Attached files
| file | filename |
|---|---|
| EX-99.1 - EX-99.1 - WELLS FARGO & COMPANY/MN | f58981exv99w1.htm |
| 8-K - FORM 8-K - WELLS FARGO & COMPANY/MN | f58981e8vk.htm |
Exhibit 99.2

| 1Q11 Quarterly Supplement April 20, 2011 (c) 2011 Wells Fargo Bank, N.A. All rights reserved. |

| Appendix Pages 22-48 Non-strategic loan portfolio risk reduction 23 Capital strength 24 PCI loan portfolio performance 25 PCI loan portfolio nonaccretable difference 26 PCI loan portfolio available nonaccretable difference 27 PCI accretable yield 28 Commercial PCI portfolio accretable yield 29 Pick-a-Pay PCI portfolio accretable yield 30 1Q11 Credit quality highlights 31 Nonperforming assets 32 Commercial nonaccrual loans 33 Consumer real estate nonaccrual loans 34 Commercial real estate (CRE) loan portfolio 35 CRE loan portfolio by business segment 36 Wholesale Banking CRE loan portfolio 37 Pick-a-Pay mortgage portfolio 38 Pick-a-Pay credit highlights 39 Pick-a-Pay portfolio available nonaccretable difference 40 Pick-a-Pay nonaccrual loan composition 41 Real estate 1-4 family first mortgage portfolio 42 Home equity portfolio 43 Credit card portfolio 44 Auto portfolio 45 Forward-looking statements and additional information 46 Tier 1 common equity reconciliation 47 Risk-adjusted net interest margin reconciliation 48 Table of contents 1Q11 Results 1Q11 Overview Page 2 Record earnings 3 Selected 1Q11 items 4 Average loans 5 Period-end loans 6 Deposits 7 Noninterest income 8 Noninterest expense 9 Noninterest expense 10 Community Banking 11 Wholesale Banking 12 Wealth, Brokerage and Retirement 13 Credit quality 14 Credit quality 15 Non-strategic/liquidating loans 16 Mortgage servicing 17 Consent orders 18 Capital 19 Capital 20 Summary 21 |

| Record earnings of $3.8 billion, up 10% linked quarter and 48% YoY Strong returns ROA = 1.23%, up 14 bps from 4Q10; Highest ROA in 3 years ROE = 11.98%, up 103 bps from 4Q10 Cash and fed funds' balances remain elevated; provides ample flexibility to invest in more attractive rate environment Noninterest expense down with additional opportunities for further reduction Significant improvement in credit quality with lower net charge-offs, lower NPAs, improved delinquency trends and additional reserve release Wachovia merger integration proceeding as planned with 74% of all our banking customers on a single platform after the April Pennsylvania conversion Highest ever capital position (1) with 8.9% Tier 1 Common ratio under Basel I and estimated Tier 1 Common ratio under Basel III of 7.2% (2) Increased quarterly dividend rate to $0.12, fully paid in 1Q11, and called $3.2 billion of trust preferred securities 1Q11 Overview (1) Based on Tier 1 Common. Capital ratios are preliminary. See Appendix page 47 for additional information. (2) Pro forma calculation based on reported Tier 1 common equity, as adjusted to reflect management's interpretation of current Basel III capital proposals. This pro forma calculation is subject to change depending on final promulgation of Basel III capital rulemaking and interpretations thereof by regulatory authorities. |

| Record earnings $3.8 billion record quarterly net income, up 10% linked quarter and 48% YoY $0.67 per share, up 10% linked quarter and 49% YoY Total revenue declined 5% from 4Q10 Net interest income down 4% QoQ reflecting 11 bps decline in margin and 2 fewer days in the quarter Approximately half the margin decline due to lower PCI loan resolution income and securities redemptions related to legacy Wachovia positions with the rest due to higher levels of low-yielding cash and short-term investments' balances Risk-adjusted margin (1) of 2.85% was up 10 bps from 4Q10 and 60 bps from 1Q10 Noninterest income down 7% QoQ primarily on lower mortgage banking fees Noninterest expense down 5% QoQ Provision expense down 26% QoQ Net Income ($ in millions) (1) Risk-adjusted net interest margin defined as reported NIM less annualized net loan charge-offs divided by average interest-earning assets. See Appendix page 48 for additional information. |

| Selected 1Q11 items (1) Reserve release represents the amount by which net charge-offs exceed the provision for credit losses. |

| Average loans were up $402 million from 4Q10 Commercial loans increased 1% from 4Q10 reflecting strong growth in international and commercial & industrial on higher line utilization and new customer activity Consumer loans declined 1% from 4Q10 as lower junior lien mortgage more than offset strong growth in the auto portfolio and modest real estate 1st mortgage growth Total average loan yield of 5.03% down 8 bps linked quarter and 6 bps YoY on lower loan resolution income Average loans Stable balances reflect commercial loan growth Average Consumer Loans & Yields ($ in billions) Average Commercial Loans & Yields ($ in billions) 435.7 464.5 Real estate 1-4 family 1st mortgage Real estate 1-4 family jr. lien mortgage Credit Card Other revolving credit and installment Total consumer loans yield Commercial & Industrial Real estate mortgage Real estate construction Lease financing Foreign Total commercial loans yield 433.3 318.0 332.9 320.8 |

| Period-end loans Declines reflect continued reduction in non-strategic/liquidating portfolio Loans declined $6.1 billion, or 1%, from 4Q10 All other loans relatively stable on increased loan utilization and new customer loan growth in the commercial portfolio and growth in the auto portfolio and private student lending in the consumer portfolio Period-end balances. (1) See page 23 for additional information regarding the non-strategic/liquidating portfolio, which comprises the Pick-a-Pay, liquidating home equity, legacy WFF indirect auto, legacy WFF debt consolidation, Education Finance government and Commercial, Commercial Real Estate and other PCI loan portfolios. 781.4 766.3 (1) 753.7 Period-end Loans Outstanding ($ in billions) 757.3 751.2 |

| Deposits Strong growth and reduced average cost Average core deposits up $2.0 billion from 4Q10 and up $37.7 billion, or 5%, from 1Q10 106% of loans Retail core deposits up 7% annualized from 4Q10 Average checking and savings up 4% annualized from 4Q10 and up $58.1 billion, or 9%, from 1Q10 91% of average core deposits Consumer checking accounts up 7.4% from 1Q10 7.9% growth in California 8.5% growth in North Carolina 12.0% growth in Florida Including non-interest bearing funding, average deposit cost of approximately 30 bps was down from 31 bps in 4Q10 Average Deposits and Rates ($ in billions) 804.1 838.0 Rate paid on Interest-bearing deposits Average Checking and Savings ($ in billions) 840.9 |

| Noninterest income Noninterest income down almost entirely due to lower mortgage banking fee income Service charges on deposit account fees down 2% from 4Q10 due to seasonality and down 24% from 1Q10 reflecting impact of Reg E Card fees up 2% QoQ and up 11% YoY on higher volumes and new account growth Mortgage banking down 27% QoQ as lower originations, down 34% from 4Q10, and lower gain on sale margins offset higher servicing income Trading gains up 15% QoQ and 14% YoY on strong customer-based sales and trading driven by the credit, rates and commodities businesses |

| Noninterest expense Noninterest expense down 5% from 4Q10 1Q11 expenses include: $472 million of operating losses, substantially all related to litigation accruals for foreclosure- related matters $440 million of merger integration costs, down $94 million from 4Q10 Seasonally higher incentive compensation and employee benefit expenses Continued to focus on corporate-wide expense reductions Volume-related mortgage personnel expense reductions not fully realized in 1Q11 as employee displacement notification periods can result in expense reductions lagging volume declines |

| Noninterest expense Mortgage-related costs Residential mortgage origination is one of the largest variable cost businesses at Wells Fargo To manage expenses, we utilize a temporary workforce including contractors and interim FTE, particularly in our retail channel Senior management decides how quickly or slowly to adjust capacity Expenses can lag changes in volume due to displacement notification periods and/or not wanting to react too quickly to changes in demand As mortgage volumes slowed in 1Q11, actions were taken to reduce retail fulfillment staffing by over 4,500 FTEs Over 2,000 FTEs were notified but still on the payroll at the end of 1Q11 and will be displaced in 2Q11 |

| Community Banking Strong segment earnings despite lower mortgage banking revenues reflected improved credit and lower expenses Wells Fargo Home Mortgage Mortgage originations down $44 billion from 4Q10 Managed residential mortgage servicing up 1% from 1Q10 = $1.8 trillion Regional Banking Strong combined net checking gains Consumer checking up a net 7.4% from 1Q10 Business checking up a net 5.3% from 1Q10 Combined retail bank household cross-sell of 5.79 products per household up from 5.60 in 1Q10 West cross-sell = 6.21 East cross-sell = 5.22 Record core product solutions of 8.93 million (1) in Western footprint Growth opportunities include: Continue to increase product penetration throughout our banking states Increase solutions to small businesses to better serve their specific needs Grow cross-sell in the East (1) On a comparable basis. (2) Checking account growth is period-ending, 12-month rolling. (3) Western footprint including Wells Fargo and Wachovia customers. |

| Wholesale Banking Net interest income down 7% from 4Q10 as strong loan growth was more than offset by lower recoveries from resolutions in our non- strategic loan portfolio and lower other gains Average loans up 2% reflecting growth in commercial banking and international on increased utilization as well as new customer relationship growth Noninterest income down 6% QoQ primarily due to lower loan resolution income and other gains Expenses down 6% QoQ on lower litigation expense Wholesale lending Wholesale line utilization up 50 bps from 4Q10 Investment Banking U.S. investment banking market share (2) of 4.7% up from 4.2% in FY2010 Treasury Management Commercial card spend volume of $2.90 billion up 5% QoQ Growth opportunities include: Cross-sell within Wholesale customers Investment Banking revenue with corporate and commercial customers increased 68% from 1Q10 Foreign Exchange revenue from Wholesale customers up 24% from 1Q10 (1) Approved and initiated. (2) Source: Dealogic U.S. investment banking fee market share. |
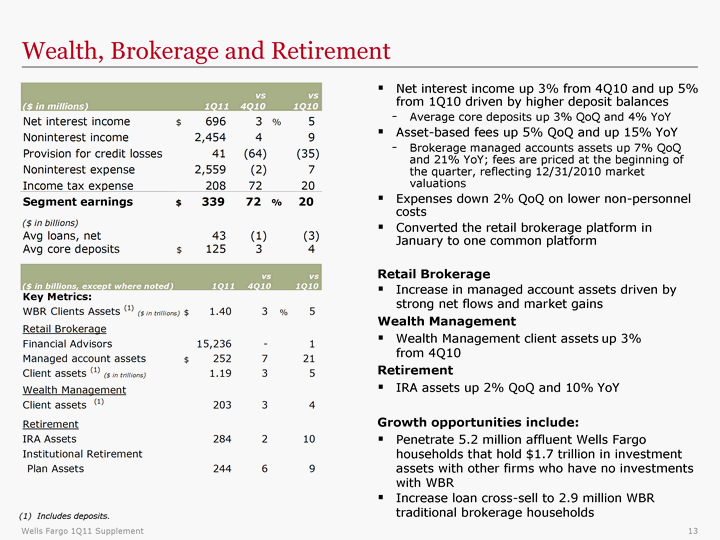
| Wealth, Brokerage and Retirement Net interest income up 3% from 4Q10 and up 5% from 1Q10 driven by higher deposit balances Average core deposits up 3% QoQ and 4% YoY Asset-based fees up 5% QoQ and up 15% YoY Brokerage managed accounts assets up 7% QoQ and 21% YoY; fees are priced at the beginning of the quarter, reflecting 12/31/2010 market valuations Expenses down 2% QoQ on lower non-personnel costs Converted the retail brokerage platform in January to one common platform Retail Brokerage Increase in managed account assets driven by strong net flows and market gains Wealth Management Wealth Management client assets up 3% from 4Q10 Retirement IRA assets up 2% QoQ and 10% YoY Growth opportunities include: Penetrate 5.2 million affluent Wells Fargo households that hold $1.7 trillion in investment assets with other firms who have no investments with WBR Increase loan cross-sell to 2.9 million WBR traditional brokerage households (1) Includes deposits. |

| Credit quality Continued decline in provision expense $3.2 billion net charge-offs, down $629 million from 4Q10 and 41% from 4Q09 peak Provision expense of $2.2 billion, down $779 million from 4Q10 ($629 million fewer losses and $150 million higher reserve release) Allowance for credit losses = $22.4 billion Remaining PCI nonaccretable = 29.6% of remaining UPB (1) Credit metrics showed continued improvement $1.8 billion QoQ decline in NPAs reflects $1.3 billion decline in NPLs on lower inflows and $497 million decline in foreclosed assets Early stage delinquencies, both balances and rates, declined QoQ (0.50) (0.65) (0.85) Reserve Release 3.99 3.45 2.99 5.33 5.91 6.11 4.56 5.09 (1) Unpaid principal balance for PCI loans that have not had a UPB charge-off. Provision Expense ($ in billions) 2.21 (1.0) |

| Credit quality Credit metrics showed continued improvement Nonperforming Assets ($ in billions) 2.6 3.2 3.9 4.9 Early Stage Delinquencies - Retail Businesses (30+ days past due - balances and rates) Nonperforming Loan Flows 32.4 34.6 32.9 31.5 30.6 2.4 Loans 90+ DPD and Still Accruing (1) ($ in billions) Excludes mortgage loans insured/guaranteed by the FHA or VA and student loans whose repayments are predominantly guaranteed by guarantee agencies on behalf of the U.S. Department of Education under the Federal Family Education Loan Program. The carrying value of PCI loans contractually 90 days or more past due was $10.8 billion in 1Q11, $11.6 billion in 4Q10, $13.0 billion in 3Q10, $15.1 billion in 2Q10 and $16.8 billion in 1Q10. Consumer includes mortgage loans held for sale 90 days or more past due and still accruing. ($ in billions) |

| Non-strategic/liquidating loans Continued reduction in balances Loss rates continued to decline in higher risk portfolios PCI portfolio continued to perform better than expected Non-strategic loans (1) since acquisition $28.0 Utilized 29.6% of UPB (4) (1) Effective first quarter 2011, we included our education finance government guaranteed loan portfolio as there is no longer a U. S. Government guaranteed student loan program available to private financial institutions, pursuant to legislation in 2010. Prior periods have been adjusted to reflect this change. (2) Net of purchase accounting adjustments. (3) Reflects releases of $1.5 billion for loan resolutions and $4.0 billion from the reclassification of nonaccretable difference to the accretable yield, which will result in increasing income over the remaining life of the loan or pool of loans. (4) Estimated coverage ratio of remaining nonaccretable difference on loans that have not yet had a write-down resulting from severe delinquency (normally 180 days) or other indicators of severe borrower stress. PCI portfolio well reserved (Nonaccretable difference $ in billions) |

| Mortgage servicing Continued reduction in outstanding demands Residential Mortgage Servicing Portfolio $1.8 Trillion (as of March 31, 2011) 4Q10 Servicing Portfolio Delinquency Performance (1) (Data as of December 31, 2010) Total Outstanding Agency Repurchase Demands and New Demands for 2006-2008 Vintages Wells Fargo total delinquency and foreclosure ratio for 1Q11 was 7.22%, down from a peak of 8.96% in 4Q09 (2) Agency Retained and acquired portfolio Non-agency securitizations of WFC originated loans Non-agency acquired servicing and private whole loan sales (1) Inside Mortgage Finance. (2) Industry is all large servicers ($6.7 trillion) including WFC, C, JPM and BAC. $69 million of non-agency repurchases in 1Q11 Total Outstanding Non-Agency Repurchase Demands and New Demands for 2006-2008 Vintages |

| Consent orders Wells Fargo is committed to complete compliance with our regulators' consent orders We support the development of national servicing standards that will provide greater clarity for servicers, investors and customers We continue to be committed to modifying mortgages for at-risk customers: Over 665,000 trial and completed modifications since 2009 Over $3.9 billion of principal forgiven We have conducted 22 Home Preservation Workshops across the country and have met with 20,000 customers face-to-face to discuss foreclosure prevention options We have been working with our regulators for an extended period on servicing improvements and have already instituted enhancements: Summer 2010 we began assigning a single point of contact to manage a loan modification from beginning to end Since early 2009 we have hired 10,000 people for a total of 16,000 home preservation staff In 4Q10 we established a uniform foreclosure affidavit form for each judicial state and a uniform checklist for affidavit signers As part of our quarterly MSR valuation process, we continually reflect changes in the cost of servicing |

| Capital Capital remained strong and continued to grow internally Tier 1 common +62 bps in 1Q11 Other capital ratios growing Tier 1 Capital = 11.5% Tier 1 Leverage = 9.3% Tier 1 common equity ratio under Basel III is estimated to be 7.2% at 3/31/11 (1) Impact of calling $3.2 billion of high cost trust preferred securities already reflected in 1Q11 capital ratios See Appendix page 47 for more information on Tier 1 common equity. 1Q11 capital ratios are preliminary estimates. (1) Pro forma calculation based on reported Tier 1 common equity, as adjusted to reflect management's interpretation of current Basel III capital proposals. This pro forma calculation is subject to change depending on final promulgation of Basel III capital rulemaking and interpretations thereof by regulatory authorities. Tier 1 Common Equity Ratio |

| Capital Capital actions taken Quarterly cash dividend rate increased to $0.12 per share and paid fully in 1Q11 Common stock repurchase authority increased by an additional 200 million shares $3.2 billion of trust preferred securities called Weighted average coupon of 7.49% Redemption to be funded through internal sources |

| Summary Record earnings Strong returns with highest ROA in 3 years Noninterest expense down with additional opportunities for further reduction Significant improvement in credit quality Liquidity remained strong Highest ever capital position Increased quarterly dividend rate to $0.12, fully paid in 1Q11, and called $3.2 billion of trust preferred securities |

| Appendix |

| (1) Effective first quarter 2011, we included our education finance government guaranteed loan portfolio as there is no longer a U. S. Government guaranteed student loan program available to private financial institutions, pursuant to legislation in 2010. Prior periods have been adjusted to reflect this change. (2) Net of purchase accounting adjustments. -$27.6 -$8.2 -$8.2 Non-strategic loan portfolio (1) risk reduction -$7.1 -$6.5 -$6.4 |

| 62 bps increase in Tier 1 common equity ratio in 1Q11 High quality capital stack 78% of Tier 1 Capital is Tier 1 Common, up from 71% in 1Q10 (1) March 31, 2010, capital ratios are preliminary. (2) See table on page 47 for more information on Tier 1 Common Equity. Capital strength |

| Purchased credit-impaired portfolios Continued to perform better than originally expected (1) Includes write-downs taken on loans where severe delinquency (normally 180 days) or other indications of severe borrower financial stress exist that indicate there will be a loss of contractually due amounts upon final resolution of the loan. (2) Reflects releases of $1.5 billion for loan resolutions and $4.0 billion from the reclassification of nonaccretable difference to the accretable yield, which will result in increasing income over the remaining life of the loan or pool of loans. |

| (1) Release of the nonaccretable difference for settlement with borrower, on individually accounted PCI loans, increases interest income in the period of settlement. Pick-a-Pay and Other consumer PCI loans do not reflect nonaccretable difference releases due to pool accounting for those loans, which assumes that the amount received approximates the pool performance expectations. (2) Release of the nonaccretable difference as a result of sales to third parties increases noninterest income in the period of the sale. (3) Reclassification of nonaccretable difference to accretable yield for loans with increased cash flow estimates will result in increased interest income as a prospective yield adjustment over the estimated remaining life of the loan or pool of loans. (4) Write-downs to net realizable value of PCI loans are absorbed by the nonaccretable difference when severe delinquency (normally 180 days) or other indications of severe borrower financial stress exist that indicate there will be a loss of contractually due amounts upon final resolution of the loan. $71 million nonaccretable difference released in 1Q11 into income due to loan resolutions $53 million in net interest income; $18 million in noninterest income $115 million reclassified to accretable yield in 1Q11 including $94 million for commercial loans and $21 million for non-Pick-a-Pay consumer loans with improving cash flows reflecting better than expected performance, expected to accrete to income over estimated remaining expected life of underlying loans $12.9 billion in nonaccretable difference remains to absorb losses on PCI loans Nonaccretable difference established in purchase accounting for PCI loans absorbs losses otherwise recorded as charge-offs Purchased credit-impaired (PCI) loan portfolio update Nonaccretable difference in 1Q11 |

| Purchased credit-impaired (PCI) portfolio Available nonaccretable difference Includes write-downs taken on loans where severe delinquency (normally 180 days) or other indications of severe borrower financial stress exist that indicate there will be a loss of contractually due amounts upon final resolution of the loan. |

| PCI accretable yield 1Q11 results included accretion of $701 million compared with $578 million in 4Q10 $123 million increase reflects a $151 million gain from the sale of a significant portion of a pool of non Pick-a- Pay consumer real estate 1-4 family first mortgage loans Balance of $15.9 billion expected to accrete to income over the remaining life of the underlying loans Expected cash flows on all PCI portfolios are recalculated quarterly including the adequacy of life-of-loan loss marks (nonaccretable difference) Estimates of redefaults on our Pick-a-Pay loan modifications While there is some underlying volatility in assumptions on a quarterly basis, total PCI cash flows have increased since acquisition (1) Includes accretable yield released as a result of settlements with borrowers, which are included in interest income, and sales to third parties, which are included in noninterest income ($155 million in 1Q11). (2) Represents changes in cash flows expected to be collected due to changes in interest rates on variable rate PCI loans and the impact of modifications. |
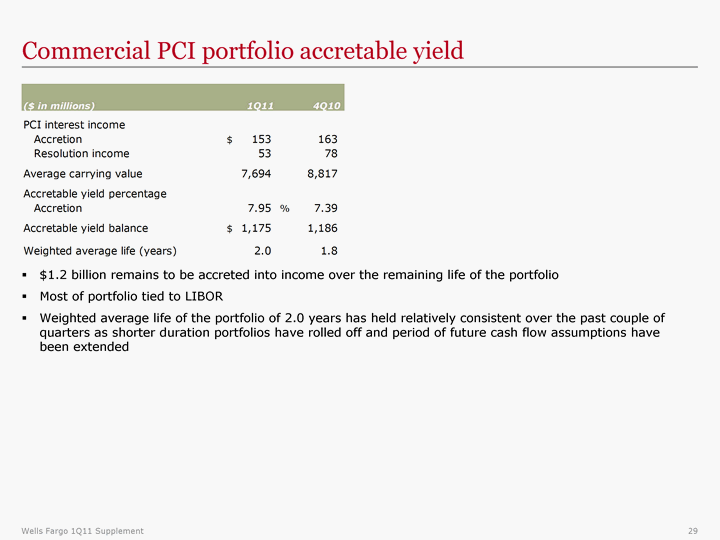
| $1.2 billion remains to be accreted into income over the remaining life of the portfolio Most of portfolio tied to LIBOR Weighted average life of the portfolio of 2.0 years has held relatively consistent over the past couple of quarters as shorter duration portfolios have rolled off and period of future cash flow assumptions have been extended Commercial PCI portfolio accretable yield |

| $14.0 billion remains to be accreted into income over the remaining life of the portfolio Based on updated cash flow valuations, there was no reclassification of nonaccretable to accretable in 1Q11 Quarterly fluctuations in accretable yield can be driven by changes in: Interest rate indices for variable rate PCI loans Prepayment assumptions Expected principal and interest payments over the estimated life While the accretable yield balance is expected to be earned over the estimated remaining life of the loans, the accretable yield percentage is also affected by the quarterly updates to projected timing of cash flow events including REO liquidations, short sales, modifications and prepayments Pick-a-Pay PCI portfolio accretable yield |

| 1Q11 Credit quality highlights Allowance for credit losses $22.4 billion 1.72x annualized quarterly charge-offs 2.98% of total loans $12.9 billion in nonaccretable difference for PCI portfolio in addition to allowance Provision expense declined $779 million and was $1.0 billion less than net charge-offs in the quarter Net charge-offs of $3.2 billion down $629 million from 4Q10 with declines/stabilization across all loan categories Commercial losses declined $331 million Consumer losses down $298 million Currently expect future reserve releases absent significant deterioration in the economy |
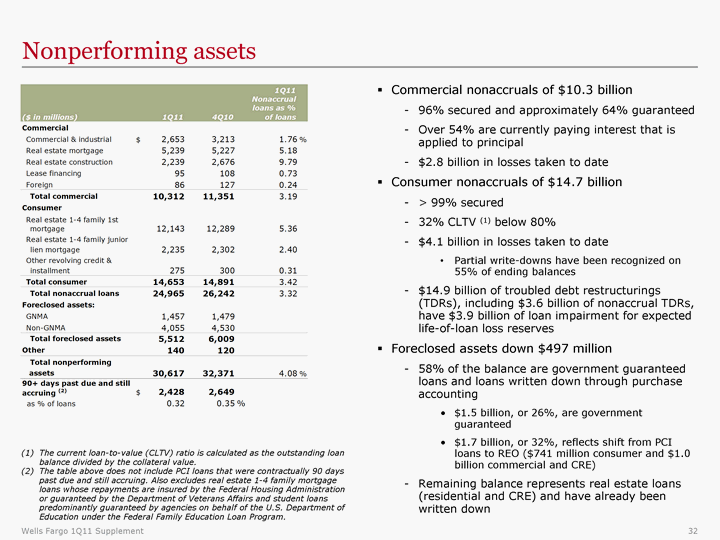
| Nonperforming assets Commercial nonaccruals of $10.3 billion 96% secured and approximately 64% guaranteed Over 54% are currently paying interest that is applied to principal $2.8 billion in losses taken to date Consumer nonaccruals of $14.7 billion > 99% secured 32% CLTV (1) below 80% $4.1 billion in losses taken to date Partial write-downs have been recognized on 55% of ending balances $14.9 billion of troubled debt restructurings (TDRs), including $3.6 billion of nonaccrual TDRs, have $3.9 billion of loan impairment for expected life-of-loan loss reserves Foreclosed assets down $497 million 58% of the balance are government guaranteed loans and loans written down through purchase accounting $1.5 billion, or 26%, are government guaranteed $1.7 billion, or 32%, reflects shift from PCI loans to REO ($741 million consumer and $1.0 billion commercial and CRE) Remaining balance represents real estate loans (residential and CRE) and have already been written down The current loan-to-value (CLTV) ratio is calculated as the outstanding loan balance divided by the collateral value. The table above does not include PCI loans that were contractually 90 days past due and still accruing. Also excludes real estate 1-4 family mortgage loans whose repayments are insured by the Federal Housing Administration or guaranteed by the Department of Veterans Affairs and student loans predominantly guaranteed by agencies on behalf of the U.S. Department of Education under the Federal Family Education Loan Program. |

| Commercial nonaccrual loans 1Q11 Total Commercial nonaccrual loans = $10,312 million ($ change in millions) Commercial and Industrial & Lease Financing: CRE Construction: CRE Mortgage: Foreign: Inflows decreased 21%; second consecutive quarterly decrease 92% secured 38% guaranteed 75% current on interest 45% have already been written down Inflows decreased 30%; third consecutive quarterly decrease 72% guaranteed 37% current on interest 33% of NPLs have been written down Inflows decreased 32%; second consecutive quarterly decline 75% guaranteed 50% current on interest 40% of NPLs have been written down |

| Consumer real estate nonaccrual loans Inflows decreased 13%; the second consecutive quarterly decline 46% are 1-4 family first mortgage 19% are TDRs for which impairment has been recognized 76% is legacy WFF debt consolidation Inflows decreased 15% 42% written down; losses taken stable from prior quarter 13% is WBR Inflows decreased 11%; second consecutive quarterly decline 58% written down; losses taken stable from prior quarter 59% are > 180 DPD Inflows declined 5%; fifth consecutive quarterly decline 83% of NPLs held at current estimated recoverable value 21% are TDRs for which impairment has been recognized See page 41 for additional information 1Q11 Total residential real estate nonaccrual loans = $14,378 million Inflows continued to decline while outflows slowed reflecting environment and seasonality All comparisons are to 4Q10. (1) Includes National Home Equity first and junior lines and loans. (2) Total inflows and outflows tracked on left scale and RE NPL balances tracked on right scale. National Home Equity (1): Home Mortgage: Pick-a-Pay: Other Businesses: ($ change in millions) (2) |

| Commercial real estate (CRE) loan portfolio Office Industrial, Warehouse Other RE Apartment Retail (Ex Shopping Ctr) Land (Ex 1-4 Family) Shopping Ctr 1-4 Family Structure Hotel/Motel 1-4 Family Land Institutional 2% Agriculture Retail CA FL TX NC GA NY VA AZ WA CO Other Reduction in outstandings reflects paydowns partially offset by transfer of $1.3 billion in loans from consumer real estate multifamily 32% of the portfolio is owner-occupied CRE loans by property type CRE loans by geography |

| CRE loan portfolio by business segment Wholesale Banking 14% owner-occupied Community Banking 62% owner-occupied Wealth, Brokerage and Retirement (WBR) 33% owner-occupied |
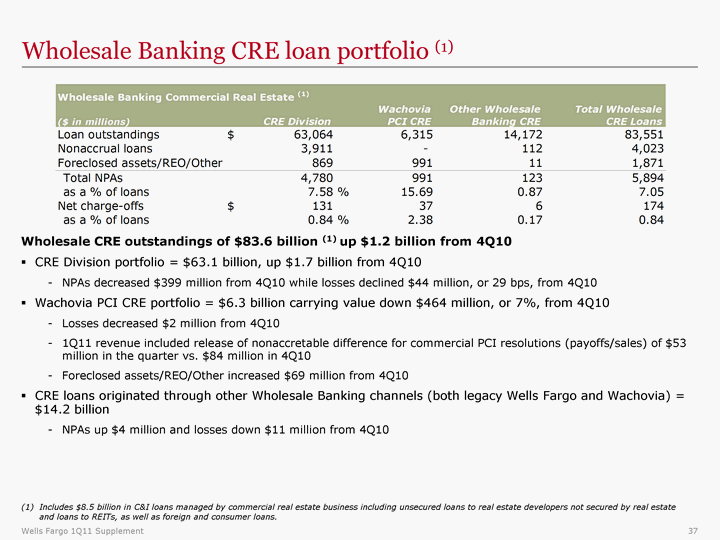
| Wholesale Banking CRE loan portfolio (1) Wholesale CRE outstandings of $83.6 billion (1) up $1.2 billion from 4Q10 CRE Division portfolio = $63.1 billion, up $1.7 billion from 4Q10 NPAs decreased $399 million from 4Q10 while losses declined $44 million, or 29 bps, from 4Q10 Wachovia PCI CRE portfolio = $6.3 billion carrying value down $464 million, or 7%, from 4Q10 Losses decreased $2 million from 4Q10 1Q11 revenue included release of nonaccretable difference for commercial PCI resolutions (payoffs/sales) of $53 million in the quarter vs. $84 million in 4Q10 Foreclosed assets/REO/Other increased $69 million from 4Q10 CRE loans originated through other Wholesale Banking channels (both legacy Wells Fargo and Wachovia) = $14.2 billion NPAs up $4 million and losses down $11 million from 4Q10 Includes $8.5 billion in C&I loans managed by commercial real estate business including unsecured loans to real estate developers not secured by real estate and loans to REITs, as well as foreign and consumer loans. |

| Pick-a-Pay mortgage portfolio Carrying value of $71.5 billion in first lien loans outstanding, down $3.3 billion from 4Q10 and down $23.8 billion from 4Q08 on paid-in-full loans and loss mitigation efforts Unpaid principal balance of $80.6 billion, down $3.6 billion from 4Q10 and down $35.1 billion from 4Q08; $1.3 billion of decline in 1Q11 resulted from multifamily loan transfer to commercial real estate $3.9 billion in modification principal forgiveness since acquisition reflects over 85,000 completed full-term modifications Pick-a-Pay loans with negative amortization potential decreased $3.1 billion from 4Q10 to 58% of loans Total portfolio deferred interest of $2.5 billion down $190 million from 4Q10 and down $1.9 billion from 4Q08; down for eighth consecutive quarter Expect minimal recast risk over next 3 years due to product structure and features Approximately $23 million, or 111 loans, expected in the rest of 2011, approximately $69 million, or 265 loans, expected in 2012 and approximately $295 million or 1,013 loans in 2013 Modification redefault rate has been consistently better than the industry average (as measured by 60+ DPD after 6 months) as we have strived to give customers an affordable, sustainable payment Adjusted unpaid principal includes write-downs taken on loans where severe delinquency (normally 180 days) or other indications of severe borrower financial stress exist that indicate there will be a loss of contractually due amounts upon final resolution of the loan. |

| Pick-a-Pay credit highlights Non-PCI portfolio Loans down 6% driven by loans paid-in-full and transfer of multifamily loans to commercial real estate 86% of portfolio current Nonaccrual loans up slightly in 1Q11 83% of loans written down to current net realizable value (See page 41) New inflows declined for fifth consecutive quarter $195 million of nonaccrual TDRs reclassified to accruing TDR status based on borrower payment performance Roll rates from current to 30+ days past due improved significantly, aided by seasonality 43% of portfolio with LTV (2) < 80% PCI portfolio Carrying value down 3% 68% of portfolio current, up 61 bps from 4Q10 driven by seasonality Life-of-loan losses continued to be lower than originally projected at time of merger The carrying value, which does not reflect the allowance for loan losses, includes purchase accounting adjustments, which, for PCI loans, are the nonaccretable difference and the accretable yield, and for all other loans, an adjustment to mark the loans to a market yield at date of merger less any subsequent charge-offs. (2) The current loan-to-value (LTV) ratio is calculated as the net carrying value (defined in (1) above) divided by the collateral value. (3) The adjusted unpaid principal balance includes write-downs taken on loans where severe delinquency (normally 180 days) or other indications of severe borrower financial stress exist that indicate there will be a loss of contractually due amounts upon final resolution of the loan. (4) The December 31, 2010 adjusted unpaid principal balance has been revised to include write-downs taken on loans where severe delinquency (normally 180 days) or other indications of severe borrower financial stress exist that indicate there will be a loss of contractually due amounts upon final resolution of the loan. |

| PCI Pick-a-Pay portfolio Available nonaccretable difference Includes write-downs taken on loans where severe delinquency (normally 180 days) or other indications of severe borrower financial stress exist that indicate there will be a loss of contractually due amounts upon final resolution of the loan. |
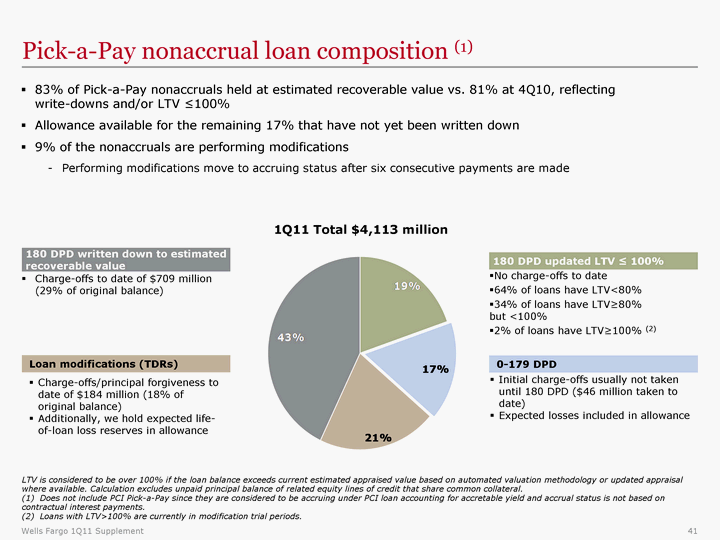
| Pick-a-Pay nonaccrual loan composition (1) 83% of Pick-a-Pay nonaccruals held at estimated recoverable value vs. 81% at 4Q10, reflecting write-downs and/or LTV ^100% Allowance available for the remaining 17% that have not yet been written down 9% of the nonaccruals are performing modifications Performing modifications move to accruing status after six consecutive payments are made 1Q11 Total $4,113 million Charge-offs to date of $709 million (29% of original balance) No charge-offs to date 64% of loans have LTV<80% 34% of loans have LTV^80% but <100% 2% of loans have LTV^100% (2) Initial charge-offs usually not taken until 180 DPD ($46 million taken to date) Expected losses included in allowance Charge-offs/principal forgiveness to date of $184 million (18% of original balance) Additionally, we hold expected life- of-loan loss reserves in allowance LTV is considered to be over 100% if the loan balance exceeds current estimated appraised value based on automated valuation methodology or updated appraisal where available. Calculation excludes unpaid principal balance of related equity lines of credit that share common collateral. (1) Does not include PCI Pick-a-Pay since they are considered to be accruing under PCI loan accounting for accretable yield and accrual status is not based on contractual interest payments. (2) Loans with LTV>100% are currently in modification trial periods. 180 DPD written down to estimated recoverable value 0-179 DPD Loan modifications (TDRs) 180 DPD updated LTV ^ 100% |

| Real estate 1-4 family first mortgage portfolio First lien mortgage loans down reflecting declines in run-off portfolios Pick-a-Pay non-PCI portfolio down 6% PCI portfolio down 3% Debt consolidation down 4% Non run-off first lien mortgage stable Non run-off first lien mortgage nonaccruals down $17 million, or 2 bps Non run-off net charge-offs down $144 million, or 40 bps (1) Ratios on non run-off first lien mortgage loan portfolio only. |

| Home equity portfolio (1) Core Portfolio (2) Outstandings down 3% High quality new originations with weighted average CLTV of 62%, 777 FICO, and 32% total debt service ratio 1Q11 losses relatively stable, up $11 million 2+ delinquencies declined $286 million, or 18 bps Continued decline in delinquency rate for loans with a CLTV >100%, 60 bps improvement QoQ Liquidating Portfolio Outstandings down 5% 1Q11 losses down $2 million 2+ delinquencies declined $58 million, or 60 bps Continued decline in delinquency rate for loans with a CLTV >100%, 75 bps improvement QoQ (1) Excludes purchased credit-impaired loans. (2) Includes equity lines of credit and closed-end junior liens associated with the Pick-a-Pay portfolio totaling $1.6 billion at March 31, 2011, and $1.7 billion at December 31, 2010. (3) CLTV quarter-end based predominantly on estimated home values from automated valuation models updated through March 2011. Total loans include all open-to-buy and unused lines of credit. |

| Credit card portfolio $21.0 billion credit card outstandings represent less than 3% of total loans Outstandings down 6% Net charge-offs down $70 million, or 98 bps, reflecting previous risk mitigation efforts that included tightened underwriting and line management changes (i.e. fewer balance transfers and approved balance increases) |

| Auto portfolio Core Portfolio Total outstandings up 3% QoQ and up 11% YoY reflecting record loan originations Originations were up 15% from 4Q10 and up 25% from 1Q10, with LTV and loan structures consistent over the last eight quarters Net charge-offs declined $33 million, or 34 bps, on low delinquencies and continued strength in used car values March Manheim index of 124.2, flat with December 2010 and up 6% from December 2009 30+ days past due decreased $377 million, or 100 bps, reflecting continued improvement in credit quality Liquidating Portfolio (2) Legacy Wells Fargo Financial indirect auto outstandings down 18%, or $1.1 billion, QoQ driven by paydowns Reflects transfer of loans from direct to indirect portfolio in 1Q11. Legacy Wells Fargo Indirect portfolio. |

| Forward-looking statements and additional information Forward-looking statements: This Quarterly Supplement and management's related presentation contain forward-looking statements about our future financial performance. These forward-looking statements include statements using words such as "believe," "expect," "anticipate," "estimate," "should," "may," "can," "will," "outlook," "appears" or similar expressions. These forward-looking statements may include, among others, statements about: expected or estimated future losses in our loan portfolios, including our belief that quarterly provision expense and quarterly total credit losses have peaked and the allowance for loan losses is expected to decline; expected or estimated loan loss reserve releases; current estimates of full-year 2011 tax rates; mortgage repurchase exposure; exposure related to mortgage practices, including foreclosures and servicing; expenses relating to our mortgage business, including personnel expenses and expenses relating to regulatory consent orders; the future economic environment; reduction or mitigation of risk in our loan portfolios; future effects of loan modification programs; life-of-loan loss estimates; future recast risk in the Pick-a-Pay portfolio; the estimated impact of regulatory reform on our financial results and business; estimated future expenses, including expected Wachovia integration costs, future loan resolution/loss mitigation costs, and certain other expenses; and our estimated Tier 1 common ratio as of March 31, 2011 under proposed Basel capital rules. Investors are urged to not unduly rely on forward-looking statements as actual results could differ materially from expectations. Forward-looking statements speak only as of the date made, and we do not undertake to update them to reflect changes or events that occur after that date. For more information about factors that could cause actual results to differ materially from expectations, refer to page 15 of Wells Fargo's press release announcing our first quarter 2011 results, as well as Wells Fargo's reports filed with the Securities and Exchange Commission, including our Annual Report on Form 10-K for the year ended December 31, 2010, including the discussion under "Risk Factors" in that report. Purchased credit-impaired loan portfolio: Loans that were acquired from Wachovia that were considered credit impaired were written down at acquisition date in purchase accounting to an amount estimated to be collectible and the related allowance for loan losses was not carried over to Wells Fargo's allowance. In addition, such purchased credit-impaired loans are not classified as nonaccrual or nonperforming, and are not included in loans that were contractually 90+ days past due and still accruing. Any losses on such loans are charged against the nonaccretable difference established in purchase accounting and are not reported as charge-offs (until such difference is fully utilized). As a result of accounting for purchased loans with evidence of credit deterioration, certain ratios of the combined company are not comparable to a portfolio that does not include purchased credit-impaired loans. In certain cases, the purchased credit-impaired loans may affect portfolio credit ratios and trends. Management believes that the presentation of information adjusted to exclude the purchased credit-impaired loans provides useful disclosure regarding the credit quality of the non-impaired loan portfolio. Accordingly, certain of the loan balances and credit ratios in this Quarterly Supplement have been adjusted to exclude the purchased credit-impaired loans. References in this Quarterly Supplement to impaired loans mean the purchased credit-impaired loans. Please see pages 30-32 of the press release for additional information regarding the purchased credit-impaired loans. |

| Tier 1 common equity reconciliation |

| Risk-adjusted net interest margin reconciliation |