Attached files
| file | filename |
|---|---|
| 8-K - NORANDA ALUMINUM HOLDING CORP. 8-K - Noranda Aluminum Holding CORP | a6690961.htm |
| EX-99.1 - EXHIBIT 99.1 - Noranda Aluminum Holding CORP | a6690961ex99_1.htm |
Exhibit 99.2
First Quarter Results Conference Call SubTitle: Noranda Aluminum Holding CorpApril 20, 2011 10:00 AM Eastern / 9:00 AM Central

Noranda Aluminum Holding Corporation Forward Looking Statements The following information contains, or may be deemed to contain, "forward-looking statements" (as defined in the U.S. Private Securities Litigation Reform Act of 1995). By their nature, forward-looking statements involve risks and uncertainties because they relate to events and depend on circumstances that may or may not occur in the future. The future results of Noranda may vary from the results expressed in, or implied by, the following forward-looking statements, possibly to a material degree. For a discussion of some of the important factors that could cause Noranda’s results to differ from those expressed in, or implied by, the following forward-looking statements, please refer to Noranda’s filings with the SEC, including the Annual Report on Form 10-K.
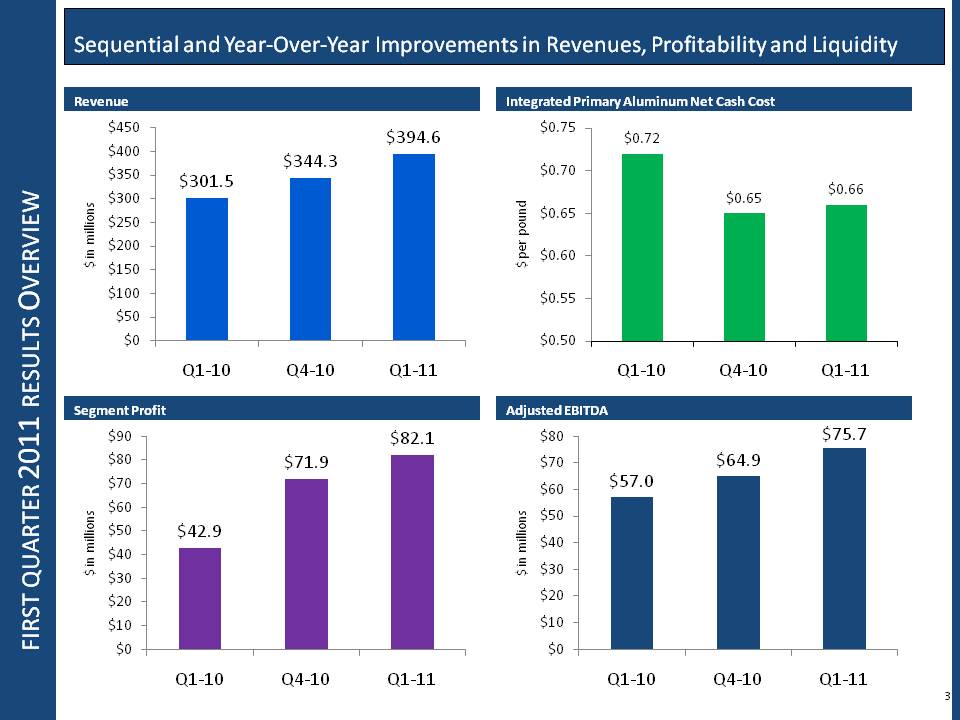
Title: first quarter 2011 results Overview Body: Revenue: $450 $400 $350 $300 $250 $200 $150 $100 $50 $0 Q1-10 Q4-10 Q1-11 $344.3 $394.6 Segment Profit $90 $80 $70 $60 $50 $40 $30 $20 $10 $0 Q1-10 Q4-10 Q1-11 $42.9 $71.9 $82.1 Integrated Primary Aluminum Net Cash Cost: $0.75 $0.70 $0.65 $0.60 $0.55 $0.50 Q1-10 Q4-10 Q1-11 $0.72 $0.65 Adjusted EBITDA $80 $70 $60 $50 $40 $30 $20 $10 $0 Q1-10 Q4-10 Q1-11 $64.9 $75.7
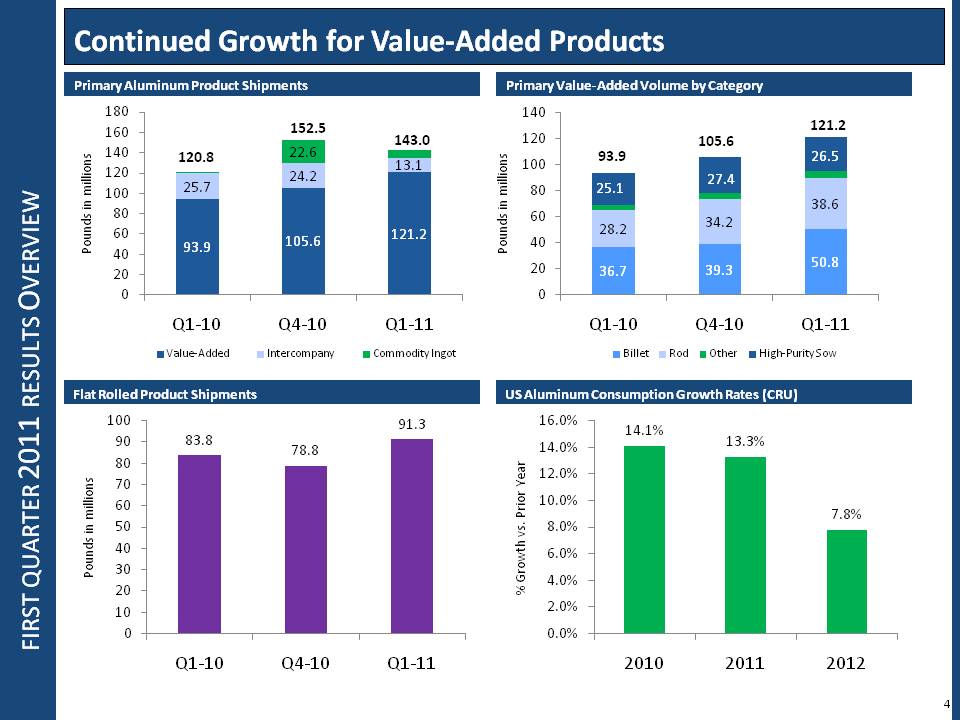
first quarter 2011 results Overview Continued Growth for Value-Added Products Primary Aluminum Product Shipments 180 160 152.5 143.0 140 120.8 22.6 120 24.2 100 25.7 80 60 40 20 0 Primary Value-Added Volume by Category Body: 140 120 100 80 60 40 20 0 US Aluminum Consumption Growth Rates (CRU) 16.0% 14.0% 12.0% 10.0% 8.0% 6.0% 4.0% 2.0% 0.0% Flat Rolled Product Shipments 100 90 80 70 60 50 40 30 20 10 0 93.9 105.6 121.2 120.8 152.5 143.0
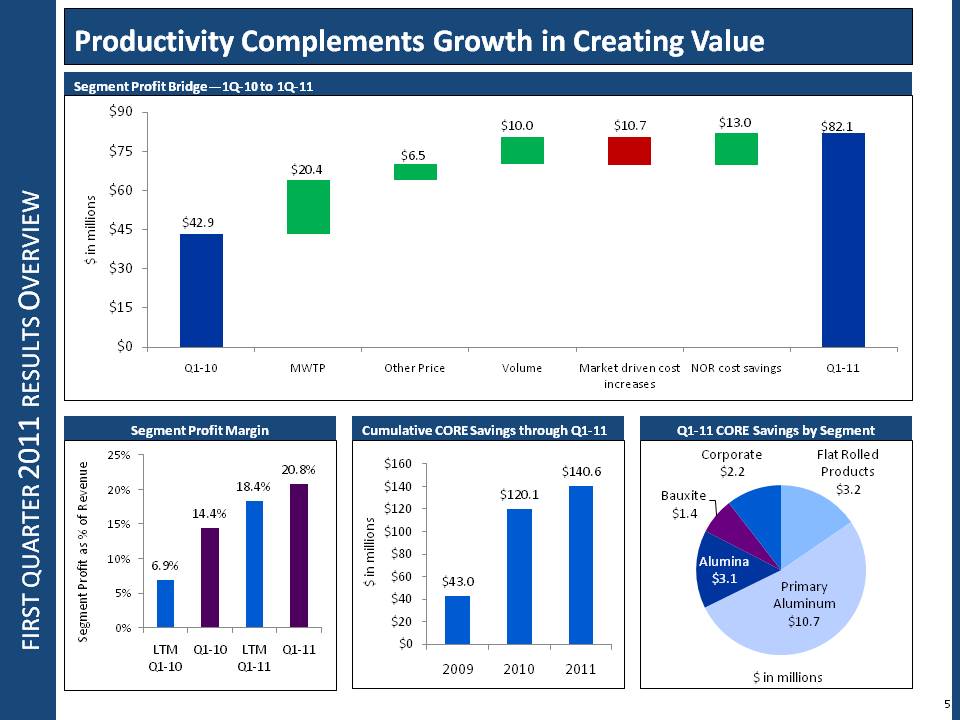
first quarter 2011 results Overview Productivity Complements Growth in Creating Value Segment Profit Bridge—1Q-10 to 1Q-11 $90 $75 $60 $45 $30 $15 $0 Q1-10 MWTP Other PriceVolume Market driven cost NOR cost savings Q1-11 increases Segment Profit Margin 25% 20% 15% 10% 5% 0% LTM Q1-10 LTM Q1-11 Q1-10 Q1-11 Cumulative CORE Savings through Q1-11 $160 $140 $120 $100 $80 $60 $40 $20 $0 Q1-11 CORE Savings by Segment $ in millions
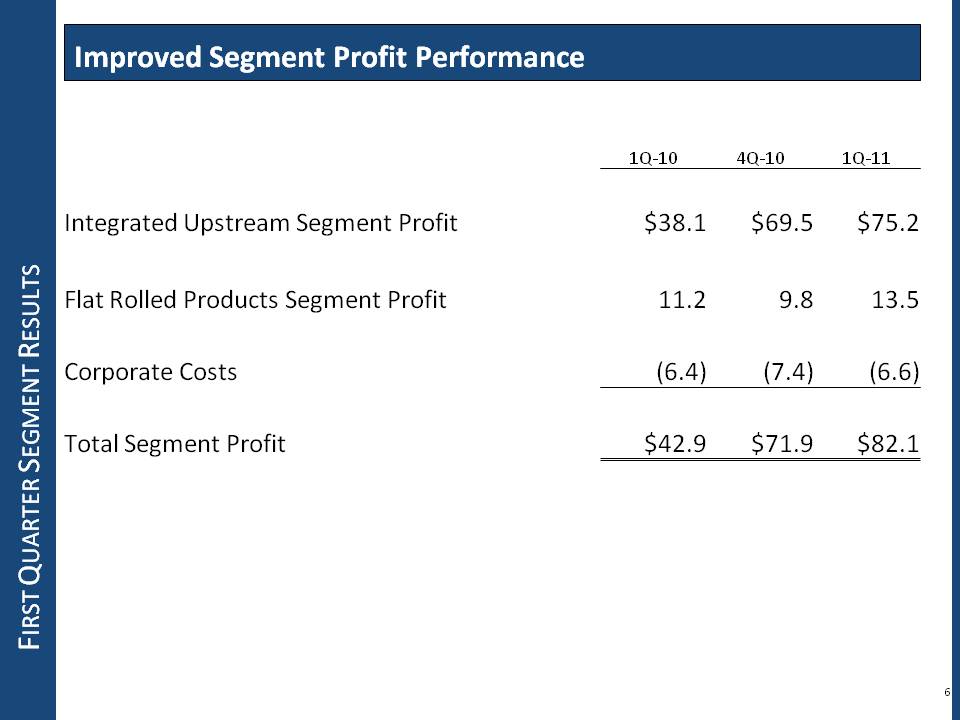
First Quarter Segment Results Improved Segment Profit Performance Integrated Upstream Segment Profit Flat Rolled Products Segment Profit Corporate Costs Total Segment Profit 1Q- 10 4Q- 10 1Q- 11 $38.1 $69.5 $75.2 11.2 9.8 13.5 (6.4) (7.4) (6.6) $42.9 $71.9 $82.1
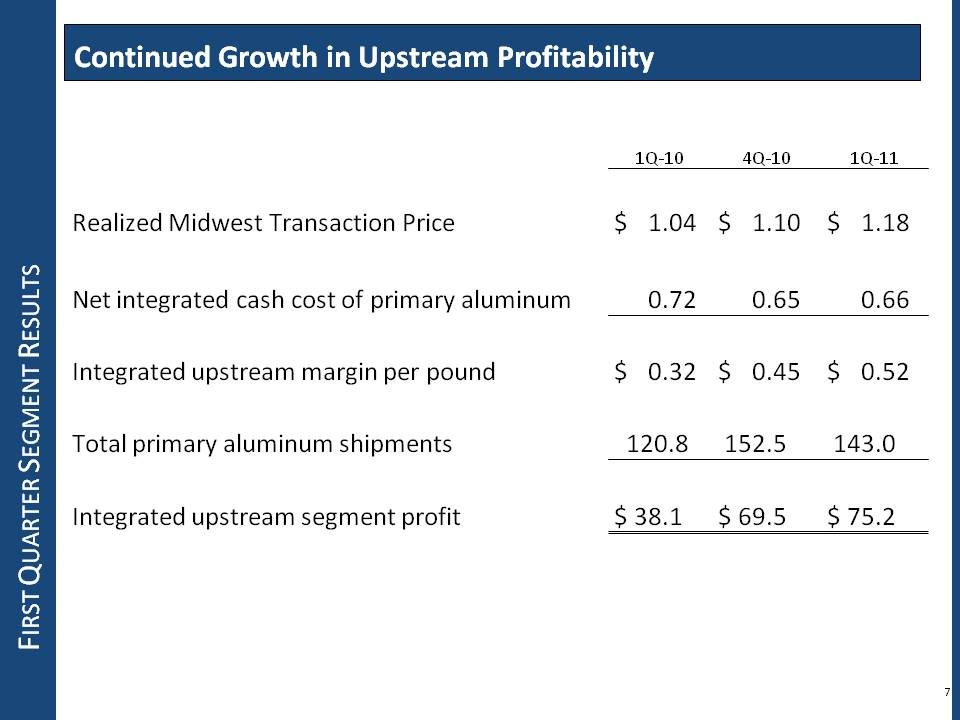
First Quarter Segment Results 7 Continued Growth in Upstream Profitability 1Q- 10 4Q-10 1Q- 11 Realized Midwest Transaction Price $ 1.04 $ 1.10 $ 1.18 Net integrated cash cost of primary aluminum 0.72 0.65 0.66 Integrated upstream margin per pound $ 0.32 $ 0.45 $ 0.52 Total primary aluminum shipments 120.8 152.5 143.0 Integrated upstream segment profit $ 38.1 $ 69.5 $ 75.2
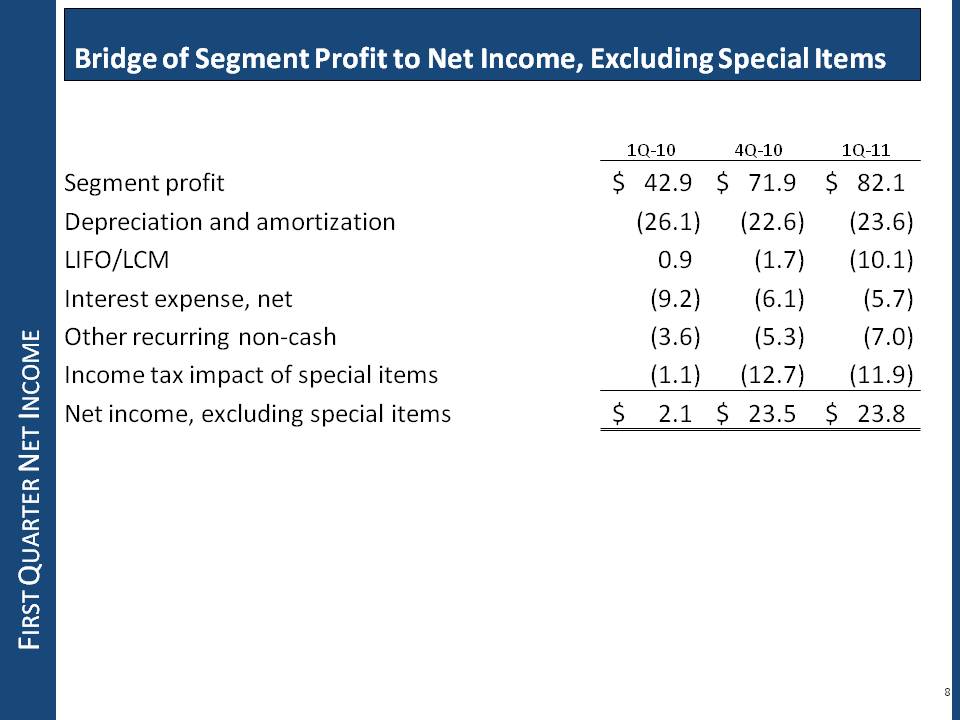
First Quarter Net Income Bridge of Segment Profit to Net Income, Excluding Special Items Segment profit Depreciation and amortization LI FO/LCM Interest expense, net Other recurring non-cash Income tax impact of special items Net income, excluding special items 1Q-10 4Q-10 1Q- 11Segment profit Depreciation and amortization LI FO/LCM Interest expense, net Other recurring non-cash Income tax impact of special items Net income, excluding special items $ 42.9 $ 71.9 $ 82.1 (26.1) (22.6) (23.6) 0.9 (1.7) (10.1) (9.2) (6.1) (5.7) (3.6) (5.3) (7.0) (1.1) (12.7) (11.9) $ 2.1 $ 23.5 $ 23.8
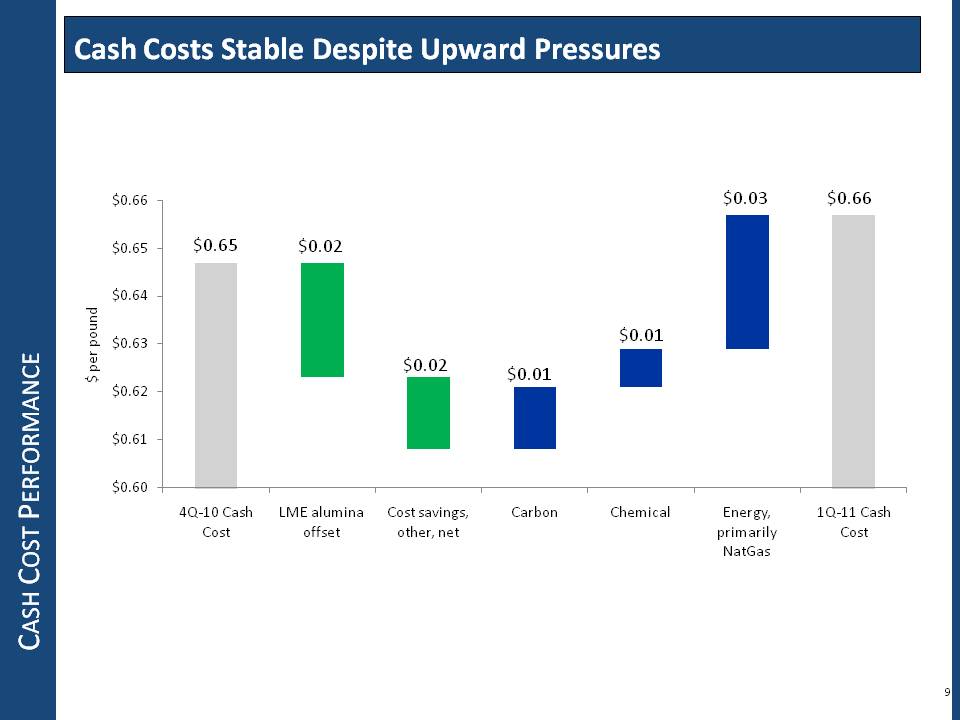
Cash Cost Performance Cash Costs Stable Despite Upward Pressures $0.66 $0.65 $0.64 $0.63 $0.62 $0.61 $0.60 $0.65 $0.024Q-10 Cash LME alumina Cost savings, Carbon Chemical Energy, 1Q-11 Cash Cost offset other, net primarily Cost NatGas
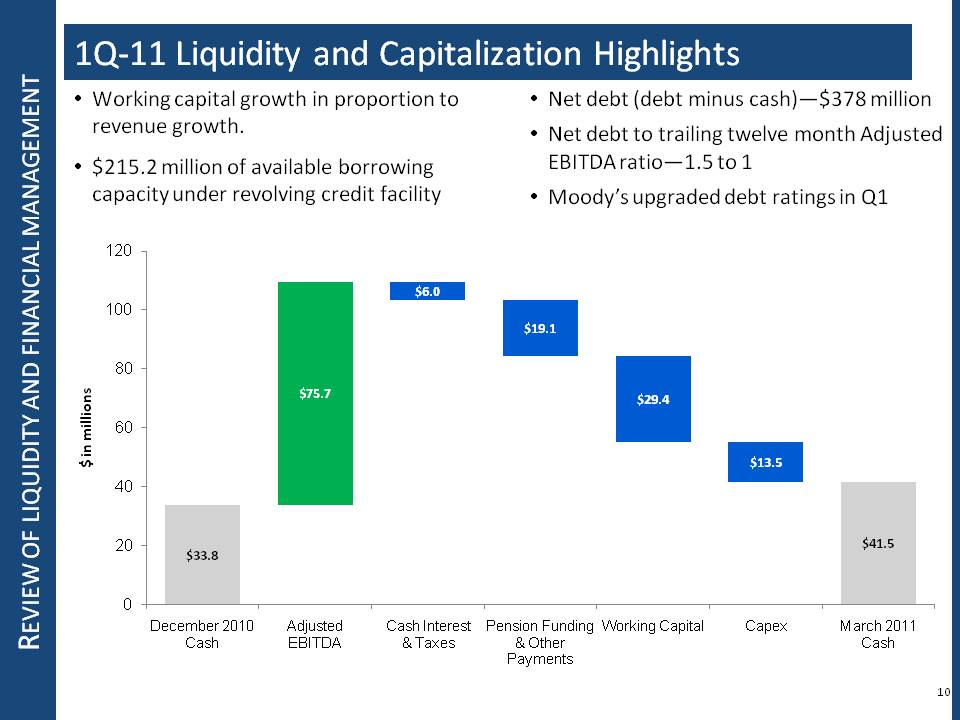
Review of Liquidity and Financial Management Review of liquidity and financial management Body: 1Q-11 Liquidity and Capitalization Highlights Other Placeholder: Working capital growth in proportion to revenue growth. $215.2 million of available borrowing capacity under revolving credit facility Net debt (debt minus cash)—$378 million Net debt to trailing twelve month Adjusted EBITDA ratio—1.5 to 1 Moody’s upgraded debt ratings in Q1 10 $33.8 $75.7 $6.0 December 2010 Adjusted Cash Interest Pension Funding Working Capital Capex March 2011 Cash EBITDA & Taxes & Other Cash Payments
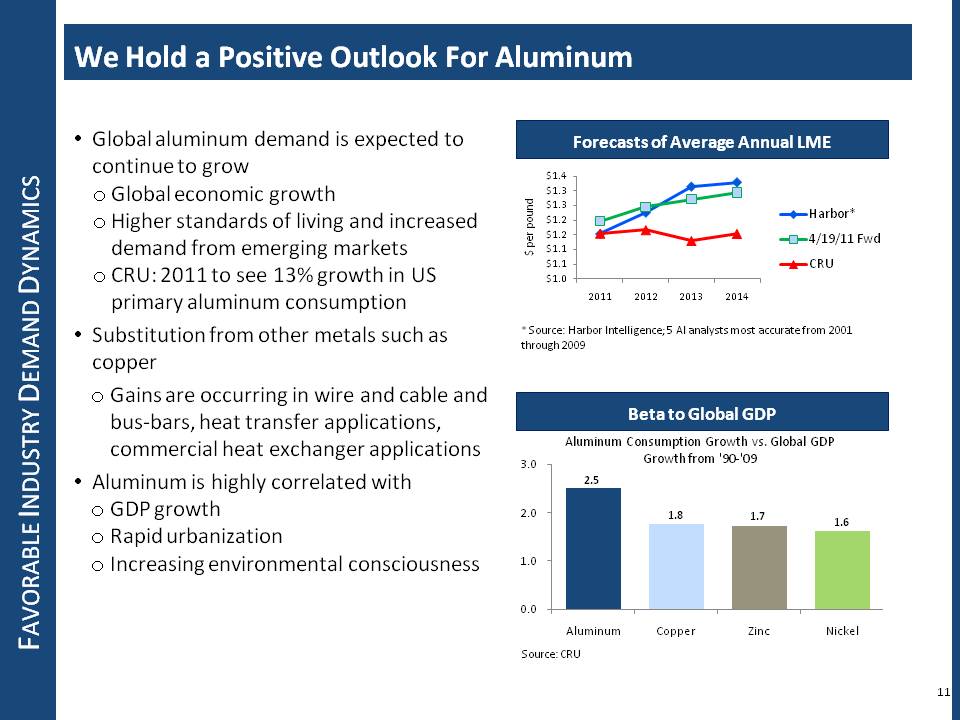
Favorable Industry Demand Dynamics Other Placeholder: Global aluminum demand is expected to continue to grow Global economic growth Higher standards of living and increased demand from emerging markets CRU: 2011 to see 13% growth in US primary aluminum consumption Substitution from other metals such as copper Gains are occurring in wire and cable and bus-bars, heat transfer applications, commercial heat exchanger applications Aluminum is highly correlated with GDP growth Rapid urbanization Increasing environmental consciousness 11 * Source: Harbor Intelligence; 5 Al analysts most accurate from 2001 through 2009 Body: We Hold a Positive Outlook For Aluminum Forecasts of Average Annual LME Beta to Global GDP Source: CRU
Noranda Aluminum Holding Corporation Key First Quarter Takeaways Achieved sequential and year-over-year growth in: Revenue Profitability Liquidity Improved our cost structure relative to the global cost curve Generated positive cash flow while funding growth Expanded financial flexibility to support prudent investments Validated again our strategy and business model Integration Input cost independence from LME Passionate focus on productivity and growth

Appendices Noranda Aluminum Holding Corporation
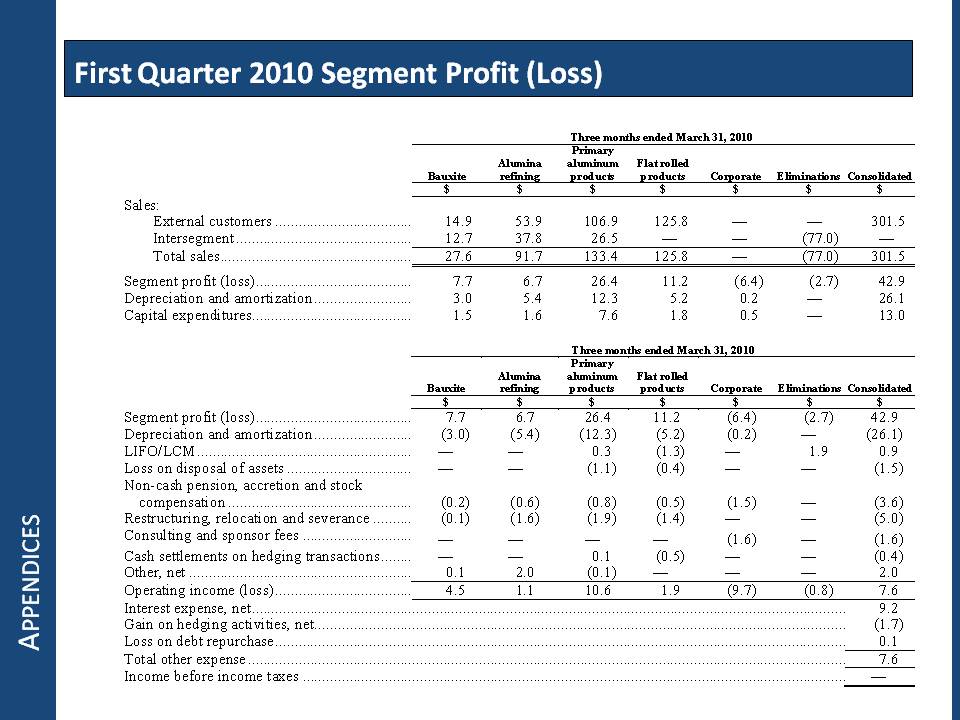
Appendices First Quarter 2010 Segment Profit (Loss) Three months ended March 31, 2010 Bauxite Alumina refining Primary aluminum products Flat rolled products Corporate Eliminations Consolidated $ $ $ $ $ $ $ Sales: External customers 14.9 53.9 106.9 125.8 — — 301.5 Intersegment 12.7 37.8 26.5 — — (77.0) — Total sales 27.6 91.7 133.4 125.8 — (77.0) 301.5 Segment profit (loss) 7.7 6.7 26.4 11.2 (6.4) (2.7) 42.9 Depreciation and amortization 3.0 5.4 12.3 5.2 0.2 — 26.1 Capital expenditures 1.5 1.6 7.6 1.8 0.5 — 13.0 Three months ended March 31, 2010 Bauxite Alumina refining Primary aluminum products Flat rolled products Corporate Eliminations Consolidated $ $ $ $ $ $ $ Segment profit (loss) 7.7 6.7 26.4 11.2 (6.4) (2.7) 42.9 Depreciation and amortization (3.0) (5.4) (12.3) (5.2) (0.2) — (26.1) LIFO/LCM — — 0.3 (1.3) — 1.9 0.9 Loss on disposal of assets — — (1.1) (0.4) — — (1.5) Non-cash pension, accretion and stock compensation (0.2) (0.6) (0.8) (0.5) (1.5) — (3.6) Restructuring, relocation and severance (0.1) (1.6) (1.9) (1.4) — — (5.0) Consulting and sponsor fees — — — — (1.6) — (1.6) Cash settlements on hedging transactions — — 0.1 (0.5) — — (0.4) Other, net 0.1 2.0 (0.1) — — — 2.0 Operating income (loss) 4.5 1.1 10.6 1.9 (9.7) (0.8) 7.6 Interest expense, net 9.2 Gain on hedging activities, net (1.7) Loss on debt repurchase 0.1 Total other expense 7.6 Income before income taxes —
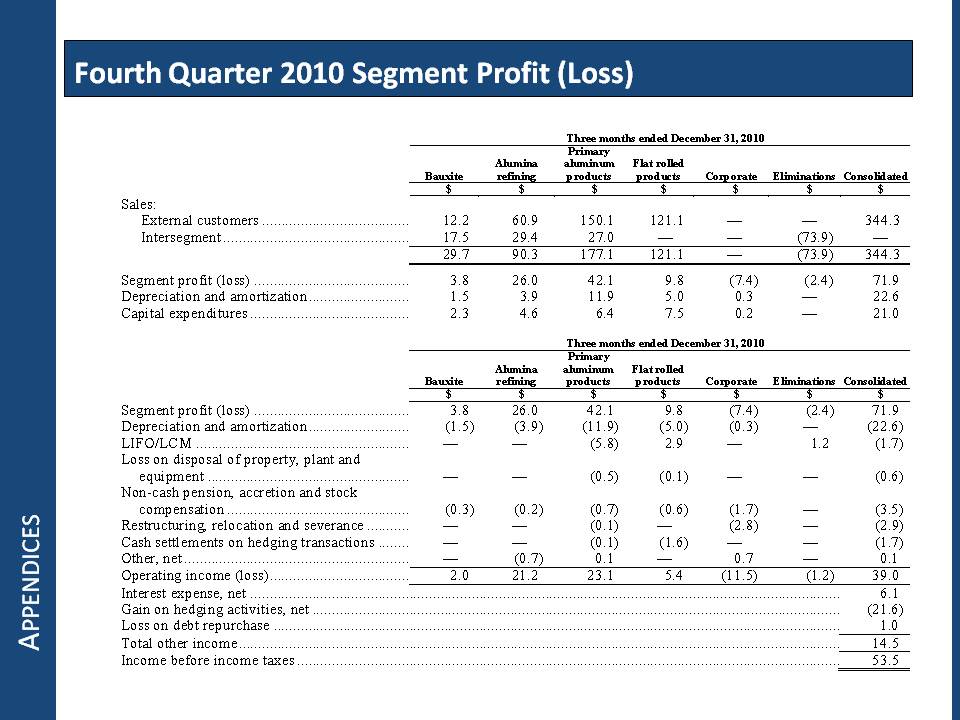
Appendices Fourth Quarter 2010 Segment Profit (Loss) Three months ended December 31, 2010 Bauxite Alumina refining Primary aluminum products Flat rolled products Corporate Eliminations Consolidated $ $ $ $ $ $ $ Sales: External customers 12.2 60.9 150.1 121.1 — — 344.3 Intersegment 17.5 29.4 27.0 — — (73.9) — 29.7 90.3 177.1 121.1 — (73.9) 344.3 Segment profit (loss) 3.8 26.0 42.1 9.8 (7.4) (2.4) 71.9 Depreciation and amortization 1.5 3.9 11.9 5.0 0.3 — 22.6 Capital expenditures 2.3 4.6 6.4 7.5 0.2 — 21.0 Three months ended December 31, 2010 Bauxite Alumina refining Primary aluminum products Flat rolled products Corporate Eliminations Consolidated $ $ $ $ $ $ $ Segment profit (loss) 3.8 26.0 42.1 9.8 (7.4) (2.4) 71.9 Depreciation and amortization (1.5) (3.9) (11.9) (5.0) (0.3) — (22.6) LIFO/LCM — — (5.8) 2.9 — 1.2 (1.7) Loss on disposal of property, plant and equipment — — (0.5) (0.1) — — (0.6) Non-cash pension, accretion and stock compensation (0.3) (0.2) (0.7) (0.6) (1.7) — (3.5) Restructuring, relocation and severance — — (0.1) — (2.8) — (2.9) Cash settlements on hedging transactions — — (0.1) (1.6) — — (1.7) Other, net — (0.7) 0.1 — 0.7 — 0.1 Operating income (loss) 2.0 21.2 23.1 5.4 (11.5) (1.2) 39.0 Interest expense, net 6.1 Gain on hedging activities, net (21.6) Loss on debt repurchase 1.0 Total other income 14.5 Income before income taxes 53.5
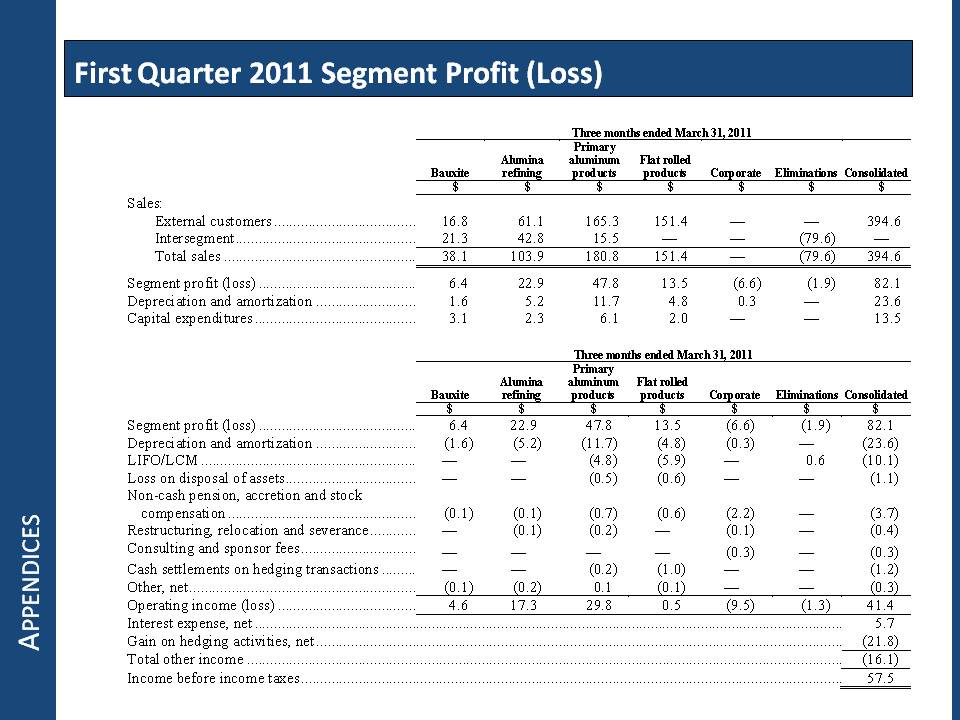
Appendices First Quarter 2011 Segment Profit (Loss) Three months ended March 31, 2011 Bauxite Alumina refining Primary aluminum products Flat rolled products Corporate Eliminations Consolidated $ $ $ $ $ $ $ Sales: External customers 16.8 61.1 165.3 151.4 — — 394.6 Intersegment 21.3 42.8 15.5 — — (79.6) — Total sales 38.1 103.9 180.8 151.4 — (79.6) 394.6 Segment profit (loss) 6.4 22.9 47.8 13.5 (6.6) (1.9) 82.1 Depreciation and amortization 1.6 5.2 11.7 4.8 0.3 — 23.6 Capital expenditures 3.1 2.3 6.1 2.0 — — 13.5 Three months ended March 31, 2011 Bauxite Alumina refining Primary aluminum products Flat rolled products Corporate Eliminations Consolidated $ $ $ $ $ $ $ Segment profit (loss) 6.4 22.9 47.8 13.5 (6.6) (1.9) 82.1 Depreciation and amortization (1.6) (5.2) (11.7) (4.8) (0.3) — (23.6) LIFO/LCM — — (4.8) (5.9) — 0.6 (10.1) Loss on disposal of assets — — (0.5) (0.6) — — (1.1) Non-cash pension, accretion and stock compensation (0.1) (0.1) (0.7) (0.6) (2.2) — (3.7) Restructuring, relocation and severance — (0.1) (0.2) — (0.1) — (0.4) Consulting and sponsor fees — — — — (0.3) — (0.3) Cash settlements on hedging transactions — — (0.2) (1.0) — — (1.2) Other, net (0.1) (0.2) 0.1 (0.1) — — (0.3) Operating income (loss) 4.6 17.3 29.8 0.5 (9.5) (1.3) 41.4 Interest expense, net 5.7 Gain on hedging activities, net (21.8) Total other income (16.1) Income before income taxes 57.5
Appendices Non-GAAP Measure: Disclaimer This presentation contains non-GAAP financial measures as defined by SEC rules. We think that these measures are helpful to investors in measuring our financial performance and comparing our performance to our peers. However, our non-GAAP financial measures may not be comparable to similarly titled non-GAAP financial measures used by other companies.These non-GAAP financial measures have limitations as an analytical tool and should not be considered in isolation or as a substitute for GAAP financial measures. To the extent we discuss any non-GAAP financial measures on the earnings call, a reconciliation of each measure to the most directly comparable GAAP measure are available in the appendices that follow and are filed as an Exhibit 99 to our Current Report on Form 8-K furnished to the SEC concurrent with the use of this presentation.
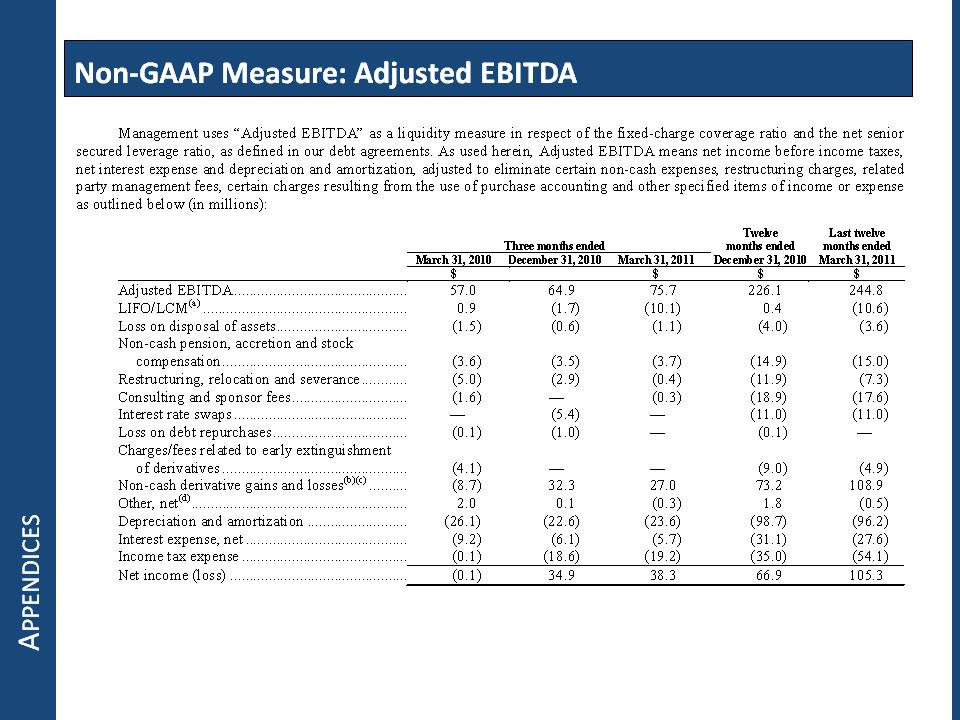
Management uses “Adjusted EBITDA” as a liquidity measure in respect of the fixed-charge coverage ratio and the net senior secured leverage ratio, as defined in our debt agreements. As used herein, Adjusted EBITDA means net income before income taxes, net interest expense and depreciation and amortization, adjusted to eliminate certain non-cash expenses, restructuring charges, related party management fees, certain charges resulting from the use of purchase accounting and other specified items of income or expense as outlined below (in millions):Three months ended Twelve months ended December 31, 2010 Last twelve months ended March 31, 2011 March 31, 2010 December 31, 2010 March 31, 2011 $ $ $ $ Adjusted EBITDA 57.0 64.9 75.7 226.1 244.8 LIFO/LCM(a) 0.9 (1.7) (10.1) 0.4 (10.6) Loss on disposal of assets (1.5) (0.6) (1.1) (4.0) (3.6) Non-cash pension, accretion and stock compensation (3.6) (3.5) (3.7) (14.9) (15.0) Restructuring, relocation and severance (5.0) (2.9) (0.4) (11.9) (7.3) Consulting and sponsor fees (1.6) — (0.3) (18.9) (17.6) Interest rate swaps — (5.4) — (11.0) (11.0) Loss on debt repurchases (0.1) (1.0) — (0.1) — Charges/fees related to early extinguishment of derivatives (4.1) — — (9.0) (4.9) Non-cash derivative gains and losses(b)(c) (8.7) 32.3 27.0 73.2 108.9 Other, net(d) 2.0 0.1 (0.3) 1.8 (0.5) Depreciation and amortization (26.1) (22.6) (23.6) (98.7) (96.2) Interest expense, net (9.2) (6.1) (5.7) (31.1) (27.6) Income tax expense (0.1) (18.6) (19.2) (35.0) (54.1) Net income (loss) (0.1) 34.9 38.3 66.9 105.3
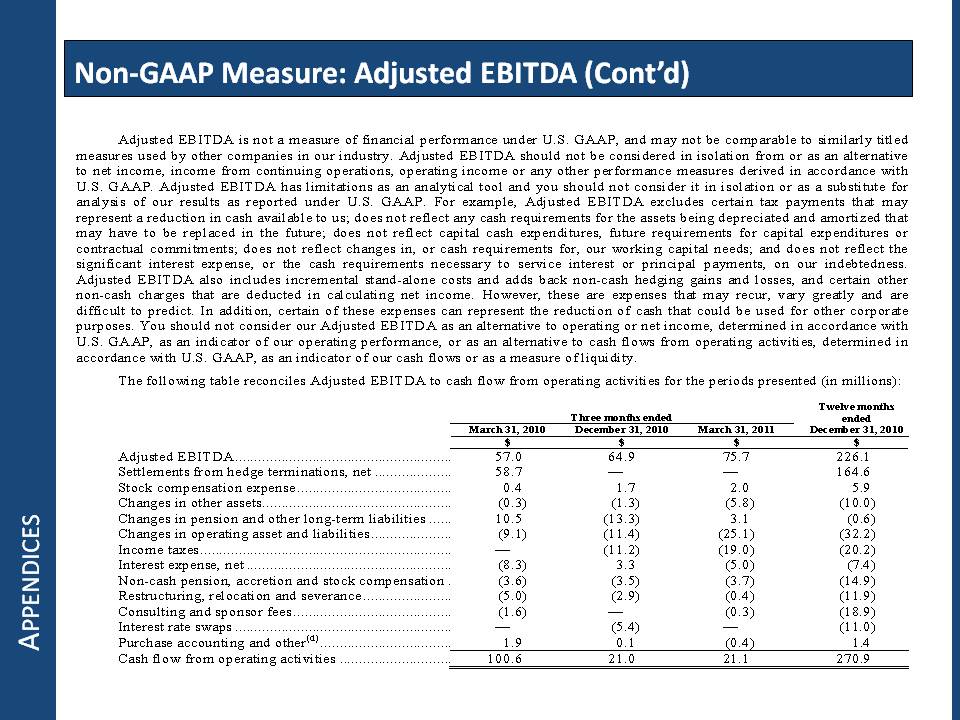
Appendices Non-GAAP Measure: Adjusted EBITDA (Cont’d) Adjusted EBITDA is not a measure of financial performance under U.S. GAAP, and may not be comparable to similarly titled measures used by other companies in our industry. Adjusted EBITDA should not be considered in isolation from or as an alternative to net income, income from continuing operations, operating income or any other performance measures derived in accordance with U.S. GAAP. Adjusted EBITDA has limitations as an analytical tool and you should not consider it in isolation or as a substitute for analysis of our results as reported under U.S. GAAP. For example, Adjusted EBITDA excludes certain tax payments that may represent a reduction in cash available to us; does not reflect any cash requirements for the assets being depreciated and amortized that may have to be replaced in the future; does not reflect capital cash expenditures, future requirements for capital expenditures or contractual commitments; does not reflect changes in, or cash requirements for, our working capital needs; and does not reflect the significant interest expense, or the cash requirements necessary to service interest or principal payments, on our indebtedness. Adjusted EBITDA also includes incremental stand-alone costs and adds back non-cash hedging gains and losses, and certain other non-cash charges that are deducted in calculating net income. However, these are expenses that may recur, vary greatly and are difficult to predict. In addition, certain of these expenses can represent the reduction of cash that could be used for other corporate purposes. You should not consider our Adjusted EBITDA as an alternative to operating or net income, determined in accordance with U.S. GAAP, as an indicator of our operating performance, or as an alternative to cash flows from operating activities, determined in accordance with U.S. GAAP, as an indicator of our cash flows or as a measure of liquidity.The following table reconciles Adjusted EBITDA to cash flow from operating activities for the periods presented (in millions): Three months ended Twelve months ended December 31, 2010 March 31, 2010 December 31, 2010 March 31, 2011 $ $ $ $ Adjusted EBITDA 57.0 64.9 75.7 226.1 Settlements from hedge terminations, net 58.7 — — 164.6 Stock compensation expense 0.4 1.7 2.0 5.9 Changes in other assets (0.3) (1.3) (5.8) (10.0) Changes in pension and other long-term liabilities 10.5 (13.3) 3.1 (0.6) Changes in operating asset and liabilities (9.1) (11.4) (25.1) (32.2) Income taxes — (11.2) (19.0) (20.2) Interest expense, net (8.3) 3.3 (5.0) (7.4) Non-cash pension, accretion and stock compensation (3.6) (3.5) (3.7) (14.9) Restructuring, relocation and severance (5.0) (2.9) (0.4) (11.9) Consulting and sponsor fees (1.6) — (0.3) (18.9) Interest rate swaps — (5.4) — (11.0) Purchase accounting and other(d) 1.9 0.1 (0.4) 1.4 Cash flow from operating activities 100.6 21.0 21.1 270.9
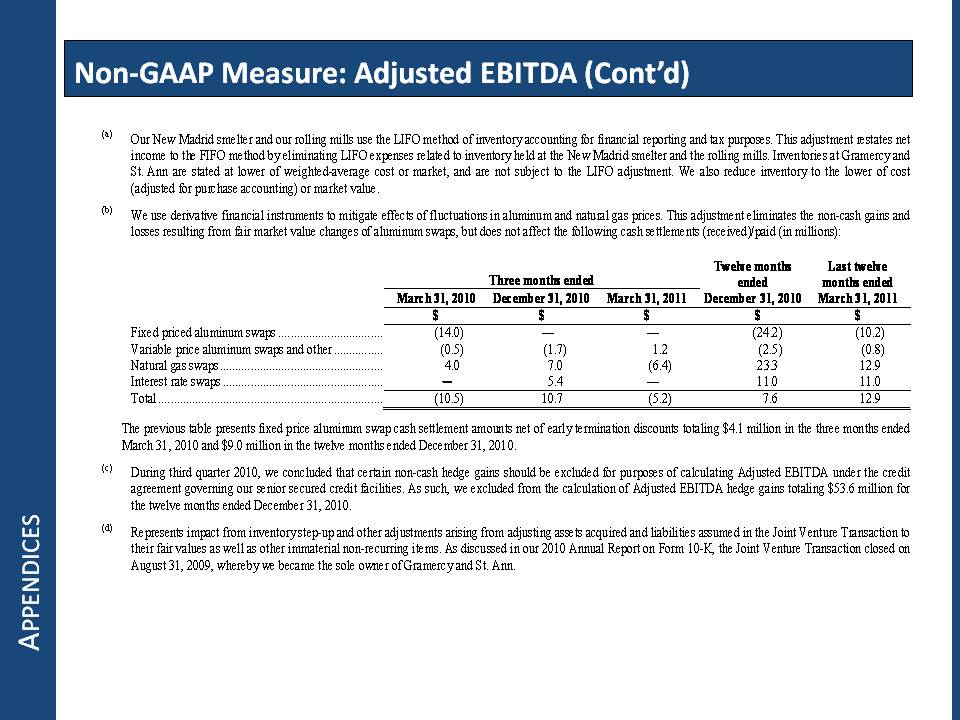
Appendices Non-GAAP Measure: Adjusted EBITDA (Cont’d) (a) Our New Madrid smelter and our rolling mills use the LIFO method of inventory accounting for financial reporting and tax purposes. This adjustment restates net income to the FIFO method by eliminating LIFO expenses related to inventory held at the New Madrid smelter and the rolling mills. Inventories at Gramercy and St. Ann are stated at lower of weighted-average cost or market, and are not subject to the LIFO adjustment. We also reduce inventory to the lower of cost (adjusted for purchase accounting) or market value. (b) We use derivative financial instruments to mitigate effects of fluctuations in aluminum and natural gas prices. This adjustment eliminates the non-cash gains and losses resulting from fair market value changes of aluminum swaps, but does not affect the following cash settlements (received)/paid (in millions): Three months ended Twelve months ended December 31, 2010 Last twelve months ended March 31, 2011 March 31, 2010 December 31, 2010 March 31, 2011 $ $ $ $ $ Fixed priced aluminum swaps (14.0) — — (24.2) (10.2) Variable price aluminum swaps and other (0.5) (1.7) 1.2 (2.5) (0.8) Natural gas swaps 4.0 7.0 (6.4) 23.3 12.9 Interest rate swaps ─ 5.4 — 11.0 11.0 Total (10.5) 10.7 (5.2) 7.6 12.9 The previous table presents fixed price aluminum swap cash settlement amounts net of early termination discounts totaling $4.1 million in the three months ended March 31, 2010 and $9.0 million in the twelve months ended December 31, 2010. (c) During third quarter 2010, we concluded that certain non-cash hedge gains should be excluded for purposes of calculating Adjusted EBITDA under the credit agreement governing our senior secured credit facilities. As such, we excluded from the calculation of Adjusted EBITDA hedge gains totaling $53.6 million for the twelve months ended December 31, 2010. (d) Represents impact from inventory step-up and other adjustments arising from adjusting assets acquired and liabilities assumed in the Joint Venture Transaction to their fair values as well as other immaterial non-recurring items. As discussed in our 2010 Annual Report on Form 10-K, the Joint Venture Transaction closed on August 31, 2009, whereby we became the sole owner of Gramercy and St. Ann.
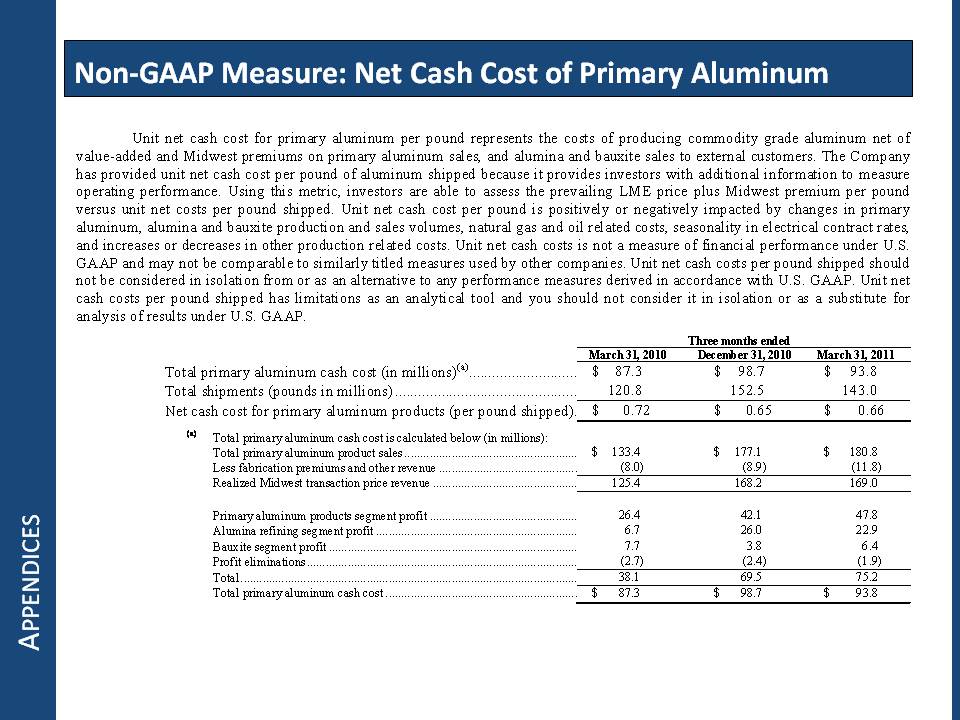
Appendices Non-GAAP Measure: Net Cash Cost of Primary Aluminum Unit net cash cost for primary aluminum per pound represents the costs of producing commodity grade aluminum net of value-added and Midwest premiums on primary aluminum sales, and alumina and bauxite sales to external customers. The Company has provided unit net cash cost per pound of aluminum shipped because it provides investors with additional information to measure operating performance. Using this metric, investors are able to assess the prevailing LME price plus Midwest premium per pound versus unit net costs per pound shipped. Unit net cash cost per pound is positively or negatively impacted by changes in primary aluminum, alumina and bauxite production and sales volumes, natural gas and oil related costs, seasonality in electrical contract rates, and increases or decreases in other production related costs. Unit net cash costs is not a measure of financial performance under U.S. GAAP and may not be comparable to similarly titled measures used by other companies. Unit net cash costs per pound shipped should not be considered in isolation from or as an alternative to any performance measures derived in accordance with U.S. GAAP. Unit net cash costs per pound shipped has limitations as an analytical tool and you should not consider it in isolation or as a substitute for analysis of results under U.S. GAAP. Three months ended March 31, 2010 December 31, 2010 March 31, 2011 Total primary aluminum cash cost (in millions)(a) $ 87.3 $ 98.7 $ 93.8 Total shipments (pounds in millions) 120.8 152.5 143.0 Net cash cost for primary aluminum products (per pound shipped) $ 0.72 $ 0.65 $ 0.66 Total primary aluminum cash cost is calculated below (in millions): Total primary aluminum product sales $ 133.4 $ 177.1 $ 180.8 Less fabrication premiums and other revenue (8.0) (8.9) (11.8) Realized Midwest transaction price revenue 125.4 168.2 169.0 Primary aluminum products segment profit 26.4 42.1 47.8 Alumina refining segment profit 6.7 26.0 22.9 Bauxite segment profit 7.7 3.8 6.4 Profit eliminations (2.7) (2.4) (1.9) Total 38.1 69.5 75.2 Total primary aluminum cash cost $ 87.3 $ 98.7 $ 93.8
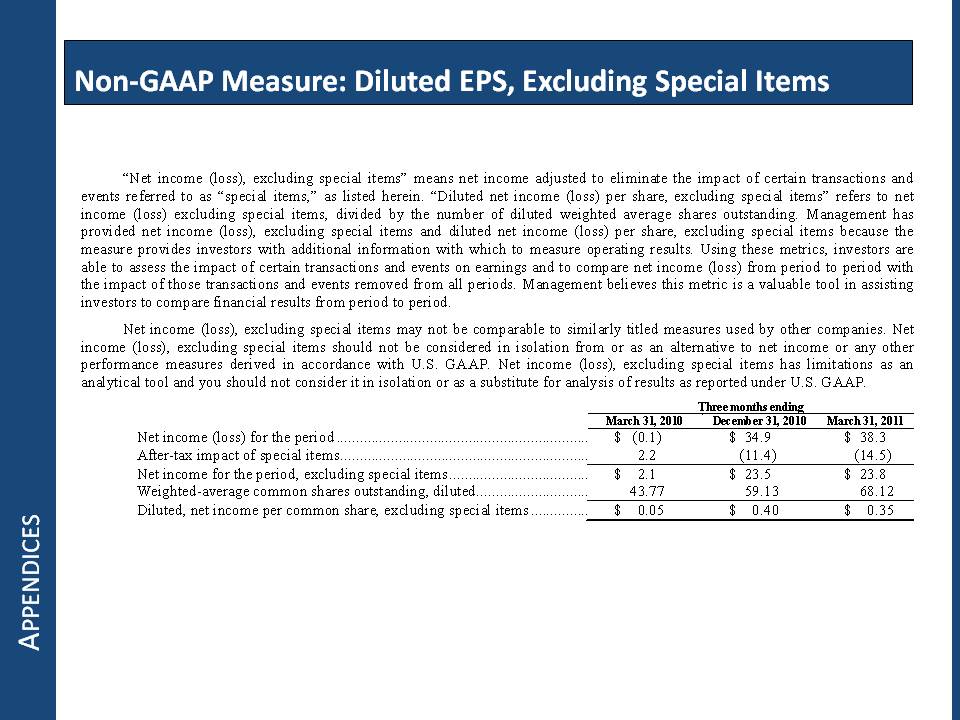
Appendices Non-GAAP Measure: Diluted EPS, Excluding Special Items “Net income (loss), excluding special items” means net income adjusted to eliminate the impact of certain transactions and events referred to as “special items,” as listed herein. “Diluted net income (loss) per share, excluding special items” refers to net income (loss) excluding special items, divided by the number of diluted weighted average shares outstanding. Management has provided net income (loss), excluding special items and diluted net income (loss) per share, excluding special items because the measure provides investors with additional information with which to measure operating results. Using these metrics, investors are able to assess the impact of certain transactions and events on earnings and to compare net income (loss) from period to period with the impact of those transactions and events removed from all periods. Management believes this metric is a valuable tool in assisting investors to compare financial results from period to period. Net income (loss), excluding special items may not be comparable to similarly titled measures used by other companies. Net income (loss), excluding special items should not be considered in isolation from or as an alternative to net income or any other performance measures derived in accordance with U.S. GAAP. Net income (loss), excluding special items has limitations as an analytical tool and you should not consider it in isolation or as a substitute for analysis of results as reported under U.S. GAAP. Three months ending March 31, 2010 December 31, 2010 March 31, 2011 Net income (loss) for the period $ (0.1) $ 34.9 $ 38.3 After-tax impact of special items 2.2 (11.4) (14.5) Net income for the period, excluding special items $ 2.1 $ 23.5 $ 23.8 Weighted-average common shares outstanding, diluted 43.77 59.13 68.12 Diluted, net income per common share, excluding special items $ 0.05 $ 0.40 $ 0.35

Noranda Aluminum Holding Corporation (Gp:) TM