Attached files
| file | filename |
|---|---|
| 8-K - Q12011 FORM 8-K - CSX CORP | form8-kq12011.htm |
| EX-99.1 - Q12011 PRESS RELEASE - CSX CORP | pressrelease_q12011.htm |
Exhibit 99.2

CSX Announces Record First Quarter Results
Year-Over-Year Highlights:
|
·
|
Operating income improves 22 percent to $773 million
|
|
·
|
Operating ratio improves 210 basis points to 72.5 percent
|
|
·
|
Earnings per share increases 36 percent
|
Jacksonville, Fla. – April 19, 2011 – CSX Corporation (NYSE: CSX) today announced first quarter net earnings of $395 million, or $1.06 per share, versus $305 million, or $0.78 per share, in the same period last year. This represents a 36 percent year-over-year improvement in earnings per share.
“CSX delivered record financial results and achieved growth across nearly all markets in a growing economy,” said Michael J. Ward, chairman, president and chief executive officer. “We expect these positive trends to continue, allowing CSX to make critical investments and meet the future transportation needs of our customers and the nation.”
Revenue in the quarter improved 13 percent from the prior year to $2.8 billion, driven primarily by a 7 percent increase in overall volume. Shipments across all major markets – merchandise, intermodal and coal – increased as the economy continued to grow.
The higher revenue coupled with the company’s focus on profitable growth drove a 22 percent increase in operating income to $773 million and a record first quarter operating ratio of 72.5 percent, a 210 basis point improvement year-over-year.
Consistent with prior guidance, CSX expects to deliver a high-sixties operating ratio in 2011, which keeps the company on a path to a 65 percent operating ratio by no later than 2015.
This earnings announcement, as well as a package of detailed financial information, is contained in the CSX Quarterly Financial Report available on the company’s website at http://investors.csx.com and on Form 8-K with the Securities and Exchange Commission (“SEC”).
|
Table of Contents
|
The accompanying unaudited
|
CSX CORPORATION
|
CONTACTS:
|
|
financial information should be
|
500 Water Street, C900
|
||
|
read in conjunction with the
|
Jacksonville, FL
|
INVESTOR RELATIONS
|
|
|
Company’s most recent
|
32202
|
David Baggs
|
|
|
Annual Report on Form 10-K,
|
http://www.csx.com
|
(904) 359-4812
|
|
|
Quarterly Reports on Form
|
MEDIA
|
||
|
10-Q, and any Current
|
Lauren Rueger
|
||
|
Reports on Form 8-K.
|
(877) 835-5279
|
1
[
CSX executives will conduct a quarterly earnings conference call with the investment community on April 20, 2011 at 8:30 a.m. Eastern Time. Investors, media and the public may listen to the conference call by dialing 1-888-327-6279 (888-EARN-CSX) and asking for the CSX earnings call. (Callers outside the U.S., dial 1-773-756-0199). Participants should dial in 10 minutes prior to the call. In conjunction with the call, a live webcast will be accessible and presentation materials will be posted on the company's website at http://investors.csx.com. Following the earnings call, an internet replay of the presentation will be archived on the company website.
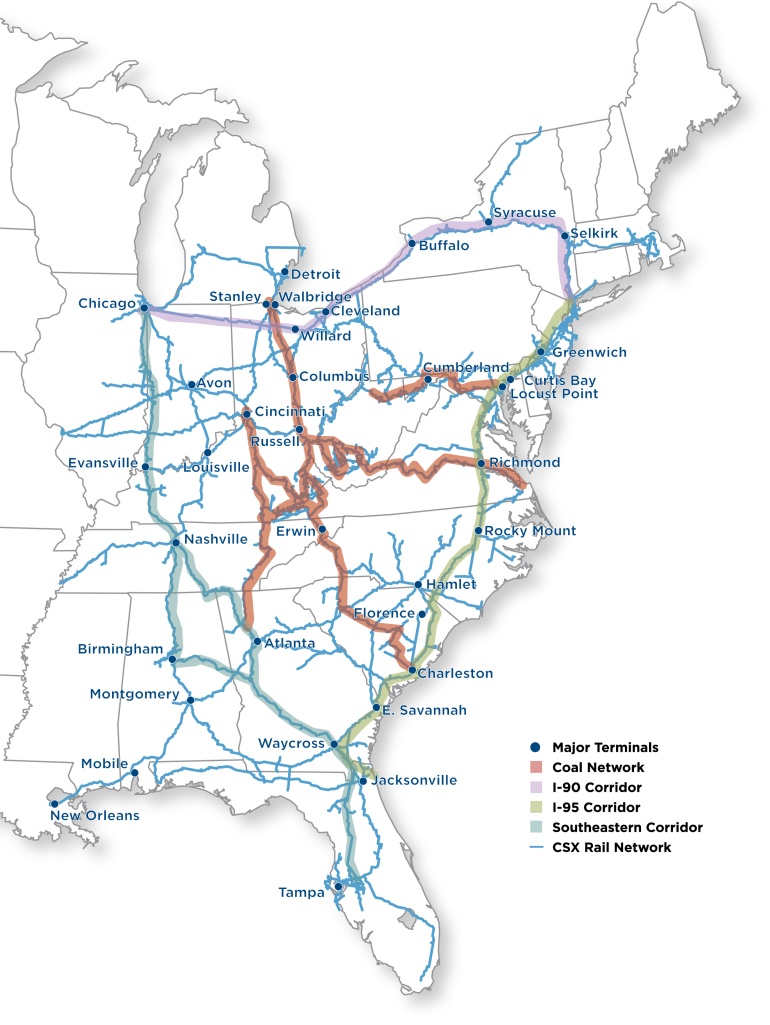
CSX Corporation, based in Jacksonville, Fla., is one of the nation’s leading transportation companies, providing rail, intermodal and rail-to-truck transload services. The company's transportation network spans approximately 21,000 miles, with service to 23 eastern states and the District of Columbia, and connects to over 230 short line and regional railroads and more than 70 ocean, river, and lake ports. More information about CSX Corporation and its subsidiaries is available at www.csx.com.
Forward-looking Statements
This information and other statements by the company may contain forward-looking statements within the meaning of the Private Securities Litigation Reform Act with respect to, among other items: projections and estimates of earnings, revenues, volumes, rates, cost-savings, expenses, taxes, liquidity, capital expenditures, share repurchases or other financial items, statements of management’s plans, strategies and objectives for future operations, and management’s expectations as to future performance and operations and the time by which objectives will be achieved, statements concerning proposed new services, and statements regarding future economic, industry or market conditions or performance. Forward-looking statements are typically identified by words or phrases such as “believe,” “expect,” “anticipate,” “project,” “estimate,” “preliminary” and similar expressions. Forward-looking statements speak only as of the date they are made, and the company undertakes no obligation to update or revise any forward-looking statement. If the company updates any forward-looking statement, no inference should be drawn that the company will make additional updates with respect to that statement or any other forward-looking statements.
Forward-looking statements are subject to a number of risks and uncertainties, and actual performance or results could differ materially from that anticipated by any forward-looking statements. Factors that may cause actual results to differ materially from those contemplated by any forward-looking statements include, among others; (i) the company’s success in implementing its financial and operational initiatives; (ii) changes in domestic or international economic, political or business conditions, including those affecting the transportation industry (such as the impact of industry competition, conditions, performance and consolidation); (iii) legislative or regulatory changes; (iv) the inherent business risks associated with safety and security; (v) the outcome of claims and litigation involving or affecting the company; (vi) natural events such as severe weather conditions or pandemic health crises; and (vii) the inherent uncertainty associated with projecting economic and business conditions.
Other important assumptions and factors that could cause actual results to differ materially from those in the forward-looking statements are specified in the company’s SEC reports, accessible on the SEC’s website at www.sec.gov and the company’s website at www.csx.com.
2
|
CONSOLIDATED INCOME STATEMENTS
|
||||||
|
(Dollars in Millions, Except Per Share Amounts)
|
||||||
|
(Unaudited)
|
||||||
|
Quarters Ended
|
||||||
|
Apr. 1,
|
Mar. 26,
|
|||||
|
2011
|
2010
|
$ Change
|
% Change
|
|||
|
(Adjusted) (a)
|
||||||
|
Revenue
|
$2,810
|
$2,491
|
$319
|
13
|
%
|
|
|
Expense
|
||||||
|
Labor and Fringe
|
765
|
729
|
(36)
|
(5)
|
||
|
Materials, Supplies and Other
|
530
|
519
|
(11)
|
(2)
|
||
|
Fuel
|
402
|
283
|
(119)
|
(42)
|
||
|
Depreciation
|
243
|
228
|
(15)
|
(7)
|
||
|
Equipment and Other Rents
|
97
|
100
|
3
|
3
|
||
|
Total Expense
|
2,037
|
1,859
|
(178)
|
(10)
|
||
|
Operating Income
|
773
|
632
|
141
|
22
|
||
|
Interest Expense
|
(140)
|
(142)
|
2
|
1
|
||
|
Other Income - Net (b)
|
5
|
11
|
(6)
|
(55)
|
||
|
Earnings Before Income Taxes
|
638
|
501
|
137
|
27
|
||
|
Income Tax Expense
|
(243)
|
(196)
|
(47)
|
(24)
|
||
|
Net Earnings
|
$395
|
$305
|
$90
|
30
|
%
|
|
|
Operating Ratio
|
72.5%
|
74.6%
|
||||
|
Per Common Share
|
||||||
|
Net Earnings Per Share, Assuming Dilution
|
$1.06
|
$0.78
|
$0.28
|
36
|
%
|
|
|
Average Shares Outstanding,
|
||||||
|
Assuming Dilution (Thousands)
|
371,586
|
394,323
|
||||
|
Cash Dividends Paid Per Common Share
|
$0.26
|
$0.24
|
||||
See accompanying Notes to Consolidated Financial Statements on Page 6.
3
|
CSX Corporation
|
||
|
CONDENSED CONSOLIDATED BALANCE SHEETS
|
||
|
(Dollars in Millions)
|
||
|
(Unaudited)
|
||
|
Apr. 1,
|
Dec. 31,
|
|
|
2011
|
2010
|
|
|
ASSETS
|
||
|
Cash, Cash Equivalents and Short-term Investments
|
$590
|
$1,346
|
|
Other Current Assets
|
1,581
|
1,509
|
|
Properties - Net
|
23,915
|
23,799
|
|
Investment in Affiliates and Other Companies
|
1,140
|
1,134
|
|
Other Long-term Assets
|
351
|
353
|
|
Total Assets
|
$27,577
|
$28,141
|
|
LIABILITIES AND SHAREHOLDERS' EQUITY
|
||
|
Current Maturities of Long-term Debt
|
$503
|
$613
|
|
Other Current Liabilities
|
1,719
|
1,924
|
|
Long-term Debt
|
7,637
|
8,051
|
|
Deferred Income Taxes
|
7,182
|
7,053
|
|
Other Long-term Liabilities
|
1,780
|
1,800
|
|
Total Liabilities
|
18,821
|
19,441
|
|
Total Shareholders' Equity
|
8,756
|
8,700
|
|
Total Liabilities and Shareholders' Equity
|
$27,577
|
$28,141
|
See accompanying Notes to Consolidated Financial Statements on Page 6.
4
|
CSX Corporation
|
||
|
CONDENSED CONSOLIDATED CASH FLOW STATEMENTS
|
||
|
(Dollars in Millions)
|
||
|
(Unaudited)
|
||
|
Quarters Ended
|
||
|
Apr. 1,
|
Mar. 26,
|
|
|
2011
|
2010
|
|
|
OPERATING ACTIVITIES
|
(Adjusted)(a)
|
|
|
Net Earnings
|
$395
|
$305
|
|
Depreciation
|
243
|
228
|
|
Deferred Income Taxes
|
137
|
46
|
|
Other - Net (c)
|
(269)
|
165
|
|
Net Cash Provided by Operating Activities
|
506
|
744
|
|
INVESTING ACTIVITIES
|
||
|
Property Additions
|
(390)
|
(328)
|
|
Other Investing Activities
|
14
|
18
|
|
Net Cash Used in Investing Activities
|
(376)
|
(310)
|
|
FINANCING ACTIVITIES
|
||
|
Long-term Debt Repaid
|
(524)
|
(17)
|
|
Dividends Paid
|
(96)
|
(93)
|
|
Shares Repurchased
|
(300)
|
(229)
|
|
Other Financing Activities - Net (d)
|
32
|
(131)
|
|
Net Cash Used in Financing Activities
|
(888)
|
(470)
|
|
Net Decrease in Cash and Cash Equivalents
|
(758)
|
(36)
|
|
CASH AND CASH EQUIVALENTS
|
||
|
Cash and Cash Equivalents at Beginning of Period
|
1,292
|
1,029
|
|
Cash and Cash Equivalents at End of Period
|
$534
|
$993
|
See accompanying Notes to Consolidated Financial Statements on Page 6.
5
CSX Corporation
NOTES TO CONSOLIDATED FINANCIAL STATEMENTS (Unaudited)
|
a)
|
Rail grinding: As previously disclosed, certain prior year amounts have been adjusted for the retrospective change in accounting policy for rail grinding.
|
|
b)
|
Other Income – Net: Other income – net consisted of the following:
|
|
Quarters Ended
|
|||
|
Apr. 1
|
Mar. 26,
|
||
|
(Dollars in Millions)
|
2011
|
2010
|
$ Change
|
|
Interest Income
|
$1
|
$1
|
$-
|
|
Income from Real Estate Operations
|
3
|
7
|
(4)
|
|
Miscellaneous Income (Expense)
|
1
|
3
|
(2)
|
|
Total Other Income - Net
|
$5
|
$11
|
$(6)
|
|
c)
|
Other Operating Activities – Net: In first quarter 2011, cash used for other operating activities (which includes working capital changes) increased primarily as a result of higher payroll-related payments due to the timing of this year's quarter-end and higher incentive compensation payouts.
|
|
d)
|
Other Financing Activities – Net: In first quarter last year, other financing activities included $141 million paid as cash consideration to exchange higher interest rate debt for lower interest rate debt which did not repeat in this year's quarter.
|
6
|
CSX Corporation
|
||||||||||||||
|
VOLUME AND REVENUE (Unaudited)(a)
|
||||||||||||||
|
Volume (Thousands of Units); Revenue (Dollars in Millions); Revenue Per Unit (Dollars)
|
||||||||||||||
|
Quarters Ended April 1, 2011 and March 26, 2010
|
||||||||||||||
|
Volume
|
Revenue
|
Revenue Per Unit
|
||||||||||||
|
2011
|
2010
|
% Change
|
2011
|
2010
|
% Change
|
2011
|
2010
|
% Change
|
||||||
|
Agricultural
|
||||||||||||||
|
Agricultural Products
|
109
|
114
|
(4)
|
%
|
$260
|
$267
|
(3)
|
%
|
$2,385
|
$2,342
|
2
|
%
|
||
|
Phosphates and Fertilizers
|
83
|
79
|
5
|
136
|
123
|
11
|
1,639
|
1,557
|
5
|
|||||
|
Food and Consumer
|
25
|
25
|
-
|
63
|
59
|
7
|
2,520
|
2,360
|
7
|
|||||
|
Industrial
|
||||||||||||||
|
Chemicals
|
117
|
112
|
4
|
394
|
351
|
12
|
3,368
|
3,134
|
7
|
|||||
|
Automotive
|
89
|
74
|
20
|
219
|
170
|
29
|
2,461
|
2,297
|
7
|
|||||
|
Metals
|
67
|
61
|
10
|
148
|
128
|
16
|
2,209
|
2,098
|
5
|
|||||
|
Housing and Construction
|
||||||||||||||
|
Emerging Markets
|
95
|
85
|
12
|
145
|
130
|
12
|
1,526
|
1,529
|
-
|
|||||
|
Forest Products
|
69
|
63
|
10
|
161
|
140
|
15
|
2,333
|
2,222
|
5
|
|||||
|
Total Merchandise
|
654
|
613
|
7
|
1,526
|
1,368
|
12
|
2,333
|
2,232
|
5
|
|||||
|
Coal
|
385
|
373
|
3
|
879
|
736
|
19
|
2,283
|
1,973
|
16
|
|||||
|
Intermodal(b)
|
553
|
500
|
11
|
332
|
319
|
4
|
600
|
638
|
(6)
|
|||||
|
Other
|
-
|
-
|
-
|
73
|
68
|
7
|
-
|
-
|
-
|
|||||
|
Total
|
1,592
|
1,486
|
7
|
%
|
$2,810
|
$2,491
|
13
|
%
|
$1,765
|
$1,676
|
5
|
%
|
||
|
(a)
|
Prior periods have been reclassified to conform to current presentation.
|
|
(b)
|
The revenue-per-unit decline was primarily driven by the continued impact of terminating the prior purchased transportation agreement.
|
7
CSX Corporation
VOLUME AND REVENUE
The Company achieved strong year-over-year volume and revenue growth as demand for rail service increased and economic conditions continued to improve. Volume was higher in almost all markets with the greatest volume increases in automotive, emerging markets and intermodal. Ongoing emphasis on pricing above rail inflation, along with higher fuel recovery associated with the increase in fuel prices drove revenue-per-unit increases in most markets.
Merchandise
Agricultural
Agricultural Products – Volume declined as feed shipments were lower year over year primarily due to a surge in exports last year as a result of the drought in South America.
Phosphates and Fertilizers – Domestic demand was strong for fertilizers as farmers increased application to improve crop yields. Export demand was also strong with recovery in exports to Central and South America after last year’s drought.
Food and Consumer – Volume was flat as strength in truckload conversions of refrigerated products (driven by higher fuel prices) and continued consumer demand for alcoholic beverages was offset by lower shipments of canned goods.
|
|
Industrial
|
Chemicals – Growth occurred across most chemicals markets reflecting improvement in demand for intermediate products used in manufacturing automobiles and consumer goods. Specifically, many plastics and chemicals are key inputs in the production of both durable and nondurable goods, as well as packaging.
Automotive – Strong growth was due to the continued increase in North American light-vehicle production driven by higher sales.
Metals – Volume growth was driven by continued increased shipments of sheet steel for auto production and increases in scrap steel resulting from higher steel production.
|
|
Housing and Construction
|
Emerging Markets – Volume increased driven by improved shipments of aggregates (which include crushed stone, sand and gravel) and waste as a result of overall market growth due to the improving economy.
Forest Products – Volume increased despite the weakness in construction-related markets with strength in shipments of pulp board and paper used in packaging for consumer products.
Coal
Growth was driven by higher export shipments due to greater demand for U.S. coal in Europe, Asia and South America. Utility coal shipments were weakened as electrical generation declined in the eastern U.S., most significantly in the Southeast. Also contributing to this decline, natural gas prices continued to remain at low levels and utility stockpiles remained at or slightly above normal levels. The increase in revenue per unit was driven by improved yield and positive mix.
Intermodal
Strength in volume was primarily driven by increased customer demand, the improving U.S. economy and new international gains as a result of the intermodal portfolio of service and network offerings. The revenue-per-unit decline was driven by the continued impact of terminating the prior purchase transportation agreement in 2010 and was partially offset by an improved pricing environment and increased fuel recovery due to higher fuel prices.
8
CSX Corporation
EXPENSE
Expenses increased $178 million from last year’s first quarter. Significant variances are described below.
Labor and Fringe expense increased $36 million primarily due to inflation of $23 million. Volume-related and other expenses were $13 million higher during the quarter.
Materials, Supplies and Other expense increased $11 million due to:
|
·
|
Volume-related, inflation and other expenses were $31 million higher during the quarter.
|
|
·
|
Prior year insurance and legal recoveries of $17 million that did not repeat in the current quarter.
|
|
·
|
Offsetting these increases was reductions of $37 million related to the impact of terminating the prior intermodal purchased transportation agreement in the prior year.
|
Fuel expense increased $119 million primarily due to a 36% increase in average price per gallon as well as higher volume. (See Fuel Statistics table below.)
|
FUEL STATISTICS
|
||||
|
Quarters Ended
|
||||
|
Apr. 1,
|
Mar. 26,
|
|||
|
2011
|
2010
|
Change
|
||
|
Estimated Locomotive Fuel Consumption (Millions of gallons)
|
127.9
|
120.9
|
(7.0)
|
|
|
Price Per Gallon (Dollars)
|
$2.86
|
$2.11
|
$(0.75)
|
|
|
Total Locomotive Fuel Expense (Dollars in millions)
|
$366
|
$255
|
$(111)
|
|
|
Total Non-Locomotive Fuel Expense (Dollars in millions)
|
36
|
28
|
(8)
|
|
|
Total Fuel Expense (Dollars in millions)
|
$402
|
$283
|
$(119)
|
|
|
EMPLOYEE COUNTS (Estimated)
|
|||||
|
2011
|
2010
|
Change
|
|||
|
January
|
30,112
|
29,105
|
1,007
|
||
|
February
|
30,309
|
29,234
|
1,075
|
||
|
March
|
30,464
|
29,590
|
874
|
||
|
Average
|
30,295
|
29,310
|
985
|
||
9
|
OPERATING STATISTICS (Estimated)
|
|||||
|
Quarters Ended
|
|||||
|
Apr. 1
|
Mar. 26,
|
Improvement
|
|||
|
Coal (Millions of Tons)
|
2011
|
2010
|
(Decline) %
|
||
|
Domestic
|
|||||
|
Utility
|
28.1
|
29.8
|
(6)
|
%
|
|
|
Other
|
2.5
|
2.5
|
-
|
||
|
Total Domestic
|
30.6
|
32.3
|
(5)
|
||
|
Export
|
10.7
|
7.4
|
45
|
||
|
Coke and Iron Ore
|
1.5
|
1.7
|
(12)
|
||
|
Total Coal
|
42.8
|
41.4
|
3
|
%
|
|
|
Revenue Ton-Miles (Billions)(a)
|
|||||
|
Merchandise
|
32.8
|
31.4
|
4
|
%
|
|
|
Coal
|
19.3
|
19.1
|
1
|
||
|
Intermodal
|
5.3
|
4.5
|
18
|
||
|
Total
|
57.4
|
55.0
|
4
|
%
|
|
|
Gross Ton-Miles (Billions)
|
|||||
|
Total Gross Ton-Miles
|
103.8
|
99.7
|
4
|
%
|
|
|
(Excludes locomotive gross ton-miles)
|
|||||
|
Safety and Service Measurements
|
|||||
|
FRA Personal Injury Frequency Index
|
0.78
|
0.82
|
5
|
%
|
|
|
Number of FRA-reportable injuries per 200,000 man-hours
|
|||||
|
FRA Train Accident Rate
|
2.57
|
3.36
|
24
|
%
|
|
|
Number of FRA-reportable train accidents per million train miles
|
|||||
|
On-Time Train Originations
|
66%
|
69%
|
(4)
|
%
|
|
|
On-Time Destination Arrivals
|
59%
|
67%
|
(12)
|
%
|
|
|
Dwell (Hours)
|
26.6
|
25.8
|
(3)
|
%
|
|
|
Cars-On-Line
|
212,418
|
214,845
|
1
|
%
|
|
|
Train Velocity (Miles per hour)
|
20.5
|
20.9
|
(2)
|
%
|
|
|
Resources
|
Decrease %
|
||||
|
Route Miles
|
21,050
|
21,189
|
(1)
|
%
|
|
|
Locomotives (Owned and long-term leased)
|
4,076
|
4,067
|
-
|
%
|
|
|
Freight Cars (Owned and long-term leased)
|
78,518
|
82,452
|
(5)
|
%
|
|
|
(a)
|
Prior periods have been reclassified to conform to current presentation.
|
10
11