Attached files
| file | filename |
|---|---|
| 8-K - FORM 8-K - Approach Resources Inc | d81442e8vk.htm |
Exhibit 99.1
| Emerging Unconventional Oil and Liquids-Rich Gas Targets J. Ross Craft, President & Chief Executive Officer DUG Conference April 19, 2011 |
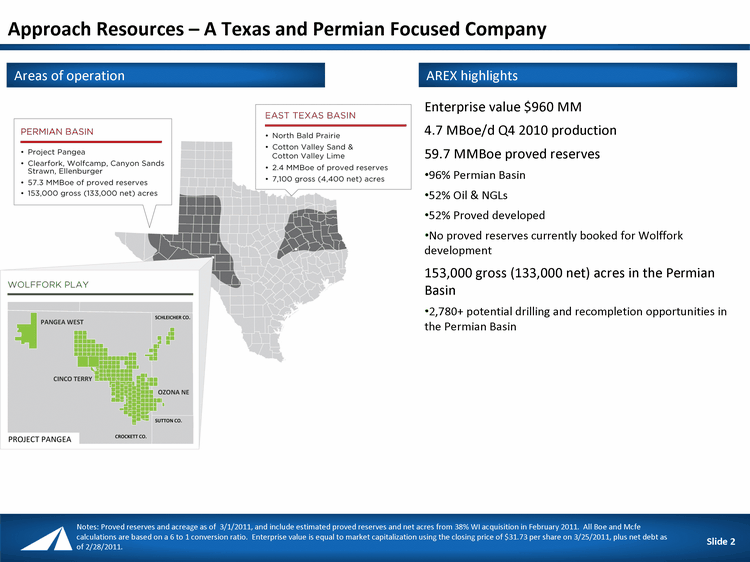
| Notes: Proved reserves and acreage as of 3/1/2011, and include estimated proved reserves and net acres from 38% WI acquisition in February 2011. All Boe and Mcfe calculations are based on a 6 to 1 conversion ratio. Enterprise value is equal to market capitalization using the closing price of $31.73 per share on 3/25/2011, plus net debt as of 2/28/2011. Enterprise value $960 MM 4.7 MBoe/d Q4 2010 production 59.7 MMBoe proved reserves 96% Permian Basin 52% Oil & NGLs 52% Proved developed No proved reserves currently booked for Wolffork development 153,000 gross (133,000 net) acres in the Permian Basin 2,780+ potential drilling and recompletion opportunities in the Permian Basin Areas of operation AREX highlights Slide 2 Approach Resources - A Texas and Permian Focused Company |
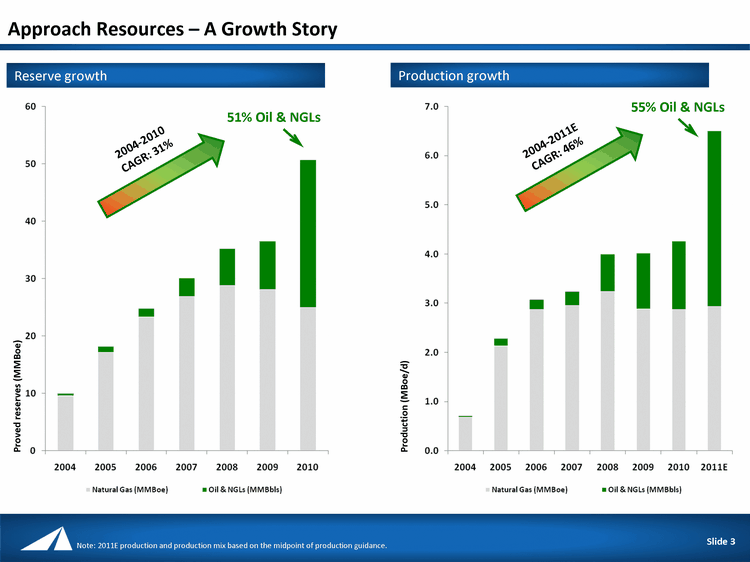
| Approach Resources - A Growth Story Slide 3 Reserve growth 51% Oil & NGLs Production growth 2004-2010 CAGR: 31% 2004-2011E CAGR: 46% Proved reserves (MMBoe) Production (MBoe/d) 55% Oil & NGLs Note: 2011E production and production mix based on the midpoint of production guidance. |
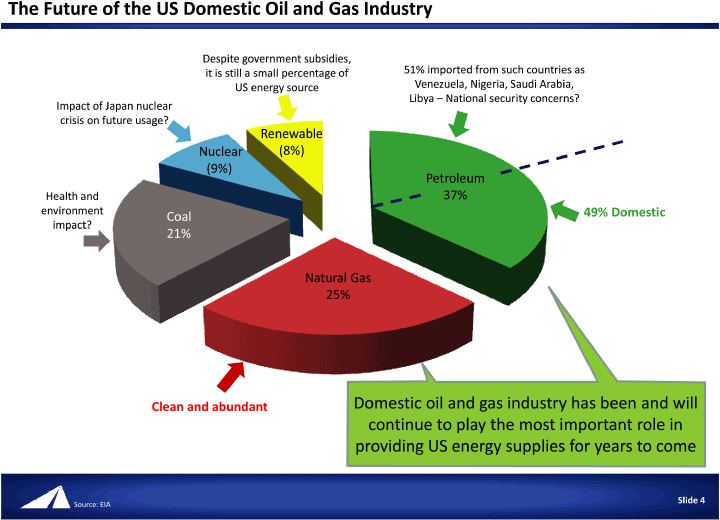
| The Future of the US Domestic Oil and Gas Industry Slide 4 51% imported from such countries as Venezuela, Nigeria, Saudi Arabia, Libya - National security concerns? Impact of Japan nuclear crisis on future usage? Health and environment impact? Natural Gas 25% Coal 21% Nuclear (9%) Renewable (8%) Clean and abundant Despite government subsidies, it is still a small percentage of US energy source Domestic oil and gas industry has been and will continue to play the most important role in providing US energy supplies for years to come 49% Domestic Petroleum 37% Source: EIA |
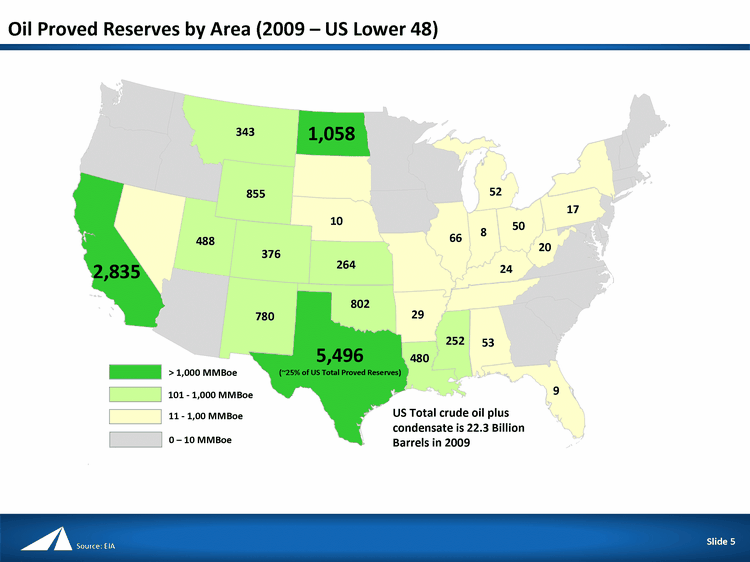
| Oil Proved Reserves by Area (2009 - US Lower 48) Slide 5 2,835 1,058 101 - 1,000 MMBoe 11 - 1,00 MMBoe 0 - 10 MMBoe US Total crude oil plus condensate is 22.3 Billion Barrels in 2009 343 855 488 376 780 264 802 252 480 10 29 9 53 17 50 20 24 52 8 66 5,496 (~25% of US Total Proved Reserves) > 1,000 MMBoe Source: EIA |
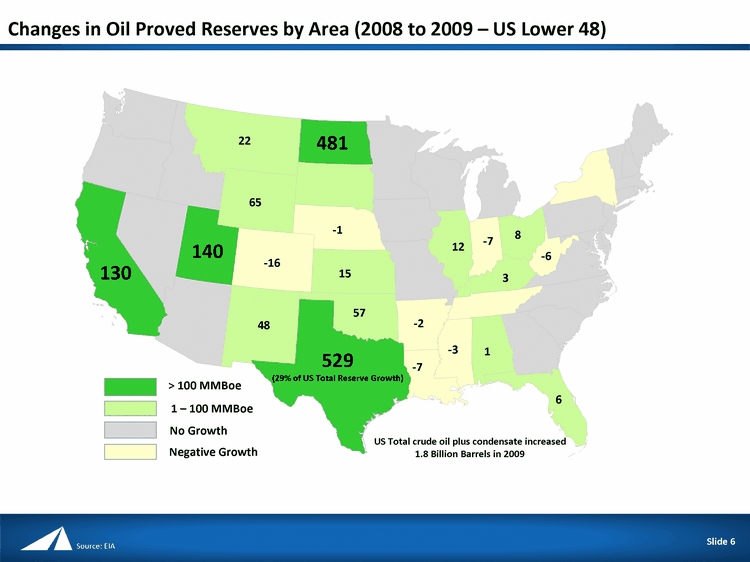
| Changes in Oil Proved Reserves by Area (2008 to 2009 - US Lower 48) Slide 6 529 (29% of US Total Reserve Growth) 130 481 1 - 100 MMBoe No Growth Negative Growth US Total crude oil plus condensate increased 1.8 Billion Barrels in 2009 22 65 140 -16 48 15 57 -3 -7 -1 -2 6 1 8 -6 3 -7 12 > 100 MMBoe Source: EIA |
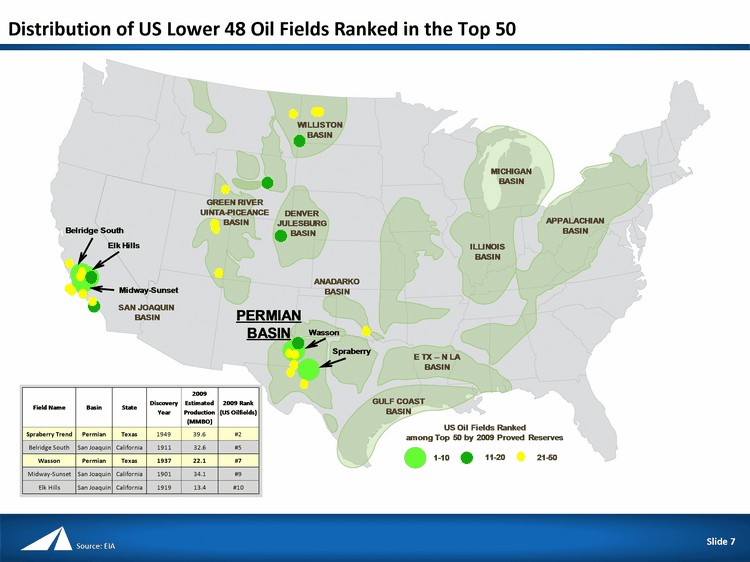
| Distribution of US Lower 48 Oil Fields Ranked in the Top 50 Slide 7 Data Source EIA Source: EIA |
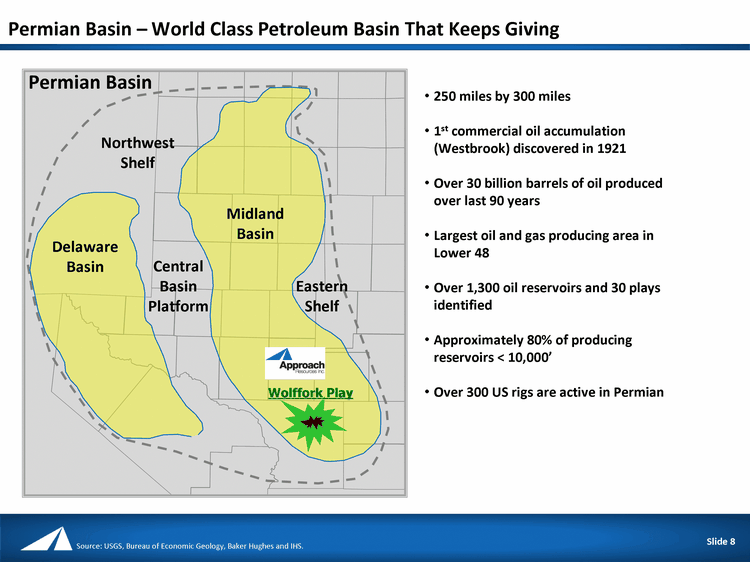
| Permian Basin - World Class Petroleum Basin That Keeps Giving Slide 8 Permian Basin Midland Basin Delaware Basin Central Basin Platform Northwest Shelf Eastern Shelf Wolffork Play 250 miles by 300 miles 1st commercial oil accumulation (Westbrook) discovered in 1921 Over 30 billion barrels of oil produced over last 90 years Largest oil and gas producing area in Lower 48 Over 1,300 oil reservoirs and 30 plays identified Approximately 80% of producing reservoirs < 10,000' Over 300 US rigs are active in Permian Source: USGS, Bureau of Economic Geology, Baker Hughes and IHS. |
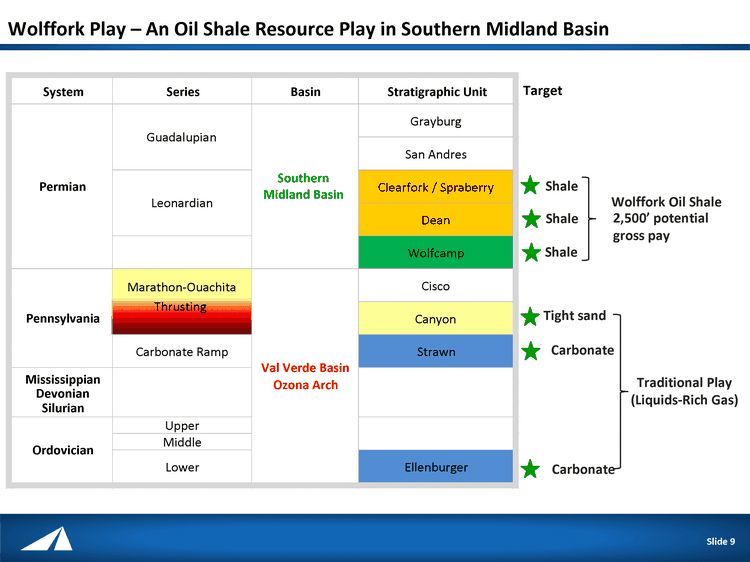
| Wolffork Play - An Oil Shale Resource Play in Southern Midland Basin Slide 9 2,500' potential gross pay Tight sand Target Carbonate Carbonate Shale Shale Wolffork Oil Shale Shale System Series Basin Stratigraphic Unit Grayburg San Andres Clearfork / Spraberry Dean Wolfcamp Cisco Canyon Carbonate Ramp Strawn Mississippian Devonian Silurian Upper Middle Lower Ellenburger Marathon-Ouachita Thrusting Southern Midland Basin Val Verde Basin Ozona Arch Guadalupian Leonardian Permian Pennsylvania Ordovician Traditional Play (Liquids-Rich Gas) |
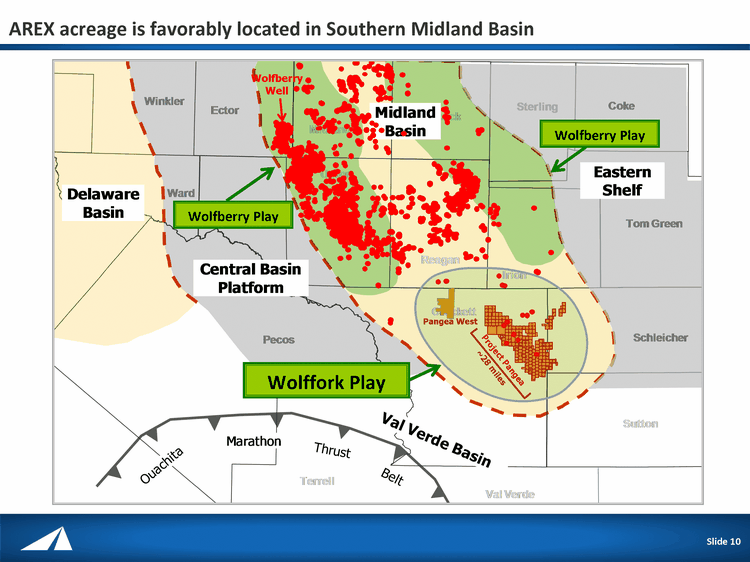
| Slide 10 AREX acreage is favorably located in Southern Midland Basin Slide 10 Wolfberry Well ~28 miles Pangea West Wolffork Play Wolfberry Play Wolfberry Play Project Pangea |
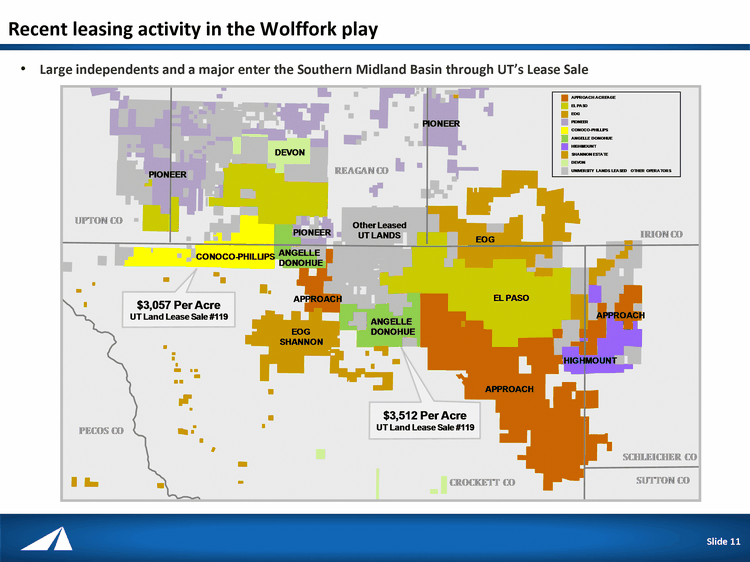
| Recent leasing activity in the Wolffork play October 12, 2010 Slide 11 Slide 11 Large independents and a major enter the Southern Midland Basin through UT's Lease Sale |
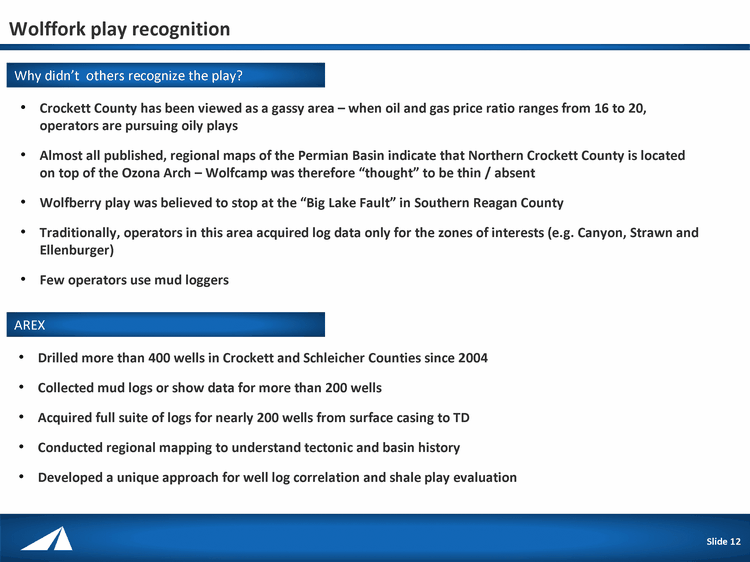
| Wolffork play recognition Slide 12 Crockett County has been viewed as a gassy area - when oil and gas price ratio ranges from 16 to 20, operators are pursuing oily plays Almost all published, regional maps of the Permian Basin indicate that Northern Crockett County is located on top of the Ozona Arch - Wolfcamp was therefore "thought" to be thin / absent Wolfberry play was believed to stop at the "Big Lake Fault" in Southern Reagan County Traditionally, operators in this area acquired log data only for the zones of interests (e.g. Canyon, Strawn and Ellenburger) Few operators use mud loggers Drilled more than 400 wells in Crockett and Schleicher Counties since 2004 Collected mud logs or show data for more than 200 wells Acquired full suite of logs for nearly 200 wells from surface casing to TD Conducted regional mapping to understand tectonic and basin history Developed a unique approach for well log correlation and shale play evaluation Why didn't others recognize the play? AREX Slide 12 |
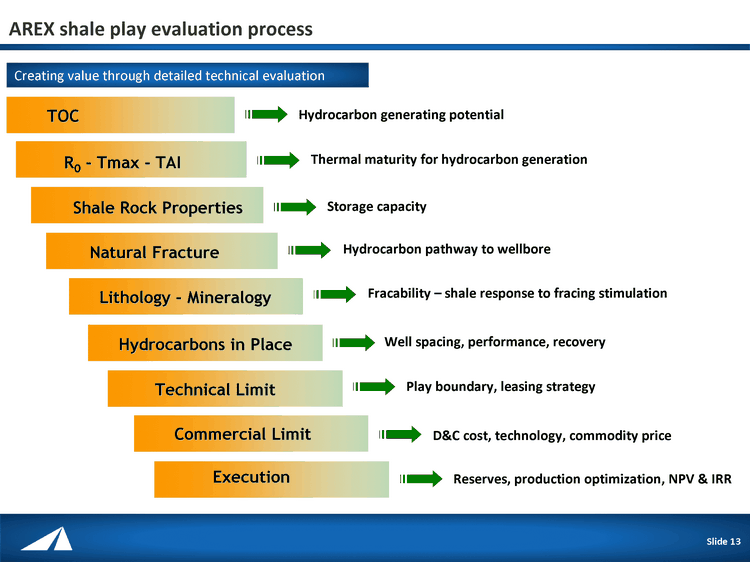
| AREX shale play evaluation process Slide 13 Hydrocarbon generating potential TOC R0 - Tmax - TAI Shale Rock Properties Lithology - Mineralogy Hydrocarbons in Place Technical Limit Commercial Limit Thermal maturity for hydrocarbon generation Storage capacity Fracability - shale response to fracing stimulation Well spacing, performance, recovery Play boundary, leasing strategy D&C cost, technology, commodity price Execution Reserves, production optimization, NPV & IRR Natural Fracture Hydrocarbon pathway to wellbore Creating value through detailed technical evaluation Slide 13 |
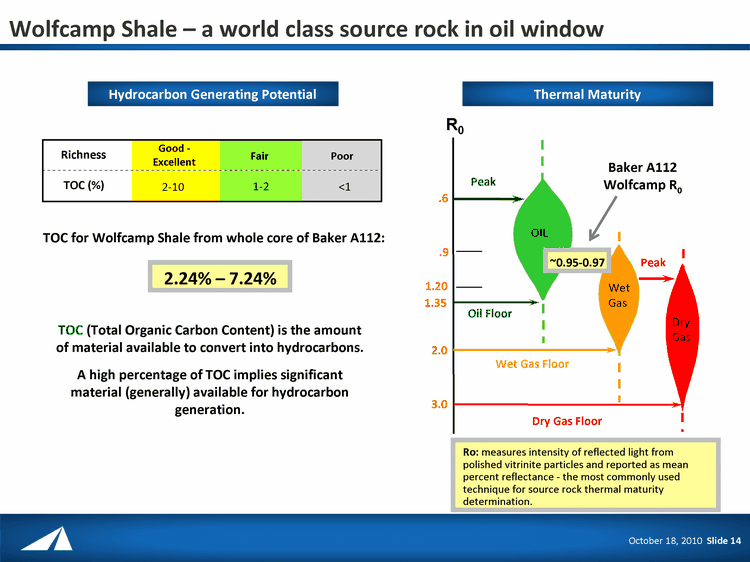
| Wolfcamp Shale - a world class source rock in oil window Slide 14 OIL .6 .9 1.20 1.35 2.0 3.0 Peak Wet Gas Dry Gas Peak Oil Floor Wet Gas Floor Dry Gas Floor R0 Ro: measures intensity of reflected light from polished vitrinite particles and reported as mean percent reflectance - the most commonly used technique for source rock thermal maturity determination. TOC (Total Organic Carbon Content) is the amount of material available to convert into hydrocarbons. A high percentage of TOC implies significant material (generally) available for hydrocarbon generation. Richness Good - Excellent Fair TOC (%) 2-10 1-2 <1 Poor TOC for Wolfcamp Shale from whole core of Baker A112: 2.24% - 7.24% October 18, 2010 Slide 14 Hydrocarbon Generating Potential Thermal Maturity Baker A112 Wolfcamp R0 ~0.95-0.97 |
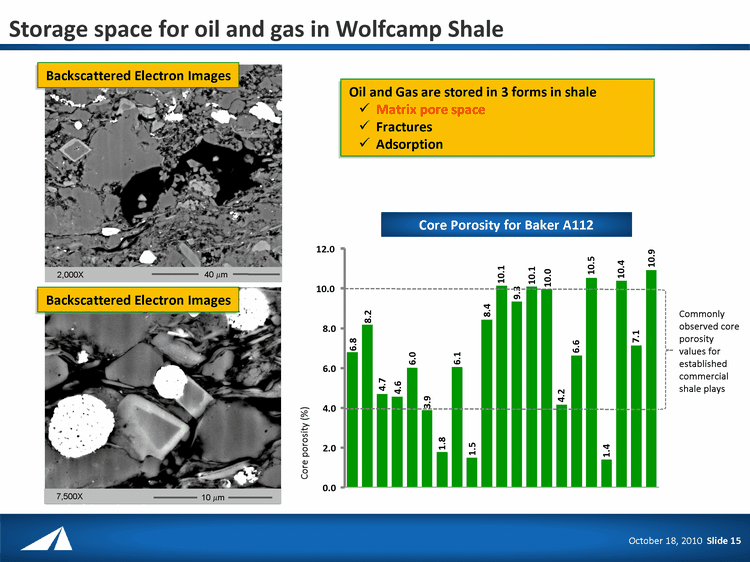
| Storage space for oil and gas in Wolfcamp Shale Slide 15 Commonly observed core porosity values for established commercial shale plays Oil and Gas are stored in 3 forms in shale Matrix pore space Fractures Adsorption 6.8 8.2 4.7 4.6 6.0 3.9 1.8 6.1 1.5 8.4 10.1 9.3 10.1 10.0 4.2 6.6 10.5 1.4 10.4 7.1 10.9 0.0 2.0 4.0 6.0 8.0 10.0 12.0 Backscattered Electron Images Backscattered Electron Images 40 mm 2,000X 10 mm 7,500X October 18, 2010 Slide 15 Core Porosity for Baker A112 Core porosity (%) |
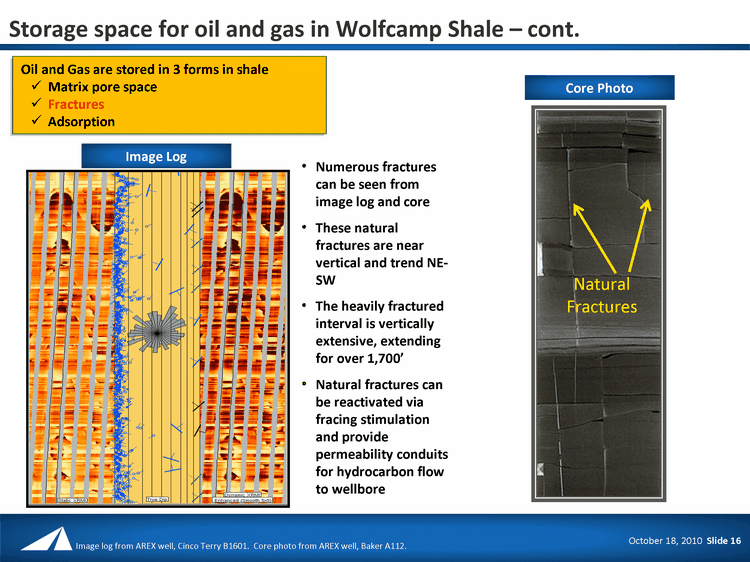
| Slide 16 Natural Fractures Storage space for oil and gas in Wolfcamp Shale - cont. Numerous fractures can be seen from image log and core These natural fractures are near vertical and trend NE- SW The heavily fractured interval is vertically extensive, extending for over 1,700' Natural fractures can be reactivated via fracing stimulation and provide permeability conduits for hydrocarbon flow to wellbore October 18, 2010 Slide 16 Oil and Gas are stored in 3 forms in shale Matrix pore space Fractures Adsorption Core Photo Image Log Image log from AREX well, Cinco Terry B1601. Core photo from AREX well, Baker A112. |
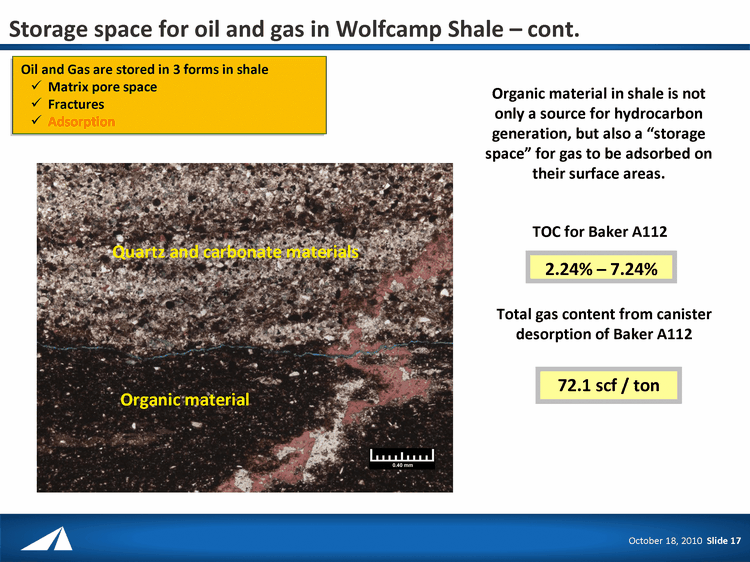
| Slide 17 Organic material Quartz and carbonate materials Storage space for oil and gas in Wolfcamp Shale - cont. Organic material in shale is not only a source for hydrocarbon generation, but also a "storage space" for gas to be adsorbed on their surface areas. 72.1 scf / ton Total gas content from canister desorption of Baker A112 2.24% - 7.24% TOC for Baker A112 October 18, 2010 Slide 17 Oil and Gas are stored in 3 forms in shale Matrix pore space Fractures Adsorption |
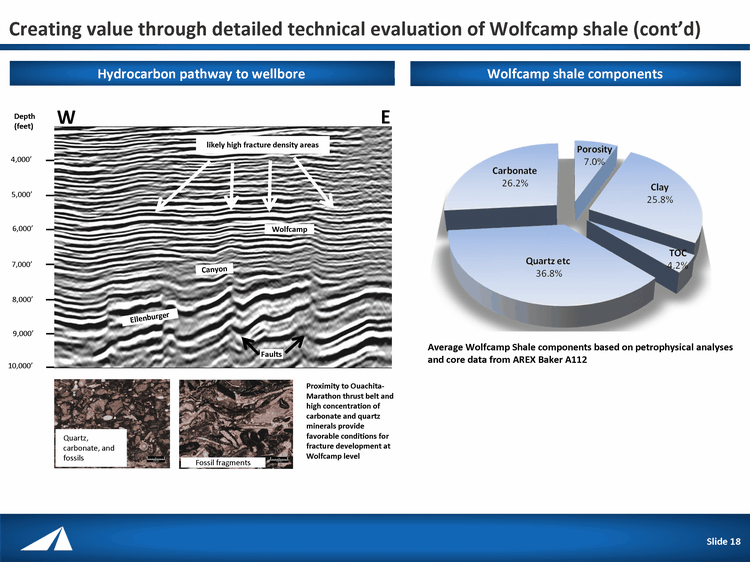
| Creating value through detailed technical evaluation of Wolfcamp shale (cont'd) Slide 18 Hydrocarbon pathway to wellbore Wolfcamp shale components W E Ellenburger Canyon Wolfcamp Proximity to Ouachita- Marathon thrust belt and high concentration of carbonate and quartz minerals provide favorable conditions for fracture development at Wolfcamp level 4,000' 5,000' 6,000' 7,000' 8,000' 9,000' 10,000' Depth (feet) Canyon Ellenburger Wolfcamp Faults likely high fracture density areas Fossil fragments Quartz, carbonate, and fossils Average Wolfcamp Shale components based on petrophysical analyses and core data from AREX Baker A112 Slide 18 |
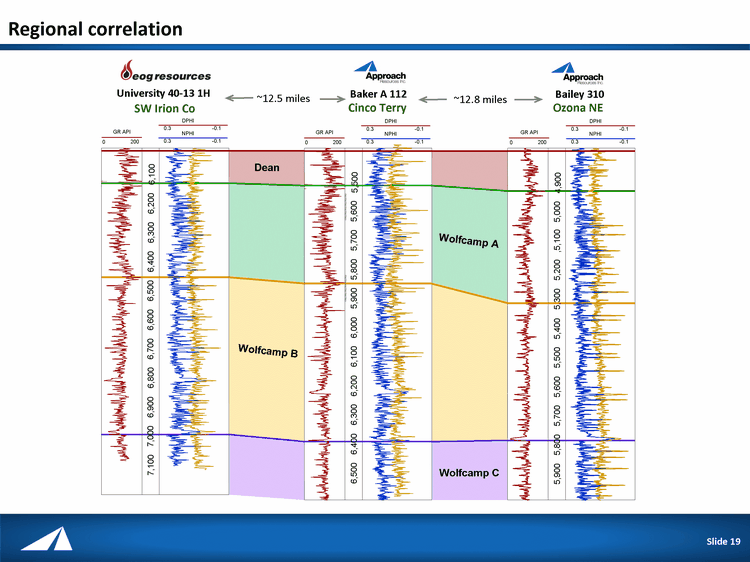
| Regional correlation Slide 19 University 40-13 1H Baker A 112 Bailey 310 ~12.5 miles ~12.8 miles SW Irion Co Cinco Terry Ozona NE Dean 6,100 6,200 6,300 6,400 6,500 6,600 6,700 6,800 6,900 7,000 7,100 5,500 5,600 5,700 5,800 5,900 6,000 6,100 6,200 6,300 6,400 6,500 4,900 5,000 ,5,100 5,200 5,300 5,400 5,500 5,600 5,700 5,800 5,900 Wolfcamp A Wolfcamp B Wolfcamp C 0 200 GR API 0.3 -0.1 NPHI 0.3 -0.1 DPHI 0 200 GR API 0.3 -0.1 NPHI 0.3 -0.1 DPHI 0 200 GR API 0.3 -0.1 NPHI 0.3 -0.1 DPHI Slide 19 |
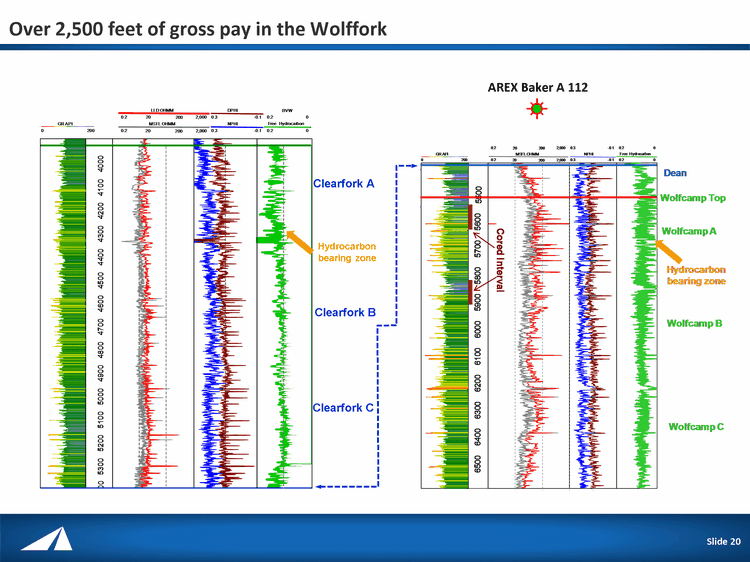
| Over 2,500 feet of gross pay in the Wolffork Slide 20 AREX Baker A 112 Clearfork A Clearfork B Clearfork C Hydrocarbon bearing zone Slide 20 |
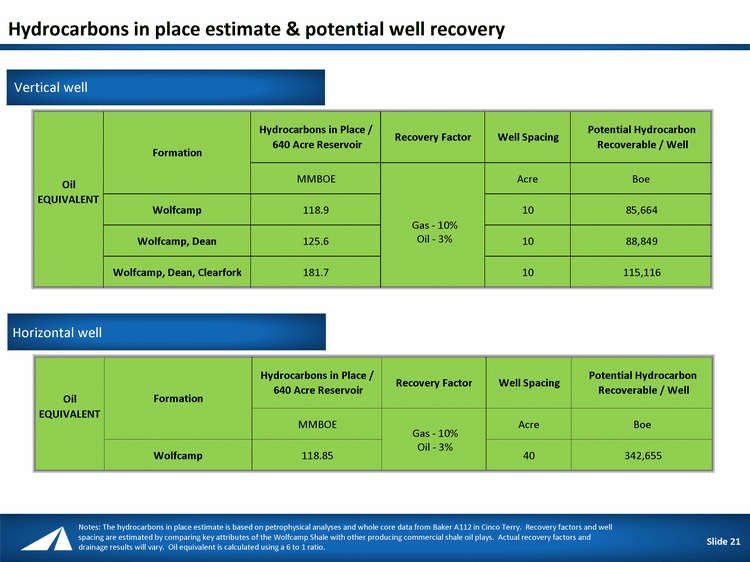
| 21 Hydrocarbons in place estimate & potential well recovery Slide 21 Vertical well Notes: The hydrocarbons in place estimate is based on petrophysical analyses and whole core data from Baker A112 in Cinco Terry. Recovery factors and well spacing are estimated by comparing key attributes of the Wolfcamp Shale with other producing commercial shale oil plays. Actual recovery factors and drainage results will vary. Oil equivalent is calculated using a 6 to 1 ratio. Slide 21 Horizontal well Hydrocarbons in Place / 640 Acre Reservoir Recovery Factor Well Spacing Potential Hydrocarbon Recoverable / Well MMBOE Acre Boe Wolfcamp 118.9 10 85,664 Wolfcamp, Dean 125.6 10 88,849 Wolfcamp, Dean, Clearfork 181.7 10 115,116 Oil EQUIVALENT Formation Gas - 10% Oil - 3% Hydrocarbons in Place / 640 Acre Reservoir Recovery Factor Well Spacing Potential Hydrocarbon Recoverable / Well MMBOE Acre Boe Wolfcamp 118.85 40 342,655 Oil EQUIVALENT Formation Gas - 10% Oil - 3% |
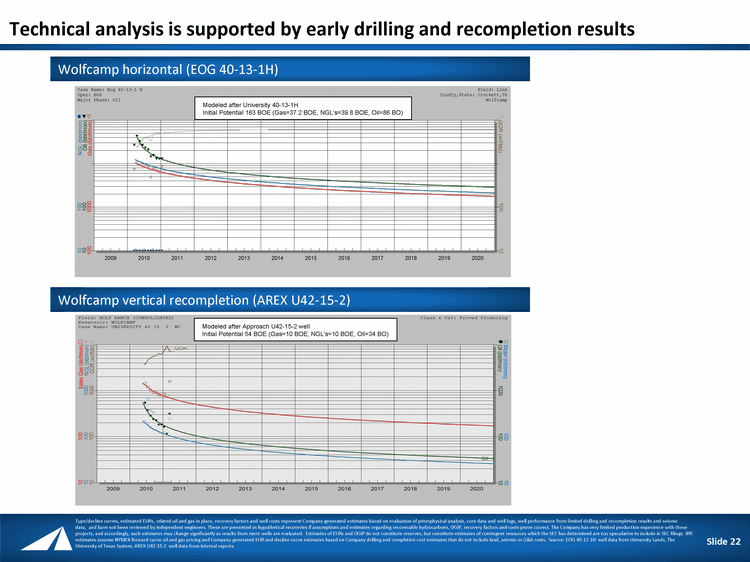
| Wolfcamp horizontal (EOG 40-13-1H) Technical analysis is supported by early drilling and recompletion results Wolfcamp vertical recompletion (AREX U42-15-2) Type/decline curves, estimated EURs, related oil and gas in place, recovery factors and well costs represent Company-generated estimates based on evaluation of petrophysical analysis, core data and well logs, well performance from limited drilling and recompletion results and seismic data, and have not been reviewed by independent engineers. These are presented as hypothetical recoveries if assumptions and estimates regarding recoverable hydrocarbons, OGIP, recovery factors and costs prove correct. The Company has very limited production experience with these projects, and accordingly, such estimates may change significantly as results from more wells are evaluated. Estimates of EURs and OGIP do not constitute reserves, but constitute estimates of contingent resources which the SEC has determined are too speculative to include in SEC filings. IRR estimates assume NYMEX forward-curve oil and gas pricing and Company-generated EUR and decline curve estimates based on Company drilling and completion cost estimates that do not include land, seismic or G&A costs. Source: EOG 40-13-1H well data from University Lands, The University of Texas System; AREX U42-15-2 well data from internal reports. Slide 22 Modeled after Approach U42-15-2 well Initial Potential 54 BOE (Gas=10 BOE, NGL's=10 BOE, Oil=34 BO) Modeled after University 40-13-1H Initial Potential 163 BOE (Gas=37.2 BOE, NGL's=39.8 BOE, Oil=86 BO) |
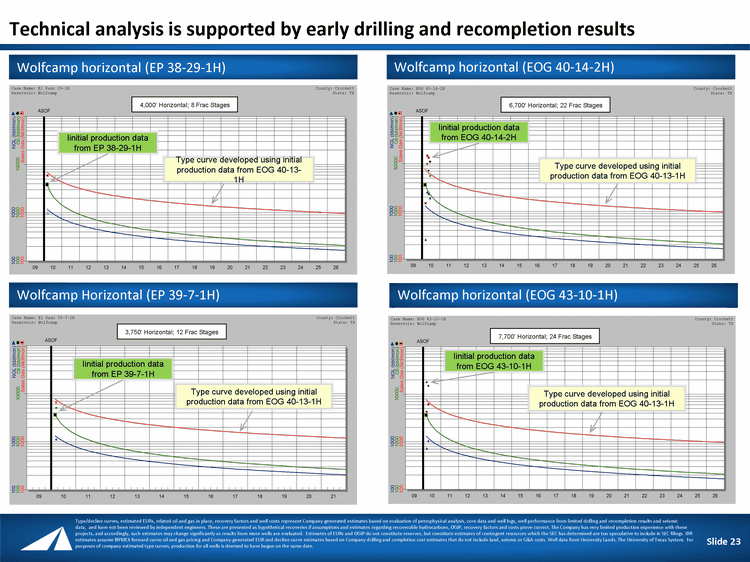
| Wolfcamp horizontal (EOG 40-14-2H) Technical analysis is supported by early drilling and recompletion results Type/decline curves, estimated EURs, related oil and gas in place, recovery factors and well costs represent Company-generated estimates based on evaluation of petrophysical analysis, core data and well logs, well performance from limited drilling and recompletion results and seismic data, and have not been reviewed by independent engineers. These are presented as hypothetical recoveries if assumptions and estimates regarding recoverable hydrocarbons, OGIP, recovery factors and costs prove correct. The Company has very limited production experience with these projects, and accordingly, such estimates may change significantly as results from more wells are evaluated. Estimates of EURs and OGIP do not constitute reserves, but constitute estimates of contingent resources which the SEC has determined are too speculative to include in SEC filings. IRR estimates assume NYMEX forward-curve oil and gas pricing and Company-generated EUR and decline curve estimates based on Company drilling and completion cost estimates that do not include land, seismic or G&A costs. Well data from University Lands, The University of Texas System. For purposes of company estimated type curves, production for all wells is deemed to have begun on the same date. Slide 23 Wolfcamp horizontal (EP 38-29-1H) Iinitial production data from EOG 40-14-2H Type curve developed using initial production data from EOG 40-13-1H Iinitial production data from EOG 43-10-1H Type curve developed using initial production data from EOG 40-13-1H Wolfcamp horizontal (EOG 43-10-1H) Wolfcamp Horizontal (EP 39-7-1H) Iinitial production data from EP 38-29-1H Type curve developed using initial production data from EOG 40-13- 1H Iinitial production data from EP 39-7-1H Type curve developed using initial production data from EOG 40-13-1H 4,000' Horizontal; 8 Frac Stages 3,750' Horizontal; 12 Frac Stages 6,700' Horizontal; 22 Frac Stages 7,700' Horizontal; 24 Frac Stages |
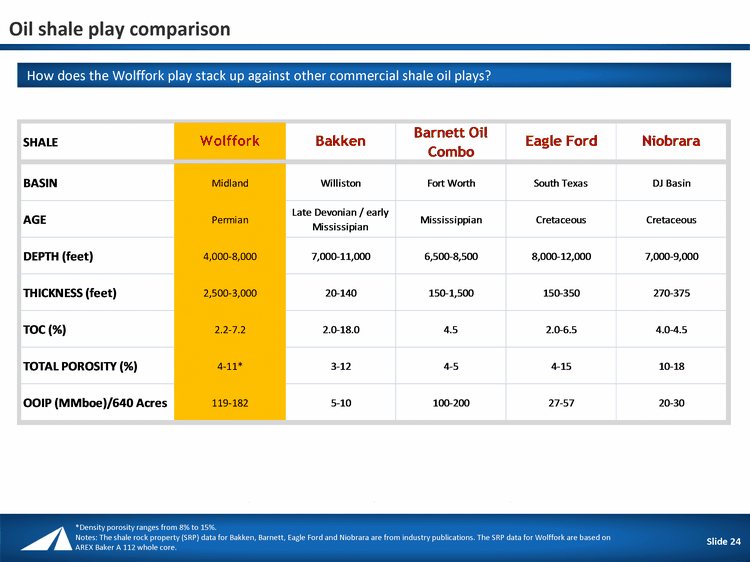
| Oil shale play comparison Slide 24 How does the Wolffork play stack up against other commercial shale oil plays? *Density porosity ranges from 8% to 15%. Notes: The shale rock property (SRP) data for Bakken, Barnett, Eagle Ford and Niobrara are from industry publications. The SRP data for Wolffork are based on AREX Baker A 112 whole core. Slide 24 |
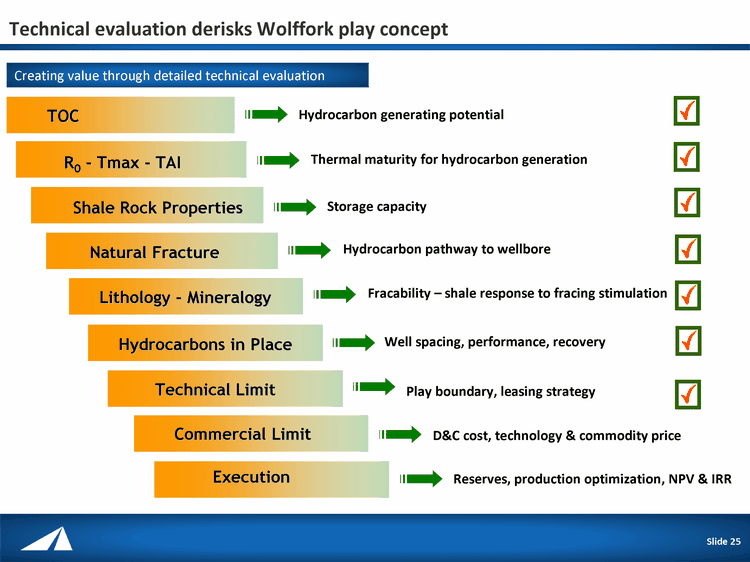
| Technical evaluation derisks Wolffork play concept Slide 25 Hydrocarbon generating potential TOC R0 - Tmax - TAI Shale Rock Properties Lithology - Mineralogy Hydrocarbons in Place Technical Limit Commercial Limit Thermal maturity for hydrocarbon generation Storage capacity Fracability - shale response to fracing stimulation Well spacing, performance, recovery Play boundary, leasing strategy D&C cost, technology & commodity price Execution Reserves, production optimization, NPV & IRR Natural Fracture Hydrocarbon pathway to wellbore Creating value through detailed technical evaluation Slide 25 |
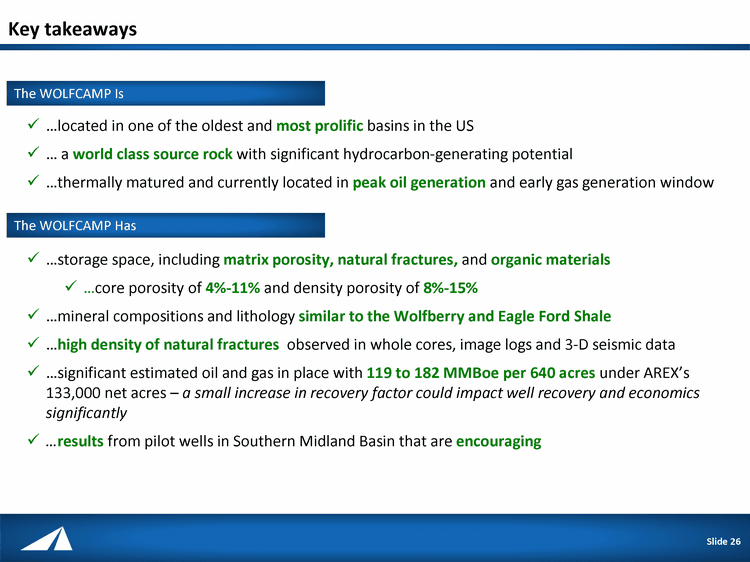
| Key takeaways ...located in one of the oldest and most prolific basins in the US ... a world class source rock with significant hydrocarbon-generating potential ...thermally matured and currently located in peak oil generation and early gas generation window The WOLFCAMP Is ...storage space, including matrix porosity, natural fractures, and organic materials ...core porosity of 4%-11% and density porosity of 8%-15% ...mineral compositions and lithology similar to the Wolfberry and Eagle Ford Shale ...high density of natural fractures observed in whole cores, image logs and 3-D seismic data ...significant estimated oil and gas in place with 119 to 182 MMBoe per 640 acres under AREX's 133,000 net acres - a small increase in recovery factor could impact well recovery and economics significantly ...results from pilot wells in Southern Midland Basin that are encouraging The WOLFCAMP Has Slide 26 |
| Slide 27 Forward-looking statements This presentation contains forward-looking statements within the meaning of Section 27A of the Securities Act of 1933 and Section 21E of the Securities Exchange Act of 1934. All statements, other than statements of historical facts, included in this presentation that address activities, events or developments that the Company expects, believes or anticipates will or may occur in the future are forward- looking statements. Without limiting the generality of the foregoing, forward-looking statements contained in this presentation specifically include the expectations of management regarding plans, strategies, objectives, anticipated financial and operating results of the Company, including as to the Company's Wolffork shale resource play, estimated oil and gas in place and recoverability of the oil and gas, estimated reserves and drilling locations, capital expenditures, typical well results and well profiles, and production and operating expenses guidance included in the presentation. These statements are based on certain assumptions made by the Company based on management's experience and technical analyses, current conditions, anticipated future developments and other factors believed to be appropriate and believed to be reasonable by management. When used in this presentation, the words "will," "potential," "believe," "intend," "expect," "may," "should," "anticipate," "could," "estimate," "plan," "predict," "project," "target," "profile," "model," or their negatives, other similar expressions or the statements that include those words, are intended to identify forward-looking statements, although not all forward-looking statements contain such identifying words. Such statements are subject to a number of assumptions, risks and uncertainties, many of which are beyond the control of the Company, which may cause actual results to differ materially from those implied or expressed by the forward-looking statements. In particular, careful consideration should be given to the cautionary statements and risk factors described in the Company's Annual Report on Form 10-K for the year ended December 31, 2010. Any forward-looking statement speaks only as of the date on which such statement is made and the Company undertakes no obligation to correct or update any forward-looking statement, whether as a result of new information, future events or otherwise, except as required by applicable law. The Securities and Exchange Commission ("SEC") permits oil and gas companies, in their filings with the SEC, to disclose only proved, probable and possible reserves that meet the SEC's definitions for such terms, and price and cost sensitivities for such reserves, and prohibits disclosure of resources that do not constitute such reserves. The Company uses the terms "estimated ultimate recovery" or "EUR," reserve "potential," "upside," "oil and gas in place" or "OGIP," "OIP" or "GIP," and other descriptions of volumes of reserves potentially recoverable through additional drilling or recovery techniques that the SEC's rules may prohibit the Company from including in filings with the SEC. These estimates are by their nature more speculative than estimates of proved, probable and possible reserves and accordingly are subject to substantially greater risk of being actually realized by the Company. EUR estimates, drilling locations and OGIP estimates have not been risked by the Company. Actual locations drilled and quantities that may be ultimately recovered from the Company's interest will differ substantially. There is no commitment by the Company to drill all of the drilling locations that have been attributed these quantities. Factors affecting ultimate recovery include the scope of the Company's ongoing drilling program, which will be directly affected by the availability of capital, drilling and production costs, availability of drilling and completion services and equipment, drilling results, lease expirations, regulatory approval and actual drilling results, including geological and mechanical factors affecting recovery rates. Estimates of unproved reserves, per well EUR, OGIP and upside potential may change significantly as development of the Company's oil and gas assets provides additional data. Estimated EURs, related oil and gas in place, recovery factors and well costs represent Company-generated estimates based on evaluation of petrophysical analysis, core data and well logs, well performance from limited drilling and recompletion results and seismic data, and have not been reviewed by independent engineers. These are presented as hypothetical recoveries if assumptions and estimates regarding recoverable hydrocarbons, OGIP, recovery factors and costs prove correct. The Company has very limited production experience with these projects, and accordingly, such estimates may change significantly as results from more wells are evaluated. Estimates of EURs and OGIP do not constitute reserves, but constitute estimates of contingent resources which the SEC has determined are too speculative to include in SEC filings. IRR estimates assume NYMEX forward-curve oil and gas pricing and Company-generated EUR and decline curve estimates based on Company drilling and completion cost estimates that do not include land, seismic or G&A costs Cautionary statements regarding oil and gas quantities |
