Attached files
| file | filename |
|---|---|
| EX-23.1 - EX-23.1 - Titan Machinery Inc. | a2203426zex-23_1.htm |
| EX-32.1 - EX-32.1 - Titan Machinery Inc. | a2203426zex-32_1.htm |
| EX-32.2 - EX-32.2 - Titan Machinery Inc. | a2203426zex-32_2.htm |
| EX-31.2 - EX-31.2 - Titan Machinery Inc. | a2203426zex-31_2.htm |
| EX-31.1 - EX-31.1 - Titan Machinery Inc. | a2203426zex-31_1.htm |
| EX-10.39 - EX-10.39 - Titan Machinery Inc. | a2203426zex-10_39.htm |
UNITED STATES
SECURITIES AND EXCHANGE COMMISSION
Washington, D.C. 20549
FORM 10-K
ANNUAL REPORT PURSUANT TO SECTION 13 OR 15(d) OF
THE SECURITIES EXCHANGE ACT OF 1934
FOR THE FISCAL YEAR ENDED JANUARY 31, 2011
Commission File No. 000-1409171
TITAN MACHINERY INC.
(Exact name of registrant as specified in its charter)
| Delaware (State or Other Jurisdiction of Incorporation or Organization) |
No. 45-0357838 (IRS Employer Identification No.) |
|
644 East Beaton Drive West Fargo, ND 58078-2648 (Address of Principal Executive Offices) |
||
(701) 356-0130
(Registrant's telephone number, including area code)
Securities registered pursuant to Section 12(b) of the Act:
Title of each class: Common Stock, $0.00001 Par Value
Name of each exchange on which registered: The NASDAQ Global Select Market
Securities registered pursuant to Section 12(g) of the Act: None
Indicate by check mark if the registrant is a well-known seasoned issuer, as defined in Rule 405 of the Securities Act. Yes o No ý
Indicate by check mark if the registrant is not required to file reports pursuant to Section 13 or Section 15(d) of the Act. Yes o No ý
Indicate by check mark whether the registrant (1) has filed all reports required to be filed by Section 13 or 15(d) of the Securities Exchange Act of 1934 during the preceding 12 months (or for such shorter period that the registrant was required to file such reports), and (2) has been subject to such filing requirements for the past 90 days. Yes ý No o
Indicate by check mark whether the registrant has submitted electronically and posted on its corporate Website, if any, every Interactive Data File required to be submitted and posted pursuant to Rule 405 of Regulation S-T (§232.405 of this chapter) during the preceding 12 months (or for such shorter period that the registrant was required to submit and post such files). Yes o No o
Indicate by check mark if disclosure of delinquent filers pursuant to Item 405 of Regulation S-K is not contained herein, and will not be contained, to the best of registrant's knowledge, in definitive proxy or information statements incorporated by reference in Part III of this Form 10-K or any amendment to this Form 10-K. o
Indicate by check mark whether the registrant is a large accelerated filer, an accelerated filer, a non-accelerated filer, or a smaller reporting company. See definitions of "large accelerated filer," "accelerated filer," and "smaller reporting company" in Rule 12b-2 of the Exchange Act. (Check one):
| Large accelerated filer o | Accelerated filer ý | Non-accelerated filer o (Do not check if a smaller reporting company) |
Smaller reporting company o |
Indicate by check mark whether the registrant is a shell company (as defined in Rule 12b-2 of the Act). Yes o No ý
The aggregate market value of our common stock held by non-affiliates as of July 31, 2010 was approximately $187.1 million (based on the last sale price of $14.27 per share on such date as reported on The NASDAQ Global Select Market).
The number of shares outstanding of the registrant's common stock as of March 31, 2011 was 17,922,193 shares.
DOCUMENTS INCORPORATED BY REFERENCE
Portions of the proxy statement for the registrant's 2011 Annual Meeting of Stockholders are incorporated by reference into Items 10, 11, 12, 13 and 14 of Part III of this report.
We make available, free of charge, copies of our annual report on Form 10-K, quarterly reports on Form 10-Q, current reports on Form 8-K and amendments to those reports filed or furnished pursuant to Section 13(a) or 15(d) of the Securities Exchange Act on our web site, http://www.titanmachinery.com, as soon as reasonably practicable after filing such material electronically or otherwise furnishing it to the SEC. We are not including the information on our web site as a part of, or incorporating it by reference into, our Form 10-K.
i
Our Company
Overview
We own and operate a network of full service agricultural and construction equipment stores in the United States. Based upon information provided to us by CNH Global N.V. or its U.S. subsidiary CNH America LLC, collectively referred to in this Form 10-K as CNH, we are the world's largest retail dealer of Case IH Agriculture equipment and a major retail dealer of New Holland Agriculture, Case Construction and New Holland Construction equipment in the U.S. We have two primary business segments, Agriculture and Construction, within each of which we sell and rent new and used equipment, sell parts, and service the equipment in the areas surrounding our stores.
The agricultural equipment we sell and service includes machinery and attachments for uses ranging from large-scale farming to home and garden use. The construction equipment we sell and service includes heavy construction and light industrial machinery for commercial and residential construction, road and highway construction and mining. Within each of our operating segments, we engage in four principal business activities:
- •
- new and used equipment sales;
- •
- parts sales;
- •
- repair and maintenance services; and
- •
- equipment rental and other activities.
The new equipment and parts we sell are supplied primarily by CNH. CNH is a leading manufacturer and supplier of agricultural and construction equipment, primarily through the Case IH Agriculture, New Holland Agriculture, Case Construction and New Holland Construction brands. We acquire used equipment for resale through trade-ins from our customers and selective purchases. We also sell parts and provide in-store and on-site repair and maintenance services. We also rent equipment and provide other ancillary services such as equipment transportation, Global Positioning System ("GPS") signal subscriptions and finance and insurance products.
We offer our customers a one-stop solution by providing equipment and parts sales, repair and maintenance services and rental functions in each store. Our full service approach provides us with multiple points of customer contact and substantial cross-selling opportunities. We believe our mix of equipment and recurring parts and service sales enables us to operate effectively throughout economic cycles. We also believe our significant scale, superior customer service, diverse and stable customer base, proven management reporting system and experienced management team provide us with a competitive advantage in many of our local markets.
Throughout our 31-year operating history we have built an extensive, geographically contiguous network of 81 stores, including two outlet stores. Our agricultural equipment stores are located in highly productive farming regions, including the Red River valley in eastern North Dakota and northwestern Minnesota, the western portions of the corn belt in Iowa, eastern South Dakota and southern Minnesota, and along the Interstate-80 corridor in Nebraska, which sits on top of the Ogallala Aquifer. Our construction equipment stores are located in North Dakota, South Dakota, Iowa, Montana, Wyoming, eastern Nebraska and western Minnesota.
Our executives have extensive industry experience. David Meyer, our Chairman and Chief Executive Officer, founded our company in 1980. In 2002, we acquired two stores owned by C.I. Farm Power, Inc., a business owned by our President and Chief Operating Officer, Peter Christianson, which he co-founded in 1988. Based on our collective industry experience, we developed the Titan Operating Model, which combines management accountability and decision-making at the store level with
1
centralized, back-office support. In addition, our executives work closely with our store managers to develop the managers' industry knowledge and ensure these managers achieve operational excellence in line with our management philosophy.
We have a history of successful growth through acquisitions. Since January 1, 2003, we have completed 34 acquisitions consisting of 75 stores operating in seven states, including 19 acquisitions consisting of 44 stores completed since our initial public offering on December 11, 2007. We have a well-established track record of successfully integrating acquired stores through the Titan Operating Model, retaining acquired-store employees and maintaining acquired-store customer relationships. We expect that acquisitions will continue to be an important component of our consolidated and segment growth.
Industry Overview
Agricultural Equipment Industry
Agricultural equipment is purchased primarily for the production of food, fiber, feed grain and renewable energy. It is also purchased for home and garden applications and maintenance of commercial, residential and government properties. Deere & Company, CNH and AGCO Corporation are the largest global manufacturers and supply a full line of equipment and parts that address the primary machinery requirements of farmers. For the most recent fiscal year-ends for which information is currently available, revenue from agriculture operations was $19.9 billion for Deere & Company, $11.5 billion for CNH and $6.9 billion for AGCO. In addition to the major manufacturers, several short-line manufacturers produce specialized equipment that addresses regional and niche requirements of farmers. Agricultural equipment manufacturers typically grant dealers in the U.S. authorized store locations, not exclusive territories, to distribute their products.
We believe there are many factors that influence demand for agricultural equipment, parts and repair and maintenance services, including commodity prices, interest rates, general economic conditions and weather. Conditions can fluctuate drastically in a short time period, creating volatility in demand, especially for equipment, in a given year. Government subsidies also influence demand for agricultural equipment. Legislation, most notably the U.S. Farm Bill and the Farm Security and Rural Investment Act of 2002, attempts to stabilize the agriculture industry through U.S. Department of Agriculture ("USDA") subsidies. USDA subsidies include (i) commodity programs consisting of direct, counter-cyclical and price support payments to farmers; (ii) conservation programs; and (iii) disaster relief programs. We believe USDA subsidies reduce financial volatility and help ensure that farmers operate their farms and equipment during economic down cycles, thus stabilizing demand for equipment, replacement parts and repair and maintenance services.
Construction Equipment Industry
Construction equipment is purchased primarily for commercial, residential and infrastructure construction, as well as for demolition, maintenance, mining, energy production and forestry operations. The market for construction equipment is larger than the market for agricultural equipment and is segmented across multiple categories including earth moving, lifting, light industrial, asphalt and paving, and concrete and aggregate equipment. We believe Caterpillar Inc., Komatsu Ltd., Deere & Company, CNH and Ingersoll-Rand Co. Ltd. are the largest global manufacturers of construction equipment. These companies generated revenue from their construction operations of $39.9 billion for Caterpillar Inc., $15.4 billion for Komatsu Ltd., $3.7 billion for Deere & Company, and $2.9 billion for CNH for the most recent fiscal year-ends for which information is currently available. As in the agricultural equipment market, distribution of construction equipment in the U.S. is executed primarily by manufacturer authorized dealers; however, manufacturers' dealership agreements in the construction industry typically assign exclusive distribution territories.
2
Construction machinery is generally divided into heavy and light subgroups. Heavy machinery includes large wheel loaders, large tracked excavators, cranes, crawler dozers, motor graders and articulated haul trucks. Light machinery includes backhoe landscape tractors, forklifts, compact excavators and skid steers. Heavy machinery is generally purchased by construction companies, municipalities, local governments, rental fleet owners, quarrying and mining companies, waste management companies and forestry-related organizations. Typically, light machinery is purchased by contractors, rental fleet owners, landscapers, logistics companies, farmers and recreational users. Although demand for construction equipment is affected by weather and seasonal factors, it is usually less susceptible to seasonal changes than the agricultural equipment industry.
CNH and industry reports show demand for construction equipment in our markets is driven by several factors, one of which is public infrastructure spending, including roads and highways, sewer and water, as well as by public and private expenditures for the energy and mining industries. Demand for construction equipment is also driven by demand for fossil fuels, as well as metals and other commodities. We expect to benefit from the need for equipment to establish the infrastructure necessary to extract these natural resources, particularly in North Dakota, as consumer and wholesale consumption accelerates.
Titan Operating Model
We believe the Titan Operating Model is a key element to our continued success. Through the Titan Operating Model, we empower leadership and share best practices at the store level while realizing efficiencies at the corporate level. We believe exceptional customer service is most efficiently delivered through accountable store employees who are supported by centralized administrative, finance and marketing functions. By managing our business as a network of independent stores supported by a centralized, shared resources group, we ensure coordination of the entire enterprise while promoting local business relationships on a store-by-store basis. We have implemented the Titan Operating Model in each of our reporting segments.
Strong Stores
Each of our stores is run by a store manager who is reviewed and compensated based on the store's achievement of revenue, profitability, market share and balance sheet objectives. Also, each store is typically staffed by a parts manager, a service manager and field marketers, all of whom report directly to the store manager. Under our operating model, decision-making for customer-related issues is decentralized, with each store manager responsible for matters such as the type of equipment to stock, equipment pricing, customer credit approvals, staffing levels and customer satisfaction. This operating model enables each store manager to concentrate on customers' equipment, parts and service needs, while our shared resources group manages the administrative functions of the store. We believe customers in our industry view store managers and sales and service personnel as important partners in operating their businesses. Therefore, we believe developing and supporting strong store managers enables us to grow same-store sales through fostering new relationships and further developing existing relationships with our customers. In addition, we believe that choosing to centralize customer-related decision making at the corporate level risks undermining the partnership many customers seek to build with their dealer.
Shared Resources
Our shared resources group provides a range of services to support our stores, including warranty and service administration, information technology support, administration, marketing campaigns, human resources management, finance and insurance, central purchasing, accounting, data administration and cash management. We believe these functions can be run more efficiently when combined and provide more sophisticated tools to our store managers than an independent dealership
3
could support alone. We maintain accountability through our management reporting systems, which provide data on certain key operational and financial metrics on a daily basis, as well as a comprehensive review of financial performance on a monthly basis. We believe the services provided by our shared resources group enables our stores to achieve a higher level of customer service by freeing them from certain general and administrative functions and a more competitive market presence at a lower cost than would be feasible if our stores operated independently. Furthermore, as we acquire new stores, we believe the shared services required to support these stores will grow at a lower rate than our overall growth in store count.
Management Development and Succession Planning
Our executives work closely with our regional and store managers and mid-level corporate managers to ensure the managers benefit from our executives' industry knowledge and execute operational excellence in line with our management philosophy. We also conduct formal meetings on a monthly basis with our store managers and regional managers to assess operational and financial objectives, develop near-term strategies and share best practices across the organization. We believe the relationships between our executives, regional managers, store managers and mid-level corporate managers will sustain our financial success through continued implementation of our effective operating model, by providing a strong pool of capable successors to our current team of executives, regional managers and store managers. Further, we seek to staff our stores with entrepreneurial individuals trained, including through our programs, and motivated to progress to higher level management positions. In addition, we sponsor programs with several technical colleges and community colleges that offer scholarships to students who will ultimately work for us in various capacities empowered with the basic knowledge and tools to succeed.
Business Strengths
In addition to the Titan Operating Model, we believe the following attributes of our business model and market position are important factors in our ability to compete effectively and achieve our long-term financial objectives:
Leading North American Equipment Provider with Significant Scale
According to CNH, we are the world's largest retail dealer of Case IH Agriculture equipment and a major retail dealer of New Holland Agriculture, Case Construction and New Holland Construction equipment in the U.S. We believe our size and large, contiguous geographic market provide us with several competitive advantages including:
- •
- our ability to efficiently manage inventory by empowering each individual store with inventory management responsibility
and access to our centralized inventory management system, thus allowing inventory exchanges among the stores, which permits us to maintain only the inventory deemed needed by each store while
providing significant breadth of parts and equipment to our customers;
- •
- our ability to use expanded sales channels, including used equipment listings and periodic auctions hosted on our website,
which enables us to offer our customers alternative purchasing options; and
- •
- our ability to sell inventory to customers in a large geographic area covering North Dakota, South Dakota, Iowa, Minnesota, Nebraska, Wyoming and Montana, which enables us to capitalize on crop diversification and disparate weather throughout this area, as well as local trends in residential, infrastructure and commercial construction.
4
Customer Focus at the Local Level
As part of the Titan Operating Model, we centralize general and administrative functions and finance resources. This strategy enables our store employees to focus exclusively on customers and eliminates redundant operating expenses. We also centralize our marketing resources to offer our stores and field marketers professional marketing support that includes targeted direct mailings, advertising with targeted local media outlets, participation in and sponsorship of trade shows and industry events, our Titan Trader monthly magazine, and our hosting of open houses, service clinics, equipment demonstrations, product showcases and customer appreciation outings. We believe this operating structure, which focuses on serving our customers on a local level, will allow us to increase market share.
Superior Customer Service to Attract and Retain Customers
We believe our ability to respond quickly to our customers' demands is a key to profitable growth. Our executives are committed to maintaining a customer-focused culture. We spend significant time and resources training our employees to effectively service our customers in each of our local markets, which we believe will increase our revenue. Our training program involves active participation in all manufacturer-sponsored training programs and the use of industry experts as consultants for customized training programs and a training team to assist in the integration of newly-acquired operations. We also partner with several technical colleges to sponsor students that we plan to ultimately employ. In particular, the following capabilities enable us to better service our customers:
- •
- our ability to staff a large number of highly-trained service technicians across our network of stores, which makes it
possible to schedule repair services on short notice without affecting our technician utilization rates;
- •
- our ability to staff and leverage product and application specialists across our network of stores, which makes it
possible to offer valuable pre-sale and aftermarket services, including equipment training, best practices education and precision farming technology support; and
- •
- our ability to innovate and lead our industry through initiatives such as Rural Tower Network, our joint venture with certain local Caterpillar and John Deere dealerships to deploy a GPS guidance system in support of precision farming in our core geographic market, which provides our customers with the latest advances in technology and operating practices.
Unique Entrepreneurial Culture to Attract and Retain Superior Employees
We created a unique entrepreneurial culture that empowers our employees to make decisions and act within the parameters of a proven operating process and system. We believe this culture and our size gives us a competitive advantage in attracting and retaining the best employees in our industry. We developed an operating system and process that provides our employees with defined objectives and frequent feedback of results within an entrepreneurial environment that allows them to work independently yet consistently throughout our company. Through this operating system and process we have established defined financial metrics on a balanced scorecard, which is used monthly with each store manager to assess performance. Each store manager is empowered to operate the individual store as appropriate within the guidelines set by the operating system and process. This balanced management philosophy enables our employees to understand clearly how they succeed in our organization and how to interact with customers who expect a level of autonomy from our employees. Our compensation system focuses on rewarding our employees for high performance, thus enabling us to retain most of those employees who perform at or above expectations. This system also enables us to attract talented individuals outside of our industry and train them to perform at a high level within a relatively short period of time.
5
Diverse and Stable Customer Base to Avoid Market Volatility
We believe our large and diverse customer base limits our exposure to risks associated with customer concentration and fluctuations in local market conditions. We have long and stable relationships with many of our customers. During fiscal 2011, we conducted business with approximately 64,000 customers, none of whom accounted for more than 1.0% of our total revenue. Our top ten customers combined represented approximately 3.9% of our total revenue.
Proven Information Technology Systems
Our management reporting systems provide the data and reports that facilitate our ability to make informed decisions. We use these systems to actively manage our business and enable each store to access the available inventory of our other stores before ordering additional parts or equipment from our suppliers. As a result, we minimize our investment in inventory while promptly satisfying our customers' parts and equipment needs. Our customer relationship management system provides sales and customer information and other organizational tools to assist our field marketers, parts managers and service managers. In addition, our management reporting systems facilitate training and foster development of management personnel.
Experienced Management Team to Implement our Growth Strategy
Our executive team is led by David Meyer, our Chairman and Chief Executive Officer, and Peter Christianson, our President and Chief Operating Officer, who have approximately 36 and 32 years, respectively, of industry experience. Our regional managers, store managers and field marketers also have extensive knowledge and experience in our industry. In addition, we compensate, develop and review our regional managers and store managers based on an approach that aligns their incentives with the goals and objectives of our company, including achievement of revenue, profitability, market share and balance sheet objectives. We believe the strength of our management team will help our success in the marketplace.
Growth Strategy
We pursue the following growth strategies:
Increase Market Share and Same-Store Sales
We focus on increasing our share of the equipment sold in our markets because our market share impacts current period revenue and compounds our revenue over the life of the equipment sold through recurring parts and service business. We seek to generate same-store growth and increase market share through:
- •
- employing significant marketing and advertising programs, including targeted direct mailings, advertising with targeted
local media outlets, participation in and sponsorship of trade shows and industry events, our Titan Trader monthly magazine, and by hosting open houses, service clinics, equipment demonstrations,
product showcases and customer appreciation outings;
- •
- supporting and providing customers with training for evolving technologies, such as precision farming, that are difficult
for single-store operators to support;
- •
- maintaining state-of-the-art service facilities, mobile service trucks and trained
service technicians to maximize our customers' equipment uptime through preventative maintenance programs and seasonal 24/7 service support; and
- •
- utilizing our inventory system to maximize parts and equipment availability for our customers.
6
Make Selective Acquisitions
The agricultural and construction equipment industries are fragmented and consist of many relatively small, independent businesses servicing discrete local markets. We believe a favorable climate for dealership consolidation exists due to several factors, including the competitiveness of our industry, growing dealer capitalization requirements and lack of succession alternatives. We intend to continue to evaluate and pursue acquisitions with the objectives of entering new markets, consolidating distribution within our established network and strengthening our competitive position.
We have a track record of completing and integrating acquisitions and have successfully used acquisitions to enter new markets. We look to add stores through acquisitions that offer attractive growth opportunities, high demand for the equipment we sell and services we offer, management strength, and contiguity with our existing geography. These factors have guided us to successful acquisition candidates. We believe our track record of successful acquisitions and expansion increases the probability that our future expansion will be profitable.
We believe that we are effectively able to identify attractive acquisition candidates due to our leadership position in the industry, our track record of completing and integrating acquisitions, and our contacts in and knowledge of our industry and geographic region. We regularly assess the acquisition landscape, evaluating potential acquisition candidates in terms of their availability and desirability to our long-term growth strategy. In addition, we believe acquisition economics in our industry have been and will continue to be conducive to executing our long-term growth strategy. Typically, we acquire only the fixed assets, working capital and selected inventory we believe are necessary to run an efficient store based on the Titan Operating Model and assume only the liabilities related to financing the inventory and working capital acquired, although we sometimes acquire all the stock of a company. We, therefore, typically calculate our net purchase price of an acquisition as the value paid for the assets acquired less the amount of any liabilities assumed. Upon completion of an acquisition we seek to re-finance the inventory acquired according to the parts and floorplan financing parameters of the Titan Operating Model. We believe our management team's experience in evaluating potential acquisition candidates helps them determine whether a particular dealership can be successfully integrated into our existing operations and enables them to structure mutually beneficial purchase terms.
The consent of CNH is required to acquire any CNH dealership, and the consent of the group of banks led by Wells Fargo Bank, National Association (the "Wells Fargo Bank Syndicate") is required for the acquisition of dealerships meeting certain thresholds or other criteria defined in our Senior Secured Credit Facility (the "Credit Agreement").
The table below summarizes our acquisition of 34 dealers, totaling 75 stores, since January 1, 2003. Certain stores (designated with an *) are included in the Agriculture segment but also sell some construction equipment. See Item 2 for a listing of our current store locations.
7
Agriculture Segment
Acquired Dealer
|
Location of Stores | |
|---|---|---|
Titan Machinery, LLC |
Watertown, South Dakota Wahpeton, North Dakota Casselton, North Dakota Fargo, North Dakota |
|
Consolidated Ag Service, Inc. |
Graceville, Minnesota |
|
Smith International, Inc. |
Waverly, Iowa |
|
H.C. Clark Implement Co., Inc. |
Aberdeen, South Dakota* |
|
Vern Anderson, Inc. |
Anthon, Iowa |
|
Walterman Implement, Inc. |
Dike, Iowa |
|
Farm Power, Inc. of Minnesota and related entities |
Elbow Lake, Minnesota |
|
Richland County Implement, Inc. |
Wahpeton, North Dakota |
|
Aberdeen Equipment Co., Huron Equipment Co. and |
Aberdeen, South Dakota* |
|
Red Power International, Inc. |
Ada, Minnesota |
|
Twin City Implement, Inc. |
Mandan, North Dakota* |
|
Reiten & Young International, Inc. |
Grand Forks, North Dakota* |
|
Avoca Operations, Inc. and Greenfield Operations, Inc. |
Avoca, Iowa |
|
Ceres Equipment Inc. |
Roseau, Minnesota |
|
Quad County Implement, Inc. |
Blairstown, Iowa |
8
Acquired Dealer
|
Location of Stores | |
|---|---|---|
Wolf's Farm Equipment, Inc. |
Kintyre, North Dakota |
|
Pioneer Garage, Inc. |
Pierre, South Dakota |
|
Anderson Power and Equipment, Inc. |
Thief River Falls, Minnesota |
|
Winger Implement, Inc. |
Winger, Minnesota |
|
Arthur Mercantile Company |
Arthur, North Dakota |
|
Valley Equipment, Inc. |
Mayville, North Dakota |
|
Lickness Bros. Implement Co. |
Britton, South Dakota |
|
Oskaloosa Implement Co. |
Pella, Iowa |
|
Valley Farm Equipment, Inc. |
Milbank, South Dakota |
|
Hubbard Implement, Inc. |
Iowa Falls, Iowa |
|
Fairbanks International Inc. |
Grand Island, Nebraska |
|
Tri-State Implement, Inc. |
Sioux Falls, South Dakota |
|
Schoffman's, Inc. |
Redwood Falls, Minnesota |
9
Construction Segment
Acquired Dealer
|
Location of Stores | |
|---|---|---|
Krider Equipment Co., Inc. |
Fargo, North Dakota Bismarck, North Dakota |
|
Fargo Tractor & Equipment, Inc. |
West Fargo, North Dakota |
|
Piorier Equipment Company, Inc. and related entities |
Sioux City, Iowa |
|
Mid-Land Equipment Company, L.C. |
Des Moines, Iowa |
|
Western Plains Machinery Co. and WP Rentals LLC |
Billings, Montana (2 stores) |
|
ABC Rental & Equipment Sales |
Williston, North Dakota |
Integrate New Dealers into the Titan Operating Model
We have developed the Titan Operating Model to optimize the performance and profitability of each of our stores. Upon consummation of each acquisition, we integrate acquired stores into our operations by implementing the Titan Operating Model to enhance each acquired store's performance within its target market. We generally complete integration of a store within 18 months, although it may take several years before acquired stores fully realize the benefits of the Titan Operating Model. We believe the Titan Operating Model provides us with multiple points of customer contact, creates cross-selling opportunities, fosters strong customer relationships and supports a culture of individual accountability that increases our revenue and provides a strong platform for future growth.
Suppliers
CNH—Case IH Agriculture, Case Construction, New Holland Agriculture and New Holland Construction
We have a longstanding relationship with CNH and, according to CNH, are the world's largest retail dealer of Case IH Agriculture equipment. We have been an authorized dealer of Case agricultural equipment since our inception in 1980 and added the other CNH brands as Case grew, acquired other brands and merged with New Holland in 1999 to form CNH. CNH supplied, through CNH America LLC, CNH's U.S. manufacturing entity, approximately 82.5% of the new agricultural equipment and 71.3% of the new construction equipment we sold in fiscal 2011.
10
CNH is a global leader in the agricultural and construction equipment industries based on the number of units sold. In 2010, CNH had $15.6 billion in worldwide revenue, with agricultural equipment accounting for approximately 74% and construction equipment accounting for approximately 19% of CNH's total revenue. In addition, CNH provides financing and insurance products and services to its end-user customers and authorized dealers through its CNH Capital America LLC ("CNH Capital") business unit. CNH is a publicly-traded company and a majority-owned subsidiary of Fiat Industrial S.p.A.
CNH is the world's second largest manufacturer of agricultural equipment. CNH owns and operates the Case IH Agriculture and New Holland Agriculture brands. Case IH Agriculture, recognized by the red color of its equipment, possesses over 160 years of farm equipment heritage. New Holland Agriculture, recognized by the blue color of its tractors and the yellow color of its harvesting and hay equipment, has over 100 years of farm equipment industry experience. CNH's agricultural equipment dealers are assigned authorized store locations but do not have exclusive territories.
CNH is one of the world's largest manufacturers of construction equipment in terms of market share, owning and operating the Case Construction, New Holland Construction and Kobelco brands. CNH's construction equipment dealers are assigned a specific geographic area of responsibility, which typically includes an entire state, within which the dealers have the right to sell new Case Construction, New Holland Construction and/or Kobelco equipment.
We have entered into separate dealership agreements with certain CNH entities to sell the Case IH Agriculture, New Holland Agriculture, Case Construction and New Holland Construction brands. These dealer agreements authorize us to sell CNH equipment and parts and entitle us to use CNH trademarks and trade names, with certain restrictions. The CNH entities have the right to terminate their dealer agreements with us immediately in certain circumstances, including if a person acquires 20% or more of our common stock without CNH's consent, and, in some cases, for any reason 90 days following written notice. The dealership agreements and industry practices generally provide that payment on equipment and parts purchased from CNH entities is due within 30 days and is typically subject to floorplan financing as discussed below. With respect to sales of equipment, payments from customers, which are typically financed by a third party, are due upon sale. Payments from customers for parts and services are due within 30 days. CNH makes available to us any floorplans, parts return programs, sales or incentive programs or similar plans or programs it offers to other dealers, and provides us with promotional items and marketing materials.
Based upon information provided to us by CNH, we are the world's largest retail dealer of Case IH Agriculture equipment and a major retail dealer of New Holland Agriculture, Case Construction and New Holland Construction equipment in the U.S. Thus, our relationship with CNH entities is more than a typical supply relationship; it is strategic for both our company and CNH. In that regard, it is in our mutual interests to maintain the strong longstanding relationship we share.
Other Suppliers
In addition to products supplied by CNH, we sell a variety of new equipment, parts and attachments from other manufacturers. These products tend to address specialized niche markets and complement the CNH products we sell by filling gaps in the CNH line of products. We believe our offering of products for specialized niche markets supports our goal of being a one-stop solution for equipment needs at each of our stores. Approximately 18.6% of our total new equipment sales in fiscal 2011 resulted from sales of products manufactured by companies other than CNH, with our single largest manufacturer other than CNH representing less than 3.1% of our total new equipment sales. The terms of our arrangements with these other suppliers vary, but most of the dealership agreements contain termination provisions allowing the supplier to terminate the agreement after a specified notice
11
period, which is typically 30 days. Payment and financing practices with these other suppliers are similar to those practices described above with respect to CNH entities.
Operating Segments, Products and Services
We operate our business in two reportable segments, Agriculture and Construction. Within each of our Agriculture and Construction segments, we have four principal sources of revenue: new and used equipment sales, parts sales, repair and maintenance service and equipment rental and other business activities. See Note 16 to our consolidated financial statements included elsewhere in this annual report for additional information regarding our segments.
Equipment Sales
We sell new agricultural and construction equipment manufactured under the CNH family of brands as well as equipment from a variety of other manufacturers. The used equipment we sell is from inventory acquired through trade-ins from our customers and selective purchases. The agricultural equipment we sell and service includes application equipment and sprayers, combines and attachments, hay and forage equipment, planting and seeding equipment, precision farming technology, tillage equipment, and tractors. The construction equipment we sell and service includes articulated trucks, compact track loaders, compaction equipment, cranes, crawler dozers, excavators, forklifts, loader/backhoes, loader/tool carriers, motor graders, skid steer loaders, telehandlers and wheel loaders. We sell new and used equipment through our professional, in-house retail sales force, which is organized by geography and operating segment. We also sell used equipment through our outlet stores. We believe this organizational structure improves the effectiveness of our sales force, better serves our customers and helps us negotiate advantageous trade-in purchase terms. Equipment sales generate cross-selling opportunities for us by populating our markets with equipment we repair and maintain and for which we sell parts. For the year ended January 31, 2011, equipment revenue was $855.4 million, representing 78.2% of total revenue for the period.
Parts Sales
We sell a broad range of maintenance and replacement parts on equipment that we sell, as well as other types of equipment. We maintain an extensive in-house parts inventory to provide timely parts and repair and maintenance support to our customers. We generally are able to acquire out-of-stock parts directly from manufacturers within two business days. Our parts sales provide us with a relatively stable revenue stream that is less sensitive to economic cycles than our equipment sales and rental operations. For the year ended January 31, 2011, parts revenue was $141.0 million, representing 12.9% of total revenue for the period.
Repair and Maintenance Services
We provide repair and maintenance services, including warranty repairs, for our customers' equipment. Each of our stores includes service bays staffed by trained service technicians. Our technicians are also available to make on-site repairs. In addition, we provide proactive and comprehensive customer service by maintaining service histories for each piece of equipment owned by our customers, maintaining 24/7 service hours in times of peak service usage, providing on-site repair services, scheduling off-season maintenance activities with customers, notifying customers of periodic service requirements and providing training programs to customers to educate them as to standard maintenance requirements. At the time equipment is purchased, we also offer customers the option of purchasing extended warranty protection provided by our suppliers. Our after-market services have historically provided us with a high-margin, relatively stable source of revenue through changing economic cycles. For the year ended January 31, 2011, service revenue was $74.5 million, representing 6.7% of total revenue for the period.
12
Equipment Rental and Other Business Activities
We rent equipment to our customers on a short-term basis for periods ranging from a few days to a few months. We actively manage the size, quality, age and composition of our rental fleet and use our information technology systems to closely monitor and analyze customer demand and rate trends. We maintain the quality of our fleet through our on-site parts and services support and dispose of rental equipment through our retail sales force. Our rental business creates cross-selling opportunities for us in equipment sales. In addition, we provide ancillary equipment support activities such as equipment transportation, GPS signal subscriptions in connection with precision farming and reselling CNH Capital finance and insurance products. For the year ended January 31, 2011, other revenue was $23.6 million, representing 2.2% of total revenue for the period.
Customers
We serve over 49,000 Agriculture customers in the U.S., primarily in North Dakota, South Dakota, Minnesota, Iowa and Nebraska. Our customers vary from small, single machine owners to large farming operations. In fiscal 2011, no single customer accounted for more than 1.0% of our Agriculture revenue and our top ten customers combined accounted for approximately 4.4% of our total Agriculture revenue.
We serve over 15,000 Construction customers in the U.S., primarily in North Dakota, South Dakota, Minnesota, Iowa, Nebraska, Wyoming and Montana. Our customers include a wide range of construction contractors, public utilities, municipalities and maintenance contractors. They vary from small, single machine owners to large contracting firms that operate under sophisticated capital equipment and maintenance budgets. In fiscal 2011, no single customer accounted for more than 1.0% of our Construction revenue and our top ten customers combined accounted for approximately 5.3% of our total Construction revenue.
Our stores enable us to closely service local and regional customers. We believe the Titan Operating Model enables us to satisfy customer requirements and increase revenue through cross-selling opportunities presented by the various products and services that we offer. In addition to our U.S. customers, we sell equipment on a limited basis to international customers, primarily in Eastern Europe. Our U.S. customers primarily finance their equipment purchases through CNH Capital.
Floorplan Financing
We attempt to maintain at each store, or have readily available at other stores in our network, sufficient inventory to satisfy customer needs. Inventory levels fluctuate throughout the year and tend to increase before the primary sales seasons for agricultural equipment. The cost of financing our inventory is an important factor affecting our financial results.
CNH Capital
CNH Capital offers floorplan financing to CNH dealers for extended periods to finance products from both CNH and other suppliers. CNH Capital provides this financing in part to enable dealers to carry representative inventories of equipment and encourage the purchase of goods by dealers in advance of seasonal retail demand. CNH Capital charges variable market rates of interest based on the prime rate on balances outstanding after any interest-free periods and retains a security interest in all of our assets, including inventories, which it inspects periodically. The interest-free periods, which CNH offers periodically in the form of additional incentives or special offers, typically average four months for new and used agriculture equipment and new construction equipment. CNH Capital also provides financing for used equipment accepted in trade, repossessed equipment and approved equipment from other suppliers, and receives a security interest in such equipment.
13
Other Financing Sources for Equipment
In addition to the financing provided by CNH Capital, financing also may be available through floorplan financing programs provided by the suppliers, which may be financed by such suppliers themselves or through third party lenders.
Other Financing
We have a Credit Agreement with the Wells Fargo Bank Syndicate, which includes a $175.0 million wholesale floorplan line of credit to finance equipment inventory purchases.
Sales and Marketing
As part of the Titan Operating Model, we have centralized sales support and marketing management. All of our stores benefit from our centralized media buys, strategic planning, sales support and training, and we provide our store managers and their sales teams with flexibility to localize sales and marketing.
We currently market our products and services through:
- •
- field marketers, our direct sales representatives who operate out of our network of local stores and call on customers in
the markets surrounding each store;
- •
- parts counter and service managers, who provide our customers with comprehensive after-market support;
- •
- local and national advertising efforts, including broadcast, cable, print and web-based media; and
- •
- our remarketing division, which trades and sells used equipment through our outlet store and website.
Field Marketers
Our field marketers perform a variety of functions, such as servicing customers at our stores, calling on existing customers and soliciting new business at farming, construction and industrial sites. These field marketers target customers in specific areas, and we develop customized marketing programs for our sales force by analyzing each customer group for profitability, buying behavior and product selection. All members of our sales force are required to attend frequent in-house training sessions to develop product and application knowledge, sales techniques and financial acumen. Our sales force is supported by our corporate marketing department.
Parts Counter and Service Managers
Our parts counter and service managers are involved in our uptime service efforts, taking advantage of our seasonal marketing campaigns in parts and service sales. As a group, they have won multiple awards from our suppliers for their efforts benefiting both our customers and our key strategic partners.
Print, Broadcast and Web-Based Advertising Campaigns
Each year we initiate several targeted direct mail, print and broadcast advertising and marketing campaigns. CNH and other suppliers periodically provide us with advertising funds, which we primarily use to promote new equipment, parts and financing programs. We will continue to explore and launch additional sales channels as appropriate, including, for example, new internet-based efforts.
Remarketing Division
Our remarketing division capitalizes on sales opportunities for aged used agricultural and construction equipment transferred out of our retail stores. We have opened two outlet stores that sell used equipment. In addition, we are actively engaged in marketing equipment through our website.
14
Competition
The agricultural and construction equipment sales and distribution industries are highly competitive and fragmented, with large numbers of companies operating on a regional or local scale. Our competitors range from multi-location, regional operators to single-location, local dealers and include dealers and distributors of competing equipment brands, including John Deere, Caterpillar and the AGCO family of brands, as well as other dealers and distributors of the CNH family of brands. Competition among equipment dealers, whether they offer agricultural or construction products or both, is primarily based on the price, value, reputation, quality and design of the products offered by the dealer, the customer service and repair and maintenance service provided by the dealer, the availability of equipment and parts and the accessibility of stores. While we believe we compete favorably on each of the identified competitive factors, our sales and margins may be impacted depending on (i) the extent of aggressive pricing competition through manufacturer discount programs or other competitive pricing tactics, (ii) our ability to obtain higher service gross margins based on our service quality and reputation and (iii) our ability to attract new and maintain existing customers based on the availability and quality of the products we offer and our local relationship and reputation.
The number of agricultural and construction equipment dealers operating on a regional scale is limited and we are one of the principal regional-scale agricultural and construction equipment dealers in the U.S. The primary regional-scale equipment dealers with whom we compete include RDO Equipment Co., Butler Machinery, Ziegler Inc. and Brandt Holdings Co. RDO Equipment Co. is a John Deere agricultural and construction equipment dealer with 59 locations in nine states, including North Dakota, South Dakota, Minnesota and Montana. Butler Machinery is a Caterpillar construction and agriculture equipment dealer with 12 locations in North Dakota and South Dakota. Ziegler Inc. is a Caterpillar construction and agriculture equipment dealer with 20 locations in three states, including Minnesota and Iowa. Brandt Holdings owns John Deere, Vermeer and Bobcat construction and agricultural equipment dealers with 32 locations in 11 states including Iowa, Minnesota, Nebraska, North Dakota, and South Dakota.
Information Technology Systems
We currently use an integrated management reporting system developed and supported by Dealer Information Systems Corporation to manage our operating information. We are in the process of implementing a new enterprise resource planning ("ERP") system that will replace our current management reporting system. Our information system enables us to closely monitor our performance and actively manage our business on a consolidated and segment basis and includes features that were enhanced to support the Titan Operating Model, including detailed store-based financial reporting, inventory management and customer relationship management.
Through our information system we maintain a complete database on inventory of parts and equipment and a centralized inventory control system for each segment. Our system enables each store to access the available inventory of our other stores before ordering additional parts or equipment from our suppliers. We are also able to monitor inventory levels and mix at each store and make adjustments in accordance with our operating plan. Finally, our system is externally connected to CNH, enabling us to locate CNH equipment and parts inventories, and communicate with other CNH dealers.
Our customer relationship management system provides sales and customer information and other organizational tools to assist our sales force. We maintain an extensive customer database that allows us to monitor the status and maintenance history of our customers' equipment and enables us to more effectively provide parts and services to meet their needs. We also use our relationship management information system and customer database to monitor sales information and customer demand.
The data we store in our information system is backed-up on a daily basis and stored at an off-site location. Thus, if our system were to become inoperable, we would be able to continue operations through an off-site data center. Further, we own the software and hardware necessary to operate this system and have employees trained to manage and maintain the software without reliance on external support.
15
Corporate Information
We were incorporated as a North Dakota corporation in 1980 and reincorporated in Delaware in December 2007 prior to our initial public offering. Our executive offices are located at 644 East Beaton Drive, West Fargo, ND 58078-2648. Our telephone number is (701) 356-0130. We maintain a web site at www.titanmachinery.com.
Intellectual Property
We do not have any registered intellectual property. Case IH, Case and New Holland are registered trademarks of CNH, which we use in connection with advertisements and sales as authorized under our dealership agreements. We license trademarks and trade names of new equipment obtained from suppliers other than CNH from their respective owners. We operate each of our stores under either the Titan Machinery name or, if there was strong local name recognition and customer loyalty at a location we acquired, the name historically used by the dealership in that location for a transition period, the length of which can vary depending upon the location.
Product Warranties
Product warranties for new equipment and parts are provided by our suppliers. The term and scope of these warranties vary greatly by supplier and by product. At the time equipment is purchased, we also offer customers the option of purchasing extended warranty protection provided by our suppliers. Suppliers pay us for repairs we perform to equipment under warranty. We generally sell used equipment "as is" and without manufacturer's warranty, although manufacturers sometimes provide limited warranties if the supplier's original warranty is transferable and has not expired. Typically, we provide no additional warranties on used equipment.
Seasonality
Our quarterly operating results are subject to fluctuation due to varying weather patterns, which may impact the timing and amount of equipment purchases, rentals, and after-sales parts and service purchases by our Agriculture and Construction customers.
Employees
As of April 1, 2011, we employed 1,596 full-time and 278 part-time employees. None of our employees is covered by a collective bargaining agreement. We believe our relations with our employees are good.
Governmental Regulation
We are subject to numerous federal, state, and local rules and regulations, including regulations promulgated by the Environmental Protection Agency and similar state agencies, with respect to storing, shipping, disposing, discharging and manufacturing hazardous materials and hazardous and non-hazardous waste. These activities are associated with the repair and maintenance of equipment at our stores. Currently, none of our stores or operations exceeds small quantity generation status. Compliance with these rules and regulations has not had any material effect on our operations, nor do we expect it to in the future. Further, we have not made, and do not anticipate making, any material capital expenditures related to compliance with environmental regulations. However, there can be no assurance that these expectations are accurate, particularly if regulations change, unforeseen incidents occur or unknown past contamination or non-compliance is discovered, among other similar events.
16
We are substantially dependent upon our relationship with CNH.
We are an authorized dealer of CNH agricultural and construction equipment and parts. In fiscal 2011, CNH supplied approximately 82.5% of the new agricultural equipment and 71.3% of the new construction equipment we sold and represented a significant portion of our parts revenue. Our acquisition strategy contemplates the acquisition of additional CNH geographic areas of responsibility and store locations in both the Agricultural and Construction equipment segments. We depend on CNH Capital for floorplan financing to purchase a substantial portion of our inventory. In addition, CNH Capital provides a significant percentage of the financing used by our customers to purchase CNH equipment from us. CNH also provides incentive programs and discount programs from time to time that enable us to price our products more competitively. In addition, CNH conducts promotional and marketing activities on national, regional and local levels. Due to our substantial dependence on CNH, our success depends, in significant part, on (i) the overall reputation and success of CNH; (ii) the availability and terms of floorplan financing and customer financing from CNH Capital; (iii) the incentive and discount programs provided by CNH and its promotional and marketing efforts for its agricultural and construction products; (iv) the goodwill associated with CNH trademarks; (v) the introduction of new and innovative products by CNH; (vi) the manufacture and delivery of competitively-priced, high quality equipment and parts by CNH in quantities sufficient to meet our customers' requirements on a timely basis; (vii) the quality, consistency and management of the overall CNH dealership system; and (viii) the ability of CNH to manage its risks and costs, including those associated with being a multinational company. If CNH does not provide, maintain or improve any of the foregoing, or if CNH were sold or reduced or ceased operations, there could be a material adverse effect on our financial condition and results of operations.
CNH may terminate its dealership agreements with us or change the terms of those agreements, which could adversely affect our business.
Under our dealership agreements with CNH through CNH America LLC, CNH's U.S. manufacturing entity, CNH entities have the right to terminate these agreements immediately in certain circumstances, and, in some cases, for any reason 90 days following written notice. Furthermore, CNH entities may change the terms of their agreements with us, among other things, to change our sales and service areas and/or the product, pricing or delivery terms. CNH routinely conducts evaluations of dealership standards, customer satisfaction surveys and market share studies, the results of which can impact the relationships with its dealers. CNH uses the evaluation results to increase or decrease the monetary rewards to dealers, or limit or expand the availability of financing, warranty reimbursements or other marketing incentives. If CNH were to change the terms of any or all of these agreements in a manner that adversely affects us, our business may be harmed, and if CNH were to terminate all or any of its dealer agreements with us, our business would be severely harmed.
Restrictions in our CNH dealership agreements may significantly affect our operations and growth and prevent a change in control of our company.
We operate our stores pursuant to CNH's customary dealership agreements. These agreements impose a number of restrictions and obligations on us with respect to our operations, including our obligations to actively promote the sale of CNH equipment within our designated geographic areas of responsibility, fulfill the warranty obligations of CNH, provide services to our customers, maintain sufficient parts inventory to service the needs of our customers, maintain inventory in proportion to the sales potential in each sales and service geographic area of responsibility, maintain adequate working capital and maintain stores only in authorized locations. Prior consent of CNH is required for the acquisition by another party of 20% or more of our outstanding stock and for our acquisition of other CNH dealerships; otherwise, CNH may terminate our dealership agreements. There can be no
17
assurance that CNH will give its consent. The restrictions and obligations in our CNH dealership agreements limit our flexibility in operating our current stores and acquiring new stores, which could have an adverse effect on our operations and growth. Furthermore, the requirement that CNH consent to the acquisition by any party of 20% or more of our outstanding stock may have the effect of discouraging transactions involving a change in our control, including transactions that stockholders might deem to be in their best interests.
Our equipment dealer appointments are not exclusive to the geographic areas we serve, which could adversely affect our operations and financial condition.
CNH could appoint other equipment dealers in close proximity to our existing stores. The sales and service geographic areas of responsibility assigned to our dealerships can be enlarged or reduced by CNH upon 30 days' prior written notice. CNH and other equipment dealers can also sell in our sales and service geographic areas of responsibility. To the extent CNH appoints other equipment dealers within our markets, enlarges or reduces the sales and service geographic areas of responsibility relating to our stores, amends the dealership agreements or imposes new or different terms or conditions under the dealer agreements, our operations and financial condition could be adversely affected.
Our operating results may be adversely impacted by an under-supply or over-supply of equipment.
If our suppliers cannot continue to provide us a reliable supply of new equipment, we may not be able to meet our customers' demand and our operating results could be negatively impacted. In times of heightened global demand for equipment, which is often driven by other factors (e.g., farm cash receipts often drive demand for agricultural equipment and infrastructure development often drives construction equipment demand), equipment suppliers may experience difficulty providing all dealerships a reliable supply of new agricultural equipment, which could adversely impact our results of operations. Further, an under-supply of equipment may cause prices for such equipment to increase. To the extent we cannot pass on any increased costs of equipment to our customers, our operating results may suffer. Conversely, an industry over-supply of equipment may also adversely affect our operations. Though manufacturers typically manage production of new equipment in response to demand, there may be short-term under-supplies or over-supplies of new equipment as manufacturers adjust to industry demand fluctuations. For used and rental equipment, short-term lease programs and commercial rental agencies for construction and agricultural equipment have expanded significantly in North America. Nationwide rental conglomerates have become sizeable purchasers of new equipment and can have a significant impact on industry sales and margins. When equipment comes off of lease or is replaced with newer equipment by rental agencies, there may be a significant increase in the availability of late-model used equipment. An over-supply of used equipment could adversely affect demand for, or the market prices of, new and used equipment. In addition, a decline in used equipment prices could have an adverse effect on residual values for leased equipment, which could adversely affect our financial performance.
If our acquisition plans are unsuccessful, we may not achieve our planned revenue growth.
We believe a significant portion of our future growth will depend on our ability to acquire additional dealerships. Our ability to continue to grow through the acquisition of additional CNH geographic areas of responsibility and store locations or other businesses will be dependent upon the availability of suitable acquisition candidates at acceptable costs, our ability to compete effectively for available acquisition candidates and the availability of capital to complete the acquisitions. We may not successfully identify suitable targets, or if we do, we may not be able to close the transactions, or if we close the transactions, they may not be profitable. In addition, CNH's consent is required for the acquisition of any CNH dealership, and the consent of the Wells Fargo Bank Syndicate is required for
18
the acquisition of dealerships meeting certain thresholds or other criteria defined in the Senior Secured Credit Facility. CNH typically evaluates management, performance and capitalization of a prospective acquirer in determining whether to consent to the sale of a CNH dealership. There can be no assurance that CNH or the Wells Fargo Bank Syndicate will consent to any or all acquisitions of dealerships that we may propose.
Our potential inability to successfully integrate newly-acquired dealerships may adversely affect our financial results.
Once an acquisition is completed, we face many other risks commonly encountered with growth through acquisitions. These risks include incurring significantly higher than anticipated capital expenditures and operating expenses; failing to assimilate the operations and personnel of the acquired dealerships; disrupting our ongoing business; dissipating our management resources; failing to maintain uniform standards, controls and policies; and impairing relationships with employees and customers as a result of changes in management. Fully integrating an acquired dealership into our operations and realization of the full benefit of our strategies, operating model and systems may take several years. We may not be successful in overcoming these risks or any other problems encountered with such acquisitions. To the extent we do not successfully avoid or overcome the risks or problems related to acquisitions, our results of operations and financial condition could be adversely affected. Future acquisitions also will have a significant impact on our financial position and capital needs, and could cause substantial fluctuations in our quarterly and yearly results of operations. Acquisitions could include significant goodwill and intangible assets, which may result in future impairment charges that would reduce our stated earnings.
We have grown significantly through acquisitions in recent years and expect to continue to grow through acquisitions. Management has expended, and expects to continue to expend, significant time and effort in evaluating, completing and integrating acquisitions and opening new stores. Our systems, procedures and controls may not be adequate to support our expanding operations. Any future growth will also impose significant added responsibilities on our executives, including the need to identify, recruit and integrate new senior level managers and executives. We may not be able to identify and retain such additional management. If we are unable to manage growth efficiently and effectively, or are unable to attract and retain additional qualified management, there could be a material adverse effect on our financial condition and results of operations.
We lease many of our dealership sites from related parties, and if we are unable to obtain commercially reasonable terms and conditions from these related parties or unrelated third parties in the future, our growth and financial condition may be adversely affected.
We lease 43 of our 81 dealership sites from entities affiliated with David Meyer, our Chairman and Chief Executive Officer, Tony Christianson, one of our directors, Peter Christianson, our President and Chief Operating Officer, or James L. Williams, one of our directors. We expect that we may lease future dealership sites we acquire from parties related to our affiliates. There is no guarantee that related parties will offer us commercially reasonable terms and conditions or that unrelated third parties will provide alternate dealership sites on commercially reasonable terms and conditions. If we cannot obtain commercially reasonable terms and conditions on leases for our current or future dealership sites from entities related to Messrs. Meyer, Tony Christianson, Peter Christianson or Williams, or from unrelated third parties, our growth and financial condition may be adversely affected.
Substantial inventory financing is required for the equipment we sell but may not be available, which could adversely affect our growth and results of operations.
The sale of agricultural and construction equipment requires substantial inventories of equipment and parts to be maintained at each store to facilitate sales to customers on a timely basis. We generally
19
purchase our inventories of equipment with the assistance of floorplan financing programs through CNH Capital and other lenders. As we grow, whether internally or through acquisitions, our inventory requirements will increase and, as a result, our financing requirements also will increase. In the event that our available financing sources are not maintained or are insufficient to satisfy our future requirements, we would be required to obtain financing from other sources. There can be no assurance that additional or alternative financing could be obtained on commercially reasonable terms. To the extent additional financing cannot be obtained on commercially reasonable terms, our growth and results of operations could be adversely affected.
Failure to properly manage our equipment inventory, our largest asset, would have a significant adverse effect on our operations.
Our equipment inventory has generally represented 50% or more of our total assets. Thus, our success is significantly dependent upon our ability to manage the supply and cost of new and used equipment. The pricing of equipment can be highly volatile and subject to negotiation, particularly in the used equipment market. Pricing for and sales of used equipment can be significantly affected by the limited market for such equipment. Further, liquidation prices of used agricultural and construction equipment can have significant fluctuations due to economic cycles, utilization trends and degree of specialization. We are dependent upon the ability of our management and buyers to negotiate acceptable purchase prices, to affect a proper balance of new and used equipment and to manage the amount of equipment in inventory to assure quick turnover. Our failure to manage our inventory and equipment costs could materially adversely affect our results of operations and financial condition.
Adverse changes in governmental agricultural policies, including decreases in farm subsidies, may reduce demand for agricultural equipment and cause our revenue to decline.
Changes in governmental agricultural policy could adversely affect sales of agricultural equipment. Government subsidies influence demand for agricultural equipment. Future farm bills and USDA budgets may reduce the amount of payments to individual farmers. We cannot predict the outcome of such governmental funding, and to the extent that future funding to individual farmers is reduced, these reductions in funding could reduce demand for agricultural equipment and we could experience a decline in revenue.
Economic events, particularly in the credit markets, may adversely affect our business and results of operations.
The agricultural and construction equipment industries are affected by macroeconomic factors, including changes in international, national, regional, and local economic conditions. Current global economic conditions pose a risk to our business as customers may postpone spending in response to tighter credit, negative financial news, downturns in agricultural commodity prices and the housing market and/or declines in income or asset values, which could have a material negative effect on the demand for our products and services. Our business is also particularly dependent on our access to the capital and credit markets to finance acquisitions and manage inventory. Tight credit markets, a low level of liquidity in many financial markets, and extreme volatility in fixed income, credit, currency and equity markets have the potential to adversely affect our business. Such disruptions in the overall economy and financial markets and the related reduction in consumer confidence in the economy, slow activity in the capital markets, negatively affect access to credit on commercially acceptable terms, and may adversely impact the access of us or our customers to credit and the terms of any such credit. Further, any decreased collectability of accounts receivable or increase in customer insolvencies could negatively impact our results of operations. The nature of the agricultural and construction equipment industries is such that a downturn in demand can occur suddenly, due to tightening credit markets, decreasing commodity prices or demand, decreasing infrastructure and housing development, adverse
20
weather conditions or other circumstances, resulting in excess inventory, un-utilized production capacity and reduced prices for equipment, which would harm our revenue and profitability. Uncertainty about current global economic conditions, agricultural commodity prices and demand and the housing market could also continue to increase the volatility of our stock price.
Adverse changes in the agricultural industries could result in decreases in purchases of agricultural equipment and harm our revenue and profitability.
Our business depends to a great extent upon general activity levels in the agricultural industries. Changes in farm income and farmland value, the level of worldwide farm output and demand for farm products, commodity prices, animal diseases and crop pests, and limits on agricultural imports are all material factors that could adversely affect the agricultural industries and result in a decrease in the amount of agricultural equipment that our customers purchase. The nature of the agricultural equipment industries is such that a downturn in demand can occur suddenly, resulting in excess inventories, un-utilized production capacity and reduced prices for new and used equipment. These downturns may be prolonged and our revenue and profitability would be harmed.
Adverse changes in the construction industry could result in decreased demand for construction equipment and harm our revenue.
General economic conditions in markets in which we do business can impact the demand for our construction equipment. The construction industry in our geographical areas has experienced a prolonged economic down cycle as a result of the macroeconomic environment, which negatively impacts sales of light construction equipment. Decreased demand for our products can have a negative impact on our financial performance and cash flow. Our business and earnings are impacted by the changes in the construction industry. The ability of consumers to obtain mortgages for the purchase of newly constructed homes or commercial properties impacts the overall demand for new home construction. The uncertainties created by recent events in the sub-prime mortgage market and their impact on the overall mortgage market, including the tightening of credit standards, could adversely affect the ability of consumers to obtain financing, thus reducing demand for new construction and in turn reducing our customers' demand for our construction equipment. Reduced demand for our construction equipment could negatively affect our financial performance and cash flow.
Climate fluctuations may negatively impact the agricultural and construction equipment markets and harm our sales.
Weather conditions, particularly severe floods and droughts, can have a significant impact on the success of regional agricultural and construction markets and, therefore, the economic conditions of the regions in which we operate stores. Accordingly, our financial condition and results of operations may be materially and adversely affected by any adverse cyclical trends or weather conditions. Our quarterly operating results are subject to fluctuation due to varying weather patterns, which may impact the timing and amount of equipment, parts and service purchases by our customers. A significant increase in the severity of weather cycles could increase the volatility of our results of operations and impact our financial condition. If we acquire businesses in geographic areas other than where we currently have operations, we may be affected more by the above-mentioned or other seasonal and equipment buying trends.
Our results of operations may fluctuate from period to period due to interest rate adjustments.
The ability to finance affordable purchases, of which the interest rate charged is a significant component, is an important part of a customer's decision to purchase agricultural or construction equipment. Volatility in the credit markets may have a negative impact on our business by making it more difficult for certain of our customers to obtain financing to purchase agricultural or construction
21
equipment. Interest rate increases may make equipment purchases less affordable for customers and, as a result, our revenue and profitability may decrease as we manage excess inventory and reduce prices for equipment. To the extent we cannot pass on our increased costs of inventory to our customers, our net income may decrease. Conversely, any decrease in interest rates may positively affect a customer's decision to purchase agricultural or construction equipment. Partially as a result of the foregoing, our results of operations have in the past and in the future are expected to continue to fluctuate from quarter to quarter and year to year. We are unable to anticipate the timing and impact of interest rate adjustments.
Aggressive pricing competition could adversely affect our results of operation and growth.
The agricultural and construction equipment sales and distribution industries are highly competitive and fragmented, with large numbers of companies operating on a regional or local scale. Historically, our competitors have competed aggressively on the basis of pricing or inventory availability, resulting in decreased margins on our sales to the extent we choose to match our competitors' downward pricing. To the extent we choose not to match or remain within a reasonable competitive distance from our competitors' pricing, it could also have an adverse impact on our results of operations, as we may lose sales volume. In addition, to the extent CNH's competitors provide their dealers with more innovative or higher quality products, better customer financing, or have more effective marketing efforts, our ability to compete and financial condition and results of operations could be adversely affected.
We are substantially dependent on our Chief Executive Officer and President/Chief Operating Officer, the loss of either of whom could have a material adverse effect on our business.
We believe our success will depend to a significant extent upon the efforts and abilities of David Meyer, our Chairman and Chief Executive Officer, and Peter Christianson, our President and Chief Operating Officer. The employment relationships with both Mr. Meyer and Mr. Christianson are terminable by us or each of them at any time for any reason. The loss of the services of one or both of these persons and other key employees could have a material adverse effect on our operating results.
Selling agricultural and construction equipment and parts subjects us to product liability risks that could adversely affect our financial condition and reputation.
Products sold or serviced by us may expose us to potential liabilities for personal injury or property damage claims relating to the use of such products. Our product liability insurance may not be adequate to cover product liability claims. Such insurance may not continue to be available on economically reasonable terms. An uninsured or partially insured claim for which indemnification is not provided could have a material adverse effect on our financial condition. Furthermore, if any significant claims are made against us or against CNH or any of our other suppliers, our business may be adversely affected by any resulting negative publicity.
Being a public company has substantially increased our legal and financial compliance costs, which could harm our business, financial condition and results of operations.
Compliance with publicly-traded company regulations adversely impacts our resources. As a publicly-traded company, we are subject to rules and regulations that increase our legal and financial compliance costs, make some activities more time-consuming and costly, and divert our management's attention away from the operation of our business. These rules and regulations may make it more difficult and more expensive for us to maintain director and officer liability insurance and we may be required to accept reduced policy limits and coverage or incur substantially higher costs to obtain the same or similar coverage. As a result, we may experience more difficulty attracting and retaining qualified individuals to serve on our board of directors or as executive officers. We cannot predict or
22
estimate the amount of additional costs we may incur as a result of these requirements or the timing of these costs. The costs of being a publicly-traded company and the attendant diversion of management's time and attention may have a material adverse effect on our business, financial condition and results of operations.
Our internal control over financial reporting may not be effective and our independent registered public accounting firm may not be able to certify as to its effectiveness, which could have a significant and adverse effect on our business and reputation.
We are required to comply with the requirements of Section 404 of the Sarbanes-Oxley Act of 2002 and rules and regulations of the SEC thereunder. If we fail to maintain the adequacy of our internal control over financial reporting, as such standards are modified, supplemented or amended from time to time, we may not be able to ensure that we can conclude on an ongoing basis that we have effective internal control over financial reporting in accordance with Section 404. We cannot be certain as to the timing of completion of our evaluation, testing and any remedial actions or their impact on our operations. If we are not able to comply with the requirements of Section 404, our independent registered public accounting firm may not be able to certify as to the effectiveness of our internal control over financial reporting, we may be unable to report our financial results accurately or in a timely manner and we may be subject to sanctions or investigation by regulatory authorities, such as the SEC. As a result, there could be a negative reaction in the financial markets due to a loss of confidence in the reliability of our financial statements. In fiscal 2010, we began implementing a new ERP system. Unforeseen problems with or any difficulties encountered integrating the new ERP system could result in internal control deficiencies.
ITEM 1B. UNRESOLVED STAFF COMMENTS
None.
Equipment Stores
We currently operate 81 agricultural and construction equipment stores, including two outlet stores in the following locations. Certain stores (those designated with an *) are included in the Agriculture segment but also sell some construction equipment.
Agriculture Segment
| North Dakota (14 stores) | Iowa (14 stores, including 1 outlet) | |||||
|---|---|---|---|---|---|---|
Arthur |
Lidgerwood |
Anthon |
Grundy Center |
|||
Casselton |
Lisbon |
Avoca |
Iowa Falls |
|||
Grand Forks* |
Mandan* |
Blairstown |
Kingsley |
|||
Jamestown |
Mayville |
Center Point* |
Le Mars |
|||
Kintyre |
Wahpeton (2 stores) |
Cherokee |
Oskaloosa |
|||
Kulm |
Wishek |
Cherokee (outlet) |
Pella |
|||
Lamoure |
Greenfield |
Waverly |
||||
23
| Minnesota (14 stores, including 1 outlet) | South Dakota (11 stores) | |||||
|---|---|---|---|---|---|---|
Ada |
Moorhead |
Aberdeen (2 stores)* |
Miller |
|||
Albert Lea |
Moorhead (outlet) |
Britton |
Pierre |
|||
Crookston* |
Pipestone |
Highmore |
Sioux Falls |
|||
Elbow Lake |
Redwood Falls |
Huron |
Redfield |
|||
Fergus Falls |
Roseau |
Milbank |
Watertown |
|||
Graceville |
Thief River Falls |
|||||
Marshall* |
Winger |
|||||
| Nebraska (6 stores) | |
|
||||
|---|---|---|---|---|---|---|
Grand Island |
Kearney |
|||||
Hastings |
Lexington |
|||||
Holdrege |
North Platte |
|||||
Construction Segment
| North Dakota (5 stores) | Iowa (4 stores) | |||||
|---|---|---|---|---|---|---|
Bismarck |
Minot |
Clear Lake |
Des Moines |
|||
Fargo (2 stores) |
Williston |
Davenport |
Sioux City |
|||
| Nebraska (2 stores) | South Dakota (2 stores) | |||||
|---|---|---|---|---|---|---|
Lincoln |
Omaha |
Rapid City |
Sioux Falls |
|||
| Montana (6 stores) | Wyoming (3 stores) | |||||
|---|---|---|---|---|---|---|
Big Sky |
Great Falls |
Casper |
Gillette |
|||
Billings (2 stores) |
Missoula |
Cheyenne |
||||
Bozeman |
||||||
Our stores are generally located in rural areas on property zoned for commercial use. The stores typically range from 5,000 square feet with three acres of land to 40,000 square feet with 14 acres of land. We fully utilize the leased space for each of our stores and believe the respective square footage and related acreage is adequate to meet our current and anticipated needs.
Store Lease Arrangements
As of January 31, 2011, we leased real estate for 43 of our stores from entities affiliated with David Meyer, our Chairman and Chief Executive Officer, Tony Christianson, one of our directors, Peter Christianson, our President and Chief Operating Officer or James L. Williams, one of our directors. Of these 43 stores, we leased 41 dealership sites from Dealer Sites, LLC, an entity owned in part by Messrs. Meyer, Tony Christianson and Peter Christianson or their affiliates; one dealership site from C.I. Farm Power, Inc., an entity owned by Mr. Peter Christianson; and one dealership site from Arthur Mercantile Company, an entity owned in part by James L. Williams. We leased 47 additional properties for stores and storage facilities under operating lease agreements with unrelated parties as of January 31, 2011. The leases for our dealership sites generally expire between 2011 and 2022, other than those leases which are currently automatically renewed on a year-to-year-basis until either we or the lessor terminate them. We do not intend to own significant amounts of real estate. Therefore, we anticipate that when we need real estate, including as part of acquiring dealerships, we will lease such real estate from third parties, which may include affiliates of our investors, directors or management. We intend for the terms of all of our leases to be commercially reasonable. We do not believe the terms of our leases with entities affiliated with Messrs. Meyer, Tony Christianson, Peter Christianson
24
and Williams are any less favorable to us than could be obtained in an arm's length transaction with an unrelated party.
Our store lease agreements with entities affiliated with David Meyer, Peter Christianson, Tony Christianson and James L. Williams all contain substantially similar terms. The leases with Dealer Sites, LLC, C.I. Farm Power, Inc. and Arthur Mercantile Company provide for fixed lease periods ranging from three to ten years. All of the leases provide for fixed monthly rental payments and require us to pay the real estate taxes on the properties for the lease periods. The leases require that we maintain public liability and personal property insurance on each of the leased premises, and require us to indemnify the lessor in connection with any claims arising from the leased premises during our occupation of the property. The leases generally prohibit us from assigning the lease agreements or subletting the leased premises without the prior written consent of the lessor. The lease agreements with Dealer Sites, LLC provide that in the event Dealer Sites, LLC and Titan Machinery Inc. agree to sell the leased premises to a party other than us or our affiliates during the term of the lease, then we shall share in half of any surplus or deficit resulting to Dealer Sites, LLC from that sale.
Our store lease agreements with unrelated parties contain terms comparable to the agreements with entities affiliated with our directors and officers described above. The lease periods range from automatically renewable month-to-month terms to 20 years in length. Many of the lease agreements either give us the option to renew or extend the lease for an additional period at the conclusion of the original lease term or automatically renew the lease term at the conclusion of the original lease period on a month-to-month or year-to-year basis. A majority of the leases provide for fixed monthly rental payments and require us to pay the real estate taxes on the properties for the lease periods. All of the leases require that we maintain public liability and personal property insurance on each of the leased premises, and a majority of the leases require us to indemnify the lessor in connection with any claims arising from the leased premises during our occupation of the property. Most of the leases prohibit us from assigning the lease agreements or subletting the leased premises without the prior written consent of the lessor. We have been granted a right of first refusal to purchase the Watertown and one of the Aberdeen properties during the applicable lease terms. The lease agreements for the West Fargo, Kingsley, Le Mars, Watertown, Mayville and Redfield properties grant us the option to purchase the leased premises during or at the conclusion of the lease term. The lease agreements for the Milbank and Albert Lea properties grant Dealer Sites, LLC the option to purchase the leased premises during or at the conclusion of the lease term. The Kingsley, Le Mars and Redfield lease agreements grant the lessor the right to require Dealer Sites, LLC to purchase the leased premises during or at the conclusion of the lease term.
As part of our due diligence review prior to a dealership acquisition, we evaluate the adequacy, suitability and condition of the related real estate. Our evaluation typically includes a Phase I environmental study, and if deemed necessary, a Phase II environmental study, of the real property to determine whether there are any environmental concerns. If any environmental concerns exist, we generally require that such concerns be addressed prior to acquisition of the dealership.
Headquarters
We currently lease and occupy approximately 48,000 square feet in West Fargo, North Dakota for our headquarters, which lease expires on May 31, 2020. We continually review our location needs, including the adequacy of our headquarters space, to ensure our space is sufficient to support our operations. We believe there is ample opportunity for expansion in the West Fargo area if necessary.
25
We are, from time to time, subject to claims and suits arising in the ordinary course of business. Such claims have, in the past, generally been covered by insurance. Management believes the resolution of other legal matters will not have a material effect on our financial condition or results of operation, although no assurance can be given with respect to the ultimate outcome of any such actions. Furthermore, there can be no assurance that our insurance will be adequate to cover all liabilities that may arise out of claims brought against us. We are not currently a party to any material litigation.
ITEM 4. (REMOVED AND RESERVED)
EXECUTIVE OFFICERS OF THE REGISTRANT
The names, ages and positions of our executive officers are as follows:
Name
|
Age | Position | |||
|---|---|---|---|---|---|
David Meyer |
57 | Chairman and Chief Executive Officer | |||
Peter Christianson |
54 | President, Chief Operating Officer and Director | |||
Mark Kalvoda |
39 | Chief Financial Officer | |||
David Meyer is our Chairman and Chief Executive Officer. Mr. Meyer was a founder of our company in 1980 and has been a director of our company since its creation. From 1976 to 1980, Mr. Meyer was a partner in a Case and New Holland dealership with locations in Lisbon and Wahpeton, North Dakota.
Peter Christianson has been our President and a director since January 2003, became our Chief Operating Officer in April 2011, and was our Chief Financial Officer from August 2007 to April 2011. Prior to joining us and since 1988, he was a partner and owner of C.I. Farm Power, Inc., the operator of two of the dealership locations acquired by Titan Machinery LLC in 2002. Peter Christianson and Tony Christianson, one of our directors, are brothers.
Mark Kalvoda became our Chief Financial Officer in April 2011 and previously served as our Chief Accounting Officer since September 2007. Prior to joining us, he held various positions between 2004 and 2007 at American Crystal Sugar Co., including Corporate Controller, Assistant Secretary and Assistant Treasurer. Prior to working for American Crystal Sugar Co., he served in various financial positions within Hormel Foods Corporation.
26
ITEM 5. MARKET FOR REGISTRANT'S COMMON EQUITY, RELATED STOCKHOLDER MATTERS AND ISSUER PURCHASES OF EQUITY SECURITIES
Market Information
Our common stock began trading on December 6, 2007 on the Nasdaq Global Market under the symbol "TITN" in connection with our initial public offering and began trading on the Nasdaq Global Select Market in January 2009. The following table sets forth, for the periods indicated, the high and low sale prices of our common stock as reported by the Nasdaq Global Select Market.
| |
High | Low | |||||
|---|---|---|---|---|---|---|---|
Fiscal 2011 |
|||||||
First Quarter |
$ | 15.44 | $ | 10.70 | |||
Second Quarter |
$ | 15.19 | $ | 11.93 | |||
Third Quarter |
$ | 20.77 | $ | 14.00 | |||
Fourth Quarter |
$ | 24.74 | $ | 18.67 | |||
Fiscal 2010 |
|||||||
First Quarter |
$ | 12.96 | $ | 7.50 | |||
Second Quarter |
$ | 17.00 | $ | 9.96 | |||
Third Quarter |
$ | 14.49 | $ | 10.38 | |||
Fourth Quarter |
$ | 13.19 | $ | 9.81 | |||
As of April 1, 2011, there were approximately 500 record holders of our common stock, excluding holders whose stock is held either in nominee name and/or street name brokerage accounts.
DIVIDENDS
We have not historically paid any dividends on our common stock and do not expect to pay cash dividends on our common stock in the foreseeable future. Payment of future cash dividends, if any, will be at the discretion of our board of directors after taking into account various factors, including our financial condition, operating results, current and anticipated cash needs, outstanding indebtedness and plans for expansion and restrictions imposed by lenders, if any. Currently, our credit facility with the Wells Fargo Bank Syndicate restricts our ability to pay cash dividends to an amount not to exceed 50% of consolidated net income for the then trailing four quarters, so long as no default of event of default exists prior to or immediately following such action or otherwise results from such action.
UNREGISTERED SALES OF EQUITY SECURITIES
We did not have any unregistered sales of equity securities during the fourth quarter of fiscal 2011.
SECURITIES AUTHORIZED FOR ISSUANCE UNDER EQUITY COMPENSATION PLANS
For information on our equity compensation plans, refer to Item 12, "Security Ownership of Certain Beneficial Owners and Management and Related Stockholder Matters."
REPURCHASES
We did not engage in any repurchases of our Common Stock during the fiscal quarter ended January 31, 2011.
27
STOCK PERFORMANCE GRAPH
The following graph compares the cumulative total return for the last trading day of the Company's last four fiscal years following commencement of trading on December 6, 2007 in conjunction with the Company's initial public offering on a $100 investment (assuming dividend reinvestment) in each of the Common Stock of the Company, the Russell 2000 Stock Index and the S&P 500 Retail Index.
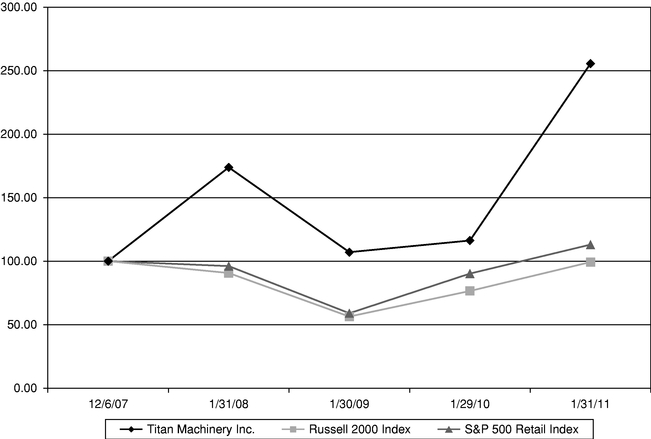
| |
|
Fiscal Year Ended January 31, | ||||||||||||||
|---|---|---|---|---|---|---|---|---|---|---|---|---|---|---|---|---|
| |
December 6, 2007 |
|||||||||||||||
| |
2008 | 2009 | 2010 | 2011 | ||||||||||||
Titan Machinery Inc. |
$ | 100.00 | $ | 173.84 | $ | 107.07 | $ | 116.24 | $ | 255.59 | ||||||
Russell 2000 Index |
100.00 | 90.64 | 56.36 | 76.50 | 99.28 | |||||||||||
S&P 500 Retail Index |
100.00 | 96.10 | 58.98 | 90.20 | 113.02 | |||||||||||
28
ITEM 6. SELECTED FINANCIAL DATA
The data given below as of and for each of the five years in the period ended January 31, 2011, has been derived from the Company's Audited Consolidated Financial Statements. In order to understand the effect of accounting policies and material uncertainties that could affect our presentation of financial information, such data should be read in conjunction with the Company's Consolidated Financial Statements and Notes thereto included under Item 8 to this Form 10-K and in conjunction with Management's Discussion and Analysis of Financial Condition and Results of Operation included under Item 7 to this Form 10-K.
| |
Year Ended January 31, | ||||||||||||||||
|---|---|---|---|---|---|---|---|---|---|---|---|---|---|---|---|---|---|
| |
2011 | 2010 | 2009 | 2008 | 2007 | ||||||||||||
| |
(in thousands, except per share data) |
||||||||||||||||
Statement of Operations Data: |
|||||||||||||||||
Revenue |
|||||||||||||||||
Equipment |
$ | 855,443 | $ | 643,186 | $ | 540,307 | $ | 338,382 | $ | 220,958 | |||||||
Parts |
140,982 | 119,509 | 94,984 | 58,743 | 42,619 | ||||||||||||
Service |
74,506 | 58,983 | 44,224 | 27,344 | 21,965 | ||||||||||||
Other |
23,558 | 17,103 | 10,922 | 8,502 | 7,056 | ||||||||||||
|
1,094,489 | 838,781 | 690,437 | 432,971 | 292,598 | ||||||||||||
Cost of revenue |
|||||||||||||||||
Equipment |
773,060 | 578,411 | 478,324 | 302,320 | 200,558 | ||||||||||||
Parts |
100,281 | 83,219 | 67,270 | 42,568 | 29,909 | ||||||||||||
Service |
27,767 | 21,615 | 16,729 | 10,118 | 8,183 | ||||||||||||
Other |
18,813 | 14,441 | 8,245 | 5,913 | 5,337 | ||||||||||||
|
919,921 | 697,686 | 570,568 | 360,919 | 243,987 | ||||||||||||
Gross Profit |
174,568 | 141,095 | 119,869 | 72,052 | 48,611 | ||||||||||||
Operating expenses |
130,541 | 108,998 | 86,940 | 53,190 | 37,399 | ||||||||||||
Income from operations |
44,027 | 32,097 | 32,929 | 18,862 | 11,212 | ||||||||||||
Other income (expense) |
|||||||||||||||||
Interest and other income |
1,794 | 1,843 | 1,545 | 577 | 349 | ||||||||||||
Interest expense |
(8,584 | ) | (6,948 | ) | (3,969 | ) | (6,292 | ) | (5,473 | ) | |||||||
Debt retirement costs |
— | — | — | (3,824 | ) | — | |||||||||||
Income before income taxes |
37,237 | 26,992 | 30,505 | 9,323 | 6,088 | ||||||||||||
Provision for income taxes |
(14,895 | ) | (11,255 | ) | (12,430 | ) | (4,110 | ) | (2,450 | ) | |||||||
Income from continuing operations |
22,342 | 15,737 | 18,075 | 5,213 | 3,638 | ||||||||||||
Discontinued operations |
— | — | — | — | — | ||||||||||||
Net income |
$ | 22,342 | $ | 15,737 | $ | 18,075 | $ | 5,213 | $ | 3,638 | |||||||
Adjustment to income: |
|||||||||||||||||
Amortization of syndication fees—preferred stock |
— | — | — | (51 | ) | (21 | ) | ||||||||||
Unpaid accumulated preferred dividends |
— | — | — | (88 | ) | (102 | ) | ||||||||||
Income available to common stockholders |
$ | 22,342 | $ | 15,737 | $ | 18,075 | $ | 5,074 | $ | 3,515 | |||||||
Earnings per share |
|||||||||||||||||
Basic |
$ | 1.27 | $ | 0.89 | $ | 1.11 | $ | 0.90 | $ | 0.81 | |||||||
Diluted |
$ | 1.23 | $ | 0.88 | $ | 1.08 | $ | 0.67 | $ | 0.57 | |||||||
Weighted average shares outstanding |
|||||||||||||||||
Basic |
17,658 | 17,593 | 16,291 | 5,607 | 4,345 | ||||||||||||
Diluted |
18,146 | 17,968 | 16,779 | 8,246 | 6,907 | ||||||||||||
29
| |
January 31, | |||||||||||||||
|---|---|---|---|---|---|---|---|---|---|---|---|---|---|---|---|---|
| |
2011 | 2010 | 2009 | 2008 | 2007 | |||||||||||
| |
(in thousands) |
|||||||||||||||
Balance Sheet Data: |
||||||||||||||||
Cash |
$ | 76,112 | $ | 76,185 | $ | 41,047 | $ | 42,802 | $ | 7,572 | ||||||
U.S. treasury bills |
— | — | 44,994 | — | — | |||||||||||
Receivables |
44,945 | 22,254 | 19,626 | 22,061 | 10,921 | |||||||||||
Inventories |
429,844 | 347,580 | 241,094 | 145,767 | 106,254 | |||||||||||
Prepaid expense |
1,003 | 1,009 | 533 | 215 | 186 | |||||||||||
Income tax receivable |
— | 1,595 | 1,433 | 1,074 | — | |||||||||||
Deferred income taxes |
3,247 | 2,266 | 1,426 | 1,027 | 462 | |||||||||||
Goodwill and intangibles, net |
23,125 | 15,057 | 12,830 | 8,608 | 3,905 | |||||||||||
Property and equipment |
65,372 | 46,604 | 45,269 | 16,023 | 8,175 | |||||||||||
Other assets |
5,198 | 2,262 | 1,996 | 1,792 | 1,397 | |||||||||||
Total Assets |
$ | 648,846 | $ | 514,812 | $ | 410,248 | $ | 239,369 | $ | 138,872 | ||||||
Accounts payable |
$ | 15,957 | $ | 12,352 | $ | 18,652 | $ | 9,244 | $ | 4,228 | ||||||
Floorplan notes payable(1) |
320,801 | 249,872 | 166,481 | 105,848 | 84,699 | |||||||||||
Current maturities of long-term debt |
4,207 | 7,218 | 7,623 | 5,654 | 2,824 | |||||||||||
Customer deposits |
28,180 | 12,974 | 15,158 | 19,310 | 4,608 | |||||||||||
Accrued expenses |
16,816 | 9,870 | 8,308 | 6,137 | 2,287 | |||||||||||
Income taxes payable |
2,093 | — | — | — | 378 | |||||||||||
Total current liabilities |
388,054 | 292,286 | 216,222 | 146,193 | 99,024 | |||||||||||
Long-term liabilities |
46,235 | 32,002 | 20,259 | 15,759 | 8,043 | |||||||||||
Subordinated debentures |
— | — | — | 1,300 | 16,747 | |||||||||||
Redeemable securities |
— | — | — | — | 1,680 | |||||||||||
Total stockholders' equity |
214,557 | 190,524 | 173,767 | 76,117 | 13,378 | |||||||||||
|
$ | 648,846 | $ | 514,812 | $ | 410,248 | $ | 239,369 | $ | 138,872 | ||||||
- (1)
- Approximately 52% of floorplan notes payable were interest bearing at January 31, 2011.
30
ITEM 7. MANAGEMENT'S DISCUSSION AND ANALYSIS OF FINANCIAL CONDITION AND RESULTS OF OPERATIONS
You should read the following discussion and analysis of our financial condition and results of operations together with our financial statements and the related notes appearing under Item 8. Some of the information contained in this discussion and analysis or set forth elsewhere in this annual report, including information with respect to our plans and strategy for our business and expected financial results, includes forward-looking statements that involve risks and uncertainties. You should review the "Risk Factors" under Item 1A for a discussion of important factors that could cause actual results to differ materially from the results described in or implied by the forward-looking statements contained in the following discussion and analysis.
BUSINESS DESCRIPTION
We own and operate a network of full service agricultural and construction equipment stores in the United States. Based upon information provided to us by CNH Global N.V. or its U.S. subsidiary CNH America LLC, collectively referred to in this annual report as CNH, we are the world's largest retail dealer of Case IH Agriculture equipment and a major retail dealer of New Holland Agriculture, Case Construction and New Holland Construction equipment in the U.S. We operate our business through two reportable segments, Agriculture and Construction. Within each segment, we have four principal sources of revenue, new and used equipment sales, parts sales, service, and other business activities including equipment rental.
The agricultural equipment we sell and service includes machinery and attachments for uses ranging from large-scale farming to home and garden use. The construction equipment we sell and service includes heavy construction and light industrial machinery for commercial and residential construction, road and highway construction and mining applications. We offer our customers a one-stop solution for their equipment needs through:
- •
- new and used equipment sales;
- •
- parts sales;
- •
- repair and maintenance services; and
- •
- equipment rental and other activities.
The new equipment and parts we sell are supplied primarily by CNH. According to public reports filed by CNH, CNH is a leading manufacturer and supplier of agricultural and construction equipment based on the number of units sold, primarily through the Case IH Agriculture, New Holland Agriculture, Case Construction and New Holland Construction brands. Sales of new CNH products accounted for approximately 81.4% of our new equipment revenue in fiscal 2011, with no other supplier accounting for more than 3.1%. We acquire used equipment for resale through trade-ins from our customers and selective purchases. We sell parts and provide in-store and on-site repair and maintenance services. We rent equipment and provide other ancillary services such as equipment transportation, GPS signal subscriptions and finance and insurance products.
Throughout our 31-year operating history we have built an extensive, geographically contiguous network of 81 stores, including two outlet stores, located in North Dakota, South Dakota, Minnesota, Iowa, Nebraska, Montana and Wyoming. We have a history of growth through acquisitions, including 34 acquisitions consisting of 75 stores operating in seven states since January 1, 2003. We expect that acquisitions will continue to be an important component of our growth.
31
Certain External Factors Affecting our Business
We are subject to a number of factors that affect our business as discussed in the sections entitled "Risk Factors" and "Information Regarding Forward-Looking Statements." Certain of the external factors include, but are not limited to, the following:
Industry Factors
Our business is primarily driven by the demand for agricultural equipment for use in the production of food, fiber, feed grain and renewable energy; home and garden applications; and the maintenance of commercial, residential and government properties. Based on USDA data, we believe farmers have recently experienced historically strong economic fundamentals, driven by growing global demand for agricultural commodities in part due to growth in renewable energy and the economies of developing countries. This strong farm economy contributed significantly to our results of operations in fiscal 2011, 2010 and 2009. We believe our operating model, as discussed in "Business—Titan Operating Model," enables us to maximize opportunities and implement our conservative expenditure philosophy that emphasizes scalable costs. Further, our large and diverse customer base and seven-state geographic footprint limits our exposure to negative events that may occur in a particular area or crop. Additionally, we believe that acquisition opportunities will continue to be strong.
Our business is also impacted by the demand for construction equipment for use in private and government commercial, residential and infrastructure construction; demolition; maintenance; mining; energy and forestry operations. CNH and industry reports show that demand for construction equipment in our markets is driven by several factors, one of which is public infrastructure spending, including roads and highways, sewer and water. Any growth in federal allocations to public infrastructure spending over the next few years should positively impact our future results of operations. Likewise, any decline in federal allocations to public infrastructure spending over the next few years should negatively impact our future results of operations. To address the uncertainty of the construction industry, we expect to continue our focus on the agriculture industry and acquisition opportunities to establish additional locations in the markets where we believe the local construction industry will maintain its current level or grow.
Seasonality
Our quarterly operating results are subject to fluctuation due to varying weather patterns, which may impact the timing and amount of equipment purchases, rentals, and after-sales parts and service purchases by our Agriculture and Construction customers.
Economic Cyclicality
Sales of agricultural equipment historically have fluctuated with general farm economic trends, primarily driven by farm cash receipts. Sales of construction equipment historically have fluctuated with general economic cycles. During economic downturns, construction equipment retailers tend to experience similar periods of decline and recession as the general economy.
Credit Market Changes
Changes in credit markets can affect our customers' ability and willingness to make capital expenditures, including purchasing our equipment. Creditors tightened their lending standards following the collapse of the sub-prime mortgage market and these conditions may still be continuing in some areas. These tightened lending standards may have a negative impact on our business if our customers are unable to obtain financing for equipment purchases. However, if retail interest rates remain low, our business may be positively affected by customers who find financing purchases of our equipment more attractive due to lower borrowing costs. Our business is also particularly dependent on our access
32
to credit markets to finance acquisitions and manage inventory. Continued tightened lending standards may make it more difficult for us to obtain financing on commercially reasonable terms. We cannot predict what future changes will occur in credit markets or how these changes will impact our business.
Inflation
Inflation has not had a material impact upon operating results and we do not expect it to have such an impact in the future. To date, in those instances in which we have experienced cost increases, we have been able to increase selling prices to offset such increases. There can be no assurance, however, that our business will not be affected by inflation or that we can continue to increase our selling prices to offset increased costs and remain competitive.
Acquisitions
We have a successful history of growth through acquisitions. Since January 1, 2003, we have completed 34 acquisitions consisting of 75 stores operating in seven states. These acquisitions have been the most significant factor affecting our results of operations and liquidity over the last several years, as noted in the period-to-period comparisons below. We expect that acquisitions will continue to be an important component of our growth. Acquisitions are typically financed with floorplan debt, long-term debt and cash from operations. Although we cannot quantify the impact of any such potential acquisitions, we believe the nature of their impact on our financial statements to be similar to that experienced with our prior acquisitions as noted in our discussions of period comparisons.
The following is a summary of acquisitions completed during the identified periods.
Fiscal 2012
- •
- On February 28, 2011, we acquired certain assets of Tri-State Implement, Inc., resulting in the
addition of one store in Sioux Falls, South Dakota.
- •
- On March 31, 2011, we acquired all of the outstanding stock of Schoffman's Inc., resulting in the addition of one
store in Redwood Falls, Minnesota.
- •
- On April 1, 2011, we acquired certain assets of ABC Rental & Equipment Sales, an independent rental yard company. The acquisition consists of four stores in Williston, North Dakota, and Bozeman, Missoula, and Big Sky, Montana. The locations in Williston, Bozeman, and Missoula will consolidate with the Titan Machinery existing Case Construction stores in their respective markets.
Fiscal 2011
- •
- On June 1, 2010, we acquired certain assets of Hubbard Implement, Inc., resulting in the addition of one store in
Iowa Falls, Iowa.
- •
- On December 31, 2010, we acquired certain assets of Fairbanks International Inc., resulting in the addition of six stores in Grand Island, Kearney, Lexington, Holdrege, Hastings, and North Platte, Nebraska.
Fiscal 2010
- •
- On May 1, 2009, we acquired all of the outstanding stock of Winger Implement, Inc., resulting in the addition of one store in Winger, Minnesota. We subsequently merged Winger Implement, Inc. into our company.
33
- •
- On May 28, 2009, we acquired certain assets of Arthur Mercantile Company, resulting in the addition of one store in
Arthur, North Dakota. James L. Williams, Arthur Mercantile Company's President and Treasurer, is a Titan Machinery director.
- •
- On June 30, 2009, we acquired certain assets of Valley Equipment, Inc., resulting in the addition of one store in
Mayville, North Dakota. James L. Williams, Valley Equipment, Inc.'s President, is a Titan Machinery director.
- •
- On August 14, 2009, we acquired certain assets of Lickness Bros. Implement Co., resulting in the addition of one
store in Britton, South Dakota.
- •
- On November 2, 2009, we acquired certain assets of Oskaloosa Implement Co., resulting in the addition of two stores
located in Pella and Oskaloosa, Iowa.
- •
- On November 2, 2009, we acquired all of the outstanding stock of Valley Farm Equipment, Inc., resulting in the addition of one store in Milbank, South Dakota. We subsequently merged Valley Farm Equipment, Inc. into our company.
Fiscal 2009
- •
- On December 31, 2008, we acquired certain assets of WP Rentals LLC and all of the outstanding stock of Western
Plains Machinery Co., resulting in the addition of three rental stores located in Billings and Belgrade, Montana and Cheyenne, Wyoming, and six construction equipment stores located in Billings, Great
Falls, Missoula, and Columbia Falls, Montana and Casper and Gillette, Wyoming. We subsequently merged Western Plains Machinery Co. into our company.
- •
- On December 22, 2008, we acquired all of the outstanding stock of Anderson Power and Equipment, Inc., resulting in
the addition of one store in Thief River Falls, Minnesota. We subsequently merged Anderson Power and Equipment, Inc. into our company.
- •
- On October 1, 2008, we acquired certain assets of Pioneer Garage, Inc., resulting in the addition of three stores
located in Pierre, Highmore, and Miller, South Dakota.
- •
- On September 12, 2008, we acquired certain assets of Wolf's Farm Equipment Inc., resulting in the addition of one
store in Kintyre, North Dakota.
- •
- On May 28, 2008, we acquired certain assets of Mid-Land Equipment Company, resulting in the addition of
six stores located in Des Moines, Davenport, Clear Lake and Cedar Rapids, Iowa and Omaha and Lincoln, Nebraska.
- •
- On May 1, 2008, we acquired all of the outstanding stock of Quad County Implement, Inc., resulting in the addition
of one store in Blairstown, Iowa. We subsequently merged Quad County Implement, Inc. into our company.
- •
- On February 1, 2008, we acquired certain assets of Ceres Equipment Inc., resulting in the addition of one store in Roseau, Minnesota.
Critical Accounting Policies and Estimates
During the preparation of our financial statements, we are required to make estimates, assumptions and judgments that affect reported amounts. These estimates, assumptions and judgments include those related to bad debts and credit sales, inventories, goodwill and intangibles, income taxes and legal proceedings, revenue recognition, allowance for doubtful accounts, inventory reserves, incentive plan accruals, deferred taxes, stock-based compensation, and accounting for business combinations. We update these estimates, assumptions and judgments as appropriate, which in most cases is at least quarterly. We use our technical accounting knowledge, cumulative business experience,
34
judgment and other factors in the selection and application of our accounting policies. While we believe the estimates, assumptions and judgments we use in preparing our financial statements are appropriate, they are subject to factors and uncertainties regarding their outcome and therefore, actual results may materially differ from these estimates. We believe the following are our primary critical accounting policies and estimates.
Revenue Recognition
Revenue on equipment sales is recognized upon receipt of a signed contract and delivery of product to customers. Revenue on parts sales is recognized upon delivery of product to customers. Rental and service revenue is recognized at the time the related services are provided. In addition to outright sales of new and used equipment, certain rental agreements may include rent-to-purchase options. Under these agreements, customers are given a period of time to exercise an option to purchase the related equipment, with a portion of the rental payments being applied to the purchase price. Any such equipment is included in inventory until the purchase option is exercised. Payments received during the rental period are recorded as customer deposits, with equipment sales revenue being recognized upon the exercise of the purchase option.
Inventories
New and used equipment are stated at the lower of cost (specific identification) or market value with adjustments for decreases in market value on inventory rented but available for sale being a percentage of the rental income received on such inventory. All used equipment inventories and certain new equipment inventories, including that which has been rented, is subject to periodic lower of cost or market evaluation. Parts inventories are valued at the lower of average cost or market value. An estimate of parts inventories not expected to be sold in the next year has been reported separately, which is based on historical sales of parts on hand. Typically, there are no freight-in charges, except in cases of special orders where such freight-in charges are included in the cost of inventory. Work in process is valued at the retail rates of labor incurred and parts inventories used on service work in process at year end.
Intangible Assets and Goodwill
Intangible assets with a finite life consist of customer relationships and covenants not to compete, and are carried at cost less accumulated amortization. We amortize the cost of identified intangible assets on a straight-line basis over the expected period of benefit, which is three years for customer relationships and the contractual term for covenants not to compete, which range from five to ten years. In accordance with the guidance for impairment of long-lived assets in ASC 360-10—Property, Plant, and Equipment—Overall, we review intangible assets that have finite useful lives when an event occurs indicating the potential for earlier impairment. We measure impairment losses related to long-lived assets based on the amount by which the carrying amounts of these assets exceed their fair values. We measure fair value under ASC 360-10, which is generally based on the sum of the undiscounted future cash flows.
Intangible assets with an indefinite life consist of distribution rights with manufacturers. We classify distribution rights as indefinite lived intangible assets as our distribution agreements continue indefinitely by their terms, or are routinely awarded or renewed without substantial cost to us or material modifications to the underlying agreements. As such, we believe that its distribution agreements will contribute to cash flows for an indefinite period, therefore the carrying amount of distribution rights is not amortized. We test distribution rights for impairment annually, or more frequently upon the occurrence of an event or when circumstances indicate that its carrying amount is greater than its fair value. The impairment test is performed by comparing the carrying value to its fair value. Fair value is calculated by discounting the estimated future cash flows of the respective store or
35
group of stores associated with the business combination in which we obtained the distribution rights. As of January 31, 2011, the carrying value of our distribution rights was not considered impaired.
Goodwill represents the excess of costs over the fair value of the assets of businesses acquired not allocable to separately identifiable intangible assets. Goodwill acquired in business combinations is assigned to its related reporting unit, which consist of our operating segments. Goodwill is not amortized, but is tested for impairment at the end of our fiscal year, or more frequently upon the occurrence of an event or when circumstances indicate that a reporting unit's carrying amount of goodwill is greater than its fair value. The goodwill impairment test is performed by comparing the carrying value of the reporting unit to its fair value. Fair value is calculated by discounting the estimated future cash flows of our reporting units. As of January 31, 2011, the carrying value of our goodwill was not considered impaired.
Income Taxes
Income taxes are provided for the tax effects of transactions reported in the financial statements and consist of taxes currently due plus deferred taxes related primarily to differences between the basis of receivables, inventory, property and equipment, intangible assets, stock-based compensation, and accrued expenses for financial and income tax reporting. The deferred tax assets and liabilities represent the future tax return consequences of those differences, which will either be taxable or deductible when the assets and liabilities are recovered or settled. Our policy is to recognize interest expense and penalties related to income tax matters within our provision for income taxes. We perform a comprehensive review of our portfolio of uncertain tax positions in accordance with the requirements and recognition standards established by Financial Accounting Standards Board ("FASB") Accounting Standards Codification ("ASC") 740, Income Taxes. Pursuant to this guidance, an uncertain tax position represents our expected treatment of a tax position taken, or expected to be taken, in a tax return, that has not been reflected in measuring income tax expense for financial reporting purposes.
Stock-Based Compensation
We account for stock-based compensation in accordance with the provisions of the ASC 718, Compensation—Stock Compensation. This guidance requires that stock-based compensation, which includes stock options and restricted stock, be accounted for at the fair value of the applicable equity instrument.
Business Combinations
We account for business combinations in accordance with the provisions of ASC 805, Business Combinations. This guidance allows the acquirer to finalize the acquisition accounting during the measurement period, which may not exceed one year from the date of acquisition. During the measurement period the Company's accounting for the business combination transaction may be based on estimates due to various unknown factors present at the date of acquisition.
Key Financial Metrics
In addition to tracking our sales and expenses to evaluate our operational performance, we also monitor certain key financial metrics, including absorption and same-store sales.
Absorption
Absorption is an industry term that refers to the percentage of an equipment dealer's fixed operating expense covered by the gross margin of its combined parts and service businesses. Absorption in a given period is calculated by dividing our gross profit from parts and service sales in the period by the difference between (i) our operating expenses (including interest on floorplan notes) and (ii) our
36
variable expense of sales commissions on equipment sales and incentive compensation in the same period. We believe that absorption is an important management metric because during economic down cycles our customers tend to postpone new and used equipment purchases while continuing to run, maintain and repair their existing equipment. Thus, operating at a high absorption rate enables us to operate profitably throughout economic down cycles. We measure and track absorption on a company-wide basis as well as on a per store basis. Our company-wide absorption rate was 75.0%, 75.4% and 75.7% for fiscal years 2011, 2010 and 2009, respectively.
Same-Store Sales
Same-store sales for any period represent sales by stores that were part of our company for the entire comparable period in the preceding fiscal year. We do not distinguish relocated or newly-expanded stores in this same-store analysis. Closed stores are excluded from the same-store analysis. We believe that tracking this metric is important to evaluating the success of the Titan Operating Model on a comparable basis.
Key Financial Statement Components
Revenue
Equipment. We derive equipment revenue from the sale of new and used agricultural and construction equipment.
Parts. We derive parts revenue from the sale of parts for equipment that we sell, as well as for other equipment makes. Our parts sales provide us with a relatively stable revenue stream that is less sensitive to the economic cycles that affect our equipment sales.
Services. We derive services revenue from maintenance and repair services to our customers' equipment. Our repair and maintenance services provide a high-margin, relatively stable source of revenue through changing economic cycles.
Other. We derive other revenue from equipment rentals and ancillary equipment support activities such as equipment transportation, GPS signal subscriptions and reselling finance and insurance products.
Cost of Revenue
Equipment. Cost of equipment revenue is the lower of the acquired cost or the market value of the specific piece of equipment sold.
Parts. Cost of parts revenue is the lower of the acquired cost or the market value of the parts sold, based on average costing.
Service. Cost of service revenue represents costs attributable to services provided for the maintenance and repair of customer-owned equipment and equipment then on-rent by customers.
Other. Costs of other revenue represent costs associated with equipment rental, providing transportation, hauling, parts freight, GPS subscriptions and damage waivers, including, among other items, drivers' wages, fuel costs, shipping costs and our costs related to damage waiver policies.
Operating Expenses
Our operating expenses include sales and marketing expenses, sales commissions (which generally are based upon equipment gross profit margins), payroll and related benefit costs, insurance expenses,
37
professional fees, property rental and related costs, property and other taxes, administrative overhead, and depreciation associated with property and equipment (other than rental equipment).
Floorplan Interest
The cost of financing inventory is an important factor affecting our results of operations. Floorplan financing from CNH Capital and our Credit Agreement represent the primary sources of financing for equipment inventories. CNH regularly offers interest-free periods as well as additional incentives and special offers. As of January 31, 2011, approximately 48% of our floorplan notes payable was non-interest bearing.
Other Interest Expense
Interest expense represents the interest on our outstanding debt instruments, other than floorplan financing facilities.
Results of Operations
Comparative financial data for each of our four sources of revenue for fiscal 2011, 2010, and 2009 are expressed below. The results of these periods include the operating results of the acquisitions made during these periods. The period-to-period comparisons included below are not necessarily indicative of future results. Information regarding segment revenue and income (loss) before income taxes is presented for each period following our discussion of the consolidated results of operations. Additional information regarding our segments is included in Note 16 of our audited financial statements.
| |
Year Ended January 31, | ||||||||||
|---|---|---|---|---|---|---|---|---|---|---|---|
| |
2011 | 2010 | 2009 | ||||||||
| |
(dollars in thousands) |
||||||||||
Equipment |
|||||||||||
Revenue |
$ | 855,443 | $ | 643,186 | $ | 540,307 | |||||
Cost of revenue |
773,060 | 578,411 | 478,324 | ||||||||
Gross profit |
$ | 82,383 | $ | 64,775 | $ | 61,983 | |||||
Gross profit margin |
9.6 | % | 10.1 | % | 11.5 | % | |||||
Parts |
|||||||||||
Revenue |
$ | 140,982 | $ | 119,509 | $ | 94,984 | |||||
Cost of revenue |
100,281 | 83,219 | 67,270 | ||||||||
Gross profit |
$ | 40,701 | $ | 36,290 | $ | 27,714 | |||||
Gross profit margin |
28.9 | % | 30.4 | % | 29.2 | % | |||||
Service |
|||||||||||
Revenue |
$ | 74,506 | $ | 58,983 | $ | 44,224 | |||||
Cost of revenue |
27,767 | 21,615 | 16,729 | ||||||||
Gross profit |
$ | 46,739 | $ | 37,368 | $ | 27,495 | |||||
Gross profit margin |
62.7 | % | 63.4 | % | 62.2 | % | |||||
Other, including trucking and rental |
|||||||||||
Revenue |
$ | 23,558 | $ | 17,103 | $ | 10,922 | |||||
Cost of revenue |
18,813 | 14,441 | 8,245 | ||||||||
Gross profit |
$ | 4,745 | $ | 2,662 | $ | 2,677 | |||||
Gross profit margin |
20.1 | % | 15.6 | % | 24.5 | % | |||||
38
The following table sets forth our statements of operations data expressed as a percentage of revenue for the periods indicated.
| |
Year Ended January 31, | ||||||||||
|---|---|---|---|---|---|---|---|---|---|---|---|
| |
2011 | 2010 | 2009 | ||||||||
Revenue |
|||||||||||
Equipment |
78.2 | % | 76.8 | % | 78.2 | % | |||||
Parts |
12.9 | % | 14.2 | % | 13.8 | % | |||||
Service |
6.7 | % | 7.0 | % | 6.4 | % | |||||
Other, including trucking and rental |
2.2 | % | 2.0 | % | 1.6 | % | |||||
Total revenue |
100.0 | % | 100.0 | % | 100.0 | % | |||||
Total cost of revenue |
84.1 | % | 83.2 | % | 82.6 | % | |||||
Gross profit |
15.9 | % | 16.8 | % | 17.4 | % | |||||
Operating expenses |
11.9 | % | 13.0 | % | 12.6 | % | |||||
Income from operations |
4.0 | % | 3.8 | % | 4.8 | % | |||||
Other income (expense) |
(0.6 | )% | (0.6 | )% | (0.4 | )% | |||||
Income before income taxes |
3.4 | % | 3.2 | % | 4.4 | % | |||||
Provision for income taxes |
(1.4 | )% | (1.3 | )% | (1.8 | )% | |||||
Net income |
2.0 | % | 1.9 | % | 2.6 | % | |||||
Fiscal Year Ended January 31, 2011 Compared to Fiscal Year Ended January 31, 2010
Consolidated Results
Revenue
| |
Fiscal Year Ended January 31, 2011 |
Fiscal Year Ended January 31, 2010 |
Increase | Percent Change |
||||||||||
|---|---|---|---|---|---|---|---|---|---|---|---|---|---|---|
| |
|
(dollars in thousands) |
|
|
||||||||||
Equipment |
$ | 855,443 | $ | 643,186 | $ | 212,257 | 33.0 | % | ||||||
Parts |
140,982 | 119,509 | 21,473 | 18.0 | % | |||||||||
Service |
74,506 | 58,983 | 15,523 | 26.3 | % | |||||||||
Other, including trucking and rental |
23,558 | 17,103 | 6,455 | 37.7 | % | |||||||||
Total Revenue |
$ | 1,094,489 | $ | 838,781 | $ | 255,708 | 30.5 | % | ||||||
The increase in revenue was primarily due to acquisitions contributing to fiscal 2011 revenue and same-store sales growth. The acquired stores contributed $68.6 million in additional total revenue, while the same-store sales growth contributed $187.1 million, an increase of 23.1% over the prior year. This revenue growth was achieved in both our Agriculture and Construction segments.
Cost of Revenue
| |
Fiscal Year Ended January 31, 2011 |
Fiscal Year Ended January 31, 2010 |
Increase | Percent Change |
||||||||||
|---|---|---|---|---|---|---|---|---|---|---|---|---|---|---|
| |
|
(dollars in thousands) |
|
|
||||||||||
Equipment |
$ | 773,060 | $ | 578,411 | $ | 194,649 | 33.7 | % | ||||||
Parts |
100,281 | 83,219 | 17,062 | 20.5 | % | |||||||||
Service |
27,767 | 21,615 | 6,152 | 28.5 | % | |||||||||
Other, including trucking and rental |
18,813 | 14,441 | 4,372 | 30.3 | % | |||||||||
Total cost of revenue |
$ | 919,921 | $ | 697,686 | $ | 222,235 | 31.9 | % | ||||||
39
The increase in cost of revenue was primarily due to increased revenue. Acquisitions contributed $58.1 million of the increase in total cost of revenue, while same-store sales growth contributed $164.1 million. As a percentage of revenue, cost of revenue was 84.1% for fiscal 2011 compared to 83.2% for fiscal 2010.
Gross Profit
| |
Fiscal Year Ended January 31, 2011 |
Fiscal Year Ended January 31, 2010 |
Increase/ (Decrease) |
Percent Change |
|||||||||||
|---|---|---|---|---|---|---|---|---|---|---|---|---|---|---|---|
| |
|
(dollars in thousands) |
|
|
|||||||||||
Gross Profit |
|||||||||||||||
Equipment |
$ | 82,383 | $ | 64,775 | $ | 17,608 | 27.2 | % | |||||||
Parts |
40,701 | 36,290 | 4,411 | 12.2 | % | ||||||||||
Service |
46,739 | 37,368 | 9,371 | 25.1 | % | ||||||||||
Other, including trucking and rental |
4,745 | 2,662 | 2,083 | 78.2 | % | ||||||||||
Total Gross Profit |
$ | 174,568 | $ | 141,095 | $ | 33,473 | 23.7 | % | |||||||
Gross Profit Margin |
|||||||||||||||
Equipment |
9.6 | % | 10.1 | % | (0.5 | )% | (5.0 | )% | |||||||
Parts |
28.9 | % | 30.4 | % | (1.5 | )% | (4.9 | )% | |||||||
Service |
62.7 | % | 63.4 | % | (0.7 | )% | (1.1 | )% | |||||||
Other, including trucking and rental |
20.1 | % | 15.6 | % | 4.5 | % | 28.8 | % | |||||||
Total Gross Profit Margin |
15.9 | % | 16.8 | % | (0.9 | )% | (5.4 | )% | |||||||
Gross Profit Mix |
|||||||||||||||
Equipment |
47.2 | % | 45.9 | % | 1.3 | % | 2.8 | % | |||||||
Parts |
23.3 | % | 25.7 | % | (2.4 | )% | (9.3 | )% | |||||||
Service |
26.8 | % | 26.5 | % | 0.3 | % | 1.1 | % | |||||||
Other, including trucking and rental |
2.7 | % | 1.9 | % | 0.8 | % | 42.1 | % | |||||||
Total Gross Profit Mix |
100.0 | % | 100.0 | % | 0.0 | % | 0.0 | % | |||||||
The increase in gross profit was primarily due to increased revenue. Acquisitions contributed $10.5 million of the increase in total gross profit, while same-store sale gross profits provided the remaining $23.0 million. Offsetting the positive effect to gross profits of higher revenue was compression on our equipment margins, which was caused by market pricing pressures throughout much of fiscal 2011, but improved towards the end of the year due to increased market demand and an increase in the amount earned under manufacturer incentive programs, as compared to the prior year.
Operating Expenses
| |
Fiscal Year Ended January 31, 2011 |
Fiscal Year Ended January 31, 2010 |
Increase | Percent Change |
|||||||||
|---|---|---|---|---|---|---|---|---|---|---|---|---|---|
| |
|
(dollars in thousands) |
|
|
|||||||||
Operating expenses |
$ | 130,541 | $ | 108,998 | $ | 21,543 | 19.8 | % | |||||
Operating expenses as a percentage of revenue |
11.9 | % | 13.0 | % | (1.1 | )% | (8.5 | )% | |||||
The increase in operating expenses was primarily due to the additional costs associated with acquisitions, such as compensation, rent, and depreciation. As a percentage of total revenue, operating expenses decreased to 11.9% in fiscal 2011 as compared to 13.0% in fiscal 2010 due to improve fixed operating cost leverage resulting from higher revenues.
40
Other Income (Expense)
| |
Fiscal Year Ended January 31, 2011 |
Fiscal Year Ended January 31, 2010 |
Increase/ (Decrease) |
Percent Change |
|||||||||
|---|---|---|---|---|---|---|---|---|---|---|---|---|---|
| |
|
(dollars in thousands) |
|
|
|||||||||
Interest and other income |
$ | 1,794 | $ | 1,843 | $ | (49 | ) | (2.7 | )% | ||||
Floorplan interest expense |
(7,223 | ) | (5,485 | ) | 1,738 | 31.7 | % | ||||||
Interest expense |
(1,361 | ) | (1,463 | ) | (102 | ) | (7.0 | )% | |||||
Interest and other income for the years ended January 31, 2011 and 2010 were positively impacted by a manufacturer incentive earned in both years. The increase in floorplan interest expense of $1.7 million was due to the increase in floorplan notes payable balances as compared to fiscal 2010, offset by reductions in interest rates. We expect floorplan interest expense in fiscal 2012 to be positively impacted by lower interest rates associated with our new Credit Agreement entered into on October 31, 2010.
Provision for Income Taxes
| |
Fiscal Year Ended January 31, 2011 |
Fiscal Year Ended January 31, 2010 |
Increase | Percent Change |
|||||||||
|---|---|---|---|---|---|---|---|---|---|---|---|---|---|
| |
|
(dollars in thousands) |
|
|
|||||||||
Provision for income taxes |
$ | 14,895 | $ | 11,255 | $ | 3,640 | 32.3 | % | |||||
Our effective tax rate decreased from 41.7% in fiscal 2010 to 40.0% in fiscal 2011. The decrease in the effective tax rate from the prior year primarily reflects a decrease in the effect of permanent differences between financial and income tax reporting, such as incentive stock options, and reconciliation of differences between estimates used in our fiscal 2010 income tax accrual and actual amounts reported in our fiscal 2010 income tax return.
Segment Results
| |
Fiscal Year Ended January 31, 2011 |
Fiscal Year Ended January 31, 2010 |
Increase/ (Decrease) |
Percent Change |
|||||||||
|---|---|---|---|---|---|---|---|---|---|---|---|---|---|
| |
|
(dollars in thousands) |
|
|
|||||||||
Revenues |
|||||||||||||
Agriculture |
$ | 979,016 | $ | 751,258 | $ | 227,758 | 30.3 | % | |||||
Construction |
152,646 | 116,361 | 36,285 | 31.2 | % | ||||||||
Segment revenues |
1,131,662 | 867,619 | 264,043 | 30.4 | % | ||||||||
Eliminations |
(37,173 | ) | (28,838 | ) | (8,335 | ) | (28.9 | )% | |||||
Total |
$ | 1,094,489 | $ | 838,781 | $ | 255,708 | 30.5 | % | |||||
Income (Loss) Before Income Taxes |
|||||||||||||
Agriculture |
$ | 44,083 | $ | 36,133 | $ | 7,950 | 22.0 | % | |||||
Construction |
(3,451 | ) | (6,837 | ) | 3,386 | 49.5 | % | ||||||
Segment income (loss) before income taxes |
40,632 | 29,296 | 11,336 | 38.7 | % | ||||||||
Shared Resources |
(3,133 | ) | (2,120 | ) | (1,013 | ) | (47.8 | )% | |||||
Eliminations |
(262 | ) | (184 | ) | (78 | ) | (42.4 | )% | |||||
Income before income taxes |
$ | 37,237 | $ | 26,992 | $ | 10,245 | 38.0 | % | |||||
41
Agriculture
Agriculture revenues for fiscal 2011 increased 30.3% compared to fiscal 2010. The revenue increase was primarily due to acquisitions and an Agriculture same-store sales increase of 22.8% over fiscal 2010. The same-store sales growth was primarily caused by increased farm cash receipts and favorable harvest conditions and crop yield reports across our footprint.
Agriculture income before income tax increased 22.0% in fiscal 2011 primarily due to higher revenues. Offsetting the positive effect to gross profits of higher revenue was compression on our equipment margins and higher floorplan interest expense, as compared to fiscal 2010. The compression on our equipment margins, which was caused by market pricing pressures throughout much of fiscal 2011, improved towards the end of the year due to increased market demand and an increase in the amount earned under manufacturer incentive programs, as compared to the prior year. Floorplan interest expense increased due to increased floorplan notes payable balances, partially offset by lower interest rates, compared to fiscal 2010. We expect floorplan interest expense in fiscal 2012 to be positively impacted by lower interest rates associated with our new Credit Agreement entered into on October 31, 2010.
Construction
Fiscal 2011 Construction revenues increased 31.2% compared to fiscal 2010. The revenue increase was primarily due to new store openings and a Construction same-store sales increase of 24.8% as compared to fiscal 2010. A major factor contributing to our increased revenue was the continued execution of our fiscal 2011 Construction business action plan, which included changing key Construction personnel and implementing the Titan Operating Model in the Construction stores acquired in fiscal 2009.
Loss before income taxes decreased 49.5% primarily due to higher Construction segment gross profits resulting from increased revenues, offset by higher interest expense resulting from increased long-term debt associated with rental fleet, as compared to fiscal 2010. Also contributing to the loss was $0.3 million in exit costs related to the closing of our store in Columbia Falls, Montana. We expect interest expense in fiscal 2012 to be positively impacted by lower interest rates associated with our new Credit Agreement entered into on October 31, 2010.
Shared Resources/Eliminations
We incur centralized expenses/income at our general corporate level, which we refer to as "Shared Resources", and then allocate these net expenses to our segments. Since these allocations are set early in the year, unallocated balances may occur.
Eliminations remove any inter-company revenues or income before tax residing in our segment results.
42
Fiscal Year Ended January 31, 2010 Compared to Fiscal Year Ended January 31, 2009
Consolidated Results
Revenue
| |
Fiscal Year Ended January 31, 2010 |
Fiscal Year Ended January 31, 2009 |
Increase | Percent Change |
||||||||||
|---|---|---|---|---|---|---|---|---|---|---|---|---|---|---|
| |
|
(dollars in thousands) |
|
|
||||||||||
Equipment |
$ | 643,186 | $ | 540,307 | $ | 102,879 | 19.0 | % | ||||||
Parts |
119,509 | 94,984 | 24,525 | 25.8 | % | |||||||||
Service |
58,983 | 44,224 | 14,759 | 33.4 | % | |||||||||
Other, including trucking and rental |
17,103 | 10,922 | 6,181 | 56.6 | % | |||||||||
Total Revenue |
$ | 838,781 | $ | 690,437 | $ | 148,344 | 21.5 | % | ||||||
The increase in revenue was primarily due to acquisitions contributing to fiscal 2010 revenue and same-store sales growth. The acquired stores contributed $117.0 million in additional total revenue, while the same-store sales growth contributed $31.3 million, an increase of 4.9% over the prior year. The same-store sales increase was driven by strong Agriculture segment sales offset by declines in our Construction segment. Revenue increases over the prior year in parts, service and other outpaced the increase in equipment revenue primarily due to a weak construction equipment market in fiscal 2010.
Cost of Revenue
| |
Fiscal Year Ended January 31, 2010 |
Fiscal Year Ended January 31, 2009 |
Increase | Percent Change |
||||||||||
|---|---|---|---|---|---|---|---|---|---|---|---|---|---|---|
| |
|
(dollars in thousands) |
|
|
||||||||||
Equipment |
$ | 578,411 | $ | 478,324 | $ | 100,087 | 20.9 | % | ||||||
Parts |
83,219 | 67,270 | 15,949 | 23.7 | % | |||||||||
Service |
21,615 | 16,729 | 4,886 | 29.2 | % | |||||||||
Other, including trucking and rental |
14,441 | 8,245 | 6,196 | 75.1 | % | |||||||||
Total cost of revenue |
$ | 697,686 | $ | 570,568 | $ | 127,118 | 22.3 | % | ||||||
The increase in cost of revenue was primarily due to increased revenue. Acquisitions contributed $97.7 million of the increase in total cost of revenue, while same-store sales growth contributed $29.4 million. As a percentage of revenue, cost of revenue was 83.2% for fiscal 2010 compared to 82.6% for fiscal 2009.
43
Gross Profit
| |
Fiscal Year Ended January 31, 2010 |
Fiscal Year Ended January 31, 2009 |
Increase/ (Decrease) |
Percent Change |
|||||||||||
|---|---|---|---|---|---|---|---|---|---|---|---|---|---|---|---|
| |
|
(dollars in thousands) |
|
|
|||||||||||
Gross Profit |
|||||||||||||||
Equipment |
$ | 64,775 | $ | 61,983 | $ | 2,792 | 4.5 | % | |||||||
Parts |
36,290 | 27,714 | 8,576 | 30.9 | % | ||||||||||
Service |
37,368 | 27,495 | 9,873 | 35.9 | % | ||||||||||
Other, including trucking and rental |
2,662 | 2,677 | (15 | ) | (0.6 | )% | |||||||||
Total Gross Profit |
$ | 141,095 | $ | 119,869 | $ | 21,226 | 17.7 | % | |||||||
Gross Profit Margin |
|||||||||||||||
Equipment |
10.1 | % | 11.5 | % | (1.4 | )% | (12.2 | )% | |||||||
Parts |
30.4 | % | 29.2 | % | 1.2 | % | 4.1 | % | |||||||
Service |
63.4 | % | 62.2 | % | 1.2 | % | 1.9 | % | |||||||
Other, including trucking and rental |
15.6 | % | 24.5 | % | (8.9 | )% | (36.3 | )% | |||||||
Total Gross Profit Margin |
16.8 | % | 17.4 | % | (0.6 | )% | (3.4 | )% | |||||||
Gross Profit Mix |
|||||||||||||||
Equipment |
45.9 | % | 51.7 | % | (5.8 | )% | (11.2 | )% | |||||||
Parts |
25.7 | % | 23.1 | % | 2.6 | % | 11.3 | % | |||||||
Service |
26.5 | % | 23.0 | % | 3.5 | % | 15.2 | % | |||||||
Other, including trucking and rental |
1.9 | % | 2.2 | % | (0.3 | )% | (13.6 | )% | |||||||
Total Gross Profit Mix |
100.0 | % | 100.0 | % | 0.0 | % | 0.0 | % | |||||||
The increase in gross profit was primarily due to increased revenue, somewhat offset by lower equipment margins. Acquisitions contributed $19.3 million of the increase in total gross profit, while same-store sale gross profits provided the remaining $1.9 million. Gross profit margins were 16.8% for fiscal 2010 compared to 17.4% for fiscal 2009. Fiscal 2009 Agriculture equipment margins were enhanced by a tight supply of equipment that did not recur in fiscal 2010. The return to more traditional supply conditions and inventory levels also resulted in increased equipment inventory valuation charges over the prior year. Fiscal 2010 also included a reduced manufacturer market share incentive payment as compared to the prior year. The decrease in "other" margins was primarily due to a lower utilization of rental fleet that resulted from a weak fiscal 2010 construction industry.
Operating Expenses
| |
Fiscal Year Ended January 31, 2010 |
Fiscal Year Ended January 31, 2009 |
Increase | Percent Change |
|||||||||
|---|---|---|---|---|---|---|---|---|---|---|---|---|---|
| |
|
(dollars in thousands) |
|
|
|||||||||
Operating Expenses |
$ | 108,998 | $ | 86,940 | $ | 22,058 | 25.4 | % | |||||
Operating expenses as a percentage of revenue |
13.0 | % | 12.6 | % | 0.4 | % | 3.2 | % | |||||
The increase in operating expenses was primarily due to the additional costs associated with acquisitions, such as compensation, rent, depreciation, travel and training. As a percentage of total revenue, operating expenses increased slightly to 13.0% in fiscal 2010 as compared to 12.6% in fiscal 2009. This increase from the prior year was due to the increased number of stores in our Construction segment, which have higher operating expenses as a percent of revenue, as well as lower revenues due to the challenging construction market, as compared to the same period of fiscal 2009.
44
Other Income (Expense)
| |
Fiscal Year Ended January 31, 2010 |
Fiscal Year Ended January 31, 2009 |
Increase | Percent Change |
|||||||||
|---|---|---|---|---|---|---|---|---|---|---|---|---|---|
| |
|
(dollars in thousands) |
|
|
|||||||||
Interest and other income |
$ | 1,843 | $ | 1,545 | $ | 298 | 19.3 | % | |||||
Floorplan interest expense |
(5,485 | ) | (3,240 | ) | 2,245 | 69.3 | % | ||||||
Interest expense |
(1,463 | ) | (729 | ) | 734 | 100.7 | % | ||||||
Interest and other income increased $0.3 million as we received a manufacturer financing incentive in the fourth quarter of fiscal 2010, offset by a decrease in interest income from investing our cash balances in highly secure investments in fiscal 2010 that carried lower interest rates than those earned in fiscal 2009. The increase in floorplan interest expense of $2.2 million was due to the increase in floorplan notes payable balances as compared to fiscal 2009, as well as increased interest rates. The increase in interest expense of $0.7 million resulted from higher long-term debt balances as compared to fiscal 2009.
Provision for Income Taxes
| |
Fiscal Year Ended January 31, 2010 |
Fiscal Year Ended January 31, 2009 |
Decrease | Percent Change |
|||||||||
|---|---|---|---|---|---|---|---|---|---|---|---|---|---|
| |
|
(dollars in thousands) |
|
|
|||||||||
Provision for income taxes |
$ | 11,255 | $ | 12,430 | $ | (1,175 | ) | (9.5 | )% | ||||
Our effective tax rate increased from 40.7% in fiscal 2009 to 41.7% in fiscal 2010. The increase in the effective tax rate from the prior year primarily reflects an increase in permanent differences between financial and income tax reporting, such as the increase in stock option expense over the prior year.
Segment Results
| |
Fiscal Year Ended January 31, 2010 |
Fiscal Year Ended January 31, 2009 |
Increase/ (Decrease) |
Percent Change |
|||||||||
|---|---|---|---|---|---|---|---|---|---|---|---|---|---|
| |
|
(dollars in thousands) |
|
|
|||||||||
Revenues |
|||||||||||||
Agriculture |
$ | 751,258 | $ | 624,035 | $ | 127,223 | 20.4 | % | |||||
Construction |
116,361 | 88,032 | 28,329 | 32.2 | % | ||||||||
Segment revenues |
867,619 | 712,067 | 155,552 | 21.8 | % | ||||||||
Eliminations |
(28,838 | ) | (21,630 | ) | (7,208 | ) | (33.3 | )% | |||||
Total |
$ | 838,781 | $ | 690,437 | $ | 148,344 | 21.5 | % | |||||
Income (Loss) Before Income Taxes |
|||||||||||||
Agriculture |
$ | 36,133 | $ | 32,023 | $ | 4,110 | 12.8 | % | |||||
Construction |
(6,837 | ) | 604 | (7,441 | ) | (1232.0 | )% | ||||||
Segment income (loss) before income taxes |
29,296 | 32,627 | (3,331 | ) | (10.2 | )% | |||||||
Shared Resources |
(2,120 | ) | (1,678 | ) | (442 | ) | (26.3 | )% | |||||
Eliminations |
(184 | ) | (444 | ) | 260 | 58.6 | % | ||||||
Income before income taxes |
$ | 26,992 | $ | 30,505 | $ | (3,513 | ) | (11.5 | )% | ||||
Agriculture
Fiscal 2010 Agriculture revenues increased 20.4% compared to fiscal 2009. The revenue increase was due to acquisitions and an Agriculture same-store sales increase of 8.2% over fiscal 2009. Income
45
before income tax increased 12.8% due to increased revenues, which generated additional gross profits and greater fixed operating expense utilization compared to the prior year. These increases were somewhat offset by lower Agriculture gross profit margins due to greater agriculture equipment supply and availability and a lower manufacturer market share incentive payment in the current year compared to fiscal 2009.
Construction
Fiscal 2010 Construction revenues increased 32.2% compared to fiscal 2009. The revenue increase was due to acquisitions offset by a Construction same-store sales decrease of 26.8% as compared to fiscal 2009. Both acquisition and same-store revenue were negatively impacted by a weak fiscal 2010 construction market. The lower Construction revenue drove the $7.4 million decrease in income (loss) before income taxes through lower gross profits and lower fixed operating expense utilization. Construction operating expense as a percent of sales was 23.7% in fiscal 2010 compared to 16.4% in fiscal 2009.
Shared Resources/Eliminations
We incur centralized expenses/income at our general corporate level, which we refer to as "Shared Resources", and then allocate these net expenses to our segments. Since these allocations are set early in the year, unallocated balances may occur. The Shared Resources amount increased $0.4 in fiscal 2010 compared to the prior year.
Eliminations remove any inter-company revenues or income before tax residing in our segment results.
Liquidity and Capital Resources
Cash Flow From Operating Activities
During fiscal 2011, cash flow used for operating activities was $35.0 million. Our cash flows from operations were primarily the result of our reported net income of $22.3 million and non-cash adjustments to net income for depreciation and amortization of $9.0 million and a net increase in accounts payable, customer deposits, accrued expenses and other long-term liabilities of $23.2 million. These operating cash inflows were principally offset by an increase in inventories of $63.1 million, a net increase in receivables, prepaid expenses and other assets of $19.9 million and a net decrease in floorplan notes payable of $13.0 million. The increase in inventories was primarily the result of our growth through acquisitions and inventory balances that reflect historical stocking levels.
During fiscal 2010, cash flow used for operating activities was $47.7 million. Our cash flows from operations were primarily the result of our reported net income of $15.7 million and non-cash adjustments to net income for depreciation and amortization of $8.0 million. These operating cash inflows were principally offset by an increase in inventories of $61.2 million, a net decrease in accounts payable, customer deposits, accrued expenses and other long-term liabilities of $6.6 million and a net decrease in floorplan notes payable of $3.7 million. The increase in inventories was primarily the result of our growth through acquisitions and inventory balances that reflect historical stocking levels.
During fiscal 2009, cash flow provided by operating activities was $4.2 million. Our cash flows from operations were primarily the result of our reported net income of $18.1 million, non-cash adjustments to net income for depreciation and amortization of $4.6 million, a net decrease in receivables, prepaid expenses and other assets of $7.0 million, an increase in floorplan notes payable of $5.4 million and a net increase in accounts payable, customer deposits, accrued expenses and other long-term liabilities of $3.8. These operating cash inflows were principally offset by an increase in inventories of $34.8 million.
46
The increase in inventories was primarily the result of our growth through acquisitions and purchasing to support our increased sales activity during fiscal 2009.
We evaluate our cash flow from operating activities net of all floorplan activity and short-term advances related to customer contracts in transit. Taking these adjustments into account, our non-GAAP cash flow provided by operating activities was $47.0 million, $4.6 million and $13.3 million, for fiscal 2011, 2010 and 2009, respectively. For reconciliation of this non-GAAP financial measure, please see the Non-GAAP Cash Flow Reconciliation below.
Cash Flow From Investing Activities
During fiscal 2011, cash used for investing activities was $48.4 million. Our cash used for investing activities primarily consisted of purchases of equipment dealerships (net of cash purchased) of $32.3 million and property and equipment purchases of $16.7 million.
During fiscal 2010, cash provided by investing activities was $25.7 million. Our cash provided by investing activities primarily consisted of net sales of U.S. treasury bills of $45.0 million, offset by purchases of equipment dealerships (net of cash purchased) of $7.3 million and property and equipment purchases of $12.4 million.
During fiscal 2009, cash used for investing activities was $87.3 million. Our cash used for investing activities primarily consisted of net purchases of U.S. treasury bills of $45.0 million following our follow-on common stock offering, purchases of equipment dealerships (net of cash purchased) of $35.5 million and property and equipment purchases of $7.2 million.
Cash Flow From Financing Activities
During fiscal 2011, cash provided by financing activities was $83.4 million. Cash provided by financing activities was primarily the result of an increase in our non-manufacturer floorplan notes payable of $82.4 million. During fiscal 2011, the increase in floorplan financing with non-manufacturers resulted from borrowings under our new Credit Agreement.
During fiscal 2010, cash provided by financing activities was $57.1 million. Cash provided by financing activities was primarily the result of an increase in our non-manufacturer floorplan notes payable of $51.4 million and proceeds from long-term debt exceeding principal payments by $4.8 million. During fiscal 2010, we increased our floorplan financing with non-manufacturers in order to take advantage of the lower interest rates offered by these entities.
During fiscal 2009, cash provided by financing activities was $81.3 million. Cash provided by financing activities was primarily the result of $78.8 million in net proceeds from our follow-on offering and an increase in our non-manufacturer floorplan notes payable of $9.1 million. Partially offsetting these proceeds were principal payments on long-term debt exceeding proceeds from long-term debt by $6.7 million.
Non-GAAP Cash Flow Reconciliation
Non-GAAP cash flow provided by (used for) operating activities is a non-GAAP financial measure which is adjusted for the following:
- •
- Non-manufacturer floorplan notes payable: We review our cash flow from operating activities to include all floorplan notes payable activity regardless of whether we obtain the financing from a manufacturer or a non-manufacturer. We consider inventory financing with both manufacturers and non-manufacturers to be part of the normal operations of our business and use the adjusted cash flow analysis in the evaluation of our inventory and inventory flooring needs. GAAP
47
- •
- Short-term advances related to customer contracts in transit: We review our cash flow from operating activities to include short-term advances related to customer contracts in transit. These advances are directly related to our contracts in transit and are considered part of our working capital. GAAP categorizes short-term advances related to customer contracts in transit as financing activities in the consolidated statement of cash flows.
categorizes non-manufacturer floorplan notes payable as financing activities in the consolidated statement of cash flows.
We believe that the presentation of non-GAAP cash flow provided by (used for) operating activities is relevant and useful to our investors because it provides information on activities we consider normal operations of our business, regardless of financing source. The following table reconciles net cash flow provided by (used for) operating activities, a GAAP measure, to non-GAAP cash flow provided by operating activities and net cash provided by financing activities, a GAAP measure, to non-GAAP cash flow provided by financing activities (in thousands):
| |
As Reported | Adjustment (1) |
Adjustment (2) |
Non-GAAP Measures |
|||||||||
|---|---|---|---|---|---|---|---|---|---|---|---|---|---|
Fiscal 2011: |
|||||||||||||
Net cash provided by (used for) operating activities |
$ | (35,008 | ) | $ | 82,371 | $ | (392 | ) | $ | 46,971 | |||
Net cash provided by financing activities |
83,383 | (82,371 | ) | 392 | 1,404 | ||||||||
Fiscal 2010: |
|||||||||||||
Net cash provided by (used for) operating activities |
$ | (47,661 | ) | $ | 51,448 | $ | 780 | $ | 4,567 | ||||
Net cash provided by financing activities |
57,069 | (51,448 | ) | (780 | ) | 4,841 | |||||||
Fiscal 2009: |
|||||||||||||
Net cash provided by operating activities |
$ | 4,215 | $ | 9,094 | $ | — | $ | 13,309 | |||||
Net cash provided by financing activities |
81,310 | (9,094 | ) | — | 72,216 | ||||||||
- (1)
- Net
change in non-manufacturer floorplan notes payable
- (2)
- Net change in short-term advances related to customer contracts in transit
Debt Facilities
Senior Secured Credit Facility. We currently have a Credit Agreement with the Wells Fargo Bank Syndicate. The Credit Agreement provides for a $175.0 million wholesale floorplan line of credit (the "Floorplan Line") and a $50.0 million working capital line of credit (the "Working Capital Line"), both of which expire October 31, 2014. The Credit Agreement has a variable interest rate on outstanding balances of LIBOR plus an applicable margin of 1.5% to 2.0% per annum, depending upon our consolidated leverage ratio, has a 0.2% to 0.4% non-usage fee on the average monthly unused amount and requires monthly payments of accrued interest. The Credit Agreement is secured by all our assets and contains certain financial covenants that impose a minimum level of fixed charge coverage ratio and a maximum level of debt to tangible net worth ratio and includes annual thresholds for acquisitions and capital expenditures. The Credit Agreement also restricts our ability to pay cash dividends to an amount not to exceed 50% of consolidated net income for the then trailing four quarters, so long as no default of event of default exists prior to or immediately following such action or otherwise results from such action. The Credit Agreement became effective on November 2, 2010.
The Floorplan Line is used to finance equipment inventory purchases. Amounts outstanding are recorded as floorplan notes payable, within current liabilities on the consolidated balance sheets as we intend to repay amounts borrowed within one year. As of January 31, 2011 we had $117.4 million outstanding on the Floorplan Line.
48
The Working Capital Line is used to finance our working capital requirements. Amounts outstanding will be recorded as long-term debt, within long-term liabilities on the consolidated balance sheets, as we do not have the intention or obligation to repay amounts borrowed within one year. As of January 31, 2011 we had $26.4 million outstanding on the Working Capital Line.
CNH Capital Credit Facility. We currently have a credit facility with CNH Capital that provides for an aggregate principal balance of up to $300.0 million for floorplan financing, the availability of which is reduced by outstanding floorplan notes payable, rental fleet financing and other acquisition-related financing arrangements with CNH Capital, as described below. Interest rates are currently equal to the prime rate plus 4% on new borrowings, subject to any interest-free periods offered by CNH Capital. The CNH Capital term loans and loans for certain purposes have interest rates equal to the prime rate plus 4% per annum. Cumulative and unpaid balance of advances under the CNH Capital credit facility accrues interest each month and requires monthly payments. The CNH Capital credit facility automatically renews on August 31 of each year through August 31, 2012, unless earlier terminated by either party. The CNH Capital credit facility is secured by the financed assets. As of January 31, 2011, we had approximately $171.4 million outstanding on the CNH Capital credit facility. The CNH Capital credit facility contains covenants that require the Company to maintain various financial ratio levels and to submit certain financial information. It also contains various restrictive covenants that require the prior consent of CNH Capital if we desire to engage in any acquisition of, or consolidation or merger with, any other business entity in which we are not the surviving company; create subsidiaries; move any collateral outside of the U.S.; or sell, rent, lease or otherwise dispose or transfer any of the collateral, other than in the ordinary course of business. CNH's consent is also required for the acquisition of any CNH dealership. In addition, the CNH Capital credit facility restricts our ability to incur any liens upon any substantial part of our assets.
Other Indebtedness with CNH Capital. CNH Capital periodically provides loans for fixed asset financing in connection with acquisitions. Related to this acquisition financing, we have various term loans with CNH Capital. The aggregate principal amount of these terms loans was approximately $0.2 million at January 31, 2011. We also obtained variable rate notes at the prime rate plus 4% per annum from CNH Capital, which are secured by our designated rental fleet. The amount of our rental fleet notes as of January 31, 2011, was $1.0 million.
Agricredit Credit Facility. We currently have a credit facility with Agricredit Acceptance LLC ("Agricredit") that provides for an aggregate principal balance of up to $75.0 million. The Agricredit credit facility may be used to purchase or refinance new and used equipment inventory. The interest rate on borrowings under the Agricredit credit facility is equal to the three-month LIBOR rate plus 5.25%. The Agricredit credit facility allows for increase, decrease or termination of the credit facility by Agricredit on 90 days notice. Under covenants of the Agricredit credit facility, the Company has agreed, among other things, to maintain various financial ratio levels, to submit certain financial information, and to obtain prior consent from Agricredit if the Company desires to engage in any acquisition meeting certain financial thresholds. The balances outstanding with Agricredit are secured by the related inventory. Repayment terms vary by individual notes, but generally payments are made from sales proceeds or rental revenue from the related inventories.
Sources of Liquidity
Our primary sources of liquidity are cash reserves, cash flow from operations, proceeds from the issuance of debt and borrowings under our credit facilities. We expect that ongoing requirements for debt service and capital expenditures will be funded from these sources.
49
Adequacy of Capital Resources
Our primary uses of cash have been to fund our strategic acquisitions, finance the purchase of inventory, meet debt service requirements and fund operating activities, working capital, payments due under building space operating leases and manufacturer floorplans payable. The primary factors affecting our ability to generate cash and to meet existing, known or reasonably likely cash requirements are the timing and extent of acquisitions and our operating performance as impacted by (i) industry factors, (ii) competition, (iii) general economic conditions and (iv) other business factors as identified in Item 1A "Risk Factors."
For fiscal 2011 and 2010, our cash expenditures on property and equipment were $16.7 million and $12.4 million, respectively, exclusive of acquisitions, transfers between equipment inventory and our designated rental fleet, and property and equipment purchased with long-term debt. Excluding cash expenditures on rental fleet equipment, cash expenditures on property and equipment was $13.3 million in fiscal 2011. We expect our property and equipment expenditures, exclusive of acquisitions, for fiscal 2012 to be approximately $13.0 to $15.0 million. The actual amount of our fiscal 2012 equipment expenditures will depend upon factors such as general economic conditions, growth prospects for our industry and our acquisition activity. We currently expect to finance equipment purchases with borrowings under the existing credit facilities, with available cash or with cash flow from operations. We may need to incur additional debt if we pursue any future acquisitions.
Our ability to service our debt will depend upon our ability to generate the necessary cash. This will depend on our future acquisitions activity, operating performance, general economic conditions, and financial, competitive, business and other factors, some of which are beyond our immediate control. Based on our current operational performance, we believe our cash flow from operations, available cash and available borrowings under the existing credit facilities will adequately provide our liquidity needs for, at a minimum, the next 12 months.
We cannot assure you, however, that our business will generate sufficient cash flow from operations or that future borrowings will be available under the credit facilities with the Wells Fargo Bank Syndicate and CNH Capital in amounts sufficient to allow us to service our indebtedness and to meet our other commitments. If we are unable to generate sufficient cash flow from operations or to obtain sufficient future borrowings, we may be required to seek one or more alternatives such as refinancing or restructuring our indebtedness, selling material assets or operations or seeking to raise additional debt or equity capital. We cannot assure you that we will be able to succeed with one of these alternatives on commercially reasonable terms, if at all. In addition, if we pursue strategic acquisitions, we may require additional equity or debt financing to consummate the transactions, and we cannot assure you that we will succeed in obtaining this financing on favorable terms or at all. If we incur additional indebtedness to finance any of these transactions, this may place increased demands on our cash flow from operations to service the resulting increased debt. Our existing debt agreements contain restrictive covenants that may restrict our ability to adopt any of these alternatives. Any non-compliance by us under the terms of our debt agreements could result in an event of default which, if not cured, could result in the acceleration of our debt.
Certain Information Concerning Off-Balance Sheet Arrangements
As of January 31, 2011, we did not have any relationships with unconsolidated entities or financial partnerships, such as entities often referred to as structured finance or special purpose entities, which would have been established for the purpose of facilitating off-balance sheet arrangements or other contractually narrow or limited purposes. We are, therefore, not exposed to any financing, liquidity, market or credit risk that could arise if we had engaged in these relationships. In the normal course of our business activities, we lease rental equipment under operating leases.
50
Contractual Obligation and Commercial Commitment Summary
Our contractual obligations and commercial commitments as of January 31, 2011 are summarized below:
| |
|
Payments Due By Period | |||||||||||||||
|---|---|---|---|---|---|---|---|---|---|---|---|---|---|---|---|---|---|
Contractual Obligations
|
Total | Less Than 1 Year |
1 to 3 Years | 3 to 5 Years | More Than 5 Years |
||||||||||||
| |
(in thousands) |
||||||||||||||||
Long-term debt obligations(1) |
$ | 41,097 | $ | 5,303 | $ | 6,420 | $ | 28,965 | $ | 409 | |||||||
Operating lease(2) |
80,168 | 11,305 | 20,132 | 18,302 | 30,429 | ||||||||||||
Other long-term liabilities(3) |
3,595 | — | 3,595 | — | — | ||||||||||||
Total |
$ | 124,860 | $ | 16,608 | $ | 30,147 | $ | 47,267 | $ | 30,838 | |||||||
- (1)
- Includes
obligations under notes payable issued in favor of our lenders and estimates of interest payable.
- (2)
- Includes
minimum lease payment obligations under operating leases related to our stores. Amounts do not include insurance or tax, which we include in our
operating expenses and which we estimate will be approximately $1.0 million for the less than 1 year period, $1.9 million for the 1-3 year period,
$1.8 million for the 3-5 year period, and $2.9 million for the more than 5 years period for a total of approximately $7.6 million. See Note 9 to
our audited financial statements for a description of our operating lease obligations.
- (3)
- Includes long-term portion of trade payables.
New Accounting Pronouncements
In December 2010, the FASB amended authoritative guidance on business combinations, codified in ASC 805, Business Combinations. This guidance clarifies that, when presenting comparative financial statements, registrants should disclose revenue and earnings of the combined entity as though the current period business combinations had occurred as of the beginning of the comparable prior annual reporting period. The guidance also expands the supplemental pro forma disclosures to include a description of the nature and amount of material, nonrecurring pro forma adjustments directly attributable to the business combination included in the reported pro forma revenue and earnings. ASU 2010-29 is effective prospectively for material (either on an individual or aggregate basis) business combinations entered into in fiscal years beginning on or after December 15, 2010 with early adoption permitted. We adopted this guidance on February 1, 2011 and do not expect it to have a material impact on our consolidated financial statements.
In December 2010, the FASB amended authoritative guidance on goodwill impairment testing, codified in ASC 305, Intangibles—Goodwill and Other. This guidance modifies Step 1 of the goodwill impairment test for reporting units with zero or negative carrying amounts, and requires performance of Step 2 of the goodwill impairment test for such reporting units if it is more likely than not that, when considering qualitative factors, an impairment exists. We adopted this guidance on February 1, 2011 and do not expect it to have a material impact on our consolidated financial statements.
In July 2010, the FASB issued authoritative guidance on financing receivables and the allowance for credit losses, codified in ASC 310, Receivables. This guidance amends the current disclosure requirements to provide a greater level of disaggregated information about the credit quality of an entity's financing receivables and its allowance for credit losses. The guidance also requires an entity to disclose credit quality indicators, past due information, and modifications of its financing receivables. We adopted this guidance in the quarter ended January 31, 2011. Its adoption did not have a material effect on our consolidated financial statements based on the nature of our receivables.
51
In January 2010, the FASB issued authoritative guidance on fair value measurements, codified in ASC 820, Fair Value Measurements and Disclosures. This guidance required additional disclosure of significant transfers in and out of Level 1 and Level 2 fair value measurements and activity in Level 3 fair value measurements. It also clarified existing disclosure requirements regarding level of disaggregation and valuation inputs and techniques. The guidance is effective for interim and annual reporting periods beginning after December 15, 2009, except for the disclosure of the Level 3 activity, which is effective for interim and fiscal years beginning after December 15, 2010. We adopted these provisions on February 1, 2010, except for the Level 3 activity disclosures, which we adopted on February 1, 2011. The adoption of the guidance did not have, and we do not expect the adoption of the Level 3 activity disclosures to have, a material impact on our consolidated financial statements.
In October 2009, the FASB issued authoritative guidance on revenue recognition, codified in ASC 605-25, Revenue Recognition. This guidance modifies the fair value requirements of revenue recognition on multiple element arrangements by allowing the use of the "best estimate of selling price" in addition to vendor specific objective evidence and third-party evidence for determining the selling price of a deliverable. This guidance establishes a selling price hierarchy for determining the selling price of a deliverable, which is based on: (a) vendor-specific objective evidence, (b) third-party evidence, or (c) estimates. In addition, the guidance eliminates the residual method of allocation and significantly expands the disclosure requirements for such arrangements. We adopted this guidance on February 1, 2011. Its adoption did not have a material effect on our consolidated financial statements.
In June 2009, the FASB issued authoritative guidance on the consolidation of variable interest entities ("VIEs"), codified in ASC 810, Consolidation. This guidance eliminates the exemption for qualifying special-purpose entities, amends the approach companies use to identify the VIEs for which they are deemed to be the primary beneficiary and are required to consolidate, and requires additional disclosure of an entity's involvement with a VIE. The guidance requires companies to perform ongoing reassessments of whether it is the primary beneficiary of a VIE. This assessment no longer includes the quantitative-based assessment, and instead requires a qualitative assessment of whether a company has the power to direct the VIE's activities that most significantly impact the company's economic performance and whether the entity has the obligation to absorb losses or the right to receive benefits that could be significant to the VIE. We adopted this guidance on February 1, 2010. Its adoption did not have a material effect on our consolidated financial statements.
In April 2009, the FASB issued authoritative guidance on the accounting and disclosure of assets acquired and liabilities assumed in a business combination that arise from contingencies, and subsequent accounting for these contingencies. This guidance was codified in ASC 805, Business Combinations. We adopted this guidance on February 1, 2010. Its adoption did not have a material effect on our consolidated financial statements based on the nature of the assets acquired and liabilities assumed in our business combinations.
Information Regarding Forward-Looking Statements
The Private Securities Litigation Reform Act of 1995 provides a "safe harbor" for forward-looking statements. Such "forward-looking" information is included in this Form 10-K, including this Item 7, as well as in other materials filed or to be filed by us with the Securities and Exchange Commission (as well as information included in oral statements or other written statements made or to be made by the Company).
This Form 10-K contains forward-looking statements that involve risks and uncertainties. In some cases, you can identify forward-looking statements by the following words: "anticipate," "believe," "continue," "could," "estimate," "expect," "intend," "may," "ongoing," "plan," "potential," "predict," "project," "should," "will," "would," or the negative of these terms or other comparable terminology, although not all forward-looking statements contain these words. These statements involve known and
52
unknown risks, uncertainties and other factors that may cause our or our industry's actual results, levels of activity, performance or achievements to be materially different from the information expressed or implied by these forward-looking statements. Forward-looking statements are only predictions and are not guarantees of performance. These statements are based on our management's beliefs and assumptions, which in turn are based on currently available information. Our forward-looking statements in this Form 10-K generally relate to the following:
- •
- our beliefs and intentions with respect to our growth strategy, including growth through acquisitions, the profitability
of expansion, the types of acquisition targets we intend to pursue, our ability to identify such targets, and the industry climate for dealer consolidation;
- •
- our beliefs with respect to our competitors and our competitive advantages;
- •
- our beliefs with respect to the impact of government subsidies on the agriculture economy;
- •
- our beliefs with respect to the benefit of natural resource exploration in our operating region on our operating results;
- •
- our beliefs with respect to the impact of government regulations;
- •
- our beliefs with respect to our business strengths, including the Titan Operating Model and the growth rate of our shared
resources expenditures and our marketing efforts;
- •
- our plans and beliefs with respect to real property used in our business;
- •
- our beliefs with respect to our employee relations and the impact of employee training on our revenues;
- •
- our assumptions, beliefs and expectations with respect to past and future market conditions, including interest rates,
lending standards and public infrastructure spending and the impact these conditions will have on our operating results;
- •
- our beliefs with respect to the impact of our Credit Agreement on future interest expense;
- •
- our beliefs with respect to the adequacy of our capital resources and the funding of debt service obligations and capital
expenditures;
- •
- our plans for future capital expenditures and dividend payments;
- •
- our cash needs and the adequacy of our working capital; and
- •
- our expectations regarding the impact of inflation.
Forward-looking statements are only predictions and are not guarantees of performance. These statements are based on our management's beliefs and assumptions, which in turn are based on currently available information. Important assumptions relating to the forward-looking statements include, among others, assumptions regarding demand for our products, the expansion of product offerings geographically, the timing and cost of planned capital expenditures, competitive conditions and general economic conditions. These assumptions could prove inaccurate. Forward-looking statements also involve known and unknown risks and uncertainties, which could cause actual results that differ materially from those contained in any forward-looking statement. Many of these factors are beyond our ability to control or predict. Such factors include, but are not limited to, the following:
- •
- incorrect assumptions regarding our cash needs;
- •
- general economic conditions and construction activity in the markets where we operate;
- •
- our relationships with equipment suppliers;
- •
- our substantial leverage;
53
- •
- the risks associated with the expansion of our business;
- •
- our possible inability to integrate any businesses we acquire;
- •
- competitive pressures;
- •
- compliance with laws and regulations; and
- •
- other factors discussed under "Risk Factors" or elsewhere in this Form 10-K.
You should read the risk factors and the other cautionary statements made in this Form 10-K as being applicable to all related forward-looking statements wherever they appear in this Form 10-K. We cannot assure you that the forward-looking statements in this Form 10-K will prove to be accurate. Furthermore, if our forward-looking statements prove to be inaccurate, the inaccuracy may be material. In light of the significant uncertainties in these forward-looking statements, you should not regard these statements as a representation or warranty by us or any other person that we will achieve our objectives and plans in any specified time frame, if at all. Other than as required by law, we undertake no obligation to update these forward-looking statements, even though our situation may change in the future.
ITEM 7A. QUANTITATIVE AND QUALITATIVE DISCLOSURES ABOUT MARKET RISK
We are exposed to market risk from changes in interest rates. Market risk is the potential loss arising from adverse changes in market rates and prices such as interest rates. For fixed rate debt, interest rate changes affect the fair value of financial instruments but do not impact earnings or cash flows. Conversely, for floating rate debt, interest rate changes generally do not affect the fair market value but do impact future earnings and cash flows, assuming other factors are held constant. We have both fixed and floating rate financing. Some of our floating rate credit facilities contain minimum rates of interest to be charged. Based upon balances and interest rates as of January 31, 2011, holding other variables constant, a one percentage point increase in interest rates for the next 12-month period would decrease pre-tax earnings and cash flow by approximately $2.0 million. Conversely, a one percentage point decrease in interest rates for the next 12-month period would result in an increase to pre-tax earnings and cash flow of approximately $2.0 million. At January 31, 2011, we had variable rate floorplan notes payable of $320.8 million, of which approximately $166.8 million was interest-bearing, variable notes payable and long-term debt of $28.6 million, and fixed rate notes payable and long-term debt of $9.0 million.
Our policy is not to enter into derivatives or other financial instruments for trading or speculative purposes.
54
ITEM 8. FINANCIAL STATEMENTS AND SUPPLEMENTARY DATA
The Consolidated Balance Sheets of the Company as of January 31, 2011 and 2010, and the related Consolidated Statements of Operations, Stockholders' Equity, and Cash Flows for each of the three years in the period ended January 31, 2011, and the notes thereto have been audited by Eide Bailly LLP, independent registered public accounting firm.
INDEX TO CONSOLIDATED FINANCIAL STATEMENTS
55
REPORT OF INDEPENDENT REGISTERED PUBLIC ACCOUNTING FIRM
To
the Board of Directors and Stockholders
Titan Machinery Inc.
Fargo, North Dakota
We have audited the accompanying consolidated balance sheets of Titan Machinery Inc. as of January 31, 2011 and 2010, and the related consolidated statements of operations, stockholders' equity, and cash flows for each of the years in the three-year period ended January 31, 2011, and the financial statement schedule listed in the Index at Item 15. Titan Machinery Inc.'s management is responsible for these consolidated financial statements. Our responsibility is to express an opinion on these financial statements based on our audits.
We conducted our audits in accordance with the standards of the Public Company Accounting Oversight Board (United States). Those standards require that we plan and perform the audit to obtain reasonable assurance about whether the financial statements are free of material misstatement. An audit includes examining, on a test basis, evidence supporting the amounts and disclosures in the financial statements. An audit also includes assessing the accounting principles used and significant estimates made by management, as well as evaluating the overall financial statement presentation. We believe that our audits provide a reasonable basis for our opinion.
In our opinion, the consolidated financial statements referred to above present fairly, in all material respects, the financial position of Titan Machinery Inc. as of January 31, 2011 and 2010, and the results of its operations and its cash flows for each of the years in the three-year period ended January 31, 2011, in conformity with accounting principles generally accepted in the United States of America. Also, in our opinion, the financial statement schedule referred to above, when considered in relation to the consolidated financial statements taken as a whole, presents fairly, in all material respects, the information set forth therein.
We also have audited, in accordance with the standards of the Public Company Accounting Oversight Board (United States), Titan Machinery Inc.'s internal control over financial reporting as of January 31, 2011, based on criteria established in Internal Control—Integrated Framework issued by the Committee of Sponsoring Organizations of the Treadway Commission (COSO), and our report dated April 18, 2011, expressed an unqualified opinion.
/s/ Eide Bailly LLP
Minneapolis,
Minnesota
April 18, 2011
56
REPORT OF INDEPENDENT REGISTERED PUBLIC ACCOUNTING FIRM
To
the Board of Directors and Stockholders
Titan Machinery Inc.
Fargo, North Dakota
We have audited Titan Machinery Inc.'s internal control over financial reporting as of January 31, 2011, based on criteria established in Internal Control—Integrated Framework issued by the Committee of Sponsoring Organizations of the Treadway Commission (COSO). Titan Machinery Inc.'s management is responsible for maintaining effective internal control over financial reporting and for its assessment of the effectiveness of internal control over financial reporting included in the accompanying Management's Report on Internal Control Over Financial Reporting. Our responsibility is to express an opinion on the company's internal control over financial reporting based on our audit.
We conducted our audit in accordance with the standards of the Public Company Accounting Oversight Board (United States). Those standards require that we plan and perform the audit to obtain reasonable assurance about whether effective internal control over financial reporting was maintained in all material respects. Our audit of internal control over financial reporting included obtaining an understanding of internal control over financial reporting, assessing the risk that a material weakness exists, and testing and evaluating the design and operating effectiveness of internal control based on the assessed risk. Our audit also included performing such other procedures as we considered necessary in the circumstances. We believe that our audit provides a reasonable basis for our opinion.
A company's internal control over financial reporting is a process designed to provide reasonable assurance regarding the reliability of financial reporting and the preparation of financial statements for external purposes in accordance with generally accepted accounting principles. A company's internal control over financial reporting includes those policies and procedures that (1) pertain to the maintenance of records that, in reasonable detail, accurately and fairly reflect the transactions and dispositions of the assets of the company; (2) provide reasonable assurance that transactions are recorded as necessary to permit preparation of financial statements in accordance with generally accepted accounting principles, and that receipts and expenditures of the company are being made only in accordance with authorizations of management and directors of the company; and (3) provide reasonable assurance regarding prevention or timely detection of unauthorized acquisition, use, or disposition of the company's assets that could have a material effect on the financial statements.
Because of its inherent limitations, internal control over financial reporting may not prevent or detect misstatements. Also, projections of any evaluation of effectiveness to future periods are subject to the risk that controls may become inadequate because of changes in conditions, or that the degree of compliance with the policies or procedures may deteriorate.
In our opinion, Titan Machinery Inc. maintained, in all material respects, effective internal control over financial reporting as of January 31, 2011, based on criteria established in Internal Control—Integrated Framework issued by the Committee of Sponsoring Organizations of the Treadway Commission (COSO).
We have also audited, in accordance with the standards of the Public Company Accounting Oversight Board (United States), the consolidated balance sheets and the related consolidated statements of operations, stockholders' equity, and cash flows of Titan Machinery Inc., and our report dated April 18, 2011, expressed an unqualified opinion.
/s/ Eide Bailly LLP
Minneapolis,
Minnesota
April 18, 2011
57
TITAN MACHINERY INC.
CONSOLIDATED BALANCE SHEETS
JANUARY 31, 2011 AND 2010
(in thousands, except per share data)
| |
January 31, 2011 |
January 31, 2010 |
|||||||
|---|---|---|---|---|---|---|---|---|---|
ASSETS |
|||||||||
CURRENT ASSETS |
|||||||||
Cash and cash equivalents |
$ | 76,112 | $ | 76,185 | |||||
Receivables, net |
44,945 | 22,254 | |||||||
Inventories |
429,844 | 347,580 | |||||||
Prepaid expenses |
1,003 | 1,009 | |||||||
Income taxes receivable |
— | 1,595 | |||||||
Deferred income taxes |
3,247 | 2,266 | |||||||
Total current assets |
555,151 | 450,889 | |||||||
INTANGIBLES AND OTHER ASSETS |
|||||||||
Noncurrent parts inventories |
2,405 | 1,642 | |||||||
Goodwill |
18,391 | 14,762 | |||||||
Intangible assets, net of accumulated amortization |
4,734 | 295 | |||||||
Other |
2,793 | 620 | |||||||
|
28,323 | 17,319 | |||||||
PROPERTY AND EQUIPMENT, net of accumulated depreciation |
65,372 | 46,604 | |||||||
|
$ | 648,846 | $ | 514,812 | |||||
LIABILITIES AND STOCKHOLDERS' EQUITY |
|||||||||
CURRENT LIABILITIES |
|||||||||
Accounts payable |
$ | 15,957 | $ | 12,352 | |||||
Floorplan notes payable |
320,801 | 249,872 | |||||||
Current maturities of long-term debt and short-term advances |
4,207 | 7,218 | |||||||
Customer deposits |
28,180 | 12,974 | |||||||
Accrued expenses |
16,816 | 9,870 | |||||||
Income taxes payable |
2,093 | — | |||||||
Total current liabilities |
388,054 | 292,286 | |||||||
LONG-TERM LIABILITIES |
|||||||||
Long-term debt, less current maturities |
33,409 | 21,852 | |||||||
Deferred income taxes |
9,012 | 6,356 | |||||||
Other long-term liabilities |
3,814 | 3,794 | |||||||
|
46,235 | 32,002 | |||||||
STOCKHOLDERS' EQUITY |
|||||||||
Common stock, par value $.00001 per share, authorized—25,000 shares; issued and outstanding—17,917 at January 31, 2011 and 17,777 at January 31, 2010 |
— | — | |||||||
Additional paid-in-capital |
140,466 | 138,775 | |||||||
Retained earnings |
74,091 | 51,749 | |||||||
|
214,557 | 190,524 | |||||||
|
$ | 648,846 | $ | 514,812 | |||||
See Notes to Consolidated Financial Statements
58
TITAN MACHINERY INC.
CONSOLIDATED STATEMENTS OF OPERATIONS
YEARS ENDED JANUARY 31, 2011, 2010 AND 2009
(in thousands, except per
share data)
| |
2011 | 2010 | 2009 | ||||||||
|---|---|---|---|---|---|---|---|---|---|---|---|
REVENUE |
|||||||||||
Equipment |
$ | 855,443 | $ | 643,186 | $ | 540,307 | |||||
Parts |
140,982 | 119,509 | 94,984 | ||||||||
Service |
74,506 | 58,983 | 44,224 | ||||||||
Other, including trucking and rental |
23,558 | 17,103 | 10,922 | ||||||||
TOTAL REVENUE |
1,094,489 | 838,781 | 690,437 | ||||||||
COST OF REVENUE |
|||||||||||
Equipment |
773,060 | 578,411 | 478,324 | ||||||||
Parts |
100,281 | 83,219 | 67,270 | ||||||||
Service |
27,767 | 21,615 | 16,729 | ||||||||
Other, including trucking and rental |
18,813 | 14,441 | 8,245 | ||||||||
TOTAL COST OF REVENUE |
919,921 | 697,686 | 570,568 | ||||||||
GROSS PROFIT |
174,568 | 141,095 | 119,869 | ||||||||
OPERATING EXPENSES |
130,541 | 108,998 | 86,940 | ||||||||
INCOME FROM OPERATIONS |
44,027 | 32,097 | 32,929 | ||||||||
OTHER INCOME (EXPENSE) |
|||||||||||
Interest and other income |
1,794 | 1,843 | 1,545 | ||||||||
Floorplan interest expense |
(7,223 | ) | (5,485 | ) | (3,240 | ) | |||||
Interest expense other |
(1,361 | ) | (1,463 | ) | (729 | ) | |||||
INCOME BEFORE INCOME TAXES |
37,237 | 26,992 | 30,505 | ||||||||
PROVISION FOR INCOME TAXES |
(14,895 | ) | (11,255 | ) | (12,430 | ) | |||||
NET INCOME |
$ | 22,342 | $ | 15,737 | $ | 18,075 | |||||
EARNINGS PER SHARE—NOTE 1 |
|||||||||||
EARNINGS PER SHARE—BASIC |
$ | 1.27 | $ | 0.89 | $ | 1.11 | |||||
EARNINGS PER SHARE—DILUTED |
$ | 1.23 | $ | 0.88 | $ | 1.08 | |||||
WEIGHTED AVERAGE SHARES—BASIC |
17,658 | 17,593 | 16,291 | ||||||||
WEIGHTED AVERAGE SHARES—DILUTED |
18,146 | 17,968 | 16,779 | ||||||||
See Notes to Consolidated Financial Statements
59
TITAN MACHINERY INC.
CONSOLIDATED STATEMENTS OF STOCKHOLDERS' EQUITY
YEARS ENDED JANUARY 31, 2011, 2010 AND 2009
(in thousands)
| |
Common Stock | |
|
|
|||||||||||||
|---|---|---|---|---|---|---|---|---|---|---|---|---|---|---|---|---|---|
| |
Shares Outstanding |
Amount | Additional Paid-In Capital |
Retained Earnings |
Total | ||||||||||||
BALANCE, JANUARY 31, 2008 |
13,441 | $ | — | $ | 58,180 | $ | 17,937 | $ | 76,117 | ||||||||
Common stock issued in follow-on offering |
4,180 | — | 78,815 | — | 78,815 | ||||||||||||
Common stock issued on grant of restricted stock and exercise of stock options and warrants |
36 | — | 68 | — | 68 | ||||||||||||
Stock-based compensation expense |
— | — | 692 | — | 692 | ||||||||||||
Net income |
— | — | — | 18,075 | 18,075 | ||||||||||||
BALANCE, JANUARY 31, 2009 |
17,657 |
— |
137,755 |
36,012 |
173,767 |
||||||||||||
Common stock issued on grant of restricted stock and exercise of stock options and warrants |
120 | — | 58 | — | 58 | ||||||||||||
Stock-based compensation expense |
— | — | 962 | — | 962 | ||||||||||||
Net income |
— | — | — | 15,737 | 15,737 | ||||||||||||
BALANCE, JANUARY 31, 2010 |
17,777 |
— |
138,775 |
51,749 |
190,524 |
||||||||||||
Common stock issued on grant of restricted stock and exercise of stock options and warrants and tax benefits of equity awards |
140 | — | 534 | — | 534 | ||||||||||||
Stock-based compensation expense |
— | — | 1,157 | — | 1,157 | ||||||||||||
Net income |
— | — | — | 22,342 | 22,342 | ||||||||||||
BALANCE, JANUARY 31, 2011 |
17,917 |
$ |
— |
$ |
140,466 |
$ |
74,091 |
$ |
214,557 |
||||||||
See Notes to Consolidated Financial Statements
60
TITAN MACHINERY INC.
CONSOLIDATED STATEMENTS OF CASH FLOWS
YEARS ENDED JANUARY 31, 2011, 2010 AND 2009
(in thousands)
| |
2011 | 2010 | 2009 | |||||||||
|---|---|---|---|---|---|---|---|---|---|---|---|---|
OPERATING ACTIVITIES |
||||||||||||
Net income |
$ | 22,342 | $ | 15,737 | $ | 18,075 | ||||||
Adjustments to reconcile net income to net cash provided by (used for) operating activities |
||||||||||||
Depreciation and amortization |
8,969 | 7,950 | 4,583 | |||||||||
Deferred income taxes |
1,675 | 1,850 | 968 | |||||||||
Stock-based compensation expense |
1,157 | 962 | 692 | |||||||||
Other |
(111 | ) | (15 | ) | (9 | ) | ||||||
Changes in assets and liabilities, net of purchase of equipment dealerships assets and assumption of liabilities |
||||||||||||
Receivables, prepaid expenses and other assets |
(19,873 | ) | (2,481 | ) | 6,993 | |||||||
Inventories |
(63,108 | ) | (61,244 | ) | (34,842 | ) | ||||||
Floorplan notes payable |
(12,992 | ) | (3,660 | ) | 5,380 | |||||||
Accounts payable, customer deposits, accrued expenses and other long-term liabilities |
23,245 | (6,649 | ) | 3,833 | ||||||||
Income taxes |
3,688 | (111 | ) | (1,458 | ) | |||||||
NET CASH PROVIDED BY (USED FOR) OPERATING ACTIVITIES |
(35,008 | ) | (47,661 | ) | 4,215 | |||||||
INVESTING ACTIVITIES |
||||||||||||
Net change in U.S. treasury bills |
— | 44,994 | (44,994 | ) | ||||||||
Property and equipment purchases |
(16,732 | ) | (12,394 | ) | (7,228 | ) | ||||||
Net proceeds from sale of equipment |
892 | 396 | 462 | |||||||||
Purchase of equipment dealerships, net of cash purchased |
(32,312 | ) | (7,266 | ) | (35,521 | ) | ||||||
Other, net |
(296 | ) | — | — | ||||||||
NET CASH PROVIDED BY (USED FOR) INVESTING ACTIVITIES |
(48,448 | ) | 25,730 | (87,281 | ) | |||||||
FINANCING ACTIVITIES |
||||||||||||
Proceeds from follow-on offering of common stock, net of underwriting discount of $4,389 and other direct costs of $396 |
— | — | 78,815 | |||||||||
Net change in non-manufacturer floorplan notes payable |
82,371 | 51,448 | 9,094 | |||||||||
Short-term advances related to customer contracts in transit, net |
(392 | ) | 780 | — | ||||||||
Proceeds from long-term debt borrowings |
23,259 | 23,914 | 12,368 | |||||||||
Principal payments on long-term debt and subordinated debentures |
(20,385 | ) | (19,066 | ) | (19,034 | ) | ||||||
Debt issuance costs |
(2,004 | ) | (65 | ) | — | |||||||
Proceeds from exercise of stock options and warrants, and tax benefits of equity awards |
534 | 58 | 67 | |||||||||
NET CASH PROVIDED BY FINANCING ACTIVITIES |
83,383 |
57,069 |
81,310 |
|||||||||
NET CHANGE IN CASH AND CASH EQUIVALENTS |
(73 |
) |
35,138 |
(1,756 |
) |
|||||||
CASH AND CASH EQUIVALENTS AT BEGINNING OF PERIOD |
76,185 |
41,047 |
42,803 |
|||||||||
CASH AND CASH EQUIVALENTS AT END OF PERIOD |
$ |
76,112 |
$ |
76,185 |
$ |
41,047 |
||||||
61
TITAN MACHINERY INC.
CONSOLIDATED STATEMENTS OF CASH FLOWS (Continued)
YEARS ENDED JANUARY 31, 2011, 2010 AND 2009
(in thousands)
| |
2011 | 2010 | 2009 | |||||||||
|---|---|---|---|---|---|---|---|---|---|---|---|---|
SUPPLEMENTAL DISCLOSURES OF CASH FLOW INFORMATION |
||||||||||||
Cash paid during the period |
||||||||||||
Income taxes, net of refunds |
$ | 9,226 | $ | 10,287 | $ | 12,894 | ||||||
Interest |
$ | 9,103 | $ | 6,311 | $ | 4,037 | ||||||
SUPPLEMENTAL DISCLOSURES OF NONCASH INVESTING AND FINANCING ACTIVITIES |
||||||||||||
Property and equipment purchased with long-term debt |
$ | 2,980 | $ | 2,312 | $ | 979 | ||||||
Net transfer of equipment from (to) fixed assets to (from) inventories |
$ | (3,219 | ) | $ | 6,528 | $ | (3,631 | ) | ||||
Net transfer of financing from (to) long-term debt to (from) floorplan notes payable |
$ | (3,084 | ) | $ | 3,180 | $ | — | |||||
Acquisition of equipment dealership assets in exchange for cash and assumption of liabilities including purchase accounting adjustments on prior acquisitions |
||||||||||||
Receivables |
$ | (2,812 | ) | $ | (558 | ) | $ | (4,905 | ) | |||
Inventories |
(21,241 | ) | (15,189 | ) | (42,594 | ) | ||||||
Deferred income taxes, net |
— | 163 | 271 | |||||||||
Property and equipment |
(5,512 | ) | (1,462 | ) | (22,255 | ) | ||||||
Intangible assets |
(4,387 | ) | — | (250 | ) | |||||||
Other assets |
— | — | (89 | ) | ||||||||
Goodwill |
(3,629 | ) | (2,298 | ) | (4,193 | ) | ||||||
Accounts payable |
— | (149 | ) | 3,367 | ||||||||
Floorplan notes payable |
2,737 | 8,765 | 24,608 | |||||||||
Customer deposits |
1,868 | 286 | 392 | |||||||||
Accrued expenses |
207 | 205 | 290 | |||||||||
Income taxes payable |
— | (51 | ) | 1,100 | ||||||||
Long-term debt |
— | 1,877 | 8,084 | |||||||||
Non-cash consideration: other long-term liabilities |
457 | 1,145 | 653 | |||||||||
Cash paid for dealerships, net of cash purchased and adjustments on prior acquisitions |
$ | (32,312 | ) | $ | (7,266 | ) | $ | (35,521 | ) | |||
See Notes to Consolidated Financial Statements
62
TITAN MACHINERY INC.
NOTES TO CONSOLIDATED FINANCIAL STATEMENTS
NOTE 1—BUSINESS ACTIVITY AND SIGNIFICANT ACCOUNTING POLICIES
Nature of Business
Titan Machinery Inc. (the "Company") is engaged in the retail sale, service and rental of agricultural and construction machinery through stores in North Dakota, South Dakota, Minnesota, Iowa, Nebraska, Montana and Wyoming.
Principles of Consolidation
The consolidated financial statements include the accounts of the Company and its wholly-owned subsidiary, Transportation Solutions, LLC. All significant accounts, transactions and profits between the consolidated companies have been eliminated in consolidation.
Reclassifications
Certain reclassifications of amounts previously reported have been made to the accompanying consolidated financial statements to maintain consistency and comparability between periods presented.
Concentrations of Credit Risk
The Company's sales are to agricultural and construction equipment customers principally in North Dakota, South Dakota, Minnesota, Iowa, Nebraska, Montana and Wyoming. The Company extends credit to its customers in the ordinary course of business and monitors its customers' financial condition to minimize its risks associated with trade receivables; however, the Company does not generally require collateral on trade receivables.
A portion of the Company's cash balances are maintained in bank deposit accounts, which are in excess of federally insured limits.
Estimates
The preparation of financial statements in conformity with accounting principles generally accepted in the United States of America requires management to make estimates and assumptions that affect the reported amounts of assets and liabilities and disclosure of contingent assets and liabilities at the date of the consolidated financial statements and the reported amounts of revenue and expenses during the reporting period. Actual results could differ from those estimates, particularly related to realization of inventory, initial valuation and impairment analyses of intangible assets, and income taxes.
Concentrations in Operations
The Company currently purchases new and rental equipment and related parts from a limited number of manufacturers. Although no change in suppliers is anticipated, the occurrence of such a change could cause a possible loss of sales and adversely affect operating results. The Company is the holder of authorized dealerships granted by CNH Capital LLC, New Holland North America, Inc. and Kobelco Construction Machinery America LLC whereby it has the right to act as an authorized dealer for the entities' equipment. The dealership authorizations and floorplan facilities can be cancelled by the respective entity if the Company does not observe certain established guidelines and covenants.
63
TITAN MACHINERY INC.
NOTES TO CONSOLIDATED FINANCIAL STATEMENTS (Continued)
NOTE 1—BUSINESS ACTIVITY AND SIGNIFICANT ACCOUNTING POLICIES (Continued)
Cash, Cash Equivalents and U.S. Treasury Bills
The Company considers all highly liquid investments with original maturities of three months or less on their acquisition date to be cash equivalents. As of January 31, 2011, cash equivalents consisted entirely of money market funds. As of January 31, 2010, cash equivalents consisted entirely of money market funds and U.S. Treasury Bills. The Treasury Bills are classified as held-to-maturity as the Company had both the positive intent and ability to hold to maturity, and were carried at amortized cost, which due to the short-term nature of the investments, approximated fair value.
Receivables and Credit Policy
Trade accounts receivable due from customers are uncollateralized customer obligations due under normal trade terms requiring payment within 30 days from the invoice date. Balances unpaid after 30 days are considered past due and begin to accrue interest. Payments of trade receivables are allocated to the specific invoices identified on the customer's remittance advice or, if unspecified, are applied to the earliest unpaid invoices. Trade accounts receivable due from manufacturers relate to discount programs, incentive programs and repair services performed on equipment with a remaining factory warranty. Trade accounts receivable due from finance companies primarily consist of contracts in transit with finance companies and balances due from credit card companies. These receivables do not generally have established payment terms but are collected in relatively short time periods.
The carrying amount of trade receivables is reduced by a valuation allowance that reflects management's best estimate of the amounts that will not be collected. Management reviews aged receivable balances and estimates the portion, if any, of the balance that will not be collected. Account balances are charged off after all appropriate means of collection have been exhausted and the potential for recovery is considered remote.
Inventories
New and used equipment are stated at the lower of cost (specific identification) or market value with adjustments for decreases in market value on inventory rented but available for sale being a percentage of the rental income received on such inventory. All used equipment inventories and certain new equipment inventories including that which has been rented, is subject to periodic lower of cost or market evaluation. Parts inventories are valued at the lower of average cost or market value. An estimate of parts inventories not expected to be sold in the next year has been reported separately, which is based on historical sales of parts on hand. Work in process is valued at the retail rates of labor incurred and parts inventories used on service work in process at year end.
Property and Equipment
Property and equipment is carried at cost less accumulated depreciation. Depreciation is computed on a straight-line basis over the estimated useful life of each asset, as summarized below:
| Buildings and leasehold improvements | Lesser of 10 – 40 years or lease term | |
| Machinery and equipment | 3 – 10 years | |
| Furniture and fixtures | 3 – 10 years | |
| Vehicles | 5 – 10 years | |
| Rental fleet | 3 – 10 years |
64
TITAN MACHINERY INC.
NOTES TO CONSOLIDATED FINANCIAL STATEMENTS (Continued)
NOTE 1—BUSINESS ACTIVITY AND SIGNIFICANT ACCOUNTING POLICIES (Continued)