Attached files
| file | filename |
|---|---|
| EX-99.1 - TRANSCRIPT OF ALCOA INC. FIRST QUARTER 2011 EARNINGS CALL - Howmet Aerospace Inc. | dex991.htm |
| 8-K - FORM 8-K - Howmet Aerospace Inc. | d8k.htm |
 1
st
Quarter 2011 Earnings Conference
April 11, 2011
Exhibit 99.2 |
 Alcoa
Logo
Cautionary Statement
2 |
 Chuck McLane
Executive Vice President and Chief Financial Officer
|
 Alcoa
Logo
1
st
Quarter 2011 Financial Overview
Income
from
Continuing
Operations
of
$309
million,
or
$0.27
per
share;
Restructuring
and
other
special
items
totaled
an
unfavorable
$8
million,
or
$0.01
per
share
Revenue
up
22%
versus
first
quarter
2010
and
5%
sequentially
Adjusted
EBITDA
of
$955
million,
up
22%
from
the
fourth
quarter
2010
and
up
60%
from
first
quarter
2010
Alumina:
$71
Adjusted
EBITDA/metric
ton,
8%
better
than
ten-year
average
of
$66/mt
Primary
Metals:
$438
Adjusted
EBITDA/metric
ton,
12%
better
than
ten-year
average
of
$390/mt
Flat-Rolled
Products:
$173
million
Adjusted
EBITDA
was
record
first
quarter
result
Engineered
Products:
18.4%
Adjusted
EBITDA
margin
was
record
result
Days
Working
Capital
two
days
lower
than
first
quarter
2010
Debt
to
Capital
of
33.6%,
130
basis
points
lower
sequentially
Completed
acquisition
of
aerospace
fastener
business
4
See appendix for Adjusted EBITDA reconciliations |
 Alcoa
Logo
Income Statement Summary
$ Millions
1Q’10
4Q’10
1Q’11
Year
Change
Sequential
Change
Sales
$4,887
$5,652
$5,958
$1,071
$306
Cost of Goods Sold
$4,013
$4,538
$4,715
$702
$177
COGS % Sales
82.1%
80.3%
79.1%
(3.0 % pts.)
(1.2 % pts.)
Selling, General Administrative, Other
$239
$282
$245
$6
($37)
SGA % Sales
4.9%
5.0%
4.1%
(0.8 % pts.)
(0.9 % pts.)
Restructuring and Other Charges
$187
($12)
$6
($181)
$18
Effective Tax Rate
-95.5%
16.1%
27.4%
122.9
% pts.
11.3 % pts.
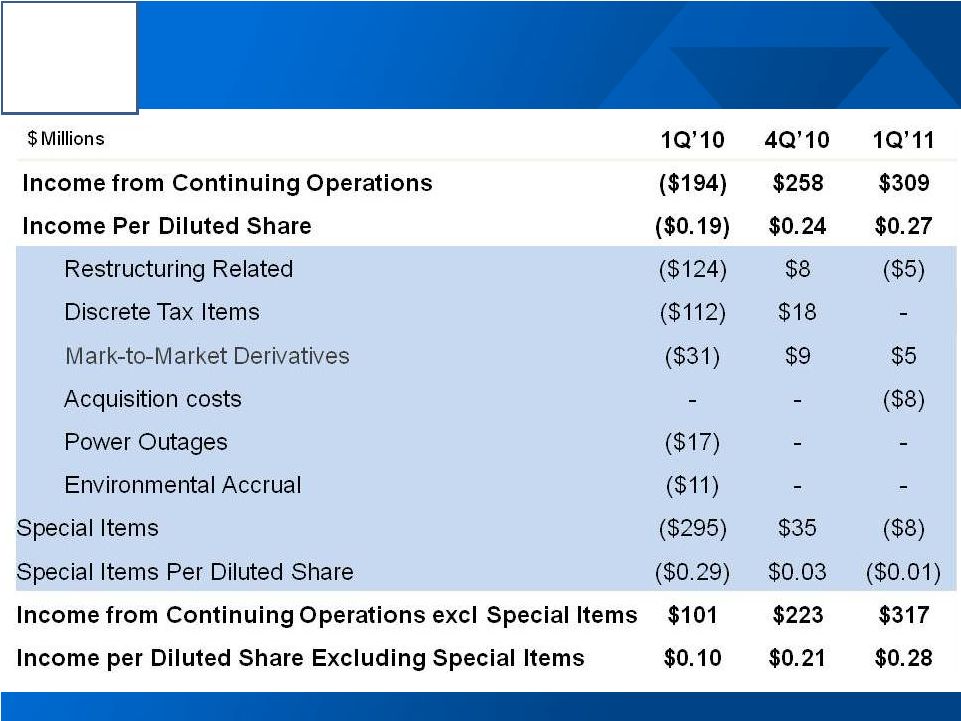
Income from Continuing Operations
($194)
$258
$309
$503
$51
Income Per Diluted Share
($0.19)
$0.24
$0.27
$0.46
$0.03
5
See appendix for Adjusted Income reconciliation |
 Alcoa
Logo
Restructuring and Other Special Items
6
See appendix for Adjusted Income reconciliation |
 Alcoa
Logo
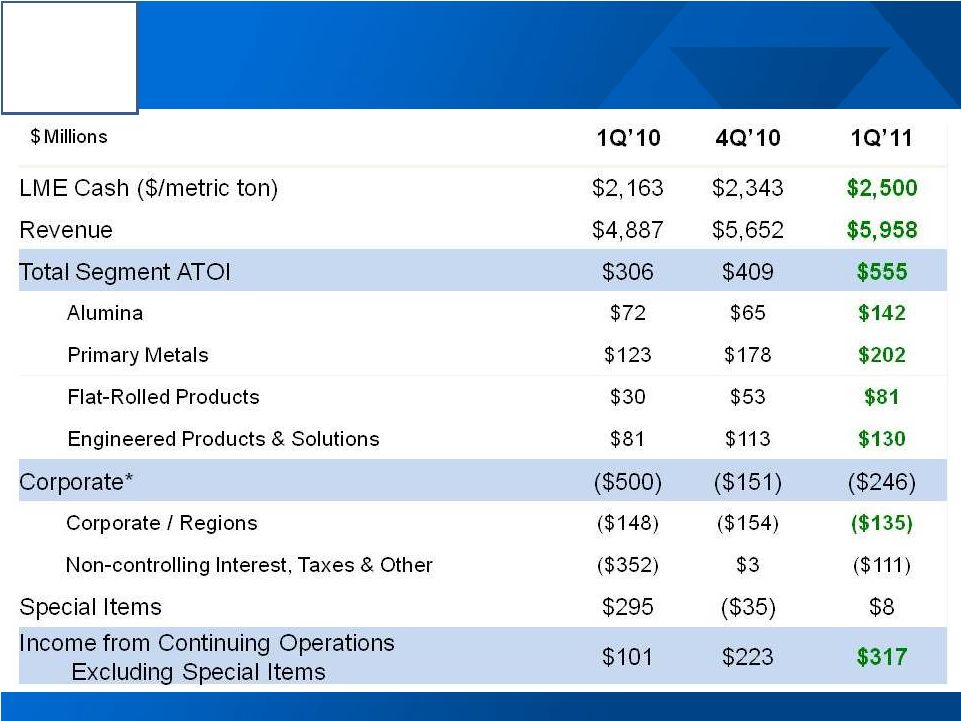
Sequential and Prior Year Improvements in All Segments
7
*
These
amounts
represent
the
sum
of
all
reconciling
items
(excluding
discontinued
operations)
within
the
Reconciliation
of
ATOI
included
in
the
appendix |
 Alcoa
Logo
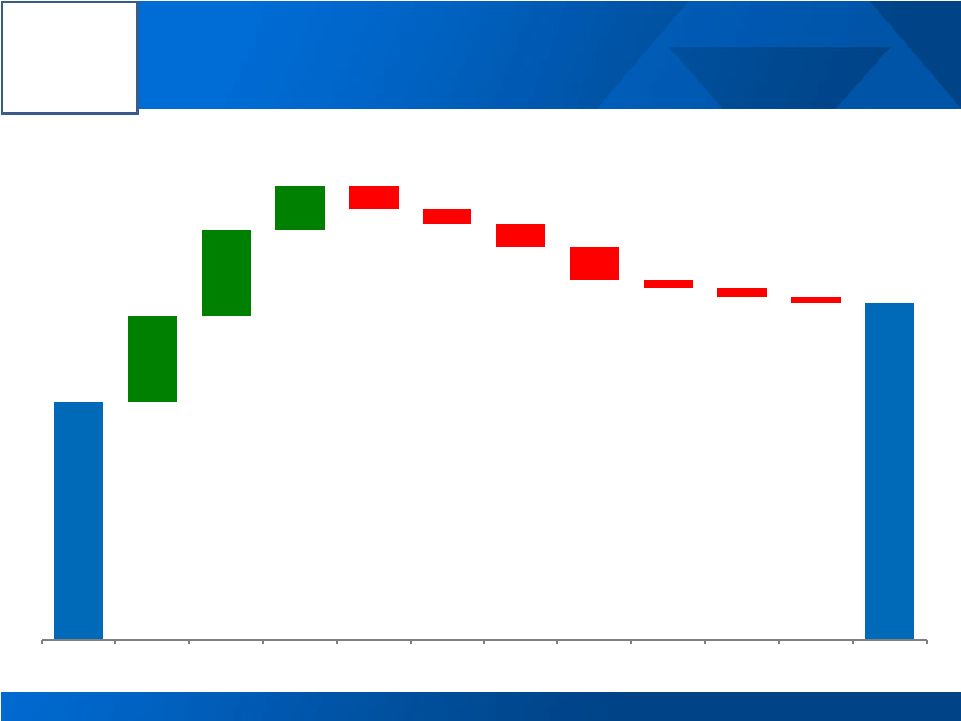
1
st
Quarter 2011 vs. 4
th
Quarter 2010 Earnings Bridge
Income from Continuing Operations excluding Restructuring & Other Special Items ($ millions) 8
See appendix for reconciliation
$223
$81
$81
$41
($21)
($14)
($22)
($31)
($7)
($9)
($5)
$317
4Q10
LME
Price/
Mix
Productivity
Energy
Currency
Raw
Materials
Taxes
Alumina
Mtce
Restarts
Other
1Q11 |
 Alcoa
Logo
1Q 10
4Q 10
1Q 11
Production (kmt)
3,866
4,119
4,024
3
rd
Party Shipments (kmt)
2,126
2,433
2,206
3
rd
Party Revenue ($ Millions)
638
759
810
ATOI ($ Millions)
72
65
142
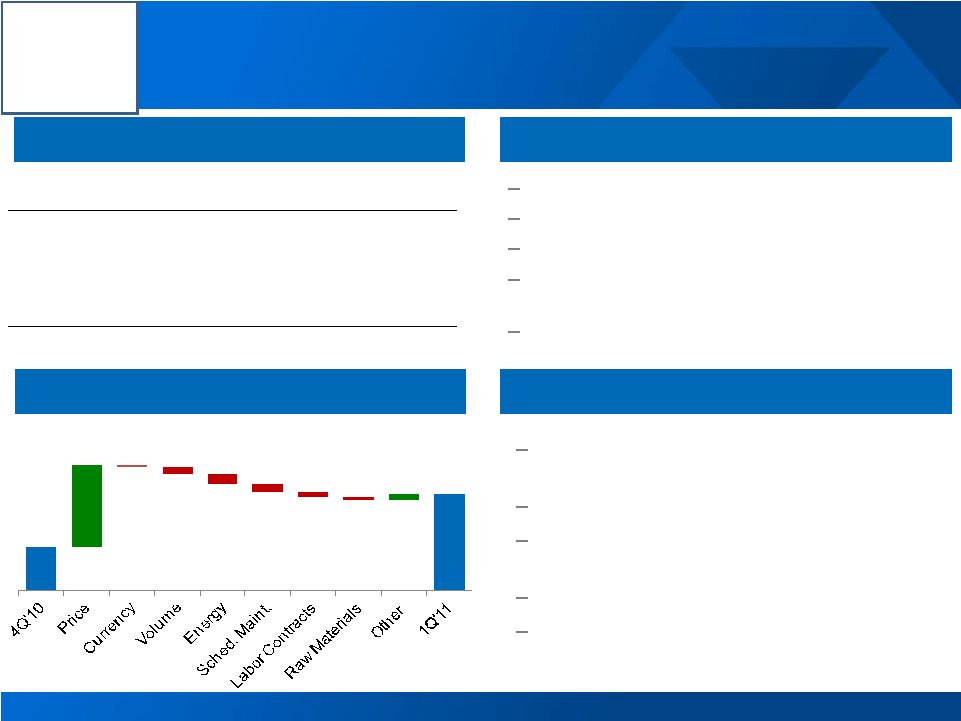
Alumina
1
st
Quarter Highlights
2
nd
Quarter Outlook
1
st
Quarter Business Conditions
9
Realized third-party alumina price up 15%
Higher natural gas, fuel oil, and caustic prices
Higher scheduled maintenance of $12 million
Achieved $71 Adjusted EBITDA/tonne, better than
ten-year average of $66
Impact of labor contract settlement in Australia
of $7 million
20% of 3
rd
party shipments on spot or prior-
month indexed basis
Other pricing to follow two-month lag on LME
Maintenance costs continue in Australia with
similar cost to Q1
Production projected to increase 125 kmt
Higher energy and caustic costs to persist
1
st
Quarter Performance Bridge
$ Millions
See appendix for Adjusted EBITDA reconciliation
$65
$142
$120
($3)
($10)
($15)
($12)
($7)
($5)
$9 |
 Alcoa
Logo
1Q 10
4Q 10
1Q 11
Production (kmt)
889
913
904
3
rd
Party Shipments (kmt)
695
743
698
3
rd
Party Revenue ($ Millions)
1,702
1,970
1,980
3
rd
Party Price ($/MT)
2,331
2,512
2,682
ATOI ($ Millions)
123
178
202
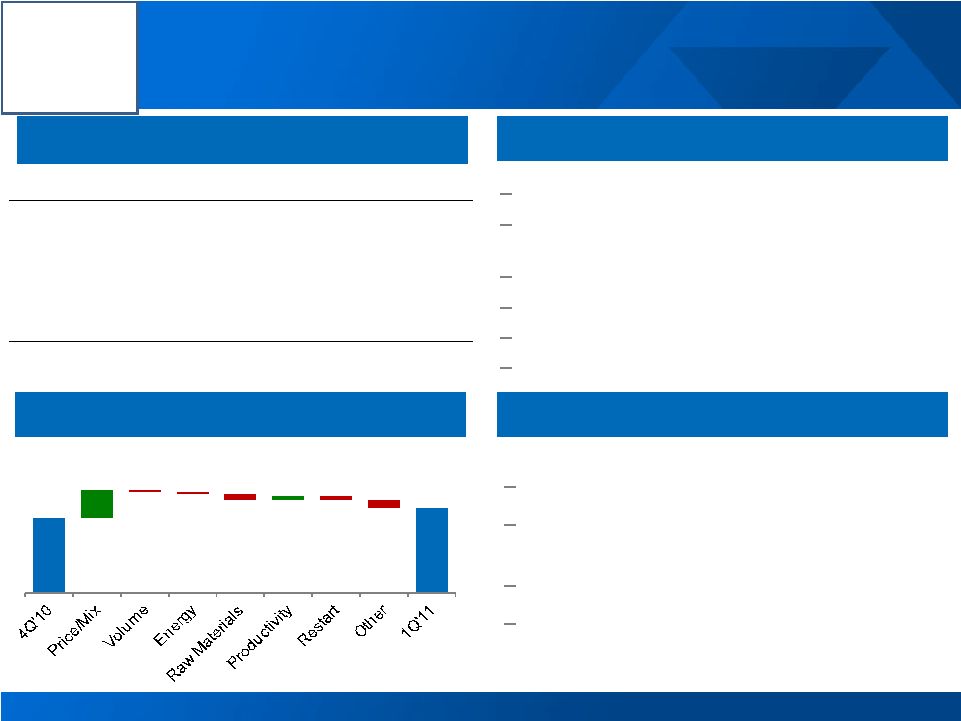
Primary Metals
1
st
Quarter Highlights
1
st
Quarter Business Conditions
2
nd
Quarter Outlook
10
Realized pricing up 7% sequentially
Achieved $438 Adjusted EBITDA/tonne, better than
ten-year average of $390
Productivity benefits continue
Restarts at US locations with cost of $9m
Higher energy and energy-derivative costs
Increasing cost of other raw materials
Pricing to follow 15-day lag to LME
US restarts will turn profitable, with no further cost
expected
50 kmt higher production with restarts
Higher energy and raw materials costs to persist
1
st
Quarter Performance Bridge
$ Millions
($13)
See appendix for Adjusted EBITDA reconciliation
$178
($5)
$202
$66
($4)
$9
($20)
($9) |
 Alcoa
Logo
$29
$17
($2)
($2)
($7)
($7)
$53
$81
11
2
nd
Quarter Outlook
1
st
Quarter Business Conditions
1
st
Quarter Highlights
ATOI $ Millions
1Q 10
4Q 10
1Q 11
Flat-Rolled Products,
excl Russia, China & Other
47
55
84
Russia, China & Other
(17)
(2)
(3)
Total ATOI
30
53
81
32% revenue growth from Q1 2010
Record 1
st
Quarter ATOI and Adjusted EBITDA
performance
Strengthened demand in most end markets, and
Improved pricing and mix
Increased cost pressures
Seasonal demand increases
Improving productivity
Cost pressures to continue
Improvement in Russia and China as shipments
increase
1
st
Quarter Performance Bridge
$ Millions
Flat-Rolled Products
17% increase
from 2010
241% increase
from 2008
Adjusted EBITDA/mt
11
See appendix for Adjusted EBITDA reconciliation |
 Alcoa
Logo
$ Millions
1Q 10
4Q 10
1Q 11
3
rd
Party Revenue
1,074
1,215
1,247
ATOI
81
113
130
Adjusted EBITDA Margin
14%
17%
18%
Engineered Products and Solutions
12
1
st
Quarter Performance Bridge
$ Millions
1
st
Quarter Business Conditions
1
st
Quarter Highlights
2
nd
Quarter Outlook
Building and construction market with continued
weakness
Markets showing incremental improvements in
line with end market forecasts
Increasing market share in several core
businesses
Product innovations continue to support
aggressive 2011 and 2013 revenue targets
Productivity improvements to continue
See appendix for Adjusted EBITDA reconciliation
$113
($2)
$11
$11
($3)
$130 |
 Alcoa
Logo
1
st
Quarter 2011 Cash Flow Overview
13
See appendix for Free Cash Flow reconciliation
1Q’11 FCF
($0.4) billion
$0.9 billion
of cash
Debt-to-Cap
in target
range at
33.6%
DWC better
by two Days
from Q1
2010
($ Millions)
1Q'10
4Q'10
1Q'11
Net Income
($179)
$292
$366
DD&A
358
371
361
Change in Working Capital
(336)
564
(646)
Pension Contributions
(22)
(43)
(31)
Taxes / Other Adjustments
378
186
($286)
Cash From Operations
$199
$1,370
($236)
Dividends to Shareholders
(32)
(31)
(33)
Change in Debt
(42)
(113)
101
Distributions to Noncontrolling Interest
(72)
(102)
(97)
Contributions from Noncontrolling Interest
27
41
121
Other Financing Activities
(61)
4
33
Cash From Financing Activities
($180)
($201)
$125
Capital Expenditures
(221)
(365)
(204)
Other Investing Activities
13
(109)
(348)
Cash From Investing Activities
($208)
($474)
($552) |
 Alcoa
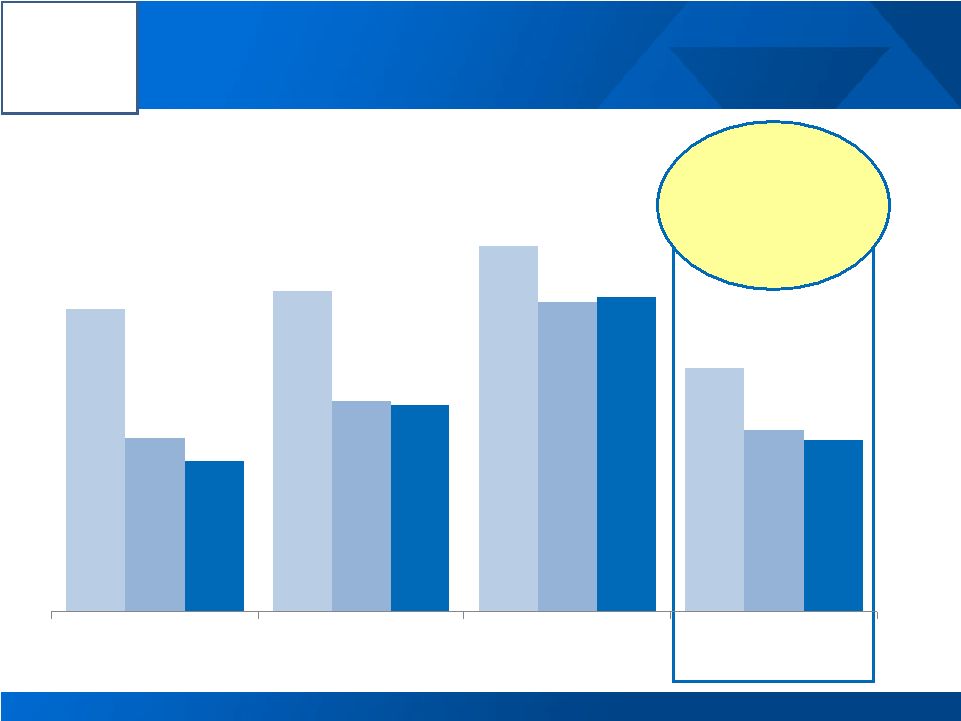
Logo Sustainable Reductions in Days Working Capital
14
1Q
2009
1Q
2010
1Q
2011
Sustained
historically low
days working
capital
performance
1Q
2009
1Q
2010
1Q
2011
1Q
2009
1Q
2010
1Q
2011
1Q
2009
1Q
2010
1Q
2011
See appendix for Free Cash Flow reconciliation
67
71
81
54
38
47
69
40
33
46
70
38
GPP
GRP
EPS
Alcoa |
 Alcoa
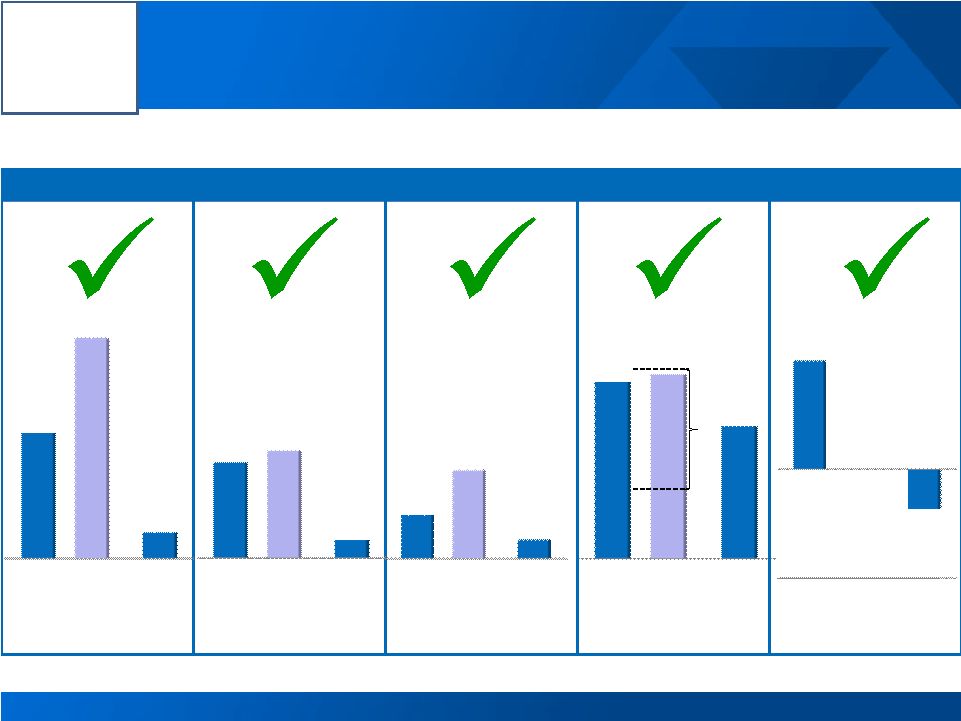
Logo 2011 Cash Sustainability Operational Targets and Actual Performance
15
Sustaining Capital
Growth Capital
Ma’aden
Invest
$400
Debt-to-cap
$ Millions
$197
$ Millions
$ Millions
%
2010
Actual
2011
Target
2011
YTD
$85
35.0%
34.9%
2010
Actual
2011
Target
2011
YTD
33.6%
$500
$445
2010
Actual
2011
Target
2011
YTD
$85
$1,000
$570
2010
Actual
2011
Target
2011
YTD
$119
Free Cash Flow
$ Millions
$0
$1,246
($440)
2010
Actual
2011
Target *
2011
YTD
30.0%
•Target is to be free cash flow positive. See appendix for Free Cash
Flow reconciliation We Are Focused on Achieving Our 2011 Goals
|
 Alcoa
Logo A
16 |
 Klaus Kleinfeld
Chairman and Chief Executive Officer
17 |
 Alcoa
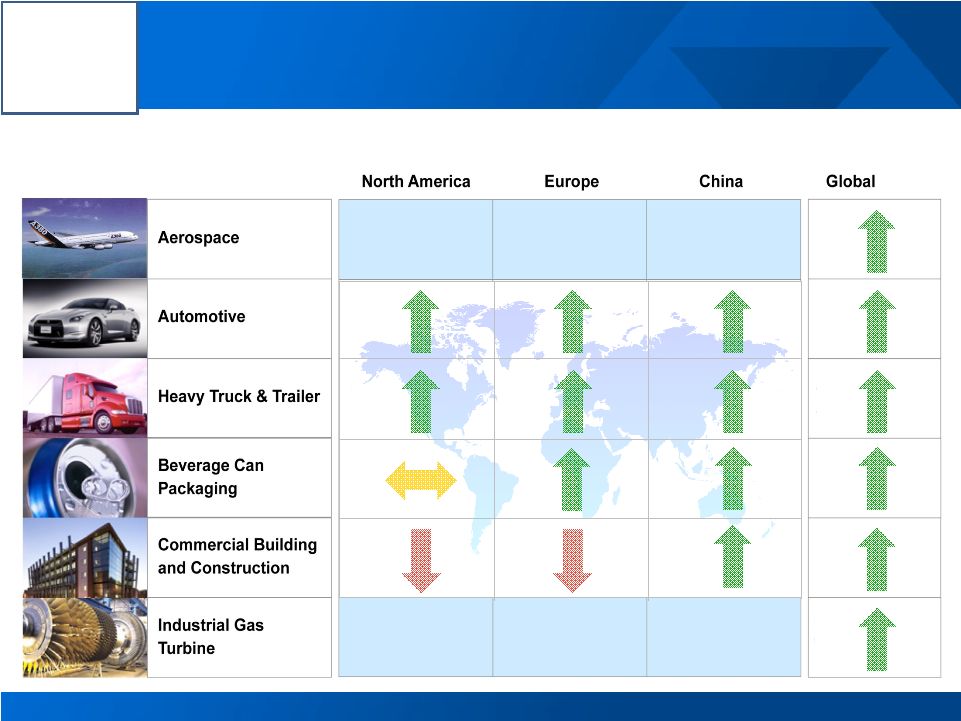
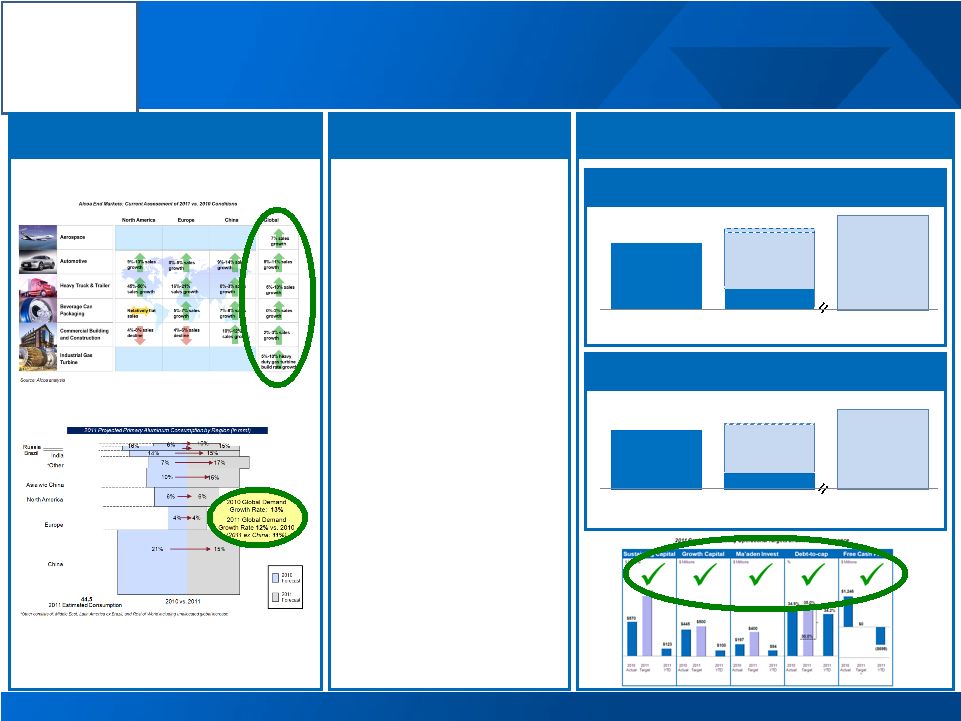
Logo Market Conditions in 2011 Continue to Strengthen
18
Alcoa End Markets: Current Assessment of 2011 vs. 2010 Conditions
Source: Alcoa analysis
9%-13% sales
growth
0%-5% sales
growth
9%-14% sales
growth
5%-11% sales
growth
45%-50%
sales growth
16%-21%
sales growth
0%-3% sales
growth
5%-10% sales
growth
Relatively flat
sales
5%-7% sales
growth
7%-8% sales
growth
0%-2% sales
growth
10%-12%
sales growth
2%-3% sales
growth
4%-8% sales
decline
4%-6% sales
decline
5%-10% heavy
duty gas turbine
build rate growth
7% sales
growth |
 Alcoa
Logo
19
*Other consists of: Middle East, Latin America ex Brazil, and Rest of World
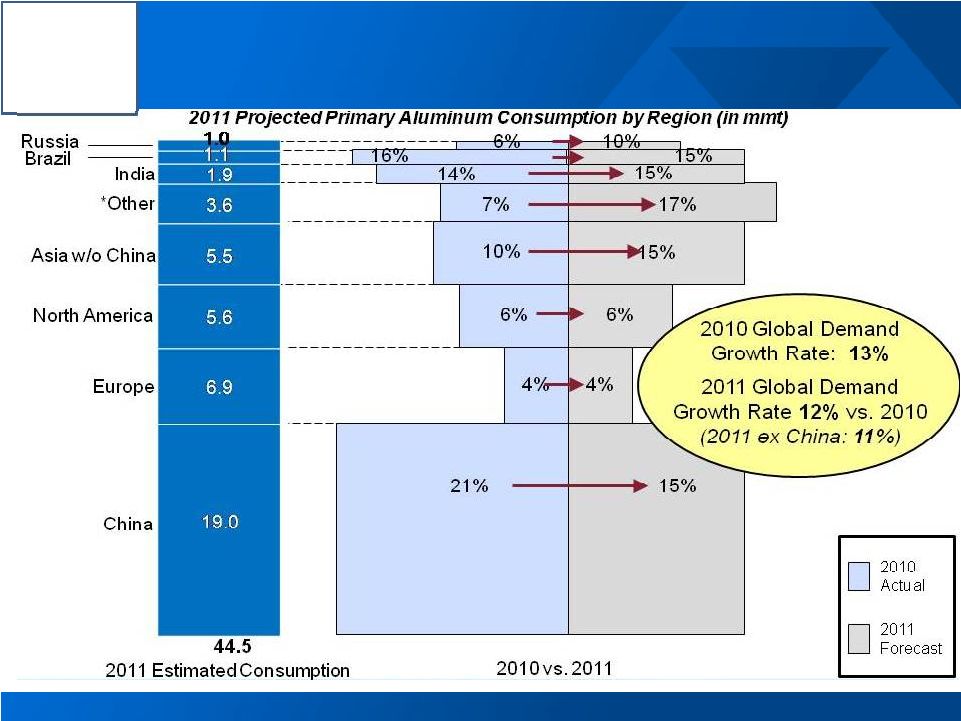
including unallocated global increase End Market Developments Support Strong
Demand Growth |
 Alcoa
Logo
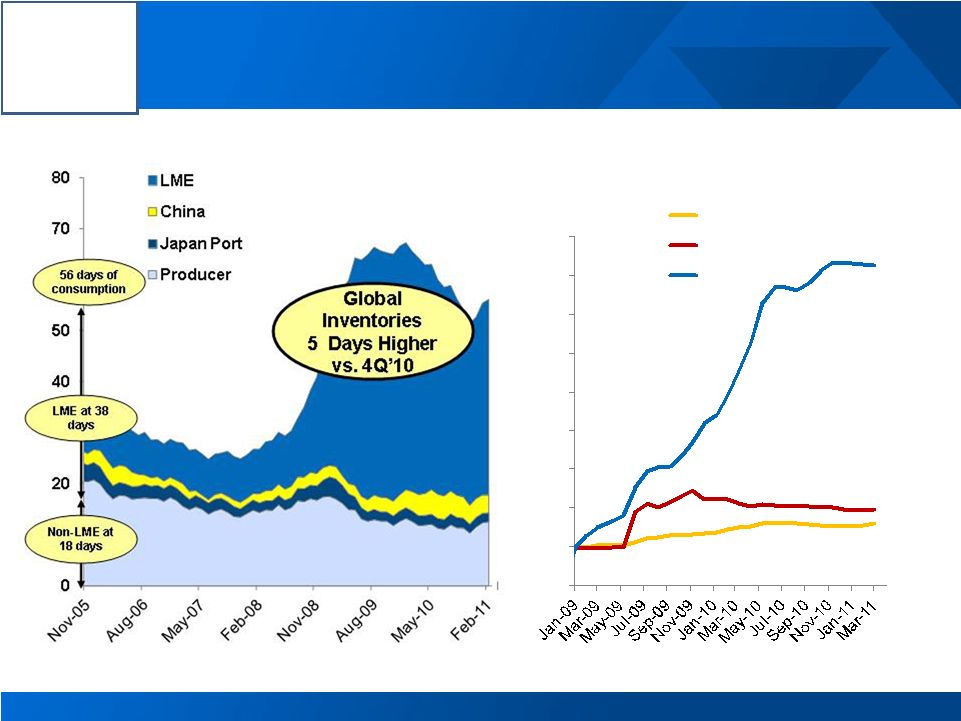
Inventories Increase, but Premiums Attest Physical Tightness
20
Regional Premiums Near All-Time Highs
Global Inventories Increase in Q1 2011
$114 / MT
$204 / MT
$145 / MT
Source: Alcoa estimates, LME, SHFE, IAI, Marubeni, Platt’s Metals Week and
Metal Bulletin 0%
100%
200%
300%
400%
500%
600%
700%
800%
900%
Midwest
Japan
Europe |
   Alcoa Logo
4.3
4.6
1.2
1.5
0.2
0.2
0.4
0.4
0.7
0.8
1.8
1.5
1.0
1.0
Q4 2010
Q1 2011
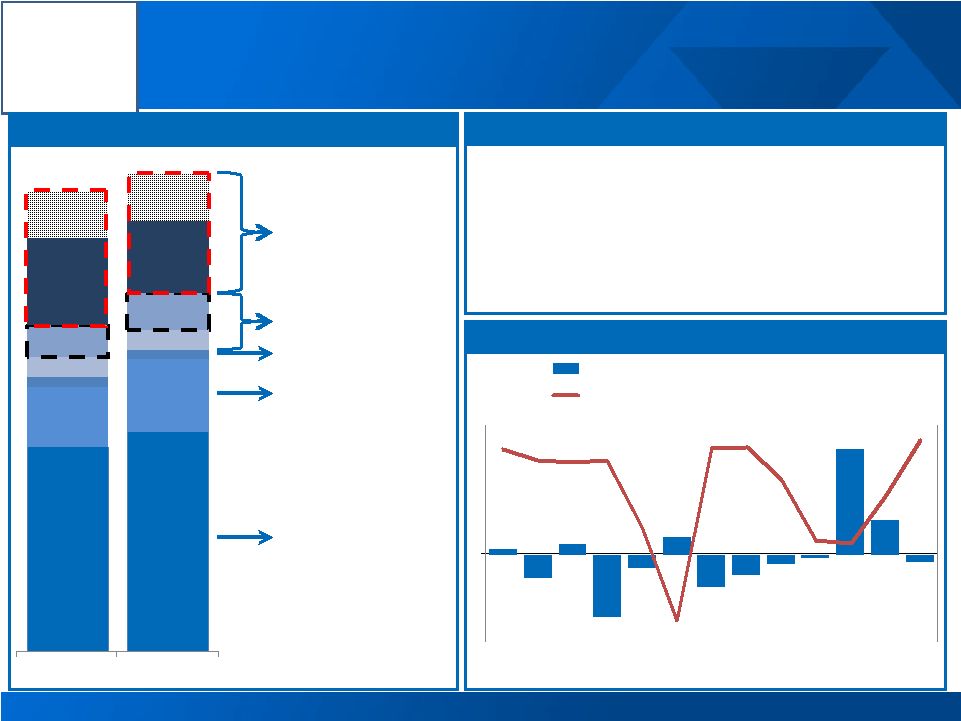
Inventory: Driven by End Markets and Financing Structure
21
Off-warrant
estimate range
(1.5 to 2.5mmt)
China Visible
Japan Port
Producer-held
LME on-warrant
Total Global Inventories (mmt)
Source: Alcoa analysis
Mar-10
May-10
Jul-10
Sep-10
Nov-10
Jan-11
•Improving end-market demand drives
work-in- process and distribution inventories
•Four additional reporting smelters in the
Middle East & India
Growing demand in All Regions
Competing Financing Deals
13
(53)
26
(145)
(32)
42
(75)
(46)
(21)
(8)
248
82
(16)
$31
$30
$29
$30
$19
$3
$32
$32
$26
$16
$16
$24
$33
$0
$5
$10
$15
$20
$25
$30
$35
(200)
(150)
(100)
(50)
0
50
100
150
200
250
300
LME Stock Change (kmt)
Contango (cash to 3 months) ($/mt) |
 Alcoa
Logo
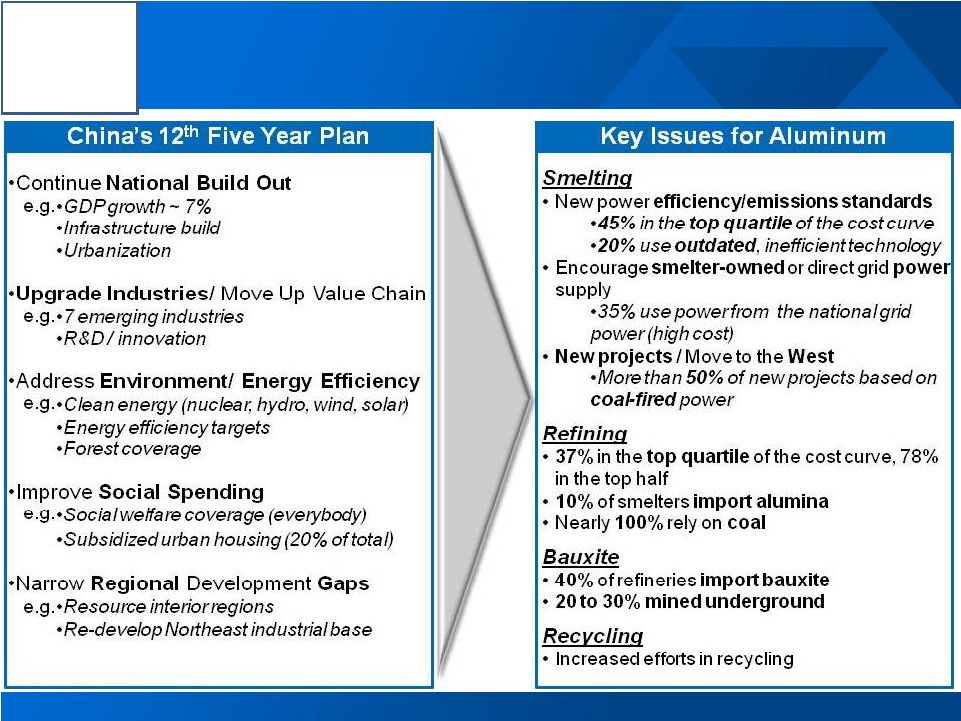
12
th
Five Year Plan Accelerates Change in Aluminum Industry
22 |
 Alcoa
Logo Western World
Annualized Production (Feb 2011)
25,385
Restarts and Expanded Capacity
1,100
Total Supply
26,485
Western World Consumption
(25,540)
(Deficit) Surplus
945
China
Annualized Production (Feb 2011)
15,865
Restarted and Expanded Capacity
2,410
Total Supply
18,275
Consumption
(18,975)
(Deficit) Surplus
(700)
2011 Primary Aluminum Balances Unchanged
23
China
Western World
Production
Demand
Surplus
Source: Alcoa estimates, Brook Hunt, CRU, CNIA, IAI
Deficit
Production
Demand
2011E Aluminum Supply / Demand Balance (in kmt) |
 Alcoa
Logo 2011 Global Alumina Balance Unchanged
24
Source: Alcoa estimates, Brook Hunt, CRU, CNIA, IAI
China
Western World
2011 Annualized Production
31,500
Imports from Western World
3,500
Supply
35,000
Demand
(35,000)
(Deficit) / Surplus
0
2011 Annualized Production
55,900
Exports to China
(3,500)
Supply
52,400
Demand
(52,400)
(Deficit) / Surplus
0
Production
Demand
Balanced
2011E Alumina Supply / Demand Balance (in kmt) |
 Alcoa
Logo
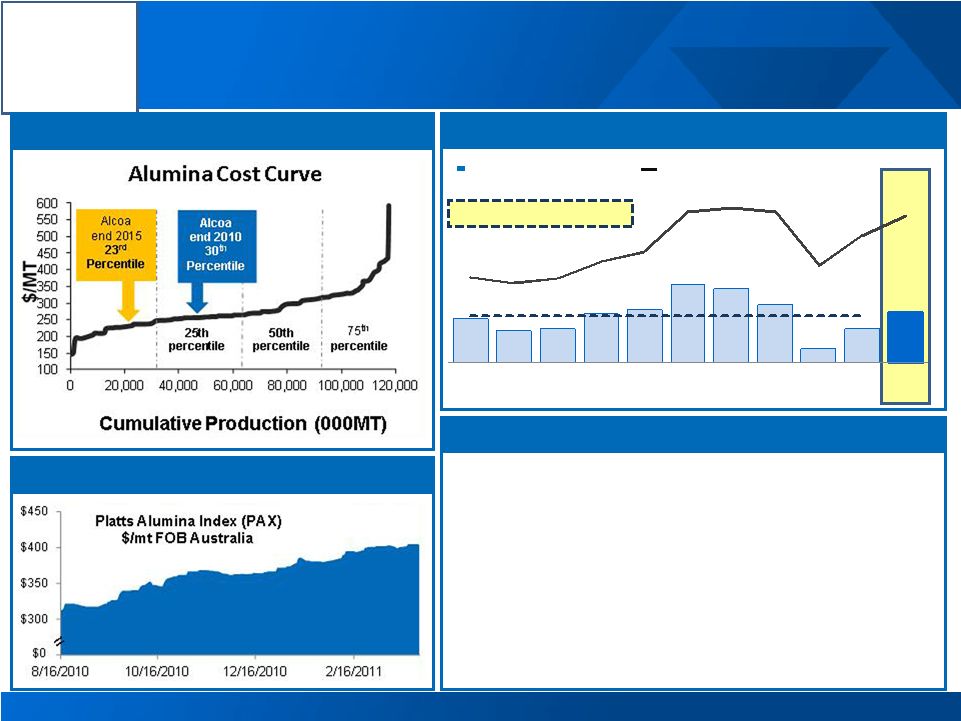
Alumina: Strong Performance and Strengthening Pricing
25
2015 Cost Curve Targets
Source: CRU; Platt’s Index
Adjusted EBITDA per Metric Ton
–
Sao
Luis
and
Juruti
continue
to
break production
records
–
Volume
increases
at
Suriname
and
Point Comfort
will provide additional exposure to rising spot prices
–
Ma’aden,
lowest
cost
refinery
online
in
2014
–
20%
of
our
customers
now
priced
on
an alumina-
indexed
or
spot
basis
Global Capacity: 18,100 kmt per year
10 Yr Average ~ $66/MT
LME
Adjusted EBITDA/MT
Strengthening Alumina Index Prices
See appendix for Adjusted EBITDA reconciliations
62
44
48
68
75
110
104
81
20
47
71
1,447
1,350
1,433
1,719
1,900
2,570
2,641
2,572
1,664
2,173
2,500
2001
2002
2003
2004
2005
2006
2007
2008
2009
2010
2011
YTD |
 Alcoa
Logo
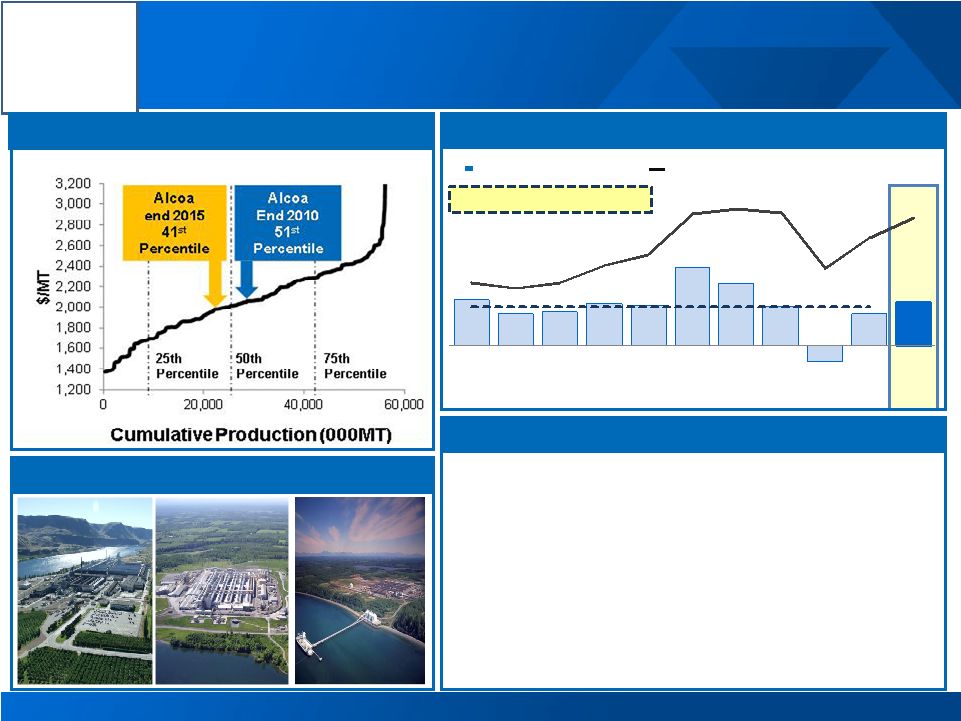
2015 Cost Curve Targets
Aluminum: Continued Strength but Looking to the Future
26
Source: CRU
Aluminum Cost Curve
–
Driving down the cost curve
–
US
restarts
on-track,
increasing
US-based
production and capturing full LME increase
–
Ma’aden,
lowest
cost
smelter
online
in
2013
–
Sustainable cost reductions
–
Repowered
asset
base
–
Capturing optimal value from global casthouses
Global Capacity: 4,500 kmt
Adjusted EBITDA per Metric Ton
LME
Adjusted EBITDA/MT
US Production Captures LME Increase
See appendix for Adjusted EBITDA reconciliations
460
321
336
418
398
784
626
392
(159)
320
438
1,447
1,350
1,433
1,719
1,900
2,570
2,641
2,572
1,664
2,173
2,500
2001
2002
2003
2004
2005
2006
2007
2008
2009
2010
2011
YTD
10 YR Average ~ $390/MT |
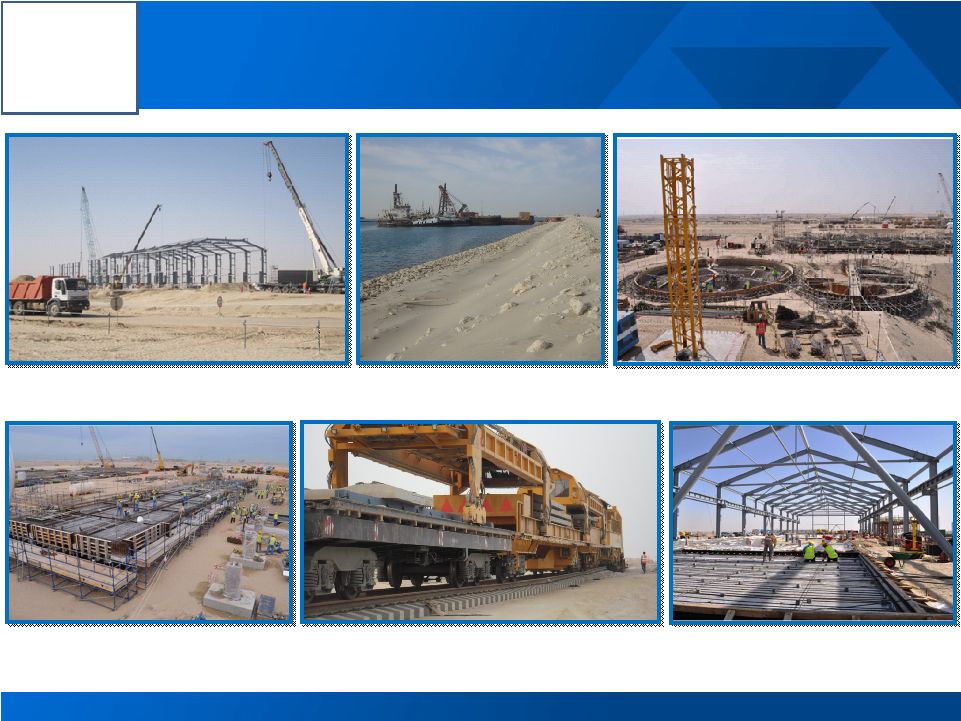 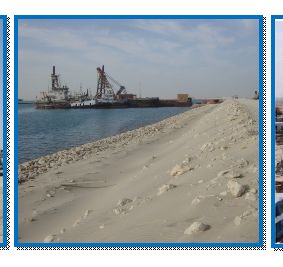   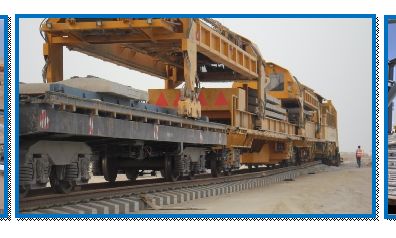 Alcoa Logo
27
Ma’aden Project is progressing very well
Potline #1
Electrical Switch
Building
Cathode Sealing
Plant
Paste Plant
Port
Rail |
 Alcoa
Logo
Distribution
15%
Automotive
7%
B&C
6%
Commercial
Transport
5%
Industrial
/Other
12%
Packaging
44%
Aerospace
11%
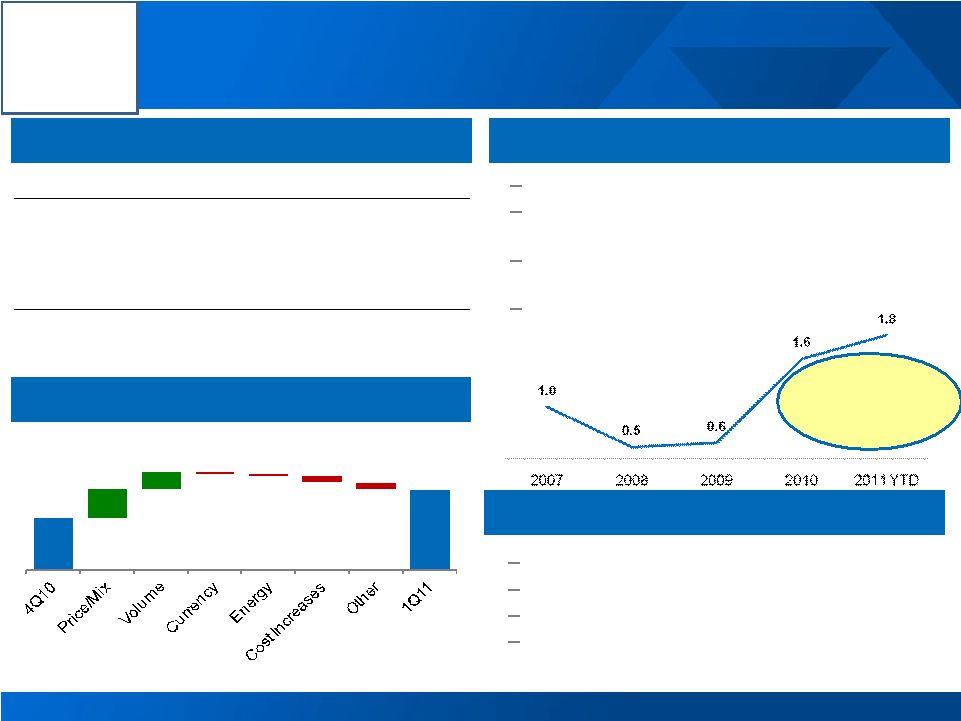
Rolled Products: Strong Start to Targeted Revenues & Margin
Adjusted EBITDA & Adjusted EBITDA Margin
28
541
495
479
531
620
536
498
254
224
551
173
Adjusted EBITDA $Millions
Adjusted EBITDA % Sales
2011 YTD 3
rd
Party Sales by Market
80%
Utilization
–
32%
revenue
growth
from
Q1
2010
–
2011 potential of at least 35 to 50% of
$2.5b 2013 revenue growth target
–
Aerospace
growth:
robust
build
rates
–
Russia
and
China
to
capture
growth
in
emerging markets
–
Ma’aden,
lowest
cost
rolling
mill
in
2013
Leveraging our strategic asset base
Strong Growth in Adjusted EBITDA per Tonne
240%
increase
from 2008
See appendix for Adjusted EBITDA reconciliations
11%
11%
10%
9%
9%
6%
5%
3%
4%
9%
9%
2001
2002
2003
2004
2005
2006
2007
2008
2009
2010
2011
YTD
1.0
0.5
0.6
1.6
1.8
2007
2008
2009
2010
2011 YTD |
   Alcoa
Logo
Russia Profitable Since Q2 2010
Solid
Growth
in
all
segments,
especially
can
stock
60% volume growth
from Q1 2010
Improving mix
of products and
customers
drives
higher
realized
conversion revenue
Focus on increasing
aluminum
consumption
and
recycling
in
Russia
29
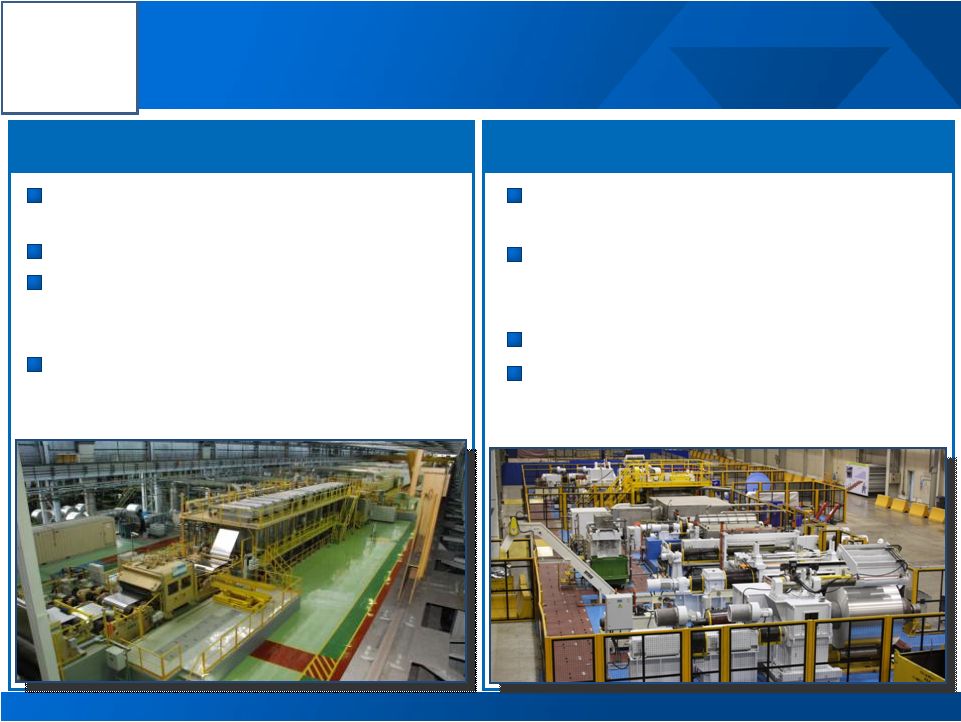
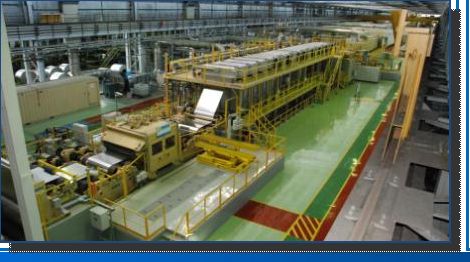
Solid Progress on GRP Growth Projects in Russia and China
China Ramping Up by 2012
End & Tab Line, Samara
Capacity
utilization
targeted
to
reach
100% by 2012
Key domestic
supplier
of
lithographic
sheet,
brazing
material
and
can
sheet
and
supplier
for
consumer
electronics
90%
volume
growth
versus
Q1
2010
Bohai
ramp-up continues
Bohai
Flat Rolled Products |
 Alcoa
Logo
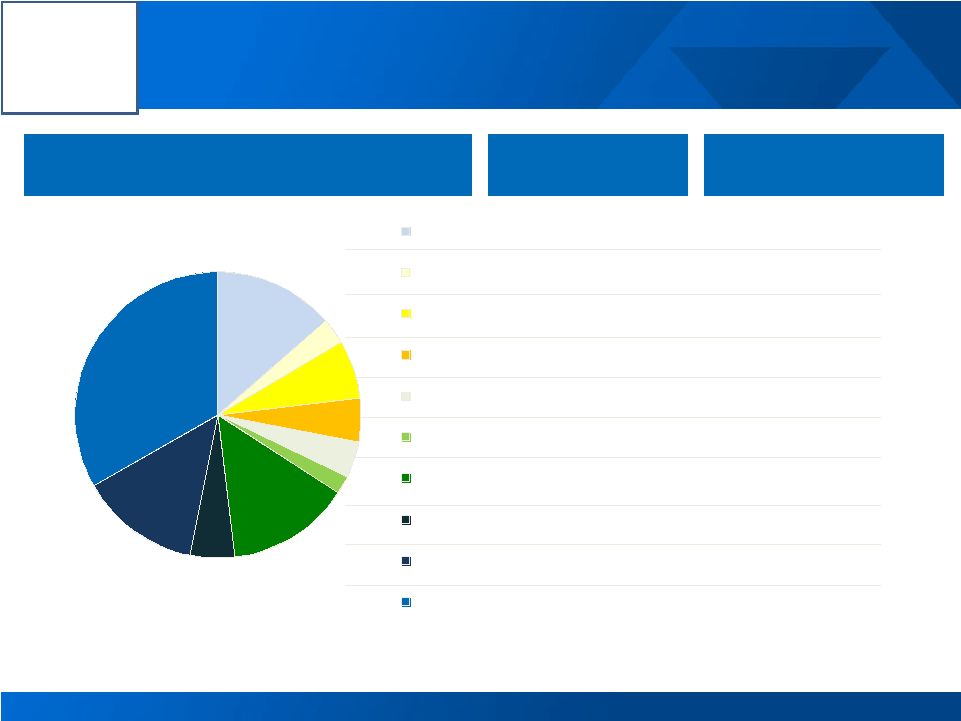
Aerospace
48%
IGT
10%
B&C
18%
Commercial
Transport
15%
Automotive
3%
Other
6%
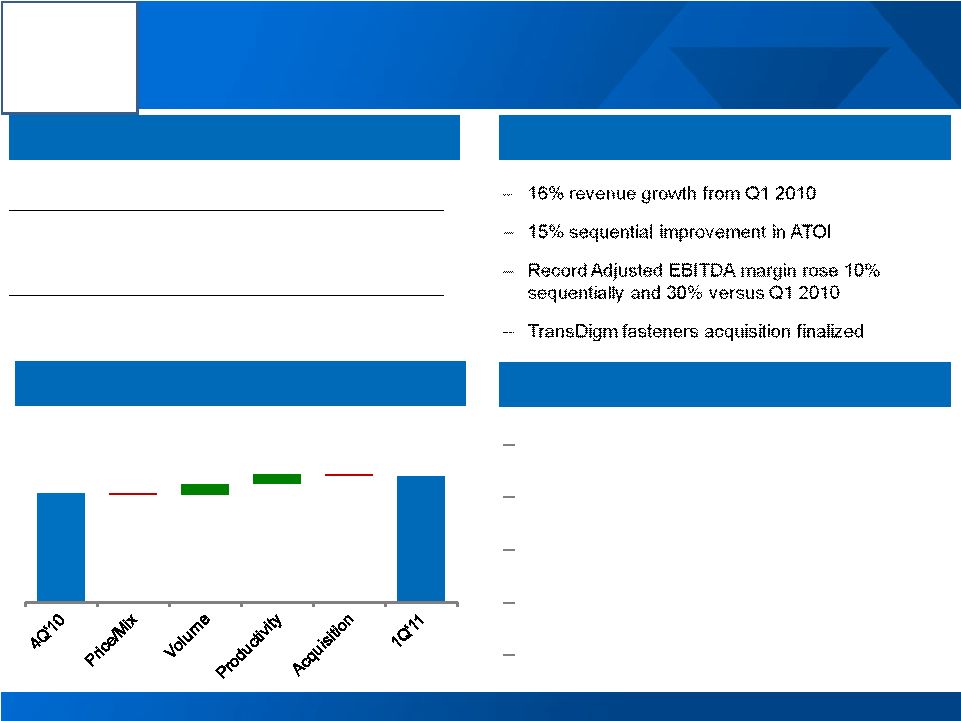
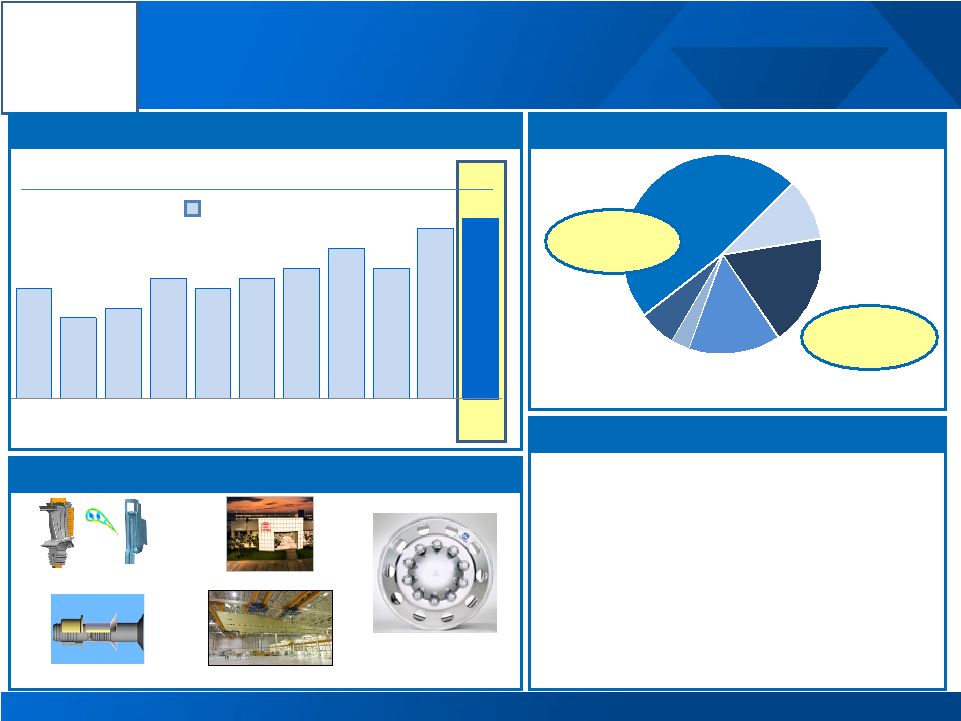
Engineered Products: Record Margins and Focus on Growth
Adjusted EBITDA & Adjusted EBITDA Margin
30
436
287
356
495
536
676
783
922
630
762
229
Adjusted EBITDA $Millions
Adjusted EBITDA % Sales
2011 YTD 3
rd
Party Sales by Market
76%
Utilization
67%
Utilization
Strong Platform for Profitable Growth
–
16% revenue growth
from Q1 2010
–
2011 potential of 25 to 30% of $1.6b
2013
revenue
growth
target
–
TransDigm
fastener acquisition
integration
on
track
with
accretive
earnings
in 2011
–
Product
innovations
and
share
gains
accelerate growth
Continued Innovation in All of our Businesses
Building & Construction
Forgings & Extrusions
Fastening Systems
Power & Propulsion
Commercial Wheels
See appendix for Adjusted EBITDA reconciliations
11%
8%
9%
12%
11%
12%
13%
15%
13%
17%
18%
2001
2002
2003
2004
2005
2006
2007
2008
2009
2010
2011
YTD |
 Alcoa
Logo
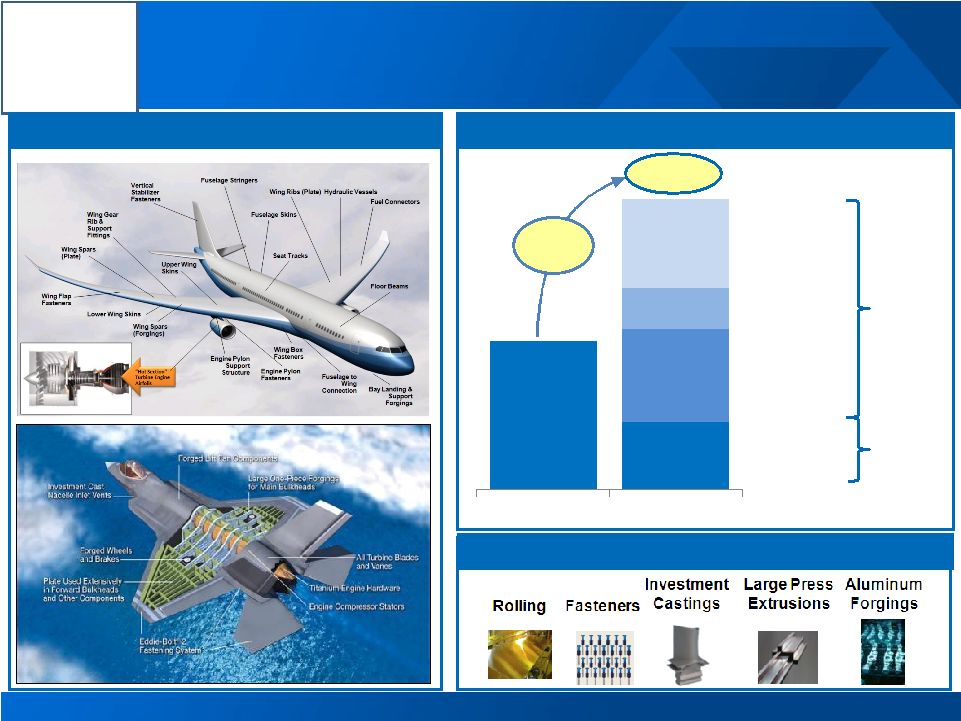
Alcoa Aerospace: A History of Growth and Innovation
31
Growth in Aerospace Revenue ($b)
Deep Product Breadth
$2.9
Alcoa Content: Tip to Tail –
Wing to Wing
2X
EPS
Fastening
Systems
Forgings &
Extrusions
Power &
Propulsion
Rolled
Products
1 Aerospace revenues are 48% of overall EPS; 2 Aerospace revenues are 11% of
overall GRP GRP
$1.5
$0.7
$0.9
$0.4
$0.9
2002
2010
1
2 |
 Alcoa
Logo
Strong Start to 2011 is Just the Beginning
Strengthening Markets
Strong Performance
32
Meeting our Aggressive Targets
EPS: $1.6b in Revenue Growth by 2013 ($b)
GRP: $2.5b in Revenue Growth by 2013 ($b)
Sales
•22% revenue growth from
Q1 2010
Alumina
•$71 Adjusted EBITDA/mt,
8% better than ten-year
average
of $66/mt
Primary Metals
•$438 Adjusted EBITDA/mt,
12% better than ten-year
average
of $390/mt
Flat-Rolled Products
•$173 million Adjusted
EBITDA was record first
quarter
result
Engineered Products &
Solutions
•18% Adjusted EBITDA
Margin was record result
See appendix for Adjusted EBITDA reconciliations
$6.3
$1.9
$8.8
$5.3
to
$5.7
2010
2011
YTD
2013
Target
$4.6
$1.2
$6.2
$3.8
to
$3.9
2010
2011
YTD
2013
Target |
 That's why …
Alcoa can't wait
Alcoa can't wait
…for tomorrow
…for tomorrow
Alcoa Logo |
 Alcoa
Logo Roy Harvey
Director, Investor Relations
A
390 Park Avenue
New York, NY 10022-4608
Telephone: (212) 836-2674
www.alcoa.com
Additional Information
34 |
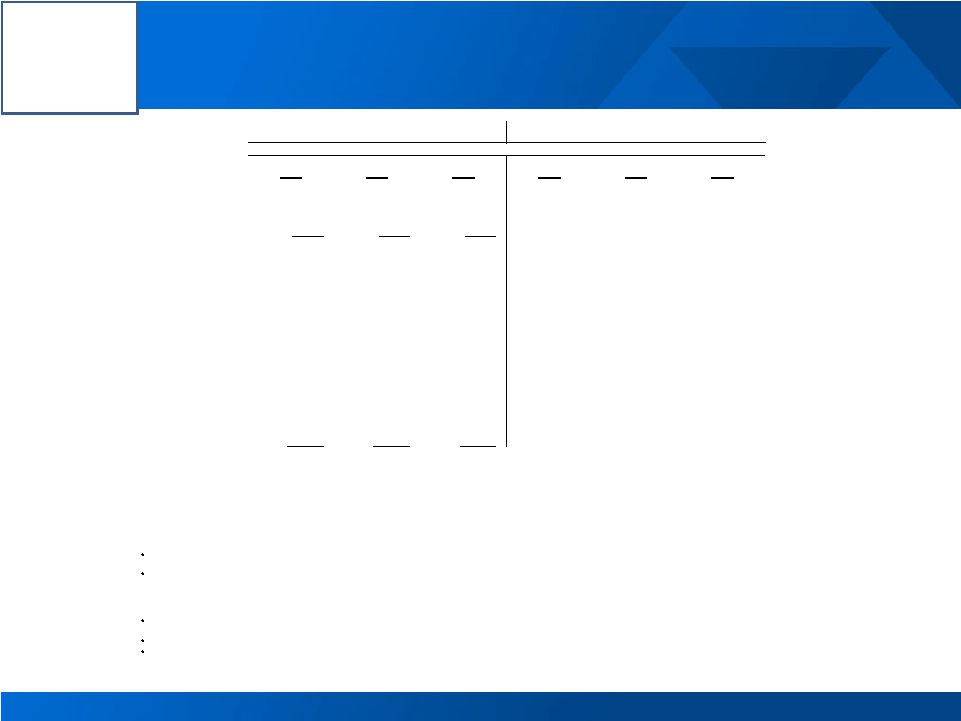
 Alcoa
Logo Annual Sensitivity Summary
35
Currency Annual Net Income Sensitivity
+/-
$0.01 versus USD
Australian $ (USD to AUD)
+/-
$10 million
Brazilian
$ (BRL to USD)
+/-
$ 3 million
Euro €
(USD to EUR)
+/-
$ 2 million
Canadian $ (CAD to USD)
+/-
$ 4 million
+/-
$100/MT = +/-
$200
Million
LME Aluminum Annual Net Income Sensitivity |
 Alcoa
Logo Revenue Change by Market
7%
30%
2%
12%
13%
(12%)
14%
(1%)
7%
1%
20%
5%
26%
37%
(2%)
8%
45%
25%
27%
16%
1Q’11 Third Party Revenue
Sequential
Change
Year-Over-Year
Change
36
13%
3%
7%
5%
4%
2%
14%
5%
14%
33%
Aerospace
Automotive
B&C
Comm. Transport
Industrial Products
IGT
Packaging
Distribution/Other
Alumina
Primary Metals |
 Alcoa
Logo
Reconciliation of ATOI to Consolidated Net (Loss) Income
Attributable to Alcoa
37
(in millions)
1Q10
2Q10
3Q10
4Q10
2010
1Q11
Total segment ATOI
$ 306
$ 381
$ 328
$
409
$ 1,424
$
555
Unallocated amounts (net of tax):
Impact of LIFO
(14)
(3)
(2)
3
(16)
(24)
Interest expense
(77)
(77)
(91)
(76)
(321)
(72)
Noncontrolling interests
(22)
(34)
(48)
(34)
(138)
(58)
Corporate expense
(67)
(59)
(71)
(94)
(291)
(67)
Restructuring and other charges
(122)
(21)
1
8
(134)
(6)
Discontinued operations
(7)
(1)
–
–
(8)
(1)
Other
(198)
(50)
(56)
42
(262)
(19)
Consolidated net (loss) income attributable to
Alcoa
$ (201)
$ 136
$ 61
$ 258
$ 254
$ 308
|
 Alcoa
Logo
Reconciliation of Adjusted Income
38
(in millions, except per-
share amounts)
Income
Diluted EPS
Quarter ended
March 31,
2010
December 31,
2010
March 31,
2011
March 31,
2010
December 31,
2010
March 31,
2011
Net (loss) income
attributable to Alcoa
$ (201)
$ 258
$ 308
$ (0.20)
$ 0.24
$ 0.27
Loss from discontinued
operations
(7)
–
(1)
(Loss) income from
continuing
operations
attributable to Alcoa
(194)
258
309
(0.19)
0.24
0.27
Restructuring and
other charges
119
(8)
5
Discrete tax items*
112
(18)
–
Other special items**
64
(9)
3
Income from
continuing
operations
attributable to Alcoa
–
as adjusted
$ 101
$ 223
$ 317
0.10
0.21
0.28
Income from continuing operations attributable to Alcoa – as adjusted is a non-GAAP financial
measure. Management believes that this measure is meaningful to investors because
management reviews the operating results of Alcoa excluding the impacts of restructuring and other charges, discrete tax
items, and other special items. There can be no assurances that additional restructuring and
other charges, discrete tax items, and other special items will not occur in future
periods. To compensate for this limitation, management believes that it is appropriate to consider both Income from continuing operations
attributable to Alcoa determined under GAAP as well as Income from continuing operations attributable
to Alcoa – as adjusted. * Discrete tax items include the following:
for the quarter ended December 31, 2010, a benefit for the reversal of the remaining valuation
allowance related to net operating losses of an international subsidiary ($16) (a portion was
initially reversed in the quarter ended September 30, 2010) and a net benefit for other small items ($2); and
for the quarter ended March 31, 2010, charges for a change in the tax treatment of federal subsidies
received related to prescription drug benefits provided under certain retiree health benefit
plans ($79), unbenefitted losses in Russia, China, and Italy ($22), interest due to the IRS related to a previously deferred gain associated with the 2007 formation
of the former soft alloy extrusions joint venture ($6), and a change in the anticipated sale structure
of the Transportation Products Europe business ($5). ** Other special items include the following:
for the quarter ended March 31, 2011, costs related to acquisitions of the aerospace fastener business
of TransDigm Group Inc. and full ownership of carbothermic smelting technology from ORKLA ASA
($8) and favorable mark-to-market changes in certain power derivative contracts ($5);
for the quarter ended December 31, 2010, favorable mark-to-market changes in certain power
derivative contracts; and for the quarter ended March 31, 2010, charges related to unfavorable mark-to-market changes in
certain power derivative contracts ($31), power outages at the Rockdale, TX and São
Luís, Brazil facilities ($17), an additional environmental accrual for the Grasse River remediation in Massena, NY ($11), and the write off of inventory related to the
permanent closures of certain U.S. facilities ($5). |
 Alcoa
Logo
Reconciliation of Free Cash Flow
39
(in millions)
Quarter ended
Year ended
March 31,
2011
December 31,
2010
Cash provided from
operations
$ (236)
$ 2,261
Capital expenditures
(204)
(1,015)
Free cash flow
$ (440)
$ 1,246
Free Cash Flow is a non-GAAP financial measure. Management believes that
this measure is meaningful to investors because management reviews cash flows
generated from operations after taking into consideration capital expenditures due
to the fact that these expenditures are considered necessary to maintain and
expand Alcoa’s asset base and are expected to generate future cash flows from
operations. It is important to note that Free Cash Flow does not represent the
residual cash flow available for discretionary expenditures since other non-
discretionary expenditures, such as mandatory debt service requirements, are not
deducted from the measure. |
 Alcoa
Logo
Reconciliation of Alcoa Adjusted EBITDA
40
($ in millions)
2001
2002
2003
2004
2005
2006
2007
2008
2009
2010
1Q10
4Q10
1Q11
Net income (loss)
attributable to
Alcoa
$ 908
$ 420
$ 938
$ 1,310
$ 1,233
$ 2,248
$ 2,564
$ (74)
$ (1,151)
$ 254
$ (201)
$ 258
$ 308
Add:
Net income
attributable to
noncontrolling
interests
205
181
212
233
259
436
365
221
61
138
22
34
58
Cumulative effect
of accounting
changes
–
(34)
47
–
2
–
–
–
–
–
–
–
–
Loss (income)
from discontinued
operations
5
101
–
27
50
(22)
250
303
166
8
7
–
1
Provision (benefit)
for income taxes
524
307
367
546
464
853
1,623
342
(574)
148
84
56
138
Other (income)
expenses, net
(295)
(175)
(278)
(266)
(478)
(236)
(1,920)
(59)
(161)
5
21
(43)
(28)
Interest expense
371
350
314
271
339
384
401
407
470
494
118
118
111
Restructuring and
other charges
530
398
(28)
(29)
266
507
268
939
237
207
187
(12)
6
Provision for
depreciation,
depletion, and
amortization
1,144
1,037
1,110
1,142
1,227
1,252
1,244
1,234
1,311
1,450
358
371
361
Adjusted EBITDA
$ 3,392
$ 2,585
$ 2,682
$ 3,234
$ 3,362
$ 5,422
$ 4,795
$ 3,313
$ 359
$ 2,704
$ 596
$ 782
$ 955
Sales
$19,906
$17,691
$18,879
$21,370
$24,149
$28,950
$29,280
$26,901
$18,439
$21,013
$ 4,887
$ 5,652
$ 5,958
Adjusted EBITDA
Margin
17%
15%
14%
15%
14%
19%
16%
12%
2%
13%
12%
14%
16%
Alcoa’s definition of Adjusted EBITDA (Earnings before interest, taxes, depreciation, and
amortization) is net margin plus an add-back for depreciation, depletion, and amortization. Net margin is equivalent to Sales minus the
following items: Cost of goods sold; Selling, general administrative, and other expenses; Research and
development expenses; and Provision for depreciation, depletion, and amortization. Adjusted EBITDA is a non-GAAP financial
measure. Management believes that this measure is meaningful to investors because Adjusted EBITDA
provides additional information with respect to Alcoa’s operating performance and the Company’s ability to meet its financial
obligations. The Adjusted EBITDA presented may not be comparable to similarly titled measures of
other companies. |
 Alcoa
Logo Reconciliation of Alumina Adjusted EBITDA
41
($ in millions, except
per metric ton
amounts)
2001
2002
2003
2004
2005
2006
2007
2008
2009
2010
4Q10
1Q11
After-tax operating
income (ATOI)
$ 471
$ 315
$ 415
$ 632
$ 682
$ 1,050
$ 956
$ 727
$ 112
$ 301
$ 65
$ 142
Add:
Depreciation,
depletion, and
amortization
144
139
147
153
172
192
267
268
292
406
107
103
Equity (income)
loss
(1)
(1)
–
(1)
–
2
(1)
(7)
(8)
(10)
(3)
(3)
Income taxes
184
130
161
240
246
428
340
277
(22)
60
14
44
Other
(17)
(14)
(55)
(46)
(8)
(6)
2
(26)
(92)
(5)
(3)
–
Adjusted EBITDA
$ 781
$ 569
$ 668
$ 978
$ 1,092
$ 1,666
$ 1,564
$ 1,239
$ 282
$ 752
$ 180
$ 286
Production
(thousand metric
tons) (kmt)
12,527
13,027
13,841
14,343
14,598
15,128
15,084
15,256
14,265
15,922
4,119
4,024
Adjusted
EBITDA/Production
($ per metric ton)
$ 62
$ 44
$ 48
$ 68
$ 75
$ 110
$ 104
$ 81
$ 20
$ 47
$ 44
$ 71
Alcoa’s definition of Adjusted EBITDA (Earnings before interest, taxes, depreciation, and
amortization) is net margin plus an add-back for depreciation, depletion, and amortization. Net margin is equivalent to Sales minus the
following items: Cost of goods sold; Selling, general administrative, and other expenses; Research and
development expenses; and Provision for depreciation, depletion, and amortization. The Other line in the table above includes
gains/losses on asset sales and other nonoperating items. Adjusted EBITDA is a non-GAAP
financial measure. Management believes that this measure is meaningful to investors because Adjusted EBITDA provides additional
information with respect to Alcoa’s operating performance and the Company’s ability to meet
its financial obligations. The Adjusted EBITDA presented may not be comparable to similarly titled measures of other companies.
|
 Alcoa
Logo Reconciliation of Primary Metals Adjusted EBITDA
42
($ in millions, except
per metric ton
amounts)
2001
2002
2003
2004
2005
2006
2007
2008
2009
2010
1Q11
After-tax operating
income (ATOI)
$ 905
$ 650
$ 657
$ 808
$ 822
$ 1,760
$ 1,445
$ 931
$ (612)
$ 488
$ 202
Add:
Depreciation,
depletion, and
amortization
327
300
310
326
368
395
410
503
560
571
141
Equity (income) loss
(52)
(44)
(55)
(58)
12
(82)
(57)
(2)
26
(1)
(1)
Income taxes
434
266
256
314
307
726
542
172
(365)
96
53
Other
(8)
(47)
12
20
(96)
(13)
(27)
(32)
(176)
(7)
1
Adjusted EBITDA
$ 1,606
$ 1,125
$ 1,180
$ 1,410
$ 1,413
$ 2,786
$ 2,313
$ 1,572
$ (567)
$ 1,147
$ 396
Production
(thousand metric
tons) (kmt)
3,488
3,500
3,508
3,376
3,554
3,552
3,693
4,007
3,564
3,586
904
Adjusted
EBITDA/Production
($ per metric ton)
$ 460
$ 321
$ 336
$ 418
$ 398
$ 784
$ 626
$ 392
$ (159)
$ 320
$ 438
Alcoa’s definition of Adjusted EBITDA (Earnings before interest, taxes, depreciation, and
amortization) is net margin plus an add-back for depreciation, depletion, and amortization. Net margin is equivalent to Sales minus the
following items: Cost of goods sold; Selling, general administrative, and other expenses; Research and
development expenses; and Provision for depreciation, depletion, and amortization. The Other line in the table above includes
gains/losses on asset sales and other nonoperating items. Adjusted EBITDA is a non-GAAP
financial measure. Management believes that this measure is meaningful to investors because Adjusted EBITDA provides additional
information with respect to Alcoa’s operating performance and the Company’s ability to meet
its financial obligations. The Adjusted EBITDA presented may not be comparable to similarly titled measures of other companies.
|
 Alcoa
Logo Reconciliation of Flat-Rolled Products Adjusted EBITDA
43
($ in millions, except
per metric ton
amounts)
2001
2002
2003
2004
2005
2006
2007
2008
2009
2010
1Q11
After-tax
operating income
(ATOI)
$ 253
$ 225
$ 222
$ 254
$ 278
$ 233
$ 178
$ (3)
$ (49)
$
220
$ 81
Add:
Depreciation,
depletion, and
amortization
167
184
190
200
220
223
227
216
227
238
58
Equity loss
2
4
1
1
–
2
–
–
–
–
–
Income taxes
124
90
71
75
121
58
92
35
48
92
33
Other
(5)
(8)
(5)
1
1
20
1
6
(2)
1
1
Adjusted EBITDA
$ 541
$ 495
$ 479
$ 531
$ 620
$ 536
$ 498
$ 254
$ 224
$ 551
$ 173
Total sales
$ 4,868
$ 4,571
$ 4,768
$ 6,042
$ 7,081
$ 8,610
$ 9,597
$ 9,184
$ 6,182
$ 6,457
$ 1,961
Adjusted EBITDA
Margin
11%
11%
10%
9%
9%
6%
5%
3%
4%
9%
9%
Total shipments
(thousand metric
tons) (kmt)
2,482
2,361
1,888
1,755
470
Adjusted
EBITDA/Total
shipments ($ per
metric ton)
$ 201
$ 108
$ 119
$ 314
$ 368
Alcoa’s definition of Adjusted EBITDA (Earnings before interest, taxes, depreciation, and
amortization) is net margin plus an add-back for depreciation, depletion, and amortization. Net margin is
equivalent to Sales minus the following items: Cost of goods sold; Selling, general administrative,
and other expenses; Research and development expenses; and Provision for depreciation,
depletion, and amortization. The Other line in the table above includes gains/losses on asset
sales and other nonoperating items. Adjusted EBITDA is a non-GAAP financial measure.
Management believes that this measure is meaningful to investors because Adjusted EBITDA provides
additional information with respect to Alcoa’s operating performance and the Company’s
ability to meet its financial obligations. The Adjusted EBITDA presented may not be comparable
to similarly titled measures of other companies. |
 Alcoa
Logo
Reconciliation of Engineered Products and Solutions
Adjusted EBITDA
44
Alcoa’s definition of Adjusted EBITDA (Earnings before interest, taxes, depreciation, and
amortization) is net margin plus an add-back for depreciation, depletion, and
amortization. Net margin is equivalent to Sales minus the following items: Cost of goods sold;
Selling, general administrative, and other expenses; Research and development expenses; and
Provision for depreciation, depletion, and amortization. The Other line in the table above includes gains/losses on asset sales and other nonoperating items.
Adjusted EBITDA is a non-GAAP financial measure. Management believes that this measure is
meaningful to investors because Adjusted EBITDA provides additional information with respect to
Alcoa’s operating performance and the Company’s ability to meet its financial obligations. The Adjusted EBITDA presented may not be comparable to
similarly titled measures of other companies.
|