Attached files
| file | filename |
|---|---|
| 8-K - FORM 8-K - SmartStop Self Storage, Inc. | d8k.htm |
 April 13,
2011 Hosted By
H. MICHAEL SCHWARTZ
Chairman and CEO
2011 First Quarter Report
Exhibit 99.1 |
 Disclaimer
CAUTIONARY NOTE REGARDING FORWARD-LOOKING STATEMENTS
Certain statements contained in this material, other than historical facts, may be considered
forward-looking statements within the meaning of Section 27A of the Securities Act
of 1933, as amended (the “Securities Act”) and Section 21E of the Securities
Exchange Act of 1934, as amended (the “Exchange Act”). We intend for all such
forward looking statements to be covered by the applicable safe harbor provisions for
forward-looking statements contained in Section 27A of the Securities Act and
Section 21E of the Exchange Act, as applicable. Such statements include, in
particular, statements about our plans, strategies, and prospects and are subject to
certain risks and uncertainties, including known and unknown risks, which could cause actual
results to differ materially from those projected or anticipated. Therefore, such
statements are not intended to be a guarantee of our performance in future periods.
Such forward-looking statements can generally be identified by our use of
forward-looking
terminology
such
as
“may,”
“will,”
“expect,”
“intend,”
“anticipate,”
“estimate,”
“believe,”
“continue,”
or other similar words. Readers are cautioned not to place undue reliance on these
forward-looking statements,
which
speak
only
as
of
the
date
this
report
is
filed
with
the
Securities
and
Exchange
Commission.
We cannot guarantee the accuracy of any such forward looking statements contained in this
material, and we do not intend to publicly update or revise any forward-looking
statements, whether as a result of new information, future events, or otherwise.
Any such forward-looking statements are subject to risks, uncertainties, and other
factors and are based on a number of assumptions involving judgments with respect to,
among other things, future economic, competitive,
and market conditions, all of which are difficult or impossible to predict accurately. To the
extent that our assumptions differ from actual results, our ability to meet such
forward-looking statements, including our ability
to generate positive cash flow from operations and provide distributions to stockholders, and
our ability to find suitable investment properties, may be significantly hindered.
All forward-looking statements should be read in light of the risks identified in
Part I, Item 1A of our Annual Report on Form 10-K for the Year Ended December 31,
2010. |
 Agenda
2010 Financials
Portfolio Update
Property Management
Strategic Vision |
 2010
Financials 2010 Year-End
Total Properties: 45
Total Units: 31,640
Net Rentable Sq. Ft.: 3,949,500
Total Assets: $307.4 Million
(As of 3/31/2011)
(61)
(40,750)
(5,072,300)
(approx. $389M) |
 Historical
Annual Distribution Yield* 2010 Financials
* Distributions are declared quarterly by the Board of Directors. During the offering period,
a substantial portion of distributions may be funded by offering proceeds or
borrowings, some of which may constitute a return of capital. Future distribution
declarations are at the sole discretion of the Board of Directors. |
 Total Assets
by Quarter 2010 Financials |
 Total
Revenues by Quarter 2010 Financials |
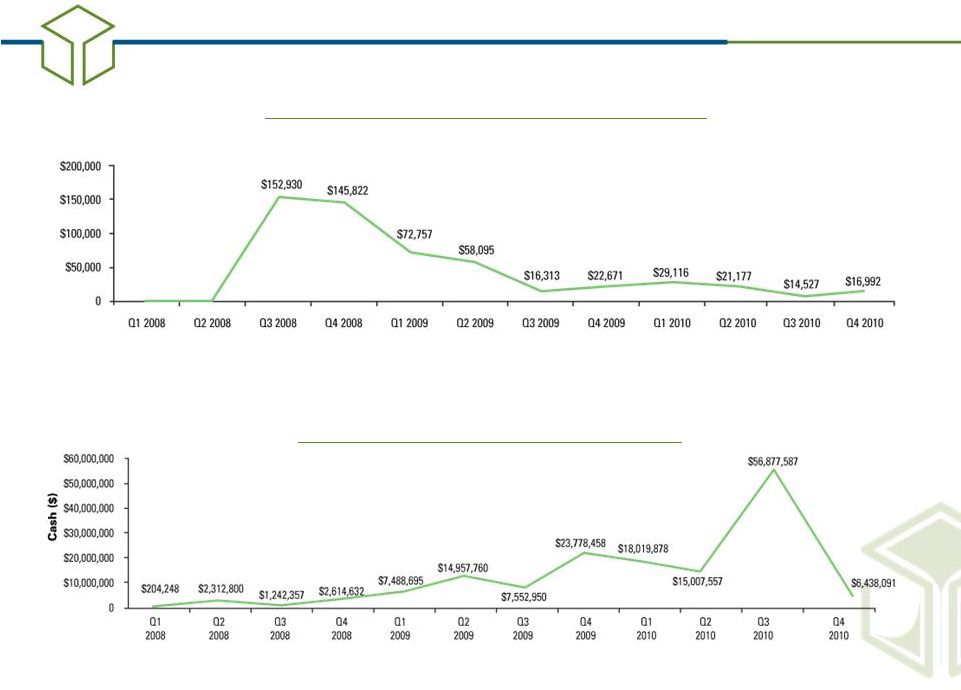 G&A Per
Property by Quarter 2010 Financials
Cash on Hand by Quarter |
 Debt
Maturities Next 5 Years* 2010 Financials
* Includes Amortization |
 Historical
Annual Occupancy 2010 Financials |
 Same Store
Occupancy by Quarter 2010 Financials |
 Portfolio
Highlights (as of 03/31/2011)
Properties:
61
Net Rentable SF:
5,072,300
Total Units:
40,750
States:
16
Ontario, Canada:
2
Portfolio Update |
 Wholly Owned
Properties by Quarter Portfolio Update |
 Net Rentable
Square Feet by Quarter Portfolio Update |
 Square
Footage
by
State
(as
of
03/31/2011)
9.38%
4.16%
7.3%
4.79%
11.07%
18.4%
2.85%
1.31%
5.18%
1.29%
1.98%
7.91%
.97%
4.95%
3.06%
11.87%
3.53%
Portfolio Update |
 2011 First
Quarter Acquisitions Portfolio Update
* Acquired through acquisition of 100% of the ownership interests in Self Storage I,
DST. (1) Amount of units and square footage when construction is completed.
Property
Approx. Units
Approx. Rentable Sq. Ft. (net)
1
Concord –
NC*
530
56,200
2
Hickory –
NC*
600
70,600
3
Morganton –
NC*
450
52,100
4
El Paso II –
TX*
520
72,900
5
El Paso III –
TX*
750
81,200
6
El Paso IV –
TX*
510
67,400
7
El Paso V –
TX*
420
60,500
8
Dallas –
TX *
660
131,000
9
Lawrenceville I –
GA*
500
73,500
10
Lawrenceville II –
GA*
500
60,600
11
Mississauga –
Ontario –
Canada
800
(1)
101,000
(1)
12
El Paso I –
TX
290
(1)
40,800
(1)
13
Las Vegas VII –
NV
720
58,400
14
Las Vegas VIII –
NV
510
60,600
15
SF Bay Area –
Morgan Hill –
CA
490
61,000
16
SF Bay Area –
Vallejo –
CA
860
75,000
Total
9,110
1,122,800 |
 Potential
Acquisitions* Portfolio Update
Property
Acquisition Price
Approx. Units
Approx. Rentable Sq. Ft. (net)
1
SF Bay Area –
San Lorenzo –
CA
$2,850,000
640
62,000
2
SF Bay Area –
Gilroy –
CA
$6,560,000
610
63,500
3
Las Vegas V –
NV
$4,600,000
790
69,000
4
Ladera Ranch –
CA
$20,900,000
(1)
980
102,000
5
Neptune –
NJ
$3,760,000
530
54,500
6
Peachtree City –
GA
$5,290,000
670
123,400
7
Buford –
GA
$2,500,000
520
68,900
8
Jonesboro –
GA
$2,440,000
730
106,400
9
Ellenwood –
GA
$2,260,000
300
40,700
10
Marietta II –
GA
$2,620,000
480
61,200
11
Collegeville –
PA
$3,030,000
540
58,400
12
Skippack –
PA
$2,340,000
390
56,300
13
Ballston Spa –
NY
$5,030,000
690
82,800
14
Trenton –
NJ
$7,620,000
660
85,100
15
Fredericksburg –
VA
$4,180,000
630
59,600
16
Sandston –
VA
$6,720,000
680
78,100
Total
$82,700,000
9,840
1,171,900
*There can be no assurance that we will complete the acquisition of any of these properties.
In some circumstances, if we fail to complete the acquisitions, we may forfeit our
earnest money. Other properties may be identified in the future that we may acquire prior to or instead of these properties. Due to the
considerable conditions to the consummation of these acquisitions, we cannot make any
assurances that the closings are probable.
(1) Includes an adjoining parcel of vacant land, which has an acquisition price of
approximately $3,900,000. |
 New
Technology to View Updates SSTI Mobile App
Available on Apple, Android and
Blackberry market
Free download (search “SSTI”)
User-friendly and content-rich
Receive the latest updates
1
st
non-traded REIT app on the
iPhone, Android and Blackberry
Portfolio Update |
 Property
Management We are an Operating Company
Experienced executive team
Highly skilled district management team
Dedicated training of local on-site staff
Customer-centric approach
Competitive pricing strategy
One-stop shopping experience
Branding, Branding, Branding
Marketing, Marketing, Marketing |
 Property
Management Integrated Marketing Strategy
Online, phone and walk-in customers |
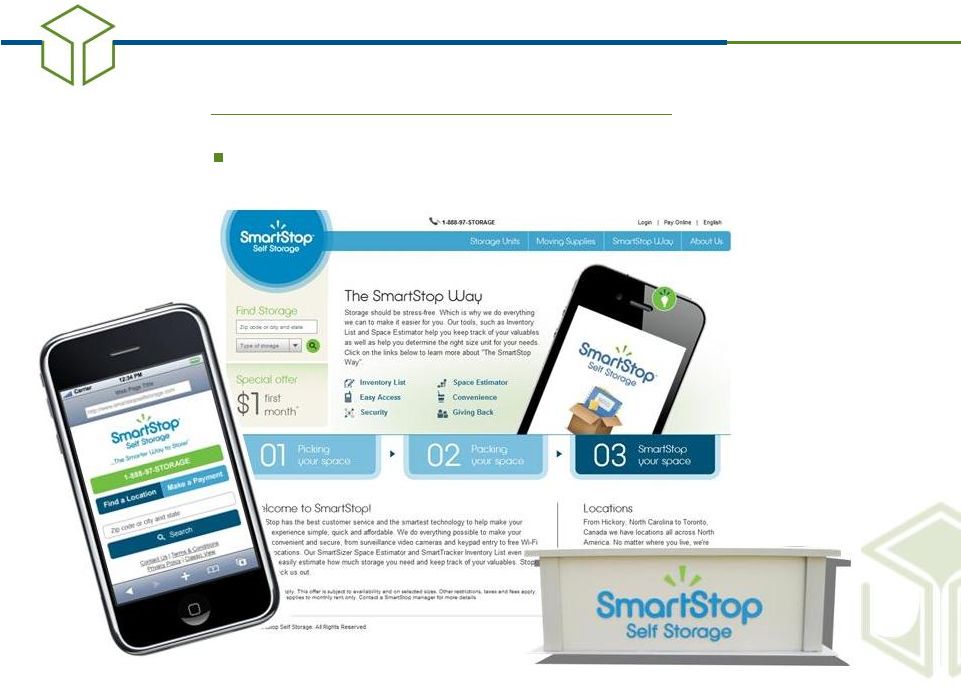
 Online
New website launch improves customer service
Pay Per Click (PPC) campaign
Generate leads
Improve brand recognition
Search Engine Optimization (SEO) process
Gain dominant position in natural listings
Take advantage of minimal cost per prospect
Social media sites
Mobile-friendly version
Property Management
www.smartstopselfstorage.com |
 Phone
New “print”
Yellow Page and “internet”
Yellow
Page campaigns
Partnership with OpenTech Alliance for national
rental call center
Expanded business hours with high quality
agents
Property Management
888-97-STORAGE |
 Walk-in
Strategically position brand on building exteriors,
interiors and on available signage
23 Properties are now branded
5 more properties are scheduled to be
completed in the near term
10 additional properties have permits, of these 5
already have temporary signage
Branded our own small fleet of trucks
Property Management |
 Economies of
Scale Real economies for self storage
More than any other asset class
Property Management |
 Strategic
Vision |
 Strategic
Vision Bill Gross, who runs the world's biggest bond fund at Pacific
Investment Management Co. (PIMCO), said Treasuries
"have little value" and the U.S. faces an inflation threat.
–
Bloomberg, March 31,
2011 |
 Strategic
Vision $1,080.00
(Million)
$631.58
(Million)
$1,730.00
(Million)
$881.40
(Million)
$953.28
(Million)
$724.22
(Million)
$18,710.00
(Million)
$5,280.57
(Million)
PUBLICLY TRADED SELF STORAGE REITS
PUBLIC NON-TRADED SELF STORAGE REIT
(1) Wall Street Journal 4/7/11
(2) Wall Street Journal 12/31/10
Market Cap
(1)
Book Value
(2) |
 Strategic
Storage Holdings, LLC Ranks # 12
Inside Self Storage
2011 Top-Operators List
April, 2011 Issue
Strategic Vision |
 H. MICHAEL
SCHWARTZ Chairman and CEO
Strategic Storage Trust, Inc.
Questions and Answers |
 April 13,
2011 Hosted By
H. MICHAEL SCHWARTZ
Chairman and CEO
2011 First Quarter Report |