Attached files
| file | filename |
|---|---|
| 8-K - FORM 8-K - TPC Group Inc. | d8k.htm |
 A
Valuable, Unique & Stable Bridge from Mixed C4 to Purity Products
A Service-Based Intermediary
with Strong Infrastructure
& Logistics Network
Spring Update
Exhibit 99.1 |
 Forward-Looking Statements & Non-GAAP Financial Measures
This
presentation
may
contain
“forward-looking
statements”
within
the
meaning
of
the
securities
laws.
These
statements
include
assumptions,
expectations,
predictions,
intentions
or
beliefs
about
future
events,
particularly
statements
that
may
relate
to
future
operating
results,
existing
and
expected
competition,
market
factors
that
may
impact
financial
performance,
and
plans
related
to
strategic
alternatives
or
future
expansion
activities
and
capital
expenditures.
Although
TPC
Group
believes
that
such
statements
are
based
on
reasonable
assumptions,
no
assurance
can
be
given
that
such
statements
will
prove
to
have
been
correct.
A
number
of
factors
could
cause
actual
results
to
vary
materially
from
those
expressed
or
implied
in
any
forward-looking
statements,
including
risks
and
uncertainties
such
as
volatility
in
the
petrochemicals
industry,
limitations
on
the
Company’s
access
to
capital,
the
effects
of
competition,
leverage
and
debt
service,
general
economic
conditions,
litigation
and
governmental
investigations,
and
extensive
environmental,
health
and
safety
laws
and
regulations.
More
information
about
the
risks
and
uncertainties
relating
to
TPC
Group
and
the
forward-looking
statements
are
found
in
the
Company’s
SEC
filings,
including
the
Transition
Report
on
Form
10-K,
which
are
available
free
of
charge
on
the
SEC’s
website
at
http://www.sec.gov
.
TPC
Group
expressly
disclaims
any
obligation
to
update
any
forward-
looking
statements
contained
herein
to
reflect
events
or
circumstances
that
may
arise
after
the
date
of
this
presentation.
This
presentation
may
also
include
non-GAAP
financial
information.
A
reconciliation
of
non-GAAP
financial
measures
to
the
most
directly
comparable
GAAP
financial
measures,
as
well
as
additional
detail
regarding
the
utility
of
such
non-GAAP
financial
information,
is
included
in
the
Appendix.
2 |
 Business Overview
3
•
We manufacture products in high demand that support global
mobilization
–
Rubber, fuel & lube additives = 75% of our end market applications
–
US car ownership 800/1000, Asia car ownership 40/1000
•
…From feedstocks that are in tight supply
–
Light/heavy steam cracker feedstocks = roughly 80/20%
–
Limits C4 availability + butadiene content
•
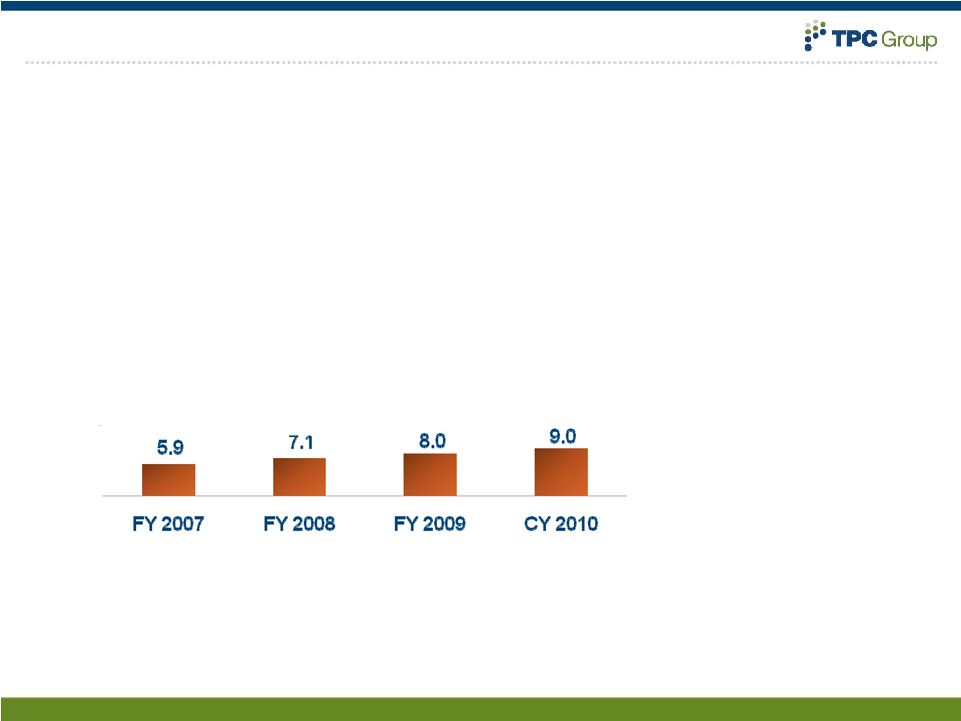
…That produces stable margins*
•
…
And has room to grow
–
$150M Adjusted EBITDA forecasted for 2012 ($107M in calendar
2010) –
Potential impact from dehydrogenation project
In cents/lb
*FY
2009
reflects
the
first
installment
of
the
insurance
claim
of
$10.0
million,
as
well
as
the
unauthorized
freight
payment
recovery
of
$4.7
million.
CY
2010
reflects
the
full
installment
of
the
insurance
claim
of
$17.1
million |
 Products Overview
4
Performance Products
Crude C4 Processing
Butadiene
Polyisobutylene
“PIB”
HR-PIB
Conventional
PIB
Gasoline &
Lube
Additives
Isobutylene
Products
Isobutylene
Diisobutylene
Phenolic
Resins
Surfactants
Fuel & Lube
Additives
Propylene
Derivatives
Nonene
Tetramer
Plasticizers
Lube Additives
Surfactants
Antioxidants
Butene-1
Raffinates
& MTBE
Butylenes
Butane
Gasoline
Blendstocks
Synthetic
Rubber
Elastomers
Nylon
Polyethylene
Fuel
Additives
Broad Product Portfolio |
 TPC
Group: Substantial & Strategic Asset Value 5
|
 Aligned With Industry Growth
6
Goodyear
Lanxess
Invista
Afton / Newmarket
Macro, global market assumptions:
•
Cars in use:
•
2000-2010: +150 million
•
2010-2020: +240 million
•
+50 million tires/year, 2011-2015
•
2010-2013 CAGR:
•
18% in consumer replacables
•
42% in commercial replacables
Source: company reports
•
Hi-performance rubber capacity expansion
•
U.S., Brazil, Germany
•
Hi-performance tire growth globally expected to
be 53% from 2010 to 2015
•
“…[from 2009 to 2010] All business units [within
Performance Polymers] increased prices,
overcompensating higher raw material prices –
especially butadiene
•
Announcement of New Nylon 6,6
Intermediates and Polymer Plant in Shanghai
(2/2011)
•
Commence production in 2014
•
“…
will employ Invista's latest advances in its
proprietary butadiene-based technology.”
Outlook for 2011
•
“We expect 2011 to be more profitable than
2010 as we project an increase in volume,
revenue and net income.”
•
“Our primary focus in the acquisition area
remains on the petroleum additives industry. It is
our view that this industry will provide the
greatest opportunity for a good return on our
investments, while minimizing risk.”
Our customers are experiencing and expecting growth |
 Business Segments –
C4 Processing & Performance Products
7
C4 Processing
Performance Products
21% Performance
Products
34% Performance
Products
14.6¢/lb
2.9 Billion lbs.
(CY 2010)
$268.1 Million
(CY 2010)
79% C4 Processing
66% C4 Processing
7.6¢/lb |
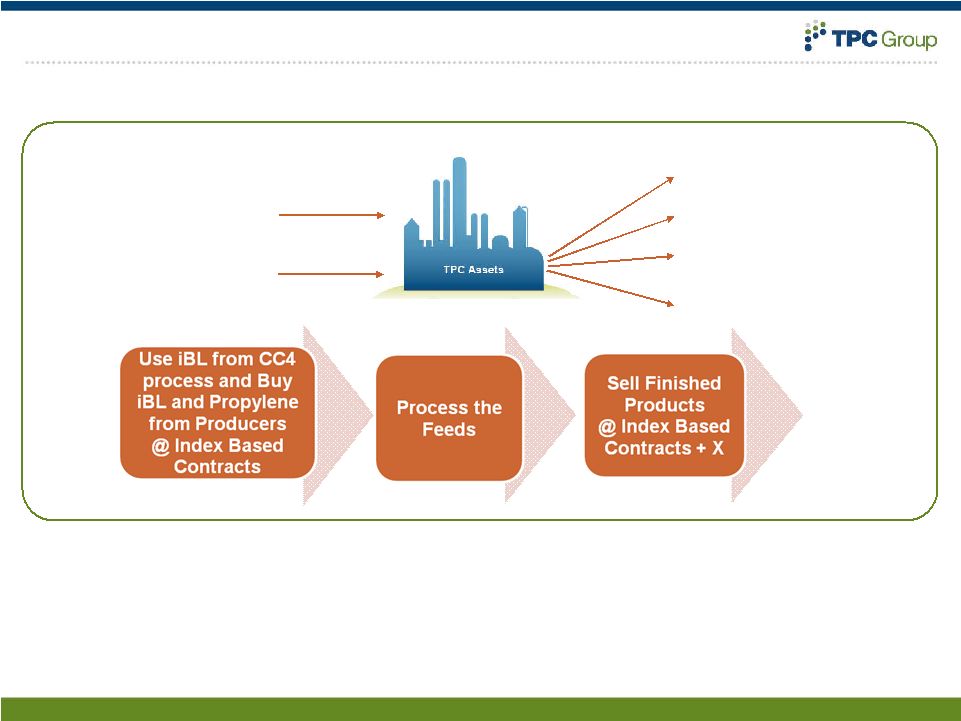
 C4
Processing: What We Do 8
•
Relatively
Stable
Unit
Margins
Cash
flow
generation
throughout
the
cycle
•
Service-based contracts and almost 2 inventory
turns/month
Mitigate
Commodity
Risk
•
No exposure to exchange rate movements
Ethylene Plants
Ethylene
Propylene
C
4
‘s
B-1
BD
Raffinates
Isobutylene |
 Unique, Long-standing Relationships with Customers and
Suppliers
9
»
Customers and suppliers put their trust in TPC
»
Customers rely on TPC for securing raw materials, which they cannot make or
significantly import »
Suppliers rely on TPC for taking their Crude C4s, which they cannot purify and cannot
store »
Large chemical producing and refining customer base, large established supplier and
customer base »
Long term relationships
Customers
Feedstock Suppliers
•
Premier processing reliability record
•
Major Crude C4 processor for fifteen
ethylene plants
•
Highest Crude C4 processing capacity in
North America
•
Five separate processing units at two
independent sites
•
Processing relationships with ten Crude C4
suppliers that exceed fifteen years
•
Crude C4 processor for every non-
integrated North American ethylene
producer
Critical Component in the Ethylene Value Chain |
 Crude C4 Market Fundamentals
10
Source: CMAI; Light: Ethane, Propane Butane / Heavy: Naphtha, Fuel Oil; ytd through
February Ethylene Cracker Rates
B/E Ratio
Source: CMAI
Source: CMAI
Feed to US Steam Crackers |
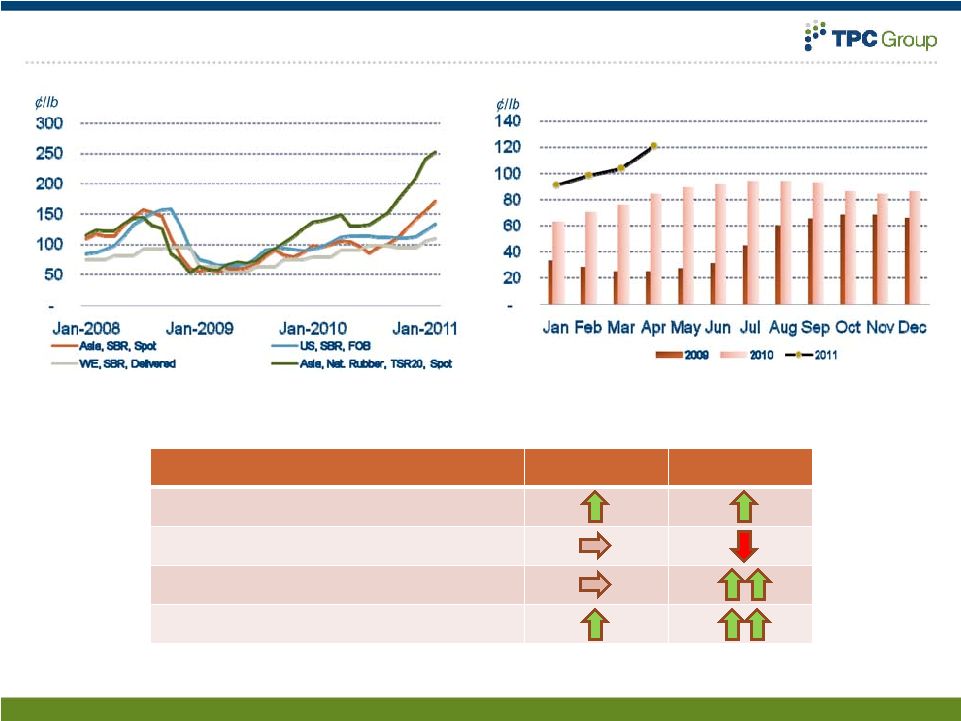 Butadiene Market Fundamentals
11
Source: CMAI
Source: CMAI
Butadiene Market Drivers
Near Term
Long Term
Steam cracker rates
B/E ratio
End-market supply/demand
Global commodity prices
U.S. Butadiene Price
Global Synthetic and Natural Rubber Prices |
 Performance Products: What We Do
12
Isobutylene (iBL)
PIB
HPIB
Nonene/
Tetramer
DIB
Propylene |
 Performance Products –
Description
13
Market Dynamics
Growth Opportunities
Products
Description
PIB
(polyisobutylene)
HR-PIB
(highly reactive -
polyisobutylene)
•
1/3 of performance
product volume
•
75% of end-market lube
and fuel additives
•
HR-PIB, patent protected
•
Historically highest
margins across product
slate
•
Concentrated fuel and lube
additive end-market users
•
Limited merchant capacity
•
Steady HR-PIB global growth of
5-7%/ yr
DIB
(diisobutylene)
•
70% of end-market lube
and fuel additives
•
Specialized chemical applications
•
Very few producers
•
De-bottlenecking projects
•
Impact of Japan
Propylene
Derivatives
(nonene & tetramer
•
Produced from Baytown
plant; only dedicated
nonene and tetramer
plant in N.A.
•
All product sold to single
customer
•
Follows global growth of end-
markets: plasticizers, detergents,
fuel additives
•
De-bottlenecking projects |
 Clear Path To 2012 EBITDA Target of $150 Million
14
Notes:
2009
EBITDA
excludes
fees
associated
with
opportunistic
/
non-recurring
inventory
handling
•
Fee structure enabling continued
improvement in ROIC
•
Margin expansion mainly in performance
products
•
Predominantly sold-out;
limits near term volume
expansion
•
High ROI projects support
margin growth
•
$83/bbl crude oil assumption
2010
2012 |
 Dehydrogenation Project
•
Asset
–
Unit was mothballed in 2007, and
predominately manufactured MTBE
•
Opportunity
–
Feedstock: isobutane
–
Output: Isobutylene
–
But flexible
15
•
Rationale
–
Feedstock constrained
–
Construction costs below greenfield
–
NGL economics
•
Current Activity
–
$5 million for engineering study
–
Potentially $10 million more in 2011 |
 Dehydrogenation Project
16
Isobutane (iC4)
Dehydro Unit
•
$100-$150 million capital
investment
•
3 years
•
Expected return 18-24%
Isobutylene (iBL)
600-650 mmppy
to Performance Products
•Polyisobutylene
•Diisobutylene
2005-2010
2010
2011 ytd
Isobutane
72
76
71
MTBE
116
114
114
% of Unleaded Regular Gasoline, spot price
Source: Platt’s
to gas blendstock production
•MTBE / ETBE |
 Conclusion
Differentiated Service-Based Business Model Following Mobility Megatrend
•
Asia move towards mobility and urbanization driving global demand for our
products •
Long-standing, service-based contracts limit exposure to commodity
prices Feedstock supply secured through multi-year contracts
Positioned for Margin Expansion and Growth
•
Commodity strength and global GDP growth enhancing product need
•
Clear path towards 2012 expectations
•
Capital plan to enhance earnings base
Significant Free Cash Flow
•
Strong focus on operational excellence and cost management
•
Steady cash flow ‘through the cycle’
17 |
 Appendix
18 |
 TPC
Manufacturing Overview 19
Three World-Scale Facilities
Source: Company data |
 12/31/10
9/30/10
6/30/10
3/31/10
12/31/09
End of Qtr BD Contract Price ($/lb) (1)
0.86
0.93
0.92
0.76
0.65
Unleaded Gasoline Qtr Avg - USGC ($/gal) (2)
2.18
2.00
2.11
2.06
1.91
US Ethylene Industry Capacity Utilization (%) (3)
88.0
92.3
87.6
85.5
87.3
US BD Production (mm lbs) (3)
813
838
820
795
831
(1) Source: CMAI
(2) Source: Platts
(3) Source: Hodson
Quarter Ended
20
Selected Market Data |
 21
12/31/10
9/30/10
6/30/10
3/31/10
12/31/09
Revenue ($mm)
394.6
$
397.9
$
424.5
$
299.7
$
337.4
$
Gross Profit ($mm)
40.2
47.3
51.4
39.3
35.2
Adj. EBITDA ($mm)*
15.7
23.8
26.1
14.7
12.3
Volume (mm lbs)
597.2
587.1
644.7
531.0
680.6
Gross Profit/lb
0.07
$
0.08
$
0.08
$
0.07
$
0.05
$
Adj. EBITDA/lb
0.03
0.04
0.04
0.03
0.02
12/31/10
9/30/10
6/30/10
3/31/10
12/31/09
Revenue ($mm)
91.5
$
101.5
$
107.3
$
101.0
$
78.4
$
Gross Profit ($mm)
19.0
24.0
26.4
20.4
13.8
Adj. EBITDA ($mm)*
9.2
14.6
17.2
11.4
4.5
Volume (mm lbs)
141.0
161.6
158.0
153.7
140.8
Gross Profit/lb
0.13
$
0.15
$
0.17
$
0.13
$
0.10
$
Adj. EBITDA/lb
0.07
0.09
0.11
0.07
0.03
12/31/10
9/30/10
6/30/10
3/31/10
12/31/09
Revenue ($mm)
486.1
$
499.4
$
531.8
$
400.7
$
415.8
$
Gross Profit ($mm)
59.2
71.3
77.8
59.7
49.0
Adj. EBITDA ($mm)*
24.9
38.4
43.3
26.1
16.8
Volume (mm lbs)
738.2
748.7
802.7
684.7
821.4
Gross Profit/lb
0.08
$
0.10
$
0.10
$
0.09
$
0.06
$
Adj. EBITDA/lb
0.03
0.05
0.05
0.04
0.02
C4 Processing
Performance Products
Total Operating Segments (excludes Corporate)
Quarter Ended
Quarter Ended
Quarter Ended
* See slide 24 for discussion of Adjusted EBITDA and slide 25 for a reconciliation
of Adjusted EBITDA to Net Income for all periods presented . Net Income
(Loss) is the GAAP measure most directly comparable to Adjusted EBITDA.
Selected Operating Results |
 22
12/31/10
9/30/10
6/30/10
3/31/10
12/31/09
Sales Volumes (mm lbs) (1)
738.2
748.7
802.7
684.7
821.4
Sales Revenue ($mm)
486.1
499.4
531.8
400.7
415.8
Adjusted EBITDA ($mm)
C4 Processing
15.7
23.8
26.1
14.7
12.3
Performance Products
9.2
14.6
17.2
11.4
4.5
Corporate
(5.9)
(5.3)
(7.8)
(7.0)
(6.7)
Adjusted EBITDA (2)
19.0
33.1
35.5
19.1
10.2
Adjusted EBITDA per pound
0.03
0.04
0.04
0.03
0.01
Operating Segment Adjusted EBITDA per pound (3)
0.03
0.05
0.05
0.04
0.02
(1) Does not include tolling volume.
(2) See footnote on slide 24
(3) Adjusted EBITDA for the C4 Processing and Performance Products
operating segments - i.e. total Adjusted EBITDA less Corporate.
Quarter Ended
(Unaudited)
Selected Financial Data |
 23
SEC Disclosure Information
ADJUSTED EBITDA –
REVISION OF PREVIOUSLY REPORTED AMOUNTS
We calculate Adjusted EBITDA as earnings before interest, taxes,
depreciation and amortization (EBITDA), which is then adjusted to remove or add
back certain items. Net Income (Loss) is the GAAP measure most directly
comparable to Adjusted EBITDA. As shown in the table below, we have revised
previously reported
Adjusted EBITDA for the C4 Processing segment for the quarter ended December 31,
2009 to remove the effect of the business interruption insurance recovery of
$17.1 million. We have concluded that removal of this item, which we consider
to be non-recurring in nature, enhances the period-to-period comparability of our
operating results and is more useful to securities analysts, investors and other
interested parties in their understanding of our operating performance. Our calculation
of Adjusted EBITDA may be different from the calculation used by
other companies; therefore, it may not be comparable to other companies.
12/31/10
9/30/10
6/30/10
3/31/10
12/31/09
Adjusted EBITDA - as previously reported ($mm)
C4 Processing
23.8
$
26.1
$
14.7
$
29.4
$
Performance Products
14.6
17.2
11.4
4.5
Corporate
(5.3)
(7.8)
(7.0)
(6.7)
33.1
$
35.5
$
19.1
$
27.2
$
Adjusted EBITDA - current definition ($mm)
C4 Processing
15.7
$
23.8
$
26.1
$
14.7
$
12.3
$
Performance Products
9.2
14.6
17.2
11.4
4.5
Corporate
(5.9)
(5.3)
(7.8)
(7.0)
(6.7)
19.0
$
33.1
$
35.5
$
19.1
$
10.2
$
Quarter Ended
(Unaudited) |
 24
(*)
Adjusted
EBITDA
is
presented
and
discussed
herein
because
management
believes
it
enhances
understanding
by
investors
and
lenders
of
the
Company’s
financial
performance.
Adjusted
EBITDA
is
not
a
measure
computed
in
accordance
with
GAAP.
Accordingly
it
does
not
represent
cash
flow
from
operations,
nor
is
it
intended
to
be
presented
herein
as
a
substitute
for
operating
income
or
net
income
as
indicators
of
the
Company’s
operating
performance.
Adjusted
EBITDA
is
the
primary
performance
measurement
used
by
senior
management
and
our
Board
of
Directors
to
evaluate
operating
results
of,
and
to
allocate
capital
resources
between,
our
business
segments.
We
calculate
Adjusted
EBITDA
as
earnings
before
interest,
taxes,
depreciation
and
amortization
(EBITDA),
which
is
then
adjusted
to
remove
or
add
back
certain
items..
These
items
are
identified
above
in
the
Reconciliation
of
Adjusted
EBITDA
to
Net
Income
(Loss),
the
GAAP
measure
most
directly
comparable
to
Adjusted
EBITDA.
Our
calculation
of
Adjusted
EBITDA
may
be
different
from
calculations
used
by
other
companies;
therefore,
it
may
not
be
comparable
to
other
companies.
12/31/10
9/30/10
6/30/10
3/31/10
12/31/09
Net income (loss)
(0.7)
$
12.8
$
14.4
$
4.1
$
8.4
$
Income tax expense
(1.6)
6.9
7.9
2.7
6.0
Interest expense, net
11.1
3.2
4.0
3.5
3.8
Depreciation and amortization
9.9
9.9
9.8
9.8
9.9
EBITDA
18.7
32.8
36.1
20.1
28.1
Non-cash stock based compensation
0.3
0.3
0.5
-
0.3
Unrealized gain on derivatives
-
-
(1.1)
(1.0)
(1.2)
BI insurance recoveries
-
-
-
-
(17.1)
Adjusted EBITDA (*)
19.0
$
33.1
$
35.5
$
19.1
$
10.1
$
Quarter Ended
(Unaudited, in millions)
Reconciliation of Adjusted EBITDA to Net Income |
 25
Adjusted EBITDA would distort comparability between the periods presented.
The following table provides a reconciliation of Adjusted EBITDA to Net Income
(Loss) (in thousands) for the 2010 calendar year ended December 31, 2010 and
the three most recent fiscal years ended June 30, 2010, 2009 and 2008. Net
Income (Loss) is the most directly comparable GAAP measure reported in the
Consolidated Statements of Operations. Reconciliation of Adjusted EBITDA to
Net Income Calendar Year
Ended Dec. 31,
2010
2010
2009
2008
2007
Net income (loss)
31
$
31
$
(23)
$
27
$
21
$
Income tax expense (benefit)
16
19
(12)
15
14
Interest expense, net
22
15
17
19
17
Depreciation and amortization
39
40
42
36
29
EBITDA
108
104
24
96
81
Impairment of assets
-
-
6
-
-
Loss on sale of assets
-
-
-
1
1
Non-cash stock-based
compensation 1
1
6
6
5
Unrealized (gain) loss on derivatives
(2)
(3)
4
(0)
(0)
Adjusted EBITDA as previously reported
107
102
40
104
86
Unauthorized freight (recoveries) payments
-
-
(5)
0
0
Business interruptions insurance
recoveries -
(17)
(10)
-
-
Adjusted EBITDA - current
definition 107
$
85
$
26
$
104
$
86
$
Fiscal Year Ended June 30, |