Attached files
Table of Contents
UNITED STATES
SECURITIES AND EXCHANGE COMMISSION
WASHINGTON, D.C. 20549
FORM 10-K
(Mark One)
| x | ANNUAL REPORT PURSUANT TO SECTION 13 OR 15(d) OF THE SECURITIES EXCHANGE ACT OF 1934 |
For the fiscal year ended January 29, 2011
OR
| ¨ | TRANSITION REPORT PURSUANT TO SECTION 13 OR 15(d) OF THE SECURITIES EXCHANGE ACT OF 1934 |
Commission file number 0-18632
THE WET SEAL, INC.
(Exact name of registrant as specified in its charter)
| Delaware | 33-0415940 | |
| (State or other jurisdiction of incorporation or organization) | (I.R.S. Employer Identification No.) | |
| 26972 Burbank, Foothill Ranch, CA | 92610 | |
| (Address of principal executive offices) | (Zip Code) | |
(949) 699-3900
(Registrant’s telephone number, including area code)
Securities registered pursuant to Section 12(b) of the Act:
| Title of Each Class |
Name of Each Exchange on Which Registered | |
| Class A Common Stock, $0.10 par value per share | NASDAQ Global Market |
Securities registered pursuant to Section 12(g) of the Act: None
Indicate by check mark if the registrant is a well-known seasoned issuer, as defined in Rule 405 of the Securities Act. Yes ¨ No þ
Indicate by check mark if the registrant is not required to file reports pursuant to Section 13 or Section 15(d) of the Act. Yes ¨ No þ
Indicate by check mark whether the registrant: (1) has filed all reports required to be filed by Section 13 or 15(d) of the Securities Exchange Act of 1934 during the preceding 12 months (or for such shorter period that the registrant was required to file such reports), and (2) has been subject to such filing requirements for the past 90 days. Yes þ No ¨
Indicate by check mark whether the registrant has submitted electronically and posted on its corporate website, if any, every Interactive Data File required to be submitted and posted pursuant to Rule 405 of Regulation S-T (232.405 of this chapter) during the preceding 12 months (or for such shorter period that the registrant was required to submit and post such files). Yes ¨ No ¨
Indicate by check mark if disclosure of delinquent filers pursuant to Item 405 of Regulation S-K is not contained herein, and will not be contained, to the best of registrant’s knowledge, in definitive proxy or information statements incorporated by reference in Part III of this Form 10-K or any amendment to this Form 10-K. þ
Indicate by check mark whether the registrant is a large accelerated filer, an accelerated filer, a nonaccelerated filer, or a smaller reporting company. See the definitions of “large accelerated filer,” “accelerated filer” and “small reporting company” in Rule 12b-2 of the Exchange Act:
Large accelerated filer: ¨ Accelerated filer: þ Nonaccelerated filer: ¨ Smaller reporting company: ¨
(Do not check if a smaller reporting company)
Indicate by check mark whether the registrant is a shell company (as defined in Rule 12b-2 of the Act). Yes ¨ No þ
The aggregate market value of voting stock held by nonaffiliates of the registrant as of July 31, 2010 was approximately $332,138,000 based on the closing sale price of $3.38 per share as reported on the NASDAQ Global Market on July 30, 2010.
The number of shares outstanding of the registrant’s Class A common stock, par value $0.10 per share, at March 25, 2011, was 100,784,547. There were no shares outstanding of the registrant’s Class B common stock, par value $0.10 per share, at March 25, 2011.
DOCUMENTS INCORPORATED BY REFERENCE
PART III of this Annual Report incorporates information by reference to the registrant’s definitive Proxy Statement for its Annual Meeting of Stockholders to be filed with the SEC within 120 days of January 29, 2011.
Table of Contents
THE WET SEAL, INC.
Annual Report on Form 10-K
For the Fiscal Year Ended January 29, 2011
| Page | ||||||
| Part I | ||||||
| Item 1. |
1 | |||||
| Item 1A. |
11 | |||||
| Item 1B. |
18 | |||||
| Item 2. |
18 | |||||
| Item 3. |
20 | |||||
| Part II | ||||||
| Item 4. |
21 | |||||
| Item 5. |
22 | |||||
| Item 6. |
25 | |||||
| Item 7. |
Management’s Discussion and Analysis of Financial Condition and Results of Operations |
26 | ||||
| Item 7A. |
50 | |||||
| Item 8. |
50 | |||||
| Item 9. |
Changes in and Disagreements With Accountants on Accounting and Financial Disclosure |
50 | ||||
| Item 9A. |
50 | |||||
| Item 9B. |
52 | |||||
| Part III | ||||||
| Item 10. |
Directors, Executive Officers, and Corporate Governance of the Registrant |
53 | ||||
| Item 11. |
53 | |||||
| Item 12. |
Security Ownership of Certain Beneficial Owners and Management and Related Stockholder Matters |
53 | ||||
| Item 13. |
Certain Relationships and Related Transactions, and Director Independence |
53 | ||||
| Item 14. |
53 | |||||
| Part IV | ||||||
| Item 15. |
54 | |||||
| 58 | ||||||
Table of Contents
PART I
| Item 1. | Business |
Forward-Looking Statements
Certain sections of this Annual Report on Form 10-K (the “Annual Report”), including “Item 1. Business” and “Item 7. Management’s Discussion and Analysis of Financial Condition and Results of Operations,” contain various forward-looking statements within the meaning of Section 27A of the Securities Act of 1933, as amended, and Section 21E of the Securities and Exchange Act of 1934, as amended (the “Exchange Act”), which represent our expectations or beliefs concerning future events.
Forward-looking statements include statements that are predictive in nature, which depend upon or refer to future events or conditions, and/or which include words such as “believes,” “plans,” “intends,” “anticipates,” “estimates,” “expects,” “may,” “will,” or similar expressions. In addition, any statements concerning future financial performance, ongoing strategies or prospects, and possible future actions, which may be provided by our management, are also forward-looking statements. Forward-looking statements are based on current expectations and projections about future events and are subject to risks, uncertainties, and assumptions about our company, economic and market factors, and the industry in which we do business, among other things. These statements are not guarantees of future performance, and we undertake no obligation to publicly update any forward-looking statements, whether as a result of new information, future events, or otherwise.
Actual events and results may differ materially from those expressed or forecasted in forward-looking statements due to a number of factors. Factors that could cause our actual performance, future results, and actions to differ materially from any forward-looking statements include, but are not limited to, those discussed in “Item 1A. Risk Factors” below and elsewhere in this Annual Report.
All references to “we,” “our,” “us,” and “our company” in this Annual Report mean The Wet Seal, Inc. and its wholly owned subsidiaries. All references in this Annual Report to “fiscal 2011,” “fiscal 2010,” “fiscal 2009,” “fiscal 2008,” “fiscal 2007,” “fiscal 2006,” and “fiscal 2005” mean the fiscal year ending January 28, 2012, and the fiscal years ended January 29, 2011, January 30, 2010, February 31, 2009, February 2, 2008, February 3, 2007, and January 28, 2006, respectively.
Available Information
Our Annual Report, Quarterly Reports on Form 10-Q, Current Reports on Form 8-K, and all amendments to those reports and the proxy statement for our annual meeting of stockholders are made available, free of charge, on our corporate web site, www.wetsealinc.com, as soon as reasonably practicable after such reports have been electronically filed with or furnished to the Securities and Exchange Commission, or the “SEC.” Our Code of Business Ethics and Conduct and our Code of Ethics Policy for our Chief Executive Officer and Chief Financial Officer are also located within the Corporate Information section of our corporate web site. These documents are also available in print to any stockholder who requests a copy from our Investor Relations department. The public may also read and copy any materials that we have filed with the SEC at the SEC’s Public Reference Room at 100 F Street, NE, Washington, D.C. 20549. Members of the general public may obtain information on the operation of the Public Reference Room by calling the SEC at 1-800-SEC-0330. In addition, these materials may be obtained at the web site maintained by the SEC at www.sec.gov. The content of our web sites (www.wetsealinc.com, www.wetseal.com, and www.ardenb.com) is not intended to be incorporated by reference in this Annual Report.
General
Incorporated in the State of Delaware in 1990, we are a national specialty retailer operating stores selling fashionable and contemporary apparel and accessory items designed for female customers aged 13 to 35 years old. As of January 29, 2011, we operated 533 retail stores in 47 states and Puerto Rico. Our products can also be purchased online through our web sites.
1
Table of Contents
The names “Wet Seal” and “Arden B” (which are registered in the retail store services and other classes) are trademarks and service marks of our company. Each trademark, trade name, or service mark of any other company appearing in this Annual Report belongs to its respective owner.
Business Segments
We operate two nationwide, primarily mall-based, chains of retail stores under the names “Wet Seal” and “Arden B.” Although the two operating segments have many similarities in their products, production processes, distribution methods, and regulatory environment, there are differences in most of these areas and distinct differences in their economic characteristics. As a result, we consider these segments to be two distinct reportable segments.
Wet Seal. Wet Seal is a junior apparel brand for teenage girls who seek trend-focused and value-competitive clothing, with a target customer age range of 13 to 19 years old. Wet Seal seeks to provide its customer base with a balance of affordably priced, fashionable and basic apparel and accessories.
Arden B. Arden B is a fashion brand at value price points for the feminine contemporary woman. Arden B targets customers aged 25 to 35 years old and seeks to deliver contemporary collections of fashion and basic separates and accessories for various aspects of the customers’ lifestyles.
We maintain a Web-based store located at www.wetseal.com, offering Wet Seal merchandise comparable to that carried in our stores, to customers over the Internet. We also maintain a Web-based store located at www.ardenb.com, offering Arden B merchandise comparable to that carried in our stores, to customers over the Internet. Our online stores are designed to serve as an extension of the in-store experience and offer a wide selection of merchandise, with the goal of expanding in-store sales. Internet operations for both Wet Seal and Arden B are included in their respective operating segments. Since fiscal 2007, we have experienced growth in both visitor traffic and our online sales, and we will continue to develop our Wet Seal and Arden B websites to increase their effectiveness in marketing our brands. We do not consider our Web-based business to be a distinct reportable segment, as the Wet Seal and Arden B reportable segments include, in addition to data from their respective stores, data from their respective Internet operations.
See Note 13 to the consolidated financial statements included in this Annual Report for financial information regarding segment reporting.
Our Stores
Wet Seal stores average approximately 4,000 square feet in size and in fiscal 2010 had average sales per square foot of $267. As of January 29, 2011, we operated 450 Wet Seal stores. Arden B stores average approximately 3,100 square feet in size and in fiscal 2010 had average sales per square foot of $341. As of January 29, 2011, we operated 83 Arden B stores.
During fiscal 2010, we opened 32 and closed six Wet Seal stores and opened nine and closed six Arden B stores.
We currently plan to open approximately 25 to 30 Wet Seal stores, net of store closings, in fiscal 2011 in mall and off-mall power center locations. We also currently intend to continue growing the Arden B store base moderately, with a plan of approximately four new stores, net of store closings, in fiscal 2011. We believe future closures for at least the next 12 months following the date of this Annual Report will primarily result from lease expirations where we decide not to extend, or are unable to extend, store leases. We may, however, accelerate the closure of underperforming stores prior to their lease expirations in cases where we can obtain favorable early lease terminations with the landlords or exercise certain rights contained in the leases. We have approximately 56 existing store leases scheduled to expire in fiscal 2011. We plan to remodel or relocate approximately 27 Wet Seal and Arden B stores during fiscal 2011 upon lease renewals. These planned remodels/relocations are
2
Table of Contents
primarily inclusive of the 56 store leases scheduled to expire in fiscal 2011. We expect to negotiate new leases that will allow us to remain in a substantial majority of these locations. Our ability to increase the number of Wet Seal and Arden B stores in the future will depend, in part, on satisfactory cash flows from existing operations, the demand for our merchandise, and our ability to find suitable mall or other locations with acceptable sites, satisfactory terms and satisfactory general business conditions. Our management does not believe there are significant geographic constraints within the U.S. on the locations of future stores.
Competitive Strengths
Experienced Management Team. Although we have most recently had changes among our senior management team, the current members have extensive knowledge of our business and operations or our industry, which will be instrumental in managing our company through the current difficult economic environment and driving our company in the next phase of its growth cycle. Ms. Susan P. McGalla, our new chief executive officer, held various leadership roles with American Eagle Outfitter, Inc. from 1994 to 2009, most recently serving as the president and chief merchandising officer of that company. Mr. Ken Seipel, our new president and chief operating officer, most recently served as the president and chief merchandise/marketing officer of Pamida Discount Stores LLC since 2009. Previous to this, Mr. Seipel served as executive vice president of stores, operations and store design for the Old Navy division of Gap, Inc. from 2003 through 2008 and also held various merchandising and operations management roles earlier in his career with Target Corporation, Shopko Stores, Inc. and J. C. Penney Company, Inc. Our Chief Financial Officer, Mr. Steven H. Benrubi, served as our corporate controller for over two years prior to his appointment as chief financial officer in September 2007. Ms. Sharon Hughes, our president and chief merchandise officer for our Arden B division, who served as a consultant to our Arden B merchandising team from 2008 to 2009, was an employee of our company from 1990 through 2002, during which period Ms. Hughes was involved in the formation of the Arden B division and held several different merchant roles, including senior vice president of merchandising. Ms. Kim Bajrech and Ms. Debbie Shinn, vice presidents and divisional merchandise managers for our Wet Seal division, joined the company in 2009 and have extensive experience in the junior apparel business. In addition, Ms. Bajrech was an employee of our company from 1990 to 2002. We are currently evaluating the timing for our need for a chief merchandise officer for our Wet Seal division.
Merchandising Models at Wet Seal and Arden B are Focused on Fashion at Affordable Prices, Speed and Flexibility. At Wet Seal, we have developed considerable expertise in identifying, stocking and selling a broad assortment of fresh and fashionable apparel and accessories at competitive prices to our teenage customers. At Arden B we continue to focus on offering unique and fashionable apparel and accessories for our young contemporary customers and have shifted the merchandising model over recent years to be quicker and more flexible. Our buyers work closely with senior management to evaluate the optimal product selection and promotion and pricing strategies. A significant portion of our merchandise is sourced domestically or from domestic importers. This sourcing strategy is intended to enable us to ship new merchandise to stores with a higher frequency and to react more quickly to changing fashion trends. We also take regular markdowns with the objective of effecting the rapid sale of slow-moving inventory.
In recent years, we have increased our cash and investments position and extinguished our debt. Through fiscal 2010, $56 million in principal amount of our convertible notes and $24.6 million in face amount of our convertible preferred stock had been converted into shares of our Class A common stock. Also, in fiscal 2010, 2009, and 2007, we repurchased 2.3 million, 2.0 million, and 3.6 million shares of our Class A common stock for $8.2 million, $7.3 million, and $20.1 million, respectively. We repurchased no common stock during fiscal 2008. As of January 29, 2011, our cash, cash equivalents and investments were $176.1 million; and stockholders’ equity was $275.7 million.
3
Table of Contents
Strategy
As part of a strategic review of business operations, we have identified what we believe are significant opportunities to improve our business trends and drive sales improvement. The key elements of our opportunities are to:
Continue to Manage Business Conservatively in the Near Term Through the Difficult Economic Environment. We have taken many actions intended to increase our financial strength through a difficult economic environment over the near term and to position ourselves to capitalize on our company’s growth and operating leverage opportunities when such environment improves. In anticipation of a continuing difficult retail environment, our near term goals include preserving a strong balance sheet, continuing growth of our Wet Seal division store base and resuming conservative growth of our Arden B division store base, ensuring our capital expenditure investments made are accretive or provide efficiencies to the business, maintaining clean inventory levels and reducing costs opportunistically, although we cannot assure we will be successful in achieving our goals. As part of our cost-cutting initiatives, in January 2008, January 2009 and January 2010, we eliminated 49, 37 and 19 positions, respectively, in our corporate offices and distribution center, and two, four and two positions, respectively, in our field operations, across numerous functional areas. We plan to open 25 to 30 Wet Seal stores, net of store closings, and four Arden B stores, net of store closings, during fiscal 2011. Additionally, we intend to continue to leverage our recently implemented markdown and size optimization systems, our new distribution center sorter system, and inventory management systems currently being implemented; and plan to continue to closely monitor inventory positions during fiscal 2011 while seeking to have the appropriate inventory mix and levels to obtain new trend opportunities. Lastly, we intend to continue to operate with a more cost-efficient, streamlined management organization by seeking to maintain our past cost reductions and to make conservative re-investments in the business where necessary.
Improve Merchandise Margin. In our Wet Seal division, we identified and began acting upon opportunities to improve our planning and allocation function, merchandise mix, and markdown cadence in response to declining merchandise margin performance over the course of fiscal 2009, resulting in merchandise margin improvement during fiscal 2010. We also intend to continue to improve upon our markdown cadence, promotional strategies and size offerings by further utilizing our markdown and size optimization systems, continue our focus on key merchandise item categories, further develop branded and private label assortments, and further optimize our accessory offerings in the merchandise mix in order to build upon our fiscal 2010 improvement. In our Arden B division, we intend to further improve our inventory management, expand dresses as a percentage of our merchandise mix, and enhance our promotional planning and strategies in order to build upon significant merchandise margin improvement generated in this division during fiscal 2009 and fiscal 2010. We intend to focus on maintaining a merchandise mix balanced with customer needs and to continue to make improvements to our sourcing processes and expand our sourcing base. We also intend to improve our price messaging to gain more recognition from our customers for our value proposition.
Improve Store Operations. Our store operations opportunities include improving customer service through new training and development programs, continuing to obtain customer feedback and acting upon it to improve our business, identifying and implementing opportunities to simplify and/or eliminate non-selling activities, and performing more detailed analysis and monitoring to identify improvements for underperforming stores.
Improve Real Estate. We will continue to seek to improve our new and remodeled store economics to address pressure from rising occupancy and store construction costs. We will re-evaluate our Wet Seal store prototype and enhanced fixturing, first implemented in fiscal 2008, to analyze whether we are providing the most attractive store design and shopper-friendly environment. Additionally, we expect to continue opening a small number of Wet Seal stores in regional “power centers” during fiscal 2011 and will assess the opportunity for off-mall growth. We expect to continue to build the pipeline for store growth and growth of our store base, which we estimate will result in fiscal 2011 openings of approximately 25 to 30 new Wet Seal stores, net of store closings, and will continue to grow the Arden B store base conservatively, with approximately four new stores, net of store closings, in fiscal 2011. Additionally, we plan to remodel or relocate approximately 27 Wet Seal and Arden B stores during fiscal 2011 upon lease renewals.
4
Table of Contents
Improve Marketing. We believe we have an opportunity to improve our marketing and divisional merchandising strategies and are developing specific plans for each division in fiscal 2011. We intend to continue emphasizing Internet marketing, including social networking, and will continue to focus on direct and grass roots marketing programs and in-store visual merchandising. Additionally, we are currently conducting consumer research studies to support and enhance brand marketing programs later in the year and to assess brand positioning opportunities.
Improve Information Systems. We expect to complete implementation of an updated retail merchandising system in fiscal 2011, which are designed to improve merchandising decision support and increase efficiency of inventory management practices. Additionally, we intend to update short-term and long-term information systems strategies to provide further efficiencies and cost controls.
Improve Physical Distribution and Transport. We intend to improve business processes to optimize efficiency of our recently implemented automated sorter system in our distribution center, which we expect will lead to increased merchandise processing speed and further cost savings.
Realize Comparable Store Sales Growth Opportunity. We are focused on regaining sales productivity lost through our comparable stores sales declines experienced in fiscal 2007 through 2009, which represented a 16.7% decline on a cumulative basis, as a result of the challenging economic environment as well as the Arden B sales deterioration under its previous merchandising model. In fiscal 2011, we will seek to achieve comparable store sales improvement through the implementation of strategic initiatives noted above, which, among other things, include continued focus on improving customer service, our store design and fixturing, key merchandise trends, increased efficiencies in our planning and allocation functions from markdown and size optimization systems, improving promotional planning and pricing messaging, ensuring inventory is maintained at sufficient levels to increase business, and implementing an enhanced merchandising system.
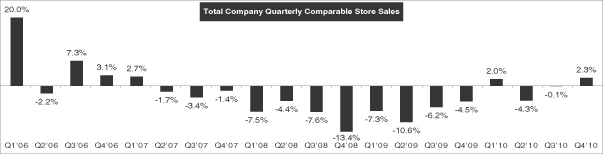
| Total Company Monthly Comparable Store Sales | ||||||||||||||||||||||||||||||||||||||||||||
|
Jan-06 |
51.4% | Jan-07 | 3.6% | Jan-08 | -5.7% | Jan-09 | -14.7% | Jan-10 | -3.7% | Jan-11 | 6.2% | |||||||||||||||||||||||||||||||||
| Feb-06 |
29.3% | Feb-07 | 5.0% | Feb-08 | -8.2% | Feb-09 | -6.6% | Feb-10 | 4.7% | |||||||||||||||||||||||||||||||||||
| Mar-06 |
16.2% | Mar-07 | 10.9% | Mar-08 | -10.8% | Mar-09 | -11.4% | Mar-10 | 6.3% | |||||||||||||||||||||||||||||||||||
| Apr-06 |
17.0% | Apr-07 | -9.6% | Apr-08 | -1.9% | Apr-09 | -2.2% | Apr-10 | -6.1% | |||||||||||||||||||||||||||||||||||
| May-06 |
-8.3% | May-07 | 1.9% | May-08 | -2.0% | May-09 | -8.4% | May-10 | -5.3% | |||||||||||||||||||||||||||||||||||
| Jun-06 |
-4.0% | Jun-07 | 0.7% | Jun-08 | -2.9% | Jun-09 | -11.1% | Jun-10 | -3.6% | |||||||||||||||||||||||||||||||||||
| Jul-06 |
6.4% | Jul-07 | -7.2% | Jul-08 | -8.2% | Jul-09 | -12.1% | Jul-10 | -4.3% | |||||||||||||||||||||||||||||||||||
| Aug-06 |
8.7% | Aug-07 | 1.7% | Aug-08 | -8.7% | Aug-09 | -11.2% | Aug-10 | 1.1% | |||||||||||||||||||||||||||||||||||
| Sep-06 |
5.8% | Sep-07 | -7.0% | Sep-08 | -7.5% | Sep-09 | -4.5% | Sep-10 | -0.7% | |||||||||||||||||||||||||||||||||||
| Oct-06 |
7.5% | Oct-07 | -5.4% | Oct-08 | -6.2% | Oct-09 | -1.3% | Oct-10 | -0.7% | |||||||||||||||||||||||||||||||||||
| Nov-06 |
5.5% | Nov-07 | -1.7% | Nov-08 | -13.9% | Nov-09 | -5.0% | Nov-10 | 7.0% | |||||||||||||||||||||||||||||||||||
|
Dec-06 |
1.3% | Dec-07 | 0.6% | Dec-08 | -12.5% | Dec-09 | -4.6% | Dec-10 | -2.1% | |||||||||||||||||||||||||||||||||||
5
Table of Contents
| Wet Seal Monthly Comparable Store Sales | ||||||||||||||||||||||||||||||||||||||||||||
|
Jan-06 |
83.7% | Jan-07 | 5.8% | Jan-08 | -1.1% | Jan-09 | -12.1% | Jan-10 | -6.7% | Jan-11 | 6.6% | |||||||||||||||||||||||||||||||||
| Feb-06 |
47.9% | Feb-07 | 5.2% | Feb-08 | -3.6% | Feb-09 | -5.6% | Feb-10 | 3.4% | |||||||||||||||||||||||||||||||||||
| Mar-06 |
26.0% | Mar-07 | 14.0% | Mar-08 | -7.3% | Mar-09 | -12.5% | Mar-10 | 6.0% | |||||||||||||||||||||||||||||||||||
| Apr-06 |
20.1% | Apr-07 | -10.0% | Apr-08 | 3.1% | Apr-09 | -4.0% | Apr-10 | -6.4% | |||||||||||||||||||||||||||||||||||
| May-06 |
-5.0% | May-07 | 3.1% | May-08 | 1.8% | May-09 | -12.4% | May-10 | -4.6% | |||||||||||||||||||||||||||||||||||
| Jun-06 |
-4.0% | Jun-07 | 2.8% | Jun-08 | -0.8% | Jun-09 | -11.3% | Jun-10 | -3.6% | |||||||||||||||||||||||||||||||||||
| Jul-06 |
8.1% | Jul-07 | -6.0% | Jul-08 | -6.2% | Jul-09 | -12.3% | Jul-10 | -4.7% | |||||||||||||||||||||||||||||||||||
| Aug-06 |
8.6% | Aug-07 | 5.4% | Aug-08 | -5.4% | Aug-09 | -12.6% | Aug-10 | 1.5% | |||||||||||||||||||||||||||||||||||
| Sep-06 |
8.3% | Sep-07 | -4.7% | Sep-08 | -3.1% | Sep-09 | -5.3% | Sep-10 | 0.1% | |||||||||||||||||||||||||||||||||||
| Oct-06 |
8.7% | Oct-07 | -3.7% | Oct-08 | 0.9% | Oct-09 | -3.1% | Oct-10 | -0.7% | |||||||||||||||||||||||||||||||||||
| Nov-06 |
7.3% | Nov-07 | 0.0% | Nov-08 | -9.7% | Nov-09 | -5.8% | Nov-10 | 8.3% | |||||||||||||||||||||||||||||||||||
|
Dec-06 |
2.1% | Dec-07 | 4.8% | Dec-08 | -6.6% | Dec-09 | -7.3% | Dec-10 | -3.7% | |||||||||||||||||||||||||||||||||||
| Arden B Monthly Comparable Store Sales | ||||||||||||||||||||||||||||||||||||||||||||
|
Jan-06 |
5.2% | Jan-07 | -2.7% | Jan-08 | -21.2% | Jan-09 | -27.0% | Jan-10 | 15.7% | Jan-11 | 3.7% | |||||||||||||||||||||||||||||||||
| Feb-06 |
-4.6% | Feb-07 | 4.2% | Feb-08 | -23.9% | Feb-09 | -11.5% | Feb-10 | 12.4% | |||||||||||||||||||||||||||||||||||
| Mar-06 |
-4.8% | Mar-07 | 1.8% | Mar-08 | -23.0% | Mar-09 | -6.3% | Mar-10 | 7.8% | |||||||||||||||||||||||||||||||||||
| Apr-06 |
8.7% | Apr-07 | -8.3% | Apr-08 | -17.2% | Apr-09 | 6.0% | Apr-10 | -4.5% | |||||||||||||||||||||||||||||||||||
| May-06 |
-16.9% | May-07 | -1.7% | May-08 | -15.1% | May-09 | 11.0% | May-10 | -7.8% | |||||||||||||||||||||||||||||||||||
| Jun-06 |
-4.1% | Jun-07 | -6.0% | Jun-08 | -10.7% | Jun-09 | -10.3% | Jun-10 | -3.2% | |||||||||||||||||||||||||||||||||||
| Jul-06 |
0.8% | Jul-07 | -11.4% | Jul-08 | -16.2% | Jul-09 | -11.2% | Jul-10 | -1.9% | |||||||||||||||||||||||||||||||||||
| Aug-06 |
9.1% | Aug-07 | -12.0% | Aug-08 | -24.7% | Aug-09 | -1.8% | Aug-10 | -1.8% | |||||||||||||||||||||||||||||||||||
| Sep-06 |
-0.7% | Sep-07 | -13.6% | Sep-08 | -21.7% | Sep-09 | -1.1% | Sep-10 | -5.5% | |||||||||||||||||||||||||||||||||||
| Oct-06 |
4.5% | Oct-07 | -10.3% | Oct-08 | -29.4% | Oct-09 | 8.2% | Oct-10 | -0.9% | |||||||||||||||||||||||||||||||||||
| Nov-06 |
0.8% | Nov-07 | -6.7% | Nov-08 | -27.9% | Nov-09 | -1.5% | Nov-10 | -0.3% | |||||||||||||||||||||||||||||||||||
|
Dec-06 |
-0.7% | Dec-07 | -12.7% | Dec-08 | -36.9% | Dec-09 | 14.1% | Dec-10 | 8.5% | |||||||||||||||||||||||||||||||||||
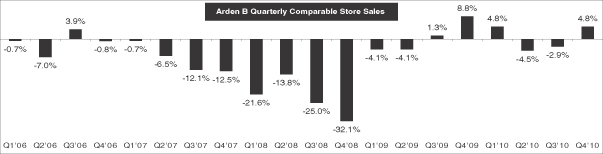
Continue Arden B Improvement. Since fiscal 2008, we have significantly reduced the size and cost of the Arden B merchandising organization, refined the product development and sourcing processes to include more partnering with merchandise suppliers, and adjusted our merchandise mix and pricing and promotional strategies. Our new pricing and promotional strategies at Arden B included significant reductions in price points across all categories. As a result, during the last half of fiscal 2009 and the first and fourth quarters of fiscal 2010, Arden B experienced positive comparable store sales results, and throughout fiscal 2009 and fiscal 2010 we generated significantly improved merchandise margins versus such results for fiscal 2007 and fiscal 2008. However, we
6
Table of Contents
believe Arden B has yet to achieve its full potential with its target young contemporary customers. We aim to drive further sales and profitability improvement at Arden B through our distinctive, quality merchandise, unified apparel and accessory assortments, higher penetration of dresses, our value-pricing strategy, new fixturing to increase store capacity, and a continually improving in-store customer experience.
Expand our Online Business. We plan to continue to grow our Internet business through several initiatives, including expanding our style offerings and significantly growing our customer contact channels through social network investments and more targeted Internet marketing programs, including Facebook® and mobile phone marketing. We experienced substantial growth in fiscal 2010, with an increase of 20% in Internet sales over fiscal 2009. We believe our focus on expanding our style offering, introducing new channels to capture customers, continuing to increase Internet marketing, maintaining consistent brand messages across both channels, and being more focused with targeted marketing will allow us to continue to grow our online business and also increase traffic to our stores. We are optimizing inventory allocated to the Internet business to better meet the demand of our Internet customers and have strengthened our buying and planning staff to meet the anticipated sales growth in this area. We also plan to continue to grow our Internet business through continued improvements to inventory planning, fulfillment, and customer service. Prior to the 2007 holiday season, we launched new website platforms for both divisions, which supports advanced merchandising capabilities, personalization based on browsing behavior and past purchase history, and testing tools to measure and determine the most effective content and promotional strategies. In fiscal 2008 Wet Seal launched industry leading social media features for the website and a cross channel mobile phone application which allow our customers to design, rate, and buy outfits using the majority of Wet Seal products. In fiscal 2009, we launched website features that allow for selling to countries outside the U.S., customers to search for and reserve denim at stores near them, customers to invite friends to shop with them online whereby each person can control and see the same screen, customers to shop online from their mobile devices and other features that continue to enhance our website and customer experience. In fiscal 2010, we launched additional mobile initiatives in the areas of location based marketing and virtual gift cards. We also added additional methods to tender payment online. Our social media marketing reach has increased substantially, adding over one million Facebook® fans in 2010.
Buying
Our buying teams are responsible for identifying evolving fashion trends and developing themes to guide our merchandising strategy. Each retail division has a separate buying team. The merchandising teams for each division develop fashion themes and strategies by assessing customer responses to current trends, shopping appropriate domestic and international markets, using fashion services, and gathering references from industry publications. After selecting fashion themes, the buying teams work closely with vendors to use colors, materials, and designs that create images consistent with the themes for our product offerings.
Since fiscal 2004 for our Wet Seal division, and beginning in fiscal 2008 for our Arden B division, we no longer internally design merchandise. This allows us more flexibility to respond to the changing fashion trends of our target customers, to buy in smaller lots, and to reduce sourcing lead times. See also “Allocation and Distribution” below.
Marketing, Advertising, and Promotion
We believe that our brands are among our most important assets. Our ability to successfully increase brand awareness is dependent upon our ability to address the changing needs and priorities of each brand’s target customers. To that end, we have embarked on thorough customer market research intended to keep us in touch with our customers and their needs and direct our marketing efforts to them. We will also continue our emphasis on visual merchandising and direct and grass roots marketing. As discussed further in Note 1 to the consolidated financial statements included elsewhere in this Annual Report, we also offer a frequent buyer program in our Wet Seal stores in order to build loyalty to the brand, increase the frequency of visits, promote multiple item purchases, and gain direct access to the customer. As part of this program, we send e-mails to participants to
7
Table of Contents
notify them of special in- store promotions. Our Arden B division also offers a loyalty program, “B Rewarded,” designed for the same purposes as that of our Wet Seal division. We intend to implement marketing strategies to build upon the past successes of these loyalty programs and to accelerate their growth. We also plan to more aggressively pursue customer acquisitions and to increase our use of Internet marketing to drive increased store traffic.
During fiscal 2010, 2009, and 2008, we spent 0.6%, 0.4%, and 0.5%, respectively, of net sales on advertising. In fiscal 2010, our primary marketing focus was on in-store promotion programs and events and Internet marketing, including Facebook®, for both Wet Seal and Arden B stores. We expect to increase marketing and advertising spending modestly in fiscal 2011 in support of our business strategies.
Sourcing and Vendor Relationships
We purchase our merchandise primarily from domestic vendors. For fiscal 2010, approximately 14% of our retail merchandising receipts were directly imported from foreign vendors. Although in fiscal 2010 no single vendor provided more than 10% of our merchandise, management believes we are one of the largest customers of many of our smaller vendors. Quality control is monitored at the distribution points of our largest vendors and manufacturers, and merchandise is inspected upon arrival at our Foothill Ranch, California facility.
We do not maintain any long-term or exclusive commitments or arrangements to purchase merchandise from any single supplier, and there are many vendors who could supply our merchandise.
Allocation and Distribution of Merchandise
Our merchandising strategies depend on maintaining a regular flow of fresh, fashionable merchandise into our stores. Successful execution depends largely on our integrated buying, planning, allocation, and distribution functions. By working closely with store operations management and merchandise buyers, our teams of planners and allocators manage inventory levels and coordinate allocation of merchandise to each of our stores based on sales volume and store size, demographics, climate, and other factors that may influence an individual store’s product mix. We utilize merchandise planning software that assists us in streamlining the planning process. In fiscal 2009, we implemented size optimization software that we believe has begun to improve our allocation of sizes to better align with each store’s needs.
All merchandise is received from vendors at our Foothill Ranch, California distribution center, where items are inspected and prepared for shipping to our stores. We ship all of our merchandise to our stores by common carrier. Consistent with our goal of maintaining the freshness of our product offerings, we frequently ship new merchandise to stores, and markdowns are taken regularly to effect the rapid sale of slow-moving inventory. In fiscal 2009, we implemented markdown optimization at our Wet Seal division to improve the speed of selling through slow product and improve merchandise margins. Marked-down merchandise that remains unsold is either sent to select stores for deep discounting and sale, sent to our Internet store for selling, sold to an outside clearance company, or given to charity. The fulfillment process and distribution of merchandise for our online business is performed at our Foothill Ranch, California distribution center.
Information and Control Systems
Our merchandise, financial, and store computer systems are integrated and operate using primarily Oracle® technology. We have invested in a large data warehouse that provides management, buyers, and planners comprehensive data that helps us identify emerging trends and manage inventories. The core merchandise system is frequently enhanced to support strategic business initiatives.
Through an installation completed in fiscal 2010, all of our stores have a point-of-sale system operating on software provided by Oracle®. This system facilitates bar-coded ticket scanning, automatic price lookups, and
8
Table of Contents
centralized credit authorizations. All stores are networked to the corporate office via a centrally managed virtual private network. We utilize a store portal/intranet that is integrated with the corporate merchandise ERP system to provide the stores and corporate staff with current information regarding sales, promotions, inventory, and shipments, and enables more efficient communications with the corporate office. We utilize wide area networking hardware at all stores, which guards against security breaches to our stores point-of-sale system. We also recently upgraded our merchandising system, and launched new website platforms for the online businesses. In fiscal 2009, in order to further improve gross margin through the use of technology, we completed implementation of Oracle® Markdown Optimization for our Wet Seal stores, and we completed the implementation of the SAS® Size Optimization system. In 2010, to maximize the benefits of size optimization, we completed installation of a new distribution center automated sorter system to allow automated picking of customized size ranges for each store. In addition, a major upgrade to the Oracle® Retail Merchandising system began in fiscal 2010 and will be completed in early fiscal 2011.
Seasonality and Inflation
Our business is seasonal in nature, with the Christmas season, beginning the week of Thanksgiving and ending the first Saturday after Christmas, and the back-to-school season, beginning the last week of July and ending during September, historically accounting for a large percentage of our sales volume. For the past three fiscal years, the Christmas and back-to-school seasons together accounted for an average of slightly less than 30% of our annual sales.
We do not believe that inflation has had a material effect on our results of operations during the past three years. However, we began to experience merchandise cost pressures in the fourth quarter of fiscal 2010 as a result of rising commodity prices, primarily for cotton, and increased labor costs, due to labor shortages in China, from which a majority of our merchandise is sourced. In addition, the rising value of the currency in China relative to the U.S. dollar is expected to have a further impact on future product costs. Although our initial mark-ups have remained fairly stable to date, we experienced some deterioration in mark-up rates in fourth quarter 2010 merchandise receipts and are experiencing further cost increases for merchandise on order for the first half of fiscal 2011. In response to the costs increases, we have evaluated and modestly adjusted our pricing in certain categories and are assessing ongoing promotional strategies in efforts to help maintain or improve upon historical merchandise margin levels. We will continue to diligently monitor our costs as well as the competitive pricing environment in order to mitigate potential margin erosion. However, we cannot be certain that our business will not be affected by inflation in the future.
Trademarks
We own numerous trademarks, several of which are important to our business. Our primary and most significant trademarks and service marks are WET SEAL and ARDEN B, which are registered in the United States Patent and Trademark Office. We also have registered, or have applications pending for, a number of other trademarks including, but not limited to, ACCOMPLICE, B. REWARDED, BLINK by WET SEAL, BLUE ASPHALT, CHIC BOUTIQUE, CONTEMPO CASUALS, ENR EVOLUTION NOT REVOLUTION, FASHION INSIDER, FIT IN. STAND OUT., GET IT. WEAR IT. FLAUNT IT., iRUNWAY, LOVE THE TREND-HATE TO SPEND, SEAL STASH, TREND SPOT, STYLIZER, REBELLIOUS, and URBAN VIBE. In general, the registrations for these trademarks and service marks are renewable indefinitely as long as the marks are used as required under applicable regulations. We are not aware of any significant adverse claims or infringement actions relating to our trademarks or service marks.
Competition
The women’s retail apparel industry is highly competitive, with fashion, quality, price, location, and service being the principal competitive factors. Our Wet Seal and Arden B stores compete with specialty apparel retailers, department stores, and other apparel retailers, including Abercrombie & Fitch, Aeropostale, American
9
Table of Contents
Eagle, Anthropologie, Banana Republic, BCBG, bebe, Charlotte Russe, Express, Forever 21, Gap, Guess?, H&M, J.C. Penney, Nordstrom, Old Navy, Pacific Sunwear, Rue 21, Target, Urban Outfitters, Zara, and other regional retailers. Many of our competitors are large national chains that have substantially greater financial, marketing, and other resources than we do. While we believe we compete effectively for favorable site locations and lease terms, competition for prime locations within malls and power centers is intense, and we cannot ensure that we will be able to obtain new locations on terms favorable to us, if at all.
Customers
Our company’s business is not dependent upon a single customer or small group of customers.
Environmental Matters
We are not aware of any federal, state, or local environmental laws or regulations that will materially affect our earnings or competitive position, or result in material capital expenditures. However, we cannot predict the effect on our operations of possible future environmental legislation or regulations. During fiscal 2010, we did not make any material capital expenditures for environmental control facilities and no such material expenditures are anticipated for fiscal 2011.
Government Regulation
Our company is subject to various federal, state, and local laws affecting our business. Each of our company’s stores must comply with licensing and regulation by a number of governmental authorities in jurisdictions in which the store is located. To date, our company has not been significantly affected by any difficulty, delay, or failure to obtain required licenses or approvals.
Our company is also subject to federal and state laws governing such matters as employment and pay practices, overtime, and working conditions. The bulk of our company’s employees are paid on an hourly basis at rates related to the federal and state minimum wages. In the past, we have been assessed penalties or paid settlements to gain dismissal of lawsuits for noncompliance with certain of these laws, and future noncompliance could result in a material adverse effect on our company’s operations. In July 2006, May 2007, and September 2008, we were served with class action complaints alleging violations under certain State of California labor laws. In November 2006, we reached an agreement to settle the July 2006 class action complaint for approximately $0.3 million, and we have accrued within accrued liabilities in our consolidated balance sheet an amount equal to this settlement amount, awaiting final approval. On September 27, 2010, the Superior Court granted final approval of the settlement agreement; however, an appeal was subsequently filed on January 26, 2011. On December 17, 2010, the Court denied Plaintiffs’ Motion for Class Certification in its entirety on the May 2007 class action complaint and denied Plaintiffs’ Motion For Leave to File An Amended Complaint. Plaintiffs have appealed both orders but have not yet filed their opening appellate briefs. We are vigorously defending the May 2007 and September 2008 complaints and are unable to predict the likely outcomes and whether such outcomes may have a material adverse effect on our results of operations or financial condition. Accordingly, no provisions for loss contingencies for the May 2007 and September 2008 complaints have been accrued as of January 29, 2011.
We continue to monitor our facilities for compliance with the Americans with Disabilities Act, or the ADA, in order to conform to its requirements. Under the ADA, we could be required to expend funds to modify stores to better provide service to, or make reasonable accommodation for the employment of, disabled persons. We believe that expenditures, if required, would not have a material adverse effect on our company’s operations.
Employees
As of January 29, 2011, we had 6,982 employees, consisting of 2,047 full-time employees and 4,935 part-time employees. Full-time personnel consisted of 649 salaried employees and 1,398 hourly employees. All
10
Table of Contents
part-time personnel are hourly employees. Of all employees, 6,575 were sales personnel and 407 were administrative and distribution center personnel. Personnel at all levels of store operations are provided various opportunities for cash and/or other incentives based upon various individual store sales and other performance targets. All of our employees are nonunion, and, in management’s opinion, are paid competitively at current industry standards. We believe that our relationship with our employees is good.
| Item 1A. | Risk Factors |
Risks Related to our Business
General economic conditions, perceptions of such conditions by our customers and the impact on consumer confidence and consumer spending have adversely impacted our results of operations and may continue to do so.
Our performance is subject to general economic conditions and their impact on levels of consumer confidence and consumer spending. Consumer purchases of discretionary items, including our merchandise, generally decline during periods when disposable income is adversely affected or there is economic uncertainty. As a result of the continued difficult economic conditions, we may face risks that will impact many facets of our operations, including, among other things, the ability of one or more of our vendors to deliver their merchandise in a timely manner or otherwise meet their obligations to us. If continued poor economic conditions in the U.S. and world economic markets become more volatile, or if they deteriorate further, our business, financial condition, and results of operations may be adversely affected.
We may experience declines in comparable store sales in our Wet Seal division.
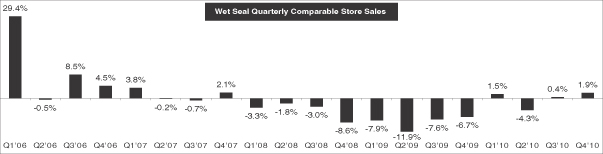
Although we had flat comparable store sales in our Wet Seal division in fiscal 2010, we did experience declines in fiscal 2009 and 2008, and we cannot assure that we will improve our comparable store sales in the future. In order to improve comparable store sales results, we will need to focus on a variety of factors, including fashion trends, our merchandise mix, holiday periods, actions of competitors, weather conditions and general economic conditions. There can be no guarantee that financial results of our Wet Seal division will improve and if they do, there can be no guarantee as to the timing, duration or significance of the improvement.
Our continued improvements in comparable store sales and improved operating results of our Arden B division may not be indicative of our future performance trends, and we cannot assure that we will be able to sustain such improvement in the future.
In fiscal 2007 and 2008, we experienced poor financial performance in our Arden B division. However, comparable store sales and operating results of our Arden B division have improved as a result of efforts by our senior management team, the closing or rebranding of underperforming stores, and changes to promotional and pricing strategies. There can be no guarantee that this improvement of our Arden B division will continue.
Our success depends to a significant extent on the performance of our senior management.
In general, our success depends to a significant extent on the performance of our senior management, particularly personnel engaged in merchandising and store operations, and on our ability to identify, hire and retain additional key management personnel. We have had significant changes in management recently and these changes may impact our ability to execute our business strategy.
Effective January 18, 2011, we appointed Ms. Susan P. McGalla as our new chief executive officer. As we noted in our announcement of her appointment, Ms. McGalla will not be based in our executive offices until August 2011. Additionally, effective March 28, 2011, we appointed Mr. Ken Seipel as our new president and chief operating officer. While Ms. McGalla and Mr. Seipel have immediately become involved in the day-to-day activities of our company, we expect that we will experience a transition period until they are fully integrated organizationally and until Ms. McGalla is fully integrated geographically. We cannot provide any assurance that
11
Table of Contents
there will not be any disruption that adversely impacts our customer relationships, employee morale and/or our business during such transition period. Further, in their roles as our chief executive officer and chief operating officer, Ms. McGalla and Mr. Seipel, respectively, may implement new strategic initiatives for our company. Because these strategic initiatives have not been formulated yet, we cannot predict how these initiatives will impact us. If they are ineffective, this would adversely affect our financial condition, results of operations and cash flow.
Our company’s ability to attract customers to our stores depends heavily on the success of the shopping centers in which many of our stores are located.
Substantially all of our stores are located in regional mall shopping centers. Factors beyond our control impact mall traffic, such as general economic conditions and consumer spending levels. Accordingly, consumer spending and mall traffic remain depressed due to the continued difficult economic conditions. As a result, mall operators have been facing increasing operational and financial difficulties. The increasing inability of mall “anchor” tenants and other area attractions to generate consumer traffic around our stores, the increasing inability of mall operators to attract “anchor” tenants and maintain viable operations and the increasing departures of existing “anchor” and other mall tenants due to declines in the sales volume and in the popularity of malls as shopping destinations, have reduced and may continue to reduce our sales volume and, consequently, adversely affect our financial condition, results of operations and/or cash flows.
Our ability to procure merchandise could be adversely affected by changes in our vendors’ factoring arrangements.
Changes in our vendors’ factoring arrangements may threaten the factors’ financial viability and ability to provide factoring services to its customers. Although we do not have a direct relationship with factors, a portion of our vendors who supply our company with merchandise have direct factoring arrangements. Vendors who engage in factoring transactions will typically sell their accounts receivable to a factor at a discount in exchange for cash payments, which can be used to finance the business and operations of the vendors.
If the financial condition of our vendors’ factors were to deteriorate and certain of our vendors were unable to procure alternative factoring arrangements from competitors of their factor on the same or substantially similar terms, our ability to timely procure merchandise for our stores could be adversely affected. This could require the devotion of significant time and attention by our management to adequately resolve such matters. In turn, our results of operations and financial condition could suffer.
Our ability to use net operating loss carryforwards to offset future taxable income for U.S. federal or state income tax purposes is subject to limitation.
We believe that our net operating losses (“NOLs”) are a valuable asset and we intend to take actions to protect the value of our NOLs. However, Section 382 of the Internal Revenue Code, or Section 382, contains provisions that may limit the availability of federal net operating loss carryforwards, or NOLs, to be used to offset taxable income in any given year upon the occurrence of certain events, including significant changes in our stockholders’ ownership interests in our company. Under Section 382, potential limitations on NOLs are triggered when there has been an “ownership change” (generally defined as a greater than 50% change (by value) in our stock ownership over a three-year period).
We incurred ownership changes in April 2005 and December 2006, which resulted in Section 382 limitations applying to NOLs generated prior to those dates, which were approximately $172.1 million. As a result of these ownership changes, of our $93.5 million NOLs as of January 29, 2011, we may utilize up to $58.3 million to offset taxable income in fiscal 2011 and 2012. Future transactions involving the sale or other transfer of our stock may result in additional ownership changes for purposes of Section 382. The occurrence of such additional ownership changes could limit our ability to utilize our remaining NOLs and possibly other tax attributes. Limitations imposed on our ability to use NOLs and other tax attributes to offset future taxable income
12
Table of Contents
could cause us to pay U.S. federal income taxes earlier than we otherwise would if such limitations were not in effect. Any further ownership change also could cause such NOLs and other tax attributes to expire unused, thereby reducing or eliminating the benefit of such NOLs and other tax attributes to us and adversely affecting our future cash flows.
In addition, we may determine that varying state laws with respect to NOL utilization may result in lower limits, or an inability to utilize NOLs in some states altogether, which could result in us incurring additional state income taxes. During fiscal 2008, the State of California passed legislation that suspended our ability to utilize NOLs to offset taxable income in fiscal 2008 and 2009. In late 2010, the State of California extended such legislation that further suspended use of NOLs to fiscal 2011. As a result, we incurred additional state income taxes in California, which increased our effective tax rate in fiscal 2008 through 2010. We may also generate income in future periods on a federal alternative minimum tax basis, which would result in alternative minimum taxes payable on a portion of such income. In the event that state law results in lower limits, or an inability to utilize loss carryforwards, or we become subject to federal alternative minimum tax, this could adversely affect our future cash flows.
If we are unable to anticipate and react to new fashion trends, our financial condition and results of operations could be adversely affected.
We rely on a limited demographic customer base for a large percentage of our sales. Our brand image is dependent upon our ability to anticipate, identify and provide fresh inventory reflecting current fashion trends.
Furthermore, the continued difficult economic conditions make it increasingly difficult for us to accurately predict product demand trends. If we fail to anticipate, identify or react appropriately or in a timely manner to these fashion trends, we could experience reduced consumer acceptance of our products, a diminished brand image and higher markdowns. These factors could adversely affect our financial condition and results of operations.
If we decrease the price that we charge for our products or offer extensive, continued promotions on our products, we may earn lower gross margins and our revenues and profitability may be adversely affected.
The prices that we are able to charge for our products depend on, among other things, the type of product offered, the consumer response to the product and the prices charged by our competitors. To the extent that we are forced to lower our prices, our gross margins will be lower and our revenues and profitability may be adversely affected.
If we are unable to pass through increases in raw material, labor and energy costs to our customers through price increases, our financial condition and results of operations could be adversely affected.
Our product costs are rising due to increasing commodity prices, primarily for cotton, as well as due to higher production labor and energy costs. We may not be able to, or may elect not to, pass these increases on to our customers through price increases, which may adversely affect our financial condition and results of operations.
We depend upon a single center for our corporate offices and distribution activities, and any significant disruption in the operation of this center could harm our business, financial condition, results of operations and/or cash flows.
Our corporate offices and the distribution functions for all of our stores and Internet business are handled from a single, leased facility in Foothill Ranch, California. In general, this area of California is subject to earthquakes and wildfires. Any significant interruption in the operation of this facility due to a natural disaster, arson, accident, system failure or other unforeseen event could delay or impair our ability to distribute merchandise to our stores and, consequently, lead to a decrease in sales. Furthermore, we have little experience operating essential functions away from our main corporate offices and are uncertain what effect operating satellite facilities might have on our business, personnel and results of operations. The financial losses incurred may exceed our insurance for earthquake damages and business interruption costs related to any such disruption. As a result, our business, financial condition, results of operations and/or cash flows could be adversely affected.
13
Table of Contents
Fluctuations in our revenues for the third fiscal quarter and the fourth fiscal quarter have a disproportionate effect on our overall financial condition, results of operations and/or cash flows.
We experience seasonal fluctuations in revenues, with a disproportionate amount of our revenues being generated in the third fiscal quarter “back-to-school” season, which begins the last week of July and ends during September, and the fourth fiscal quarter “holiday” season. Our revenues are generally lower during the first and second fiscal quarters. In addition, any factors that harm our third and fourth fiscal quarter operating results, including adverse weather or unfavorable economic conditions, could have a disproportionate effect on our results of operations for the entire fiscal year.
In order to prepare for our peak shopping seasons, we must order and keep in stock significantly more merchandise than we would carry at other times of the year. An unanticipated decrease in demand for our products during our peak shopping seasons could require us to sell excess inventory at a substantial markdown, which could reduce our net sales and gross profit. Alternatively, an unanticipated increase in demand for certain of our products could leave us unable to fulfill customer demand and result in lost sales and customer dissatisfaction.
Our quarterly results of operations may also fluctuate significantly as a result of a variety of other factors, including the merchandise mix and the timing and level of inventory markdowns. As a result, historical period-to-period comparisons of our revenues and operating results are not necessarily indicative of future period-to-period results. Reliance should not be placed on the results of a single fiscal quarter, particularly the third fiscal quarter “back-to-school” season or fourth fiscal quarter “holiday” season, as an indication of our annual results or our future performance.
Our failure to effectively compete with other retailers for sales and locations could have a material adverse effect on our financial condition, results of operations and/or cash flows.
The women’s retail apparel industry is highly competitive, with fashion, quality, price, location and service being the principal competitive factors. Our Wet Seal and Arden B stores compete with specialty apparel retailers, department stores and certain other apparel retailers, including Abercrombie & Fitch, Aeropostale, American Eagle, Anthropologie, Banana Republic, BCBG, bebe, Charlotte Russe, Express, Forever 21, Gap, Guess?, H&M, J.C. Penney, Nordstrom, Old Navy, Pacific Sunwear, Rue 21, Target, Urban Outfitters, Zara, and other regional retailers. Many of our competitors are large national chains that have substantially greater financial, marketing and other resources than we do. We face a variety of competitive challenges, including:
| • | anticipating and quickly responding to changing consumer demands; |
| • | maintaining favorable brand recognition and effectively marketing our products to consumers in narrowly-defined market segments; |
| • | developing innovative, high-quality products in sizes, colors and styles that appeal to consumers in our target markets and maintaining a sufficient quantity of these items for which there is the greatest demand; |
| • | obtaining favorable site locations within malls on reasonable terms; |
| • | sourcing merchandise efficiently; |
| • | pricing our products competitively and achieving customer perception of value; |
| • | offering attractive promotional incentives while maintaining profit margins; and |
| • | withstanding periodic downturns in the apparel industry. |
Our industry has low barriers to entry that allow the introduction of new products or new competitors at a fast pace. Any of these factors could result in reductions in sales or the prices of our products which, in turn, could have a material adverse effect on our financial condition, results of operations and/or cash flows.
14
Table of Contents
We expect to open between 25 and 30 Wet Seal stores, net of store closures, in fiscal 2011. At this time, we plan to conservatively grow our Arden B store base in fiscal 2011, with approximately four stores, net of store closures. While we believe we compete effectively for favorable site locations and lease terms, competition for prime locations within malls, in particular, and within other locations is intense and we cannot assure that we will be able to obtain new locations on terms favorable to us, if at all.
In addition, actions of our competitors, particularly increased promotional activity, can negatively impact our business. In light of the continued difficult economic conditions, pricing is a significant driver of consumer choice in our industry and we regularly engage in price competition, particularly through our promotional programs. To the extent that our competitors lower prices, through increased promotional activity or otherwise, our ability to maintain gross profit margins and sales levels may be negatively impacted. There can be no assurance that our competitors’ increased promotional activity will not negatively impact our business.
The upcoming expiration of leases for approximately 56 of our existing stores could lead to increased costs associated with renegotiating our leases and/or relocating our stores.
We have approximately 56 existing store leases scheduled to expire in fiscal 2011. In connection with the expiration of these leases, we will have to renegotiate new leases, which could result in higher rental amounts for each store and landlord requirements to remodel existing locations as a condition for renewal. We may not be able to obtain new lease terms that are favorable to us. In addition, as a result of renewal negotiations, we may be required by the landlord to remodel, which could result in significant capital expenditures. In addition, some landlords may refuse to renew our leases due to our lower sales per square foot as compared with other prospective tenants. If we are unable to agree to new terms with our landlords, we will have to close or relocate these stores, which could result in a significant expenditure and could lead to an interruption in the operation of our business at the affected stores, and we could be required to relocate to less desirable locations or may not be able to find viable locations at all.
Our hardware and software systems are vital to the efficient operation of our retail and Web-based stores, and damage to these systems could harm our business.
We rely on our computer hardware and software systems for the efficient operation of our retail and Web-based stores. Our information systems provide our management with real-time inventory, sales and cost information that is essential to the operation of our business. Due to our number of stores, geographic diversity and other factors, we would be unable to generate this information in a timely and accurate manner in the event our hardware or software systems were unavailable. These systems are vulnerable to damage or interruption from a number of factors, including earthquake, fire, flood and other natural disasters and power loss, computer systems failure, or security breaches, Internet and telecommunications or data network failure.
A significant information systems failure could reduce the quality or quantity of operating data available to our management. If this information were unavailable for any extended period of time, our management would be unable to efficiently run our business, which would result in a reduction in our net sales.
Because of the importance of our brand names, we may lose market share to our competitors if we fail to adequately protect our intellectual property rights.
We believe that our trademarks and other proprietary rights are important to our success and our competitive position. We have registered trademarks for Wet Seal and Arden B (which are registered in the retail store services and other classes). We take actions to establish and protect our intellectual property. However, others may infringe on our intellectual property rights or seek to block the sale of our products as violative of their intellectual property rights. If we are required to stop using any of our registered or nonregistered trademarks, our sales could decline and, consequently, our business and results of operations could be adversely affected.
15
Table of Contents
Covenants contained in agreements governing our senior credit facility restrict the manner in which we conduct our business, under certain circumstances, and our failure to comply with these covenants could result in a default under these agreements, which would have a material adverse effect on our business, financial condition, growth prospects and ability to procure merchandise for our stores.
Our senior revolving credit facility contains covenants that restrict the manner in which we conduct our business under certain circumstances. Subject to certain exceptions, these covenants restrict or limit our ability to, among other things:
| • | incur or guarantee additional indebtedness or refinance our existing indebtedness; |
| • | make certain investments or acquisitions; |
| • | merge, consolidate, dissolve or liquidate; |
| • | engage in certain asset sales (including the sale of stock); |
| • | repurchase stock; |
| • | grant liens on assets; |
| • | pay dividends; and |
| • | close stores. |
A breach of any of these covenants could result in a default under the agreements governing our existing indebtedness, acceleration of any amounts then outstanding, the foreclosure upon collateral securing the debt obligations, or the unavailability of the line of credit.
We do not authenticate the license rights of our suppliers.
We purchase merchandise from a number of vendors who purport to hold manufacturing and distribution rights under the terms of license agreements or that assert that their products are not subject to any restrictions as to distribution. We generally rely upon each vendor’s representation concerning those manufacturing and distribution rights and do not independently verify whether each vendor legally holds adequate rights to the licensed properties they are manufacturing or distributing. If we acquire unlicensed merchandise or merchandise violating a registered trademark, we could be obligated to remove it from our stores, incur costs associated with destruction of the merchandise if the vendor is unwilling or unable to reimburse us and be subject to civil and criminal liability. The occurrence of any of these events could adversely affect our financial condition, results of operations and/or cash flows.
We are subject to risks associated with our procurement of products from non-U.S. based vendors and U.S. vendors that purchase products internationally, any of which could have a material adverse effect on our business, financial condition, results of operations and/or cash flows.
The majority of our products are manufactured outside the U.S. and is primarily bought by us within the U.S. from domestic importers. As a result, we are susceptible to greater losses as a result of a number of risks inherent in doing business in international markets and from a number of factors beyond our control, any of which could have a material adverse effect on our business, financial condition, results of operations and/or cash flows.
These factors include:
| • | import or trade restrictions (including increased tariffs, customs duties, taxes or quotas) imposed by the U.S. government in respect of the foreign countries in which our products are currently manufactured or any of the countries in which our products may be manufactured in the future; |
16
Table of Contents
| • | political instability or acts of terrorism, significant fluctuations in the value of the U.S. dollar against foreign currencies, restrictions on the transfer of funds between the U.S. and foreign jurisdictions, and/or potential disruption of imports due to labor disputes at U.S. ports, any of which could adversely affect our merchandise flow and, consequently, cause our sales to decline; and |
| • | local business practices that do not conform to our legal or ethical guidelines. |
The U.S. and the countries in which our products are produced or sold may also, from time to time, impose new quotas, duties, tariffs or other restrictions, or adversely adjust prevailing quota, duty or tariff levels. In addition, none of our international suppliers or international manufacturers supplies or manufactures our products exclusively. As a result, we compete with other companies for the production capacity of independent manufacturers and import quota capacity. If we were unable to obtain our raw materials and finished apparel from the countries where we wish to purchase them, either because room under the necessary quotas was unavailable or for any other reason, or if the cost of doing so should increase, it could have a material adverse effect on our business, financial condition, results of operations and/or cash flows.
Violation of labor laws and practices by our suppliers could harm our business and results of operations.
Our company’s policy is to use only those sourcing agents and independent manufacturers who operate in material compliance with applicable laws and regulations. The violation of laws, particularly labor laws, by an independent manufacturer, or by one of the sourcing agents, or the divergence of an independent manufacturer’s or sourcing agent’s labor practices from those generally accepted as ethical in the U.S. or in the country in which the manufacturing facility is located, and the public revelation of those illegal or unethical practices, could cause significant damage to our company’s reputation. Although our manufacturer operating guidelines promote ethical business practices, we do not control the business and operations of the manufacturers and cannot guarantee their legal and regulatory compliance.
We are exposed to business risks as a result of our Internet operations.
We operate online stores at www.wetseal.com and www.ardenb.com. Our Internet operations are subject to numerous risks, including unanticipated operating problems, reliance on third-party computer hardware and software providers, system failures and the need to invest in additional computer systems. Specific risks include: (i) diversion of sales from our stores; (ii) rapid technological change; (iii) liability for online content; and (iv) risks related to the failure of the computer systems that operate the websites and their related support systems, including computer viruses, telecommunication failures and electronic break-ins and similar disruptions. In addition, Internet operations involve risks which are beyond our control that could have a direct material adverse effect on our operational results, including: (i) price competition involving the items we intend to sell; (ii) the entry of our vendors into the Internet business in direct competition with us; (iii) the level of merchandise returns experienced by us; (iv) governmental regulation; (v) online security breaches involving unauthorized access to our and/or customer information; (vi) credit card fraud; and (vii) competition and general economic conditions specific to the Internet, online commerce and the apparel industry. Our inability to effectively address these risks and any other risks that we face in connection with our Internet operations could materially adversely affect our business, financial condition, results of operations and/or cash flows.
Risks Related to our Common Stock
The price of our Class A common stock has fluctuated significantly during the past few years and may fluctuate significantly in the future.
Our Class A common stock, which is traded on the NASDAQ Global Market, has experienced and may continue to experience significant price and volume fluctuations that could adversely affect the market price of our Class A common stock. The market price of our Class A common stock is likely to fluctuate, both because of
17
Table of Contents
actual and perceived changes in our operating results and prospects and because of general volatility in the stock market. The market price of our Class A common stock could continue to fluctuate widely in response to factors such as:
| • | actual or anticipated variations in our results of operations, including comparable store sales; |
| • | the addition or loss of suppliers, customers and other business relationships; |
| • | changes in financial estimates of, and recommendations by, securities analysts; |
| • | conditions or trends in the apparel and consumer products industries; |
| • | additions or departures of key personnel; |
| • | sales of our Class A common stock; |
| • | general market and economic conditions; and |
| • | other events or factors, including the realization of any of the risks described in this risk factors section, many of which are beyond our control. |
Fluctuations in the price and trading volume of our Class A common stock in response to factors such as those set forth above could be unrelated or disproportionate to our actual operating performance.
We have never paid dividends on our Class A common stock and do not plan to do so in the future.
Holders of shares of our Class A common stock are entitled to receive any dividends that may be declared by our Board of Directors. However, we have not paid any cash dividends on our Class A common stock and we do not expect to for the foreseeable future. Also, our agreements with our senior lenders restrict the payment of dividends to our stockholders.
Our charter provisions and Delaware law may have anti-takeover effects.
Our certificate of incorporation permits our Board of Directors to designate and issue, without stockholder approval, up to 2,000,000 shares of preferred stock with voting, conversion and other rights and preferences that could differentially and adversely affect the voting power or other rights of the holders of our Class A common stock, which could be used to discourage an unsolicited acquisition proposal. Furthermore, certain provisions of Delaware law applicable to our company could also delay or make more difficult a merger, tender offer or proxy contest involving our company, including Section 203 of the Delaware General Corporation Law, which prohibits a Delaware corporation from engaging in any business combination with any interested stockholder for a period of three years unless certain conditions are met.
The possible issuance of preferred stock and the application of anti-takeover provisions of Delaware law could each have the effect of delaying, deferring or preventing a change in control of our company, including, without limitation, discouraging a proxy contest, making the acquisition of a substantial block of Class A common stock more difficult and limiting the price that investors might in the future be willing to pay for shares of our Class A common stock.
| Item 1B. | Unresolved Staff Comments |
None.
| Item 2. | Properties |
Our principal executive offices are located at 26972 Burbank, Foothill Ranch, California, with 301,408 square feet of leased office and distribution facility space. Our principal executive offices contain 215,192 square feet of merchandise handling and storage space in the distribution facility and 86,216 square feet of office space. Our lease for this space runs through December 4, 2017, with the option for us to terminate on December 4, 2014, upon payment by us of an early termination fee of $0.7 million.
18
Table of Contents
We lease all of our stores. Lease terms for our stores typically are 10 years. The leases generally provide for a fixed minimum rental, charges for common area maintenance, real estate taxes and other mall operating costs, and, on occasion, additional rental based on a percentage of sales once a minimum sales level has been reached. Certain leases include cash reimbursements received from landlords for leasehold improvements and other cash payments received from landlords as lease incentives. When a lease expires, we generally renew that lease at current market terms. However, each renewal is based upon an analysis of the individual store’s profitability and sales potential. At the end of fiscal 2010, we had 2,042,546 square feet of leased space under retail store leases.
The following table sets forth our 533 retail stores by state or territory as of January 29, 2011:
| State |
Wet Seal | Arden B | State |
Wet Seal | Arden B | |||||||||||||
| Alabama |
9 | 1 | Montana | 3 | — | |||||||||||||
| Alaska |
1 | — | Nebraska | 3 | — | |||||||||||||
| Arizona |
14 | 2 | Nevada | 5 | 1 | |||||||||||||
| Arkansas |
3 | — | New Hampshire | 2 | 1 | |||||||||||||
| California |
64 | 11 | New Jersey | 13 | 5 | |||||||||||||
| Colorado |
5 | 2 | New Mexico | 4 | — | |||||||||||||
| Connecticut |
5 | — | New York | 14 | 4 | |||||||||||||
| Delaware |
1 | — | North Carolina | 9 | 1 | |||||||||||||
| Florida |
33 | 6 | North Dakota | 4 | — | |||||||||||||
| Georgia |
10 | 2 | Ohio | 19 | 3 | |||||||||||||
| Hawaii |
4 | — | Oklahoma | 3 | — | |||||||||||||
| Idaho |
2 | — | Oregon | 4 | — | |||||||||||||
| Illinois |
21 | 5 | Pennsylvania | 22 | 3 | |||||||||||||
| Indiana |
10 | 1 | Rhode Island | 2 | 1 | |||||||||||||
| Iowa |
4 | — | South Carolina | 7 | 1 | |||||||||||||
| Kansas |
6 | 1 | South Dakota | 1 | — | |||||||||||||
| Kentucky |
4 | 1 | Tennessee | 7 | 1 | |||||||||||||
| Louisiana |
7 | — | Texas | 27 | 8 | |||||||||||||
| Massachusetts |
14 | 5 | Utah | 5 | 1 | |||||||||||||
| Maryland |
10 | 2 | Virginia | 11 | 4 | |||||||||||||
| Michigan |
14 | 2 | Washington | 12 | 2 | |||||||||||||
| Minnesota |
10 | 3 | West Virginia | 2 | — | |||||||||||||
| Mississippi |
2 | — | Wisconsin | 8 | — | |||||||||||||
| Missouri |
8 | 2 | Puerto Rico | 2 | 1 | |||||||||||||
The following table sets forth information with respect to store openings and closings since fiscal 2006:
Total Company
| Fiscal Years | ||||||||||||||||||||
| 2010 | 2009 | 2008 | 2007 | 2006 | ||||||||||||||||
| Stores open at beginning of year |
504 | 496 | 494 | 430 | 400 | |||||||||||||||
| Stores opened during the year |
41 | 18 | 13 | 78 | 38 | |||||||||||||||
| Stores closed during the year |
12 | 10 | 11 | 14 | 8 | |||||||||||||||
| Stores open at end of year |
533 | 504 | 496 | 494 | 430 | |||||||||||||||
19
Table of Contents
Wet Seal
| Fiscal Years | ||||||||||||||||||||
| 2010 | 2009 | 2008 | 2007 | 2006 | ||||||||||||||||
| Stores open at beginning of year |
424 | 409 | 399 | 338 | 308 | |||||||||||||||
| Stores opened during the year |
32 | 17 | 13 | 71 | 34 | |||||||||||||||
| Stores closed during the year |
6 | 2 | 3 | 10 | 4 | |||||||||||||||
| Stores open at end of year |
450 | 424 | 409 | 399 | 338 | |||||||||||||||
Arden B
| Fiscal Years | ||||||||||||||||||||
| 2010 | 2009 | 2008 | 2007 | 2006 | ||||||||||||||||
| Stores open at beginning of year |
80 | 87 | 95 | 92 | 92 | |||||||||||||||
| Stores opened during the year |
9 | 1 | — | 7 | 4 | |||||||||||||||
| Stores closed during the year |
6 | 8 | 8 | 4 | 4 | |||||||||||||||
| Stores open at end of year |
83 | 80 | 87 | 95 | 92 | |||||||||||||||
| Item 3. | Legal Proceedings |
On July 19, 2006, a complaint was filed in the Superior Court of the State of California for the County of Los Angeles on behalf of certain of our current and former employees that were employed and paid by us on an hourly basis during the four-year period from July 19, 2002 through July 19, 2006. We were named as a defendant. The complaint alleged various violations under the State of California Labor Code, the State of California Business and Professions Code, and orders issued by the Industrial Welfare Commission. On November 30, 2006, we reached an agreement to pay approximately $0.3 million to settle this matter, subject to Superior Court approval. On September 27, 2010, the Superior Court granted final approval of the settlement agreement. An appeal was subsequently filed on January 26, 2011. As of January 29, 2011, we have accrued an amount equal to the settlement amount in accrued liabilities in our consolidated balance sheet.
On May 22, 2007, a complaint was filed in the Superior Court of the State of California for the County of Orange on behalf of certain of our current and former employees who were employed and paid by us from May 22, 2003 through the present. We were named as a defendant. The complaint alleged various violations under the State of California Labor Code, the State of California Business and Professions Code, and orders issued by the Industrial Welfare Commission. On December 17, 2010, the court denied Plaintiffs’ Motion for Class Certification in its entirety and denied Plaintiffs’ Motion For Leave to File An Amended Complaint. Plaintiffs have appealed both orders but have not yet filed their opening appellate briefs. We are vigorously defending this litigation and are unable to predict the likely outcome and whether such outcome may have a material adverse effect on our results of operations or financial condition. Accordingly, no provision for a loss contingency has been accrued as of January 29, 2011.
On September 29, 2008, a complaint was filed in the Superior Court of the State of California for the County of San Francisco on behalf of certain of our current and former employees who were employed and paid by us from September 29, 2004 through the present. We were named as a defendant. The complaint alleges various violations under the State of California Labor Code and the State of California Business and Professions Code. The case has been transferred to the complex panel of the San Francisco Superior Court for case management purposes. Currently, Plaintiffs’ Motion for Class Certification and Defendants’ Motion to Strike Class Claims is due to be filed on April 25, 2011. Discovery is ongoing. We are vigorously defending this litigation and are unable to predict the likely outcome and whether such outcome may have a material adverse effect on our results of operations or financial condition. Accordingly, no provision for a loss contingency has been accrued as of January 29, 2011.
20
Table of Contents
On April 24, 2009 the U.S. Equal Employment Opportunity Commission, or the EEOC, requested information and records relevant to several charges of discrimination by our company against employees of our company. In the course of this investigation, the EEOC served a subpoena seeking information related to current and former employees throughout the United States. In April 2010, the EEOC filed an application to enforce the subpoena in the U.S. District Court for the Eastern District of Pennsylvania, and is in the process of a nationwide investigation. We are awaiting the results of the investigation and are unable to predict the likely outcome and whether such outcome may have a material adverse effect on our results of operations or financial condition. Accordingly, no provision for a loss contingency has been accrued as of January 29, 2011.
From time to time, we are involved in other litigation matters relating to claims arising out of our operations in the normal course of business. We believe that, in the event of a settlement or an adverse judgment on certain of these claims, we have insurance coverage to cover a portion of such losses; however, certain other matters may exist or arise for which we do not have insurance coverage. As of January 29, 2011, we were not engaged in any other legal proceedings that are expected, individually or in the aggregate, to have a material adverse effect on our results of operations or financial condition.
| Item 4. | Reserved |
21
Table of Contents
PART II
| Item 5. | Market for the Registrant’s Common Equity, Related Stockholder Matters, and Issuer Purchases of Equity Securities |
We have two classes of common stock: Class A and Class B. Our Class A common stock is listed on the NASDAQ Global Market under the symbol “WTSLA.” As of March 25, 2011, there were 686 stockholders of record of our Class A common stock. The closing price of our Class A common stock on March 25, 2011, was $4.01 per share. As of March 25, 2011, there were no shares of our Class B common stock outstanding.
Price Range of Stock
The following table reflects the high and low closing sale prices of our Class A common stock as reported by NASDAQ for the last two fiscal years:
| Quarter |
Fiscal 2010 | Fiscal 2009 | ||||||||||||||
| High | Low | High | Low | |||||||||||||
| First quarter |
$ | 5.15 | $ | 3.35 | $ | 4.12 | $ | 2.02 | ||||||||
| Second quarter |
$ | 4.84 | $ | 3.30 | $ | 4.60 | $ | 2.77 | ||||||||
| Third quarter |
$ | 3.71 | $ | 2.81 | $ | 4.07 | $ | 3.15 | ||||||||
| Fourth quarter |
$ | 3.91 | $ | 3.11 | $ | 3.76 | $ | 2.88 | ||||||||
Dividend Policy
We have reinvested earnings in the business and have never paid any cash dividends to holders of our common stock. The declaration and payment of future dividends are at the sole discretion of the Board of Directors and will depend upon our profitability, financial condition, cash requirements, future prospects, and other factors deemed relevant by our Board of Directors. Under certain circumstances, our senior revolving credit facility limits our ability to declare or pay dividends on any of our shares without consent from the lenders. The company has no intention of paying cash dividends in the immediate future.
Securities Authorized for Issuance Under Equity Compensation Plans
The following table provides information as of January 29, 2011, about our common stock that may be issued upon the exercise of options, warrants, and rights granted to employees, consultants, or members of our Board of Directors under all of our existing equity compensation plans, including our 1996 Long-Term Incentive Plan, as amended; our 2000 Stock Incentive Plan; and our 2005 Stock Incentive Plan, as amended:
| Plan category |
(a) | (b) | (c) | |||||||||
| Equity Compensation Plan Information | ||||||||||||
| Number of securities to be issued upon exercise of outstanding options, warrants and rights |
Weighted-average exercise price of outstanding options, warrants and rights |
Number of securities remaining available for future issuance under equity compensation plans (excluding securities reflected in column (a)) |
||||||||||
| Equity compensation plans approved by security holders |
5,342,069 | (1) | $ | 5.26 | (2) | 4,380,927 | ||||||
| Equity compensation plans not approved by security holders |
— | — | — | |||||||||
| Total |
5,342,069 | $ | 5.26 | 4,380,927 | ||||||||
| (1) | Includes 3,280,857 outstanding vested and non-vested stock options and 2,061,212 shares of non-vested restricted common stock and performance shares. |
| (2) | Includes 3,280,857 stock options exercisable at a weighted-average exercise price of $5.26. A weighted-average exercise price is not applied to the 2,061,212 of non-vested restricted common stock and performance shares. |
22
Table of Contents
Stock Price Performance Graph
The following graph compares the cumulative stockholder return on our Class A common stock with the return on the Total Return Index for the NASDAQ Stock Market (US) and the NASDAQ Retail Trade Stocks. The graph assumes $100 invested on January 27, 2006, in the stock of Wet Seal, the NASDAQ Global Stock Market (US), and the NASDAQ Retail Trade Stocks. It also assumes that all dividends are reinvested.
Comparison of Cumulative Total Return for the Class A Common Stock
of Wet Seal, January 27, 2006 through January 28, 2011(1)
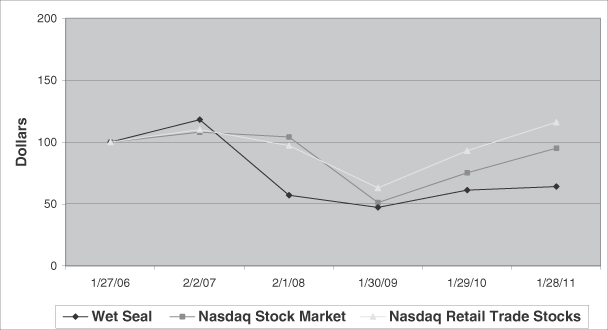
| February 2, 2007* |
February 1, 2008* |
January 30, 2009* |
January 29, 2010* |
January 28, 2011* |
||||||||||||||||
| The Wet Seal, Inc. |
$ | 118 | $ | 57 | $ | 47 | $ | 61 | $ | 64 | ||||||||||
| NASDAQ Stock Market (US) |
$ | 108 | $ | 104 | $ | 51 | $ | 75 | $ | 95 | ||||||||||
| NASDAQ Retail Trade Stocks |
$ | 110 | $ | 97 | $ | 63 | $ | 93 | $ | 116 | ||||||||||
| * | Closest preceding trading date to the beginning of our fiscal year. |
| (1) | Returns are based upon the premise that $100 is invested in each of (a) our Class A common stock, (b) NASDAQ Stock Market, and (c) the index of NASDAQ Retail Trade Stocks on January 27, 2006, and that all dividends (if any) were reinvested. Over a five-year period, and based on the actual price movement of these investments, the original $100 would have turned into the amounts shown as of the end of each Wet Seal fiscal year. Stockholder returns over the indicated period should not be considered indicative of future stockholder returns. |
The historical stock performance shown on the graph is not necessarily indicative of future price performance.
Unregistered Sales of Equity Securities
(a) None.
(b) None.
23
Table of Contents
(c) Purchases of Equity Securities By the Issuer and Affiliated Purchasers
| Period |
Total Number of Shares Purchased |
Average Price Paid per Share |
Total Number of Shares Purchased as Part of Publicly Announced Plans or Programs |
Maximum Number of Shares that May Yet Be Purchased Under the Plans or Programs(1) |
||||||||||||
| October 31, 2010 to November 27, 2010 |
— | — | — | 6,230,699 | ||||||||||||
| November 28, 2010 to January 1, 2011 |
— | — | — | 6,230,699 | ||||||||||||
| January 2, 2011 to January 29, 2011 |
— | — | — | 6,230,699 | ||||||||||||
| (1) | On September 7, 2010, our Board of Directors authorized a program to repurchase up to $25.0 million of our Class A common stock from time to time in the open market or in privately negotiated transactions. Repurchases are at our option and can be suspended or discontinued at any time. Pursuant to this plan, during the third quarter of fiscal 2010, we repurchased 882,300 shares of our Class A common stock at an average market price of $3.39, for a total cost, including commissions, of approximately $3.0 million. No such repurchases occurred during the fourth quarter of fiscal 2010. The maximum number of shares that may yet be purchased under the share repurchase program is calculated as the balance remaining of the authorized spending of approximately $22.0 million divided by $3.53, the closing price of our Class A common stock as of January 28, 2011, the last trading day of the fourth quarter of fiscal 2010. |
As of January 29, 2011, 8,295,882 repurchased shares, at a cost of $38.0 million, as well as 3,837,051 shares reacquired by the Company, at no cost, upon employee, director, and consultant forfeitures of stock-based compensation, were not yet retired.
24
Table of Contents
| Item 6. | Selected Financial Data |
The following table sets forth selected consolidated financial and other data as of the end of and for the 2006 through 2010 fiscal years. The following selected financial data has been derived from our audited consolidated financial statements. The data set forth below should be read in conjunction with the consolidated financial statements and notes thereto, which are included elsewhere in this Annual Report.
Five-Year Financial Summary
(In thousands, except per-share and per square foot amounts, ratios, share data, store data, and square footage data)
| Fiscal Year | 2010 | 2009 | 2008 | 2007 | 2006 | |||||||||||||||
| Fiscal Year Ended |
January 29, 2011 |
January 30, 2010 |
January 31, 2009 |
February 2, 2008 |
February 3, 2007 |
|||||||||||||||
| Operating Results |
||||||||||||||||||||
| Net sales |
$ | 581,194 | $ | 560,918 | $ | 592,960 | $ | 611,163 | $ | 564,324 | ||||||||||
| Cost of sales |
$ | 401,287 | $ | 394,092 | $ | 400,521 | $ | 408,892 | $ | 370,888 | ||||||||||
| Gross margin |
$ | 179,907 | $ | 166,826 | $ | 192,439 | $ | 202,271 | $ | 193,436 | ||||||||||
| Selling, general, and administrative expenses |
$ | 150,432 | $ | 141,633 | $ | 154,671 | $ | 177,468 | $ | 178,703 | ||||||||||
| Store closure (adjustments) costs |
$ | — | $ | — | $ | — | $ | — | $ | (730 | ) | |||||||||
| Asset impairment |
$ | 4,228 | $ | 2,341 | $ | 5,611 | $ | 5,546 | $ | 425 | ||||||||||
| Operating income |
$ | 25,247 | $ | 22,852 | $ | 32,157 | $ | 19,257 | $ | 15,038 | ||||||||||
| Income (loss) before provision (benefit) for income taxes(2) |
$ | 22,539 | $ | 22,366 | $ | 31,010 | $ | 23,610 | $ | (14,727 | ) | |||||||||
| Net income (loss)(1)(2) |
$ | 12,570 | $ | 86,870 | $ | 29,688 | $ | 23,232 | $ | (15,035 | ) | |||||||||
| Per-Share Data |
||||||||||||||||||||
| Net income (loss) per share, basic |
$ | 0.12 | $ | 0.86 | $ | 0.30 | $ | 0.23 | $ | (0.21 | ) | |||||||||
| Net income (loss) per share, diluted |
$ | 0.12 | $ | 0.85 | $ | 0.30 | $ | 0.22 | $ | (0.21 | ) | |||||||||
| Weighted-average shares outstanding, basic |
99,255,952 | 95,685,557 | 93,172,635 | 91,154,133 | 72,577,398 | |||||||||||||||
| Weighted-average shares outstanding, diluted |
99,412,817 | 96,250,188 | 94,099,234 | 94,141,019 | 72,577,398 | |||||||||||||||
| Other Financial Information |
||||||||||||||||||||
| Cash, cash equivalents, and investments |
$ | 176,052 | $ | 161,693 | $ | 142,064 | $ | 100,618 | $ | 105,254 | ||||||||||
| Working capital |
$ | 183,453 | $ | 170,102 | $ | 130,716 | $ | 90,236 | $ | 89,954 | ||||||||||
| Ratio of current assets to current liabilities |
4.0 | 4.3 | 3.7 | 2.5 | 2.5 | |||||||||||||||
| Total assets(1) |
$ | 368,532 | $ | 347,670 | $ | 256,659 | $ | 224,076 | $ | 208,167 | ||||||||||
| Long-term debt, including current portion(3) |
$ | — | $ | 3,540 | $ | 2,707 | $ | 3,583 | $ | 2,739 | ||||||||||
| Total stockholders’ equity(2) |
$ | 275,693 | $ | 260,139 | $ | 171,208 | $ | 127,839 | $ | 116,797 | ||||||||||
| Other Operating Information |
||||||||||||||||||||
| Number of stores open at year-end |
533 | 504 | 496 | 494 | 430 | |||||||||||||||
| Number of stores opened during the year |
41 | 18 | 13 | 78 | 38 | |||||||||||||||
| Number of stores closed during the year |
12 | 10 | 11 | 14 | 8 | |||||||||||||||
| Square footage of leased store space at year-end: |
||||||||||||||||||||
| Total Company |
2,042,546 | 1,918,309 | 1,879,395 | 1,863,123 | 1,612,807 | |||||||||||||||
| Wet Seal |
1,787,088 | 1,674,048 | 1,612,189 | 1,568,124 | 1,316,228 | |||||||||||||||
| Arden B |
255,458 | 244,261 | 267,206 | 294,999 | 296,579 | |||||||||||||||
| Average sales per square foot of leased store space(4): |
||||||||||||||||||||
| Total Company |
$ | 276 | $ | 277 | $ | 297 | $ | 332 | $ | 348 | ||||||||||
| Wet Seal |
$ | 267 | $ | 268 | $ | 292 | $ | 314 | $ | 321 | ||||||||||
| Arden B |
$ | 341 | $ | 339 | $ | 326 | $ | 420 | $ | 459 | ||||||||||
| Average sales per store(4): |
||||||||||||||||||||
| Total Company |
$ | 1,052 | $ | 1,052 | $ | 1,123 | $ | 1,248 | $ | 1,301 | ||||||||||
| Wet Seal |
$ | 1,056 | $ | 1,056 | $ | 1,149 | $ | 1,229 | $ | 1,253 | ||||||||||
| Arden B |
$ | 1,034 | $ | 1,035 | $ | 1,011 | $ | 1,324 | $ | 1,467 | ||||||||||
| Comparable store sales increase |
||||||||||||||||||||
| Total Company |
0.1 | % | (7.1 | )% | (8.5 | )% | (1.1 | )% | 6.1 | % | ||||||||||
| Wet Seal |
0.0 | % | (8.5 | )% | (4.5 | )% | 1.2 | % | 8.8 | % | ||||||||||
| Arden B |
0.6 | % | 0.2 | % | (23.5 | )% | (8.2 | )% | (1.1 | )% | ||||||||||
25
Table of Contents
| (1) | Net income and total assets for fiscal 2009 includes the reversal of the valuation allowance against the net deferred tax assets in the amount of $64.7 million, recorded as a benefit for income taxes. The reversal was originally in the amount of $71.3 million and has been corrected to reflect a $6.6 million overstatement of deferred tax assets, benefit for income taxes and net income due to a prior misinterpretation of federal tax laws and other minor errors identified in the third quarter of fiscal 2010. See Note 1 of the notes to consolidated financial statements for further detail. |
| (2) | Income before provision (benefit) for income taxes and net income for fiscal 2008 and 2006 and net income per share basic and diluted for fiscal 2006 have been adjusted to reflect the correct treatment for accrued interest forfeited by note holders upon conversion. We previously recorded the forfeited accrued interest as a reduction to interest expense rather than a credit to paid-in capital. This correction resulted in a reclassification between paid in capital and accumulated deficit within stockholder’s equity and aggregated $2.9 million when identified in the first quarter of fiscal 2010. See Note 1 of the notes to consolidated financial statements for further detail. |
| (3) | Long-term debt is presented net of unamortized discount of $2.1 million, $2.7 million, $5.5 million, and $6.0 million for fiscal 2009, fiscal 2008, fiscal 2007, and fiscal 2006, respectively. |
| (4) | Sales during the 53rd week of fiscal 2006 were excluded for purposes of calculating “average sales per square foot of leased store space” and “average sales per store” in order to make fiscal 2006 comparable to fiscal 2010, fiscal 2009, fiscal 2008, and fiscal 2007. |
| (5) | “Comparable store sales” for fiscal 2006 (a 53-week fiscal year) includes a comparison of the 53rd week of comparable store sales in fiscal 2006 to the 1st week of comparable store sales in fiscal 2006. Stores are deemed comparable stores on the first day of the month following the one-year anniversary of their opening or significant remodel/relocation. |
| Item 7. | Management’s Discussion and Analysis of Financial Condition and Results of Operations |
The following discussion should be read in conjunction with our audited consolidated financial statements and notes thereto included elsewhere in this Annual Report. The following discussion and analysis contains forward-looking statements which involve risks and uncertainties, and our actual results could differ materially from those anticipated in these forward-looking statements as a result of certain factors, including those set forth under the heading “Forward-Looking Statements” included elsewhere in this Annual Report.
Executive Overview
We are a national specialty retailer operating stores selling fashionable and contemporary apparel and accessory items designed for female customers aged 13 to 35 years old. We operate two nationwide, primarily mall-based, chains of retail stores under the names “Wet Seal” and “Arden B”. At January 29, 2011, we had 533 retail stores in 47 states and Puerto Rico. Of the 533 stores, there were 450 Wet Seal stores and 83 Arden B stores.
We report our results of operations as two reportable segments representing our two retail divisions (“Wet Seal” and “Arden B”). Internet operations for Wet Seal and Arden B are included in their respective operating segments. Although the two operating segments have many similarities in their products, production processes, distribution methods and regulatory environment, there are differences in most of these areas and distinct differences in their economic characteristics.
Our fiscal year ends on the Saturday closest to the end of January. Fiscal 2010, fiscal 2009, and fiscal 2008 each include 52 weeks of operations.
We consider the following to be key performance indicators in evaluating our performance:
Comparable store sales—For purposes of measuring comparable store sales, sales include merchandise sales as well as membership fee revenues recognized under our Wet Seal division’s frequent buyer program during the
26
Table of Contents
applicable period. Stores are deemed comparable stores on the first day of the month following the one-year anniversary of their opening or significant remodel/relocation, which we define to be a square footage increase or decrease of at least 20%. Stores that are remodeled or relocated with a resulting square footage change of less than 20% are maintained in the comparable store base with no interruption. However, stores that are closed for four or more days in a fiscal month, due to remodel, relocation or other reasons, are removed from the comparable store base for that fiscal month as well as for the comparable fiscal month in the following fiscal year. Comparable store sales results are important in achieving operating leverage on expenses such as store payroll, occupancy, depreciation and amortization, general and administrative expenses, and other costs that are at least partially fixed. Positive comparable store sales results generate greater operating leverage on expenses while negative comparable store sales results negatively affect operating leverage. Comparable store sales results also have a direct impact on our total net sales, cash, and working capital.
Average transaction counts—We consider the trend in the average number of sales transactions occurring in our stores to be a key performance metric. To the extent we are able to increase transaction counts in our stores that more than offset the decrease, if any, in the average dollar sale per transaction, we will generate increases in our comparable store sales.
Gross margins—We analyze the components of gross margin, specifically cumulative mark-on, markups, markdowns, shrink, buying costs, distribution costs, and store occupancy costs. Any inability to obtain acceptable levels of initial markups, a significant increase in our use of markdowns or in inventory shrink, or an inability to generate sufficient sales leverage on other components of cost of sales could have an adverse impact on our gross margin results and results of operations.
Operating income —We view operating income as a key indicator of our financial success. The key drivers of operating income are comparable store sales, gross margins, and the changes we experience in operating costs.
Cash flow and liquidity (working capital)—We evaluate cash flow from operations, liquidity and working capital to determine our short-term operational financing needs.
Critical Accounting Policies and Estimates
The preparation of financial statements in conformity with accounting principles generally accepted in the United States of America requires the appropriate application of certain accounting policies, some of which require us to make estimates and assumptions about future events and their impact on amounts reported in our consolidated financial statements. Since future events and their impact cannot be determined with absolute certainty, the actual results will inevitably differ from our estimates.
We believe the application of our accounting policies, and the estimates inherently required therein, are reasonable. Our accounting policies and estimates are reevaluated on an ongoing basis, and adjustments are made when facts and circumstances dictate a change. Our accounting policies are more fully described in Note 1 to our consolidated financial statements included elsewhere in this Annual Report.
The policies and estimates discussed below involve the selection or application of alternative accounting policies that are material to our consolidated financial statements. Management has discussed the development and selection of these critical accounting policies and estimates with the Audit Committee of our Board of Directors.
We have certain accounting policies that require more significant management judgment and estimates than others. These include our accounting policies with respect to revenue recognition, short-term investments, merchandise inventories, long-lived assets, stock-based compensation, accounting for income taxes and insurance reserves.
27
Table of Contents
Revenue Recognition
Sales are recognized upon purchases by customers at our retail store locations. Taxes collected from our customers are recorded on a net basis. For online sales, revenue is recognized at the estimated time goods are received by customers. Online customers typically receive goods within four days of being shipped. Shipping and handling fees billed to customers for online sales are included in net sales. For fiscal 2010, 2009 and 2008, shipping and handling fee revenues were $3.2 million, $2.9 million, and $2.4 million, respectively, within net sales on the consolidated statements of operations.
We have recorded accruals to estimate sales returns by customers based on historical sales return results. Historically, a customer generally could return merchandise within 30 days of the original purchase date. Beginning in the third quarter of fiscal 2008, we modified our sales return policy to allow customers to return merchandise only within 21 days of original purchase. We also modified our sales return policy such that Wet Seal retail store merchandise may be returned for store credit only and Arden B retail store merchandise may be returned for cash refund or store credit within seven days of the original purchase date, and for store credit only thereafter. For Wet Seal and Arden B online sales, merchandise may be returned within 21 days for a full refund. Actual return rates have historically been within management’s estimates and the accruals established. As the accrual for merchandise returns is based on estimates, the actual returns could differ from the accrual, which could impact net sales. The accrual for merchandise returns is recorded in accrued liabilities on the consolidated balance sheets and was $0.3 million and $0.3 million at January 29, 2011, and January 30, 2010, respectively.
We recognize the sales from gift cards, gift certificates, and store credits as they are redeemed for merchandise. Prior to redemption, we maintain an unearned revenue liability for gift cards, gift certificates, and store credits until we are released from such liability. Our gift cards, gift certificates, and store credits do not have expiration dates; however, over time, a percentage of gift cards, gift certificates, and store credits are not redeemed or recovered (“breakage”). Based upon historical redemption trend data, we previously determined that the likelihood of redemption of unredeemed gift cards, gift certificates, and store credits three years after their issuance is remote and adjusted our unearned revenue liability quarterly to record breakage as additional sales for gift cards, gift certificates, and store credits that remained unredeemed three years after their issuance. Our net sales for fiscal 2008 included a benefit of $0.9 million to reduce our unearned revenue liability for estimated unredeemed amounts. Additionally, based upon an analysis completed by us during the second fiscal quarter of 2009, historical redemption patterns indicated that the likelihood of redemption of unredeemed gift cards, gift certificates, and store credits greater than two years after their issuance is remote. As a result, beginning in the second quarter of fiscal 2009, we adjusted our unearned revenue liability to recognize the change in estimated timing of when breakage of gift cards, gift certificates and store credits is recognized from greater than three years after their issuance dates to greater than two years after their issuance dates. Our net sales in the second quarter of fiscal 2009 included a benefit of $1.2 million due to this change in estimate to reduce our unearned revenue liability for estimated unredeemed amounts. Our net sales for fiscal 2010 and fiscal 2009 included a benefit of $1.4 million and $2.2 million, respectively, to reduce our unearned revenue liability for estimated unredeemed amounts. The unearned revenue for gift cards, gift certificates, and store credits is recorded in accrued liabilities in the consolidated balance sheets and was $5.1 million and $5.4 million at January 29, 2011 and January 30, 2010, respectively. If actual redemptions ultimately differ from the assumptions underlying our breakage adjustments, or our future experience indicates the likelihood of redemption of gift cards, gift certificates, and store credits becomes remote at a different point in time after issuance, we may recognize further significant adjustments to our accruals for such unearned revenue, which could have a significant effect on our net sales and results of operations.
We maintain a frequent buyer program, the fashion insider card, through our Wet Seal division. Under the program, customers receive a 10% to 20% discount on all purchases made during a 12-month period and are provided $5-off coupons that may be used on purchases during such period. The annual membership fee of $20 is nonrefundable. Discounts received by customers on purchases using the frequent buyer program are recognized at the time of such purchases.
28
Table of Contents
We have historically recognized membership fee revenue under the frequent buyer program on a straight-line basis over the 12-month membership period. During November 2007, we changed from in-store delivery to e-mail delivery of the program’s $5-off coupons, which eliminated the customer’s ability to use such coupons at the time of initial purchases. We believe this change affects customer usage patterns. We also continue to test alternative program structures, and promotions tied to the program, and may decide to further modify the program in ways that could also affect customer usage patterns. As a result of the program change and potential further modifications, we believe it is appropriate to maintain straight-line recognition of membership fee revenue. We may, in the future, determine that recognition of membership fee revenue on a different basis is appropriate, which would affect net sales. The unearned revenue for this program is recorded in accrued liabilities in the consolidated balance sheets and was $3.8 million and $4.7 million at January 29, 2011, and January 30, 2010, respectively.
We maintain a customer loyalty program through our Arden B division. Under the program, customers accumulate points based on purchase activity. Once a loyalty program member achieves a certain point level, the member earns awards that may be redeemed for merchandise. Unredeemed awards and accumulated partial points are accrued as unearned revenue and awards redeemed by the member for merchandise are recorded as an increase to net sales.
We convert into fractional awards the points accumulated by customers who have not made purchases within the preceding 18 months. Similar to all other awards currently being granted under the program, such fractional awards expire if unredeemed after 60 days. The unearned revenue for this program is recorded in accrued liabilities on the consolidated balance sheets and was $1.3 million and $1.4 million at January 29, 2011, and January 30, 2010, respectively. If actual redemptions ultimately differ from accrued redemption levels, or if we further modify the terms of the program in a way that affects expected redemption value and levels, we could record adjustments to the unearned revenue accrual, which would affect net sales.
Short-term Investments
Our short-term investments consist of interest-bearing corporate bonds that are guaranteed by the U.S. Government under the Temporary Liquidity Guarantee Program (“TLGP”), have maturities that are less than one year and are carried at amortized cost plus accrued income. Our short-term investments are carried at amortized cost due to our intent to hold to maturity. Short-term investments on the consolidated balance sheets were $50.7 million at January 29, 2011. Any unrealized gains or unrealized losses on held to maturity investments are considered temporary and are not recorded unless an other than temporary impairment has occurred. Factors considered that could result in the necessity to impair include intention to sell, more likely than not being required to sell the security before recovery of the security’s amortized cost basis and whether we expect to recover the entire amortized cost basis of the security. We have considered all impairment factors and have determined that an other than temporary impairment has not occurred as of January 29, 2011.
Merchandise Inventories
Merchandise inventories are stated at the lower of cost or market. Market is determined based on the estimated net realizable value, which generally is the merchandise selling price. Cost is calculated using the retail inventory method. Under the retail inventory method, inventory is stated at its current retail selling value and then is converted to a cost basis by applying a cost-to-retail ratio based on beginning inventory and the fiscal year purchase activity. The retail inventory method inherently requires management judgments and estimates, such as the amount and timing of permanent markdowns to clear unproductive or slow-moving inventory, which may impact the ending inventory valuation as well as gross margins.
Markdowns are recorded when the sales value of the inventory has diminished. Factors considered in the determination of permanent markdowns include current and anticipated demand, customer preferences, age of the merchandise and fashion trends. When a decision is made to permanently mark down merchandise, the
29
Table of Contents
resulting gross margin reduction is recognized in the period the markdown is recorded. Total markdowns, including permanent and promotional markdowns, on a cost basis in fiscal 2010, 2009 and 2008 were $84.2 million, $78.6 million and $77.4 million, respectively, and represented 14.5%, 14.0% and 13.1% of net sales, respectively. We accrued $2.7 million and $2.4 million for planned but unexecuted markdowns, including markdowns related to slow moving merchandise, as of January 29, 2011, and January 30, 2010, respectively.
To the extent that management’s estimates differ from actual results, additional markdowns may be required that could reduce our gross margin, operating income and the carrying value of inventories. Our success is largely dependent upon our ability to anticipate the changing fashion tastes of our customers and to respond to those changing tastes in a timely manner. If we fail to anticipate, identify or react appropriately to changing styles, trends or brand preferences of our customers, we may experience lower sales, excess inventories and more frequent and extensive markdowns, which would adversely affect our operating results.
Long-Lived Assets
We evaluate the carrying value of long-lived assets for impairment whenever events or changes in circumstances indicate that the carrying value of such assets may not be recoverable. Factors that are considered important that could result in the necessity to perform an impairment review include a current-period operating or cash flow loss combined with a history of operating or cash flow losses and a projection or forecast that indicates continuing losses or insufficient income associated with the realization of a long-lived asset or asset group. Other factors include a significant change in the manner of the use of the asset or a significant negative industry or economic trend. This evaluation is performed based on estimated undiscounted future cash flows from operating activities compared with the carrying value of the related assets. If the undiscounted future cash flows are less than the carrying value, an impairment loss is recognized, measured by the difference between the carrying value and the estimated fair value of the assets, based on discounted cash flows using our weighted average cost of capital. We have considered all relevant valuation techniques that could be obtained without undue cost and effort and have determined that the discounted cash flow approach continues to provide the most relevant and reliable means by which to determine fair value in this circumstance.
Quarterly, we assess whether events or changes in circumstances have occurred that potentially indicate the carrying value of long-lived assets may not be recoverable. During fiscal 2010, 2009 and 2008, we determined such events or changes in circumstances had occurred with respect to certain of our retail stores, and that operating losses or insufficient operating income would likely continue. As such, we recorded noncash charges of $4.2 million, $2.3 million and $5.6 million, respectively, in our consolidated statements of operations for fiscal 2010, 2009 and 2008 to write down the carrying value of these stores’ long-lived assets to their estimated fair values.
The estimation of future cash flows from operating activities requires significant estimates of factors that include future sales growth and gross margin performance. If our sales growth, gross margin performance or other estimated operating results are not achieved at or above our forecasted level, or inflation exceeds our forecast and we are unable to recover such costs through price increases, the carrying value of certain of our retail stores may prove to be unrecoverable and we may incur additional impairment charges in the future.
Stock-Based Compensation
We measure and recognize compensation expense for all share-based payment awards to employees and directors based on estimated fair values.
We currently use the Black-Scholes option-pricing model to value stock options granted to employees. We use these values to recognize stock compensation expense for stock options. The Black-Scholes model is complex and requires significant exercise of judgment to estimate future common stock dividend yield, common stock expected volatility and the expected life of the stock options. These assumptions significantly affect our
30
Table of Contents
stock option valuations, and future changes in these assumptions could significantly change valuations of future stock option grants and, thus, affect future stock compensation expense. In addition, if circumstances were to change such that we determined stock option values were better represented by an alternative valuation method, such change could also significantly affect future stock compensation expense.
We also apply the Black-Scholes and Monte-Carlo simulation models to value performance shares granted to employees. Use of the Black-Scholes model for this purpose requires the same exercise of judgment noted above. The Monte-Carlo simulation model is also complex and requires significant exercise of judgment to estimate expected returns on our common stock, expected common stock volatility and our maximum expected share value during applicable vesting periods. This valuation approach also requires us to estimate a marketability discount in consideration of trading restrictions on performance share grants.
We currently believe Monte-Carlo simulation provides the most relevant value of performance share grants as the simulation allows for vesting throughout the vesting period and includes an assumption for equity returns over time, while the Black-Scholes method does not. As the Monte-Carlo simulation provides a more precise estimate of fair value, we have used that approach to value our performance shares for accounting purposes.
The assumptions we use to value our performance shares significantly affect the resulting values used for accounting purposes. Accordingly, changes in these assumptions could significantly change valuations and, thus, affect future stock compensation expense. In addition, if circumstances were to change such that we determined performance share values were better represented by the Black-Scholes model or an alternative valuation method, and such changes resulted in a significant change in the value of performance shares, such changes could also significantly affect future stock compensation.
The following table summarizes stock-based compensation recorded in the consolidated statements of operations:
| Fiscal Year Ended | ||||||||||||
| January 29, 2011 |
January 30, 2010 |
January 31, 2009 |
||||||||||
| (in thousands) | ||||||||||||
| Cost of sales |
$ | 2 | $ | (132 | ) | $ | 574 | |||||
| Selling, general, and administrative expenses |
1,785 | 1,756 | 2,403 | |||||||||
| Stock-based compensation |
$ | 1,787 | $ | 1,624 | $ | 2,977 | ||||||
Change in Estimated Forfeiture Rate
Based on historical experience, we modified the estimated annual forfeiture rate used in recognizing stock-based compensation expense, from a 10% forfeiture rate to a 15% forfeiture rate in the first quarter of fiscal 2009 and, for our executives, from a 5% forfeiture rate to a 10% forfeiture rate in the first quarter of fiscal 2008. During these same periods, we also realized benefits from actual forfeiture experience that was higher than previously estimated for unvested stock options and restricted common stock, resulting primarily from executive and other employee departures from our Company. See Note 2 to our consolidated financial statements included elsewhere in this Annual Report for further information.
Accounting for Income Taxes
Our income tax expense, deferred tax assets and reserves for unrecognized tax benefits reflect management’s best assessment of estimated future taxes to be paid. We are subject to income taxes in the United States federal jurisdiction as well as various state jurisdictions within the United States. Significant judgments and estimates are required in determining the consolidated income tax expense.
Deferred income taxes arise from temporary differences between the tax and financial statement recognition of revenue and expense and NOLs. In evaluating our ability to recover our deferred tax assets within the
31
Table of Contents
jurisdictions from which they arise, we consider whether it is more likely than not that some portion or all of the deferred tax assets will be realized using all available positive and negative evidence, projected future taxable income, tax planning strategies and recent financial operations. In projecting future taxable income, we begin with historical results adjusted for the results of changes in accounting policies and incorporate assumptions including the amount of future state and federal pretax operating income, the reversal of temporary differences, and the implementation of feasible and prudent tax planning strategies. These assumptions require significant judgment about the forecasts of future taxable income and are consistent with the plans and estimates we are using to manage the underlying business. In evaluating the objective evidence that historical results provide, we consider, among other things, three years of cumulative operating income. In 2004, as a result of historical operating losses and projected future results, we fully reserved against our deferred tax assets. As of fiscal 2009, we performed an analysis of all available evidence including, but not limited to, generating taxable income for the past four consecutive years, including 2009 in which we operated in an extremely challenging retail and economic environment, and concluded that the evidence supported that it is more likely than not that substantially all of our deferred tax assets will be realized, and we reversed the valuation allowance against the net deferred tax assets in the amount of $64.7 million, which was recorded to (benefit) provision for income taxes on the consolidated statement of operations.
During our third quarter of fiscal 2010, we determined we previously had interpreted federal tax rules incorrectly pertaining to expiration of charitable contribution carry forwards available to offset future taxable income. We also identified certain other minor errors in our deferred income taxes. As a result, we had overstated our net deferred tax assets, benefit for income taxes and net income by approximately $6.6 million as of the end of fiscal 2009. The overstatement had no net impact on the statement of cash flows or total cash flows from operating activities for fiscal 2009. We do not believe this amount is material to the fiscal 2009 financial statements. However, we adjusted deferred tax assets and stockholders’ equity on our consolidated balance sheet as of January 30, 2010, respectively, from amounts previously reported, to correct this overstatement. Presentation of our statement of operations, statement of cash flows and statement of stockholders’ equity and comprehensive income for fiscal 2009 has been adjusted to reflect the $6.6 million correction to reduce the benefit for income taxes and net income and to decrease the deferred tax asset and accumulated deficit balances (see Note 1: Summary of Significant Accounting Policies). The first and second quarterly filings on Form 10-Q in fiscal 2011 will also have the fiscal 2010 deferred tax assets and stockholder’s equity balances adjusted related to the first two quarters of fiscal 2010.
In addition, we evaluate our charitable contributions carryforward for likelihood of realizability prior to expiration and provided a reserve against any amounts that are deemed more likely than not to be realized.
During the third quarter of fiscal 2010, we implemented a change in tax method, upon filing our 2009 federal income tax return, which resulted in the reduction of deferred tax assets related to our charitable contribution carry forwards of $0.5 million. This decrease was recorded as a deferred income tax charge and increased our effective income tax rate for the quarter.
Our effective income tax rate for fiscal 2010 was approximately 44%. This rate was higher than expected due to $2.8 million in interest charges incurred in the first fiscal quarter upon the conversion of our remaining Secured Convertible Notes (the “Notes”) and Series C Convertible Preferred Stock (the “Preferred Stock”), which were not tax-deductible, and the $0.5 million non-cash deferred income tax charge previously discussed, offset by $0.5 million of non-cash deferred income tax benefit related to stock compensation true-ups in the fourth fiscal quarter. The net impact of these charges was an increase in the effective income tax rate for fiscal 2010 of approximately 4%.
Due to our utilization of federal and state NOLs during fiscal 2010, we incurred cash income taxes for the fiscal year of approximately 2% of pre-tax income, representing the portion of federal and state alternative minimum taxes and State of California regular income taxes that cannot be offset by NOLs. The difference between the effective income tax rate and the cash income taxes is recorded as a non-cash provision for deferred incomes taxes.
32
Table of Contents
We believe that our NOLs are a valuable asset and we intend to protect the value of our NOLs. However, Section 382 of the Internal Revenue Code (“Section 382”) contains provisions that may limit the availability of federal NOLs to be used to offset taxable income in any given year upon the occurrence of certain events, including significant changes in ownership interests of our common stock. Under Section 382, an ownership change that triggers potential limitations on NOLs occurs when there has been a greater than 50% change in ownership interest by shareholders owning 5% or more of a company over a period of three years or less. Based on our analyses, we had ownership changes in April 2005 and December 2006, which resulted in Section 382 limitations applying to federal NOLs generated prior to those dates, which were approximately $172.1 million.
As a result of those ownership changes, of our $93.5 million of remaining federal NOLs, we may utilize up to $58.3 million of our federal NOLs to offset taxable income in fiscal 2011 and 2012. We may also experience additional ownership changes in the future, which could further limit the amount of federal NOLs annually available. As of January 29, 2011, there have been no ownership changes since 2006.
In addition, we may determine that varying state laws with respect to NOL utilization may result in lower limits, or an inability to utilize NOLs in some states altogether, which could result in us incurring additional state income taxes. During fiscal 2008, the State of California passed legislation that suspended our ability to utilize NOLs to offset taxable income in fiscal 2008 and 2009. In late 2010, the State of California extended such legislation that further suspended use of NOLs to fiscal 2010 and 2011. As a result, we incurred additional state income taxes in California, which increased our effective tax rate in fiscal 2008 through 2010. The Company may also generate income in future periods on a federal alternative minimum tax basis, which would result in alternative minimum taxes payable on a portion of such income.
The calculation of our tax assets involves dealing with uncertainties in the application of complex tax laws and regulations in a multitude of jurisdictions across our operations. At January 29, 2011, we had no significant unrecognized tax benefits or expenses that, if recognized, would affect our effective income tax rate in future periods. We are currently unaware of any issues under review that could result in significant payments, accruals or material deviations from our recognized tax positions. However, if we later identify other income tax issues that result in significant additional payments or necessary accruals, this could have a material adverse effect on our reported results.
Insurance Reserves
We are partially self-insured for our workers’ compensation and group health plans. Under the workers’ compensation insurance program, we are liable for a deductible of $0.25 million for each individual claim and an aggregate annual liability of $1.4 million. Under our group health plan, we are liable for a deductible of $0.175 million for each claim and an aggregate monthly liability of $0.5 million. The monthly aggregate liability is subject to adjustment based on the number of participants in the plan each month. For both of the insurance plans, we record a liability for the costs associated with reported claims and a projected estimate for unreported claims considering historical experience and industry standards. We will continue to adjust the estimates as the actual experience dictates. A significant change in the number or dollar amount of claims could cause us to revise our estimate of potential losses and affect our reported results. Included in accrued liabilities within the consolidated balance sheets as of January 29, 2011, and January 30, 2010, are $1.5 million and $1.8 million, respectively, for reported claims and estimated unreported claims under our self-insured workers’ compensation and group health plans.
Current Trends and Outlook
We continue to operate in a challenging retail environment driven by several factors, including disruptions in the U.S. housing and financial markets and high unemployment rates across all regions of the U.S. Beginning in the fourth calendar quarter of 2008 and continuing through the second calendar quarter of 2009, U.S. gross domestic product decreased on a year-over-year basis. Although U.S. gross domestic product has shown
33
Table of Contents
improvement since the third calendar quarter of 2009, the increases have been modest, unemployment rates remain high in the teen segment and throughout the U.S. overall, and we continue to experience a volatile, and generally weak, retail environment. In addition, we began to experience increased sourcing costs in the fourth quarter of fiscal 2010 as a result of rising commodity prices, primarily for cotton, and increased labor costs, due to labor shortages in China, from which a majority of our merchandise is sourced. The rising value of the currency in China relative to the U.S. dollar is expected to have a further impact on future product costs. Our performance is subject to general economic conditions and their impact on levels of consumer confidence and consumer spending. Consumer purchases of discretionary items, including our merchandise, generally decline during periods when disposable income is adversely affected or there is economic uncertainty. As a result of the continued difficult economic conditions, we may face risks that will impact many facets of our operations, including, among other things, the ability of one or more of our vendors to deliver their merchandise in a timely manner or otherwise meet their obligations to us. Although we believe we are sufficiently prepared and financially strong enough to endure continued poor economic conditions in the U.S. and world economic markets, if such conditions become more volatile, or if they deteriorate further, our business, financial condition, and results of operations may be adversely affected.
Our comparable store sales increased 0.1% for fiscal 2010, driven by a 0.6% comparable store sales increase in our Arden B division and flat comparable store sales in our Wet Seal division. The Wet Seal division’s flat comparable store sales was primarily driven by an increase in average dollar sale per transaction, which was mainly due to an increase in average unit selling price, partially offset by a decrease in transaction volume. Directionally, the shifts in transaction volume and average unit selling price metrics were in line with our expectations and resulted from our planned merchandise content shift at Wet Seal towards apparel and away from lower-priced accessories relative to the prior year. The Arden B division comparable store sales increase was primarily driven by an increase in transaction volume, partially offset by declines in units purchased per customer and its average unit selling price. Lastly, we increased investment in our e-commerce inventories, marketing and team infrastructure starting in the third quarter of fiscal 2010 and generated online sales growth of 20.2% over the prior year.
We made progress on several key initiatives during fiscal 2010. We achieved merchandise margin improvement versus the prior year in the Wet Seal division due to the increase in merchandise mix in apparel, especially tops, the reduction of categories that had been underperforming and benefits from our new markdown and size optimization systems. However, we experienced negative comparable store sales results in our denim business during the year, which we believe was caused mainly by a highly promotional competitive environment in this category. Arden B experienced higher than originally planned promotional and overall markdown levels during fiscal 2010, resulting in a slight decline in merchandise margin performance. During fiscal 2010, we focused on increasing inventory position within our dress business at Arden B and, as a result, increased dress sales. We believe Arden B remains a key dress destination for our customers, and we expect to be well positioned in this category throughout fiscal 2011.
Our strategic priorities are to generate higher positive comparable store sales growth, continue improving upon Wet Seal merchandise margins, build upon improvements in our Arden B business to allow it to reach its full potential, expand our existing retail store base and expand our online businesses. To drive higher sales productivity in our retail stores, we will continue to review our store layout and design and visual displays with the objective of supporting higher productivity and a strong customer experience. We have embarked on several initiatives to improve customer service, including new training and development programs and better align merchandise mix with target customer wants. Additionally, we have been attentive to gross margins, including efforts to optimize sourcing of merchandise, enhance our inventory planning and allocation functions and improve supply chain efficiency by better coordination among and within our vendor, internal distribution and store operation organizations.
Our operating performance since fiscal 2005 has resulted in increased liquidity and improved credit standing with suppliers. However, we may not generate increases in comparable store sales or may be unsuccessful in
34
Table of Contents
executing some or all of our business strategy. If our comparable store sales drop significantly for an extended period of time, or we falter in execution of our business strategy, we may not achieve our financial performance goals, which could impact our business, financial condition, results of operations and operating cash flow.
Store Openings and Closures
During fiscal 2010, we opened 32 and closed six Wet Seal stores and opened nine and closed six Arden B stores. We believe future closures for at least the next 12 months will primarily result from lease expirations where we decide not to extend, or are unable to extend, a store lease.
We currently plan to open 25 to 30 Wet Seal stores in fiscal 2011, net of store closings, with a focus on malls and, to a lesser extent, on off-mall power centers to help us gain further understanding of the long-term growth potential in that venue. We also currently intend to continue growing the Arden B store base conservatively, with approximately four new stores, net of store closings, planned in fiscal 2011.
Results of Operations
The following table sets forth selected statements of operations data as a percentage of net sales for the fiscal year indicated. The discussion that follows should be read in conjunction with the table below:
| As a Percentage of Sales | ||||||||||||
| Fiscal Year | 2010 | 2009 | 2008 | |||||||||
| January 29, 2011 |
January 30, 2010 |
January 31, 2009 |
||||||||||
| Fiscal Year Ended |
||||||||||||
| Net sales |
100.0 | % | 100.0 | % | 100.0 | % | ||||||
| Cost of sales |
69.0 | 70.2 | 67.5 | |||||||||
| Gross margin |
31.0 | 29.8 | 32.5 | |||||||||
| Selling, general, and administrative expenses |
26.0 | 25.3 | 26.2 | |||||||||
| Asset impairment |
0.7 | 0.4 | 0.9 | |||||||||
| Operating income |
4.3 | 4.1 | 5.4 | |||||||||
| Interest expense, net |
(0.4 | ) | (0.1 | ) | (0.1 | ) | ||||||
| Income before provision (benefit) for income taxes |
3.9 | 4.0 | 5.3 | |||||||||
| Provision (benefit) for income taxes |
1.7 | (11.5 | ) | 0.2 | ||||||||
| Net income |
2.2 | % | 15.5 | % | 5.1 | % | ||||||
Fiscal 2010 compared to Fiscal 2009
The following summarizes the consolidated operating results of our company. This discussion is followed by an overview of operating results by reportable segment.
Net Sales
| 2010 | Change From Prior Fiscal Year |
2009 | ||||||||||||||
| ($ in millions) | ||||||||||||||||
| Net sales |
$ | 581.2 | $ | 20.3 | 3.6 | % | $ | 560.9 | ||||||||
| Comparable store sales increase |
0.1 | % | ||||||||||||||
35
Table of Contents
Net sales for fiscal 2010 increased primarily as a result of the following:
| • | An increase in number of stores open, from 504 stores as of January 30, 2010, to 533 stores as of January 29, 2011; |
| • | An increase of $6.7 million in net sales for our internet business compared to the prior year, which is not a factor in calculating our comparable store sales; and |
| • | An increase of 0.1% in comparable store sales resulting from a 5.8% increase in comparable store average dollar sales per transaction, partially offset by a 5.5% decrease in comparable store average transactions. Comparable store average dollar sales per transaction increased mainly due to a 7.8% increase in average unit retail prices, partially offset by a 1.5% decrease in the number of units purchased per customer. |
However, these factors were partially offset by:
| • | The prior year including an increase of $1.2 million in net sales resulting from a change in estimated breakage for unredeemed gift cards, gift certificates and store credits remaining outstanding for more than two years from their respective issuance dates. |
Cost of Sales
| 2010 | Change From Prior Fiscal Year |
2009 | ||||||||||||||
| ($ in millions) | ||||||||||||||||
| Cost of sales |
$ | 401.3 | $ | 7.2 | 1.8 | % | $ | 394.1 | ||||||||
| Percentage of net sales |
69.0 | % | (1.2 | )% | 70.2 | % | ||||||||||
Cost of sales includes the cost of merchandise; markdowns; inventory shortages; inventory valuation adjustments; inbound freight; payroll expenses associated with buying, planning and allocation; processing, receiving and other warehouse costs; rent and other occupancy costs; and depreciation and amortization expense associated with our stores and distribution center.
Cost of sales as a percentage of net sales decreased due primarily to an increase in merchandise margin as a result of higher initial markup rates in both divisions and favorable physical inventory shrink results in the Wet Seal division, as compared to the prior year, partially offset by an increase in markdown rates due to the highly promotional retail environment. Additionally, cost of sales decreased due to a decrease in buying costs resulting from a reduction in incentive bonuses as a result of declining performance results relative to incentive compensation targets.
Cost of sales increased due primarily to the 3.6% increase in net sales, an increase in distribution costs due to a loss on disposal of our previous distribution center pick system and operational inefficiencies upon automated sorter system start-up and an increase in occupancy cost as a result of an increase in number of stores, from 504 stores as of January 30, 2010, to 533 stores as of January 29, 2011.
Selling, General, and Administrative Expenses (SG&A)
| 2010 | Change From Prior Fiscal Year |
2009 | ||||||||||||||
| ($ in millions) | ||||||||||||||||
| Selling, general, and administrative expenses |
$ | 150.4 | $ | 8.8 | 6.2 | % | $ | 141.6 | ||||||||
| Percentage of net sales |
26.0 | % | 0.7 | % | 25.3 | % | ||||||||||
Our SG&A expenses are comprised of two components. Selling expenses include store and field support costs, including personnel, advertising and merchandise delivery costs as well as Internet processing costs.
36
Table of Contents
General and administrative expenses include the cost of corporate functions such as executives, legal, finance and accounting, information systems, human resources, real estate and construction, loss prevention and other centralized services.
Selling expenses increased approximately $6.1 million from the prior year to $119.9 million. As a percentage of net sales, selling expense was 20.7% of net sales, or 40 basis points higher than a year ago.
The following contributed to the current year increase in selling expenses:
| • | A $3.0 million increase in payroll and benefits costs as a result of increased sales volume; |
| • | A $1.5 million increase in internet order fulfillment costs due to increased internet sales volume; |
| • | A $1.2 million increase in advertising and marketing expenditures due to an increase in in-store signage at both divisions, an increase in direct marketing at our Wet Seal division and an increase in our internet advertising, primarily due to our increased presence on Facebook®; |
| • | A $0.3 million increase in credit card fees due to the prior year including funds received as a result of a Visa Check/Master Money antitrust litigation settlement and increased sales volume, partially offset by declines in average processing fees as a percent to sales; |
| • | A $0.1 million increase in merchandise delivery costs due to increased unit volume; |
| • | A $0.1 million increase in store supplies due to increased sales volume; and |
| • | A $0.2 million net increase in other selling expenses. |
However, the increases in selling expenses were partially offset by the following decrease:
| • | A $0.3 million decrease in bags and boxes usage. |
General and administrative expenses increased approximately $2.7 million from the prior year to $30.1 million. As a percentage of net sales, general and administrative expenses were 5.3%, or 30 basis points higher than a year ago.
The following contributed to the current year increase in general and administrative expenses:
| • | A $0.8 million increase due to the transition payment to our previous chief executive officer; |
| • | A $0.7 million increase in corporate wages; |
| • | A $0.6 million increase in bonuses due to corporate bonuses based on our financial performance and retention agreements; |
| • | A $0.4 million increase in recruiting fees related to our search for a new chief executive officer; |
| • | A $0.3 million increase in legal fees associated with various litigation and other corporate legal matters; |
| • | A $0.3 million increase in consulting fees due to timing of services performed, compared to the prior year; |
| • | A $0.2 million increase in audit fees due to timing of services performed, compared to the prior year; and |
| • | A $0.1 million net increase in other general and administrative costs. |
However, the increases in general and administrative expenses were partially offset by the following decreases:
| • | A $0.5 million decrease in severance as the prior year included a severance charge upon departure of the former chief merchandise officer for our Wet Seal division; |
37
Table of Contents
| • | A $0.1 million decrease in general office and supplies; and |
| • | A $0.1 million decrease in computer maintenance costs. |
Asset Impairment
| 2010 | Change From Prior Fiscal Year |
2009 | ||||||||||||||
| ($ in millions) | ||||||||||||||||
| Asset impairment |
$ | 4.2 | $ | 1.9 | 80.6 | % | $ | 2.3 | ||||||||
| Percentage of net sales |
0.7 | % | 0.3 | % | 0.4 | % | ||||||||||
Based on our quarterly assessments of the carrying value of long-lived assets, during fiscal 2010 and fiscal 2009, we identified certain retail stores with carrying values of their assets, including leasehold improvements, furniture, fixtures and equipment, in excess of such stores’ respective forecasted undiscounted cash flows. Accordingly, we reduced their respective carrying values to their estimated fair market values, resulting in non-cash charges of $4.2 million and $2.3 million, respectively.
Interest Expense, Net
| 2010 | Change From Prior Fiscal Year |
2009 | ||||||||||||||
| ($ in millions) | ||||||||||||||||
| Interest expense, net |
$ | (2.7 | ) | $ | 2.2 | 457.2 | % | $ | (0.5 | ) | ||||||
| Percentage of net sales |
(0.4 | )% | 0.3 | % | (0.1 | )% | ||||||||||
We incurred interest expense, net, of $2.7 million in fiscal 2010 comprised of:
| • | Interest charges of $2.8 million, consisting of $2.1 million of non-cash charges and a $0.7 million conversion/exercise inducement fee, related to the conversion of $4.7 million of the Notes into 3,111,111 shares of our common stock and $1.6 million of the Preferred Stock into 537,000 shares of our common stock, and the exercise of Series E warrants into 625,000 shares of our common stock; |
| • | Non-cash interest expense of $0.1 million on the Notes prior to conversion, comprised primarily of discount amortization and, to a lesser extent, annual interest at 3.76%, which we elected to add to principal; |
| • | Interest expense of $0.1 million from fees for the unused portion of our credit facility; partially offset by |
| • | Interest income of $0.3 million from investments in cash and cash equivalents, short-term investments and noncash benefits to recognize interest capitalized on fixed assets and interest income related to long-term tenant allowances. |
We incurred interest expense, net, of $0.5 million in fiscal 2009 comprised of:
| • | Non-cash interest expense of $0.9 million with respect to our secured convertible notes, comprised primarily of discount amortization and, to a lesser extent, annual interest at 3.76%, which we elected to add to principal; partially offset by |
| • | Interest income of $0.4 million from investments in cash and cash equivalents and a nominal noncash benefit to recognize interest capitalized on fixed assets. |
38
Table of Contents
Provision (Benefit) for Income Taxes
| 2010 | Change From Prior Fiscal Year |
2009 | ||||||||||||||
| ($ in millions) | ||||||||||||||||
| Provision (benefit) for income taxes |
$ | 10.0 | $ | 74.5 | 115.5 | % | $ | (64.5 | ) | |||||||
In fiscal 2010 we incurred a 44% effective income tax rate, which is significantly higher than the rate in fiscal 2009 primarily as a result of the reversal of our deferred tax asset valuation allowance at the end of fiscal 2009. In addition, this rate was higher than that expected for future periods due to $2.8 million in interest charges incurred upon the Note conversions in the first fiscal quarter 2010, which are not tax deductible, and a $0.5 million non-cash deferred income tax charge in the third fiscal quarter due to a tax method change that resulted in the reduction of deferred tax assets related to charitable contribution carry forwards, offset by $0.5 million of non-cash deferred income tax benefit related to stock compensation true-ups in the fourth fiscal quarter. Excluding the effect of these charges, the effective income tax rate for fiscal 2010 would have been approximately 40%.
Due to our utilization of federal and state NOL carry forwards during fiscal 2010, we incurred cash income taxes for the fiscal year of approximately 2% of pre-tax income, representing the portion of federal and state alternative minimum taxes, as well as State of California regular income taxes, that cannot be offset by NOLs. The difference between the effective income tax rate and the cash income taxes is recorded as a non-cash provision for deferred incomes taxes.
In 2004, as a result of disappointing sales results and historical operating losses, we fully reserved against our deferred tax assets. As of January 30, 2010, we performed an analysis of all available evidence including, but not limited to, generating taxable income for the past four consecutive years, including 2009 in which we operated in an extremely challenging retail and economic environment. We concluded that the evidence supported that it is more likely than not that substantially all of our deferred tax assets will be realized. As a result, we reversed the valuation allowance against the net deferred tax assets in the amount of $64.7 million in the fourth quarter of fiscal 2009.
Segment Information
The following is a discussion of the operating results of our business segments. We consider each of our operating divisions to be a segment. In the tables below, Wet Seal and Arden B reportable segments include data from their respective stores and Internet operations. Operating segment results include net sales, cost of sales, asset impairment and store closure costs, and other direct store and field management expenses, with no allocation of corporate overhead, interest income or expense.
Wet Seal:
| ($ in thousands, except sales per square foot and store count data) |
Fiscal 2010 |
Fiscal 2009 |
||||||
| Net sales |
$ | 486,959 | $ | 465,630 | ||||
| Percentage of consolidated net sales |
84 | % | 83 | % | ||||
| Comparable store sales percentage increase (decrease) compared to the prior fiscal year |
0.0 | % | (8.5 | )% | ||||
| Operating income |
$ | 46,429 | $ | 41,847 | ||||
| Sales per square foot |
$ | 267 | $ | 268 | ||||
| Number of stores as of year-end |
450 | 424 | ||||||
| Square footage as of year-end |
1,787 | 1,674 | ||||||
Wet Seal comparable stores sales were flat during fiscal 2010, compared to a prior year decrease of 8.5%. The flat comparable store sales for fiscal 2010 was due primarily to a 6.3% increase in comparable store average
39
Table of Contents
dollar sales per transaction, partially offset by a 6.1% decrease in comparable store average transactions. The increase in comparable store average dollar sales per transaction resulted from an 8.2% increase in our average unit retail prices, partially offset by a 1.5% decrease in units purchased per customer, as a result of a merchandise content shift towards apparel and away from lower-priced accessories. The net sales increase was attributable to the increase in the number of stores compared to the prior year and a $4.0 million increase in net sales in our internet business, partially offset by the prior year including $0.8 million of additional net sales resulting from a change in estimated breakage for unredeemed gift cards, gift certificates and store credits remaining outstanding more than two years from their respective issuance dates.
Wet Seal division operating income increased to 9.5% of net sales during fiscal 2010, from 9.0% during fiscal 2009. This increase was due primarily to an increase in merchandise margin as a result of an increase in initial markup rates and favorable physical inventory shrink results, and a decrease in buying costs and stock compensation expense primarily due to our open chief merchandise officer position, partially offset by higher markdown rates driven by a heavily promotional competitive environment. Additionally, during fiscal 2010 and fiscal 2009, operating income included asset impairment charges of $3.6 million and $2.0 million, respectively, to write down the carrying value of long-lived assets that were identified during our quarterly impairment evaluations. Operating income for fiscal 2009 included the $0.8 million breakage benefit noted above.
Arden B:
| ($ in thousands, except sales per square foot and store count data) |
Fiscal 2010 |
Fiscal 2009 |
||||||
| Net sales |
$ | 94,235 | $ | 95,288 | ||||
| Percentage of consolidated net sales |
16 | % | 17 | % | ||||
| Comparable store sales percentage increase compared to the prior fiscal year |
0.6 | % | 0.2 | % | ||||
| Operating income |
$ | 8,384 | $ | 9,107 | ||||
| Sales per square foot |
$ | 341 | $ | 339 | ||||
| Number of stores as of year-end |
83 | 80 | ||||||
| Square footage as of year-end |
256 | 244 | ||||||
Arden B comparable stores sales increased 0.6% during fiscal 2010, compared to a prior year increase of 0.2%. The increase during fiscal 2010 was due primarily to a 1.3% increase in comparable store average transactions, partially offset by a 0.7% decrease in comparable store average dollar sales per transaction. The decrease in the average dollar sales per transaction resulted from a 0.5% decline in average unit retail prices and a 0.6% decrease in units purchased per customer. The net sales decrease was primarily attributable to six store closings and nine store openings which did not have a full year impact on sales and the prior year including $0.4 million of additional net sales resulting from a change in estimated breakage for unredeemed gift cards, gift certificates and store credits remaining outstanding more than two years from their respective issuance dates, partially offset by a $2.7 million increase in net sales in our internet business and the comparable store sales increase.
Arden B generated operating income of 8.9% of net sales during fiscal 2010, compared to operating income of 9.6% of net sales during fiscal 2009. The decrease in operating income was due primarily to a decrease in merchandise margin as a result of higher markdown rates partially offset by an increase in initial markup rates, an increase in buying wages and an increase in stock compensation expense. Additionally, during fiscal 2010, and fiscal 2009, operating income included asset impairment charges of $0.6 million and $0.3 million, respectively, to write down the carrying value of long-lived assets that were identified during our quarterly impairment evaluations. Also, operating income for fiscal 2009 included the $0.4 million breakage benefit noted above.
40
Table of Contents
Fiscal 2009 compared to Fiscal 2008
The following summarizes the consolidated operating results of our company. This discussion is followed by an overview of operating results by reportable segment.
Net Sales
| 2009 | Change From Prior Fiscal Year |
2008 | ||||||||||||||
| ($ in millions) | ||||||||||||||||
| Net sales |
$ | 560.9 | $ | (32.1 | ) | (5.4 | )% | $ | 593.0 | |||||||
| Comparable store sales |
(7.1 | )% | ||||||||||||||
Net sales in fiscal 2009 decreased as a result of the following:
| • | A decrease of 7.1% in comparable store sales resulting from a 2.5% decline in comparable store average dollar sales and a 4.1% decrease in comparable store average transaction counts. Comparable store average dollar sales decreased mainly due to an 8.4% decline in our average unit retail prices, primarily driven by increased promotional activity and an increase in clearance sales at Wet Seal, our strategic decision to significantly lower price points at Arden B in January 2009, and a decline in Wet Seal frequent buyer program membership sales, partially offset by a 6.9% increase in the number of units purchased per customer, compared to the prior year, primarily at Wet Seal. |
However, these factors were partially offset by:
| • | An increase in the number of stores open, from 496 stores as of January 31, 2009, to 504 stores as of January 30, 2010; |
| • | An increase of $2.7 million in net sales for our internet business compared to the prior year, which is not a factor in calculating our comparable store sales; and |
| • | An increase of $1.2 million in net sales resulting from a change in estimated breakage for unredeemed gift cards, gift certificates and store credits from greater than three years to greater than two years from their respective issuance dates. |
Cost of Sales
| 2009 | Change From Prior Fiscal Year |
2008 | ||||||||||||||
| ($ in millions) | ||||||||||||||||
| Cost of sales |
$ | 394.1 | $ | (6.4 | ) | (1.6 | )% | $ | 400.5 | |||||||
| Percentage of net sales |
70.2 | % | 2.7 | % | 67.5 | % | ||||||||||
Cost of sales decreased due primarily to the 5.4% decrease in net sales, a decrease in buying, planning and allocation costs primarily due to the full-year effect of eliminated positions as a result of the restructuring of the Arden B buying and design organization, favorable impact on stock-based compensation from forfeitures by previously employed executives and a change in stock compensation forfeiture rate from 10% to 15% based on historical analysis, a reduction in recruiting as the prior year period included a more significant recruiting retainer fee to search for a chief merchandise officer in the Wet Seal division, and a decrease in distribution costs due to operational efficiencies. Cost of sales was negatively impacted by an increase in occupancy costs primarily due to normal inflation of rents and common area maintenance charges for new stores and remodels/relocations.
Cost of sales increased as a percentage of net sales due primarily to a deleveraging effect on occupancy cost from our comparable store sales decrease and a decrease in merchandise margin. Merchandise margin decreased
41
Table of Contents
as a result of an increase in markdown rates for our Wet Seal division, partially offset by a significantly lower markdown rate in our Arden B division, and a decrease in initial markup rates in both divisions, as compared to the prior year. Additionally, net sales includes a benefit of $1.2 million due to a change in estimated timing of when breakage of gift cards, gift certificates and store credits is recognized from greater than three years after their issuance dates to greater than two years after their issuance dates.
Selling, General, and Administrative Expenses (SG&A)
| 2009 | Change From Prior Fiscal Year |
2008 | ||||||||||||||
| ($ in millions) | ||||||||||||||||
| Selling, general, and administrative expenses |
$ | 141.6 | $ | (13.1 | ) | (8.4 | )% | $ | 154.7 | |||||||
| Percentage of net sales |
25.3 | % | (0.9 | )% | 26.2 | % | ||||||||||
During fiscal 2009, we placed major emphasis on reducing costs across all SG&A categories, resulting in a significant decline in SG&A in absolute dollars as well as a percentage of sales.
Selling expenses decreased approximately $10.2 million from the prior year to $113.8 million. As a percentage of net sales, selling expense was 20.3% of net sales, or 60 basis points lower, as a percentage of net sales, than a year ago.
The following contributed to the current year decrease in selling expenses:
| • | A $7.6 million decrease in payroll and benefits costs as a result of decreased payroll hours in response to lower sales volume, improved efficiency in controlling labor hours and a decrease in claim costs in our employee health care plan; |
| • | A $0.8 million decrease in advertising and marketing expenditures due to a decrease in in-store signage and the shift to more cost-effective advertising activities at our Arden B division; |
| • | A $0.4 million decrease in credit card fees due to funds received as a result of a Visa Check/Master Money antitrust litigation settlement and lower sales volume, partially offset by increases in interchange fee rates; |
| • | A $0.3 million decrease in store and field travel costs; |
| • | A $0.3 million decrease in bags and boxes usage as a result of lower sales volume; |
| • | A $0.2 million decrease in merchandise delivery costs as a result of a decrease in units processed and slightly lower cost per unit due to lower fuel surcharges compared to the prior year; |
| • | A $0.2 million decrease in store and field meetings and seminars expense; and |
| • | A $0.4 million net decrease in other selling costs. |
General and administrative expenses decreased approximately $2.9 million from the prior year to $27.8 million. As a percentage of net sales, general and administrative expenses were 5.0%, or 30 basis points lower, than a year ago.
The following contributed to the current year decrease in general and administrative expenses:
| • | A $1.4 million decrease in corporate wages, primarily due to reduced staffing levels from a January 2009 organizational restructuring; |
| • | A $1.4 million decrease in corporate bonuses based on a shortfall in our financial performance relative to bonus targets; |
42
Table of Contents
| • | A $0.6 million decrease in stock compensation, primarily due the favorable impact of forfeitures from previously employed executives and a change in stock compensation forfeiture rate from 10% to 15%; |
| • | A $0.3 million decrease in insurance due to favorably negotiated rates upon renewals; |
| • | A $0.2 million decrease in consultant fees; and |
| • | A $0.5 million net decrease in other general and administrative costs. |
However, the decreases in general and administrative expenses were partially offset by the following increases:
| • | A $1.0 million increase in legal fees associated with various litigation matters; and |
| • | A $0.5 million severance charge upon departure of the former chief merchandise officer for our Wet Seal division. |
Asset Impairment
| 2009 | Change From Prior Fiscal Year |
2008 | ||||||||||||||
| ($ in millions) | ||||||||||||||||
| Asset impairment |
$ | 2.3 | $ | (3.3 | ) | (58.3 | )% | $ | 5.6 | |||||||
| Percentage of net sales |
0.4 | % | (0.5 | )% | 0.9 | % | ||||||||||
Based on our quarterly assessments of the carrying value of long-lived assets, in fiscal 2009, we identified certain stores with carrying values of their assets, including leasehold improvements, furniture, fixtures and equipment, in excess of such stores’ respective forecasted undiscounted cash flows. Accordingly, we reduced their respective carrying values to their estimated fair market values and wrote down the value of certain capital additions made to previously impaired stores. We incurred noncash charges of $2.3 million in writing down these stores to their respective fair values, primarily in the Wet Seal division.
During fiscal 2008, we recorded impairment charges of $5.6 million in writing down certain stores’ assets to their respective fair values, primarily within our Arden B division.
Interest Expense, Net
| 2009 | Change From Prior Fiscal Year |
2008 | ||||||||||||||
| ($ in millions) | ||||||||||||||||
| Interest expense, net |
$ | (0.5 | ) | $ | (0.6 | ) | (57.6 | )% | $ | (1.1 | ) | |||||
| Percentage of net sales |
(0.1 | )% | 0.1 | % | (0.2 | )% | ||||||||||
We incurred interest expense, net, of $0.5 million in fiscal 2009 comprised of:
| • | Non-cash interest expense of $0.9 million with respect to our secured convertible notes, comprised primarily of discount amortization and, to a lesser extent, annual interest at 3.76%, which we elected to add to principal; partially offset by |
| • | Interest income of $0.4 million from investments in cash and cash equivalents and a nominal noncash benefit to recognize interest capitalized on fixed assets. |
43
Table of Contents
We incurred interest expense, net, of $1.1 million in fiscal 2008 comprised of:
| • | Noncash net interest charges of $2.3 million accelerated upon the conversion of $3.4 million of convertible notes into 2,274,804 shares of our common stock; |
| • | Noncash interest expense of $0.8 million with respect to our secured convertible notes comprised primarily of discount amortization and, to a lesser extent, annual interest at 3.76%, which we elected to add to principal; |
| • | Amortization of deferred financing costs of $0.1 million associated with our revolving credit facility and secured convertible notes; partially offset by |
| • | Interest income of $2.1 million from investments in cash and cash equivalents and a nominal noncash benefit to recognize the decrease in market value of a derivative liability. |
(Benefit) Provision for Income Taxes
| 2009 | Change From Prior Fiscal Year |
2008 | ||||||||||||||
| ($ in millions) | ||||||||||||||||
| (Benefit) provision for income taxes |
$ | (64.5 | ) | $ | (65.8 | ) | NM | $ | 1.3 | |||||||
In 2004, as a result of historical operating losses and projected future results, we fully reserved against our deferred tax assets. As of January 30, 2010, we performed a current analysis of all available positive and negative evidence including, but not limited to, generating taxable income for the past four consecutive years, including 2009 in which we operated in an extremely challenging retail and economic environment, and concluded that the evidence supports that it is more likely than not that substantially all of our deferred tax assets will be realized, and we reversed the valuation allowance against the net deferred tax assets in the amount of $64.7 million in the fourth quarter of fiscal 2009. See Note 1 of the notes to consolidated financial statements for further detail.
We have NOL carry forwards available, subject to certain limitation, to offset our regular taxable income in fiscal 2009 and 2008. Therefore, we incurred cash income taxes only for the limited portion of federal and state alternative minimum taxes and regular income taxes in the State of California which cannot be offset by NOL carry forwards in fiscal 2009 and 2008. Also, during fiscal 2009, we generated a nominal income tax benefit to reflect a prior period income tax overpayment to Puerto Rico.
Segment Information
Wet Seal:
| (In thousands, except sales per square foot and store count data) |
Fiscal 2009 |
Fiscal 2008 |
||||||
| Net sales |
$ | 465,630 | $ | 491,052 | ||||
| Percentage of consolidated net sales |
83 | % | 83 | % | ||||
| Comparable store sales percentage decrease compared to the prior fiscal year |
(8.5 | )% | (4.5 | )% | ||||
| Operating income |
$ | 41,847 | $ | 71,113 | ||||
| Sales per square foot |
$ | 268 | $ | 292 | ||||
| Number of stores as of year-end |
424 | 409 | ||||||
| Square footage as of year-end |
1,674 | 1,612 | ||||||
Wet Seal comparable stores sales decreased 8.5% during fiscal 2009, compared to a prior year decrease of 4.5%. The decrease during fiscal 2009 was due primarily to a 6.6% decrease in comparable store average transaction counts per store and a 1.2% decline in comparable store average dollar sales per transaction. The
44
Table of Contents
decrease in comparable store average dollar sales resulted from an 8.1% decrease in our average unit retail prices and a decline in frequent buyer program membership sales, partially offset by an 8.4% increase in units purchased per customer. We believe that the overall net sales decrease was attributable to the difficult retail and economic environment and our weak merchandise mix throughout most of fiscal 2009, partially offset by $0.8 million of additional net sales resulting from a change in estimated breakage for unredeemed gift cards, gift certificates and store credits remaining outstanding more than two years from their respective issuance dates, a $0.4 million increase in net sales in our Internet business and a $12.0 million increase from stores not in the comparable store base.
Wet Seal’s operating income, before allocation of corporate general and administration expenses, decreased to 9.0% of net sales during fiscal 2009, from 14.5% during fiscal 2008. This decrease was due primarily to a decrease in merchandise margin as a result of higher markdown rates and a decrease in initial markup rates, as a result of the difficult retail and economic environment and our weak merchandise mix throughout most of fiscal 2009, an increase in occupancy costs primarily due to normal inflation of rents and common area maintenance charges for new stores and remodels/relocations and the resulting deleveraging effect of a decrease in comparable store sales on occupancy costs, compared to the prior year. Additionally, during fiscal 2009 and fiscal 2008, operating income included asset impairment charges of $2.0 million and $0.5 million, respectively, to write down the carrying value of long-lived assets that were identified during our quarterly impairment evaluations. Operating income for fiscal 2009 also included the $0.8 million breakage benefit noted above.
Arden B:
| (In thousands, except sales per square foot and store count data) |
Fiscal 2009 |
Fiscal 2008 |
||||||
| Net sales |
$ | 95,288 | $ | 101,908 | ||||
| Percentage of consolidated net sales |
17 | % | 17 | % | ||||
| Comparable store sales percentage increase (decrease) compared to the prior fiscal year |
0.2 | % | (23.5 | )% | ||||
| Operating income (loss) |
$ | 9,107 | $ | (9,754 | ) | |||
| Sales per square foot |
$ | 339 | $ | 326 | ||||
| Number of stores as of year-end |
80 | 87 | ||||||
| Square footage as of year-end |
244 | 267 | ||||||
Arden B comparable stores sales increased 0.2% during fiscal 2009, compared to a prior year decrease of 23.5%. The increase during fiscal 2009 was due primarily to a 32.7% increase in comparable store average transaction counts per store, largely offset by a 24.5% decrease in comparable store average dollar sales per transaction, which reflects our strategic decision to significantly lower price points across all categories in January 2009. The decrease in the average dollar sales per transaction resulted from a 25.9% decline in our average unit retail prices, slightly offset by a 1.7% increase in units purchased per customer. Throughout fiscal 2009, we were building inventories at Arden B to a level that supports its new fast fashion model. We began to see comparable store sales growth acceleration later in the year when the inventory levels began to peak. The net sales decrease was attributable to the decrease in the number of stores compared to prior year, partially offset by $0.4 million of additional net sales resulting from a change in estimated breakage for unredeemed gift cards, gift certificates and store credits remaining outstanding more than two years from their respective issuance dates and a $2.3 million increase in net sales in our Internet business.
Arden B generated operating income of 9.6% of net sales during fiscal 2009, compared to an operating loss of 9.6% of net sales during fiscal 2008. The improvement in operating results was due primarily to a significant increase in merchandise margin resulting from a significant decrease in markdown rates, a decrease in buying costs upon restructuring the Arden B buying and design groups, partially offset by an increase in merchant incentive bonuses due to improvement in divisional performance, a decrease in occupancy costs due to a decrease in depreciation expense as a result of a number of underperforming Arden B stores being impaired during fiscal
45
Table of Contents
2008, the decrease in store counts from 87 stores as of January 31, 2009, to 80 stores as of January 30, 2010, and a decrease in store payroll costs as a result of lower sales and improved efficiency in controlling labor hours compared to the prior year. Additionally, during fiscal 2009 and fiscal 2008, operating income (loss) included asset impairment charges of $0.3 million and $5.1 million, respectively, to write down the carrying value of long-lived assets that were identified during our quarterly impairment evaluations. Operating income for fiscal 2009 also included the $0.4 million breakage benefit noted above.
Liquidity and Capital Resources
Net cash provided by operating activities was $50.1 million for fiscal 2010, compared to $40.5 million for the same period last year. For fiscal 2010, cash provided by operating activities was comprised of net income of $12.6 million, net non-cash charges, primarily depreciation and amortization, asset impairment, stock-based compensation, stock-based compensation tax shortfalls, provision for deferred income taxes and non-cash interest expense, of $35.6 million, a $0.7 million add back for a conversion inducement fee, and an increase in merchandise payables over the increase of merchandise inventories of $1.7 million, partially offset by a net use of cash from changes in other operating assets and liabilities of $0.5 million. For fiscal 2010, net cash used in investing activities of $82.0 million was comprised of $30.7 million for capital expenditures, primarily for the construction of new Wet Seal and Arden B stores, remodeling of existing Wet Seal and Arden B stores upon lease renewals and/or store relocations, and investment in the development of new retail merchandising and point-of-sale operating systems and a merchandise sorting system installed in our distribution center, and $51.3 million for investment of cash from money market funds into short-term investments. Capital expenditures that remain unpaid as of January 29, 2011, have increased $1.5 million since the end of fiscal 2009. We expect to pay nearly all of the total balance of such amounts payable of $4.2 million during the first quarter of fiscal 2011.
We estimate that, in fiscal 2011, capital expenditures will be between $29.0 million and $30.0 million, net of approximately $4.5 million in landlord tenant improvement allowances. Of the total net capital expenditures, approximately $22.0 million to $23.0 million is expected to be for the remodeling of existing Wet Seal and Arden B stores upon lease renewals and/or store relocations and the construction of new Wet Seal and Arden B stores.
For fiscal 2010, net cash used by financing activities was $4.4 million, comprised of $8.2 million used to repurchase 2,276,462 shares of our Class A common stock, which utilized all remaining capacity under a $12.5 million repurchase authorization granted by our Board of Directors in November 2009 and a portion of the capacity under a $25 million repurchase authorization granted by our Board of Directors in September 2010, and a $0.7 million conversion inducement fee paid to a Note holder (see further comments below), partially offset by $4.3 million of proceeds from investor exercises of common stock warrants, which resulted in the issuance of 1,160,715 shares of our Class A common stock, and $0.2 million of proceeds from the exercise of stock options.
For fiscal 2009, net cash provided by financing activities was $0.5 million, comprised primarily of $7.8 million of proceeds from investor exercises of common stock warrants, which resulted in the issuance of 2,911,520 shares of our Class A common stock, and nominal proceeds from the exercise of stock options, partially offset by $7.3 million used to repurchase 2,025,720 shares of our Class A common stock pursuant to the $12.5 million repurchase authorization granted by our Board of Directors in November 2009.
In March 2010, a holder of the Notes, Preferred Stock and Series E warrants converted $4.7 million in principal amount of our Notes into 3,111,111 shares of our Class A common stock and 1,611 shares of the Preferred Stock into 537,000 shares of our Class A common stock, and exercised Series E warrants into 625,000 shares of our Class A common stock for an exercise price of $2.3 million. As an inducement for the holder to undertake these conversions and/or exercises of the Notes, Preferred Stock and Series E warrants, we provided the holder with a $0.7 million inducement fee. We also repurchased an insignificant remaining Note balance from another holder. As a result of these transactions, there are no longer any remaining Notes and Preferred Stock outstanding and there was a satisfaction and discharge of our obligations under the Indenture governing the Notes.
46
Table of Contents
On November 3, 2010, all of the Company’s remaining Series E Warrants expired unexercised. As a result, no warrants to acquire the Company’s Class A common stock remain outstanding.
Total cash, cash equivalents and investments at January 29, 2011, was $176.1 million compared to $161.7 million at January 30, 2010.
On February 3, 2011, we renewed, via amendment and restatement, our $35.0 million senior revolving credit facility with our existing lender (the “Facility”), which can be increased up to $50.0 million in the absence of any default and upon the satisfaction of certain conditions precedent specified in the Facility. The Facility expires in February 2016. Effective, April 1, 2011, under the Facility, we are subject to borrowing base limitations on the amount that can be borrowed and certain customary covenants, including, under certain circumstances, covenants limiting our ability to incur additional indebtedness, make investments and acquisitions, grant liens, pay dividends, repurchase our common stock, close stores, and dispose of assets, without the lender’s consent. Our ability to borrow and request the issuance of letters of credit is subject to the requirement that we maintain an excess of the borrowing base over the outstanding credit extensions of the greater of 10% of the aggregate amount of the facility or $4.0 million. The interest rate on the revolving line of credit under the Facility is (i) the higher of the lender’s prime rate, the Federal funds rate plus 0.5% or the one month London InterBank Offered Rate (LIBOR) plus 1.0%, collectively referred to as the “Base Rate”, plus the applicable margin ranging from 0.5% to 1.0% or, (ii) if we elect, the average one, two, three or six months LIBOR plus a margin ranging from 1.5% to 2.0%. The applicable Base Rate or LIBOR margin is based on the level of average excess availability, as defined under the Facility, at the time of election, as adjusted quarterly. We also incur fees on outstanding letters of credit under the Facility at a rate equal to the applicable LIBOR margin for standby letters of credit and 23.0% of the applicable LIBOR margin for commercial letters of credit. Additionally, we are subject to commitment fees of 0.25% on the unused portion of the line of credit under the Facility.
The rates under our previous senior revolving credit facility will remain applicable through March 31, 2011. The interest rate on our line of credit under the Facility was the prime rate or, if we elected, the London InterBank Offered Rate (“LIBOR”) plus a margin ranging from 1.0% to 1.5%. The applicable LIBOR margin was based on the level of average excess availability, as defined under the Facility, at the time of election, as adjusted quarterly. The applicable LIBOR margin was 1.0% as of January 29, 2011. We also incurred fees on outstanding letters of credit under the Facility at a rate equal to the applicable LIBOR margin for standby letters of credit and 33.3% of the applicable LIBOR margin for commercial letters of credit. Additionally, we incurred commitment fees of 0.25% on the unused portion of the line of credit under the Facility.
Borrowings under the Facility are secured by inventory, receivables, cash, cash equivalents and investments held by us and our wholly owned subsidiaries, The Wet Seal Retail, Inc. and Wet Seal Catalog, Inc., each of which may be a borrower under the Facility. Borrowings under the previous senior credit facility were secured by all assets held by us and two of our wholly owned subsidiaries, The Wet Seal Retail, Inc. and Wet Seal Catalog, Inc. Our obligations thereunder and the subsidiary borrowers under the Facility are guaranteed by one of our wholly owned subsidiaries, Wet Seal GC, LLC.
At January 29, 2011, the amount outstanding under the Facility consisted of $6.7 million in open documentary letters of credit related to merchandise purchases and $1.7 million in outstanding standby letters of credit. At January 29, 2011, we had $26.6 million available for cash advances and/or for the issuance of additional letters of credit, and we were in compliance with all covenant requirements under the Facility.
We believe we will have sufficient cash and credit availability to meet our operating and capital requirements for at least the next 12 months.
The financial performance of our business is susceptible to declines in discretionary consumer spending, availability of consumer credit and low consumer confidence in the United States. Volatile fuel prices and increasing commodity costs may also cause a shift in consumer demand away from the retail clothing products
47
Table of Contents
that we offer. There are no guarantees that government or other initiatives will limit the duration or severity of the current economic challenges or stabilize factors that affect our sales and profitability. Continuing adverse economic trends could affect us more significantly than companies in other industries.
Seasonality and Inflation
Our business is seasonal in nature, with the Christmas season, beginning the week of Thanksgiving and ending the first Saturday after Christmas, and the back-to-school season, beginning the last week of July and ending during September, historically accounting for a large percentage of our sales volume. For the past three fiscal years, the Christmas and back-to-school seasons together accounted for an average of slightly less than 30% of our annual sales.
We do not believe that inflation has had a material effect on our results of operations during the past three years. However, we began to experience cost pressures on the fourth quarter of fiscal 2010 as a result of the rising commodity prices, primarily for cotton, and increased labor costs, due to labor shortages in China, from which a majority of our merchandise is sourced. In addition, the rising value of the currency in China relative to the U.S. dollar is expected to have a further impact on future product costs. Although our initial mark ups have remained fairly stable to date, we have experienced some deterioration in mark-up rates in the fourth quarter of 2010 merchandise receipts and are experiencing further cost increases for merchandise on order for the first half of fiscal 2011. In response to the costs increases, we have evaluated and modestly adjusted our pricing in certain categories and are assessing ongoing promotional strategies in efforts to help maintain or improve upon historical merchandise margin levels. We will continue to diligently monitor our costs as well as the competitive pricing environment in order to mitigate potential margin erosion. However, we cannot be certain that our business will not be affected by inflation in the future.
Commitments and Contingencies
Our principal contractual obligations and commercial commitments at January 29, 2011, are summarized in the following charts. We have no other off-balance sheet commitments.
| Contractual Obligations (in thousands) |
Payments Due By Period | |||||||||||||||||||
| Total | Less Than 1 Year |
1–3 Years |
3–5 Years |
Over 5 Years |
||||||||||||||||
| Lease commitments: |
||||||||||||||||||||
| Operating leases |
$ | 401,900 | $ | 64,700 | $ | 108,800 | $ | 91,300 | $ | 137,100 | ||||||||||
| Fixed common area maintenance |
106,800 | 14,400 | 27,100 | 25,800 | 39,500 | |||||||||||||||
| Supplemental Employee Retirement Plan |
1,983 | 220 | 440 | 440 | 883 | |||||||||||||||
| Merchandise on order with suppliers |
89,201 | 89,201 | — | — | — | |||||||||||||||
| Total |
$ | 599,884 | $ | 168,521 | $ | 136,340 | $ | 117,540 | $ | 177,483 | ||||||||||
Lease commitments include operating leases for our retail stores, principal executive offices, warehouse facilities, vehicles, computers and office equipment under operating lease agreements expiring at various times through 2022. Certain leases for our retail stores include fixed common area maintenance obligations.
We have a defined benefit Supplemental Employee Retirement Plan (the “SERP”) for one former director. The SERP provides for retirement death benefits through life insurance. We funded a portion of the SERP obligation in prior years through contributions to a trust arrangement known as a “Rabbi” trust.
48
Table of Contents
We place merchandise orders approximately 30 to 60 days in advance for domestic merchandise and 70 to 120 days in advance for imported merchandise. We do not maintain any long-term or exclusive commitments or arrangements to purchase merchandise from any single supplier. We have markdown risk to the extent we do not ultimately achieve adequate sell-through on such merchandise.
Our other commercial commitments consist of letters of credit primarily for the procurement of domestic and imported merchandise and to secure obligations to certain insurance providers, and are secured through our senior revolving credit facility. At January 29, 2011, our contractual commercial commitments under these letter of credit arrangements were as follows:
| Other Commercial Commitments (in thousands) |
Total Amounts Committed |
Amount of Commitment Expiration Per Period | ||||||||||||||||||
| Less Than 1 Year |
1–3 Years |
3–5 Years |
Over 5 Years |
|||||||||||||||||
| Letters of credit |
$ | 6,701 | $ | 6,701 | — | — | — | |||||||||||||
Other Off-Balance Sheet Arrangements
We are not a party to any off-balance sheet arrangements, except for operating lease and purchase obligations as discussed above.
Recently Adopted Accounting Pronouncements and New Accounting Pronouncements Not Yet Adopted
In October 2009, the Financial Accounting Standards Board (the “FASB”) issued guidance related to revenue arrangements with multiple deliverables. Under the new guidance, when vendor specific objective evidence or third party evidence for deliverables in an arrangement cannot be determined, a best estimate of the selling price is required to separate deliverables and allocate arrangement consideration using the relative selling price method. Such guidance is to be applied on a prospective basis for revenue arrangements entered into or materially modified in fiscal years beginning on or after June 15, 2010, with early adoption permitted. The adoption of this guidance did not have any effect on our consolidated financial statements.
In January 2010, the FASB issued guidance and clarifications for improving disclosures about fair value measurements. This guidance requires enhanced disclosures regarding transfers in and out of the levels within the fair value hierarchy. Separate disclosures are required for transfers in and out of Level 1 and 2 fair value measurements, and the reasons for the transfers must be disclosed. In the reconciliation for Level 3 fair value measurements, separate disclosures are required for purchases, sales, issuances, and settlements on a gross basis. The new disclosures and clarifications of existing disclosures are effective for interim and annual reporting periods beginning after December 15, 2009, except for the disclosures about purchases, sales, issuances, and settlements in the roll forward of activity in Level 3 fair value measurements, which are effective for interim and annual reporting periods beginning after December 15, 2010. Effective January 31, 2010, we adopted the new and updated guidance for disclosures, aside from that deferred to periods after December 15, 2010, and this did not significantly impact our consolidated financial statements. We do not believe adoption of the remaining disclosure guidance will have any effect on our consolidated financial statements.
Additional information regarding new accounting pronouncements is contained in Note 1 to our consolidated financial statements included elsewhere in this Annual Report.
49
Table of Contents
| Item 7A. | Quantitative and Qualitative Disclosures About Market Risk |
Interest Rate Risk
To the extent that we borrow under the Facility, we are exposed to market risk related to changes in interest rates. At January 29, 2011, no borrowings were outstanding under the Facility. At January 29, 2011, the weighted average interest rate on borrowings under the Facility was 1.333%. Based upon a sensitivity analysis as of January 29, 2011, if we had average outstanding borrowings of $7.4 million during fiscal 2010, a 50 basis point increase in interest rates would have resulted in a potential increase in interest expense of approximately $37,000.
As of January 29, 2011, we are not a party to any derivative financial instruments.
Foreign Currency Exchange Rate Risk
We contract for and settle all purchases in U.S. dollars. We only purchase a modest amount of goods directly from international vendors. Thus, we consider the effect of currency rate changes to be indirect and we believe the effect of a major shift in currency exchange rates on short-term results would be minimal, as a hypothetical 10% change in the foreign exchange rate of the Chinese currency against the U.S. dollar as of January 29, 2011 would not materially affect our results of operations or cash flows. Over a longer period, the cumulative year-to-year impact of such changes, especially the exchange rate between the currency in China and the U.S. dollar, could be significant, albeit indirectly, through increased charges in U.S. dollars from our vendors that source their products internationally.
| Item 8. | Financial Statements and Supplementary Data |
Information with respect to this item is set forth under Item 15.
| Item 9. | Changes in and Disagreements With Accountants on Accounting and Financial Disclosure |
None.
| Item 9A. | Controls and Procedures |
Disclosure Controls and Procedures
We conducted an evaluation, under the supervision and with the participation of our chief executive officer and chief financial officer, of our disclosure controls and procedures, as such term is defined in Rule 13a-15(e) and 15d-15(e) promulgated under the Exchange Act. These disclosure controls and procedures are designed to provide reasonable assurance that the information required to be disclosed by the company in the reports that it files or submits under the Exchange Act is recorded, processed, summarized and reported within the time periods specified by the SEC’s rules and forms. Our disclosure controls and procedures are also designed to provide reasonable assurance that information required to be disclosed in the reports that we file or submit under the Exchange Act is accumulated and communicated to our management, including our chief executive officer and chief financial officer, in order to allow timely decisions regarding required disclosures. Based on this evaluation, our chief executive officer and our chief financial officer concluded that our disclosure controls and procedures were effective at a reasonable assurance level as of January 29, 2011.
Changes in Internal Control Over Financial Reporting
During the fiscal quarter ended January 29, 2011, no changes occurred with respect to our internal control over financial reporting that materially affected, or are reasonably likely to materially affect, internal control over financial reporting.
50
Table of Contents
Management’s Report on Internal Control Over Financial Reporting
Our management is responsible for establishing and maintaining adequate internal control over financial reporting, as such term is defined in Exchange Act Rules 13a-15(f) and 15d-15(f). Under the supervision and with the participation of our management, including our chief executive officer and chief financial officer, our management conducted an evaluation of the effectiveness of our internal control over financial reporting as of January 29, 2011, based on the framework in Internal Control—Integrated Framework issued by the Committee of Sponsoring Organizations of the Treadway Commission. Based on our management’s evaluation under the framework in Internal Control—Integrated Framework, our management concluded that our internal control over financial reporting was effective as of January 29, 2011.
Our internal control over financial reporting as of January 29, 2011, has been audited by Deloitte & Touche LLP, an independent registered public accounting firm, as stated in their report which is set forth below.
51
Table of Contents
REPORT OF INDEPENDENT REGISTERED PUBLIC ACCOUNTING FIRM
To the Board of Directors and Stockholders of
The Wet Seal, Inc.:
We have audited the internal control over financial reporting of The Wet Seal, Inc. and subsidiaries (the “Company”) as of January 29, 2011, based on criteria established in Internal Control—Integrated Framework issued by the Committee of Sponsoring Organizations of the Treadway Commission. The Company’s management is responsible for maintaining effective internal control over financial reporting and for its assessment of the effectiveness of internal control over financial reporting, included in the accompanying Management’s Report on Internal Control Over Financial Reporting. Our responsibility is to express an opinion on the Company’s internal control over financial reporting based on our audit.
We conducted our audit in accordance with the standards of the Public Company Accounting Oversight Board (United States). Those standards require that we plan and perform the audit to obtain reasonable assurance about whether effective internal control over financial reporting was maintained in all material respects. Our audit included obtaining an understanding of internal control over financial reporting, assessing the risk that a material weakness exists, testing and evaluating the design and operating effectiveness of internal control based on the assessed risk, and performing such other procedures as we considered necessary in the circumstances. We believe that our audit provides a reasonable basis for our opinion.
A company’s internal control over financial reporting is a process designed by, or under the supervision of, the company’s principal executive and principal financial officers, or persons performing similar functions, and effected by the company’s board of directors, management, and other personnel to provide reasonable assurance regarding the reliability of financial reporting and the preparation of financial statements for external purposes in accordance with generally accepted accounting principles. A company’s internal control over financial reporting includes those policies and procedures that (1) pertain to the maintenance of records that, in reasonable detail, accurately and fairly reflect the transactions and dispositions of the assets of the company; (2) provide reasonable assurance that transactions are recorded as necessary to permit preparation of financial statements in accordance with generally accepted accounting principles, and that receipts and expenditures of the company are being made only in accordance with authorizations of management and directors of the company; and (3) provide reasonable assurance regarding prevention or timely detection of unauthorized acquisition, use, or disposition of the company’s assets that could have a material effect on the financial statements.
Because of the inherent limitations of internal control over financial reporting, including the possibility of collusion or improper management override of controls, material misstatements due to error or fraud may not be prevented or detected on a timely basis. Also, projections of any evaluation of the effectiveness of the internal control over financial reporting to future periods are subject to the risk that the controls may become inadequate because of changes in conditions, or that the degree of compliance with the policies or procedures may deteriorate.
In our opinion, the Company maintained, in all material respects, effective internal control over financial reporting as of January 29, 2011, based on the criteria established in Internal Control—Integrated Framework issued by the Committee of Sponsoring Organizations of the Treadway Commission.
We have also audited, in accordance with the standards of the Public Company Accounting Oversight Board (United States), the consolidated financial statements as of and for the year ended January 29, 2011, of the Company and our report dated March 30, 2011, expressed an unqualified opinion on those financial statements.
/s/ DELOITTE & TOUCHE LLP
Costa Mesa, CA
March 30, 2011
| Item 9B. | Other Information |
None.
52
Table of Contents
PART III
| Item 10. | Directors, Executive Officers, and Corporate Governance of the Registrant |
Information with respect to this item is incorporated by reference to our definitive Proxy Statement to be filed with the SEC within 120 days of January 29, 2011.
| Item 11. | Executive Compensation |
Information with respect to this item is incorporated by reference to our definitive Proxy Statement to be filed with the SEC within 120 days of January 29, 2011.
| Item 12. | Security Ownership of Certain Beneficial Owners and Management and Related Stockholder Matters |
Information with respect to this item is incorporated by reference to our definitive Proxy Statement to be filed with the SEC within 120 days of January 29, 2011.
| Item 13. | Certain Relationships and Related Transactions, and Director Independence |
Information with respect to this item is incorporated by reference to our definitive Proxy Statement to be filed with the SEC within 120 days of January 29, 2011.
| Item 14. | Principal Accountant Fees and Services |
Information with respect to this item is incorporated by reference to our definitive Proxy Statement to be filed with the SEC within 120 days of January 29, 2011.
53
Table of Contents
PART IV
| Item 15. | Exhibits and Financial Statement Schedules |
| (a) | The following documents are filed as part of this report: |
| 1. | Financial Statements: The financial statements listed in the “Index to Consolidated Financial Statements and Financial Statement Schedules” at F-1 are filed as part of this report. |
| 2. | Financial Statement Schedules: All schedules are omitted as they are not required, or the required information is shown in the consolidated financial statements or notes thereto. |
| 3. | Exhibits: See “Exhibit Index.” |
| (b) | See (a) 3 above. |
| (c) | See (a) 1 and 2 above. |
54
Table of Contents
EXHIBIT INDEX
| Exhibit No. |
Description | |
| 3.1 | Restated Certificate of Incorporation of our company (incorporated by reference to Exhibit 3.1 of our company’s Registration Statement on Form S-1 filed September 2, 1992) | |
| 3.1.1 | Amendment to Restated Certificate of Incorporation of our company (incorporated by reference to Exhibit 3.1.1 of our company’s Annual Report on Form 10-K for the fiscal year ended February 2, 2002) | |
| 3.1.2 | Amendment to Restated Certificate of Incorporation, as amended, of our company (incorporated by reference to Exhibit 3.1 of our company’s Current Report on Form 8-K filed on January 18, 2005) | |
| 3.1.3 | Amendment to Restated Certificate of Incorporation, as amended, of our company (incorporated by reference to Exhibit 3.1.3 of our company’s Annual Report on Form 10-K for the fiscal year ended January 28, 2006) | |
| 3.2 | Amended and Restated Bylaws of our company (incorporated by reference to Exhibit 3.1 of our company’s Current Report on Form 8-K filed on May 29, 2009) | |
| 4.1 | Specimen Certificate of the Class A Stock, par value $.10 per share (incorporated by reference to Exhibit 4.1 of our company’s Registration Statement on Form S-1 filed September 2, 1992) | |
| 4.2 | Specimen Certificate of the Class B Stock, par value $.10 per share (incorporated by reference to Exhibit 4.2 of our company’s Registration Statement on Form S-1 filed September 2, 1992) | |
| 4.3 | Certificate of Designations, Preferences and Rights of Series C Convertible Preferred Stock of the Company (incorporated by reference to Exhibit 10.3 of our company’s Current Report on Form 8-K filed on May 3, 2005) | |
| 4.4 | Satisfaction and Discharge of Indenture entered into between our company and The Bank of New York Mellon, dated as of May 3, 2010 (incorporated by reference to Exhibit 99.1 of our company’s Current Report on Form 8-K filed on May 7, 2010) | |
| 10.1 | Lease between our company and Foothill-Parkstone I, LLC, dated November 21, 1996 (incorporated by reference to Exhibit 10.1 of our company’s Annual Report on Form 10-K for the fiscal year ended January 31, 1998) | |
| 10.1.1 | Lease Addendum between our company and FFP, LLC, dated October 28, 2006 (incorporated by reference to Exhibit 10.1.1 of our company’s Quarterly Report on Form 10-Q for the fiscal quarter ended October 28, 2006) | |
| 10.2 | 1996 Long-Term Incentive Plan (incorporated by reference to Exhibit 10.10 of our company’s Annual Report on Form 10-K for the fiscal year ended February 1, 1997) | |
| 10.2.1 | Second Amendment to the 1996 Long-Term Incentive Plan (incorporated by reference to Exhibit 10.10.1 of our company’s Annual Report on Form 10-K the fiscal year ended February 2, 2002) | |
| 10.3 | Supplemental Executive Retirement Plan (incorporated by reference to Exhibit 10.11 of our company’s Annual Report on Form 10-K for the fiscal year ended January 31, 1998) | |
| 10.4 | 2000 Stock Incentive Plan (incorporated by reference to Exhibit 10.12 of our company’s Annual Report on Form 10-K for the fiscal year ended February 3, 2001) | |
| 10.5 | Amended and Restated 2005 Stock Incentive Plan (incorporated by reference in Exhibit B of our company’s Definitive Proxy Statement of Form DEF 14A, dated April 19, 2010) | |
55
Table of Contents
| Exhibit No. |
Description | |
| 10.7 | Form of Indemnification Agreement between our company and members of our Board of Directors (incorporated by reference to Exhibit 10.33 of our company’s Annual Report on Form 10-K for the fiscal year ended February 29, 2005) | |
| 10.8 | Employment Agreement between our company and Sharon Hughes, dated as of November 19, 2009 (incorporated by reference to Exhibit 10.1 of our company’s Current Report on Form 8-K filed on November 20, 2009) | |
| 10.9 | Employment Agreement between our company and Steven H. Benrubi, dated as of August 3, 2010 (incorporated by reference to Exhibit 10.1 of our company’s Current Report on Form 8-K filed on August 4, 2010) | |
| 10.10 | Employment Agreement between our company and Jon C. Kubo, dated as of August 26, 2010 (incorporated by reference to Exhibit 10.2 of our company’s Current Report on Form 8-K filed on August 30, 2010) | |
| 10.11 | Employment Agreement between our company and Susan P. McGalla, dated as of January 11, 2011 (incorporated by reference to Exhibit 10.1 of our company’s Current Report on Form 8-K filed on January 13, 2011) | |
| 10.12 | Transition Agreement and Release between the Company and Edmond S. Thomas, dated as of August 30, 2010 (incorporated by reference to Exhibit 10.1 of our company’s Current Report on Form 8-K filed on August 30, 2010) | |
| 10.13 | Form of Restricted Stock Agreement between our company and members of our Board of Directors (incorporated by reference to Exhibit 10.34 of our company’s Annual Report on Form 10-K for the fiscal year ended January 29, 2005) | |
| 10.14 | Form of Stock Option Agreement between our company and employees of our company (incorporated by reference to Exhibit 10.27 of our company’s Annual Report on Form 10-K for the fiscal year ended February 3, 2007) | |
| 10.15 | Stock Option Agreement between our company and Susan P. McGalla, dated as of January 18, 2011 (incorporated by reference to Exhibit 10.2 of our company’s Current Report on Form 8-K filed on January 13, 2011) | |
| 10.16 | Performance Share and Restricted Share Award Agreement between our company and Susan P. McGalla, dated as of January 18, 2011 (incorporated by reference to Exhibit 10.3 of our company’s Current Report on Form 8-K filed on January 13, 2011) | |
| 10.17 | Amended and Restated Credit Agreement entered into by and among our Company and Bank of America, N.A., dated as of August 14, 2006 (incorporated by reference to Exhibit 10.1 of our company’s Current Report on Form 8-K filed on August 18, 2006) | |
| 10.18 | Security Agreement entered into among our company, Bank of America (f/k/a Fleet National Bank) and certain other parties thereto, dated as of May 26, 2004 (incorporated by reference to Exhibit 10.2 of our company’s Current Report on Form 8-K filed on January 5, 2005) | |
| 10.19 | Amended and Restated Credit Agreement entered into by and between our Company and Bank of America, N.A., dated as of February 3, 2011 (incorporated by reference to Exhibit 10.1 of our company’s Current Report on Form 8-K filed on February 9, 2011) | |
| 10.20 | Amended and Restated Security Agreement entered into among our Company, Bank of America, N.A. and certain other parties thereto, dated as of February 3, 2011 (incorporated by reference to Exhibit 10.2 of our company’s Current Report on Form 8-K filed on February 9, 2011) | |
| 10.21 | Employment Agreement between our company and Ken Seipel, dated as of March 21, 2011 (incorporated by reference to Exhibit 10.1 of our company’s Current Report on Form 8-K filed on March 24, 2011) | |
56
Table of Contents
| Exhibit No. |
Description | |
| 14.1 | The Wet Seal, Inc. Code of Business Ethics and Conduct (incorporated by reference to Exhibit 14.1 of our company’s Current Report on Form 8-K filed on March 29, 2011) | |
| 21.1 | Subsidiaries of the registrant (incorporated by reference to Exhibit 21.1 of our company’s Annual Report on Form 10-K for the fiscal year ended January 30, 2010) | |
| 23.1 | Consent of Independent Registered Public Accounting Firm | |
| 31.1 | Certification of the Chief Executive Officer filed herewith pursuant to Section 302 of the Sarbanes-Oxley Act of 2002 | |
| 31.2 | Certification of the Chief Financial Officer filed herewith pursuant to Section 302 of the Sarbanes-Oxley Act of 2002 | |
| 32.1 | Certification of the Chief Executive Officer furnished herewith pursuant to Section 906 of the Sarbanes-Oxley Act of 2002 | |
| 32.2 | Certification of the Chief Financial Officer furnished herewith pursuant to Section 906 of the Sarbanes-Oxley Act of 2002 | |
57
Table of Contents
Pursuant to the requirements of Section 13 or 15(d) of the Securities Exchange Act of 1934, the registrant has duly caused this report to be signed on its behalf by the undersigned, thereunto duly authorized.
| THE WET SEAL, INC. (Registrant) | ||
| By: |
/s/ SUSAN P. MCGALLA | |
| Susan P. McGalla Chief Executive Officer | ||
| By: |
/s/ STEVEN H. BENRUBI | |
| Steven H. Benrubi Executive Vice President and Chief Financial Officer | ||
| Date Signed: March 30, 2011 | ||
Pursuant to the requirements of the Securities Exchange Act of 1934, this report has been signed below by the following persons on behalf of the registrant and in the capacities indicated and on the dates indicated.
| Signatures |
Title |
Date Signed | ||
| /s/ SUSAN P. MCGALLA Susan P. McGalla |
Chief Executive Officer (Principal Executive Officer) and Director | March 30, 2011 | ||
| /s/ STEVEN H. BENRUBI Steven H. Benrubi |
Executive Vice President and Chief Financial Officer (Principal Financial and Accounting Officer) | March 30, 2011 | ||
| /s/ HAROLD D. KAHN Harold D. Kahn |
Chairman of the Board of Directors | March 30, 2011 | ||
| /s/ JONATHAN DUSKIN Jonathan Duskin |
Director | March 30, 2011 | ||
| /s/ SIDNEY M. HORN Sidney M. Horn |
Director | March 30, 2011 | ||
| /s/ KENNETH M. REISS Kenneth M. Reiss |
Director | March 30, 2011 | ||
| /s/ HENRY D. WINTERSTERN Henry D. Winterstern |
Director | March 30, 2011 | ||
58
Table of Contents
THE WET SEAL, INC.
INDEX TO CONSOLIDATED FINANCIAL STATEMENTS
AND FINANCIAL STATEMENT SCHEDULES
| Page | ||||
| F-2 | ||||
| FINANCIAL STATEMENTS: |
||||
| Consolidated balance sheets as of January 29, 2011, and January 30, 2010 |
F-3 | |||
| F-4 | ||||
| F-5 | ||||
| F-6 | ||||
| F-8 | ||||
| FINANCIAL STATEMENT SCHEDULES: |
||||
| All schedules are omitted as they are not required, or the required information is shown in the consolidated financial statements or the notes thereto. |
||||
F-1
Table of Contents
REPORT OF INDEPENDENT REGISTERED PUBLIC ACCOUNTING FIRM
To the Board of Directors and Stockholders of
The Wet Seal, Inc.
We have audited the accompanying consolidated balance sheets of The Wet Seal, Inc. and subsidiaries (the “Company”) as of January 29, 2011 and January 30, 2010, and the related consolidated statements of operations, stockholders’ equity and comprehensive income, and cash flows for each of the three years in the period ended January 29, 2011. These financial statements are the responsibility of the Company’s management. Our responsibility is to express an opinion on these consolidated financial statements based on our audits.
We conducted our audits in accordance with the standards of the Public Company Accounting Oversight Board (United States). Those standards require that we plan and perform the audit to obtain reasonable assurance about whether the financial statements are free of material misstatement. An audit includes examining, on a test basis, evidence supporting the amounts and disclosures in the financial statements. An audit also includes assessing the accounting principles used and significant estimates made by management, as well as evaluating the overall financial statement presentation. We believe that our audits provide a reasonable basis for our opinion.
In our opinion, such consolidated financial statements present fairly, in all material respects, the financial position of The Wet Seal, Inc. and subsidiaries as of January 29, 2011 and January 30, 2010, and the results of their operations and their cash flows for each of the three years in the period ended January 29, 2011, in conformity with accounting principles generally accepted in the United States of America.
We have also audited, in accordance with the standards of the Public Company Accounting Oversight Board (United States), the Company’s internal control over financial reporting as of January 29, 2011, based on the criteria established in Internal Control—Integrated Framework issued by the Committee of Sponsoring Organizations of the Treadway Commission and our report dated March 30, 2011, expressed an unqualified opinion on the Company’s internal control over financial reporting.
/s/ DELOITTE & TOUCHE LLP
Costa Mesa, CA
March 30, 2011
F-2
Table of Contents
CONSOLIDATED BALANCE SHEETS
| January 29, 2011 |
January 30, 2010 |
|||||||
| (In thousands, except share data) |
||||||||
| ASSETS | ||||||||
| CURRENT ASSETS: |
||||||||
| Cash and cash equivalents |
$ | 125,362 | $ | 161,693 | ||||
| Short-term investments |
50,690 | — | ||||||
| Other receivables |
1,941 | 479 | ||||||
| Merchandise inventories |
33,336 | 29,159 | ||||||
| Prepaid expenses and other current assets |
12,651 | 10,939 | ||||||
| Deferred tax assets (Note 1) |
19,649 | 19,600 | ||||||
| Total current assets |
243,629 | 221,870 | ||||||
| EQUIPMENT AND LEASEHOLD IMPROVEMENTS: |
||||||||
| Leasehold improvements |
115,712 | 108,958 | ||||||
| Furniture, fixtures, and equipment |
75,395 | 66,708 | ||||||
| 191,107 | 175,666 | |||||||
| Less accumulated depreciation and amortization |
(102,387 | ) | (97,603 | ) | ||||
| Net equipment and leasehold improvements |
88,720 | 78,063 | ||||||
| OTHER ASSETS: |
||||||||
| Deferred tax assets (Note 1) |
33,255 | 45,153 | ||||||
| Other assets |
2,928 | 2,584 | ||||||
| Total other assets |
36,183 | 47,737 | ||||||
| TOTAL ASSETS |
$ | 368,532 | $ | 347,670 | ||||
| LIABILITIES AND STOCKHOLDERS’ EQUITY | ||||||||
| CURRENT LIABILITIES: |
||||||||
| Accounts payable—merchandise |
$ | 20,455 | $ | 14,588 | ||||
| Accounts payable—other |
11,571 | 9,480 | ||||||
| Income taxes payable |
60 | 47 | ||||||
| Accrued liabilities |
24,752 | 24,918 | ||||||
| Current portion of deferred rent |
3,338 | 2,735 | ||||||
| Total current liabilities |
60,176 | 51,768 | ||||||
| LONG-TERM LIABILITIES: |
||||||||
| Secured convertible notes, including accrued interest of $0 and $956 at January 29, 2011 and January 30, 2010, respectively, and net of unamortized discount of $0 and $2,083 at January 29, 2011 and January 30, 2010, respectively |
— | 3,540 | ||||||
| Deferred rent |
30,900 | 28,827 | ||||||
| Other long-term liabilities |
1,763 | 1,785 | ||||||
| Total long-term liabilities |
32,663 | 34,152 | ||||||
| Total liabilities |
92,839 | 85,920 | ||||||
| COMMITMENTS AND CONTINGENCIES (Note 6) |
||||||||
| CONVERTIBLE PREFERRED STOCK, $0.01 par value, authorized 2,000,000 shares; no shares issued and outstanding at January 29, 2011, and 1,611 shares issued and outstanding at January 30, 2010 |
— | 1,611 | ||||||
| STOCKHOLDERS’ EQUITY: |
||||||||
| Common stock, Class A, $0.10 par value, authorized 300,000,000 shares; 113,736,844 shares issued and 101,603,911 shares outstanding at January 29, 2011, and 106,889,150 shares issued and 98,046,279 outstanding at January 30, 2010 |
11,374 | 10,689 | ||||||
| Common stock, Class B convertible, $0.10 par value, authorized 10,000,000 shares; no shares issued and outstanding at January 29, 2011, and January 30, 2010, respectively |
— | — | ||||||
| Paid-in capital (Note 1) |
323,324 | 312,689 | ||||||
| Accumulated deficit (Note 1) |
(21,332 | ) | (33,902 | ) | ||||
| Treasury stock, 12,132,933 shares and 8,842,871 shares, at cost, at January 29, 2011, and January 30, 2010, respectively (Note 7) |
(37,963 | ) | (29,758 | ) | ||||
| Accumulated other comprehensive income |
290 | 421 | ||||||
| Total stockholders’ equity |
275,693 | 260,139 | ||||||
| TOTAL LIABILITIES AND STOCKHOLDERS’ EQUITY |
$ | 368,532 | $ | 347,670 | ||||
See notes to consolidated financial statements.
F-3
Table of Contents
CONSOLIDATED STATEMENTS OF OPERATIONS
| Fiscal Years Ended | ||||||||||||
| January 29, 2011 |
January 30, 2010 |
January 31, 2009 |
||||||||||
| (In thousands, except share data) | ||||||||||||
| Net sales |
$ | 581,194 | $ | 560,918 | $ | 592,960 | ||||||
| Cost of sales |
401,287 | 394,092 | 400,521 | |||||||||
| Gross margin |
179,907 | 166,826 | 192,439 | |||||||||
| Selling, general, and administrative expenses |
150,432 | 141,633 | 154,671 | |||||||||
| Asset impairment |
4,228 | 2,341 | 5,611 | |||||||||
| Operating income |
25,247 | 22,852 | 32,157 | |||||||||
| Interest income |
337 | 487 | 2,182 | |||||||||
| Interest expense (Note 1) |
(3,045 | ) | (973 | ) | (3,329 | ) | ||||||
| Interest expense, net |
(2,708 | ) | (486 | ) | (1,147 | ) | ||||||
| Income before provision (benefit) for income taxes |
22,539 | 22,366 | 31,010 | |||||||||
| Provision (benefit) for income taxes (Note 1) |
9,969 | (64,504 | ) | 1,322 | ||||||||
| Net income |
$ | 12,570 | $ | 86,870 | $ | 29,688 | ||||||
| Net income per share, basic |
$ | 0.12 | $ | 0.86 | $ | 0.30 | ||||||
| Net income per share, diluted |
$ | 0.12 | $ | 0.85 | $ | 0.30 | ||||||
| Weighted-average shares outstanding, basic |
99,255,952 | 95,685,557 | 93,172,635 | |||||||||
| Weighted-average shares outstanding, diluted |
99,412,817 | 96,250,188 | 94,099,234 | |||||||||
See notes to consolidated financial statements.
F-4
Table of Contents
CONSOLIDATED STATEMENTS OF STOCKHOLDERS’ EQUITY AND COMPREHENSIVE INCOME
(In thousands, except share data)
| Common Stock | Paid-In Capital |
Accumulated Deficit |
Treasury Stock |
Comprehensive Income (Loss) |
Accumulated Other Comprehensive Income |
Total Stockholders’ Equity |
||||||||||||||||||||||||||||||||||
| Class A | Class B | |||||||||||||||||||||||||||||||||||||||
| Shares | Par Value | Shares | Par Value | |||||||||||||||||||||||||||||||||||||
| Balance at February 2, 2008 |
98,377,559 | 9,838 | — | — | 290,326 | (150,460 | ) | (22,461 | ) | 596 | 127,839 | |||||||||||||||||||||||||||||
| Net income |
— | — | — | — | — | 29,688 | — | $ | 29,688 | — | 29,688 | |||||||||||||||||||||||||||||
| Stock issued pursuant to long-term incentive plans |
682,525 | 68 | — | — | (68 | ) | — | — | — | — | — | |||||||||||||||||||||||||||||
| Stock-based compensation |
— | — | — | — | 2,977 | — | — | — | — | 2,977 | ||||||||||||||||||||||||||||||
| Amortization of stock payment in lieu of rent |
— | — | — | — | 179 | — | — | — | — | 179 | ||||||||||||||||||||||||||||||
| Exercise of stock options |
6,000 | 1 | — | — | 10 | — | — | — | — | 11 | ||||||||||||||||||||||||||||||
| Exercise of common stock warrants |
1,793,139 | 179 | — | — | 5,939 | — | — | — | — | 6,118 | ||||||||||||||||||||||||||||||
| Conversions of secured convertible notes into common stock (Note 5) |
2,274,804 | 227 | — | — | 3,651 | — | — | — | — | 3,878 | ||||||||||||||||||||||||||||||
| Conversions of convertible preferred stock into common stock (Note 5) |
185,333 | 19 | — | — | 537 | — | — | — | — | 556 | ||||||||||||||||||||||||||||||
| Amortization of actuarial gain under Supplemental Employee Retirement Plan |
— | — | — | — | — | — | — | (26 | ) | (26 | ) | (26 | ) | |||||||||||||||||||||||||||
| Actuarial net loss under Supplemental Employee Retirement Plan |
— | — | — | — | — | — | — | (12 | ) | (12 | ) | (12 | ) | |||||||||||||||||||||||||||
| Comprehensive income |
$ | 29,650 | ||||||||||||||||||||||||||||||||||||||
| Balance at January 31, 2009 |
103,319,360 | 10,332 | — | — | 303,551 | (120,772 | ) | (22,461 | ) | 558 | $ | 171,208 | ||||||||||||||||||||||||||||
| Net income |
— | — | — | — | — | 86,870 | — | $ | 86,870 | — | 86,870 | |||||||||||||||||||||||||||||
| Stock issued pursuant to long-term incentive plans |
654,936 | 66 | — | — | (66 | ) | — | — | — | — | — | |||||||||||||||||||||||||||||
| Stock-based compensation |
— | — | — | — | 1,624 | — | — | — | — | 1,624 | ||||||||||||||||||||||||||||||
| Amortization of stock payment in lieu of rent |
— | — | — | — | 97 | — | — | — | — | 97 | ||||||||||||||||||||||||||||||
| Exercise of stock options |
3,334 | — | — | — | 8 | — | — | — | — | 8 | ||||||||||||||||||||||||||||||
| Exercise of common stock warrants |
2,911,520 | 291 | — | — | 7,475 | — | — | — | — | 7,766 | ||||||||||||||||||||||||||||||
| Amortization of actuarial gain under Supplemental Employee Retirement Plan |
— | — | — | — | — | — | — | (25 | ) | (25 | ) | (25 | ) | |||||||||||||||||||||||||||
| Actuarial net loss under Supplemental Employee Retirement Plan |
— | — | — | — | — | — | — | (112 | ) | (112 | ) | (112 | ) | |||||||||||||||||||||||||||
| Comprehensive income |
$ | 86,733 | ||||||||||||||||||||||||||||||||||||||
| Repurchase of common stock |
— | — | — | — | — | — | (7,297 | ) | (7,297 | ) | ||||||||||||||||||||||||||||||
| Balance at January 30, 2010 |
106,889,150 | $ | 10,689 | — | $ | — | $ | 312,689 | $ | (33,902 | ) | $ | (29,758 | ) | $ | 421 | $ | 260,139 | ||||||||||||||||||||||
| Net income |
— | — | — | — | — | 12,570 | — | $ | 12,570 | — | 12,570 | |||||||||||||||||||||||||||||
| Stock issued pursuant to long-term incentive plans |
1,972,700 | 197 | — | — | (197 | ) | — | — | — | — | — | |||||||||||||||||||||||||||||
| Stock-based compensation |
— | — | — | — | 1,787 | — | — | — | — | 1,787 | ||||||||||||||||||||||||||||||
| Stock-based compensation tax shortfalls (Note 2) |
— | — | — | — | (2,317 | ) | — | — | — | — | (2,317 | ) | ||||||||||||||||||||||||||||
| Amortization of stock payment in lieu of rent |
— | — | — | — | 97 | — | — | — | — | 97 | ||||||||||||||||||||||||||||||
| Exercise of stock options |
66,168 | 7 | — | — | 206 | — | — | — | — | 213 | ||||||||||||||||||||||||||||||
| Exercise of common stock warrants |
1,160,715 | 116 | — | — | 4,155 | — | — | — | — | 4,271 | ||||||||||||||||||||||||||||||
| Conversions of secured convertible notes into common stock (Note 5) |
3,111,111 | 311 | — | — | 5,347 | — | — | — | — | 5,658 | ||||||||||||||||||||||||||||||
| Conversions of convertible preferred stock into common stock (Note 5) |
537,000 | 54 | — | — | 1,557 | — | — | — | — | 1,611 | ||||||||||||||||||||||||||||||
| Amortization of actuarial gain under Supplemental Employee Retirement Plan |
— | — | — | — | — | — | — | (16 | ) | (16 | ) | (16 | ) | |||||||||||||||||||||||||||
| Actuarial net loss under Supplemental Employee Retirement Plan |
— | — | — | — | — | — | — | (115 | ) | (115 | ) | (115 | ) | |||||||||||||||||||||||||||
| Comprehensive income |
$ | 12,439 | ||||||||||||||||||||||||||||||||||||||
| Repurchase of common stock |
— | — | — | — | — | — | (8,205 | ) | (8,205 | ) | ||||||||||||||||||||||||||||||
| Balance at January 29, 2011 |
113,736,844 | $ | 11,374 | — | $ | — | $ | 323,324 | $ | (21,332 | ) | $ | (37,963 | ) | $ | 290 | $ | 275,693 | ||||||||||||||||||||||
See notes to consolidated financial statements.
F-5
Table of Contents
CONSOLIDATED STATEMENTS OF CASH FLOWS
| Fiscal Years Ended | ||||||||||||
| January 29, 2011 |
January 30, 2010 |
January 31, 2009 |
||||||||||
| (in thousands) | ||||||||||||
| CASH FLOWS FROM OPERATING ACTIVITIES: |
||||||||||||
| Net income |
$ | 12,570 | $ | 86,870 | $ | 29,688 | ||||||
| Adjustments to reconcile net income to net cash provided by operating activities: |
||||||||||||
| Depreciation and amortization |
16,813 | 15,101 | 14,518 | |||||||||
| Amortization of premium on investments |
300 | — | — | |||||||||
| Amortization/acceleration of discount on secured convertible notes |
2,083 | 629 | 2,746 | |||||||||
| Amortization of deferred financing costs |
162 | 98 | 284 | |||||||||
| Amortization of stock payment in lieu of rent |
97 | 97 | 179 | |||||||||
| Adjustment of derivatives to fair value |
(20 | ) | (40 | ) | (40 | ) | ||||||
| Interest added to principal of secured convertible notes |
35 | 204 | 256 | |||||||||
| Conversion inducement fee (Note 5) |
700 | — | — | |||||||||
| Asset impairment |
4,228 | 2,341 | 5,611 | |||||||||
| Loss on disposal of equipment and leasehold improvements |
578 | 361 | 558 | |||||||||
| Deferred income taxes |
11,849 | (64,753 | ) | — | ||||||||
| Stock-based compensation (Note 2) |
1,787 | 1,624 | 2,977 | |||||||||
| Stock-based compensation tax shortfalls (Note 2) |
(2,317 | ) | — | — | ||||||||
| Changes in operating assets and liabilities: |
||||||||||||
| Income taxes receivable |
— | — | 167 | |||||||||
| Other receivables |
(1,189 | ) | 1,305 | 3,931 | ||||||||
| Merchandise inventories |
(4,177 | ) | (3,630 | ) | 6,061 | |||||||
| Prepaid expenses and other current assets |
(1,874 | ) | (339 | ) | 346 | |||||||
| Other non-current assets |
(344 | ) | (869 | ) | 62 | |||||||
| Accounts payable and accrued liabilities |
6,243 | 3,638 | (8,113 | ) | ||||||||
| Income taxes payable |
13 | (181 | ) | 228 | ||||||||
| Deferred rent |
2,676 | (1,867 | ) | (986 | ) | |||||||
| Other long-term liabilities |
(133 | ) | (133 | ) | (133 | ) | ||||||
| Net cash provided by operating activities |
50,080 | 40,456 | 58,340 | |||||||||
| CASH FLOWS FROM INVESTING ACTIVITIES: |
||||||||||||
| Purchase of equipment and leasehold improvements |
(30,727 | ) | (21,304 | ) | (23,023 | ) | ||||||
| Investments in marketable securities |
(51,263 | ) | — | — | ||||||||
| Net cash used in investing activities |
(81,990 | ) | (21,304 | ) | (23,023 | ) | ||||||
F-6
Table of Contents
THE WET SEAL, INC.
CONSOLIDATED STATEMENTS OF CASH FLOWS (Continued)
| Fiscal Years Ended | ||||||||||||
| January 29, 2011 |
January 30, 2010 |
January 31, 2009 |
||||||||||
| (in thousands) | ||||||||||||
| CASH FLOWS FROM FINANCING ACTIVITIES: |
||||||||||||
| Repurchase of common stock |
(8,205 | ) | (7,297 | ) | — | |||||||
| Conversion inducement fee (Note 5) |
(700 | ) | — | — | ||||||||
| Proceeds from exercise of stock options |
213 | 8 | 11 | |||||||||
| Proceeds from exercise of common stock warrants |
4,271 | 7,766 | 6,118 | |||||||||
| Net cash (used in) provided by financing activities |
(4,421 | ) | 477 | 6,129 | ||||||||
| NET (DECREASE) INCREASE IN CASH AND CASH EQUIVALENTS |
(36,331 | ) | 19,629 | 41,446 | ||||||||
| CASH AND CASH EQUIVALENTS, beginning of year |
161,693 | 142,064 | 100,618 | |||||||||
| CASH AND CASH EQUIVALENTS, end of year |
$ | 125,362 | $ | 161,693 | $ | 142,064 | ||||||
| SUPPLEMENTAL DISCLOSURES OF CASH FLOW INFORMATION: |
||||||||||||
| Cash paid during the year for: |
||||||||||||
| Interest |
$ | 70 | $ | 67 | $ | 69 | ||||||
| Income taxes |
$ | 744 | $ | 505 | $ | 1,094 | ||||||
| SUPPLEMENTAL DISCLOSURES OF NONCASH TRANSACTIONS: |
||||||||||||
| Conversions of convertible preferred stock into Class A common stock |
$ | 1,611 | $ | — | $ | 556 | ||||||
| Conversions of secured convertible notes into Class A common stock |
$ | 5,658 | $ | — | $ | 3,878 | ||||||
| Amortization of actuarial gain under Supplemental Employee Retirement Plan |
$ | 16 | $ | 25 | $ | 26 | ||||||
| Actuarial net loss under Supplemental Employee Retirement Plan |
$ | 115 | $ | 112 | $ | 12 | ||||||
| Purchases of equipment and leasehold improvements unpaid at end of year |
$ | 4,176 | $ | 2,627 | $ | 2,935 | ||||||
See notes to consolidated financial statements.
F-7
Table of Contents
NOTES TO CONSOLIDATED FINANCIAL STATEMENTS
For the fiscal years ended January 29, 2011, January 30, 2010, and January 31, 2009
NOTE 1: Summary of Significant Accounting Policies
Nature of the Business
The Wet Seal, Inc. and its subsidiaries (“the Company”) is a national specialty retailer operating stores selling fashionable and contemporary apparel and accessory items designed for female customers aged 13 to 35 years old. The Company operates two nationwide, primarily mall-based, chains of retail stores under the names “Wet Seal” and “Arden B.” The Company’s success is largely dependent upon its ability to gauge the fashion tastes of its customers and to provide merchandise that satisfies customer demand.
The Company’s fiscal year ends on the Saturday closest to the end of January. The reporting periods include 52 weeks of operations ended January 29, 2011 (fiscal 2010), January 30, 2010 (fiscal 2009) and January 31, 2009 (fiscal 2008).
Principles of Consolidation
The consolidated financial statements include the accounts of The Wet Seal, Inc. and its subsidiaries, which are all wholly owned subsidiaries. All intercompany balances and transactions have been eliminated in consolidation.
Basis of Presentation
The consolidated financial statements have been prepared in accordance with accounting principles generally accepted in the United States of America (GAAP).
Correction
The Company has corrected its fiscal 2009 consolidated balance sheet and fiscal 2009 and fiscal 2008 consolidated statements of operations, statements of cash flows and statements of stockholder’s equity and comprehensive income to appropriately reflect income tax and interest expense corrections.
During fiscal 2010, the Company determined it previously had interpreted federal tax rules incorrectly pertaining to expiration of charitable contribution carry forwards available to offset future taxable income. The Company also identified certain other minor errors in its deferred income taxes. As a result, the Company had overstated its net deferred tax assets, benefit for income taxes and net income by approximately $6.6 million as of and for the fiscal year ended January 30, 2010, or fiscal 2009. The overstatement had no net impact on the statement of cash flows or total cash flows from operating activities for fiscal 2009. The Company does not believe this amount is material to the fiscal 2009 financial statements. However, the Company has corrected deferred tax assets and stockholders’ equity on its accompanying consolidated balance sheets as of January 30, 2010, from amounts previously reported to correct this overstatement. Presentation of the Company’s statement of operations, statement of cash flows and statement of stockholders’ equity and comprehensive income for fiscal 2009 has been adjusted to reflect the $6.6 million correction to reduce the benefit for income taxes and net income and to decrease the deferred tax asset and the accumulated deficit balances.
Prior to the first quarter of fiscal 2010, the Company recognized the ratable portion of accrued interest forfeited by Note holders upon conversions as a reduction of interest expense. During fiscal 2010, the Company determined that the correct treatment of accrued interest forfeited is a credit to paid-in capital rather than a reduction of interest expense. As a result, the Company has reclassified $2.9 million from accumulated deficit to paid-in capital in the accompanying consolidated balance sheet and statement of stockholders’ equity and comprehensive income for fiscal 2009 to reflect the correct treatment of accrued interest forfeited in periods prior to fiscal 2010. In the consolidated statements of operations, the Company has corrected interest expense for the $0.5 million of expense forfeited in fiscal 2008.
F-8
Table of Contents
THE WET SEAL, INC.
NOTES TO CONSOLIDATED FINANCIAL STATEMENTS (Continued)
For the fiscal years ended January 29, 2011, January 30, 2010, and January 31, 2009
NOTE 1: Summary of Significant Accounting Policies (Continued)
A summary of the effects of these income tax and interest expense corrections are as follows:
| Consolidated Balance Sheet | ||||||||
| As of January 30, 2010 | ||||||||
| As previously reported |
As corrected |
|||||||
| Deferred tax assets- long term |
$ | 51,713 | $ | 45,153 | ||||
| Total other assets |
54,297 | 47,737 | ||||||
| Total assets |
354,230 | 347,670 | ||||||
| Paid-in capital |
309,745 | 312,689 | ||||||
| Accumulated deficit |
(24,398 | ) | (33,902 | ) | ||||
| Total stockholders’ equity |
266,699 | 260,139 | ||||||
| Total liabilities and stockholders’ equity |
354,230 | 347,670 | ||||||
| Consolidated Statement of Operations For the Fiscal Year Ended January 30, 2010 |
||||||||
| As previously reported |
As corrected |
|||||||
| Provision (benefit) for income taxes |
$ | (71,064 | ) | $ | (64,504 | ) | ||
| Net income |
93,430 | 86,870 | ||||||
| Net income per share, basic |
$ | 0.92 | $ | 0.86 | ||||
| Net income per share, diluted |
$ | 0.92 | $ | 0.85 | ||||
| Consolidated Statement of Stockholders’ Equity and Comprehensive Income |
||||||||
| For the Fiscal Year Ended January 30, 2010 |
||||||||
| As previously reported |
As corrected |
|||||||
| Paid-In Capital |
$ | 309,745 | $ | 312,689 | ||||
| Accumulated Deficit |
(24,398 | ) | (33,902 | ) | ||||
| Net income |
93,430 | 86,870 | ||||||
| Comprehensive income |
93,293 | 86,733 | ||||||
| Total Stockholders’ Equity |
266,699 | 260,139 | ||||||
| Consolidated Statement of Cash Flows For the Fiscal Year Ended January 30, 2010 |
||||||||
| As previously reported |
As corrected |
|||||||
| Net income |
$ | 93,430 | $ | 86,870 | ||||
| Deferred income taxes |
(71,313 | ) | (64,753 | ) | ||||
F-9
Table of Contents
THE WET SEAL, INC.
NOTES TO CONSOLIDATED FINANCIAL STATEMENTS (Continued)
For the fiscal years ended January 29, 2011, January 30, 2010, and January 31, 2009
NOTE 1: Summary of Significant Accounting Policies (Continued)
| Consolidated Statement of Operations For the Fiscal Year Ended January 31, 2009 |
||||||||
| As previously reported |
As corrected |
|||||||
| Interest expense |
$ | (2,863 | ) | $ | (3,329 | ) | ||
| Interest expense, net |
(681 | ) | (1,147 | ) | ||||
| Net income before provision for income taxes |
31,476 | 31,010 | ||||||
| Net income |
30,154 | 29,688 | ||||||
| Consolidated Statement of Cash Flows For the Fiscal Year Ended January 31, 2009 |
||||||||
| As previously reported |
As corrected |
|||||||
| Net income |
$ | 30,154 | $ | 29,688 | ||||
| Interest added to principal of secured convertible notes |
(210 | ) | 256 | |||||
| Consolidated Statement of Stockholders’ Equity and Comprehensive Income For the Fiscal Year Ended January 31, 2009 |
||||||||
| As previously reported |
As corrected |
|||||||
| Paid-In Capital |
$ | 300,607 | $ | 303,551 | ||||
| Accumulated Deficit |
(117,828 | ) | (120,772 | ) | ||||
| Net income |
30,154 | 29,688 | ||||||
| Comprehensive income |
30,116 | 29,650 | ||||||
| Conversion of secured convertible notes into common stock |
3,412 | 3,878 | ||||||
| Consolidated Statement of Stockholders’ Equity and Comprehensive Income For the Fiscal Year Ended February 2, 2008 |
||||||||
| As previously reported |
As corrected |
|||||||
| Paid-In Capital |
$ | 287,848 | $ | 290,326 | ||||
| Accumulated Deficit |
(147,982 | ) | (150,460 | ) | ||||
Estimates and Assumptions
The preparation of financial statements in conformity with GAAP requires management to make estimates and assumptions that affect the reported amounts of assets, liabilities, revenues, and expenses. Actual results could differ from those estimates.
The Company’s most significant areas of estimation and assumption are:
| • | determination of the appropriate amount and timing of markdowns to clear unproductive or slow- moving inventory; |
F-10
Table of Contents
THE WET SEAL, INC.
NOTES TO CONSOLIDATED FINANCIAL STATEMENTS (Continued)
For the fiscal years ended January 29, 2011, January 30, 2010, and January 31, 2009
NOTE 1: Summary of Significant Accounting Policies (Continued)
| • | estimation of future cash flows used to assess the recoverability of long-lived assets; |
| • | estimation of ultimate redemptions of awards under the Company’s Arden B division customer loyalty program; |
| • | determination of the revenue recognition pattern for cash received under the Company’s Wet Seal division frequent buyer program; |
| • | estimation of expected customer merchandise returns; |
| • | estimation of expected gift card, gift certificate, and store credit breakage; |
| • | determination of the appropriate assumptions to use to estimate the fair value of stock-based compensation for purposes of recording stock-based compensation; |
| • | estimation of the net deferred income tax asset valuation allowance; and |
| • | estimation, using actuarially determined methods, of self-insured claim losses under workers’ compensation and employee health care plans. |
Cash and Cash Equivalents
The Company considers all highly liquid debt instruments purchased with an initial maturity of three months or less to be cash equivalents. Cash equivalents are carried at cost, which approximates their fair market value. As of January 29, 2011, cash equivalents principally consist of investments in money market funds invested in U.S. Treasury securities and U.S. government agency securities. The Company is potentially exposed to concentration of credit risk when cash deposits in banks are in excess of federally insured limits. Cash accounts at banks are currently insured by the Federal Deposit Insurance Corporation up to $250,000. At January 29, 2011, and at various other times throughout fiscal 2010, the Company had cash balances in excess of federally insured limits. At January 29, 2011, amounts in excess of federally insured limits were $39.0 million.
Short-term Investments
The Company’s short-term investments consist of interest-bearing corporate bonds that are guaranteed by the U.S. Government under the Temporary Liquidity Guarantee Program (“TLGP”), have maturities that are less than one year and are carried at amortized cost plus accrued income. Short-term investments are carried at amortized cost due to the Company’s intent to hold to maturity. Short-term investments on the consolidated balance sheets were $50.7 million at January 29, 2011. Any unrealized gains or unrealized losses on held to maturity investments are considered temporary and are not recorded unless an other than temporary impairment has occurred. Factors considered that could result in the necessity to impair include intention to sell, more likely than not being required to sell the security before recovery of the security’s amortized cost basis and whether the Company expects to recover the entire amortized cost basis of the security. The Company has considered all impairment factors and has determined that an other than temporary impairment has not occurred as of January 29, 2011.
Merchandise Inventories
Merchandise inventories are stated at the lower of cost or market. Market is determined based on the estimated net realizable value, which generally is the merchandise selling price. Cost is calculated using the retail inventory method. Under the retail inventory method, inventory is stated at its current retail selling value and then is converted to a cost basis by applying a cost-to-retail ratio based on beginning inventory and the fiscal year
F-11
Table of Contents
THE WET SEAL, INC.
NOTES TO CONSOLIDATED FINANCIAL STATEMENTS (Continued)
For the fiscal years ended January 29, 2011, January 30, 2010, and January 31, 2009
NOTE 1: Summary of Significant Accounting Policies (Continued)
purchase activity. The retail inventory method inherently requires management judgments and estimates, such as the amount and timing of permanent markdowns to clear unproductive or slow-moving inventory, which may impact the ending inventory valuation as well as gross margins.
Markdowns are recorded when the sales value of the inventory has diminished. Factors considered in the determination of permanent markdowns include current and anticipated demand, customer preferences, age of the merchandise, and fashion trends. When a decision is made to permanently markdown merchandise, the resulting gross margin reduction is recognized in the period the markdown is recorded. Total markdowns, including permanent and promotional markdowns, on a cost basis, in fiscal 2010, 2009, and 2008 were $84.2 million, $78.6 million, and $77.4 million, respectively, and represented 14.5%, 14.0%, and 13.1% of net sales, respectively.
The Company accrued for planned but unexecuted markdowns, including markdowns related to slow moving merchandise, as of January 29, 2011, and January 30, 2010, of $2.7 million and $2.4 million, respectively. To the extent the Company’s estimates differ from actual results, additional markdowns may be required that could reduce the Company’s gross margin, operating income, and the carrying value of inventories.
Equipment and Leasehold Improvements
Equipment and leasehold improvements are stated at cost. Expenditures for betterment or improvement are capitalized, while expenditures for repairs and maintenance that do not significantly increase the life of the asset are expensed as incurred.
Depreciation and amortization is provided using the straight-line method over the estimated useful lives of the assets. Furniture, fixtures, and equipment are typically depreciated over three to five years. Leasehold improvements and the cost of acquiring leasehold rights are amortized over the lesser of the term of the lease or 10 years.
Long-Lived Assets
The Company evaluates the carrying value of long-lived assets for impairment whenever events or changes in circumstances indicate that the carrying value of such assets may not be recoverable. Factors that are considered important that could result in the necessity to perform an impairment review include a current-period operating or cash flow loss combined with a history of operating or cash flow losses and a projection or forecast that indicates continuing losses or insufficient income associated with the realization of a long-lived asset or asset group. Other factors include a significant change in the manner of the use of the asset or a significant negative industry or economic trend. This evaluation is performed based on estimated undiscounted future cash flows from operating activities compared with the carrying value of the related assets. If the undiscounted future cash flows are less than the carrying value, an impairment loss is recognized, measured by the difference between the carrying value and the estimated fair value of the assets, based on discounted cash flows using the Company’s weighted average cost of capital. The Company has considered all relevant valuation techniques that could be obtained without undue cost and effort and has determined that the discounted cash flow approach continues to provide the most relevant and reliable means by which to determine fair value in this circumstance.
At least quarterly, the Company assesses whether events or changes in circumstances have occurred that potentially indicate the carrying value of long-lived assets may not be recoverable. The Company’s evaluations during fiscal 2010, 2009, and 2008 indicated that operating losses or insufficient operating income existed at
F-12
Table of Contents
THE WET SEAL, INC.
NOTES TO CONSOLIDATED FINANCIAL STATEMENTS (Continued)
For the fiscal years ended January 29, 2011, January 30, 2010, and January 31, 2009
NOTE 1: Summary of Significant Accounting Policies (Continued)
certain retail stores, with a projection that the operating losses or insufficient operating income for those locations would continue. As such, the Company recorded non-cash charges of $4.2 million, $2.3 million, and $5.6 million during fiscal 2010, 2009, and 2008, respectively, within asset impairment in the consolidated statements of operations, to write down the carrying values of these stores’ long-lived assets to their estimated fair values.
Deferred Financing Costs
Costs incurred to obtain long-term financing are amortized over the terms of the respective debt agreements using the interest method. In addition, deferred financing costs associated with the Company’s secured convertible notes (the “Notes”) were expensed immediately upon the conversion of portions of such notes into Class A common stock. Amortization of deferred financing costs, which was included within interest expense in the consolidated statements of operations, was $0.2 million, $0.1 million, and $0.3 million in fiscal 2010, 2009, and 2008, respectively.
Discount on Secured Convertible Notes
As discussed further in Note 5, upon issuance of its Notes, the Company recorded the Notes net of a discount of $45.0 million. The Company amortized this discount over the seven-year term of the Notes using the interest method. In addition, the unamortized portion of the discount on the Notes was expensed immediately upon conversions of portions of the Notes into Class A common stock. Amortization of this discount, which was included within interest expense in the consolidated statements of operations, was $2.1 million, $0.6 million, and $2.7 million in fiscal 2010, 2009, and 2008, respectively. During fiscal 2010, investors converted the remaining Notes balance, and there are no longer any Notes outstanding as of January 29, 2011.
Revenue Recognition
Sales are recognized upon purchases by customers at the Company’s retail store locations. Taxes collected from the Company’s customers are recorded on a net basis. For online sales, revenue is recognized at the estimated time goods are received by customers. Customers typically receive goods within four days of being shipped. Shipping and handling fees billed to customers for online sales are included in net sales. For fiscal 2010, 2009 and 2008, shipping and handling fee revenues were $3.2 million, $2.9 million, and $2.4 million, respectively, within net sales on the consolidated statements of operations.
The Company has recorded accruals to estimate sales returns by customers based on historical sales return results. Historically, a customer generally could return merchandise within 30 days of the original purchase date. Beginning in the third quarter of fiscal 2008, the Company modified its sales return policy to allow customers to return merchandise only within 21 days of original purchase. The Company also modified its sales return policy such that Wet Seal retail store merchandise may be returned for store credit only and Arden B retail store merchandise may be returned for cash refund or store credit within seven days of the original purchase date, and for store credit only thereafter. For Wet Seal and Arden B online sales, merchandise may be returned within 21 days for a full refund. Actual return rates have historically been within management’s estimates and the accruals established. As the accrual for merchandise returns is based on estimates, the actual returns could differ from the accrual, which could impact net sales. The accrual for merchandise returns is recorded in accrued liabilities on the consolidated balance sheets and was $0.3 million and $0.3 million at January 29, 2011, and January 30, 2010, respectively.
F-13
Table of Contents
THE WET SEAL, INC.
NOTES TO CONSOLIDATED FINANCIAL STATEMENTS (Continued)
For the fiscal years ended January 29, 2011, January 30, 2010, and January 31, 2009
NOTE 1: Summary of Significant Accounting Policies (Continued)
The Company recognizes the sales from gift cards, gift certificates, and store credits as they are redeemed for merchandise. Prior to redemption, the Company maintains an unearned revenue liability for gift cards, gift certificates, and store credits until the Company is released from such liability. The Company’s gift cards, gift certificates, and store credits do not have expiration dates; however, over time, a percentage of gift cards, gift certificates, and store credits are not redeemed or recovered (“breakage”). Based upon historical redemption trend data, the Company determined that the likelihood of redemption of unredeemed gift cards, gift certificates, and store credits three years after their issuance is remote and adjusted its unearned revenue liability quarterly to record breakage as additional sales for gift cards, gift certificates, and store credits that remained unredeemed three years after their issuance. The Company’s net sales for fiscal 2008 included a benefit of $0.9 million to reduce its unearned revenue liability for estimated unredeemed amounts. Additionally, based upon an analysis completed by the Company during the second fiscal quarter of 2009, historical redemption patterns indicated that the likelihood of redemption of unredeemed gift cards, gift certificates, and store credits greater than two years after their issuance is remote. As a result, beginning in the second quarter of fiscal 2009, the Company adjusted its unearned revenue liability to recognize the change in estimated timing of when breakage of gift cards, gift certificates and store credits is recognized from greater than three years after their issuance dates to greater than two years after their issuance dates. The Company’s net sales in the second quarter of fiscal 2009 included a benefit of $1.2 million due to this change in estimate to reduce its unearned revenue liability for estimated unredeemed amounts. The Company’s net sales for fiscal 2010 and fiscal 2009 included a benefit of $1.4 million and $2.2 million, respectively, to reduce its unearned revenue liability for estimated unredeemed amounts. The unearned revenue for gift cards, gift certificates, and store credits is recorded in accrued liabilities in the consolidated balance sheets and was $5.1 million and $5.4 million at January 29, 2011 and January 30, 2010, respectively. If actual redemptions ultimately differ from the assumptions underlying the Company’s breakage adjustments, or the Company’s future experience indicates the likelihood of redemption of gift cards, gift certificates, and store credits becomes remote at a different point in time after issuance, the Company may recognize further significant adjustments to its accruals for such unearned revenue, which could have a significant effect on the Company’s net sales and results of operations.
The Company maintains a frequent buyer program, the fashion insider card, through its Wet Seal division. Under the program, customers receive a 10% to 20% discount on all purchases made during a 12-month period and are provided $5-off coupons that may be used on purchases during such period. The annual membership fee of $20 is nonrefundable. Discounts received by customers on purchases using the frequent buyer program are recognized at the time of such purchases.
The Company has historically recognized membership fee revenue under the frequent buyer program on a straight-line basis over the 12-month membership period. During November 2007, the Company changed from in-store delivery to e-mail delivery of the program’s $5-off coupons, which eliminated the customer’s ability to use such coupons at the time of initial purchases. The Company believes this change affects customer usage patterns. The Company also continues to test alternative program structures, and promotions tied to the program, and may decide to further modify the program in ways that could also affect customer usage patterns. As a result of the program change and potential further modifications, the Company believes it is appropriate to maintain straight-line recognition of membership fee revenue. The Company may, in the future, determine that recognition of membership fee revenue on a different basis is appropriate, which would affect net sales. The unearned revenue for this program is recorded in accrued liabilities in the consolidated balance sheets and was $3.8 million and $4.7 million at January 29, 2011, and January 30, 2010, respectively.
F-14
Table of Contents
THE WET SEAL, INC.
NOTES TO CONSOLIDATED FINANCIAL STATEMENTS (Continued)
For the fiscal years ended January 29, 2011, January 30, 2010, and January 31, 2009
NOTE 1: Summary of Significant Accounting Policies (Continued)
The Company maintains a customer loyalty program through its Arden B division. Under the program, customers accumulate points based on purchase activity. Once a loyalty program member achieves a certain point level, the member earns awards that may be redeemed for merchandise. Unredeemed awards and accumulated partial points are accrued as unearned revenue and awards redeemed by the member for merchandise are recorded as an increase to net sales.
The Company converts into fractional awards the points accumulated by customers who have not made purchases within the preceding 18 months. Similar to all other awards currently being granted under the program, such fractional awards expire if unredeemed after 60 days. The unearned revenue for this program is recorded in accrued liabilities on the consolidated balance sheets and was $1.3 million and $1.4 million at January 29, 2011, and January 30, 2010, respectively. If actual redemptions ultimately differ from accrued redemption levels, or if the Company further modifies the terms of the program in a way that affects expected redemption value and levels, the Company could record adjustments to the unearned revenue accrual, which would affect net sales.
Cost of Sales
Cost of sales includes the cost of merchandise; markdowns; inventory shortages; inbound freight; payroll expenses associated with buying, planning and allocation; inspection cost; processing, receiving and other warehouse costs; rent and other occupancy costs; and depreciation and amortization expense associated with the Company’s stores and distribution center.
Leases
The Company recognizes rent expense for operating leases on a straight-line basis (including the effect of reduced or free rent and rent escalations) over the lease term. The difference between the cash paid to the landlord and the amount recognized as rent expense on a straight-line basis is recognized as an adjustment to deferred rent in the consolidated balance sheets. Also, cash reimbursements received from landlords for leasehold improvements and other cash payments received from landlords as lease incentives are recorded as deferred rent and are amortized using the straight-line method over the lease term as an offset to rent expense.
Store Preopening Costs
Store opening and preopening costs are charged to expense as they are incurred.
Advertising Costs
Costs for advertising related to visual merchandising, consisting of in-store signage, promotions, and Internet marketing, are expensed as incurred. Total advertising expenses were $3.6 million, $2.4 million, and $3.2 million in fiscal 2010, 2009, and 2008, respectively.
Vendor Discounts
The Company receives certain discounts from its vendors in accordance with agreed-upon payment terms. These discounts are reflected as a reduction of merchandise inventories in the period they are received and charged to cost of sales when the items are sold.
F-15
Table of Contents
THE WET SEAL, INC.
NOTES TO CONSOLIDATED FINANCIAL STATEMENTS (Continued)
For the fiscal years ended January 29, 2011, January 30, 2010, and January 31, 2009
NOTE 1: Summary of Significant Accounting Policies (Continued)
Income Taxes
The Company accounts for income taxes by recognizing deferred tax assets, which include, among other things, net operating loss carryforwards and tax credits, and liabilities based on the differences between the financial statement carrying amounts and the tax basis of assets and liabilities, using enacted tax rates in effect in the years the differences are expected to reverse. Deferred income tax expense or benefit results from the change in net deferred tax assets or deferred tax liabilities.
The Company records net deferred tax assets to the extent it believes these assets will more likely than not be realized. In making such determination, the Company considers all available positive and negative evidence, including future reversals of existing taxable temporary differences, projected future taxable income, tax planning strategies and recent financial operations. In the event the Company had a change in expectations regarding its ability to realize its deferred income tax assets in the future, it would make an adjustment to the valuation allowance which would affect the provision for income taxes.
In fiscal 2004, due to the Company’s historical operating losses and future projected results, the Company established a valuation allowance for 100% of its deferred tax assets. The Company discontinued recording income tax benefits in the consolidated statements of operations from fiscal 2004 through fiscal 2008.
In fiscal 2009, the Company determined it was more likely than not that substantially all of the net deferred tax assets will be realized in the future. As a result, the Company reversed the valuation allowance on its deferred tax assets in the fourth quarter of fiscal 2009. However, in fiscal 2010, the Company determined it previously had interpreted federal tax rules incorrectly pertaining to expiration of charitable contribution carry forwards available to offset future taxable income and identified certain other minor errors in its deferred income taxes. As a result, the Company had overstated its net deferred tax assets, benefit for income taxes and net income by approximately $6.6 million as of the end of fiscal 2009. The reversal was originally in the amount of $71.3 million and has been changed to be $64.7 million to correct for the prior misinterpretation of federal tax laws and other minor errors identified in the third quarter of fiscal 2010. The Company concluded that the necessary corrections were not material to previously issued financial statements, and the 2009 balances previously overstated have been corrected in the accompanying financial statements. Refer elsewhere in Note 1 for further information.
As discussed further in Note 3, the Company is subject to certain limitations on its ability to utilize its federal and state net operating loss carryforwards.
Comprehensive Income (Loss)
Employers are required to recognize the over or under funded status of defined benefit plans and other postretirement plans in the statement of financial position and to recognize changes in the funded status in the year in which the changes occur through comprehensive income. The Company was required to adopt such provisions as of the end of fiscal 2006, resulting in the recognition of other comprehensive income in the consolidated balance sheets for the difference between the previous carrying value of the accrued liability under the Company’s supplemental employee retirement plan and the carrying value (see Note 11).
F-16
Table of Contents
THE WET SEAL, INC.
NOTES TO CONSOLIDATED FINANCIAL STATEMENTS (Continued)
For the fiscal years ended January 29, 2011, January 30, 2010, and January 31, 2009
NOTE 1: Summary of Significant Accounting Policies (Continued)
Insurance/Self-Insurance
The Company uses a combination of insurance and self-insurance for its workers’ compensation and employee health care programs. A portion of the employee health care plan is funded by employees. Under the workers’ compensation insurance program, the Company is liable for a deductible of $0.25 million for each individual claim and an aggregate annual liability of $1.4 million. Under the group health plan, the Company is liable for a deductible of $0.175 million for each individual claim and an aggregate monthly liability of $0.5 million. The monthly aggregate liability is subject to adjustment based on the number of participants in the plan each month. For both of the insurance plans, the Company records a liability for the costs associated with reported claims and a projected estimate for unreported claims considering historical experience and industry standards. The Company adjusts these liabilities based on historical claims experience, demographic factors, severity factors, and other actuarial assumptions. A significant change in the number or dollar amount of claims could cause the Company to revise its estimates of potential losses, which would affect its reported results. The following summarizes the activity within the Company’s accrued liability for the self-insured portion of unpaid claims and estimated unreported claims:
| January 29, 2011 |
January 30, 2010 |
January 31, 2009 |
||||||||||
| (in thousands) | ||||||||||||
| Balance at beginning of year |
$ | 1,826 | $ | 2,111 | $ | 1,765 | ||||||
| Accruals |
4,965 | 4,303 | 6,869 | |||||||||
| Payment of claims |
(5,323 | ) | (4,588 | ) | (6,523 | ) | ||||||
| Balance at end of year |
$ | 1,468 | $ | 1,826 | $ | 2,111 | ||||||
Stock-Based Compensation
The Company accounts for share-based compensation arrangements in accordance with applicable accounting standards, which require the measurement and recognition of compensation expense for all share-based payment awards to employees and directors based on estimated fair values. Refer to Note 2 for further information.
Derivative Financial Instruments
As of January 30, 2010, the Company’s only derivative financial instrument was an embedded derivative associated with the Company’s Notes (see Note 5). The Company accounted for its only derivative financial instrument at fair value on its consolidated balance sheets. The gain or loss as a result of the change in fair value of the embedded derivative was recognized in interest expense in the consolidated statements of operations and was not significant for any period presented. During fiscal 2010, the balance of the Notes was converted. As a result, no embedded derivative remained in the Company’s consolidated balance sheet as of January 29, 2011.
Recently Adopted Accounting Pronouncements and New Accounting Pronouncements Not Yet Adopted
In October 2009, the Financial Accounting Standards Board (the “FASB”) issued guidance related to revenue arrangements with multiple deliverables. Under the new guidance, when vendor specific objective evidence or third party evidence for deliverables in an arrangement cannot be determined, a best estimate of the
F-17
Table of Contents
THE WET SEAL, INC.
NOTES TO CONSOLIDATED FINANCIAL STATEMENTS (Continued)
For the fiscal years ended January 29, 2011, January 30, 2010, and January 31, 2009
NOTE 1: Summary of Significant Accounting Policies (Continued)
selling price is required to separate deliverables and allocate arrangement consideration using the relative selling price method. Such guidance is to be applied on a prospective basis for revenue arrangements entered into or materially modified in fiscal years beginning on or after June 15, 2010, with early adoption permitted. The adoption of this guidance did not have any effect on its consolidated financial statements.
In January 2010, the FASB issued guidance and clarifications for improving disclosures about fair value measurements. This guidance requires enhanced disclosures regarding transfers in and out of the levels within the fair value hierarchy. Separate disclosures are required for transfers in and out of Level 1 and 2 fair value measurements, and the reasons for the transfers must be disclosed. In the reconciliation for Level 3 fair value measurements, separate disclosures are required for purchases, sales, issuances, and settlements on a gross basis. The new disclosures and clarifications of existing disclosures are effective for interim and annual reporting periods beginning after December 15, 2009, except for the disclosures about purchases, sales, issuances, and settlements in the roll forward of activity in Level 3 fair value measurements, which are effective for interim and annual reporting periods beginning after December 15, 2010. Effective January 31, 2010, the Company adopted the new and updated disclosure guidance, aside from that deferred to periods after December 15, 2010, and this did not significantly impact the Company’s consolidated financial statements. The Company does not believe adoption of the remaining guidance on disclosures will have any effect on its consolidated financial statements.
NOTE 2: Stock-Based Compensation
The provisions of FASB guidance require the measurement and recognition of compensation expense for all share-based payment awards to employees and directors based on estimated fair values.
The Company elected to adopt the alternative transition method provided in FASB guidance for calculating the tax effects of share-based compensation. The alternative transition method includes simplified methods to establish the beginning balance of the additional paid-in capital pool (the “APIC Pool”) related to the tax effects of employee share-based compensation, and to determine the subsequent impact on the APIC Pool and consolidated statements of cash flows of the tax effects of employee and director share-based awards that are outstanding upon adoption. In addition, the Company elected to recognize excess income tax benefits from stock option exercises and vesting of restricted stock and performance shares in additional paid-in capital only if an incremental income tax benefit would be realized after considering all other tax attributes presently available to the Company. The Company measures the tax benefit associated with excess tax deductions related to stock-based compensation expense by multiplying the excess tax deductions by the statutory tax rates. The Company records tax shortfalls for the stock compensation related to vested stock options and performance awards that have been forfeited to paid-in capital to the extent there is APIC Pool balance available. If there is no APIC Pool balance available, the Company records these tax shortfalls to its provision for income taxes. During 2010, the Company recorded $2.3 million of tax shortfalls to paid-in capital.
The Company had one stock incentive plan under which shares were available for grant at January 29, 2011: the 2005 Stock Incentive Plan (the “2005 Plan”). The Company also previously granted share awards under its 1996 Long-Term Incentive Plan (the “1996 Plan”) and the 2000 Stock Incentive Plan (the “2000 Plan”) that remain unvested and/or unexercised as of January 29, 2011; however, the 1996 Plan expired during fiscal 2006 and the 2000 Plan expired during fiscal 2009, and no further share awards may be granted under the 1996 Plan and 2000 plan. The 2005 Plan, the 2000 Plan, and the 1996 Plan are collectively referred to as the “Plans.”
F-18
Table of Contents
THE WET SEAL, INC.
NOTES TO CONSOLIDATED FINANCIAL STATEMENTS (Continued)
For the fiscal years ended January 29, 2011, January 30, 2010, and January 31, 2009
NOTE 2: Stock-Based Compensation (Continued)
The 2005 Plan permits the granting of options, restricted common stock, performance shares, or other equity-based awards to the Company’s employees, officers, directors, and consultants. The Company believes the granting of equity-based awards helps to align the interests of its employees, officers, directors, and consultants with those of its stockholders. The Company has a practice of issuing new shares to satisfy stock option exercises, as well as for restricted stock and performance share grants. The 2005 Plan was approved by the Company’s stockholders on January 10, 2005, as amended with stockholder approval on July 20, 2005, for the issuance of incentive awards covering 12,500,000 shares of Class A common stock. Additionally, an amended and restated 2005 Plan was approved by the Company’s stockholders on May 19, 2010, which increased the incentive awards capacity under the 2005 Plan to 17,500,000 shares of Class A common stock. An aggregate of 23,041,778 shares of Class A common stock have been issued or may be issued pursuant to the Plans. As of January 29, 2011, 4,380,927 shares were available for future grants.
Options
The Plans provide that the per-share exercise price of a stock option may not be less than the fair market value of Class A common stock on the date the option is granted. Under the Plans, outstanding options generally vest over periods ranging from three to five years from the grant date and generally expire from five to ten years after the grant date. Certain stock option and other equity-based awards provide for accelerated vesting if there is a change in control (as defined in the Plans). The Company records compensation expense for employee stock options based on the estimated fair value of the options on the date of grant using the Black-Scholes option-pricing model. The Company uses historical data, the implied volatility of market-traded options and other factors to estimate the expected price volatility, option lives, and forfeiture rates.
The risk-free rate is based on the U.S. Treasury yield curve in effect at the time of grant and the estimated life of the option. The following weighted-average assumptions were used to estimate the fair value of options granted during the periods indicated using the Black-Scholes option-pricing model:
| Fiscal 2010 |
Fiscal 2009 |
Fiscal 2008 |
||||||||||
| Dividend Yield |
0.00 | % | 0.00 | % | 0.00 | % | ||||||
| Expected Volatility |
59.00 | % | 56.00 | % | 53.00 | % | ||||||
| Risk-Free Interest Rate |
1.12 | % | 1.57 | % | 2.44 | % | ||||||
| Expected Life of Options (in Years) |
3.3 | 3.3 | 3.3 | |||||||||
The Company recorded $0.3 million, $0.2 million, and $0.5 million of compensation expense, or in each case less than $0.01 per basic and diluted share, related to stock options outstanding during fiscal 2010, 2009, and 2008, respectively.
At January 29, 2011, there was $2.7 million of total unrecognized compensation expense related to nonvested stock options under the Company’s share-based payment plans, which will be recognized over an average period of 3.1 years, representing the remaining vesting periods of such options through fiscal 2014.
F-19
Table of Contents
THE WET SEAL, INC.
NOTES TO CONSOLIDATED FINANCIAL STATEMENTS (Continued)
For the fiscal years ended January 29, 2011, January 30, 2010, and January 31, 2009
NOTE 2: Stock-Based Compensation (Continued)
The following table summarizes the Company’s stock option activities with respect to its Plans for fiscal 2010, as follows (aggregate intrinsic value in thousands):
| Options |
Number of Shares |
Weighted- Average Exercise Price Per Share |
Weighted- Average Remaining Contractual Life (in years) |
Aggregate Intrinsic Value |
||||||||||||
| Outstanding at January 30, 2010 |
2,234,752 | $ | 6.77 | |||||||||||||
| Granted |
1,643,000 | $ | 3.60 | |||||||||||||
| Exercised |
(66,168 | ) | $ | 3.21 | ||||||||||||
| Canceled |
(530,727 | ) | $ | 6.57 | ||||||||||||
| Outstanding at January 29, 2011 |
3,280,857 | $ | 5.26 | 4.16 | $ | 353 | ||||||||||
| Vested and expected to vest in the future at January 29, 2011 |
2,808,828 | $ | 5.54 | 3.81 | $ | 314 | ||||||||||
| Exercisable at January 29, 2011 |
1,341,214 | $ | 7.72 | 1.79 | $ | 119 | ||||||||||
Options vested and expected to vest in the future are comprised of all options outstanding at January 29, 2011, net of estimated forfeitures. Additional information regarding stock options outstanding as of January 29, 2011, is as follows:
| Options Outstanding | Options Exercisable | |||||||||||||||||||
| Range of Exercise Prices |
Number Outstanding as of January 29, 2011 |
Weighted- Average Remaining Contractual Life (in years) |
Weighted- Average Exercise Price Per Share |
Number Exercisable as of January 29, 2011 |
Weighted- Average Exercise Price Per Share |
|||||||||||||||
| $ 1.81 - $ 2.93 |
162,500 | 1.25 | $ | 2.62 | 100,835 | $ | 2.58 | |||||||||||||
| 2.96 - 4.83 |
2,176,167 | 5.63 | 3.62 | 311,188 | 3.84 | |||||||||||||||
| 4.86 - 8.00 |
460,940 | 1.49 | 6.44 | 447,941 | 6.49 | |||||||||||||||
| 8.08 - 15.02 |
405,250 | 0.98 | 10.93 | 405,250 | 10.93 | |||||||||||||||
| 19.90 - 23.02 |
76,000 | 1.12 | 20.62 | 76,000 | 20.62 | |||||||||||||||
| $ 1.81 - $23.02 |
3,280,857 | 4.16 | $ | 5.26 | 1,341,214 | $ | 7.72 | |||||||||||||
The weighted-average grant-date fair value of options granted during fiscal 2010, 2009, and 2008 was $1.49, $1.36, and $1.50 per share, respectively. The total intrinsic value for options exercised during fiscal 2010 was $0.1 million and for fiscal 2009 and 2008 was less than $0.1 million each year.
Cash received from option exercises under all Plans for fiscal 2010, 2009, and 2008 was $0.2 million, less than $0.1 million, and less than $0.1 million, respectively. During fiscal 2010, 2009 and 2008, the Company did not realize tax benefits for the tax deductions from option exercises as it must first utilize its regular net operating loss carryforwards (see Note 3) prior to realizing the excess tax benefits.
Restricted Common Stock and Performance Shares
Under the 2005 Plan, the Company grants directors, certain executives, and other key employees restricted common stock with vesting contingent upon completion of specified service periods ranging from one to three
F-20
Table of Contents
THE WET SEAL, INC.
NOTES TO CONSOLIDATED FINANCIAL STATEMENTS (Continued)
For the fiscal years ended January 29, 2011, January 30, 2010, and January 31, 2009
NOTE 2: Stock-Based Compensation (Continued)
years. The Company also grants certain executives and other key employees performance share awards with vesting contingent upon a combination of specified service periods and the Company’s achievement of specified common stock price levels.
During fiscal 2010, 2009, and 2008, the Company granted 972,700, 263,436, and 249,025 shares, respectively, of restricted common stock to certain employees and directors under the Plans. The weighted-average grant-date fair value of the restricted common stock granted during fiscal 2010, 2009, and 2008 was $3.48, $2.71, and $3.10 per share, respectively. The Company recorded approximately $1.3 million, $1.1 million, and $1.4 million of compensation expense related to outstanding shares of restricted common stock held by employees and directors during fiscal 2010, 2009, and 2008, respectively.
During fiscal 2010, 2009, and 2008, the Company granted 1,000,000, 54,000, and 90,000 performance shares, respectively, to certain officers under the 2005 Plan. The weighted-average grant-date fair value of the performance share grants made during fiscal 2010, 2009, and 2008, which included consideration of the probability of such shares vesting, was $2.56, $1.79, and $2.07 per share, respectively. The Company recorded $0.2 million, $0.3 million, and $1.1 million of compensation expense during fiscal 2010, 2009, and 2008, respectively, related to performance shares granted to officers.
The fair value of nonvested restricted common stock awards is determined based on the closing trading price of the Company’s common stock on the grant date. The fair value of nonvested performance shares is determined based on a number of factors, including the closing trading price of the Company’s common stock and the estimated probability of achieving the Company’s stock price performance conditions as of the grant date. For nonvested performance shares that remain outstanding as of January 29, 2011, the various closing trading price performance conditions for the Company’s common stock range from $4.60 to $9.00 per share. The following table summarizes activity with respect to the Company’s nonvested restricted common stock and performance shares for fiscal 2010:
| Nonvested Restricted Common Stock and Performance Shares |
Number of Shares |
Weighted- Average Grant- Date Fair Value |
||||||
| Nonvested at January 30, 2010 |
1,596,318 | $ | 2.37 | |||||
| Granted |
1,972,700 | $ | 3.01 | |||||
| Vested |
(464,206 | ) | $ | 2.98 | ||||
| Forfeited |
(1,043,600 | ) | $ | 1.82 | ||||
| Nonvested at January 29, 2011 |
2,061,212 | $ | 3.12 | |||||
The fair value of restricted common stock and performance shares that vested during fiscal 2010 was $1.7 million.
At January 29, 2011, there was $5.1 million of total unrecognized compensation expense related to nonvested restricted common stock and performance shares under the Company’s share-based payment plans, of which $2.5 million relates to restricted common stock and $2.6 million relates to performance shares. That cost is expected to be recognized over a weighted-average period of 2.5 years. These estimates utilize subjective assumptions about expected forfeiture rates, which could change over time. Therefore, the amount of unrecognized compensation expense noted above does not necessarily represent the expense that will ultimately be recognized by the Company in its consolidated statements of operations.
F-21
Table of Contents
THE WET SEAL, INC.
NOTES TO CONSOLIDATED FINANCIAL STATEMENTS (Continued)
For the fiscal years ended January 29, 2011, January 30, 2010, and January 31, 2009
NOTE 2: Stock-Based Compensation (Continued)
The following table summarizes stock-based compensation recorded in the consolidated statements of operations:
| Fiscal Year Ended | ||||||||||||
| January 29, 2011 |
January 30, 2010 |
January 31, 2009 |
||||||||||
| (in thousands) | ||||||||||||
| Cost of sales |
$ | 2 | $ | (132 | ) | $ | 574 | |||||
| Selling, general, and administrative expenses |
1,785 | 1,756 | 2,403 | |||||||||
| Stock-based compensation |
$ | 1,787 | $ | 1,624 | $ | 2,977 | ||||||
Change in Estimated Forfeiture Rate
Based on historical experience, the Company modified the estimated annual forfeiture rate used in recognizing stock-based compensation expense, for its executives only, from a 5% forfeiture rate to a 10% forfeiture rate in the first quarter of fiscal 2008, and then from a 10% forfeiture rate to a 15% forfeiture rate in the first quarter of fiscal 2009 for both executives and non-executives. During these same periods, the Company also realized benefits from actual forfeiture experience that was higher than previously estimated for unvested stock options and restricted common stock, resulting primarily from executive and other employee departures from the Company. The impact of these events were benefits during fiscal 2009 and fiscal 2008 of approximately $0.9 million and $0.9 million, respectively, of which $0.4 million and $0.3 million, respectively, was included in cost of sales and $0.5 million and $0.6 million, respectively, was included in selling, general, and administrative expenses in the consolidated statements of operations. During fiscal 2010, the estimated annual forfeiture rate has remained at 15% for all employees.
NOTE 3: Provision (Benefit) for Income Taxes
The components of the provision (benefit) for income taxes for fiscal 2010, 2009, and 2008 are as follows (in thousands):
| Fiscal 2010 |
Fiscal 2009 |
Fiscal 2008 |
||||||||||
| Current: |
||||||||||||
| Federal |
$ | 239 | $ | (24 | ) | $ | 630 | |||||
| State |
192 | 273 | 692 | |||||||||
| 431 | 249 | 1,322 | ||||||||||
| Deferred: |
||||||||||||
| Federal |
8,801 | 7,315 | 13,043 | |||||||||
| State |
1,194 | 1,117 | 2,717 | |||||||||
| Change in valuation allowance |
(457 | ) | (8,432 | ) | (15,760 | ) | ||||||
| Valuation allowance release |
— | (64,753 | ) | — | ||||||||
| 9,538 | (64,753 | ) | — | |||||||||
| $ | 9,969 | $ | (64,504 | ) | $ | 1,322 | ||||||
F-22
Table of Contents
THE WET SEAL, INC.
NOTES TO CONSOLIDATED FINANCIAL STATEMENTS (Continued)
For the fiscal years ended January 29, 2011, January 30, 2010, and January 31, 2009
NOTE 3: Provision (Benefit) for Income Taxes (Continued)
Reconciliations of the provision (benefit) for income taxes to the amount of the provision (benefit) that would result from applying the federal statutory rate of 35% to income before provision (benefit) for income taxes for fiscal 2010, 2009, and 2008 are as follows:
| Fiscal 2010 |
Fiscal 2009 |
Fiscal 2008 |
||||||||||
| Provision for income taxes at federal statutory rate |
35.0 | % | 35.0 | % | 35.0 | % | ||||||
| State income taxes, net of federal income tax benefit |
3.8 | 4.7 | 1.4 | |||||||||
| Charitable contributions |
4.6 | — | — | |||||||||
| Nondeductible interest on secured convertible notes |
4.6 | 1.4 | 3.1 | |||||||||
| Other nondeductible expenses |
0.7 | 0.5 | 0.6 | |||||||||
| Valuation allowance |
(3.0 | ) | (327.7 | ) | (35.9 | ) | ||||||
| Other |
(1.5 | ) | (2.6 | ) | — | |||||||
| Effective tax rate |
44.2 | % | (288.7 | )% | 4.2 | % | ||||||
The major components of the Company’s net deferred income tax assets at January 29, 2011, and January 30, 2010, are as follows (in thousands):
| January 29, 2011 |
January 30, 2010 |
|||||||
| Deferred rent |
$ | 5,776 | $ | 5,556 | ||||
| Merchandise inventories |
1,640 | 1,437 | ||||||
| Difference between book and tax bases of fixed assets |
(1,260 | ) | 3,426 | |||||
| State income taxes |
(2,763 | ) | (3,942 | ) | ||||
| Supplemental employee retirement plan |
954 | 1,006 | ||||||
| Net operating loss and other tax attribute carryforwards |
35,422 | 44,550 | ||||||
| Deferred revenue |
7,823 | 7,694 | ||||||
| Stock-based compensation |
1,788 | 3,422 | ||||||
| Other |
4,166 | 2,703 | ||||||
| 53,546 | 65,852 | |||||||
| Valuation allowance |
(642 | ) | (1,099 | ) | ||||
| Net deferred income tax assets |
$ | 52,904 | $ | 64,753 | ||||
As a result of the Company’s historical operating losses and future projected results, management concluded in fiscal 2004 that it was more likely than not that the Company would not realize its net deferred tax assets. As a result, the Company established a valuation allowance for 100% of its net deferred income tax assets in fiscal 2004. The Company discontinued recording income tax benefits in the consolidated statements of operations from fiscal 2004 through fiscal 2008. At the end of fiscal 2009, the Company determined, based upon the balance of positive and negative evidence, that it was more likely than not that substantially all of the net deferred tax assets will be realized in the future, and the Company reversed $64.7 million of valuation allowance on its deferred tax assets (see Note 1: Summary of Significant Accounting Policies), all of which was recorded to the provision (benefit) for income taxes on the consolidated statement of operations.
F-23
Table of Contents
THE WET SEAL, INC.
NOTES TO CONSOLIDATED FINANCIAL STATEMENTS (Continued)
For the fiscal years ended January 29, 2011, January 30, 2010, and January 31, 2009
NOTE 3: Provision (Benefit) for Income Taxes (Continued)
During fiscal 2010, the Company implemented a change in tax method, upon filing its 2009 federal income tax return, which resulted in the reduction of deferred tax assets related to its charitable contribution carry forwards of $0.5 million. This decrease was recorded as a deferred income tax charge and increased the Company’s effective income tax rate for the year.
The Company’s effective income tax rate for fiscal 2010 was approximately 44%. This rate was higher than expected due to $2.8 million in interest charges incurred in the first fiscal quarter upon the conversion of the Company’s remaining Notes and Series C Convertible Preferred Stock (the “Preferred Stock”), which were not tax-deductible, and the $0.5 million non-cash deferred income tax charge previously discussed, offset by $0.5 million of non-cash deferred income tax benefit related to stock compensation true-ups in the fourth fiscal quarter. The net impact of these charges was an increase in the effective income tax rate for fiscal 2010 of approximately 4%.
Due to its utilization of federal and state net operating loss (“NOL”) carryforwards during fiscal 2010, the Company incurred cash income taxes for the fiscal year of approximately 2% of pre-tax income, representing the portion of federal and state alternative minimum taxes and State of California regular income taxes that cannot be offset by NOLs. The difference between the effective income tax rate and the cash income taxes is recorded as a non-cash provision for deferred incomes taxes.
As of January 29, 2011, the Company had federal NOL carryforwards of $93.5 million, of which $14.3 million relates to benefits from stock-based compensation. The Company’s federal NOL carryforwards begin to expire in 2023. The NOL carryforwards are subject to annual utilization limitations as of January 29, 2011. As of January 29, 2011, the Company also had net federal charitable contribution carryforwards remaining of $3.7 million, net of reserve for anticipated expiration, alternative minimum tax credits of $2.3 million, which do not expire, and remaining state NOLs of $51.3 million, which are also subject to annual utilization limitations, of which $14.3 million relates to benefits from stock-based compensation. On an ongoing basis, the Company projects taxable income in future years and establishes a valuation allowance related to the portion of charitable contribution carryforwards it anticipates will expire unused.
The Company uses the with-or-without method to determine when it will recognize and realize excess tax benefits from stock-based compensation. Under this method, the Company will recognize and realize these excess tax benefits only after it realizes the tax benefits of NOLs from operations.
Section 382 of the Internal Revenue Code (“Section 382”) contains provisions that may limit the availability of federal NOL carryforwards to be used to offset taxable income in any given year upon the occurrence of certain events, including significant changes in ownership interests of the Company’s common stock. Under Section 382, an ownership change that triggers potential limitations on NOL carryforwards occurs when there has been a greater than 50% change in ownership interest by shareholders owning 5% or more of a company over a period of three years or less. Based on its analyses, the Company had ownership changes in April 2005 and December 2006, which resulted in Section 382 limitations applying to federal NOLs generated prior to those dates, which were approximately $172.1 million.
As a result of those ownership changes, of the Company’s $93.5 million of remaining federal NOL carryforwards, the Company may utilize up to $58.3 million to offset taxable income in fiscal 2011 and 2012. The Company may also experience additional ownership changes in the future, which could further limit the amount of federal NOL carryforwards annually available and an increase in future cash income tax payments. As of January 29, 2011, there have been no ownership changes since 2006.
F-24
Table of Contents
THE WET SEAL, INC.
NOTES TO CONSOLIDATED FINANCIAL STATEMENTS (Continued)
For the fiscal years ended January 29, 2011, January 30, 2010, and January 31, 2009
NOTE 3: Provision (Benefit) for Income Taxes (Continued)
In addition, the Company may determine that varying state laws with respect to NOL carryforward utilization may result in lower limits, or an inability to utilize loss carryforwards in some states altogether, which could result in the Company incurring additional state income taxes. During fiscal 2008, the State of California passed legislation that suspended the Company’s ability to utilize NOL carryforwards to offset taxable income in fiscal 2008 and 2009. In late 2010, the State of California extended such legislation that further suspended use of NOL carryforwards to fiscal 2010 and 2011. As a result, the Company incurred regular state income taxes in California and an increased effective tax rate in fiscal 2008 through 2010.
The Company may also generate income in future periods on a federal alternative minimum tax basis, which would result in alternative minimum taxes payable on a portion of such income.
The Company applies provisions under ASC 740, “Income Taxes,” which require that a position taken or expected to be taken in a tax return be recognized in the financial statements when it is more likely than not that the position would be sustained upon examination by tax authorities. A recognized tax position is then measured at the largest amount of benefit that is greater than 50% likely of being realized upon ultimate settlement. These provisions also require that a change in judgment that results in subsequent recognition, derecognition, or change in a measurement of a tax position taken in a prior annual period (including any related interest and penalties) be recognized as a discrete item in the period in which the change occurs. These provisions require expanded disclosures, including identification of tax positions for which it is reasonably possible that total amounts of unrecognized tax benefits will significantly change in the next 12 months, a description of tax years that remain subject to examination by major tax jurisdiction, a tabular reconciliation of the total amount of unrecognized tax benefits at the beginning and end of each annual reporting period, the total amount of unrecognized tax benefits or expenses that, if recognized, would affect the effective tax rate, and the total amounts of interest and penalties recognized in the statements of operations and financial position.
The adoption of these provisions had no effect on the Company’s consolidated financial statements. At January 29, 2011, the Company had no material unrecognized tax benefits or expenses that, if recognized, would affect the Company’s effective income tax rate in future periods. The Company is currently unaware of any issues under review that could result in significant payments, accruals, or material deviations from its recognized tax positions.
The Company recognizes interest and penalties accrued related to unrecognized tax benefits and penalties within its provision for income taxes. The Company had no such interest and penalties accrued at January 29, 2011. Prior to its adoption of these provisions, the Company recognized such interest and penalties, which were immaterial in prior periods, within general and administrative expenses.
The major jurisdictions in which the Company files income tax returns include the United States federal jurisdiction as well as various state jurisdictions within the United States. The Company’s fiscal 2007 and thereafter are subject to examination by the United States federal jurisdiction, and, generally, fiscal 2003 and thereafter are subject to examination by various state tax authorities. The Company’s fiscal 2008 and 2009 income tax returns are currently under examination by the Internal Revenue Service. The Company does not expect that the results of the examination will have a material impact on its financial condition or statement of operations.
F-25
Table of Contents
THE WET SEAL, INC.
NOTES TO CONSOLIDATED FINANCIAL STATEMENTS (Continued)
For the fiscal years ended January 29, 2011, January 30, 2010, and January 31, 2009
NOTE 4: Accrued Liabilities
Accrued liabilities consist of the following as of January 29, 2011, and January 30, 2010 (in thousands):
| January 29, 2011 |
January 30, 2010 |
|||||||
| Minimum rent and common area maintenance |
$ | 2,056 | $ | 2,632 | ||||
| Accrued wages, bonuses, and benefits |
8,020 | 6,071 | ||||||
| Gift cards, gift certificates, and store credits |
5,793 | 6,045 | ||||||
| Frequent buyer and loyalty programs |
5,112 | 6,009 | ||||||
| Sales and use taxes |
1,821 | 1,447 | ||||||
| Other |
1,950 | 2,714 | ||||||
| $ | 24,752 | $ | 24,918 | |||||
| NOTE 5: | Senior Revolving Credit Facility, Secured Convertible Notes, Convertible Preferred Stock, and Common Stock Warrants |
Senior Revolving Credit Facility
On February 3, 2011, the Company renewed, via amendment and restatement, its $35.0 million senior revolving credit facility with its existing lender (the “Facility”), which can be increased up to $50.0 million in the absence of any default and upon the satisfaction of certain conditions precedent specified in the Facility. The Facility expires in February 2016. Effective April 1, 2011, under the Facility, the Company is subject to borrowing base limitations on the amount that can be borrowed and certain customary covenants, including, under certain circumstances, covenants limiting the ability to incur additional indebtedness, make investments and acquisitions, grant liens, pay dividends, repurchase its Class A common stock, close stores, and dispose of assets, without the lender’s consent. The ability of the Company to borrow and request the issuance of letters of credit is subject to the requirement that the Company maintain an excess of the borrowing base over the outstanding credit extensions of the greater of 10% of the aggregate amount of the facility or $4.0 million. The interest rate on the revolving line of credit under the Facility is (i) the higher of the lender’s prime rate, the Federal funds rate plus 0.5% or the one month London InterBank Offered Rate (LIBOR) plus 1.0%, collectively referred to as the “Base Rate”, plus the applicable margin ranging from 0.5% to 1.0% or, (ii) if the Company elects, the average one, two, three or six months LIBOR plus a margin ranging from 1.5% to 2.0%. The applicable Base Rate or LIBOR margin is based on the level of average excess availability, as defined under the Facility, at the time of election, as adjusted quarterly. The Company also incurs fees on outstanding letters of credit under the Facility at a rate equal to the applicable LIBOR margin for standby letters of credit and 23.0% of the applicable LIBOR margin for commercial letters of credit. Additionally, the Company is subject to commitment fees of 0.25% on the unused portion of the line of credit under the Facility.
The rates under the previous senior revolving credit facility will remain applicable through March 31, 2011. The interest rate on the Company’s line of credit under the Facility was the prime rate or, if it elected, the London InterBank Offered Rate (“LIBOR”) plus a margin ranging from 1.0% to 1.5%. The applicable LIBOR margin was based on the level of average excess availability, as defined under the Facility, at the time of election, as adjusted quarterly. The applicable LIBOR margin was 1.0% as of January 29, 2011. The Company also incurred fees on outstanding letters of credit under the Facility at a rate equal to the applicable LIBOR margin for standby letters of credit and 33.3% of the applicable LIBOR margin for commercial letters of credit. Additionally, the Company incurred commitment fees of 0.25% on the unused portion of the line of credit under the Facility.
F-26
Table of Contents
THE WET SEAL, INC.
NOTES TO CONSOLIDATED FINANCIAL STATEMENTS (Continued)
For the fiscal years ended January 29, 2011, January 30, 2010, and January 31, 2009
| NOTE 5: | Senior Revolving Credit Facility, Secured Convertible Notes, Convertible Preferred Stock, and Common Stock Warrants (Continued) |
Borrowings under the Facility are secured by inventory, receivables, cash, cash equivalents and investments held by the Company and two of its wholly owned subsidiaries, The Wet Seal Retail, Inc. and Wet Seal Catalog, Inc., each of which may be a borrower under the Facility. Borrowings under the previous senior credit facility were secured by all assets held by the Company and two of its wholly owned subsidiaries, The Wet Seal Retail, Inc. and Wet Seal Catalog, Inc. The obligations of the Company and the subsidiary borrowers under the Facility are guaranteed by another wholly owned subsidiary of the Company, Wet Seal GC, LLC.
At January 29, 2011, the amount outstanding under the Facility consisted of $6.7 million in open documentary letters of credit related to merchandise purchases and $1.7 million in outstanding standby letters of credit, and the Company had $26.6 million available under the Facility for cash advances and/or the issuance of additional letters of credit.
At January 29, 2011, the Company was in compliance with all covenant requirements related to the Facility.
Secured Convertible Notes and Common Stock Warrants
On January 14, 2005, after receipt of stockholder approval on January 10, 2005, the Company issued $56.0 million in aggregate principal amount of its Notes due January 14, 2012, to certain investors (the “Investors”). The Notes had a conversion price of $1.50 per share of the Company’s Class A common stock (subject to antidilution adjustments) and bore interest at an annual rate of 3.76% (interest could be paid in cash or accrued to principal at the Company’s discretion, and a ratable portion of accrued interest was extinguished without payment by the Company if and when Notes were converted). The initial conversion price assigned to the Notes was lower than the fair market value of the Class A common stock on the commitment date (January 11, 2005), creating a beneficial conversion feature. On January 14, 2005, the Company also issued to the Investors Series B warrants, Series C warrants, and Series D warrants (collectively with 2.3 million of Series A warrants previously issued to the Investors, the “Warrants”) to acquire initially up to 3.4 million, 4.5 million, and 4.7 million shares of the Company’s Class A common stock, respectively. The Series B, Series C, and Series D warrants had exercise prices per share of $2.25, $2.50, and $2.75, respectively. Each Investor was prohibited from converting any of the Notes or exercising any Warrants if, as a result, it would own beneficially at any time more than 9.99% of the outstanding Class A common stock of the Company. The Notes were guaranteed by other wholly owned subsidiaries of the Company, Wet Seal Catalog, Inc., The Wet Seal Retail Inc. and Wet Seal GC, LLC.
The Company determined the relative fair values of the Warrants issued and the beneficial conversion feature of the Notes. Fair value was first determined for the Warrants using the Black-Scholes option-pricing model. The Warrants were allocated a value of $14.4 million and reduced the face value of the Notes and increased paid-in capital using a method that approximates the relative fair value method. Based on the reduced value of the Notes and their convertibility into 37,333,333 shares of Class A common stock, the effective conversion price was determined and compared to the market price of Class A common stock on the commitment date, the difference representing the beneficial conversion feature on a per-share basis. The face value of the Notes was further reduced by $30.1 million, the value allocated to the beneficial conversion feature, and paid-in capital was increased.
Additionally, the Notes contained an embedded derivative, which upon the occurrence of a change of control, as defined, allowed each noteholder the option to require the Company to redeem all or a portion of the
F-27
Table of Contents
THE WET SEAL, INC.
NOTES TO CONSOLIDATED FINANCIAL STATEMENTS (Continued)
For the fiscal years ended January 29, 2011, January 30, 2010, and January 31, 2009
| NOTE 5: | Senior Revolving Credit Facility, Secured Convertible Notes, Convertible Preferred Stock, and Common Stock Warrants (Continued) |
Notes at a price equal to the greater of (i) the product of (x) the conversion amount being redeemed and (y) the quotient determined by dividing (A) the closing sale price of the Class A common stock on the business day on which the first public announcement of such proposed change of control is made by (B) the conversion price and (ii) 125% of the conversion amount being redeemed. The Company accounted for this derivative at fair value on the consolidated balance sheets within other long-term liabilities. The face value of the Notes was reduced by $0.5 million to record this liability. Changes in the fair market value of the derivative liability were recognized in the consolidated statements of operations within interest expense. During fiscal 2010, 2009 and 2008, there were decreases of less than $0.1 million, in the fair value of the embedded derivative, which the Company recognized as decreases in fiscal 2010, 2009 and 2008, to the carrying value of the derivative liability and as credits in fiscal 2010, 2009 and 2008, to interest expense in the consolidated statements of operations.
During fiscal 2008, Investors converted $3.4 million of the Notes into 2,274,804 shares of Class A common stock. As a result of the conversion, the Company recorded net noncash interest charges of $2.3 million to write off a ratable portion of unamortized debt discount and deferred financing costs associated with the Notes (see Note 1: Summary of Significant Accounting Policies).
During fiscal 2010, investors in the Notes converted the remaining $4.7 million of the Notes into 3,111,111 shares of the Company’s Class A common stock. As a result of these conversions, the Company recorded non-cash interest charges of $2.1 million during fiscal 2010, to write-off a ratable portion of unamortized debt discount and deferred financing costs associated with the Notes. Additionally, a ratable portion of accrued interest of $1.0 million was forfeited by the holder when the Notes were converted and it was written off to paid-in capital. Finally, the Company provided the holder with a $0.7 million conversion inducement, which was recorded as an interest charge during fiscal 2010. The Company also repurchased an insignificant remaining Note balance from another holder. As a result of these transactions, there are no longer any Notes outstanding as of January 29, 2011, and there was a satisfaction and discharge of the Company’s obligations under the Indenture governing the Notes. No Notes were converted during fiscal 2009.
The resulting discount to the Notes was amortized under the interest method over the seven-year life of the Notes and charged to interest expense. The Notes had a yield to maturity of 27.1%. For fiscal 2010, 2009, and 2008, the Company recognized $0.1 million, $0.6 million, and $0.6 million, respectively, in interest expense, not including accelerated charges upon conversions, related to the discount amortization.
The Company includes the shares issuable upon conversion of the Notes in its calculations of basic and diluted earnings per share to the extent such inclusion would be dilutive. During fiscal 2010, 2009 and 2008, the Notes were dilutive and included in the earnings per share calculations.
Convertible Preferred Stock and Common Stock Warrants
On April 29, 2005, the Company signed a Securities Purchase Agreement and a related Registration Rights Agreement with several investors that participated in the Company’s Notes financing. Pursuant to the Securities Purchase Agreement, on May 3, 2005, the Company issued to the investors 24,600 shares of Preferred Stock, for an aggregate purchase price of $24.6 million. The Company received approximately $19.1 million in net proceeds (including the exercise of Series A and Series B Warrants discussed below and after the retirement of certain bridge financing). The Preferred Stock was convertible into 8.2 million shares of Class A common stock, reflecting an initial $3.00 per-share conversion price. The effective conversion price assigned to the Preferred
F-28
Table of Contents
THE WET SEAL, INC.
NOTES TO CONSOLIDATED FINANCIAL STATEMENTS (Continued)
For the fiscal years ended January 29, 2011, January 30, 2010, and January 31, 2009
| NOTE 5: | Senior Revolving Credit Facility, Secured Convertible Notes, Convertible Preferred Stock, and Common Stock Warrants (Continued) |
Stock was lower than the fair value of the common stock on the commitment date, creating a beneficial conversion feature. The Preferred Stock was not entitled to any special dividend payments, mandatory redemption, or special voting rights. The Preferred Stock had customary weighted-average antidilution protection for future stock issuances below the applicable per-share conversion price.
Pursuant to the Securities Purchase Agreement, the Investors agreed to exercise all of their outstanding Series A Warrants and a portion of their outstanding Series B warrants that were issued in the Notes financing. The Company issued approximately 3.4 million shares of Class A common stock related to the exercise of the Series A and Series B warrants at an aggregate exercise price of approximately $6.4 million.
The Company also issued new Series E Warrants to purchase up to 7.5 million shares of Class A common stock. The Series E warrants became exercisable on November 3, 2005, and expired on November 3, 2010, and had an initial exercise price of $3.68, reflecting the closing bid price of the Class A common stock on the business day immediately before the signing of the Securities Purchase Agreement. The Series E warrants had antidilution protection for stock splits, stock dividends, distributions, and similar transactions.
The Company used approximately $11.9 million of the proceeds from this financing to retire certain outstanding loans and approximately $1.5 million to pay transaction costs. The remainder of the proceeds, approximately $17.6 million, is being used for general working capital and other corporate purposes.
The Company determined the relative fair values of the Series E warrants issued, the Preferred Stock, and the Registration Rights Agreement to be approximately $8.5 million, $16.0 million, and $0.1 million, respectively. The relative fair value allocated to the Series E warrants reduced the face value of the Preferred Stock and increased paid-in capital. The relative fair value allocated to the Registration Rights Agreement also reduced the face value of the Preferred Stock and increased other long-term liabilities (see below). Based on the reduced value of the Preferred Stock and its convertibility into 8.2 million shares of Class A common stock, the effective conversion price was determined and compared to the market price of Class A common stock on the commitment date (April 29, 2005), with the difference representing the beneficial conversion feature on a per-share basis. The value allocated to the beneficial conversion feature reduced the face value of the Preferred Stock by approximately $14.7 million and increased paid-in capital.
The Preferred Stock was generally a perpetual security unless and until it was converted into Class A common stock. However, certain “change of control” events, as defined in the Certificate of Designations, Preferences, and Rights of the Preferred Stock (the “Certificate”), still could have been out of the Company’s control, which could have required cash redemption of the Preferred Stock. Upon such a change of control or certain other liquidation events, as defined in the Certificate, the holders of the Preferred Stock would have been entitled to receive cash equal to the stated value of the Preferred Stock ($1,000 per share) before any amount was paid to the Company’s common stockholders. The Preferred Stock was presented outside of stockholders’ equity in the consolidated balance sheets. If such a change of control event were to occur, the Preferred Stock would have been recognized as a liability in the consolidated balance sheets until redeemed.
Because the Preferred Stock was immediately convertible and had no stated redemption date, the $23.3 million discount on the Preferred Stock was recognized as a non-cash deemed dividend in its entirety on May 3, 2005, the Preferred Stock issuance date.
F-29
Table of Contents
THE WET SEAL, INC.
NOTES TO CONSOLIDATED FINANCIAL STATEMENTS (Continued)
For the fiscal years ended January 29, 2011, January 30, 2010, and January 31, 2009
| NOTE 5: | Senior Revolving Credit Facility, Secured Convertible Notes, Convertible Preferred Stock, and Common Stock Warrants (Continued) |
The Company included the shares issuable upon conversion of the Preferred Stock in its calculations of basic and diluted earnings per share to the extent such inclusion was dilutive.
The Company determined the Registration Rights Agreement associated with the Preferred Stock was a derivative financial instrument. The Company accounted for this derivative financial instrument at fair value on the consolidated balance sheets within other long-term liabilities. Changes in the fair market value of this derivative liability were recognized in the statements of operations within interest expense. On July 29, 2005, the U.S. Securities and Exchange Commission declared effective an S-3 registration statement filed by the Company to register Class A common stock underlying the Preferred Stock and Series E warrants, which reduced the derivative value of the Registration Rights Agreement to zero. As a result, during fiscal 2005, the Company recognized a $0.1 million decrease in the fair value of this derivative as a decrease to the carrying value of the derivative liability and a credit to interest expense in the consolidated statements of operations.
During fiscal 2010 and fiscal 2008, investors in the Company’s Preferred Stock converted $1.6 million and $0.6 million, respectively, of Preferred Stock into 537,000 and 185,333 shares of the Company’s Class A common stock, respectively. During fiscal 2009, no Preferred Stock conversions occurred. As a result of the fiscal 2010 conversion, there is no longer any Preferred Stock outstanding as of January 29, 2011.
Exercise of Common Stock Warrants
In fiscal 2010, fiscal 2009 and fiscal 2008, investors in the Notes exercised portions of outstanding Warrants, resulting in the issuance of 1,160,715, 2,911,520, and 1,793,139 shares, of Class A common stock, respectively, in exchange for $4.3 million, $7.8 million and $6.1 million, respectively, of proceeds to the Company. In fiscal 2008, Series B warrants exercisable into 104,465 shares of Class A common stock expired unredeemed. In fiscal 2009, Series C and Series D warrants exercisable into 8,035 shares and 8,393 shares, respectively, of Class A common stock expired unredeemed. In fiscal 2010, Series E warrants exercisable into 4,931,401 shares of Class A common stock expired unredeemed. As a result of these expirations, there are no longer any warrants outstanding as of January 29, 2011.
NOTE 6: Commitments and Contingencies
Leases
The Company leases retail stores, its corporate office, warehouse facilities, vehicles, computers, and office equipment under operating lease agreements expiring at various times through 2022. Certain leases for the Company’s retail stores include fixed common area maintenance obligations.
Minimum annual rental and other commitments under noncancelable leases as of January 29, 2011, are as follows (in thousands):
| Fiscal year: |
||||
| 2011 |
$ | 64,700 | ||
| 2012 |
57,600 | |||
| 2013 |
51,200 | |||
| 2014 |
47,800 | |||
| 2015 |
43,500 | |||
| Thereafter |
137,100 | |||
| $ | 401,900 | |||
F-30
Table of Contents
THE WET SEAL, INC.
NOTES TO CONSOLIDATED FINANCIAL STATEMENTS (Continued)
For the fiscal years ended January 29, 2011, January 30, 2010, and January 31, 2009
NOTE 6: Commitments and Contingencies (Continued)
Aggregate rents under noncancelable operating leases for fiscal 2010, 2009, and 2008 were as follows (in thousands):
| Fiscal 2010 |
Fiscal 2009 |
Fiscal 2008 |
||||||||||
| Minimum rent |
$ | 60,500 | $ | 61,500 | $ | 60,600 | ||||||
| Percentage rent |
200 | 100 | 300 | |||||||||
| Deferred rent, net |
(2,600 | ) | (2,700 | ) | (3,800 | ) | ||||||
| Common area maintenance and real estate taxes |
40,200 | 37,300 | 36,400 | |||||||||
| Excise tax |
800 | 700 | 800 | |||||||||
| Aggregate rent expense |
$ | 99,100 | $ | 96,900 | $ | 94,300 | ||||||
Indemnities, Commitments, and Guarantees
The restricted shares and options awarded under the Company’s stock incentive plans permit accelerated vesting in connection with change-of-control events. A change of control is generally defined as the acquisition of over 50% of the combined voting power of the Company’s outstanding shares eligible to vote for the election of its Board of Directors by any person, or the merger or consolidation of the Company in which voting control is not retained by the holders of the Company’s securities prior to the transaction or the majority of directors of the surviving company are not directors of the Company. In addition, the members of the Board of Directors who have received restricted stock awards also have accelerated vesting provisions in connection with the occurrence of certain events, including, but not limited to, failure to be nominated or reelected to the Board of Directors and/or the significant diminution in the directors’ and officers’ insurance provided by the Company. In Fiscal 2010, 2009, and 2008, no change of control or other events occurred that would give rise to such accelerated vesting.
During its normal course of business, the Company has made certain indemnifications, commitments, and guarantees under which it may be required to make payments in relation to certain transactions. These indemnities include those given to various lessors in connection with facility leases for certain claims arising from such facility or lease and indemnities to directors and officers of the Company to the maximum extent permitted under the laws of the State of Delaware. The Company has issued guarantees in the form of letters of credit as security for merchandise shipments, payment of claims under the Company’s self-funded workers’ compensation insurance program, and certain other operating commitments. There were $6.7 million in letters of credit outstanding at January 29, 2011. The duration of these indemnities, commitments, and guarantees varies. Some of these indemnities, commitments, and guarantees do not provide for any limitation of the maximum potential future payments the Company could be obligated to make. It is not possible to determine the maximum potential amount under these indemnification agreements due to the limited history of prior indemnification claims and the unique facts and circumstances involved in each particular agreement. Historically, payments made related to these indemnifications have been immaterial. At January 29, 2011, the Company has determined that no accrued liability is necessary related to these commitments, guarantees, and indemnities.
Litigation
On July 19, 2006, a complaint was filed in the Superior Court of the State of California for the County of Los Angeles on behalf of certain of the Company’s current and former employees that were employed and paid by the Company on an hourly basis during the four-year period from July 19, 2002 through July 19, 2006. The
F-31
Table of Contents
THE WET SEAL, INC.
NOTES TO CONSOLIDATED FINANCIAL STATEMENTS (Continued)
For the fiscal years ended January 29, 2011, January 30, 2010, and January 31, 2009
NOTE 6: Commitments and Contingencies (Continued)
Company was named as a defendant. The complaint alleged various violations under the State of California Labor Code, the State of California Business and Professions Code, and orders issued by the Industrial Welfare Commission. On November 30, 2006, the Company reached an agreement to pay approximately $0.3 million to settle this matter, subject to Superior Court approval. On September 27, 2010, the Superior Court granted final approval of the settlement agreement. An appeal was subsequently filed on January 26, 2011. As of January 29, 2011, the Company has accrued an amount equal to the settlement amount in accrued liabilities in its consolidated balance sheet.
On May 22, 2007, a complaint was filed in the Superior Court of the State of California for the County of Orange on behalf of certain of the Company’s current and former employees who were employed and paid by the Company from May 22, 2003 through the present. The Company was named as a defendant. The complaint alleged various violations under the State of California Labor Code, the State of California Business and Professions Code, and orders issued by the Industrial Welfare Commission. On December 17, 2010, the court denied Plaintiffs’ Motion for Class Certification in its entirety and denied Plaintiffs’ Motion For Leave to File An Amended Complaint. Plaintiffs have appealed both orders but have not yet filed their opening appellate briefs. The Company is vigorously defending this litigation and is unable to predict the likely outcome and whether such outcome may have a material adverse effect on its results of operations or financial condition. Accordingly, no provision for a loss contingency has been accrued as of January 29, 2011.
On September 29, 2008, a complaint was filed in the Superior Court of the State of California for the County of San Francisco on behalf of certain of the Company’s current and former employees who were employed and paid by the Company from September 29, 2004 through the present. The Company was named as a defendant. The complaint alleges various violations under the State of California Labor Code and the State of California Business and Professions Code. The case has been transferred to the complex panel of the San Francisco Superior Court for case management purposes. Currently, Plaintiffs’ Motion for Class Certification and Defendants’ Motion to Strike Class Claims is due to be filed on April 25, 2011. Discovery is ongoing. The Company is vigorously defending this litigation and is unable to predict the likely outcome and whether such outcome may have a material adverse effect on its results of operations or financial condition. Accordingly, no provision for a loss contingency has been accrued as of January 29, 2011.
On April 24, 2009 the U.S. Equal Employment Opportunity Commission, or the EEOC, requested information and records relevant to several charges of discrimination by the Company against employees of the Company. In the course of this investigation, the EEOC served a subpoena seeking information related to current and former employees throughout the United States. In April 2010, the EEOC filed an application to enforce the subpoena in the U.S. District Court for the Eastern District of Pennsylvania, and is in the process of a nationwide investigation. The Company is awaiting the results of the investigation and is unable to predict the likely outcome and whether such outcome may have a material adverse effect on the Company’s results of operations or financial condition. Accordingly, no provision for a loss contingency has been accrued as of January 29, 2011.
From time to time, the Company is involved in other litigation matters relating to claims arising out of its operations in the normal course of business. The Company believes that, in the event of a settlement or an adverse judgment on certain of these claims, the Company has insurance coverage to cover a portion of such losses; however, certain other matters may exist or arise for which the Company does not have insurance coverage. As of January 29, 2011, the Company was not engaged in any other legal proceedings that are expected, individually or in the aggregate, to have a material adverse effect on its results of operations or financial condition.
F-32
Table of Contents
THE WET SEAL, INC.
NOTES TO CONSOLIDATED FINANCIAL STATEMENTS (Continued)
For the fiscal years ended January 29, 2011, January 30, 2010, and January 31, 2009
NOTE 7: Stockholders’ Equity
In June 2004, the Company completed a private placement of equity securities that included detachable warrants to acquire 2,109,275 additional shares of Class A common stock at an exercise price of $5.41 per share (the June 2004 warrants), subject to adjustment from time to time for stock splits, stock dividends, distributions, and similar transactions. The fair value of the warrants at the date of issue approximated $6.5 million. In fiscal 2009, the remaining June 2004 warrants exercisable into 1,723,705 shares of Class A common stock expired unredeemed.
On November 18, 2009, the Company’s Board of Directors authorized a program to repurchase up to $12.5 million to repurchase outstanding shares of the Company’s Class A Common Stock. Pursuant to this plan, during fiscal 2009, the Company repurchased 2,025,720 shares of its Class A common stock at an average market price of $3.58, for a total cost, including commissions, of approximately $7.3 million. During February 2010, the Company completed its use of this authority through additional repurchases of approximately $5.2 million. As a result this authorized spending plan is now closed.
On September 7, 2010, the Company’s Board of Directors authorized a program to repurchase up to $25.0 million of the outstanding shares of our Class A common stock from time to time in the open market or in privately negotiated transactions. Repurchases are at the option of the Company and can be suspended or discontinued at any time. Pursuant to this plan, the Company repurchased 882,300 shares of its Class A Common Stock at an average market price of $3.39, for a total cost, including commissions, of approximately $3.0 million. As of January 29, 2011, $22.0 million remained authorized for additional stock repurchases. Additionally, during February 2011, the Company repurchased 1,000,000 shares of its Class A common stock at an average market price of $3.71, for a total cost, including commissions of $3.7 million.
As of January 29, 2011, 8,295,882 repurchased shares, at a cost of $38.0 million, as well as 3,837,051 shares reacquired by the Company, at no cost, upon employee, director, and consultant forfeitures of stock-based compensation, were not yet retired.
NOTE 8: Fair Value of Financial Instruments
Fair value is defined as the price that would be received upon sale of an asset or paid upon transfer of a liability in an orderly transaction between market participants at the measurement date and in the principal or most advantageous market for that asset or liability. The fair value should be calculated based on assumptions that market participants would use in pricing the asset or liability, not on assumptions specific to the entity. In addition, the fair value of liabilities should include consideration of non-performance risk, including the Company’s own credit risk.
Inputs used in measuring fair value are prioritized into a three-level hierarchy based on whether the inputs to those measurements are observable or unobservable. Observable inputs reflect market data obtained from independent sources, while unobservable inputs reflect the Company’s market assumptions. The fair-value hierarchy requires the use of observable market data when available and consists of the following levels:
| • | Level 1 – Quoted prices for identical instruments in active markets; |
| • | Level 2 – Quoted prices for similar instruments in active markets; quoted prices for identical or similar instruments in markets that are not active; and model-derived valuations in which all significant inputs are observable in active markets; and |
| • | Level 3 – Valuations derived from valuation techniques in which one or more significant inputs are unobservable. |
F-33
Table of Contents
THE WET SEAL, INC.
NOTES TO CONSOLIDATED FINANCIAL STATEMENTS (Continued)
For the fiscal years ended January 29, 2011, January 30, 2010, and January 31, 2009
NOTE 8: Fair Value of Financial Instruments (Continued)
The following tables present information on the Company’s financial instruments (in thousands):
| Carrying Amount as of January 29, 2011 |
Fair Value Measurements at Reporting Date Using |
|||||||||||||||
| Level 1 | Level 2 | Level 3 | ||||||||||||||
| Financial assets: |
||||||||||||||||
| Cash and cash equivalents |
$ | 125,362 | $ | 31,738 | $ | 93,624 | $ | — | ||||||||
| Short-term investments |
50,690 | — | 50,686 | — | ||||||||||||
| Long-term tenant allowance receivables |
798 | — | — | 798 | ||||||||||||
| Carrying Amount as of January 30, 2010 |
Fair Value Measurements at Reporting Date Using |
|||||||||||||||
| Level 1 | Level 2 | Level 3 | ||||||||||||||
| Financial assets: |
||||||||||||||||
| Cash and cash equivalents |
$ | 161,693 | $ | 17,306 | $ | 144,387 | $ | — | ||||||||
| Long-term tenant allowance receivables |
728 | — | — | 728 | ||||||||||||
| Financial liabilities: |
||||||||||||||||
| Embedded derivative instrument |
20 | — | 20 | — | ||||||||||||
| Notes |
3,540 | 10,422 | — | — | ||||||||||||
| Preferred Stock |
1,611 | 1,799 | — | — | ||||||||||||
Cash and cash equivalents are carried at either cost or amortized cost, which approximates fair value, due to their short term maturities. Certain money market funds are valued through the use of quoted market prices and are represented as Level 1. Other money market funds are valued at $1, which is generally the net asset value of these funds and are represented at Level 2. Short-term investments are carried at amortized cost due to the Company’s intent to hold to maturity. The fair value of the Company’s short-term investments is determined based on quoted prices for similar instruments in active markets. The Company believes the carrying amounts of other receivables and accounts payable approximate fair value. The fair value of the long-term tenant allowance receivables was determined by discounting them to present value using an incremental borrowing rate of 9.26% over their five year period, and they are included in other assets within the consolidated balance sheet. The Company determined the fair value of its embedded derivative instrument using a combination of the Black-Scholes model and Monte-Carlo simulation. The estimated fair values for the Notes and Preferred Stock were determined to be the market value of the Company’s Class A common stock as of January 30, 2010, multiplied by the number of shares of common stock into which such securities could be converted. There are no longer any embedded derivatives, Notes or Preferred Stock outstanding as of January 29, 2011, as a result of the conversions discussed in Note 5.
F-34
Table of Contents
THE WET SEAL, INC.
NOTES TO CONSOLIDATED FINANCIAL STATEMENTS (Continued)
For the fiscal years ended January 29, 2011, January 30, 2010, and January 31, 2009
NOTE 8: Fair Value of Financial Instruments (Continued)
The table below segregates all non-financial assets and liabilities as of January 29, 2011, and January 30, 2010 that are measured at fair value on a nonrecurring basis in periods subsequent to initial recognition into the most appropriate level within the fair value hierarchy based on the inputs used to determine the fair value at the measurement date:
| Carrying Amount as of January 29, 2011 |
Fair Value Measurements at Reporting Date Using |
Total Gains (Losses) |
||||||||||||||||||
| Level 1 | Level 2 | Level 3 | ||||||||||||||||||
| Long-lived assets held and used |
$ | 88,720 | $ | — | $ | — | $ | 88,720 | $ | (4,228 | ) | |||||||||
| Total assets |
$ | 88,720 | $ | — | $ | — | $ | 88,720 | $ | (4,228 | ) | |||||||||
| Carrying Amount as of January 30, 2010 |
Fair Value Measurements at Reporting Date Using |
Total Gains (Losses) |
||||||||||||||||||
| Level 1 | Level 2 | Level 3 | ||||||||||||||||||
| Long-lived assets held and used |
$ | 78,063 | $ | — | $ | — | $ | 78,063 | $ | (2,341 | ) | |||||||||
| Total assets |
$ | 78,063 | $ | — | $ | — | $ | 78,063 | $ | (2,341 | ) | |||||||||
The Company performs impairment tests whenever there are indicators of impairment. Refer to Note 1 for further information.
NOTE 9: Related-Party Transactions
The Company had a member of its Board of Directors that was a senior partner with the law firm of Akin Gump Strauss Hauer and Feld LLP (“Akin Gump”) until his retirement from Akin Gump in April 2007. This board member resigned from the Board of Directors in December 2009. In fiscal years 2009 and 2008, the Company incurred fees of $0.7 million and $0.5 million, respectively, for legal services from Akin Gump. The accrual for incurred but unpaid fees to Akin Gump included in accrued liabilities on the consolidated balance sheet was $0.6 million and $0.2 million as of January 29, 2011, and January 30, 2010, respectively.
NOTE 10: Retirement Plan
The Company maintains a qualified defined contribution retirement plan under the Internal Revenue Code Section 401(k). The Wet Seal Retirement Plan (the “Retirement Plan”) is available to all employees who meet the Retirement Plan’s eligibility requirements. The Retirement Plan is funded by employee and employer contributions. The Company provides an immediately vesting Company match of 100% on the employee’s first 3% of deferral and 50% on the employee’s next 2% of deferral. In fiscal 2010, 2009, and 2008, the Company incurred expense for matching contributions of $0.6 million, $0.6 million, and $0.7 million, respectively.
NOTE 11: Supplemental Employee Retirement Plan
The Company maintains a defined benefit Supplemental Employee Retirement Plan (the “SERP”) for a former Chairman of the board of directors of the Company. The SERP provides for retirement death benefits and for retirement benefits through life insurance. The Company funded the SERP in prior years through contributions to a trust fund known as a “Rabbi” trust. Funds are held in a Rabbi trust for the SERP consisting of
F-35
Table of Contents
THE WET SEAL, INC.
NOTES TO CONSOLIDATED FINANCIAL STATEMENTS (Continued)
For the fiscal years ended January 29, 2011, January 30, 2010, and January 31, 2009
NOTE 11: Supplemental Employee Retirement Plan (Continued)
a life insurance policy reported at cash surrender value. In accordance with applicable accounting standards, the assets and liabilities of a Rabbi trust must be accounted for as if they are assets and liabilities of the Company. The assets held in the Rabbi trust are not available for general corporate purposes. In addition, all earnings and expenses of the Rabbi trust are reported in the Company’s consolidated statements of operations. The cash surrender value of such life insurance policy was $1.5 million and $1.4 million at January 29, 2011, and January 30, 2010, respectively, and is included in other assets in the Company’s consolidated balance sheets.
Effective January 1, 2005, a former Chairman of the Board of Directors of the Company began to receive an annual pension, payable in monthly installments, pursuant to the SERP of $220,000.
Applicable accounting standards require an entity to recognize in its consolidated balance sheet an asset for a defined benefit postretirement plan’s overfunded status or a liability for a plan’s underfunded status as of the end of the entity’s fiscal year, and recognize changes in the funded status of a defined benefit postretirement plan in comprehensive income in the year in which the changes occur. The Company recorded decreases of $0.1 million in each of fiscal 2010 and fiscal 2009 and less than $0.1 million in fiscal 2008 to accumulated other comprehensive income.
The following presents a reconciliation of the SERP’s funded status and certain other SERP information (in thousands):
| January 29, 2011 |
January 30, 2010 |
|||||||
| Benefit obligation at beginning of year |
$ | 1,985 | $ | 1,981 | ||||
| Interest cost |
103 | 112 | ||||||
| Actuarial loss |
115 | 112 | ||||||
| Benefits paid |
(220 | ) | (220 | ) | ||||
| Benefit obligation at end of year |
$ | 1,983 | $ | 1,985 | ||||
| Funded status |
$ | (1,983 | ) | $ | (1,985 | ) | ||
| Unrecognized prior-service cost |
— | — | ||||||
| Unrecognized actuarial gain |
— | — | ||||||
| Net amount recognized |
$ | (1,983 | ) | $ | (1,985 | ) | ||
| Weighted-average assumptions: |
||||||||
| Discount rate |
5.00 | % | 5.50 | % | ||||
| Expected return on plan assets |
n/a | n/a | ||||||
| Rate of compensation increase |
n/a | n/a | ||||||
The amounts recognized in accumulated other comprehensive income for fiscal 2010, fiscal 2009 and fiscal 2008 on the consolidated balance sheets consist of the following (in thousands):
| Fiscal 2010 | Fiscal 2009 | Fiscal 2008 | ||||||||||
| Net actuarial loss |
$ | 115 | $ | 112 | $ | 12 | ||||||
F-36
Table of Contents
THE WET SEAL, INC.
NOTES TO CONSOLIDATED FINANCIAL STATEMENTS (Continued)
For the fiscal years ended January 29, 2011, January 30, 2010, and January 31, 2009
NOTE 11: Supplemental Employee Retirement Plan (Continued)
The components of net periodic pension cost for fiscal 2010, fiscal 2009 and fiscal 2008 are as follows (in thousands):
| Fiscal 2010 | Fiscal 2009 | Fiscal 2008 | ||||||||||
| Interest cost |
$ | 103 | $ | 112 | $ | 113 | ||||||
| Amortization of actuarial gain |
(16 | ) | (25 | ) | (26 | ) | ||||||
| Net periodic pension cost |
$ | 87 | $ | 87 | $ | 87 | ||||||
NOTE 12: Net Income Per Share
Net income per share, basic, is computed based on the weighted-average number of common shares outstanding for the period, including consideration of the two-class method with respect to certain of the Company’s other equity securities (see below). Net income per share, diluted, is computed based on the weighted-average number of common and potentially dilutive common equivalent shares outstanding for the period, also with consideration given to the two-class method.
The dilutive effect of stock warrants was determined using the “treasury stock” method, whereby exercise was assumed at the beginning of the reporting period and proceeds from such exercise were assumed to be used to purchase the Company’s Class A common stock at the average market price during the period. The dilutive effect of stock options is also determined using the “treasury stock” method, whereby proceeds from such exercise, unamortized compensation on share-based awards, and excess tax benefits arising in connection with share-based compensation are assumed to be used to purchase the common stock at the average market price during the period.
The Notes and Preferred Stock were convertible into shares of Class A common stock. Both of these securities included rights whereby, upon payment of dividends or other distributions to Class A common stockholders, the Notes and Preferred Stock would participate ratably in such distributions based on the number of common shares into which such securities were convertible at that time. Because of these rights, the Notes and Preferred Stock were considered to be participating securities requiring the use of the two-class method for the computation of earnings per share. For the dilutive computation, under the two-class method, determination of whether the Notes and Preferred Stock were dilutive was based on the application of the “if-converted” method. Although the Notes and Preferred Stock were fully converted and represented Class A common shares outstanding as of January 29, 2011, they were included in the computation of diluted earnings for fiscal 2010, with respect to the period they were outstanding prior to conversion. In fiscal 2010, 2009, and 2008, the effect of the Notes and Preferred Stock was not dilutive to the computation of diluted earnings per share.
While the Company historically has paid no cash dividends, participants in the Company’s equity compensation plans who were granted restricted stock and performance shares are allowed to receive cash dividends paid on unvested restricted stock and unvested performance shares. The Company’s unvested restricted stock and unvested performance shares also qualify as participating securities and are included in the computation of earnings per share pursuant to the two-class method. For the dilutive computation, under the two-class method, determination of whether the unvested share-based payment awards are dilutive is based on the application of the “treasury stock” method and whether the performance criteria has been met. In fiscal 2010, 2009, and 2008, the effect of the unvested share-based payment awards was anti-dilutive to the computation of diluted earnings per share.
F-37
Table of Contents
THE WET SEAL, INC.
NOTES TO CONSOLIDATED FINANCIAL STATEMENTS (Continued)
For the fiscal years ended January 29, 2011, January 30, 2010, and January 31, 2009
NOTE 12: Net Income Per Share (Continued)
The two-class method requires allocation of undistributed earnings per share among the common stock, Notes, Preferred Stock and unvested share-based payment awards based on the dividend and other distribution participation rights under each of these securities. The following table summarizes the allocation of undistributed earnings among common stock and other participating securities using the two-class method and reconciles the weighted average common shares used in the computation of basic and diluted earnings per share (in thousands, except share data):
| Fiscal 2010 | Fiscal 2009 | Fiscal 2008 | ||||||||||||||||||||||||||||||||||
| Net Income | Shares | Per Share Amount |
Net Income | Shares | Per Share Amount |
Net Income | Shares | Per Share Amount |
||||||||||||||||||||||||||||
| Basic earnings per share: |
||||||||||||||||||||||||||||||||||||
| Net income |
$ | 12,570 | $ | 86,870 | $ | 29,688 | ||||||||||||||||||||||||||||||
| Less: Undistributed earnings allocable to participating securities |
(274 | ) | (4,658 | ) | (1,873 | ) | ||||||||||||||||||||||||||||||
| Basic earnings per share |
$ | 12,296 | 99,255,952 | $ | 0.12 | $ | 82,212 | 95,685,557 | $ | 0.86 | $ | 27,815 | 93,172,635 | $ | 0.30 | |||||||||||||||||||||
| Diluted earnings per share: |
||||||||||||||||||||||||||||||||||||
| Net income |
$ | 12,570 | $ | 86,870 | $ | 29,688 | ||||||||||||||||||||||||||||||
| Less: Undistributed earnings allocable to participating securities |
(274 | ) | (4,633 | ) | (1,856 | ) | ||||||||||||||||||||||||||||||
| Effect of dilutive securities |
156,865 | 564,631 | 926,599 | |||||||||||||||||||||||||||||||||
| Diluted earnings per share |
$ | 12,296 | 99,412,817 | $ | 0.12 | $ | 82,237 | 96,250,188 | $ | 0.85 | $ | 27,832 | 94,099,234 | $ | 0.30 | |||||||||||||||||||||
The computations of diluted earnings per share excluded the following potentially dilutive securities exercisable or convertible into Class A common stock for the periods indicated because their effect would not have been dilutive.
| Fiscal 2010 | Fiscal 2009 | Fiscal 2008 | ||||||||||
| Stock options outstanding |
3,081,036 | 2,025,512 | 2,150,592 | |||||||||
| Performance share and nonvested restricted stock awards |
1,629,114 | 1,773,734 | 1,665,565 | |||||||||
| Stock issuable upon conversion of Notes |
495,727 | 3,111,113 | 3,948,541 | |||||||||
| Stock issuable upon conversion of Preferred Stock |
84,091 | 537,000 | 659,707 | |||||||||
| Stock issuable upon exercise of warrants— |
||||||||||||
| June 2004 warrants |
— | — | 1,906,957 | |||||||||
| Series E warrants |
— | 6,092,116 | 6,290,480 | |||||||||
| Total |
5,289,968 | 13,539,475 | 16,621,842 | |||||||||
On November 3, 2010, all of the Company’s remaining Series E warrants expired unexercised. As of January 29, 2011, no warrants to acquire the Company’s Class A common stock remain outstanding.
F-38
Table of Contents
THE WET SEAL, INC.
NOTES TO CONSOLIDATED FINANCIAL STATEMENTS (Continued)
For the fiscal years ended January 29, 2011, January 30, 2010, and January 31, 2009
NOTE 13: Segment Reporting
The Company operates exclusively in the retail apparel industry in which it sells fashionable and contemporary apparel and accessory items, primarily through mall-based chains of retail stores, to female consumers with a young, active lifestyle. The Company has identified two operating segments (“Wet Seal” and “Arden B”). Internet operations for Wet Seal and Arden B are included in their respective operating segments.
Information for fiscal 2010, 2009, and 2008 for the two reportable segments is set forth below (in thousands, except percentages):
| Fiscal 2010 |
Wet Seal | Arden B | Corporate and Unallocated |
Total | ||||||||||||
| Net sales |
$ | 486,959 | $ | 94,235 | $ | — | $ | 581,194 | ||||||||
| Percentage of consolidated net sales |
84 | % | 16 | % | — | 100 | % | |||||||||
| Operating income (loss) |
$ | 46,429 | $ | 8,384 | $ | (29,566 | ) | $ | 25,247 | |||||||
| Depreciation and amortization expense |
$ | 14,245 | $ | 1,619 | $ | 949 | $ | 16,813 | ||||||||
| Interest income |
$ | — | $ | — | $ | 337 | $ | 337 | ||||||||
| Interest expense |
$ | — | $ | — | $ | (3,045 | ) | $ | (3,045 | ) | ||||||
| Income (loss) before provision for income taxes |
$ | 46,429 | $ | 8,384 | $ | (32,274 | ) | $ | 22,539 | |||||||
| Total identifiable assets as of year-end |
$ | 256,427 | $ | 44,969 | $ | 67,136 | $ | 368,532 | ||||||||
| Capital expenditures |
$ | 18,603 | $ | 5,199 | $ | 6,925 | $ | 30,727 | ||||||||
| Fiscal 2009 |
Wet Seal | Arden B | Corporate and Unallocated |
Total | ||||||||||||
| Net sales |
$ | 465,630 | $ | 95,288 | $ | — | $ | 560,918 | ||||||||
| Percentage of consolidated net sales |
83 | % | 17 | % | — | 100 | % | |||||||||
| Operating income (loss) |
$ | 41,847 | $ | 9,107 | $ | (28,102 | ) | $ | 22,852 | |||||||
| Depreciation and amortization expense |
$ | 12,563 | $ | 1,619 | $ | 919 | $ | 15,101 | ||||||||
| Interest income |
$ | — | $ | — | $ | 487 | $ | 487 | ||||||||
| Interest expense |
$ | — | $ | — | $ | 973 | $ | 973 | ||||||||
| Income (loss) before benefit for income taxes |
$ | 41,847 | $ | 9,107 | $ | (28,588 | ) | $ | 22,366 | |||||||
| Total identifiable assets as of year-end |
$ | 235,235 | $ | 37,254 | $ | 75,181 | $ | 347,670 | ||||||||
| Capital expenditures |
$ | 17,182 | $ | 61 | $ | 4,061 | $ | 21,304 | ||||||||
| Fiscal 2008 |
Wet Seal | Arden B | Corporate and Unallocated |
Total | ||||||||||||
| Net sales |
$ | 491,052 | $ | 101,908 | $ | — | $ | 592,960 | ||||||||
| Percentage of consolidated net sales |
83 | % | 17 | % | — | 100 | % | |||||||||
| Operating income (loss) |
$ | 71,113 | $ | (9,754 | ) | $ | (29,202 | ) | $ | 32,157 | ||||||
| Depreciation and amortization expense |
$ | 10,548 | $ | 2,961 | $ | 1,009 | $ | 14,518 | ||||||||
| Interest income |
$ | — | $ | — | $ | 2,182 | $ | 2,182 | ||||||||
| Interest expense |
$ | — | $ | — | $ | 3,329 | $ | 3,329 | ||||||||
| Income (loss) before provision for income taxes |
$ | 71,113 | $ | (9,754 | ) | $ | (30,349 | ) | $ | 31,010 | ||||||
| Total identifiable assets as of year-end |
$ | 209,595 | $ | 37,540 | $ | 9,524 | $ | 256,659 | ||||||||
| Capital expenditures |
$ | 20,879 | $ | 642 | $ | 1,502 | $ | 23,023 | ||||||||
F-39
Table of Contents
THE WET SEAL, INC.
NOTES TO CONSOLIDATED FINANCIAL STATEMENTS (Continued)
For the fiscal years ended January 29, 2011, January 30, 2010, and January 31, 2009
NOTE 13: Segment Reporting (Continued)
The “Corporate and Unallocated” column is presented solely to allow for reconciliation of segment contribution and total identifiable asset amounts to consolidated operating income, interest income, interest expense, income before provision for income taxes, and total identifiable assets. Wet Seal and Arden B segment results include net sales, cost of sales, asset impairment, store closure costs, and other direct store and field management expenses, with no allocation of corporate overhead or interest income and expense.
Wet Seal operating segment results in fiscal 2009 includes $0.8 million of additional net sales resulting from the recognition of breakage on gift cards, gift certificates, and store credits, and during fiscal 2010, 2009, and 2008 include $3.6 million, $2.0 million and $0.5 million, respectively, of asset impairment charges.
Arden B operating segment results in fiscal 2009 includes $0.4 million of additional net sales resulting from the recognition of breakage on gift cards, gift certificates, and store credits, and in fiscal 2010, 2009, and 2008 include $0.6 million, $0.3 million, and $5.1 million, respectively, of asset impairment charges.
Corporate expenses in fiscal 2010 and fiscal 2008 include interest expense of $2.1 million and $1.9 million, respectively, as a result of accelerated write-off of discounts on Notes and deferred financing costs upon conversions of Notes and, in fiscal 2010, includes $0.7 million of interest expense for a conversion inducement associated with conversions of Notes and Preferred Stock. Additionally, corporate expenses in fiscal 2010 include $1.6 million in charges associated with the transition payment to the Company’s previous chief executive officer and recruiting fees for the Company’s new chief executive officer. Corporate total assets consist primarily of deferred income tax assets and net equipment and leasehold improvements located at the Company’s corporate offices and distribution facility, as well as receivables, prepaid expenses, and other miscellaneous assets not specifically related to the reporting segments.
NOTE 14: Unaudited Quarterly Financial Data
Summarized quarterly financial information for fiscal 2010 and 2009 is listed below (in thousands, except per-share data).
| Fiscal 2010 Quarter Ended | ||||||||||||||||
| May 1, 2010 |
July 31, 2010 |
October 30, 2010 |
January 29, 2011 |
|||||||||||||
| Net sales |
$ | 137,762 | $ | 131,541 | $ | 146,401 | $ | 165,490 | ||||||||
| Gross margin |
$ | 45,123 | $ | 38,382 | $ | 44,511 | $ | 51,891 | ||||||||
| Net income |
$ | 3,142 | $ | 1,615 | $ | 2,561 | $ | 5,252 | ||||||||
| Net income per share |
||||||||||||||||
| Basic |
$ | 0.03 | $ | 0.02 | $ | 0.03 | $ | 0.05 | ||||||||
| Diluted |
$ | 0.03 | $ | 0.02 | $ | 0.03 | $ | 0.05 | ||||||||
| Weighted-average number of shares of common stock outstanding |
||||||||||||||||
| Basic |
97,255,370 | 100,257,750 | 99,927,566 | 99,583,123 | ||||||||||||
| Diluted |
98,282,637 | 100,556,634 | 99,950,790 | 99,616,991 | ||||||||||||
| Cash dividends per share |
$ | — | $ | — | $ | — | $ | — | ||||||||
| Class A common stock market price data |
||||||||||||||||
| High |
$ | 5.15 | $ | 4.84 | $ | 3.71 | $ | 3.91 | ||||||||
| Low |
$ | 3.35 | $ | 3.30 | $ | 2.81 | $ | 3.11 | ||||||||
F-40
Table of Contents
THE WET SEAL, INC.
NOTES TO CONSOLIDATED FINANCIAL STATEMENTS (Continued)
For the fiscal years ended January 29, 2011, January 30, 2010, and January 31, 2009
NOTE 14: Unaudited Quarterly Financial Data (Continued)
| Fiscal 2009 Quarter Ended | ||||||||||||||||
| May 2, 2009 |
August 1, 2009 |
October 31, 2009 |
January 30, 2010 |
|||||||||||||
| Net sales |
$ | 132,009 | $ | 136,366 | $ | 141,546 | $ | 150,997 | ||||||||
| Gross margin |
$ | 39,181 | $ | 39,170 | $ | 41,029 | $ | 47,446 | ||||||||
| Net income |
$ | 5,029 | $ | 3,103 | $ | 4,514 | $ | 74,224 | ||||||||
| Net income per share |
||||||||||||||||
| Basic |
$ | 0.05 | $ | 0.03 | $ | 0.04 | $ | 0.73 | ||||||||
| Diluted |
$ | 0.05 | $ | 0.03 | $ | 0.04 | $ | 0.73 | ||||||||
| Weighted-average number of shares of common stock outstanding |
||||||||||||||||
| Basic |
95,390,238 | 95,594,834 | 95,685,372 | 96,071,786 | ||||||||||||
| Diluted |
95,812,691 | 96,159,261 | 96,405,850 | 96,542,059 | ||||||||||||
| Cash dividends per share |
$ | — | $ | — | $ | — | $ | — | ||||||||
| Class A common stock market price data |
||||||||||||||||
| High |
$ | 4.12 | $ | 4.60 | $ | 4.07 | $ | 3.76 | ||||||||
| Low |
$ | 2.02 | $ | 2.77 | $ | 3.15 | $ | 2.88 | ||||||||
The fiscal quarters ended May 1, 2010, July 31, 2010, October 30, 2010 and January 29, 2011, include a $0.1 million, $1.0 million, $1.6 million and $1.5 million in charges, respectively, to record the impairment of certain retail store equipment and leasehold improvement assets. The fiscal quarter ended May 1, 2010, includes a non-cash interest expense of $2.1 million as a result of accelerated write-off of remaining unamortized debt discount and deferred financing costs upon conversion of Notes and $0.7 million of interest expense for a conversion inducement associated with conversions of Notes and Preferred Stock. The fiscal quarters ended July 31, 2010, October 30, 2010 and January 29, 2011, include a $0.4 million, $0.3 million and $0.9 million in charges, respectively, to record charges associated with the transition payment to the Company’s previous chief executive officer and recruiting fees for the Company’s new chief executive officer.
The fiscal quarter ended August 1, 2009, includes a $1.2 million benefit to net sales to recognize the change in timing of when breakage of gift cards, gift certificates and store credits is recorded from greater than three years after their issuance date to greater than two years after their issuance date, and a $1.6 million charge to record the impairment of certain retail store equipment and leasehold improvement assets. The fiscal quarters ended October 31, 2009 and January 30, 2010, include $0.3 million and $0.4 million in charges, respectively, to record the impairment of certain retail store equipment and leasehold improvement assets. The fiscal quarter ended May 2, 2009, includes a $0.9 million benefit due to the modification of the estimated annual forfeiture rate used in recognizing stock-based compensation expense, from a 10% forfeiture rate to a 15% forfeiture rate.
The fiscal quarters ended May 2, 2009, August 1, 2009 and October 31, 2009, include an effective income tax rate of 3.3%, 3.0% and 2.7%, respectively, related to a limited portion of federal alternative minimum taxes that cannot be offset by NOL carry forwards, income taxes in the State of California, which cannot be offset by NOL carry forwards, and certain other state income taxes. During the fourth quarter of fiscal 2009 the Company determined based upon the balance of positive and negative evidence, that it was more likely than not that substantially all of its net deferred tax assets will be realized in the future and the Company reversed $64.7 million of valuation allowance on its deferred tax assets, all of which was recorded to the (benefit) provision for income taxes on the consolidated statement of operations. As a result of this reversal, the fiscal quarters ended May 1, 2010, July 31, 2010, October 30, 2010 and January 29, 2011 incurred higher effective income tax rates than the 2009 fiscal quarters.
F-41