Attached files
Table of Contents
UNITED STATES
SECURITIES AND EXCHANGE COMMISSION
Washington, D.C. 20549
FORM 10-K
(Mark One)
| þ | ANNUAL REPORT PURSUANT TO SECTION 13 OR 15(d) OF THE SECURITIES EXCHANGE ACT OF 1934 |
For the fiscal year ended December 31, 2010
or
| ¨ | TRANSITION REPORT PURSUANT TO SECTION 13 OR 15(d) OF THE SECURITIES EXCHANGE ACT OF 1934 |
For the transition period from to .
Commission File Number 001-33092
LEMAITRE VASCULAR, INC.
(Exact name of registrant as specified in its charter)
| Delaware | 04-2825458 | |
| (State or other jurisdiction of incorporation or organization) | (I.R.S. Employer Identification No.) | |
| 63 Second Avenue, Burlington, Massachusetts | 01803 | |
| (Address of principal executive offices) | (Zip Code) |
Registrant’s telephone number, including area code 781-221-2266
Securities registered under Section 12(b) of the Act:
| Title of each class |
Name of each exchange on which registered | |
| Common Stock, $0.01 par value per share | The NASDAQ Stock Market LLC |
Securities registered under Section 12(g) of the Act: None
Indicate by check mark if the registrant is a well-known seasoned issuer, as defined in Rule 405 of the Securities Act. Yes: ¨ No: þ
Indicate by check mark if the registrant is not required to file reports pursuant to Section 13 or Section 15(d) of the Act. Yes: ¨ No: þ
Indicate by check mark whether the registrant (1) has filed all reports required to be filed by Section 13 or 15(d) of the Securities Exchange Act of 1934 during the preceding 12 months (or for such shorter period that the registrant was required to file such reports), and (2) has been subject to such filing requirements for the past 90 days. Yes: þ No: ¨
Indicate by check mark whether the registrant has submitted electronically and posted on its corporate Web site, if any, every Interactive Data File required to be submitted and posted pursuant to Rule 405 of Regulation S-T (§232.405 of this chapter) during the preceding 12 months (or for such shorter period that the registrant was required to submit and post such files). Yes ¨ No ¨
Indicate by check mark if disclosure of delinquent filers pursuant to Item 405 of Regulation S-K (§229.405 of this chapter) is not contained herein, and will not be contained, to the best of registrant’s knowledge, in definitive proxy or information statements incorporated by reference in Part III of this Form10-K or any amendment to this Form 10-K. ¨
Indicate by check mark whether the registrant is a large accelerated filer, an accelerated filer, a non-accelerated filer, or a smaller reporting company. See the definitions of “large accelerated filer,” “accelerated filer,” and “smaller reporting company” in Rule12b-2 of the Exchange Act.
Large accelerated filer ¨ Accelerated filer ¨ Non-accelerated filer ¨ (Do not check if a small reporting company) Smaller reporting company þ
Indicate by check mark whether the registrant is a shell company (as defined in Rule12b-2 of the Act). Yes: ¨ No: þ
The aggregate market value of the voting and non-voting common stock held by non-affiliates of the registrant, based on the last sale price for such stock on June 30, 2010: $48,347,712. The number of shares held by stockholders whose ownership exceeds 5% of the registrant’s common stock outstanding at June 30, 2010 is based on Schedules 13D and 13G filed by such stockholders for the year ended December 31, 2009 and subsequent reports, if any, filed by such stockholders pursuant to Section 16 of the Securities Exchange Act of 1934, as amended. Exclusion of such shares should not be construed to indicate that any such person possesses the power, direct or indirect, to direct or cause the direction of the management or policies of the registrant or that such person is controlled by or under common control with the registrant. At March 23, 2011, the registrant had 15,466,207 shares of common stock, par value $0.01 per share, outstanding.
DOCUMENTS INCORPORATED BY REFERENCE
Part III of this Form 10-K incorporates information by reference from the registrant’s definitive proxy statement to be filed with the Securities and Exchange Commission within 120 days after the close of the fiscal year covered by this annual report.
Table of Contents
2010 FORM 10-K ANNUAL REPORT
TABLE OF CONTENTS
| Item 1. |
2 | |||||
| Item 1A. |
19 | |||||
| Item 1B. |
40 | |||||
| Item 2. |
40 | |||||
| Item 3. |
41 | |||||
| Item 4. |
41 | |||||
| Item 5. |
42 | |||||
| Item 6. |
45 | |||||
| Item 7. |
Management’s Discussion and Analysis of Financial Condition and Results of Operations |
46 | ||||
| Item 7A. |
64 | |||||
| Item 8. |
64 | |||||
| Item 9. |
Changes In and Disagreements With Accountants on Accounting and Financial Disclosure |
64 | ||||
| Item 9A. |
64 | |||||
| Item 9B. |
65 | |||||
| Item 10. |
66 | |||||
| Item 11. |
66 | |||||
| Item 12. |
Security Ownership of Certain Beneficial Owners and Management and Related Stockholder Matters |
66 | ||||
| Item 13. |
Certain Relationships and Related Transactions, and Director Independence |
67 | ||||
| Item 14. |
67 | |||||
| Item 15. |
68 | |||||
| 71 | ||||||
Table of Contents
SPECIAL NOTE REGARDING FORWARD-LOOKING STATEMENTS
This Annual Report on Form 10-K contains forward-looking statements (within the meaning of the federal securities law) that involve substantial risks and uncertainties. All statements, other than statements of historical facts, included in this Annual Report on Form 10-K regarding our strategy, future operations, future financial position, future net sales, projected costs, projected expenses, prospects and plans and objectives of management are forward-looking statements. The words “anticipates,” “believes,” “estimates,” “expects,” “intends,” “may,” “plans,” “projects,” “will,” “would,” and similar expressions are intended to identify forward-looking statements, although not all forward-looking statements contain these identifying words. We have based these forward-looking statements on our current expectations and projections about future events. Although we believe that the expectations underlying any of our forward-looking statements are reasonable, these expectations may prove to be incorrect, and all of these statements are subject to risks and uncertainties. Should one or more of these risks and uncertainties materialize, or should underlying assumptions, projections, or expectations prove incorrect, actual results, performance, or financial condition may vary materially and adversely from those anticipated, estimated, or expected. We have identified below some important factors that could cause our forward-looking statements to differ materially from actual results, performance, or financial conditions:
| • | the unpredictability of our quarterly net sales and results of operations; |
| • | our ability to keep pace with a rapidly evolving marketplace and to develop or acquire and then successfully market new and enhanced products; |
| • | our ability to successfully identify, acquire, and integrate new products, businesses, and technologies and realize expected benefits; |
| • | our ability to compete in the medical device industry; |
| • | the effect of a disaster at any of our manufacturing facilities; |
| • | the loss of any significant suppliers, especially sole-source suppliers; |
| • | the loss of any distributor or any significant customer, especially in regard to any product that has a limited distributor or customer base; |
| • | our ability to adequately grow our operations and attain sufficient operating scale; |
| • | our ability to obtain adequate profit margins; |
| • | our ability to effectively protect our intellectual property and not infringe on the intellectual property of others; |
| • | our determination whether or not to continue the payment of quarterly cash dividends; |
| • | possible product liability lawsuits and product recalls; |
| • | inadequate levels of third-party reimbursement to healthcare providers; |
| • | our ability to obtain and maintain U.S. and foreign regulatory clearance for our products and our manufacturing operations; |
| • | our ability to raise sufficient capital when necessary or at satisfactory valuations; |
| • | loss of key personnel; and |
| • | other factors discussed elsewhere in this Annual Report on Form 10-K. |
We may not actually achieve the plans, intentions, or expectations disclosed in our forward-looking statements and you should not place undue reliance on our forward-looking statements. We have included important factors in the cautionary statements included in this Annual Report on Form 10-K, particularly in the
1
Table of Contents
section entitled “Risk Factors,” that we believe could cause actual results or events to differ materially from the forward-looking statements that we make. Our forward-looking statements do not reflect the potential impact of any future acquisitions, mergers, dispositions, joint ventures, or investments we may make. We do not assume any obligation to update any forward-looking statements, whether as a result of new information, future events, or otherwise, except as required by law.
The following discussion should be read in conjunction with our financial statements and the related notes contained elsewhere in this Annual Report on Form 10-K and in our other Securities and Exchange Commission filings.
Unless the context requires otherwise, references to “LeMaitre Vascular,” “we,” “our,” and “us” in this Annual Report on Form 10-K refer to LeMaitre Vascular, Inc. and its subsidiaries.
LeMaitre, AlboGraft, AnastoClip, AnastoClip GC, EndoHelix, EndoRE, Expandable LeMaitre Valvulotome, Flexcel, Glow ‘N Tell, Grice, Inahara-Pruitt, InvisiGrip, LeverEdge, LifeSpan, MollRing Cutter, NovaSil, Periscope, Pruitt, Pruitt F3, Pruitt-Inahara, Reddick, TAArget, TT, UniFit, VascuTape, XenoSure, and the LeMaitre Vascular logo are registered trademarks of LeMaitre Vascular, and AlboSure, Martin, Reddick-Saye, UnBalloon and VCS are unregistered trademarks of LeMaitre Vascular. This Annual Report on Form 10-K also includes the registered and unregistered trademarks of other persons.
| Item 1. | Business |
Overview
LeMaitre Vascular is a global provider of medical devices and implants for the treatment of peripheral vascular disease. We develop, manufacture, and market vascular devices to address the needs of vascular surgeons. Our diversified portfolio of peripheral vascular devices consists of brand name products that are used in arteries and veins outside of the heart and are well known to vascular surgeons, including the Expandable LeMaitre Valvulotome, the Pruitt F3 Carotid Shunt, and VascuTape Radiopaque Tape.
We have grown our business by using a three-pronged strategy: competing in niche markets, expanding our worldwide direct sales force, and acquiring and developing complementary vascular devices. Since 1998 we have built our sales force from zero to 67 direct sales representatives and we have completed a number of vascular device acquisitions.
We estimate that peripheral vascular disease affects more than 20 million people worldwide. We estimate that the annual worldwide market for all peripheral vascular devices is approximately $3 billion and that the annual worldwide market addressed by our core product lines approximates $750 million. We believe that this market will grow due to the increase in the incidence and diagnosis of peripheral vascular disease, a shift to higher priced endovascular devices, and the adoption of western healthcare standards by the developing world. We believe that our strong brands, established sales force, evolving suite of peripheral vascular devices, and broad network of vascular surgeon customers position us to capture an increasing share of this large and growing market.
We sell 13 product lines, most of which are used in open vascular surgery and some of which are used in endovascular procedures. No single product line accounts for more than 25% of our revenues.
Historically, we have been a leading provider of vascular surgery products in niche product markets characterized by low or limited competition. More recently we have sought to leverage our market leadership in these niche product markets by selling complementary products in more competitive, larger market segments. In addition, our vascular surgeon customers are increasingly performing minimally invasive endovascular procedures, presenting us with attractive opportunities to sell new devices that address their changing product needs.
2
Table of Contents
We sell our products primarily through a direct sales force. Our sales force was comprised of 67 field sales representatives in North America, the European Union, and Japan as of December 31, 2010. We also sell our products through a network of distributors in countries where we do not have a direct sales force. For the year ended December 31, 2010, approximately 93% of our net sales were generated through our direct sales force, and no single customer accounted for more than 2% of our net sales.
The Peripheral Vascular Device Market
We estimate that peripheral vascular disease affects more than 20 million people worldwide. The disease encompasses a number of conditions in which the arteries or veins that carry blood to or from the legs, arms, or organs other than the heart become narrowed, obstructed, weakened, or otherwise compromised. In many cases peripheral vascular disease goes undetected, sometimes leading to life-threatening events—such as stroke, ruptured aneurysm, or pulmonary embolism—or death.
Clinical studies have identified several factors that increase the risk of peripheral vascular disease, including smoking, diabetes, obesity, high blood pressure, lack of exercise, coronary artery disease, high cholesterol, and being over the age of 65. Demographic trends suggest an increase in the prevalence of peripheral vascular disease over time, driven primarily by rising levels of obesity and diabetes and an aging population.
Vascular surgeons treat peripheral vascular disease and also perform vascular procedures associated with other diseases, such as end-stage renal disease. We estimate that there are more than 2,000 board-certified vascular surgeons and several thousand general surgeons who perform vascular procedures in the United States, and that there are more than 3,000 vascular surgeons in Europe and Japan. In contrast to other medical specialists, such as interventional cardiologists and interventional radiologists, vascular surgeons perform both conventional vascular surgeries and endovascular procedures. Conventional vascular surgery involves opening the body, cutting vessels, and suturing. Endovascular procedures typically are minimally invasive, catheter-based procedures involving repairing vessels from within using real-time imaging technologies.
Our History
We were founded in 1983 by George D. LeMaitre, M.D., a vascular surgeon who designed and developed the predecessor to our Expandable LeMaitre Valvulotome. Through a combination of strategic acquisitions and research and development efforts, we have expanded to 13 product lines.
We have conducted several acquisitions of complementary products since 1998:
| Year |
Acquisition |
Key Product(s) | ||
| 1998 | Whittaker Screen Printing | Radiopaque tape manufacturing operations | ||
| 1999 | Vermed | Balloon catheters | ||
| 2001 | Ideas for Medicine | Carotid shunts, balloon catheters, and laparoscopic cholecystectomy devices | ||
| 2003 | Credent | Vascular access grafts | ||
| 2004 | VCS Clip | Vessel closure system | ||
| 2005 | Endomed | Thoracic and abdominal stent grafts | ||
| 2007 | Vascular Innovations | Contrast injector | ||
| 2007 | Vascular Architects | Remote endarterectomy devices | ||
| 2007 | UnBalloon Technology | Stent graft modeling catheters | ||
| 2007 | Biomateriali | Polyester grafts and patches | ||
| 2008 | XenoSure(1) | Biologic vascular patch(1) | ||
| 2010 | LifeSpan | ePTFE grafts |
| (1) | We obtained exclusive rights to distribute this product under our “XenoSure” brand in the United States and most of Europe until January 26, 2016, and an option to acquire this product commencing January 2, 2014 and expiring January 26, 2016. If we do not meet our obligations under our distribution agreement with the manufacturer, the manufacturer could terminate the agreement, and we would lose our purchase option to acquire this product. |
3
Table of Contents
We have relocated most of the manufacturing operations associated with these acquisitions to our Burlington, Massachusetts, headquarters and we continue to look at ways to make our operations more efficient.
Prior to 1999, we had no direct sales force and instead relied on direct marketing to generate brand awareness and product loyalty. In 1999, we began building a direct sales organization that we have continued to expand, most recently into the French and Italian markets in 2007 and 2008, respectively. We currently sell products directly to our hospital customers in the United States and Canada, Japan, and most major European markets. In furtherance of this strategy, we intend to initiate direct sales in Spain and Denmark in 2011.
Our Business Strategies
Our goal is to be the leading global provider of medical devices to vascular surgeons.
To achieve this objective, we are utilizing the following long-term strategies:
| • | Focus on niche markets. We seek to build and maintain market-leading share positions in niche product markets. We believe that the relative lack of competitive focus on these markets by larger competitors with greater resources, and the differentiated features and consistent quality of our products, allow for higher selling prices in these markets. In recent years we have sought to leverage these market-leading share positions by selling complementary products in more competitive, larger market segments. |
| • | Expand Our Direct Sales Force. We sell our products primarily through a direct sales force in North America, the European Union, and Japan. We intend to further expand our sales force over time. We believe that direct-to-hospital sales build closer customer relationships, allow for higher selling prices, and are not subject to the risk of customer churn resulting from distributor turnover. |
| • | Add Complementary Products through Acquisitions, Research and Development, and Additional Regulatory Approvals. We intend to further expand and diversify our product offerings and add new technology platforms. We believe our significant experience in acquiring and integrating product lines and businesses is one of our competitive advantages. We actively track industry developments and plan to acquire additional product lines and businesses, refine our current product lines, develop new applications for our existing technologies, and obtain regulatory approvals for our devices in new markets in order to further access the broader peripheral vascular device market. |
4
Table of Contents
Our Products
The following table describes the primary use and availability of each of our product lines as of March 30, 2011:
| Generally Available for Sale in(1) | ||||||||||
| Product Category |
Product Line |
Primary Use |
United States |
European Union |
Japan | |||||
| Vascular |
Balloon Catheters - LeMaitre Embolectomy Catheters - Over-the-Wire Embolectomy Catheters - NovaSil Embolectomy Catheters - Pruitt Occlusion Catheters - Distal Perfusion Catheter |
Removal of blood clots; occlusion, and facilitation of blood flow | ü | ü | ü | |||||
| Carotid Shunts - Pruitt F3 Carotid Shunts - Pruitt- Inahara Carotid Shunts - Flexcel Carotid Shunts |
Facilitation of blood flow to brain during carotid plaque removal | ü | ü | ü | ||||||
| Remote Endarterectomy Devices - MollRing Cutter Transection Device - Martin Dissector - EndoHelix Retrieval Device - Periscope Dissector - Ring Stripper |
Removal of blockages in the major arteries of the leg | ü | ü | |||||||
| Valvulotomes - Expandable LeMaitre Valvulotome |
Destruction of vein valves to create vein bypass grafts | ü | ü | ü | ||||||
| Vascular Grafts - AlboGraft Knitted Vascular Grafts - AlboGraft Woven Vascular Grafts - LifeSpan ePTFE Vascular Grafts |
Synthetic vessels for use in bypass and replacement procedures | ü | ü | ü | ||||||
| Vascular Patches(2) - AlboSure Vascular Patches - XenoSure Biologic Patches |
Synthetic and biological patches for use in closing incisions in a blood vessel | ü | ü | |||||||
| Vein Strippers - InvisiGrip Vein Stripper |
Single-incision removal of varicose veins | ü | ü | ü | ||||||
| Vessel Closure Systems - AnastoClip VCS Vessel Closure System - AnastoClip GC Vessel Closure System - Accessory Devices |
Attachment of blood vessels, primarily for dialysis access | ü | ü | ü | ||||||
| Endovascular |
Aortic Stent Grafts(3) - TAArget Thoracic Stent Graft - UniFit Abdominal Stent Graft - Cuffs and Extenders - TT Tortuous Tracker Introducer System |
Endovascular repair of abdominal and thoracic aortic aneurysms and thoracic dissections | In clinical studies |
ü | Preparing regulatory submission | |||||
| Manual Contrast Injectors - LeverEdge Contrast Injector |
Injection of contrast media into blood vessels | ü | ü | |||||||
| Modeling Catheters - The UnBalloon Non-Occlusive Modeling Catheter |
Improvement in the seal of aortic stent grafts | Application submitted (4) |
Application submitted (4) |
Application submitted | ||||||
| Radiopaque Tape - Glow ‘n’ Tell Tape - LeMaitre Stent Guide |
Improvement in precision of vascular and endovascular procedures | ü | ü | ü | ||||||
| General Surgery |
Laparoscopic Cholecystectomy Devices - Reddick Cholangiogram Catheter - Reddick-Saye Screw Retractor Kit - Grice Laparoscopic Suture Needle |
Introduction of dye into the cystic duct; related uses | ü | ü | ü | |||||
5
Table of Contents
| (1) | Due to varying regulatory schemes and product introduction timelines, it may be that only some models within the applicable product line are approved for sale in the indicated market. For example, in our Vascular Grafts product line, our LifeSpan ePTFE Vascular Graft is available for sale in the United States, the European Union and Japan, but our AlboGraft products are not yet available for sale in Japan. |
| (2) | Our synthetic patch, the AlboSure Vascular Patch, is not yet commercially available. We intend to begin selling this device in the second half of 2011. Our XenoSure Biologic Vascular Patch is manufactured by Neovasc Inc. We have exclusive rights to distribute this product under our “XenoSure” brand in the United States and most of Europe until January 26, 2016, and an option to acquire this product commencing January 2, 2014 and expiring January 26, 2016. If we do not meet our obligations under our distribution agreement with the manufacturer, the manufacturer could terminate the agreement, and we would lose our purchase option to acquire this product. |
| (3) | In October 2010, we discontinued research and development activities and suspended clinical studies related to our aortic stent grafts, and in January 2011, we initiated a process to potentially divest these products. There can be no assurance that we will be successful in divesting these products on terms acceptable to us. |
| (4) | We withdrew The UnBalloon Non-Occlusive Modeling Catheter from the market in 2010 in order to resolve a design issue and improve user convenience. We have revised the device and have submitted applications for 510(k) clearance and for the Conformité Européenne (CE mark), with the U.S Food and Drug Administration (FDA) and with our Notified Body, respectively. |
We also distribute the Powerlink System, a bifurcated abdominal stent graft manufactured by Endologix, Inc., and ArterX Vascular Sealant, a surgical sealant manufactured by Tenaxis Medical, Inc., in several European countries, and from time to time we engage in a limited amount of private label manufacturing. Endologix has stated that it intends to create its own direct sales organization in Europe and we believe it is unlikely that our agreement with Endologix will be extended past its current June 30, 2013 expiration.
Vascular Products
Our vascular products are used primarily in open vascular surgery for the treatment of peripheral vascular disease. Descriptions of our primary vascular product offerings follow.
Balloon Catheters for Embolectomy, Occlusion and Perfusion
Our LeMaitre line of embolectomy catheters are used to remove blood clots from arteries or veins. We manufacture single-lumen latex and latex-free embolectomy catheters as well as dual-lumen latex embolectomy catheters. The dual-lumen embolectomy catheter allows clot removal and simultaneous irrigation or guide-wire trackability. Occlusion catheters temporarily occlude blood flow to allow the vascular surgeon time and space to complete a given procedure. Perfusion catheters temporarily perfuse blood and other liquids into the vasculature. Our Pruitt line of occlusion and perfusion catheters reduces vessel trauma by using internal balloon fixation rather than traditional external clamp fixation.
Carotid Shunts
Our Pruitt F3, Pruitt-Inahara, Inahara-Pruitt, and Flexcel Carotid Shunts are used to temporarily divert, or shunt, blood to the brain while the surgeon removes plaque from the carotid artery in a carotid endarterectomy surgery. Our Pruitt F3, Pruitt-Inahara, and Inahara-Pruitt shunts feature internal balloon fixation that eliminates the need for clamps, thereby reducing vessel trauma. Our Flexcel shunt is a non-balloon shunt offered for surgeons who prefer to secure their shunt using externally placed clamps.
Remote Endarterectomy Devices
Our EndoRE line of remote endarterectomy devices are used to remove severe atherosclerotic blockages from the major arteries of the leg in a minimally invasive procedure requiring a single incision in the groin. Our
6
Table of Contents
EndoRE devices are used to separate the sclerotic blockage from the vessel, cut the far end of the blockage to free it for removal, and then withdraw the blockage from the vessel. A retrospective 133-patient clinical study published in the February 2006 Journal of Vascular Surgery found that, compared to bypass procedures, this minimally invasive procedure leads to less trauma to the patient and reduced hospital stays. It also preserves the patient’s own veins for future use in an unrelated bypass procedure.
Valvulotomes
Our Expandable LeMaitre Valvulotome cuts valves in the saphenous vein, a vein that runs from the ankle to the groin, so that it can function as a bypass vessel to carry blood past diseased arteries to the lower leg or the foot. The Expandable LeMaitre Valvulotome is the only self-sizing and self-centering valvulotome available. We believe that the Expandable LeMaitre Valvulotome reduces costs for hospitals by enabling less invasive bypass surgery to be performed with several one-inch incisions rather than one continuous ankle-to-groin incision, thereby reducing the length of hospital stays and the likelihood of wound complications. The Expandable LeMaitre Valvulotome is the sixth generation of the original valvulotome developed by our founder, George D. LeMaitre, M.D.
Vascular Grafts
Our AlboGraft Woven and Knitted Vascular Grafts are collagen-impregnated polyester grafts used to bypass or replace diseased arteries. They are available in both straight tube and bifurcated versions.
Our LifeSpan ePTFE Vascular Graft is an expanded polytetrafluoroethylene (ePTFE) graft used to bypass or replace diseased arteries, and to create dialysis access sites. They are available in both regular and thin wall options and with an optional full or partial external spiral support to increase resistance to compression or kinking. Our stepped and quick tapered LifeSpan models are designed to reduce the risk of steal syndrome and high cardiac output, which are complications that may arise in dialysis access grafts.
Vascular Patches
Our AlboSure Vascular Patch is a polyester patch used in conjunction with endarterectomy and vascular reconstructions. We have received regulatory clearance to market our AlboSure Vascular Patch in the United States and European Union and intend to begin selling this device in the second half of 2011. Vascular surgeons use patches in conjunction with carotid endarterectomy, remote endarterectomy, and other vascular reconstructions.
We also distribute the XenoSure Biologic Vascular Patch, a patch made from bovine pericardium. The patch is exceptionally strong, uniform and easy to handle and suture. We have exclusive rights to distribute this product under our “XenoSure” brand in the United States and most of Europe until January 26, 2016, and an option to acquire this product commencing January 2, 2014 and expiring January 26, 2016.
Vessel Closure Systems
Our AnastoClip VCS and AnastoClip GC Vessel Closure Systems allow surgeons to deploy titanium clips to attach vessels, native and prosthetic, to one another. These vessel closure systems create an interrupted anastomosis, or a vessel attachment that expands and contracts as the vessel pulses, which we believe improves the durability of the anastomosis.
A retrospective 1,110-patient clinical study published in the August 2003 Journal of Vascular Surgery found that the AnastoClip VCS Vessel Closure System improved 24-month patency versus traditional continuous sutures from approximately 34% to 54% in arterio-venous fistulae, which are surgical attachments of arteries and veins, and from approximately 17% to 36% in prosthetic grafts attachments. In 2010 we released the next-generation AnastoClip GC Vessel Closure System, with a new clip design that is intended to provide additional security and ease of use.
7
Table of Contents
Endovascular Products
Our endovascular products are used primarily by vascular surgeons in minimally invasive endovascular procedures, such as stent-grafting, angioplasty, stenting, and atherectomy. Descriptions of our primary endovascular product offerings follow.
Aortic Stent Grafts
Our TAArget Thoracic Stent Graft is an endovascular graft used to treat an aortic aneurysm, a weakening and ballooning of the aorta, or an aortic dissection, a separation of the layers of the aortic wall that often leads to rupture and death, in each case in the upper part of the aorta, known as the thoracic aorta. The TAArget Thoracic Stent Graft features our TT Tortuous Tracker Delivery System. TAArget’s flexible, encapsulated design uses ePTFE, which is designed to prevent the stent scaffolding from contacting either the blood stream or the vessel wall. This design also allows us to offer a wide range of stent grafts sizes, including tapered grafts, which fit a wider range of patient anatomies than many of our competitors’ products.
Our UniFit Abdominal Stent Graft is a non-bifurcated endovascular graft used to treat aneurysms in the lower part of the aorta, known as the abdominal aorta, and the iliac arteries. The UniFit device is similar in design to the TAArget device, with a flexible, encapsulated design and similar manufacturing advantages that allow us to offer a wide range of stent graft sizes and custom-built devices. The UniFit Abdominal Stent Graft is also available with the TT Tortuous Tracker Delivery System.
In October 2010, we discontinued research and development activities and suspended clinical studies related to our aortic stent grafts, and in January 2011 we initiated a process to potentially divest these products. There can be no assurance that we will be successful in divesting these products on terms acceptable to us.
Modeling Catheters
Our UnBalloon Non-Occlusive Modeling Catheter is used to apply radial pressure to the inside of an aortic stent graft in order to seal the outer lining of the stent graft against the interior wall of either the aorta or an adjacent stent graft. The physician expands the device’s nitinol mesh cage inside of the stent graft in order to appose the stent graft lining against the vessel or stent graft wall. An adequate seal will exclude blood flow from the aneurysm, thereby preventing an endoleak, a condition in which blood continues to enter the aneurismal sac, increasing the risk of aneurysm rupture and death. Unlike a balloon catheter, The UnBalloon catheter dilates the aortic stent graft without occluding blood flow, allowing the physician more time to repair an endoleak or model the stent graft while minimizing the risk of stent graft migration during modeling.
We withdrew The UnBalloon Non-Occlusive Modeling Catheter from the market in 2010 in order to resolve a design issue and improve user convenience. We have revised the device and have submitted applications for 510(k) clearance and for the Conformité Européenne (CE mark), with the U.S Food and Drug Administration (FDA) and with our Notified Body, respectively.
Radiopaque Tape
Our VascuTape Radiopaque Tape is a flexible, medical-grade tape with centimeter or millimeter markings printed with our proprietary radiopaque ink that is visible both to the eye and to an x-ray machine or fluoroscope. VascuTape Radiopaque Tape is applied to the skin and provides interventionalists with a simple way to cross-reference between the inside and the outside of a patient’s body, allowing them to accurately size or locate tributaries or lesions beneath the skin. VascuTape Radiopaque Tape enables smaller skin incisions, more accurate lesion location, more precise stent and catheter sizing, and reduced contrast injections.
General Surgery Products
In some community hospitals, vascular surgery procedures are performed by general surgeons. We sell non-vascular medical devices used in general surgery procedures, primarily laparoscopic cholecystectomy. Our
8
Table of Contents
leading general surgery product is the Reddick Cholangiogram Catheter, which is used to inject dye into the cystic duct during laparoscopic cholecystectomy. In this procedure, the gall bladder is dissected and removed through small punctures in the abdomen. We also offer two laparoscopic accessories used in laparoscopic gall bladder removal.
Clinical Studies
We conduct clinical studies from time to time in order to obtain regulatory approval and provide marketing data for our product lines. The goal of a clinical study is to evaluate the safety and/or clinical effectiveness of a device or the substantial equivalence to another device. We had two ongoing U.S. clinical studies related to our aortic stent grafts. In October 2010, we suspended enrollment in both of these clinical studies, and in January 2011 we initiated a process to potentially divest these products. Although we have suspended these studies, FDA regulations require that we continue to monitor study subject who are already enrolled for five years.
Sales and Marketing
As of December 31, 2010, we employed 67 field sales representatives. We believe that the expansion of our direct sales force has been a key factor in our success and it remains one of our primary long-term strategies. In recent years, we have reduced the amount of starting compensation that we typically pay to our sales representatives, and this savings has helped facilitate the hiring of additional sales personnel. Outside our direct markets, we generally sell our products through a network of country-specific distributors. We typically sign exclusive distribution agreements with terms of up to three years specifying minimum annual sales volumes and pricing. These agreements are renewable by mutual agreement.
In addition, we engage in direct marketing efforts, including direct mail and exhibitions at medical congresses, which we believe are important to our brand development and continued success. We believe that direct marketing allows us to market to vascular surgeons beyond the reach of our direct sales force.
Research and Development
Our research and development has historically focused on developing enhancements and extensions to our existing product lines. Our current product development efforts are largely focused on the vascular space, including improvements to our existing devices. In recent years we have increased investment in product research and development, with the goal of more rapidly developing new products, line extensions, and next-generation devices.
Our products are subject to our design control procedures throughout the various stages of product development. These procedures may include bench testing, animal testing, human use testing conducted by independent physicians, and post-market surveillance of product performance, as appropriate. We may use feedback received from independent physicians to demonstrate product functionality, safety, and effectiveness before commencing full-scale marketing of any product.
For fiscal 2010, 2009, and 2008, our research and development expenditures, including clinical study expenditures, were $5.5 million, $5.9 million and $5.3 million, respectively, and represented between 10% and 12% of net sales. As of December 31, 2010, our research and development staff consisted of 15 full-time engineers and technicians.
Manufacturing
Our principal manufacturing facilities are located in Burlington, Massachusetts, where most of our product lines are produced in a 5,556 square foot ISO 14644-1 Class 8 clean room. We are in the process of relocating our AlboGraft Vascular Graft manufacturing operations from Brindisi, Italy, to a new 5,500 square foot ISO
9
Table of Contents
14644-1 Class 8 clean room in Burlington, Massachusetts. We manufacture our LifeSpan ePTFE Vascular Graft in a 2,500 square foot ISO 14644-1 Class 5 clean room located in Laguna Hills, California. In addition, third-parties manufacture our EndoRE remote endarterectomy devices as well as our distributed products.
We manufacture certain proprietary components, assemble most of our devices ourselves, and inspect, test, and package all of our finished products. By designing and manufacturing many of our products from raw materials, and assembling and testing as many of our subassemblies and products as practical, we believe that we can maintain better quality control, ensure compliance with applicable regulatory standards and our internal specifications, limit outside access to our proprietary technology, ensure adequate product supply, and make design modifications in a timely manner. We have custom-designed proprietary manufacturing and processing equipment and have developed proprietary enhancements for existing production machinery.
Nearly all of our products are built to stock. The only exceptions are those aortic stent grafts that we custom build for specific anatomies as requested by physicians.
Our management information systems provide us with the ability to evaluate our performance, collect business intelligence, and make better strategic decisions. These systems include order entry, invoicing, on-line inventory management, lot traceability, purchasing, shop floor control, and shipping and distribution analysis, as well as various accounting-oriented functions. During day-to-day operations, these systems enable us to track our products from the inception of an order through the manufacturing process and then through delivery of the product to the customer.
We purchase components from, and have certain product lines manufactured by, third parties. Most of our components are readily available from several supply sources, but we do rely on single- and limited-source suppliers for several of our key product components and our third-party-manufactured products. We do not have contractual arrangements with most of these suppliers and manufacturers, and we order our supplies and product on an as-needed basis. To date, we have not experienced any material disruption in the adequate supply from existing sources of product and components.
Any disruption in our manufacturing capacity could impact our ability to produce sufficient inventory and meet the demands of our customers, which could adversely affect our financial condition and results of operations.
Our manufacturing facilities have been certified to ISO 13485:2003 quality management system standards, which enables us to satisfy certain regulatory requirements of the European Union, Canada, and other foreign jurisdictions. If we were to lose these certifications, we would no longer be able to sell our products in these countries until we made the necessary corrections to our operations or, in the case of the European Union, satisfactorily completed an alternate approval route that did not rely on compliance with quality system standards. Our manufacturing facilities are subject to periodic inspections by regulatory authorities and our Notified Body (described below) to ensure compliance with domestic and non-U.S. regulatory requirements. See “—Government Regulation.”
Competition
The markets in which our 13 product lines compete are characterized by rapid change resulting from technological advances and scientific discoveries. No one company competes against us in all of our product lines. Rather, we compete with a range of companies, from large to small, including both publicly traded and privately held device companies. Notable competitors include Applied Medical Resources Corporation, Cardiovascular Systems Inc., Cook Group Incorporated, C.R. Bard, Inc., Edwards Lifesciences Corporation, Getinge AB, Jotec GmbH, Medtronic, Inc., Terumo Medical Corporation, Uresil, LLC, and W. L. Gore & Associates.
10
Table of Contents
Our products compete primarily on the basis of their innovative technology, quality, reliability, ease of use, cost-effectiveness, physician familiarity, brand recognition, and service support. Several of our products are sold at higher prices than those of our competitors. We believe that our continued success will depend on our ability to broaden and optimize our direct sales channel, acquire or develop additional vascular device product lines, obtain patent or other product protections, obtain regulatory and reimbursement approvals, maintain sufficient inventory to meet customer demand, and attract and retain skilled personnel.
Many of our competitors have substantially greater financial, technological, research and development, regulatory, marketing, sales, and personnel resources than we do. Certain of these competitors are able to manufacture at lower costs and may therefore offer comparable products at lower prices. Certain of these competitors may also have greater experience in developing and further improving products, obtaining regulatory approvals, and manufacturing and marketing such products. Certain of these competitors may obtain patent protection or regulatory approval or clearance, or achieve product commercialization, before us, any of which could materially adversely affect us.
Intellectual Property
We believe that our success is dependent, to a certain extent, on the development and maintenance of proprietary aspects of our technologies. We rely on a combination of patents, trademarks, trade secret laws, and confidentiality and invention assignment agreements to protect our intellectual property rights.
As of December 31, 2010, we actively maintained 26 issued patents and 5 pending patent applications in the United States and Europe relating to various aspects of our products and/or manufacturing processes. The majority of our issued U.S. patents are set to expire at various times from 2012 to 2020.
We intend to file and prosecute patent applications for our technology in jurisdictions where we believe that patent protection is effective and advisable. Generally, for products that we believe are appropriate for patent protection, we will attempt to obtain patents in the United States and key markets of the European Union. However, depending on circumstances, we may not apply for patents in all or any of those jurisdictions, or we may pursue patent protection elsewhere.
Notwithstanding the foregoing, the patent positions of medical device companies, including our company, are uncertain and involve complex and evolving legal and factual questions. The coverage sought in a patent application can be denied or significantly reduced either before or after the patent is issued. Consequently, there can be no assurance that any of our pending patent applications will result in an issued patent. There is also no assurance that any existing or future patent will provide significant protection or commercial advantage, or whether any existing or future patent will be dominated by a more basic patent, thus possibly requiring us to obtain a license to produce and sell the product.
While most of the world relies on a first-to-file system, the United States gives patent rights to whomever was the first to invent an idea, even if the inventor filed the related patent application after another was filed covering the same idea. Because patent applications can be maintained in secrecy for at least 18 months after their earliest priority date, and publication of discoveries in the scientific or patent literature often lags behind actual discoveries, we cannot be certain that we were the first to invent the subject matter covered by each of our pending U.S. patent applications or that we were the first to file non-U.S. patent applications for such subject matter. For example, in 2005 and 2006 Boston Scientific Corporation initiated opposition proceedings in the European Patent Office claiming that we were not the first to file a patent application on certain material. As a result of these opposition proceedings, some of our patent claims were canceled. Although the cancellation of these patent claims did not affect our ability to manufacture, distribute, or sell any of our products, it could affect our right to exclude others from selling products similar to our TAArget and UniFit stent grafts in Europe.
Because the United States follows a first-to-invent system, if a third party files a patent application relating to an invention claimed in our patents or patent applications, we may be required to participate in an interference proceeding declared by the U.S. Patent and Trademark Office to determine who was the first to invent the idea in
11
Table of Contents
question and therefore who should own the patent rights to that idea. Such a proceeding could involve substantial uncertainties and cost, even if the eventual outcome is favorable to us. There can be no assurance that our patents, if issued, would be upheld as valid in court.
Third parties may claim that our products infringe on their patents and other intellectual property rights. Some companies in the medical device industry have used intellectual property infringement litigation to gain a competitive advantage. If a competitor were to challenge our patents, licenses, or other intellectual property rights, or assert that our products infringe its patent or other intellectual property rights, we could incur substantial litigation costs, be forced to make expensive changes to our product designs, license rights in order to continue manufacturing and selling our products, or pay substantial damages. Third-party infringement claims, regardless of their outcome, would not only consume our financial resources but also divert our management’s time and effort. Such claims could also cause our customers or potential customers to defer or limit their purchase or use of the affected products until resolution of the claim.
Certain aspects of our products are covered by patents held by third parties. We manufacture, market, and sell these products pursuant to license agreements with these third parties. These arrangements require us to pay royalties, typically determined as a percentage of our net sales for the underlying product. If we fail to make these payments or otherwise fail to observe the terms of these agreements, we may lose our ability to sell these products. For example, we manufacture, market, and sell our TAArget and UniFit stent grafts pursuant to a sublicense from Bard Peripheral Vascular, Inc., a subsidiary of C.R. Bard, Inc., to a U.S. patent covering aspects of ePTFE. Our arrangement with Bard may preclude us from assigning the sublicense to a third party, including in connection with the sale of more than 30% of our capital stock or all or substantially all of our assets, without the prior consent of Bard. The loss by us of our right to manufacture, market, and sell our TAArget and UniFit products could materially and adversely affect our business and results of operations. We also manufacture, market, and sell our AnastoClip and AnastoClip GC Vessel Closure Systems, EndoHelix Retrieval Device, Grice Suture Needle, LifeSpan Vascular Graft, MollRing Cutter Transection Device, Reddick-Saye Screw, and Periscope Dissector products pursuant to licenses with third-party patent holders.
We believe that our strong brands have been an important factor in our success. We rely on common law and registered trademarks to protect our product brands. Some of our registered trademarks are LeMaitre, Pruitt, VascuTape, Glow ‘N Tell, and Reddick, each of which is registered in the United States and the European Union, and in certain cases in other foreign countries.
We rely on trade secret protection for certain unpatented aspects of other proprietary technology. Some of our products are not protected by patents. In the past, other companies have independently developed or otherwise acquired comparable or substantially equivalent proprietary information and techniques, and there can be no assurance that others will not do so in the future or otherwise gain access to our proprietary technology or disclose such technology, or that we can meaningfully protect our trade secrets. We have a policy of requiring key employees and consultants to execute confidentiality agreements upon the commencement of an employment or consulting relationship with us. Our confidentiality agreements also require our employees to assign to us all rights to any inventions made or conceived during their employment with us. We also generally require our consultants to assign to us any inventions made during the course of their engagement by us. There can be no assurance, however, that these agreements will provide meaningful protection or adequate remedies for us in the event of unauthorized use, transfer, or disclosure of confidential information or inventions.
The laws of foreign countries generally do not protect our proprietary rights to the same extent as do the laws of the United States and we may experience more difficulty enforcing our proprietary rights in certain foreign jurisdictions.
Government Regulation
The products we manufacture and market are subject to regulation by the FDA, and, in some instances, other federal and state authorities and foreign governments.
12
Table of Contents
United States Regulation
Our products are medical devices subject to extensive regulation by the FDA under the Federal Food, Drug, and Cosmetic Act (the FDCA). FDA regulations govern, among other things, product development, testing, manufacture, packaging, labeling, storage, clearance or approval, advertising and promotion, sales and distribution, and import and export.
Premarket Pathways
Most medical devices must receive either 510(k) clearance or premarket application approval (PMA approval) from the FDA prior to commercial distribution. Devices deemed to pose relatively less risk are placed in either class I or II, which requires the manufacturer to submit a premarket notification requesting permission for commercial distribution; this is known as 510(k) clearance. Some low-risk devices are exempted from this requirement. Class II devices may be subject to special controls, such as performance standards and FDA guidelines that are not applied to class I devices. Devices deemed by the FDA to pose the greatest risk, such as life-sustaining, life-supporting, or implantable devices, or devices deemed not substantially equivalent to a previously 510(k)-cleared device or to a pre-amendment class III device (i.e., one in commercial distribution before May 28, 1976) for which PMA applications have not been called, are placed in class III, which generally requires PMA approval. In all cases, a user fee is required for 510(k) submissions and PMA applications, which in the case of PMA applications can be very costly.
510(k) Clearance. To obtain 510(k) clearance, a manufacturer must submit a premarket notification demonstrating that the proposed device is substantially equivalent in intended use and in safety and effectiveness to a “predicate device” (i.e., a previously 510(k)-cleared class I or class II device or a pre-amendment class III device for which the FDA has not yet called for PMA applications). The FDA’s 510(k) clearance pathway usually takes from three to twelve months, but it can last longer. In reviewing a premarket notification, the FDA may request additional information, including clinical data. For example, in reviewing our premarket notification for the AlboGraft Vascular Graft, the FDA requested, and we submitted, clinical data from the use of the device in other countries where it was then already approved for sale. All of our devices sold in the United States to date are marketed pursuant to the 510(k) process.
After a device receives 510(k) clearance, any modification that could significantly affect its safety or effectiveness, or that would constitute a major change in its intended use, requires a new 510(k) clearance. The FDA requires each manufacturer to make this determination in the first instance, but the FDA can review any such decision. If the FDA disagrees with a manufacturer’s decision not to seek a new 510(k) clearance, the agency may retroactively require the manufacturer to seek 510(k) clearance. The FDA also can require the manufacturer to cease marketing and/or recall the modified device until 510(k) clearance or PMA approval is obtained. Also, the manufacturer may be subject to significant regulatory fines or penalties.
PMA Approval. The PMA approval pathway requires proof of the safety and effectiveness of the proposed device to the FDA’s satisfaction, making this pathway much more costly, lengthy, and uncertain. A PMA application must provide extensive preclinical and clinical trial data, as well as detailed information about the device and its components regarding, among other things, device design, manufacturing, and labeling. As part of the PMA review, the FDA will typically inspect the manufacturer’s facilities for compliance with the Quality System Regulation (QSR) which imposes elaborate testing, control, documentation, and other quality assurance procedures on the manufacturing process.
If the FDA approves a PMA, the approved indications or claims may be more limited than those originally sought. The PMA can include post-approval conditions that the FDA believes to be necessary to ensure the safety and effectiveness of the device including, among other things, restrictions on labeling, promotion, sale, and distribution. Failure to comply with the conditions of approval can result in material adverse enforcement action, including the loss or withdrawal of the approval. Even after approval of a PMA, a new PMA or PMA supplement
13
Table of Contents
is required if the device or its labeling or manufacturing process are modified. Supplements to a PMA often require the submission of the same type of information required for an original PMA, except that the supplement is generally limited to that information needed to support the proposed change from the product covered by the original PMA.
Clinical Trials. A clinical trial is typically required to support a PMA application and is sometimes required to support 510(k) clearance. In some cases, one or more smaller feasibility IDE studies may precede a pivotal IDE clinical trial intended to comprehensively demonstrate the safety and effectiveness of the investigational device. All clinical studies of investigational devices must be conducted in compliance with the FDA’s extensive requirements. If an investigational device could pose a significant risk to patients (as defined in the regulations), the FDA, prior to initiation of clinical use, must approve an IDE application showing that it is safe to test the device in humans and that the testing protocol is scientifically sound. A non-significant risk device does not require submission to the FDA of an IDE application. Both significant risk and non-significant risk investigational devices require approval from institutional review boards (IRBs) at the study centers where the device will be used. The FDA and the IRB at each institution at which a clinical trial is being performed may suspend a clinical trial at any time for various reasons, including a belief that the subjects are being exposed to an unacceptable health risk.
During a study, the sponsor must comply with the FDA’s IDE requirements for investigator selection, trial monitoring, reporting, record keeping, and prohibitions on the promotion of investigational devices. The investigators must obtain patient informed consent, rigorously follow the investigational plan and study protocol, control the disposition of investigational devices, and comply with all reporting and record-keeping requirements. Required records and reports are subject to inspection by the FDA. Prior to granting PMA approval, the FDA typically inspects the records relating to the conduct of the study and the clinical data supporting the PMA application for compliance with IDE requirements.
In January 2008, the FDA audited the conduct of the feasibility study and pivotal clinical trial of our UniFit Abdominal Stent Graft. As a result of this audit, the FDA issued a formal notification, or Form FDA-483, listing nine observations. Specifically, the FDA observed that we had not adequately supervised participating sites, made all required reports to those sites and the FDA, or adequately maintained all records required by FDA regulations. In June 2008, the FDA issued a public Warning Letter regarding many of the matters cited in the Form FDA-483. After receiving this Warning Letter, we submitted a response letter to the FDA detailing our implementation of corrective actions, and in July 2008, we received a letter from the FDA indicating that the corrective actions that we have developed and implemented appear to be adequate. In February 2010, the FDA conducted a follow-up audit of the feasibility study and pivotal clinical trial. The FDA did not make any adverse findings, but our corrective actions remain subject to further verification as part of any future inspection. If the FDA determines that we are not in substantial compliance with IDE requirements, they may take enforcement action against us.
Although the QSR does not fully apply to investigational devices, the requirement for controls on design and development does apply. The sponsor also must manufacture the investigational device in conformity with the quality controls described in the IDE application and any conditions of IDE approval that FDA may impose with respect to manufacturing.
Historically, our products have been introduced into the market using the 510(k) clearance procedure, and we have not used the more burdensome PMA process for any of the products that we currently market or sell in the United States. In contrast, the FDA has required that both our UniFit Abdominal Stent Graft and TAArget Thoracic Stent Graft undergo the PMA process and we have elected to discontinue pursuit of this process for these products.
14
Table of Contents
Postmarket Regulation
After a device is placed on the market, regardless of the classification or premarket pathway, significant regulatory requirements apply. These include:
| • | manufacturing establishment registration and device listing with the FDA; |
| • | the QSR, which requires finished device manufacturers, including third-party or contract manufacturers, to follow stringent design, testing, control, documentation, and other quality assurance procedures in all aspects of manufacturing; |
| • | labeling regulations and FDA prohibitions against the promotion of products for uncleared, unapproved, or off-label uses and other requirements related to promotional activities; |
| • | medical device reporting regulations, which require that manufacturers report to the FDA if their device may have caused or contributed to a death or serious injury or malfunctioned in a way that would likely cause or contribute to a death or serious injury if the malfunction were to recur; and |
| • | corrections and removal reporting regulations, which require that manufacturers report to the FDA any field corrections and product recalls or removals if undertaken to reduce a risk to health posed by the device or to remedy a violation of the FDCA that may present a risk to health. |
We are subject to inspection and marketing surveillance by the FDA to determine our compliance with regulatory requirements. Non-compliance with applicable FDA requirements can result in, among other things, public warning letters, fines, injunctions, civil penalties, recall or seizure of products, total or partial suspension of production, failure of the FDA to grant marketing approvals, withdrawal of marketing approvals, a recommendation by the FDA to disallow us to enter into government contracts, and criminal prosecutions. The FDA also has the authority to request repair, replacement, or refund of the cost of any device manufactured or distributed by us. In the event that one of our suppliers fails to maintain compliance with our quality requirements, we may have to qualify a new supplier and could experience manufacturing delays as a result.
Non-U.S. sales of medical devices manufactured in the United States that are not approved or cleared by the FDA for use in the United States, or are banned or deviate from lawful performance standards, are subject to FDA export requirements. Before exporting such products to a foreign country, we must first comply with the FDA’s regulatory procedures for exporting unapproved devices.
Other U.S. Regulations
We and our products are also subject to a variety of state and local laws in those jurisdictions where our products are or will be marketed, and federal, state, and local laws relating to matters such as safe working conditions, manufacturing practices, environmental protection, fire hazard control, and disposal of hazardous or potentially hazardous substances. We are subject to various federal and state laws governing our relationships with the physicians and others who purchase or make referrals for our products. For instance, federal law prohibits payments of any form that are intended to induce a referral for any item payable under Medicare, Medicaid, or any other federal healthcare program. Many states have similar laws. There can be no assurance that we will not be required to incur significant costs to comply with such laws and regulations now or in the future or that such laws or regulations will not have a material adverse effect upon our ability to do business.
We are subject to federal, state, and local laws, rules, regulations, and policies governing the use, generation, manufacture, storage, air emission, effluent discharge, handling, and disposal of certain hazardous and potentially hazardous substances used in connection with our operations. Although we believe that we have complied with these laws and regulations in all material respects and to date have not been required to take any action to correct any noncompliance, there can be no assurance that we will not be required to incur significant costs to comply with environmental regulations in the future.
15
Table of Contents
Non-U.S. Regulation
Sales of medical devices are subject to regulatory requirements in many countries. The regulatory review process may vary greatly from country to country. For example, the European Union has adopted numerous directives and standards relating to medical devices regulating their design, manufacture, clinical trials, labeling, and adverse event reporting, including the Medical Devices Directive (93/42/EEC (the Directive)), which is applicable to our products. Devices that comply with the requirements of the Directive are entitled to bear a CE mark, indicating that the device conforms with the essential requirements of the applicable directive and can be commercially distributed in countries that are members of the European Union, as well as Iceland, Lichtenstein, Norway, and Switzerland. Each member state of the European Union has implemented the directives into its respective national law and has each established a “Competent Authority” to apply the directive in its territory.
The Directive defines a classification system placing devices into Class I, IIa, IIb, or III, depending on the risks and characteristics of the medical device. The Directive also defines the essential requirements that devices must meet before being placed on the market, establishes assessment procedures for approving a device for marketing, and creates mechanisms for national authorities to manage implementation or to intervene when public health requires. Essential requirements include manufacturing, design, performance, labeling, and safety requirements, and may include providing certain clinical data. These requirements vary based on the type of the device and other related factors.
A manufacturer of low-risk devices typically may demonstrate conformity to the essential requirements based on a self-declaration. The European Standardization Committees have adopted numerous harmonized standards for specific types of medical devices. Compliance with relevant standards establishes a presumption of conformity with the essential requirements. Manufacturers of higher-risk devices generally must use a “Notified Body”—an appointed independent third party to assess conformity. This third-party assessment may consist of an audit of the manufacturer’s quality system and specific testing of the manufacturer’s devices. An assessment by a Notified Body in one country within the European Union is generally required in order for a manufacturer to commercially distribute the product throughout the European Union. Most of our devices are considered higher-risk devices that require Notified Body assessment.
The European medical device laws also address the advertising and promotion of medical devices, clinical investigations, and requirements for handling adverse events. Post-market surveillance of medical devices in the European Union is generally conducted on a country-by-country basis; however, the Directive sets forth certain specific requirements for reporting adverse events. The Medical Device Vigilance system is the mechanism by which adverse event reporting is managed and monitored in the European Union.
In some cases, we rely on our non-U.S. distributors to obtain premarket approvals, complete product registrations, comply with clinical trial requirements, and complete those steps that are customarily taken in the applicable jurisdictions to comply with governmental and quasi-governmental regulation. In the future, we expect to continue to rely on distributors in this manner in those countries where we continue to market and sell our products through them.
In Japan, the Ministry of Health, Labor and Welfare (MHLW) regulates medical devices through the Pharmaceutical Affairs Law, which was reformed effective April 1, 2005. The revisions to Japan’s regulations have resulted in longer lead times for product registration.
There can be no assurance that new laws or regulations or new interpretations of laws and regulations regarding the release or sale of medical devices will not delay or prevent sale of our current or future products.
16
Table of Contents
Third-Party Reimbursement
United States
Healthcare providers that purchase medical devices generally rely on third-party payors, including the Medicare and Medicaid programs and private payors (such as indemnity insurers, employer group health insurance programs, and managed care plans) to reimburse all or part of the cost of those products. As a result, demand for our products is and will continue to be dependent in part on the coverage and reimbursement policies of these payors. The manner in which reimbursement is sought and obtained varies based upon the type of payor involved and the setting in which the product is furnished and utilized. Furthermore, payments from Medicare, Medicaid, and other third-party payors are subject to legislative and regulatory changes and are susceptible to budgetary pressures.
In the United States, third-party payors generally pay healthcare providers directly for the procedures they perform and in certain instances for the products they use. Alternatively, third-party payors may reimburse patients for all or part of the charges that patients pay for procedures and the products used in connection with those procedures. In either case, our sales volumes depend on the extent to which third-party payors cover our products and the procedures in which they are used. In general, a third-party payor only covers a medical product or procedure when the plan administrator is satisfied that the product or procedure is medically necessary because it improves health outcomes, including quality of life or functional ability, in a safe and cost-effective manner. Even if a device has received clearance or approval for marketing by the FDA, there is no assurance that third-party payors will cover the cost of the device and related procedures in which the device is used.
In many instances, third-party payors cover the procedures performed using our products using price fee schedules that do not vary reimbursement to reflect the cost of the products and equipment used in performing those procedures. In other instances, payment or reimbursement is separately available for the products and equipment used, in addition to payment or reimbursement for the procedure itself. Even if coverage is available, third-party payors may place restrictions on the circumstances in which they provide coverage or may offer reimbursement that is not sufficient to cover the cost of our products. Many of the products that compete with ours are less expensive. Therefore, although coverage may be available for our products and the related procedures, the levels of approved coverage may not be sufficient to justify using our products instead of those of competitors.
Finally, the advent of contracted fixed rates per procedure has made it difficult to receive separate reimbursement for disposable products, even if the use of these products improves clinical outcomes. In addition, many third-party payors are moving to managed care systems in which providers contract to provide comprehensive healthcare for a fixed cost per person. Managed care providers often attempt to control the cost of healthcare by authorizing fewer elective surgical procedures. Under current prospective payment systems, such as the diagnosis-related group system and the hospital out-patient prospective payment system, both of which are used by Medicare and in many managed care systems used by private third party payors, the reimbursement for our products will be incorporated into the overall reimbursement of a procedure, and there will be no separate reimbursement for our products. As a result, we cannot be certain that hospital administrators and physicians will purchase our products.
If hospitals and physicians cannot obtain adequate reimbursement for our products or the procedures in which they are used, our business, financial condition, and results of operations could suffer a material adverse impact.
Non-U.S.
Our success in non-U.S. markets will depend largely upon the availability of reimbursement from the third-party payors through which healthcare providers are paid in those markets. Reimbursement and healthcare payment systems in non-U.S. markets vary significantly by country. The main types of healthcare payment systems are government sponsored healthcare and private insurance. As in the United States, reimbursement is
17
Table of Contents
subject to legislative and regulatory changes and is susceptible to budgetary pressures. Reimbursement approval must be obtained individually in each country in which our products are marketed. Outside the United States, we generally pursue reimbursement approval in those countries in which we sell directly to the hospital. In other markets, we generally rely on the distributors who sell our products to obtain reimbursement approval in those countries in which they will sell our products. There can be no assurance that reimbursement approval will be received.
Fraud and Abuse Laws
We may directly or indirectly be subject to various federal and state laws pertaining to healthcare fraud and abuse, including anti-kickback laws. In particular, the federal healthcare program Anti-Kickback Statute prohibits persons from knowingly and willfully soliciting, offering, receiving, or providing remuneration, directly or indirectly, in exchange for or to induce either the referral of an individual, or the furnishing, arranging for, or recommending a good or service for which payment may be made in whole or part under federal healthcare programs, such as the Medicare and Medicaid programs. Penalties for violations include criminal penalties and civil sanctions such as fines, imprisonment, and possible exclusion from Medicare, Medicaid, and other federal healthcare programs. The Anti-Kickback Statute is broad and prohibits many arrangements and practices that are lawful in businesses outside of the healthcare industry. In implementing the statute, the Office of Inspector General, or OIG, has issued a series of regulations, known as the “safe harbors.” These safe harbors set forth provisions that, if all their applicable requirements are met, will assure healthcare providers and other parties that they will not be prosecuted under the Anti-Kickback Statute. The failure of a transaction or arrangement to fit precisely within one or more safe harbors does not necessarily mean that it is illegal or that prosecution will be pursued. However, conduct and business arrangements that do not fully satisfy each applicable element of a safe harbor may result in increased scrutiny by government enforcement authorities, such as the OIG.
In March 2010, significant reforms to the U.S. healthcare system were adopted in the form of the Patient Protection and Affordable Care Act (the PPACA). The PPACA includes provisions that, among other things, require detailed disclosure of gifts and other remuneration made to health care professionals.
Employees
We had 255 full-time employees at December 31, 2010. Of these employees, 110 were in manufacturing and research and development, 98 were in sales and marketing, 22 were in clinical, regulatory, and quality assurance, and 25 were in general and administrative. We believe that our employee relations are good.
Financial Information by Business Segment and Geographic Data
We operate in one reportable industry segment: the design, marketing, sales and technical support of medical devices and implants for the treatment of peripheral vascular disease. Our chief operating decision maker is our chief executive officer. Our chief executive officer reviews financial information, accompanied by information about revenue by geographic region for purposes of allocating resources and evaluating financial performance. The information included in Note 14 of the Notes to Consolidated Financial Statements is hereby incorporated by reference.
Customers
Our sales are not dependent on any single customer or distributor, and we continue to expand our distribution channel worldwide through direct and indirect sales forces.
Corporate Information
We were incorporated in Massachusetts on November 28, 1983, as Vascutech, Inc. On June 16, 1998, we were reincorporated in Delaware, and on April 6, 2001, we changed our name to LeMaitre Vascular, Inc. Our principal executive offices are located at 63 Second Avenue, Burlington, Massachusetts 01803, and our telephone number is (781) 221-2266.
18
Table of Contents
Where You Can Find More Information
Our Annual Reports on Form 10-K, Quarterly Reports on Form 10-Q, Current Reports on Form 8-K, and amendments to those reports filed or furnished pursuant to Section 13(a) or 15(d) of the Securities Exchange Act of 1934 are available through the investor relations portion of our website (www.lemaitre.com) free of charge as soon as reasonably practicable after we electronically file such material with, or furnish it to, the Securities and Exchange Commission, or SEC. Information on our investor relations page and on our website is not part of this Annual Report on Form 10-K or any of our other securities filings unless specifically incorporated herein or therein by reference. In addition, our filings with the Securities and Exchange Commission may be accessed through the Securities and Exchange Commission’s Electronic Data Gathering, Analysis and Retrieval (EDGAR) system at www.sec.gov. You may also obtain copies of the documents at prescribed rates by writing to the Public Reference Section of the SEC at 100 F Street, N.E., Washington, D.C. 20549. Please call the SEC at 1-800-SEC-0330 for further information on the operation of the public reference facilities. All statements made in any of our securities filings, including all forward-looking statements or information, are made as of the date of the document in which the statement is included, and we do not assume or undertake any obligation to update any of those statements or documents unless we are required to do so by law. In addition, our Corporate Governance Guidelines, Code of Business Conduct and Ethics and Charters of our Audit, Compensation and Nominating and Corporate Governance Committees are available on our website and are available in print to any stockholder who requests such information.
| Item 1A. | Risk Factors |
The following important factors, among others, could cause our actual operating results to differ materially from those indicated or suggested by forward-looking statements made in this Form 10-K or presented elsewhere by management from time to time. Investors should carefully consider the risks described below before making an investment decision. The risks described below are not the only ones we face. Additional risks not presently known to us or that we currently believe are immaterial may also significantly impair our business operations. Our business could be harmed by any of these risks. The trading price of our common stock could decline due to any of these risks, and investors may lose all or part of their investment.
Risks Related to Our Business
We may experience significant fluctuations in our quarterly and annual results.
Fluctuations in our quarterly and annual financial results have resulted and will continue to result from numerous factors, including:
| • | strategic actions by us, such as acquisitions of additional businesses, products, or technologies; |
| • | the discontinuation of a product line or other revenue generating activity, such as private label manufacturing; |
| • | costs incurred in connection with the termination of contractual and other relationships, including distributorships; |
| • | the relocation of manufacturing operations and other strategic restructuring; |
| • | changes in the mix of products we sell; |
| • | our determination whether or not to continue the payment of quarterly cash dividends; |
| • | the expiration or exhaustion of deferred tax assets such as net operating loss carry-forwards; |
| • | effects of domestic and foreign economic conditions and exchange rates on our industry and/or customers; |
| • | increased product and price competition; |
19
Table of Contents
| • | seasonality in the sales of our products; and |
| • | the loss of any significant customer, especially in regard to any product that has a limited customer base. |
These factors, some of which are not within our control, may cause the price of our common stock to fluctuate substantially. If our quarterly operating results fail to meet or exceed the expectations of securities analysts or investors, our stock price could drop suddenly and significantly. We believe the quarterly comparisons of our financial results are not always meaningful and should not be relied upon as an indication of our future performance.
We may not maintain our recent profitability.
As of December 31, 2010, we had an accumulated deficit of approximately $8.6 million. While we reported operating and net income for the years ended December 31, 2010 and 2009, we had an operating and a net loss for the years ended December 31, 2008 and 2007. There can be no assurance we will achieve significant net sales gains or maintain either operating or net profitability in the future. We intend to increase operating expenses in 2011 in areas such as sales and product development, and so we may need to maintain or reduce our operating expenses in other areas in order to maintain or improve operating profitability. Decreased investment levels may inhibit future growth in net sales and earnings.
Additionally, our ability to maintain and increase profitability will be influenced by many factors, including:
| • | the level and timing of future sales, manufacturing costs and operating expenditures; |
| • | market acceptance of our new products; |
| • | the productivity of our direct sales force and distributors; |
| • | fluctuations in foreign currency exchange rates; |
| • | our ability to successfully build direct sales organizations in new markets; |
| • | our ability to successfully acquire and develop competitive products; |
| • | our ability to successfully integrate acquired businesses, products, or technologies; |
| • | the impact on our business of competing products, technologies, and procedures; |
| • | our ability to obtain regulatory approvals for our products in new markets; and |
| • | the cost of our clinical studies, if any; and |
| • | the cost of intellectual property challenges, if any. |
If we are unable to expand our product offerings, we may not achieve our growth objectives and our results of operations could suffer.
The treatment of peripheral vascular disease is increasingly shifting from open vascular surgery to minimally invasive endovascular procedures, and many of our products are used primarily or exclusively in open vascular surgery procedures. We may not be able to compete effectively with our competitors unless we can keep pace with existing or new products and technologies in the vascular device market. Our success in developing and commercializing new products and new versions of our existing products is affected by our ability to:
| • | identify in a timely manner new market trends and customer needs; |
| • | keep pace with technological changes and industry standards; |
| • | obtain regulatory clearance or approval of new products and technologies; |
20
Table of Contents
| • | successfully develop cost-effective manufacturing processes for such products; |
| • | commercially introduce such products and technologies; and |
| • | achieve market acceptance. |
If we are unable to expand our product offerings, we may not achieve our growth objectives and our results of operations could suffer.
Fluctuations in foreign currency exchange rates could result in declines in our reported sales and earnings.
For the full year ended December 31, 2010, 38% of net sales were derived from sales occurring outside of the Americas. Because the majority of our sales outside of the United States are denominated in local currencies, our reported sales and earnings are subject to fluctuations in foreign exchange rates. At present, we do not manufacture any of our products outside the United States and we rarely engage in hedging transactions to protect against uncertainty in future exchange rates between particular foreign currencies and the U.S. dollar. In 2010, the value of foreign currencies against the U.S. dollar fluctuated dramatically. For example, the value of the euro against the U.S. dollar declined by approximately 14% during the first six months of 2010. A decline in the value of the euro against the U.S. dollar could be expected to have a negative impact on our revenue and earnings growth as euro-denominated revenues and earnings, if any, would be translated into U.S. dollars at a reduced value. We cannot predict the impact of foreign currency fluctuations, and foreign currency fluctuations in the future may adversely affect our sales and earnings.
We may acquire businesses and assets in the future. We may experience difficulties in completing the integration of these acquisitions into our business, or we may not realize the anticipated benefits of these acquisitions.
In order to expand our product offerings, we have completed several acquisitions, and a key part of our strategy is to acquire additional businesses, products, or technologies in the future. Our growth strategy depends in part upon our ability to identify, negotiate, complete, and integrate suitable acquisitions and develop products from uncommercialized intellectual property that we acquire. If we are unable to complete acquisitions on satisfactory terms, our growth objectives could be negatively affected.
Even if we complete acquisitions, we may experience:
| • | difficulties in integrating any acquired companies, personnel, and products into our existing business; |
| • | difficulties in integrating manufacturing operations into our existing business or successfully replicating manufacturing processes at new manufacturing facilities; |
| • | difficulties or delays in transitioning clinical studies or unfavorable results from such clinical studies; |
| • | difficulties or delays in commercializing intellectual property that we acquire; |
| • | the sudden reduction in volume or loss of orders from a key customer, particularly where the acquired company has concentrated sales; |
| • | diversion of our management’s time and attention from other business concerns; |
| • | challenges resulting from limited or no prior experience in new markets or countries we may enter; |
| • | higher costs of integration than we anticipated; |
| • | the need to improve an acquired product in order to gain broader market acceptance; |
| • | difficulties in retaining key employees of the acquired business who are necessary to manage these acquisitions; |
| • | difficulties in acquiring the rights to and protecting intellectual property; |
21
Table of Contents
| • | difficulties if the acquired company is remote or inconvenient to our Burlington, Massachusetts, headquarters; |
| • | dilution as a result of equity financing required to fund acquisition costs; or |
| • | debt as a result of debt financing required to fund acquisition costs, which would be senior to our outstanding shares of capital stock, and which would require interest payments to a lender. |
For any of these reasons or as a result of other factors we may not realize the anticipated benefits of acquisitions and our operating results may be harmed.
For example, the 29 employees of our Biomateriali S.r.l. subsidiary, which we acquired in December 2007, commenced a strike in October 2010 to demonstrate their concerns regarding the possibility that we might relocate manufacturing operations to our Burlington, Massachusetts headquarters. We paid approximately $1.4 million in severance and associated costs to resolve the strike and prevent disruption of the transfer of manufacturing operations. The strike, the resultant product backorders, and subsequent settlement negatively impacted our sales, gross margin and net income for the quarter ended December 31, 2010. We can provide no assurance that similar events will not occur in the future in regard to any future operational consolidations, particularly with respect to any acquisitions that we may complete in Europe, where employees are more likely to be unionized.
We could also discover deficiencies withheld from us due to fraud or otherwise not uncovered in our due diligence prior to the acquisition, including deficiencies in internal controls, data adequacy and integrity, product quality, and regulatory compliance, as well as undisclosed and product liabilities, any of which could result in us becoming subject to penalties or other liabilities. Any of these difficulties could negatively impact our ability to realize the intended and anticipated benefits that we currently expect from our acquisitions or from acquisitions we complete in the future and could harm our financial condition and results of operations.
Our assumptions about the market for our products may not be correct.
We are focused on the market for devices used to treat peripheral vascular disease. We believe that demographic trends point towards an increase in the need for our products. However, the projected demand for our products could materially differ from actual demand if our assumptions regarding these trends and acceptance of our products by the medical community prove to be incorrect or do not materialize or if drug therapies gain more widespread acceptance as a viable alternative treatment, which in each case could adversely affect our business prospects and profitability.
We face intense competition from other companies, technologies, and alternative medical procedures and we may not be able to compete effectively.
The markets in which we compete are highly competitive, subject to change, and significantly affected by new product introductions and other activities of industry participants. Although no one company competes against us in all of our product lines, a number of manufacturers of peripheral vascular devices have substantially greater capital resources, larger customer bases, broader product lines, larger sales forces, greater marketing and management resources, larger research and development staffs, and larger facilities than ours; have established reputations with our target customers; and have developed worldwide distribution channels that are more effective than ours. Our competitors could elect to devote additional resources to the markets in which we currently enjoy less competition. Also, although we currently have leading market positions in the markets for some of our products, this is not true for the markets for all of our products, in particular our endovascular products. We have from time to time experienced difficulties competing against very large companies. For example, we believe that intense competition from Medtronic, W. L. Gore and Cook has been a significant factor in inhibiting the adoption of our aortic stent grafts in European markets.
22
Table of Contents
Recent industry consolidation could make the competitive environment more difficult for smaller companies like ours. Because of the size of the vascular disease market opportunity, competitors and potential competitors have dedicated, and we believe will continue to dedicate, significant resources to aggressively promote their products. Also, new product developments that could compete with us more effectively are likely because the vascular disease market is characterized by extensive research efforts and technological progress. Competitors may develop technologies and products that are safer, more effective, easier to use, less expensive, or more readily accepted than ours. Their products could make our technology and products obsolete or noncompetitive. Our competitors may also be able to achieve more efficient manufacturing and distribution operations than we can. In addition, many of our products face competition from alternative procedures that utilize a different kind of medical device that we do not currently sell. Increased competition could also result in price reductions and loss of market share, any of which could result in lower revenues and reduced gross profits.
If we encounter difficulties in converting Spain and Denmark from distributor sales to direct sales, or if we fail to convert additional countries in the future, our results of operations could suffer.
In 2011, we intend to convert Spain and Denmark from distributor sales to direct sales. In December 2010 we entered into agreements with our exclusive distributors in these countries to end their distribution of our products on June 30, 2011. Even with the cooperation of our distributors, however, these conversions could result in disruptions in our sales and an increase in our operating expenses. Further, we are required to repurchase inventory from these distributors, and we may therefore need to make a corresponding negative adjustment to net sales and incur expenses related to the disposal of excess or obsolete inventory.
We also intended to convert select other countries from distributor sales to direct sales in the future. Our distribution agreements are typically exclusive with terms of up to three years. These agreements may temporarily constrain our ability to convert certain countries or products from a distributor to a direct sales model. Further, even where the payment of compensation is not required by contract or local law, it may be prudent to make such a payment in order to assure a successful market transition. For example, we are paying consulting and transition services fees to our distributors in Spain and Denmark even though not required under an existing contract or local law, because the absence of cooperation by a distributor may result in the sudden erosion of our customer base, which could materially harm our ability to sell our product in that country.
Following termination of any distribution relationship, we may encounter difficulties in transitioning to a direct-sales model in any country in question. It may take us longer than expected to find sufficient qualified sales personnel to establish an effective sales force, which could negatively impact projected sales. If a distributor sold our products through a network of sales agents, rather than exclusively through its own personnel, we may not be able to establish relationships with all members of that network, temporarily limiting our access to the existing market. Similarly, failure to maintain or quickly re-establish a distributor’s close relationships with the physicians who use our products could cause a drop in sales. On the logistical side, if a distributor entered into an agreement with a customer relating to sales of our products or successfully completed a customer’s internal approval process, it may be difficult or impossible to assign the distributor’s rights under such agreements or approvals, and sales to that customer may be delayed until a new agreement is entered into or a new approval is obtained. The transition to a direct sales model may also require us to incur additional expenses and meet regulatory requirements that were previously the responsibility solely of the distributor. As a result of these risks, there can be no assurance that we will be successful in transitioning to a direct sales model in Spain, Denmark, or any other countries that we select, and difficulties that we encounter in these transitions could negatively affect our business.
Current economic instability may harm our operating results.
Financial markets and the economies in the United States and internationally have recently experienced disruption and volatility and conditions could worsen. As a result, the economic environment may, among other things:
| • | create downward pressure on the pricing of our products; |
23
Table of Contents
| • | affect the collection of accounts receivable; |
| • | increase the sales cycle for certain of our products; |
| • | slow the adoption of new technology; |
| • | adversely affect our customers, causing them to reduce spending; and |
| • | adversely affect our suppliers, which could disrupt our ability to produce our products. |
Any of these conditions could harm our operating results and liquidity.
If we are unable to increase our selling prices to customers, our rate of net sales growth might be reduced and our operating results could suffer.
In the fiscal years ended December 31, 2010 and 2009, a material portion of our increases in net sales was driven by higher average selling prices to our hospital customers across several of our product lines, particularly with respect to sales occurring in the United States. We have in the past been able to rely upon our intellectual property position, our well-known brands, our established reputation in the vascular surgery device marketplace, and, in some cases, an absence of competition, to implement price increases. If healthcare spending is reduced, particularly in the United States, in response either to government-enacted healthcare reform or to general economic conditions, if the reimbursement rates for the medical procedures in which our products are used are reduced or constrained, or if competitors introduce lower-priced products of comparable safety and efficacy, we may become unable to implement further increases in the selling prices of our products. If we become unable to raise selling prices, it might reduce our rate of net sales growth, which could harm our operating results.
If there is a disruption in the supply of products that we distribute, or if our relationships with their manufacturers are impaired, our net sales and results of operations could be harmed.
We are party to an agreement with Endologix, Inc. to distribute the Powerlink System in several European countries, and we are party to agreements with Neovasc Inc. to distribute the XenoSure Biologic Vascular Patch in the United States and most of Europe. If we are unable to market these products successfully, or if our agreement with either manufacturer is terminated early, our net sales and results of operations would likely suffer. In each case, if we do not meet our minimum purchase requirements under our agreement, and do not cure this deficiency, the agreement may be terminated by the manufacturer, which, in the case of Neovasc, would result in the loss of our purchase option to acquire the XenoSure product. In addition, even if we market our distributed products successfully, if the manufacturer is unable to produce enough of its products to meet our demands, we may not be able to meet our customers’ demands, and our net sales and results of operations may suffer.
In the case of Endologix we have not always met these performance requirements. There can be no assurance that our minimum purchase obligations will not exceed the market demand for the Powerlink System, which is dependent upon many risks outside our control. Were Endologix to declare a default under our agreement with them, we would be permitted to cure the performance requirement by purchasing additional inventory in order to avoid a termination, but these required purchases may be material in amount, reducing our cash reserves, and may increase the likelihood that we may eventually need to incur expenses related to the disposal of excess or obsolete inventory. Further, Endologix has stated that it intends to create its own direct sales organization in Europe and has announced plans to begin selling in 2012 a newer, competing product that is not available to us for distribution. We believe it is unlikely that our agreement with Endologix will be extended past its current June 30, 2013 expiration. If we are unable to replace revenues from sales of the Powerlink System, which approximated 7% of our 2010 revenues, our net sales and results of operations would likely suffer upon termination of this agreement.
24
Table of Contents
Our devices may not achieve market acceptance, which could adversely affect our business.
Some of our devices have been recently introduced into the market, and we cannot assure you that they will achieve market acceptance. The same is true of new devices that we may acquire or internally develop in the future. The marketing of our products requires a significant amount of time and expense in order to identify and develop relationships with the physicians who may use our products, invest in training and education with these physicians, and employ a sales force that is large enough to interact with the targeted physicians, with no assurance of success. In some cases, our devices may face competition from devices marketed by our competitors, and our customers may not prefer our devices. In other cases, our devices may be used in new procedures and techniques, and if physicians do not adopt these procedures and techniques, demand for these devices would fail to develop. For example, in 2010 we launched The UnBalloon Non-Occlusive Modeling Catheter, which did not achieve widespread market adoption because of user convenience and design issues. This catheter was subsequently withdrawn from the market due to safety concerns and has not yet been reintroduced. If our products do not gain market acceptance, our business could be adversely affected.
If we are unable to manage the anticipated growth of our business, our financial condition and operating results could be adversely affected.
The growth that we have experienced, and may experience in the future, will continue to provide challenges to our organization. For example, since 1998 we have completed several acquisitions, and we expect to pursue additional acquisitions in the future. As our operations expand, both in terms of scope and geographic coverage, we expect that we will need to manage additional relationships with various partners, suppliers, and other organizations. We also will need to manage the corresponding growth of our manufacturing operations. Our ability to manage our operations and growth requires us to continue to improve our operational, financial, and management controls and reporting systems and procedures, and may in the future require us to transition to new enterprise management software. Such growth could place a strain on our administrative and operational infrastructure. We may not be able to make improvements to our management information and control systems in an efficient or timely manner, and we may discover deficiencies in existing systems and controls. If we cannot scale and manage our business appropriately, our anticipated growth may be impaired and our financial results could suffer.
The risks inherent in operating internationally and the risks of selling and shipping our products and of purchasing our components and products internationally may adversely impact our net sales, results of operations, and financial condition.
We derive a significant portion of our net sales from operations in markets outside of the Americas. For the full year ended December 31, 2010, 38% of our net sales were derived from our operations outside of the United States. Our international sales operations expose us and our representatives, agents, and distributors to risks inherent in operating in foreign jurisdictions. These risks include:
| • | fluctuations in foreign currency exchange rates; |
| • | the imposition of additional U.S. and foreign governmental controls or regulations, including export licensing requirements, duties and tariffs, and other trade restrictions; |
| • | the risk of non-compliance with the Foreign Corrupt Practices Act by our sales representatives or our distributors; |
| • | the imposition of U.S. and/or international sanctions against a country, company, person, or entity with whom we do business that would restrict or prohibit continued business with the sanctioned country, company, person, or entity; |
| • | a shortage of high-quality sales personnel and distributors; |
| • | loss of any key personnel who possess proprietary knowledge, or who are otherwise important to our success in certain international markets; |
25
Table of Contents
| • | changes in third-party reimbursement policies that may require some of the patients who receive our products to directly absorb medical costs or that may necessitate the reduction of the selling prices of our products; |
| • | the imposition of restrictions on the activities of foreign agents, representatives, and distributors; |
| • | scrutiny of foreign tax authorities, which could result in significant fines, penalties, and additional taxes being imposed on us; |
| • | pricing pressure that we may experience internationally; |
| • | laws and business practices favoring local companies; |
| • | longer payment cycles; |
| • | difficulties in enforcing agreements and collecting receivables through certain foreign legal systems; |
| • | difficulties in enforcing or defending intellectual property rights; |
| • | exposure to different legal and political standards; and |
| • | political, economic, and/or social instability. |
We cannot assure you that one or more of these factors will not harm our business. Any material decrease in our international sales would adversely impact our net sales, results of operations, and financial condition.
If we experience difficulties in relocating manufacturing operations related to our AlboGraft Vascular Graft from Brindisi, Italy to Burlington, Massachusetts, then our financial condition and results of operations could be harmed.
We are in the process of relocating the manufacturing operations related to our AlboGraft Vascular Graft from Brindisi, Italy to our Burlington, Massachusetts headquarters. We may encounter difficulties or delays which could negatively impact product quality or impair our ability to manufacture sufficient quantities of the devices to satisfy demand. Further, this transfer may be more expensive than we currently anticipate and we may not be successful in duplicating manufacturing processes in a timely manner. If our relocation is delayed or more costly than anticipated, our financial condition or results of operations may be harmed.
We depend on single- and limited-source suppliers for some of the components to our products, as well as for acquired products that have not been transitioned to in-house manufacture, and if any of those suppliers are unable or unwilling to supply them on acceptable terms, it could limit our ability to deliver our products to our customers on a timely basis or at all.
We rely on single- and limited-source suppliers for some of our important product components, as well as for products we have acquired that are not manufactured in-house. For example, our EndoRE remote endarterectomy product line is manufactured for us by third-party suppliers, and we obtain from a third-party supplier a key component used in our aortic stent grafts. There are relatively few, or in some cases no, alternative, validated sources of supply for these components and products. We do not have supply agreements with most of these suppliers, and instead place orders on an as-needed basis. Most of these suppliers could discontinue the manufacture or supply of these components or products at any time. We do not carry a significant inventory of these components and products. Identifying and qualifying additional or replacement suppliers, if required, may not be accomplished quickly or at all and could involve significant additional costs. Any supply interruption from our vendors or failure to obtain additional vendors for any of the components used to manufacture our products would limit our ability to manufacture our products, may result in production delays and increased costs, and may limit our ability to deliver products to our customers. If we are unable to identify alternate sources of supply for the components, we would have to modify our products to use substitute components, which may cause delays in shipments, increase design and manufacturing costs, and increase prices for our products. We cannot assure you that any such modified products would be as effective as the predecessor
26
Table of Contents
products, or that such modified products would gain market acceptance. This could lead to customer dissatisfaction and damage to our reputation.
Any disruption in our manufacturing facilities could harm our results of operations.
Our principal worldwide executive, distribution, and manufacturing operations are located at adjacent 27,098 square foot and 17,617 square foot leased facilities located in Burlington, Massachusetts. We also manufacture our LifeSpan ePTFE Vascular Graft in a 9,425 square foot leased facility in Laguna Hills, California. These facilities and the manufacturing equipment we use to produce our products would be difficult to replace and could require substantial lead-time to repair or replace in the event of a natural or man-made disaster. In such event, we could not shift production to alternate manufacturing facilities, and we would be forced to rely on third-party manufacturers. Although we possess insurance for damage to our property and the disruption of our business from casualties, such insurance may not be sufficient to cover all of our potential losses, including potential damage to our reputation, and may not continue to be available to us on acceptable terms, or at all.
Our focus on the needs of vascular surgeons could harm our business if interventional cardiologists and interventional radiologists perform a greater percentage of new procedures that replace those procedures traditionally performed by vascular surgeons, or if vascular surgeons increasingly specialize in procedures for which we do not sell devices.
The treatment of peripheral vascular disease is increasingly shifting from open vascular surgery to minimally invasive endovascular procedures. We market and sell our products primarily to vascular surgeons, who in addition to performing traditional open surgical procedures, in growing numbers also perform minimally invasive, image-guided interventional procedures for peripheral vascular disease. However, vascular surgeons may not adopt these procedures in the numbers we expect and instead these procedures may be largely performed by interventional cardiologists and interventional radiologists. Many of our competitors have focused their sales efforts on these interventionalists. If interventional cardiologists and interventional radiologists perform a greater percentage of these new procedures than we expect, our net sales may decline.
Moreover, demographic trends and other market factors, such as reimbursement rates, are driving vascular surgeons in the United States and potentially in other markets to increasingly specialize in certain kinds of procedures, such as endovascular therapies, the creation and maintenance of dialysis access sites, and the treatment of varicose veins. Sometimes these physicians will discontinue performing other vascular procedures. If this trend continues, it could lead to the fragmentation of our customer base, which would reduce cross-selling opportunities and the efficiency of each sales call by our sales representatives, which in turn would negatively impact our business.
We depend on our senior management team and other key scientific, sales, and technical personnel, and if we are unable to retain them or recruit additional qualified personnel we may not be able to manage our operations and meet our strategic objectives.
We depend on the continued services of our senior management team and other key scientific, sales, and technical personnel, as well as our ability to continue to attract and retain additional highly qualified personnel. Our ability to retain our skilled labor force and our success in attracting and hiring new skilled employees will be a critical factor in determining whether we will be successful in the future. Each of our key employees may terminate his or her employment with us at any time. The loss of any of our senior management team or key employees could harm our business. We compete for such personnel with other companies, academic institutions, government entities, and other organizations. We may not be able to meet our future hiring needs or retain existing personnel on acceptable terms. We could face significant challenges and risks in hiring, training, managing, and retaining engineering and sales employees. Any loss or interruption of the services of our other key personnel could also significantly reduce our ability to effectively manage our operations and meet our
27
Table of Contents
strategic objectives, because we cannot assure you that we would be able to find an appropriate replacement should the need arise. We maintain life insurance payable to us on our Chairman and Chief Executive Officer, George W. LeMaitre, but not on our other key personnel.
If we do not maintain our relationships with our physician customers, our growth may be limited and our business could be harmed.
Physicians typically influence the medical device purchasing decisions of the hospitals and other healthcare institutions in which they practice. Consequently, our relationships with our physician customers are critical to our continued growth. We believe that these relationships are based on our long-standing reputation and presence in the market for peripheral vascular devices, the quality of our product offerings and clinical outcomes, our marketing efforts and our presence at medical society meetings. Any actual or perceived diminution in our reputation or the quality of our products or our failure or inability to maintain these other efforts could damage our current relationships, or prevent us from forming new relationships, with physicians and cause our growth to be limited and our business to be harmed.
Our lack of customer purchase contracts makes it difficult to predict sales and plan manufacturing requirements, which could lead to lower net sales, higher expenses, and reduced margins.
We generally do not have long-term purchase contracts with our hospital customers, who typically order products on an as-needed basis. As a result, it is difficult to accurately forecast our component and product requirements. Our manufacturing and operating expenses are largely based on anticipated sales volume, and a significant portion of these expenses is and will continue to be fixed. We must plan production and order product components and third-party manufactured products several months in advance of customer orders. In addition, lead times for product components and third-party manufactured products that we order vary significantly and depend on factors such as the specific supplier and demand for each component at any given time. These factors expose us to a number of risks, such as the following:
| • | if we overestimate our requirements, or experience shortages, we may be obligated to carry more inventory than we need, which could result in write-offs of excess or obsolete inventory; |
| • | if we underestimate our requirements, we may have an insufficient product component inventory, which could disrupt manufacturing of our products and cause delays in shipments and net sales; and |
| • | if we experience shortages of product components from time to time, which could delay the manufacturing and shipping of our products. |
If any of the foregoing occurs, it could lead to lower net sales, higher expenses, and reduced margins.
The use or misuse of our products may result in injuries that lead to product liability suits, which could be costly to our business.
Although we offer training for physicians in the use of some of our products, we do not require that physicians be trained in the use of our products. Not requiring training specific to the use of our devices may expose us to greater risk of product liability if injuries occur during a procedure involving our products. In addition, if demand for our products continues to grow, less skilled surgeons will likely use the devices, potentially leading to an increased incidence of patient injury and an increased risk of product liability.
If our products are defectively designed, manufactured, or labeled, contain defective components, or are misused, or if our products are found to have caused or contributed to injuries or death, we may become subject to costly litigation by our customers or their patients. We are from time to time involved in product liability claims. Product liability claims could divert management’s attention from our core business, be expensive to defend, and result in sizable damage awards against us. Claims of this nature may also adversely affect our reputation, which could damage our position in the market and subject us to product recalls.
28
Table of Contents
We cannot assure you that our product liability insurance coverage will be sufficient to satisfy any claim made against us. Further, we may not be able to maintain the same level of coverage, and we may not be able to obtain adequate coverage at a reasonable cost and on reasonable terms, if at all. Any product liability claim brought against us, with or without merit, could increase our product liability insurance rates or prevent us from securing coverage in the future. Additionally, if any such product liability claim or series of claims is brought against us for uninsured liabilities or is in excess of our insurance coverage, our business could be harmed.
We rely on our independent distributors to market and sell our products in select markets outside of the United States and Canada.
Sales of our products through independent distributors represented 7% of our net sales for the year ended December 31, 2010. Our success in these markets depends largely upon marketing arrangements with distributors, in particular their sales and service expertise and relationships with their respective customers in the marketplace. Although we intend to replace some of these distributors with a direct sales force, this will take time and we may maintain a distribution model in some markets. We do not control our distributors and they may not be successful in implementing our marketing plans.
Many of our distributors initially obtain and maintain foreign regulatory approval for sale of our products in their respective countries. We do not have long-term contracts with many of our distributors, and our distributors may terminate their relationships with us on little or no notice. In addition, some of our distributors are not required to purchase any minimum amount of products from us, may sell products that compete with ours or devote more efforts to selling other products, and may stop selling our products at any time. If we lose any of our significant distributors, if we fail to recruit and retain additional skilled distributors in these locations, or if our distributors devote more effort to selling products other than ours, our operations could be harmed. We have experienced turnover with some of our distributors in the past that has impacted our short-term financial results while we transitioned to new distributors. Similar occurrences could happen in the future.
We may require additional capital and failure to attract additional capital on acceptable terms could impair our growth.
We may require additional capital to execute our strategies and expand our business. In particular, we depend on access to capital to acquire products and technologies that complement our existing product lines. If we complete an acquisition at a purchase price approaching or in excess of available capital resources, or if these resources are otherwise insufficient to fund our operations, we will require debt or equity financing. Equity financing, if available, may be dilutive to our stockholders. If we raise additional capital through the issuance of debt, this debt will be senior to our outstanding shares of capital stock upon our liquidation. The availability of such financing depends in large measure on capital markets and liquidity factors over which we exert little control. Financing may not be available or, if available, may not be available on terms satisfactory to us and could result in significant stockholder dilution. In addition, covenants in debt financing arrangements may restrict our ability to operate our business or obtain additional debt financing. These covenants may also require us to attain certain levels of financial performance and we may not be able to do so; any such failure may result in the acceleration of such debt and the foreclosure by our creditors on the collateral we used to secure the debt. We may also elect to raise additional funds through collaboration, licensing, marketing, or similar arrangements, and these arrangements may require us to relinquish valuable rights to our products or proprietary technologies, or grant licenses that are not favorable to us. If we fail to obtain sufficient additional capital in the future, we could be forced to curtail our growth strategy by reducing or delaying capital expenditures and acquisitions, delaying or postponing our product development efforts (including clinical studies), selling assets, restructuring our operations, or refinancing our indebtedness.
29
Table of Contents
From time to time we may become subject to tax audits or similar proceedings, and as a result we may owe additional taxes, interest, and penalties in amounts that may be material.
We are subject to income taxes in many countries, jurisdictions, and provinces, including the United States. In determining our global provision for income taxes, we are required to exercise judgment. Regularly, we make estimates where the ultimate tax determination is uncertain. While we believe our estimates are reasonable, we cannot assure you that the final determination of any tax audit or tax-related litigation will not be materially different from that reflected in our historical income tax provisions and accruals.
In addition, we are subject to sales, use, and similar taxes in many countries, jurisdictions, and provinces, including those states in the United States where we maintain a physical presence or have a substantial nexus. These taxing regimes are complex. For example, in the United States, each state and local taxing authority has its own interpretation of what constitutes a sufficient physical presence or nexus to require the collection and remittance of these taxes. Similarly, each state and local taxing authority has its own rules regarding the applicability of sales tax by customer or product type. We employ a variety of strategies from time to time with respect to our international operations. There can be no assurance that these strategies will be accepted by the relevant taxing authorities.
We have reviewed the tax positions taken, or to be taken, in our tax returns for all tax years currently open to examination by a taxing authority. As of December 31, 2010, the total amount of unrecognized tax benefits, that is the reserve for uncertain tax positions, was approximately $277,000. The assessment of additional taxes, interest, and penalties as a result of audits, litigation, or otherwise, could be materially adverse to our current and future results of operations and financial condition.
Risks Related to the Regulatory Environment
Oversight of the medical device industry might affect the manner in which we may sell medical devices and compete in the marketplace.
There are laws and regulations that govern the means by which companies in the healthcare industry may market their products to healthcare professionals and may compete by discounting the prices of their products, including for example, the federal Anti-Kickback Statute, the federal False Claims Act, the federal Health Insurance Portability and Accountability Act of 1996, state law equivalents to these federal laws that are meant to protect against fraud and abuse and analogous laws in foreign countries. Violations of these laws are punishable by criminal and civil sanctions, including, but not limited to, in some instances civil and criminal penalties, damages, fines, exclusion from participation in federal and state healthcare programs, including Medicare and Medicaid. Although we exercise care in structuring our sales and marketing practices and customer discount arrangements to comply with those laws and regulations, we cannot assure you that:
| • | government officials charged with responsibility for enforcing those laws will not assert that our sales and marketing practices or customer discount arrangements are in violation of those laws or regulations; or |
| • | government regulators or courts will interpret those laws or regulations in a manner consistent with our interpretation. |
Correspondingly, federal and state laws are also sometimes open to interpretation, and from time to time we may find ourselves at a competitive disadvantage if our interpretation differs from that of our competitors.
In January 2004, AdvaMed, the principal United States trade association for the medical device industry, put in place a model “code of conduct” that sets forth standards by which its members should abide in the promotion of their products. AdvaMed issued a revised “code of conduct” effective July 1, 2009. We have in place policies and procedures for compliance that we believe are at least as stringent as those set forth in the revised AdvaMed Code, and we provide routine training to our sales and marketing personnel on our policies regarding sales and
30
Table of Contents
marketing practices. Nevertheless, the sales and marketing practices of our industry have been the subject of increased scrutiny from federal and state government agencies, and we believe that this trend will continue. For example, recent federal legislation and state legislation would require detailed disclosure of gifts and other remuneration made to health care professionals. In addition, prosecutorial scrutiny and governmental oversight, on the state and federal levels, over device companies regarding the retention of healthcare professionals as consultants has limited the manner in which medical device companies may retain healthcare professionals as consultants. Various hospital organizations, medical societies and trade associations are establishing their own practices that may require detailed disclosures of relationships between healthcare professionals and medical device companies or ban or restrict certain marketing and sales practices such as gifts and business meals.
Our business is subject to complex, costly, and burdensome regulations. We could be subject to significant penalties if we fail to comply.
The production and marketing of our products and our ongoing research and development and clinical trial activities are subject to extensive regulation and review by numerous governmental authorities both in the United States and abroad. U.S. and foreign regulations applicable to medical devices are wide-ranging and govern, among other things, the testing, marketing, and premarket clearance or approval of new medical devices, in addition to regulating manufacturing practices, reporting, promotion and advertising, importing and exporting, labeling, and record-keeping procedures.
Our failure to comply with applicable regulatory requirements could result in governmental agencies or a court taking action, including any of the following:
| • | issuing public warning letters to us; |
| • | imposing fines and penalties on us; |
| • | issuing an injunction preventing us from manufacturing or selling our products; |
| • | bringing civil or criminal charges against us; |
| • | delaying the introduction of our new products into the market; |
| • | ordering a recall of, or detaining or seizing, our products; or |
| • | withdrawing or denying approvals or clearances for our products. |
If any or all of the foregoing were to occur, our business, results of operations, and reputation could suffer.
If we are not successful in obtaining and maintaining clearances and approvals from governmental agencies, we will not be able to sell our products, and our future growth will be significantly hampered.
Our products require premarket clearance or approval in the United States and the CE Mark or other approvals in foreign countries where they are sold. Each medical device that we wish to market in the United States generally must receive either 510(k) clearance, unless it is exempt, or approval of a premarket application, or PMA, from the FDA before the product can be marketed or sold. Either process can be lengthy and expensive. The FDA’s 510(k) clearance procedure usually takes from three to twelve months from the date the FDA receives the application, but may take significantly longer. Although 510(k) clearances have been obtained for nearly all of our current products that require 510(k) clearances, the FDA may condition, limit or prohibit our sales of these products if safety or effectiveness problems develop with the devices. Our new products or significantly modified marketed products could be denied 510(k) clearance and required to undergo the more burdensome PMA approval process if they are not found to be substantially equivalent.
The PMA approval process is much more costly, lengthy, and uncertain than the premarket notification process. It generally takes from six months to three years from the date the application is submitted to, and filed
31
Table of Contents
with, the FDA, and may take even longer. Achieving premarket approval typically requires extensive clinical trials and may require the filing of numerous amendments with the FDA over time. We do not have significant experience in obtaining PMA approval for our products. Our TAArget and UniFit products must receive PMA approval before being commercially distributed in the United States and we have determined not to pursue these approvals.
The FDA has proposed changes for which FDA clearance to market would possibly require clinical data, more extensive manufacturing information and postmarket data. The FDA is also proposing that an FDA inspection of the manufacturing facility may be required for certain products prior to clearance of the 510(k), which is similar to the requirements of a Class III device. As part of the 510(k) reform, the FDA proposes to issue regulations defining grounds and procedures for rescission of 510(k) applications that have previously been cleared to market. The FDA may also require the more extensive PMA process for certain products. Our ability to market our products outside the United States is also subject to regulatory approval, including our ability to demonstrate the safety and effectiveness of our products in the clinical setting. The products for which we are currently conducting studies are already approved for sale outside of the United States. While our studies are ongoing, unfavorable data may arise in connection with usage of our products outside the United States, which could adversely impact approval of our products in the United States. Conversely, unfavorable data from clinical studies in the United States may adversely impact sales of our products outside the United States.
Even if regulatory approval or clearance of a product is granted, the approval or clearance could limit the uses or the claims for which the product may be labeled and promoted, which may limit the market for our products. If we do not obtain and maintain foreign regulatory or FDA approval with respect to our products, as applicable, we will not be able to sell our products, and our future growth will be significantly hampered.
Modifications to our marketed devices may require new regulatory clearances or premarket approvals, or may require us to cease marketing or recall the modified devices until clearances or approvals are obtained.
Any modification to a 510(k)-cleared device that could significantly affect its safety or effectiveness, or would constitute a major change in its intended use, requires the submission of another 510(k) or PMA application to address the change. The FDA requires every manufacturer to make its own determination as to whether a modification requires a new 510(k) clearance or PMA. Although in the first instance we may determine that a change does not rise to a level of significance that would require us to make a submission, the FDA may review and disagree with our determination and can require us to submit a 510(k) or a PMA for a significant technological change or major change or modification in intended use. If the FDA requires us to submit a 510(k) or a PMA for any modification to a previously cleared device, we may be required to cease marketing the device, recall it, and not resume marketing until we obtain clearance or approval from the FDA for the modified version of the device. Delays in our receipt of regulatory clearance or approval will cause delays in our ability to sell our products, which could have a negative effect on our business, results of operations, and prospects. Also, we may be subject to regulatory fines, penalties, and/or other sanctions authorized by the Federal Food, Drug, and Cosmetic Act.
If we or some of our suppliers fail to comply with the FDA’s Quality System Regulation and other applicable postmarket requirements, our manufacturing operations could be disrupted, our product sales and profitability could suffer, and we may become subject to a wide variety of FDA enforcement actions.
After a device is placed on the market, numerous regulatory requirements apply. We are subject to inspection and marketing surveillance by the FDA to determine our compliance with all regulatory requirements. If the FDA finds that we have failed to comply with any regulatory requirements, it can institute a wide variety of enforcement actions.
We and some of our suppliers must comply with the FDA’s Quality System Regulation, which governs the methods used in, and the facilities and controls used for, the design, testing, manufacture, control, quality
32
Table of Contents
assurance, installation, servicing, labeling, packaging, storage, and shipping of medical devices. The FDA enforces the Quality System Regulation through unannounced inspections. We have been, and anticipate in the future being, subject to such inspections. If we or one of our suppliers fails a Quality System Regulation inspection, or if a corrective action plan adopted by us or one of our suppliers is not sufficient, the FDA may bring an enforcement action against us, and our operations could be disrupted and our manufacturing delayed.
We are also subject to the FDA’s general prohibition against promoting our products for unapproved or off-label uses and to the medical device reporting, or MDR, regulations that require us to report to the FDA if our products may have caused or contributed to a death or serious injury, or if our device malfunctions and a recurrence of the malfunction would likely result in a death or serious injury. We must also file reports with the FDA of some device corrections and removals, and we must adhere to the FDA’s rules on labeling and promotion. If we fail to comply with these or other FDA requirements or fail to take adequate corrective action in response to any significant compliance issue raised by the FDA, the FDA can take significant enforcement actions, which could harm our business, results of operations, and our reputation.
In addition, most other countries, such as Japan, require us to comply with manufacturing and quality assurance standards for medical devices that are similar to those in force in the United States before marketing and selling our products in those countries. If we fail to comply, we would lose our ability to market and sell our products in those foreign countries.
Even after receiving regulatory clearance or approval, our products may be subject to product recalls, which may harm our reputation and divert managerial and financial resources.
The FDA and similar governmental authorities in other countries have the authority to order mandatory recall of our products or order their removal from the market if the governmental entity finds that our products would cause serious adverse health consequences or death. A government mandated or voluntary recall by us could occur as a result of component failures, manufacturing errors or design defects, including labeling defects. For example, we initiated a voluntary recall of The UnBalloon Non-Occlusive Modeling Catheter in June 2010 due to a product design issue that compromised the safety of the product. Any future recall of our products may harm our reputation with customers and divert managerial and financial resources.
The adoption of healthcare reform in the United States may adversely affect our business, results of operations and/or financial condition.
In March 2010, significant reforms to the U.S. healthcare system were adopted in the form of the Patient Protection and Affordable Care Act (the PPACA). The PPACA includes provisions that, among other things, reduce and/or limit Medicare reimbursement, require all individuals to have health insurance (with limited exceptions) and impose new and/or increased taxes. Specifically, the law requires the medical device industry to subsidize healthcare reform in the form of a 2.3% excise tax on U.S. sales of most medical devices beginning in 2013. While we are still evaluating the impact of this tax on our overall business, in 2010 this would have equated to an excise tax of approximately $0.8 million. Various healthcare reform proposals have also emerged at the state level. The PPACA and these proposals could reduce medical procedure volumes and impact the demand for our products or the prices at which we sell our products. In addition, the excise tax will increase our cost of doing business. The impact of the PPACA and these proposals could harm our operating results and liquidity.
Domestic and foreign legislative or administrative reforms resulting in restrictive reimbursement practices of third-party payors and cost containment measures could decrease the demand for products purchased by our customers, the prices that our customers are willing to pay for those products and the number of procedures using our devices.
Our products are purchased principally by hospitals or physicians which typically bill various third-party payors, such as governmental programs (e.g., Medicare, Medicaid and comparable foreign programs), private
33
Table of Contents
insurance plans and managed care plans, for the healthcare services provided to their patients. The ability of our customers to obtain appropriate reimbursement for products and services from third-party payors is critical to the success of our products because it affects which products customers purchase and the prices they are willing to pay. Reimbursement varies by country and can significantly impact the acceptance of new technology. Implementation of healthcare reforms in the United States and in significant overseas markets such as Germany, Japan, France and other countries may limit, reduce or eliminate reimbursement for our products and adversely affect both our pricing flexibility and the demand for our products. Even when we develop or acquire a promising new product, we may find limited demand for the product unless reimbursement approval is obtained from private and governmental third-party payors.
Major third-party payors for hospital services in the United States and abroad continue to work to contain healthcare costs through, among other things, the introduction of cost containment incentives and closer scrutiny of healthcare expenditures by both private health insurers and employers. For example, in an effort to decrease costs, certain hospitals and other customers may resterilize our products intended for a single use or purchase reprocessed products from third-party reprocessors in lieu of purchasing new products from us.
Further legislative or administrative reforms to the reimbursement systems in the United States and abroad, or adverse decisions relating to our products by administrators of these systems in coverage or reimbursement, could significantly reduce reimbursement for procedures using our medical devices or result in the denial of coverage for those procedures. Examples of these reforms or adverse decisions include price regulation, competitive pricing, coverage and payment policies, comparative effectiveness of therapies, technology assessments and managed-care arrangements. Any of such reforms or adverse decisions resulting in restrictive reimbursement practices or denials of coverage could have an adverse impact on the acceptance of our products and the prices that our customers are willing to pay for them.
If we do not comply with foreign regulatory requirements to market our products outside the United States, our business will be harmed.
Sales of medical devices outside the United States are subject to international regulatory requirements that vary from country to country. These requirements and the amount of time required for approval may differ from our experiences with the FDA in the United States. In some cases, we rely on our non-U.S. distributors to obtain premarket approvals, complete product registrations, comply with clinical trial requirements, and complete those steps that are customarily taken in the applicable jurisdictions to comply with governmental and quasi-governmental regulation. In the future, we expect to continue to rely on distributors in this manner in those countries where we continue to market and sell our products through them. Failure to satisfy these foreign regulations would impact our ability to sell our products in these countries and could cause our business to suffer. There can be no assurance that we will be able to obtain or maintain the required regulatory approvals in these countries.
Our products are regulated in the European Union under the European Medical Devices Directive (93/42/EC as amended by 2007/47/EC). In order to market our medical devices in the European Union, we are required to obtain CE mark certification, which denotes conformity to the essential requirements of the Medical Devices Directive. We have received CE mark certification to sell nearly all of our products. However, there can be no assurance that we will be able to obtain a CE mark for new products in the future or for modifications to our existing products or in the manufacturing of our products, and obtaining a CE mark may involve a significant amount of time and expense, stringent clinical and preclinical testing, or modification of our products and could result in limitations being placed on the use of our products in order to obtain approval.
Maintaining a CE mark is contingent upon our continued compliance with applicable European medical device requirements, including limitations on advertising and promotion of medical devices and requirements governing the handling of adverse events. There can be no assurance that we will be successful in maintaining the CE mark for any of our current products. In particular, adverse event reporting requirements in the European
34
Table of Contents
Union mandate that we report incidents which led or could have led to death or serious deterioration in health. Under certain circumstances, we could be required to initiate a recall or removal of our product from the market in order to address product deficiencies or malfunctions. Any recall of our products may harm our reputation with customers and divert managerial and financial resources.
Failure to receive or maintain approval would prohibit us from selling these products in member countries of the European Union, and would require significant delays in obtaining individual country approvals. If we do not receive or maintain these approvals, our business could be harmed.
Our manufacturing facilities are subject to periodic inspection by European regulatory authorities and Notified Bodies, and we must demonstrate compliance with the Medical Devices Directive. Any failure by us to comply with European requirements in this regard may entail our taking corrective action, such as modification of our policies and procedures. In addition, we may be required to cease all or part of our operations for some period of time until we can demonstrate that appropriate steps have been taken. There can be no assurance that we will be found in compliance with such standards in future audits.
In Japan, the Ministry of Health, Labor and Welfare (the MHLW) regulates medical devices through the Pharmaceutical Affairs Law, which was reformed effective April 1, 2005. The revisions to Japanese regulations have resulted in longer lead times for product development.
Any such delay in product registrations could have a negative impact on our results of operations.
Certain of our products contain materials derived from animal sources and may become subject to additional regulation.
Our AlboGraft Vascular Graft, AlboSure Vascular Patch, and XenoSure Biologic Patch products contain bovine tissue or material derived from bovine tissue. Products that contain materials derived from animal sources, including food, pharmaceuticals and medical devices, are increasingly subject to scrutiny in the media and by regulatory authorities. Regulatory authorities are concerned about the potential for the transmission of disease from animals to humans via those materials. This public scrutiny has been particularly acute in Japan and Western Europe with respect to products derived from animal sources, because of concern that materials infected with the agent that causes bovine spongiform encephalopathy, otherwise known as BSE or mad cow disease, may, if ingested or implanted, cause a variant of the human Creutzfeldt-Jakob Disease, an ultimately fatal disease with no known cure. Cases of BSE in cattle discovered in Canada and the United States have increased awareness of the issue in North America. Certain countries, such as Japan, have issued regulations that require our products be processed from bovine tissue sourced from countries where no cases of BSE have occurred. Products that contain materials derived from animals, including our products, may become subject to additional regulation, or even be banned in certain countries, because of concern over the potential for the transmission of infections agents. Significant new regulation, or a ban of our products, could impair our current business or our ability to expand our business.
Compliance with environmental laws and regulations could be expensive. Failure to comply with environmental laws and regulations could subject us to significant liability.
Our manufacturing operations and our research and development programs involve the use of hazardous substances and are subject to a variety of federal, state, and local environmental laws and regulations relating to the storage, use, discharge, disposal, and remediation of, and human exposure to, hazardous substances. Our research and development and manufacturing operations produce biological waste materials, such as human and animal tissue, and waste solvents, such as isopropyl alcohol. Regulatory authorities permit these operations, and the resulting waste materials are disposed of in material compliance with environmental laws and regulations. Compliance with these laws and regulations is expensive, and non-compliance could result in substantial
35
Table of Contents
liabilities, which could exceed our insurance coverage. In addition, our manufacturing operations may result in the release, discharge, emission, or disposal of hazardous substances that could cause us to incur substantial liabilities, including costs for investigation and remediation.
We cannot assure you that violations of these laws and regulations will not occur in the future or have not occurred in the past as a result of human error, accidents, equipment failure, or other causes. The expense associated with environmental regulation and remediation could harm our financial condition and operating results.
Risks Related to Intellectual Property
If we fail to adequately protect our intellectual property rights, or prevent use of our intellectual property by third parties, we could lose a significant competitive advantage and our business may suffer.
Our success depends in part on obtaining, maintaining, and enforcing our patents, trademarks, and other proprietary rights, and our ability to avoid infringing on the proprietary rights of others. We take precautionary steps to protect our technological advantages and intellectual property. We rely upon patent, trade secret, copyright, know-how, and trademark laws, as well as license agreements and contractual provisions, to establish our intellectual property rights and protect our products. These measures may only afford limited protection and may not:
| • | prevent our competitors from duplicating our products; |
| • | prevent our competitors from gaining access to our proprietary information and technology; or |
| • | permit us to gain or maintain a competitive advantage. |
The issuance of a patent is not conclusive as to its validity or enforceability. Any patents we have obtained or will obtain in the future might also be invalidated or circumvented by third parties. In addition, our pending patent applications may not issue as patents or, if issued, may not provide commercially meaningful protection, as competitors may be able to design around our patents to produce alternative, non-infringing designs. Should such challenges to our patents be successful, competitors might be able to market products and use manufacturing processes that are substantially similar to ours.
Additionally, we may not be able to effectively protect our rights in unpatented technology, trade secrets, and confidential information. We have a policy of requiring key employees and consultants and corporate partners with access to trade secrets or other confidential information to execute confidentiality agreements. Our confidentiality agreements also require our employees to assign to us all rights to any inventions made or conceived during their employment with us. We also generally require our consultants to assign to us any inventions made during the course of their engagement by us. There can be no assurance, however, that these agreements will provide meaningful protection or adequate remedies for us in the event of unauthorized use, transfer, or disclosure of confidential information or inventions.
In addition, the laws of foreign countries may not protect our intellectual property rights effectively or to the same extent as the laws of the United States. If our intellectual property rights are not adequately protected, we may not be able to commercialize our technologies, products, or services and our competitors could commercialize similar technologies, which could result in a decrease in our sales and market share.
If third parties claim that we infringe upon their intellectual property rights, we may incur liabilities and costs, and we may have to redesign or discontinue selling the affected product.
The medical device industry is litigious with respect to patents and other intellectual property rights. Companies operating in our industry routinely seek patent protection for their product designs, and many of our principal competitors have large patent portfolios. Companies in the medical device industry have used
36
Table of Contents
intellectual property litigation to gain a competitive advantage. Whether a product infringes a patent involves complex legal and factual issues, the determination of which is often uncertain. We face the risk of claims that we have infringed on third parties’ intellectual property rights, and we cannot assure you that our products or methods do not infringe the patents or other intellectual property rights of third parties. Our efforts to identify and avoid infringing on third parties’ intellectual property rights may not always be successful. Any claims of patent or other intellectual property infringement, even those without merit, could:
| • | be expensive and time consuming to defend; |
| • | result in us being required to pay significant damages to third parties for past use of the asserted intellectual property; |
| • | harm our reputation; |
| • | cause us to cease making or selling products that incorporate the challenged intellectual property; |
| • | require us to redesign, reengineer, or rebrand our products, which may not be possible and could be costly and time consuming if it is possible to do so at all; |
| • | require us to enter into royalty or licensing agreements in order to obtain the right to use a third party’s intellectual property, which agreements may not be available on terms acceptable to us or at all; |
| • | divert the attention of our management and key personnel from other tasks important to the success of our business; or |
| • | result in our customers or potential customers deferring or limiting their purchase or use of the affected products until resolution of the litigation. |
It is also possible that one of our competitors could claim that our manufacturing process violates an existing patent. If we were unsuccessful in defending such a claim, we may be forced to stop production at one or more of our manufacturing facilities.
In addition, new patents obtained by our competitors could threaten a product’s continued life in the market even after it has already been introduced. If our business is successful, the possibility may increase that others will assert infringement claims against us.
If we believe our product is or may be the subject of a patent with a third party, we attempt to reach a license agreement with them to manufacture, market, and sell these products. If we fail to reach an agreement with a third party patent holder that covers a product we offer, we could be required to pay significant damages to third parties for past use of the asserted intellectual property and may be forced to cease making or selling products that incorporate the challenged intellectual property.
In addition, we may become subject to interference proceedings conducted in the United States Patent Office or opposition proceedings conducted in foreign patent offices challenging the priority of invention or the validity of our patents. For example, in 2005 and 2006, respectively, Boston Scientific Corporation initiated opposition proceedings in the European Patent Office claiming that we were not the first to file a patent application on certain material. As a result of these opposition proceedings, some of our patent claims were canceled.
We may become involved in lawsuits and administrative proceedings to protect, defend, or enforce our patents that would be expensive and time consuming.
In order to protect or enforce our patent rights, we may initiate patent litigation or interference or opposition proceedings against third parties in the United States or in foreign countries. The defense of intellectual property rights, including patent rights through lawsuits, interference, or opposition proceedings, and other legal and
37
Table of Contents
administrative proceedings can be costly and can divert our technical and management personnel from their normal responsibilities. Such costs increase our operating expenses and reduce our resources available for development activities. An adverse determination of any litigation or defense proceedings could put one or more of our patents at risk of being invalidated or interpreted narrowly and could put our patent applications at risk of not issuing.
Furthermore, because of the substantial amount of discovery required in connection with intellectual property litigation, there is a risk that some of our confidential information could be compromised by disclosure during this type of litigation. For example, during the course of this kind of litigation and despite protective orders entered by the court, confidential information may be inadvertently disclosed in the form of documents or testimony in connection with discovery requests, depositions, or study testimony. This disclosure could materially adversely affect our business and financial results.
If we fail to observe the terms of our agreements or fail to reach agreement with third-party patent holders, we may lose the ability to manufacture, market, or sell some of our products.
Certain aspects of our products are or may be the subject of patents held by third parties. If we believe our product is or may be the subject of a patent with a third party, we attempt to reach a license agreement with them to manufacture, market, and sell these products. These arrangements do or may require us to pay royalties, typically determined as a percentage of our net sales for the underlying product. If we fail to reach agreement with a third party patent holder that covers a product we offer, we could be required to pay significant damages to third parties for past use of the asserted intellectual property and may be forced to cease making or selling products that incorporate the challenged intellectual property. Further, if we enter into a license agreement regarding a third party patent, but we fail to make these payments or otherwise fail to observe the terms of these agreements, we may lose our ability to sell these products. For example, we manufacture, market, and sell our aortic stent grafts pursuant to a sublicense from Bard Peripheral Vascular, Inc., a subsidiary of C.R. Bard, Inc., to a U.S. patent covering aspects of ePTFE. Our arrangement with Bard may preclude us from assigning the sublicense to a third party, including in connection with the sale of more than 30% of our capital stock or all or substantially all of our assets, without the prior consent of Bard.
Risks Related to Our Common Stock
Our stock price may be volatile, and your investment in our common stock could suffer a decline in value.
There has been significant volatility in the market price and trading volume of equity securities that is unrelated to the financial performance of the companies issuing the securities. These broad market fluctuations may negatively affect the market price of our common stock. You may not be able to resell your shares at or above the price at which you purchased them due to fluctuations in the market price of our common stock caused by changes in our operating performance or prospects, a low volume of trading in our common stock, and other factors.
Some specific factors that may have a significant effect on our common stock market price include:
| • | actual or anticipated fluctuations in our operating results or future prospects; |
| • | our announcements or our competitors’ announcements of new products; |
| • | public concern as to the safety or efficacy of our products; |
| • | the public’s reaction to our press releases, our other public announcements, and our filings with the Securities and Exchange Commission; |
| • | our determination whether or not to continue the payment of quarterly cash dividends; |
38
Table of Contents
| • | our determination whether or not to continue our share repurchase program; |
| • | strategic actions by us or our competitors, such as acquisitions or restructurings; |
| • | changes in our growth rates or our competitors’ growth rates; |
| • | developments regarding our patents or proprietary rights or those of our competitors; |
| • | our inability to raise additional capital; |
| • | changes in financial markets or general economic conditions, including those resulting from war, incidents of terrorism, and responses to such events; |
| • | new laws or regulations or new interpretations of existing laws or regulations applicable to our business; |
| • | changes in accounting standards, policies, guidance, interpretations, or principles; |
| • | sales of common stock by us or our directors, officers, or principal stockholders; and |
| • | changes in stock market analyst recommendations or earnings estimates regarding our common stock, other comparable companies, or our industry generally. |
In the past, following periods of volatility in the market price of a company’s securities, securities class action litigation has often been instituted. A securities class action suit against us could result in substantial costs and divert our management’s attention and resources that would otherwise be used to benefit the future performance of our business.
Our directors, officers, and principal stockholders have significant voting power and may take actions that may not be in the best interests of our other stockholders.
Our directors, officers, and affiliated stockholders holding more than 5% of our common stock collectively control almost a majority of our outstanding common stock, assuming the exercise of all options held by such persons. As a result, these stockholders, if they act together, would be able to control the management and affairs of our company and most matters requiring stockholder approval, including the election of directors and approval of significant corporate transactions. This concentration of ownership may have the effect of delaying or preventing a change in control, might adversely affect the market price of our common stock, and may not be in the best interests of our other stockholders.
Future acquisitions that we make may be dilutive to our current stockholders.
We intend to pursue the acquisition of complementary products, technologies, or businesses, and in connection with these acquisitions we may use substantial portions of our available cash or make dilutive issuances of securities. In addition, an acquisition could impair our operating results by causing us to incur debt or requiring us to recognize acquisition expenses or amortize, depreciate, or impair acquired assets. This debt would be senior to our outstanding shares of capital stock upon our liquidation.
Our corporate documents and Delaware law contain provisions that could discourage, delay, or prevent a change in control of our company.
Provisions in our amended and restated certificate of incorporation and bylaws may have the effect of delaying or preventing a change of control or changes in our management. These provisions include the following:
| • | the division of our board of directors into three classes; |
| • | the right of the board of directors to elect a director to fill a vacancy created by the expansion of the board of directors or due to the resignation or departure of an existing board member; |
39
Table of Contents
| • | the prohibition of cumulative voting in the election of directors, which would otherwise allow less than a majority of stockholders to elect director candidates; |
| • | the requirement for the advance notice of nominations for election to the board of directors or for proposing matters that can be acted upon at a stockholders’ meeting; |
| • | the ability of our board of directors to alter our bylaws without obtaining stockholder approval; |
| • | the ability of the board of directors to issue, without stockholder approval, up to 5,000,000 shares of preferred stock with terms set by the board of directors, which rights could be senior to those of our common stock; |
| • | the elimination of the rights of stockholders to call a special meeting of stockholders and to take action by written consent in lieu of a meeting; |
| • | the required approval of at least 75% of the shares entitled to vote at an election of directors to adopt, amend or repeal our bylaws or repeal the provisions of our amended and restated certificate of incorporation regarding the election and removal of directors and the inability of stockholders to take action by written consent in lieu of a meeting; and |
| • | the required approval of at least 75% of the shares entitled to vote at an election of directors to remove directors with cause. |
We are also subject to the anti-takeover provisions of Section 203 of the Delaware General Corporation Law. Under these provisions, if anyone becomes an “interested stockholder,” we may not enter into a “business combination” with that person for three years without special approval, which could discourage a third party from making a takeover offer and could delay or prevent a change of control. For purposes of Section 203, “interested stockholder” means, generally, someone owning 15% or more of our outstanding voting stock or an affiliate of ours that owned 15% or more of our outstanding voting stock during the past three years, subject to certain exceptions as described in Section 203.
We have not established a minimum dividend payment level for our common stockholders and there are no assurances of our ability to pay dividends to common stockholders in the future.
In February 2011, our Board of Directors adopted a quarterly dividend program for the purpose of returning capital to our stockholders. However, we have not established a minimum dividend payment level for our common stockholders and our ability to pay dividends may be harmed by the risks and uncertainties described in this Annual Report on Form 10-K and in the other documents we file from time to time with the SEC. Future dividends, if any, will be authorized by our Board of Directors and declared by us based upon a variety of factors deemed relevant by our directors, including, among other things, our financial condition, liquidity, earnings projections and business prospects. In addition, financial covenants in any credit facility to which we become a party may restrict our ability to pay future quarterly dividends. We can provide no assurance of our ability to pay dividends in the future.
| Item 1B. | Unresolved Staff Comments |
None.
| Item 2. | Properties |
Our principal worldwide executive, distribution, and manufacturing operations are located at adjacent 27,098 square foot and 17,617 square foot leased facilities located in Burlington, Massachusetts. In addition, our international operations are headquartered at a 12,841 square foot leased facility located in Sulzbach, Germany, our LifeSpan manufacturing operations are located at a 9,425 square foot facility located in Laguna Hills, California, and our Asian operations are located at a 2,140 square foot leased facility located in Tokyo, Japan. In addition, we have an Italian sales office located in a 1,400 square foot leased facility located in Milan, Italy.
40
Table of Contents
We also lease 16,146 a square foot leased facility in Brindisi, Italy, where we formerly manufactured our AlboGraft Vascular Graft. We expect to exit this facility by March 31, 2011.
The leases for our Burlington, Sulzbach, Laguna Hills, Brindisi, Milan, and Tokyo facilities expire in 2017, 2016, 2011, 2016, 2016, and 2013, respectively. Based on our current operating plan, we believe our current facilities are adequate.
| Item 3. | Legal Proceedings |
In the ordinary course of business, we are from time to time involved in lawsuits, claims, investigations, proceedings, and threats of litigation consisting of intellectual property, commercial and other matters. While the outcome of these proceedings and claims cannot be predicted with certainty, there are no matters, as of December 31, 2010, that, in the opinion of management, might have a material adverse effect on our financial position, results of operations or cash flows.
| Item 4. | Removed and Reserved |
41
Table of Contents
| Item 5. | Market for Registrant’s Common Equity, Related Stockholder Matters and Issuer Purchases of Equity Securities |
Market Information
Our common stock began trading on The NASDAQ Global Market under the symbol “LMAT” on October 19, 2006. The following table sets forth the high and low sales closing prices of our common stock as reported on The NASDAQ National Market for the eight quarters ending December 31, 2010:
| High | Low | |||||||
| Year ended December 31, 2009: |
||||||||
| First quarter ended March 31, 2009 |
$ | 2.81 | $ | 1.91 | ||||
| Second quarter ended June 30, 2009 |
$ | 3.83 | $ | 2.23 | ||||
| Third quarter ended September 30, 2009 |
$ | 4.09 | $ | 2.82 | ||||
| Fourth quarter ended December 31, 2009 |
$ | 5.00 | $ | 4.00 | ||||
| Year ended December 31, 2010: |
||||||||
| First quarter ended March 31, 2010 |
$ | 5.11 | $ | 4.42 | ||||
| Second quarter ended June 30, 2010 |
$ | 5.81 | $ | 4.50 | ||||
| Third quarter ended September 30, 2010 |
$ | 7.28 | $ | 5.19 | ||||
| Fourth quarter ended December 31, 2010 |
$ | 7.09 | $ | 6.03 | ||||
Holders of Record
On March 23, 2011, the closing price per share of our common stock was $6.74 as reported on The NASDAQ Global Market, and we had approximately 414 stockholders of record. In addition, we believe that a significant number of beneficial owners of our common stock hold their shares in street name.
Dividend Policy
On February 28, 2011, our Board of Directors approved a policy for the payment of regular quarterly cash dividends on our common stock of $0.02 per share. The first quarterly dividend is payable on April 5, 2011, to stockholders of record at the close of business on March 22, 2011, and will be approximately $0.3 million. Future declarations of quarterly dividends and the establishment of future record and payment dates are subject to approval by our Board of Directors on a quarterly basis.
Stock Price Performance Graph
Set forth below is a graph comparing the cumulative total stockholder return on LeMaitre’s common stock with the NASDAQ US Composite Index, the NASDAQ Medical Equipment Index and a peer group for the period covering LeMaitre’s initial public offering on October 19, 2006, through the end of LeMaitre’s fiscal year ended December 31, 2010. The graph assumes an investment of $100.00 made at the opening of trading on October 20, 2006, in (i) LeMaitre’s common stock, (ii) the stocks comprising the NASDAQ US Composite Index, (iii) stocks comprising the NASDAQ Medical Equipment Index, and (iv) the stocks comprising our peer group. This graph is not “soliciting material,” is not deemed “filed” with the SEC and is not to be incorporated by reference into any filing of LeMaitre under the Securities Act of 1933, as amended, or the Securities Exchange Act of 1934, as amended, whether made before or after the date hereof and irrespective of any general incorporation language in any such filing.
42
Table of Contents
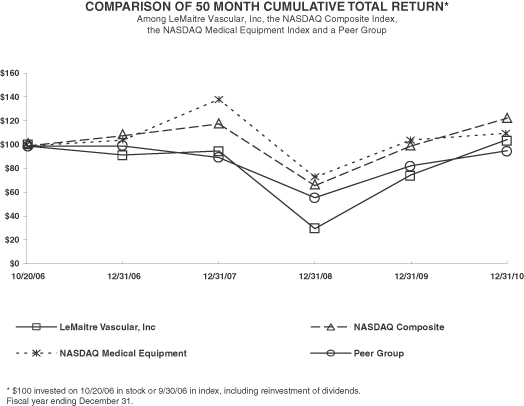
| 10/20/06 | 12/31/06 | 12/31/07 | 12/31/08 | 12/31/09 | 12/31/10 | |||||||||||||||||||
| LeMaitre Vascular, Inc |
100.00 | 93.02 | 96.12 | 35.78 | 77.52 | 104.96 | ||||||||||||||||||
| NASDAQ Composite |
100.00 | 107.83 | 120.31 | 71.20 | 103.38 | 121.53 | ||||||||||||||||||
| NASDAQ Medical Equipment |
100.00 | 104.19 | 139.61 | 74.19 | 104.21 | 109.90 | ||||||||||||||||||
| Peer Group |
100.00 | 99.08 | 94.55 | 70.03 | 84.79 | 96.26 | ||||||||||||||||||
LeMaitre’s fiscal year ends on the last day of December each year; data in the above table reflects market values for our stock and NASDAQ and peer group indices as of the close of trading on the last trading day of year presented.
The peer group includes the following companies: AngioDynamics, Inc., Cardiovascular Systems Inc., Endologix, Inc., Integra Lifesciences Holdings Corporation, Kensey Nash Corporation, Merit Medical Systems Inc., Spectranetics Corp., and Vascular Solutions, Inc.
Recent Sales of Unregistered Securities
Not Applicable.
43
Table of Contents
Issuer Purchases of Equity Securities
In the quarter ending December 31, 2010, we repurchased 5,516 shares of our common stock in conjunction with the forfeiture of shares to satisfy the employees’ obligations with respect to withholding taxes in connection with the vesting of shares of restricted stock.
| Issuer Purchases of Equity Securities | ||||||||||||||||
| Period |
Total Number of Shares (or Units) Purchased(1) |
Average Price
Paid Per Share (or Unit) |
Total Number of Shares (or Units) Purchased as Part of Publicly Announced Plans or Program(2) |
Maximum Number (or Approximate Dollar Value) of Shares (or Units that may yet be Purchased under the Plans or Program |
||||||||||||
| October 1, 2010 through October 31, 2010 |
— | $ | — | 41,269 | $ | 3,114,544 | ||||||||||
| November 1, 2010 through November 30, 2010 |
5,516 | $ | 6.73 | 60,933 | $ | 2,721,948 | ||||||||||
| December 1, 2010 through December 31, 2010 |
— | $ | — | 74,636 | $ | 2,234,121 | ||||||||||
| Total |
5,516 | $ | 6.73 | 176,838 | $ | 2,234,121 | ||||||||||
| (1) | For the three months ended December 31, 2010, we repurchased 5,516 shares of our common stock to satisfy the employees’ obligations with respect to withholding taxes in connection with the vesting of restricted stock units. |
| (2) | In July 2009, our Board of Directors authorized the repurchase of up to $1.0 million of our common stock from time to time on the open market or in privately negotiated transactions. In October 2009, our Board of Directors increased this amount to $2.0 million, and in July 2010, our Board of Directors further increased this amount to $5.0 million. The expiration date of this program is December 31, 2011. |
44
Table of Contents
| Item 6. | Selected Financial Data |
You should read the following selected consolidated financial data in conjunction with our consolidated financial statements and the related notes which are included elsewhere in this Annual Report and the “Management’s Discussion and Analysis of Financial Condition and Results of Operations” section of this Annual Report. We have derived the consolidated statement of operations data for the years ended December 31, 2010, 2009, and 2008, and the consolidated balance sheet data as of December 31, 2010 and 2009, from our audited consolidated financial statements, which are included elsewhere in this Annual Report. We have derived the consolidated statement of operations data for the years ended December 31, 2007 and 2006, and the consolidated balance sheet data as of December 31, 2008, 2007, and 2006 from our audited consolidated financial statements, which are not included in this Annual Report. Our historical results for any prior period are not necessarily indicative of results to be expected for any future period.
| Year ended December 31, | ||||||||||||||||||||
| 2010 | 2009 | 2008 | 2007 | 2006 | ||||||||||||||||
| (in thousands, except per share data) | ||||||||||||||||||||
| Consolidated Statements of Operations Data: |
||||||||||||||||||||
| Net sales |
$ | 56,060 | $ | 50,908 | $ | 48,720 | $ | 41,446 | $ | 34,628 | ||||||||||
| Cost of sales |
14,341 | 13,604 | 14,817 | 10,739 | 9,367 | |||||||||||||||
| Gross profit |
41,719 | 37,304 | 33,903 | 30,707 | 25,261 | |||||||||||||||
| Operating expenses: |
||||||||||||||||||||
| Sales and marketing |
19,409 | 17,710 | 19,762 | 19,443 | 15,183 | |||||||||||||||
| General and administrative |
10,506 | 9,852 | 9,999 | 9,534 | 7,105 | |||||||||||||||
| Research and development |
5,488 | 5,910 | 5,328 | 4,591 | 3,301 | |||||||||||||||
| Purchased research and development |
— | — | — | 373 | — | |||||||||||||||
| Restructuring charges |
1,816 | 1,777 | 1,147 | 1,042 | 257 | |||||||||||||||
| Impairment charge |
485 | 106 | 597 | 7 | 94 | |||||||||||||||
| Total operating expenses |
37,704 | 35,355 | 36,833 | 34,990 | 25,940 | |||||||||||||||
| Income (loss) from operations |
4,015 | 1,949 | (2,930 | ) | (4,283 | ) | (679 | ) | ||||||||||||
| Other income (expense): |
||||||||||||||||||||
| Interest income |
31 | 38 | 530 | 1,299 | 299 | |||||||||||||||
| Interest expense |
(5 | ) | (26 | ) | (61 | ) | (1 | ) | (296 | ) | ||||||||||
| Investment impairment |
— | — | (168 | ) | — | — | ||||||||||||||
| Foreign currency gain (loss) |
(30 | ) | 280 | (139 | ) | 292 | 228 | |||||||||||||
| Other income (expense), net |
14 | (26 | ) | (53 | ) | (9 | ) | (72 | ) | |||||||||||
| Total other income |
10 | 266 | 109 | 1,581 | 159 | |||||||||||||||
| Income (loss) before income tax |
4,025 | 2,215 | (2,821 | ) | (2,702 | ) | (520 | ) | ||||||||||||
| Provision (benefit) for income taxes |
(1,988 | ) | 617 | 493 | 232 | 652 | ||||||||||||||
| Net income (loss) |
$ | 6,013 | $ | 1,598 | $ | (3,314 | ) | $ | (2,934 | ) | $ | (1,172 | ) | |||||||
| Net income (loss) per share available for common shareholders: |
||||||||||||||||||||
| Basic |
$ | 0.38 | $ | 0.10 | $ | (0.21 | ) | $ | (0.19 | ) | $ | (0.15 | ) | |||||||
| Diluted |
$ | 0.37 | $ | 0.10 | $ | (0.21 | ) | $ | (0.19 | ) | $ | (0.15 | ) | |||||||
| Weighted-average shares outstanding: |
||||||||||||||||||||
| Basic |
15,627 | 15,687 | 15,572 | 15,398 | 9,904 | |||||||||||||||
| Diluted |
16,114 | 15,916 | 15,572 | 15,398 | 9,904 | |||||||||||||||
45
Table of Contents
| December 31, | ||||||||||||||||||||
| 2010 | 2009 | 2008 | 2007 | 2006 | ||||||||||||||||
| (in thousands) | ||||||||||||||||||||
| Consolidated Balance Sheet Data: |
||||||||||||||||||||
| Cash and cash equivalents |
$ | 22,614 | $ | 23,192 | $ | 15,895 | $ | 6,397 | $ | 17,636 | ||||||||||
| Marketable securities |
— | 808 | 5,359 | 16,198 | 13,182 | |||||||||||||||
| Current assets |
42,911 | 39,550 | 37,116 | 41,766 | 43,641 | |||||||||||||||
| Total assets |
63,274 | 56,906 | 54,399 | 60,857 | 56,963 | |||||||||||||||
| Revolving line of credit and current portion of long-term debt |
— | — | — | 262 | — | |||||||||||||||
| Current liabilities (excluding revolving line of credit and current portion of long-term debt) |
10,389 | 6,548 | 6,933 | 9,783 | 5,378 | |||||||||||||||
| Long-term liabilities |
529 | 2,145 | 1,718 | 2,226 | 886 | |||||||||||||||
| Total liabilities |
10,918 | 8,693 | 8,651 | 12,271 | 6,264 | |||||||||||||||
| Total stockholders’ equity |
52,356 | 48,213 | 45,748 | 48,586 | 50,699 | |||||||||||||||
| Item 7. | Management’s Discussion and Analysis of Financial Condition and Results of Operations |
The following discussion should be read in conjunction with our consolidated financial statements and the related notes contained elsewhere in this Annual Report on Form 10-K and in our other Securities and Exchange Commission filings. The following discussion may contain predictions, estimates, and other forward-looking statements that involve a number of risks and uncertainties, including those discussed under “Risk Factors” and elsewhere in this Annual Report on Form 10-K. These risks could cause our actual results to differ materially from any future performance suggested below.
Overview
We are a medical device company that develops, manufactures, and markets medical devices and implants for the treatment of peripheral vascular disease. Our principal product offerings are sold throughout the world, primarily in the United States, the European Union and, to a lesser extent, Japan. We estimate that the annual worldwide market addressed by our core product lines approximates $750 million and that the annual worldwide market for all peripheral vascular devices approximates $3 billion. We have used acquisitions as a primary means of further accessing the larger peripheral vascular device market, and we expect to continue to pursue this strategy in the future. We currently manufacture most of our product lines in our Burlington, Massachusetts, headquarters.
Our products are used by vascular surgeons who treat peripheral vascular disease through both open surgical methods and more recently adopted endovascular techniques. In contrast to interventional cardiologists and interventional radiologists, neither of whom are certified to perform open surgical procedures, vascular surgeons can perform both open surgical and minimally invasive endovascular procedures, and are therefore uniquely positioned to provide patients with a wider range of treatment options.
Below is a listing of our principal product lines and product categories:
| • | Our Vascular product category includes our balloon catheters, carotid shunts, remote endarterectomy devices, valvulotomes, vascular grafts, and vessel closure systems. We also report the results of our distribution of the Xenosure Biologic Patch and ArterX Vascular Sealant within this category. |
| • | Our Endovascular product category includes our aortic stent grafts and radiopaque marking tape. We also report the results of our distribution of the Endologix Powerlink System within this category. |
| • | Our General Surgery product category consists of our laparoscopic cholecystectomy devices. |
46
Table of Contents
We evaluate the sales performance of our various product lines utilizing criteria that vary based upon the position of each product line in its expected life cycle. For established products, we typically review unit sales and selling prices. For newer or faster growing products, we typically also focus upon new account generation and customer retention.
Our business opportunities include the following:
| • | the addition of complementary products through acquisitions; |
| • | the updating of existing products and introduction of new products through research and development; |
| • | the long-term growth of our sales force in North America, Europe and Japan; and |
| • | the introduction of our products in new markets upon obtainment of regulatory approvals in these markets. |
We are currently pursuing each of these opportunities.
To assist us in evaluating our business strategies, we regularly monitor long-term technology trends in the peripheral vascular device market. Additionally, we consider the information obtained from discussions with the medical community in connection with the demand for our products, including potential new product launches. We also use this information to help determine our competitive position in the peripheral vascular device market and our manufacturing capacity requirements.
We sell our products primarily through a direct sales force. As of December 31, 2010 our sales force was comprised of 67 sales representatives in North America, the European Union and Japan. We also sell our products in other countries through a network of distributors. Our worldwide headquarters are located in Burlington, Massachusetts. Our international operations are headquartered in Sulzbach, Germany. We also have sales offices located in Tokyo, Japan, and Milan, Italy, and a manufacturing facility in Laguna Hills, California. In 2010, approximately 93% of our net sales were generated in markets in which we employ direct sales representatives.
In recent years we have experienced comparatively greater success in product markets characterized by low or limited competition, for example the market for remote endarterectomy devices. In these markets, we believe that we have been able to increase selling prices without sacrificing material market share, to the benefit of our rate of net sales growth. In contrast, we have experienced comparatively lesser success in highly competitive product markets such as aortic stent grafts, where we face intense competition from larger companies with greater resources. While this latter trend may moderate as we continue to grow our organization, and while we believe that this trend can be mitigated by our strong relationships with our vascular surgeon customers, there can be no assurance that we will be successful in highly competitive markets.
Because we believe that direct-to-hospital sales engender closer customer relationships, and allow for higher selling prices and gross margins, we periodically enter into transactions with our distributors to transition their sales of our medical devices to our direct sales organization:
| • | In March 2009, we entered into a definitive agreement with Edwards Lifesciences to terminate its distribution of our AlboGraft Vascular Graft. We paid $3.5 million to Edward Lifesciences in exchange for this early termination, the purchase of their AlboGraft customer list, certain customer contracts and remaining AlboGraft inventory, and their provision of sales and marketing services. |
| • | In December 2010, we entered into a definitive agreement with Cardiva, S.L. to terminate its distribution of our products in Spain effective as of June 30, 2011. The agreement requires us to pay approximately $1.1 million in exchange for this early termination, the purchase of their Spanish customer list for our products, certain customer contracts, and their provision of sales and marketing services. We are also required to repurchase certain inventory. |
47
Table of Contents
| • | In December 2010, we entered into a definitive agreement with Marcom Medical ApS to terminate its distribution of our products in Denmark effective as of June 30, 2011. The agreements require us to pay approximately $0.2 million in exchange for this early termination, the purchase of their Danish customer list for our products, certain customer contracts, and their provision of sales and marketing services. We are also required to repurchase certain inventory. |
We anticipate that the expansion of our direct sales organization to Spain, and to a lesser extent, Denmark may result in increased sales and marketing expenses during the second half of 2011.
Our strategy for growing our business includes the acquisition of complementary product lines and companies and occasionally the discontinuance or divestiture of products or activities that are no longer complementary:
| • | In December 2008, we entered into an agreement with Neovasc Inc. to distribute the XenoSure Biologic Vascular Patch. We began selling this product in 2009. |
| • | In March 2010, we discontinued our Aspire Stent. |
| • | In June 2010, we divested our OptiLock Implantible Port to Minvasive Ltd. for $0.2 million. |
| • | In November 2010, we acquired our LifeSpan ePTFE Vascular Graft from affiliates of Angiotech Pharmaceuticals, Inc. for $2.8 million and related assets from Edwards Lifesciences for $1.2 million. |
These activities may affect the comparability of our financial results from period to period and may cause substantial fluctuations from period to period. In particular, we expect that the LifeSpan acquisition will increase sales by approximately $1.7 million but reduce operating income by approximately $0.7 million in 2011 as we integrate this product.
In October 2010, we discontinued research and development activities and suspended clinical studies related to our TAArget and UniFit aortic stent grafts, and in January 2011 we initiated a process to potentially divest these products. There can be no assurance that we will be successful in divesting these products on terms acceptable to us. We had revenues from these products of approximately $2.6 million in 2010.
In October 2010, we announced a reorganization plan designed to eliminate redundant costs resulting from our 2007 acquisition of Biomateriali Srl and to improve efficiencies in our manufacturing operations by transitioning the production of our AlboGraft Vascular Graft to our corporate headquarters in Burlington, Massachusetts. The plan provides for the termination of employees, the relocation of manufacturing equipment, the eventual dissolution of our Biomateriali Srl subsidiary, and the hiring of approximately 15 employees to staff the required functions in Burlington. In connection with this plan, we incurred approximately $1.4 million in severance and associated costs to the employees at our Brindisi, Italy manufacturing facility, of which $0.9 million was paid in December 2010 and the balance will be paid in 2011. In addition, we incurred $0.4 million loan charges, the abandonment of fixed assets and legal fees associated with the negotiation of the severance agreements. We expect to incur approximately $1.2 million of additional restructuring charges, of which $0.7 million will be non-cash, related to the closure and transfer of this facility in 2011.
Fluctuations in the rate of exchange between the U.S. dollar and foreign currencies, primarily the euro, affect our financial results. For the year ended December 31, 2010, approximately 38% of our sales were from outside the Americas. We expect that foreign currencies will continue to represent a similarly significant percentage of our sales in the future. Selling, marketing, and administrative costs related to these sales are largely denominated in the same respective currency, thereby partially mitigating our transaction risk exposure. We therefore believe that the risk of a significant impact on our operating income from foreign currency fluctuations is moderated. However, most of our foreign sales are denominated in local currency, and if there is an increase in the rate at which a foreign currency is exchanged for U.S. dollars, it will require more of the foreign currency to equal a specified amount of U.S. dollars than before the rate increase. In such cases we will receive less in U.S. dollars than we did before the rate increase went into effect.
48
Table of Contents
The following table indicates the impact of foreign currency fluctuations and changes to our business activities for each of our quarters during the three most recently completed fiscal years:
| (amounts in thousands) | 2010 | 2009 | 2008 | |||||||||||||||||||||||||||||||||||||||||||||
| Q4 | Q3 | Q2 | Q1 | Q4 | Q3 | Q2 | Q1 | Q4 | Q3 | Q2 | Q1 | |||||||||||||||||||||||||||||||||||||
| Total net sales |
14,431 | 13,656 | 14,158 | 13,815 | 13,584 | 13,346 | 12,630 | 11,348 | 12,111 | 12,023 | 12,739 | 11,847 | ||||||||||||||||||||||||||||||||||||
| Impact of currency exchange rate fluctuations(1) |
(420 | ) | (418 | ) | (336 | ) | 314 | 613 | (215 | ) | (699 | ) | (622 | ) | (448 | ) | 452 | 836 | 674 | |||||||||||||||||||||||||||||
| Net impact of acquisitions, distributed sales and discontinued products, excluding currency exchange rate fluctuations(2) |
56 | (105 | ) | (65 | ) | 95 | 397 | 333 | 234 | 101 | 235 | 703 | 929 | 1,133 | ||||||||||||||||||||||||||||||||||
| (1) | Represents the impact of the change in foreign exchange rates compared to the corresponding quarter of the prior year based on the weighted average exchange rate for each quarter. |
| (2) | Represents the impact of sales of products of acquired businesses and distributed sales of other manufacturers’ products, net of sales related to discontinued and divested products, based on 12 months’ sales following the date of the event or transaction, for the current period only. |
Adjustments to Previously Issued Unaudited Preliminary Results of Operations
Subsequent to the issuance on February 28, 2011 of our earnings release for the quarter and year ended December 31, 2010, we discovered that, as of the time of the earnings release, we had under-accrued restructuring expenses with respect to the closure of our Brindisi, Italy manufacturing facility by approximately $0.3 million for the quarter and year ended December 31, 2010, and as a result, our operating expenses for these periods were understated by this amount. Adjusted for the under-accrual, for the quarter and year ended December 31, 2010, our operating expenses were $11.6 million and $37.7 million, respectively. The increase in operating expenses caused (a) an increase in loss from operations from $1.0 million to $1.3 million, and a decrease in net income from $2.1 million to $2.0 million, or from $0.13 cents per fully diluted share to $0.12 cents per fully diluted share, for the quarter ended December 31, 2010, and (b) a decrease in income from operations from $4.3 million to $4.0 million, and a decrease in net income from $6.2 million to $6.0 million, or from $0.38 cents per fully diluted share to $0.37 cents per fully diluted share, for the year ended December 31, 2010.
In addition, on our consolidated balance sheet as at December 31, 2010, total assets increased from $63.2 million to $63.3 million, current liabilities increased from $10.0 million to $10.4 million, long-term liabilities decreased from $0.7 million to $0.5 million, total liabilities increased from $10.7 million to $10.9 million, and total stockholders’ equity decreased from $52.5 million to $52.4 million. There were no other revisions to the financial results set forth in the Earnings Release.
Our audited consolidated financial statements for the year ended December 31, 2010 included in this Annual Report on Form 10-K reflect these revisions.
Net Sales and Expense Components
The following is a description of the primary components of our net sales and expenses:
Net sales. We derive our net sales from the sale of our products, less discounts and returns. Most of our sales are generated by our direct sales force and are shipped and billed to hospitals or clinics throughout the world. In countries where we do not have a direct sales force, sales are primarily generated by shipments to distributors who, in turn, sell to hospitals and clinics. In those cases where our products are held on consignment at a hospital or clinic, we generate sales at the time the product is used in surgery rather than at shipment.
49
Table of Contents
Cost of sales. We manufacture nearly all of the products that we sell. Our cost of sales consists primarily of manufacturing personnel, raw materials and components, depreciation of property and equipment, and other allocated manufacturing overhead, as well as freight expense we pay to ship products to customers.
Sales and marketing. Our selling and marketing expense consists primarily of salaries, commissions, stock based compensation, travel and entertainment, attendance at medical society meetings, training programs, advertising and product promotions, direct mail, and other marketing costs.
General and administrative. General and administrative expense consists primarily of executive, finance and human resource expense, stock based compensation, legal and accounting fees, information technology expense, intangible amortization expense, and insurance expense.
Research and development. Research and development expense includes costs associated with the design, development, testing, enhancement, and regulatory approval of our products. It also includes costs associated with design and execution of clinical studies, regulatory submissions and costs to register, maintain, and defend our intellectual property, and royalty payments associated with licensed and acquired intellectual property.
Restructuring. Restructuring expense includes costs directly associated with distribution agreement termination expenses, severance, and retention costs for terminated employees, and other expenses associated with restructuring our operations.
Other income (expense). Other income (expense) primarily includes interest income and expense, investment impairment charges, foreign currency gains (losses), and other miscellaneous gains (losses).
Income tax expense. We are subject to federal and state income taxes for earnings generated in the United States, which include operating losses in certain foreign jurisdictions for certain years depending on tax elections made, and foreign taxes on earnings of our wholly-owned German, French, Italian, and Japanese subsidiaries. Our consolidated tax expense is affected by the mix of our taxable income (loss) in the United States, Germany, France, Italy, and Japan, permanent items, discrete items, unrecognized tax benefits, and amortization of goodwill for U.S tax reporting purposes.
Results of Operations
Comparison of the year ended December 31, 2010, to the year ended December 31, 2009
The following tables set forth, for the periods indicated, our results of operations and the change between the specified periods expressed as a percent increase or decrease:
| 2010 | 2009 | $ Change | Percent change |
|||||||||||||
| ($ in thousands) | ||||||||||||||||
| Net sales |
$ | 56,060 | $ | 50,908 | $ | 5,152 | 10 | % | ||||||||
| Net sales by product category: |
||||||||||||||||
| Vascular |
$ | 40,022 | $ | 34,265 | $ | 5,757 | 17 | % | ||||||||
| Endovascular |
12,040 | 12,363 | (323 | ) | (3 | %) | ||||||||||
| General Surgery |
3,882 | 3,836 | 46 | 1 | % | |||||||||||
| Total Branded Products |
55,944 | 50,464 | 5,480 | 11 | % | |||||||||||
| OEM |
116 | 444 | (328 | ) | * | |||||||||||
| Total |
$ | 56,060 | $ | 50,908 | $ | 5,152 | 10 | % | ||||||||
| Net sales by geography: |
||||||||||||||||
| Americas |
$ | 34,575 | $ | 29,420 | $ | 5,155 | 18 | % | ||||||||
| International |
21,485 | 21,488 | (3 | ) | * | |||||||||||
| Total |
$ | 56,060 | $ | 50,908 | $ | 5,152 | 10 | % | ||||||||
| * | Not a meaningful percentage. |
50
Table of Contents
Net sales. Net sales increased 10% to $56.1 million in 2010 from $50.9 million in 2009. Sales in our Vascular product category grew 17%, while sales in our Endovascular product category decreased by 3% and General Surgery increased by 1% from the previous year. Foreign currency exchange rates subtracted 2% from year over year sales growth. Sales increases in 2010 were largely driven by higher average selling prices across nearly all product lines, as well as stronger sales of our Vascular products which included increased sales of valvulotomes of $1.7 million, biologic patches of $1.1 million, and carotid shunts of $0.8 million. These gains were partially offset by a $0.3 million decrease in our Endovascular product category, primarily due to decreased TAArget and UniFit stent graft sales of $0.7 million. Sales were unfavorably impacted by the effect of currency exchange rate fluctuations by $0.9 million.
TAArget and UniFit stent graft sales declined by 21% in 2010 compared to the prior year. The results were due mainly to the retirement of our largest stent graft customer in the fourth quarter of 2009, a reduction in sales to a distributor in Greece, and strong competitor product offerings. We suspended our clinical trials and ceased development efforts related to these products in November 2010. We expect that our TAArget and UniFit sales will continue to decline in 2011 as we divert corporate resources to other product lines.
In November 2010, we acquired the LifeSpan ePTFE Vascular Graft. Net sales of this product were $0.1 million in December 2010, primarily in Europe.
Direct-to-hospital net sales were 93% in 2010, up from 92% in 2009. The increase was primarily due to the conversion of our AlboGraft Vascular Graft from a distribution model to a direct sales model in March 2009, resulting in an additional three months of direct sales in 2010.
Net sales by geography. Net sales in the Americas increased $5.2 million to $34.6 million in 2010. The increase was mainly the result of higher average selling prices, increased biologic patch sales of $1.1 million, and strong results across nearly all of our Vascular product offerings. International net sales of $21.5 million were flat in 2010. International sales were favorably impacted by a $1.6 million increase in Vascular products sales, led by vascular graft and valvulotome sales, as well as a $0.4 million increase in Powerlink System sales. International sales were unfavorably impacted by the effect of currency exchange rate fluctuations of $0.9 million and a $0.7 million decrease in sales of our own aortic stent grafts and a $0.3 million decrease in sales to the one private label customer of our Biomateriali subsidiary. We have terminated our relationship with this customer, who purchased $0.1 million of dacron-related products in 2010, and do not expect this revenue to recur in 2011.
International direct-to-hospital net sales were 84% in 2010, up from 83% in 2009. The increase was primarily due to our direct sales of the AlboGraft Vascular Graft for twelve months in 2010 as opposed to nine months in 2009.
| 2010 | 2009 | $ Change | Percent change |
|||||||||||||
| ($ in thousands) | ||||||||||||||||
| Gross profit |
$ | 41,719 | $ | 37,304 | $ | 4,415 | 12 | % | ||||||||
| Gross margin |
74.4 | % | 73.3 | % | * | 1.1 | % | |||||||||
| * | Not applicable |
Gross profit. Gross profit increased 12% to $41.7 million in 2010 from $37.3 million in 2009, while our gross margin increased 1.1% to 74.4%. The gross margin increase was largely the result of improved manufacturing efficiencies in our Burlington facility, higher average selling prices across nearly all product lines, particularly in the United States, and favorable geographic sales mix versus the prior year. The gross margin increase was partially offset by an increase in excess and obsolete inventory write-downs of $0.5 million, manufacturing start-up costs associated with the transfer of AlboGraft Vascular Graft manufacturing to our Burlington, Massachusetts headquarters, and sales growth in our comparatively lower margin polyester grafts and distributed products. We expect AlboGraft manufacturing start-up costs and Biomateriali plant closure costs to continue to adversely affect the gross margin in 2011.
51
Table of Contents
| 2010 | 2009 | $ change | Percent change |
2010 as a% of Revenue |
2009 as a% of Revenue |
|||||||||||||||||||
| ($ in thousands) | ||||||||||||||||||||||||
| Sales and marketing |
$ | 19,409 | $ | 17,710 | $ | 1,699 | 10 | % | 35 | % | 35 | % | ||||||||||||
| General and administrative |
10,506 | 9,852 | 654 | 7 | % | 19 | % | 19 | % | |||||||||||||||
| Research and development |
5,488 | 5,910 | (422 | ) | (7 | %) | 10 | % | 12 | % | ||||||||||||||
| Restructuring charges |
1,816 | 1,777 | 39 | 2 | % | 3 | % | 3 | % | |||||||||||||||
| Impairment charge |
485 | 106 | 379 | * | * | * | ||||||||||||||||||
| $ | 37,704 | $ | 35,355 | $ | 2,349 | 7 | % | 67 | % | 69 | % | |||||||||||||
| * | Not a meaningful percentage. |
Sales and marketing. Sales and marketing expense increased 10% to $19.4 million in 2010, from $17.7 million in 2009. Selling expenses increased $1.7 million to $16.3 million while marketing expenses remained relatively flat. Changes in foreign currency exchange rates reduced sales and marketing expense by $0.3 million compared to the prior year. Selling expense increases were largely driven by higher commission costs of $1.5 million and higher base compensation costs of $0.5 million, partly due to additional sales representatives. As a percentage of net sales, sales and marketing expenses were 35% in 2010, comparable to the prior year. At the end of 2010, we employed 67 sales representatives worldwide, as compared to 61 at the end of 2009. We plan to continue to increase the size of our sales force in 2011, and we expect that related cost increases may be partially offset by reduced commission expenses primarily from the reduction of periodic sales contests. In addition, we intend to commence direct sales in Spain and Denmark in 2011. We expect to incur additional selling and marketing expenses as we hire sales personnel in those countries.
General and administrative. General and administrative expense increased 7% to $10.5 million in 2010 from $9.9 million in 2009. The increase was largely the result of higher personnel costs of $0.9 million, and was partially offset by a decrease in professional services of $0.2 million and changes in foreign currency exchange rates of $0.1 million. As a percentage of net sales, general and administrative expenses were 19% in both 2010 and 2009.
Research and development. Research and development expenses decreased 7% to $5.5 million in 2010 from $5.9 million in 2009. As a percentage of net sales, research and development expense decreased to 10% in 2010 from 12% in 2009. The decrease was driven primarily by a reduction of regulatory and clinical affairs costs of $0.4 million to $2.0 million in 2010, largely due to reduced animal testing as well as a reduction in the use of outside services following the suspension of enrollment of our UNITE and ENRUST trials in October 2010. Expenses related to product development and royalties remained consistent between 2010 and 2009. We expect clinical and regulatory expenses will continue to decline as expenses associated with our clinical trials abate; however, we plan to reallocate a portion of these savings to additional product development in 2011.
Restructuring. Restructuring charges were $1.8 million in 2010 and 2009. In 2010, we incurred a $1.8 million restructuring charge related to the closure of our Biomateriali manufacturing facility in Brindisi, Italy, and the related transition of production to our existing corporate headquarters in Burlington, Massachusetts. The restructuring charge consisted of $1.4 million of employee-related severance charges, $0.3 million of charges associated with repayment of a development grant and loan from the Italian government, and $0.1 million of charges related to the abandonment of fixed assets and legal fees. We expect to incur approximately $1.2 million of additional restructuring charges related to the closure and transfer of this facility in 2011. In addition, we expect to incur restructuring charges associated with the termination of our Spanish distributor.
In 2009, we incurred a $1.8 million restructuring charge related to the March 27, 2009 termination of our AlboGraft Vascular Graft distribution agreement with Edwards Lifesciences. The transaction included the payment of $3.5 million in exchange for the termination of the distribution agreement, as well as the acquisition of detailed customer information, transition services, and remaining product inventory.
52
Table of Contents
Impairment charges. We incurred $0.5 million of impairment charges in 2010 of which $0.4 million was due to the write-down of certain technology, customer lists, and fixed assets related to our aortic stent graft product line. As of December 31, 2010, we determined that impairment indicators existed as a result of our decision to suspend enrollment into our UNITE and ENTRUST clinical trials and cease product development efforts in October 2010. The residual fair value of the TAArget and UniFit intangible assets was $0.2 million as of December 31, 2010. Additionally, we incurred a $0.1 million impairment charge associated with a Biomateriali private label customer relationship, which we subsequently terminated. We incurred $0.1 million of impairment charges in 2009 related to patents deemed to have no value based on future expected economic benefits.
Other income (expense). Foreign exchange losses for 2010 were $30,000 compared to foreign exchange gains of $0.3 million in 2009. Foreign exchange gains were due to the comparative strengthening of the dollar versus the euro during the year. Net interest income and other income (expense) was relatively flat between 2010 and 2009.
Income tax expense. We recorded a tax benefit of $2.0 million in 2010 compared to a tax expense of $0.6 million in 2009, on pre-tax income of $4.0 million in 2010 and $2.2 million in 2009. The 2010 benefit was primarily due to the release of our U.S. deferred tax asset valuation allowance of $3.3 million, and was partially offset by U.S. deferred provision of $0.9 million, taxes in certain foreign subsidiaries that are profitable of $0.2 million, federal tax in the United States of $0.1 million, and state taxes of $0.1 million. The valuation allowance reversal was the result of achieving three year cumulative profitability which occurred in the fourth quarter of 2010 as well as our expectation of future taxable income in the U.S. The 2009 provision was comprised of taxes on profits on certain of our foreign subsidiaries that are profitable, deferred tax liabilities related to the amortization of goodwill for U.S. tax purposes which could not be used to reduce existing deferred tax assets, and the alternative minimum tax. Our effective tax rate differed from the U.S. statutory tax rate in 2010 principally due to the reversal of the valuation allowance on certain deferred tax assets and utilization of U.S net operating loss carryforwards. While it is often difficult to predict the final outcome or timing of the resolution of any particular tax matter, we believe that our tax reserves reflect the probable outcome of known contingencies.
We have assessed the need for a valuation allowance against our deferred tax assets and concluded that as of December 31, 2010, we have emerged from a cumulative loss position in the fourth quarter of 2010 in the United States. As previously noted, we have reversed $3.3 million of valuation allowance against certain U.S. deferred tax assets as based on the weight of available evidence we believe it is more likely than not that such assets will be realized. We continue to carry a valuation allowance against $4.3 million of other deferred tax assets, principally foreign net operating loss carryforwards, which based on the weight of available evidence, we believe it is more likely than not that such assets will not be realized.
We expect that our effective tax rate will increase in 2011 and begin to approach the U.S. statutory tax rate as we fully utilized all of our U.S net operating loss carryforwards in 2010 and we expect to utilize our remaining research and development credit carryforwards in 2011.
53
Table of Contents
Comparison of the year ended December 31, 2009, to the year ended December 31, 2008
The following tables set forth, for the periods indicated, our results of operations and the change between the specified periods expressed as a percent increase or decrease:
| 2009 | 2008 | $ Change | Percent change |
|||||||||||||
| ($ in thousands) | ||||||||||||||||
| Net sales |
$ | 50,908 | $ | 48,720 | $ | 2,188 | 4 | % | ||||||||
| Net sales by product category: |
||||||||||||||||
| Vascular |
$ | 34,265 | $ | 31,316 | $ | 2,949 | 9 | % | ||||||||
| Endovascular |
12,363 | 13,203 | (840 | ) | (6 | %) | ||||||||||
| General Surgery |
3,836 | 3,928 | (92 | ) | (2 | %) | ||||||||||
| Total Branded Products |
50,464 | 48,447 | 2,017 | 4 | % | |||||||||||
| OEM |
444 | 273 | 171 | 63 | % | |||||||||||
| Total |
$ | 50,908 | $ | 48,720 | $ | 2,188 | 4 | % | ||||||||
| Net sales by geography: |
||||||||||||||||
| Americas |
$ | 29,420 | $ | 26,899 | $ | 2,521 | 9 | % | ||||||||
| International |
21,488 | 21,821 | (333 | ) | (2 | %) | ||||||||||
| Total |
$ | 50,908 | $ | 48,720 | $ | 2,188 | 4 | % | ||||||||
Net sales. Net sales increased 4% to $50.9 million in 2009 from $48.7 million in 2008. Sales in our Vascular product category grew 9%, while sales in our Endovascular product category and General Surgery product categories decreased by 6% and 2%, respectively, from the previous year. New acquisitions and business development activities added 2% to year-over-year sales growth while changes in foreign currency exchange rates subtracted 2%. Sales increases in 2009 were largely driven by higher average selling prices across nearly all product lines, as well as an increase in our Vascular product category of $2.9 million, which included additional biologic patch sales of $1.1 million, increased valvulotomes sales of $0.7 million and vascular catheter sales of $0.5 million, as well as increases in primarily all other product lines in the Vascular product category and was partially offset by a $0.4 million decline in vessel closure systems sales. These gains were partially offset by a $0.8 million decrease in our Endovascular product category, primarily due to reduced sales of our TAArget stent graft and the Powerlink System, as well as the effect of negative currency exchange rate fluctuations of $0.9 million. In 2009 the volatility of the euro as compared to the dollar significantly affected the value of our sales in Europe when translated into U.S. dollars.
Our Endovascular product category declined to 24% of net sales in 2009 from 27% in the prior year. Endovascular declines were driven in part by decreased sales from our TAArget stent graft and the Powerlink System, which were impacted by the retirement of our largest stent graft customer in the fourth quarter of 2009, as well as strong competitor product offerings.
Direct-to-hospital net sales were 92% in 2009, up from 88% in 2008. The increase was largely due to strong results from our comparatively newer sales organizations in Italy and France and the conversion of our AlboGraft Vascular Graft from a distribution model to a direct sales model in March 2009.
Net sales by geography. Net sales in the Americas increased $2.5 million to $29.4 million in 2009. The increase was mainly the result of higher average selling prices across nearly all product lines as well as the addition of $1.1 million of sales of biologic patches. International net sales decreased $0.3 million in 2009 to $21.5 million. International sales were favorably impacted by sales growth of $0.8 million at our Italian sales office, $0.5 million at our French sales office, and $0.3 million at our Japanese sales office. International sales were unfavorably impacted by the effect of negative currency exchange rate fluctuations of $0.9 million and by a decrease in sales of our Endovascular product category of $0.5 million.
54
Table of Contents
International direct-to-hospital net sales increased to 83% in 2009, up from 73% in 2008. The increase was largely due to strong results from our comparatively newer sales organizations in Italy and France and the termination of Edwards’ distribution of our AlboGraft Vascular Graft.
| 2009 | 2008 | $ Change | Percent change |
|||||||||||||
| ($ in thousands) | ||||||||||||||||
| Gross profit |
$ | 37,304 | $ | 33,903 | $ | 3,401 | 10.0 | % | ||||||||
| Gross margin |
73.3 | % | 69.6 | % | * | 3.7 | % | |||||||||
| * | Not applicable |
Gross profit. Gross profit increased 10% to $37.3 million in 2009 from $33.9 million in 2008 while our gross margin increased 3.7% to 73.3%. The gross margin increase was largely the result of improved manufacturing efficiencies, higher average selling prices across nearly all product lines, a reduction in inventory write-downs related to the redesign of our TAArget stent graft product in 2008, and our direct sales of the AlboGraft Vascular Graft, which commenced on March 27, 2009. The increase was partially offset by negative currency exchange rate fluctuations.
| 2009 | 2008 | $ change | Percent change |
2009 as a% of Revenue |
2008 as a% of Revenue |
|||||||||||||||||||
| ($ in thousands) | ||||||||||||||||||||||||
| Sales and marketing |
$ | 17,710 | $ | 19,762 | $ | (2,052 | ) | (10 | %) | 35 | % | 41 | % | |||||||||||
| General and administrative |
9,852 | 9,999 | (147 | ) | (1 | %) | 19 | % | 21 | % | ||||||||||||||
| Research and development |
5,910 | 5,328 | 582 | 11 | % | 12 | % | 11 | % | |||||||||||||||
| Restructuring charges |
1,777 | 1,147 | 630 | 55 | % | 3 | % | 2 | % | |||||||||||||||
| Impairment charge |
106 | 597 | (491 | ) | (82 | %) | 0 | % | 1 | % | ||||||||||||||
| $ | 35,355 | $ | 36,833 | $ | (1,478 | ) | (4 | %) | 69 | % | 76 | % | ||||||||||||
Sales and marketing. Sales and marketing expense decreased 10% to $17.7 million in 2009, from $19.8 million in 2008. Selling expense decreased $1.6 million while marketing expense decreased $0.5 million. Foreign currency exchange rate fluctuations reduced sales and marketing expense by $0.3 million compared to the prior year. Selling expense decreases were driven largely by reduced sales commissions and payroll costs of $0.8 million, decreased travel and entertainment expenses of $0.4 million, and the effects of currency exchange rate fluctuations. Marketing expense decreases were largely the result of reduced advertising expenses of $0.2 million, reduced advisory board expenses of $0.2 million, and the effects of currency exchange rate fluctuations, and were partially offset by additional payroll costs of $0.2 million. As a percentage of revenues, sales and marketing expense decreased to 35% in 2009 from 41% in the prior year. At the end of 2009, we employed 61 field sales representatives worldwide, as compared to 52 at the end of 2008. Selling expense was restrained in part by the adoption of a lower-cost compensation model for most new sales hires.
General and administrative. General and administrative expense decreased 1% to $9.9 million in 2009 from $10.0 million in 2008. The decrease was primarily due to a reduction in insurance premiums of $0.2 million and was partially offset by increased amortization of $0.1 million related to the termination of our AlboGraft Vascular Graft distribution agreement with Edwards Lifesciences.
Research and development. Research and development expense increased 11% to $5.9 million in 2009 from $5.3 million in 2008. As a percentage of revenues, research and development expense increased to 12% in 2009 compared to 11% in 2008. The increase was driven by increased regulatory and clinical affairs related costs of $0.7 million as well as higher product development expense of $0.1 million, and was partially offset by a reduction in royalty expense of $0.1 million, driven by reduced TAArget and UniFit stent graft sales, and in processing engineering expense of $0.1 million.
55
Table of Contents
Restructuring. Restructuring charges increased to $1.8 million in 2009 from $1.1 million in 2008. In 2009, we incurred a $1.8 million restructuring charge related to the March 27, 2009 termination of our AlboGraft Vascular Graft distribution agreement with Edwards Lifesciences. The transaction included the payment of $3.5 million in exchange for the termination of the distribution agreement, as well as the acquisition of detailed customer information, transition services, and remaining product inventory. 2008 charges included $0.7 million related to the early termination of our distributor in Italy, and $0.4 million related to our reductions in force in February and July.
Impairment charges. We incurred $0.1 million of impairment charges in 2009 related to patents deemed to have no value based on future expected economic benefits. We recorded an impairment charge of $0.6 million in 2008. The charge was the result of the write-down of intangible assets totaling $0.5 million relating to a customer relationship at our Biomateriali subsidiary, as well as the write-down of selected patents of $0.1 million.
Other income (expense). In 2009, net interest income was $12,000 compared to $0.5 million in 2008. The decrease was a result of an unfavorable interest rate market and the allocation of our portfolio to low risk investments. Foreign exchange gains for 2009 were $0.3 million compared to foreign exchange losses of $0.1 million in 2008. Foreign exchange gains are due to the comparative weakening of the dollar versus the euro during the financial period. Other income (expense) for 2009 was primarily due to losses on the disposal of capital equipment of $17,000. In 2008, we recognized the write-down of portfolio investments totaling $0.2 million which was attributed to the other-than-temporary decline in one specific asset backed security which we held as available-for-sale in our marketable securities portfolio.
Income tax expense. We recorded a provision for taxes of $0.6 million in 2009 compared to $0.5 million in 2008 on pre-tax income of $2.2 million in 2009 and on a pre-tax loss of $2.8 million in 2008. The 2009 provision was comprised of taxes on profits on certain of our foreign subsidiaries that are profitable, deferred tax liabilities related to the amortization of goodwill for U.S. tax purposes which cannot be used to reduce existing deferred tax assets, and the alternative minimum tax. Our effective tax rate differed from the U.S. statutory tax rate principally due to the utilization of net operating loss carryforwards. While it is often difficult to predict the final outcome or timing of the resolution of any particular tax matter, we believe that our tax reserves reflect the probable outcome of known contingencies. In 2009, we utilized $4.8 million of our U.S net operating loss carryforwards.
Liquidity and Capital Resources
At December 31, 2010, our cash, cash equivalents and marketable securities were $22.6 million as compared to $24.0 million at December 31, 2009. Our cash and cash equivalents are highly liquid investments with maturities of 90 days or less at the date of purchase and consist of time deposits, fully collateralized overnight repurchase agreements, and U.S. government obligations, and are stated at cost, which approximates fair value. We did not hold any marketable securities nor any mortgage asset-backed or auction-rate securities in our investment portfolio as of December 31, 2010. In the event of a temporary decline in market value, we have the intent and ability to hold our investments for a sufficient period of time to allow for recovery of the principal amounts invested. We continually monitor the asset allocation of our holdings in an attempt to mitigate our credit and interest rate exposures, and we intend to continue to closely monitor developments in the credit markets and make appropriate changes to our investment policy as necessary.
Operating and Capital Expenditure Requirements
We require cash to pay our operating expenses, make capital expenditures, fund acquisitions, and pay our long-term liabilities. Since our inception, we have funded our operations through private and public placements of equity securities, short-term borrowings, and funds generated from our operations.
For the year ended December 31, 2010, we recognized operating income of $4.0 million. For the year ended December 31, 2009, we recognized operating income of $1.9 million. Although it is our intention to generate an
56
Table of Contents
operating profit on an ongoing basis, excluding the impact of acquisitions, divestitures and distributor terminations, there can be no assurance that we will generate an operating profit in the future due to our continued investment in growing our business. We expect to fund any increased costs and expenditures from our existing cash and cash equivalents and marketable securities, though our future capital requirements depend on numerous factors. These factors include, but are not limited to, the following:
| • | the revenues generated by sales of our products; |
| • | the ongoing transfer of our AlboGraft Vascular Graft manufacturing from Brindisi, Italy to Burlington, Massachusetts; |
| • | the termination of distributor agreements in Spain and Denmark and subsequent start-up costs associated with going direct in those markets; |
| • | payments associated with potential future quarterly cash dividends to our common stockholders; |
| • | payments associated with our stock repurchase plan; |
| • | the costs associated with expanding our manufacturing, marketing, sales, and distribution efforts; |
| • | the rate of progress and cost of our research and development activities; |
| • | the costs of obtaining and maintaining FDA and other regulatory clearances of our existing and future products; |
| • | the effects of competing technological and market developments; |
| • | remaining payment obligations associated with the LifeSpan Vascular Graft acquisition; and |
| • | the number, timing, and nature of acquisitions and other strategic transactions |
Our cash balances may decrease as we continue to use cash to fund our operations, make acquisitions, make purchases under our share repurchase program, make payments under our quarterly dividend program, and make deferred payments related to prior acquisitions. We believe that our cash, cash equivalents, investments and the interest we earn on these balances will be sufficient to meet our anticipated cash requirements for at least the next twelve months. If these sources of cash are insufficient to satisfy our liquidity requirements beyond the next twelve months, we may seek to sell additional equity or debt securities or borrow from a financial institution. The sale of additional equity and debt securities may result in dilution to our stockholders. If we raise additional funds through the issuance of debt securities, such securities could have rights senior to those of our common stock and could contain covenants that would restrict our operations. We may require additional capital beyond our currently forecasted amounts. Any such required additional capital may not be available on reasonable terms, if at all.
Credit Facility
We currently have no credit facility. We terminated our revolving line of credit with Brown Brothers Harriman & Co. effective as of August 23, 2010. Our borrowing capacity under this facility was $10 million and the maximum principal amount of any letters of credit issued as part of this facility was $3 million. Loans made under this revolving line of credit bore interest at the bank’s base rate or LIBOR plus 200 basis points, at our discretion, and were collateralized by substantially all of our assets. The loan agreement required that we meet certain financial and operating covenants including a required leverage ratio and minimum tangible net worth. As of August 23, 2010 and December 31, 2009, we had no borrowings outstanding under this credit facility and were in compliance with these covenants.
As part of the purchase of Biomateriali S.r.l, we assumed a loan from the Italian government under a program that provides funding to certain businesses in Italy through a combination of grants and loans if certain requirements are met. The loan was stated to be payable in ten annual payments through 2018 of principal and
57
Table of Contents
interest at an interest rate of 0.74%. The present value of the loan was recorded as of the date the proceeds were received using our incremental borrowing rate. Interest was being imputed on the loan and the amortization was recorded as interest expense. In March 2011, the Italian government informed us that the loan and grants will become due in full as a result of the Biomateriali S.r.l plant closure. We expect to repay the previous grants received, the imputed interest on the outstanding loan balance, and certain additional interest and penalties of approximately $0.3 million, which has been recorded as restructuring expense for the year ended December 31, 2010. The outstanding amount of the accelerated loan and grant repayment was approximately $0.4 million as of December 31, 2010 and has been recorded in our balance sheet in accrued expenses. We expect that this matter will be settled in 2011.
Cash Flows
| Year ended December 31, | Net Change |
|||||||||||
| 2010 | 2009 | |||||||||||
| Cash and cash equivalents |
$ | 22,614 | $ | 23,192 | $ | (578 | ) | |||||
| Cash flows provided by (used in): |
||||||||||||
| Operating activities |
$ | 7,052 | $ | 5,440 | $ | 1,612 | ||||||
| Investing activities |
(5,235 | ) | 2,182 | (7,417 | ) | |||||||
| Financing activities |
(2,335 | ) | (376 | ) | (1,959 | ) | ||||||
Operating activities. Net cash provided by operating activities was $7.1 million in 2010 and consisted of the $6.0 million net income, adjusted for non-cash items of $1.5 million (including depreciation and amortization of $1.4 million, stock-based compensation of $1.0 million, provision for inventory write-offs of $0.8 million, impairment charges of $0.5 million and $0.1 million in accounts receivable loss provisions and was partially offset by a deferred income tax benefit of $2.4 million) and net cash used by changes in working capital of $0.4 million. The net cash used by changes in working capital was principally the result of an increase of accounts receivable, inventories and other current assets while partially offset by increased accounts payable.
Net cash provided by operating activities was $5.4 million in 2009 and consisted of the $1.6 million net income, adjusted for non-cash items of $3.4 million (including depreciation and amortization of $1.4 million, stock-based compensation of $1.0 million, provision for inventory write-offs of $0.4 million, provision for deferred income taxes of $0.2 million, an intangibles impairment charge of $0.1 million and $0.1 million in accounts receivable loss provisions) and net cash provided by changes in working capital of $0.4 million. The net cash provided by changes in working capital was principally the result of a reduction in prepaid assets and in inventories and was partially offset by increased accounts receivable.
Investing activities. Net cash used in investing activities was $5.2 million in 2010. This was primarily due to payments related to our acquisition of the LifeSpan Vascular ePTFE Graft of $3.5 million and purchases of property and equipment of $2.5 million, and was partially offset by sales and maturities of marketable securities of $0.8 million.
Net cash provided by investing activities was $2.2 million in 2009. This was primarily due to sales and maturities of marketable securities of $4.6 million, offset by the purchase of technology and other intangible assets of $1.0 million, payments made related to prior year acquisitions of $0.8 million, and purchases of property and equipment of $0.6 million.
Financing activities. Net cash used in financing activities was $2.3 million in 2010. This was primarily due to the purchase of $2.2 million of treasury stock under our stock repurchase plan and the purchase of $0.3 million of treasury stock to cover minimum withholding taxes of restricted stock unit vestings and was partially offset by $0.1 million from the exercise of stock options. As of December 31, 2010, we were able to purchase up to an additional $2.2 million of treasury stock under our stock repurchase plan through December 31, 2011.
58
Table of Contents
Net cash used in financing activities was $0.4 million in 2009. This was primarily due to the purchase of $0.5 million of treasury stock under our stock repurchase plan and the purchase of $0.2 million of treasury stock to cover minimum withholding taxes of restricted stock unit vestings and was partially offset by $0.2 million from the exercise of stock options and $0.1 million from an Italian government loan program which we assumed as part of our purchase of Biomateriali.
Dividends. On February 28, 2011, our Board of Directors approved a policy for the payment of regular quarterly cash dividends on our common stock of $0.02 per share. The first quarterly dividend is payable on April 5, 2011, to stockholders of record at the close of business on March 22, 2011, and will be approximately $0.3 million. Future declarations of quarterly dividends and the establishment of future record and payment dates are subject to approval by our Board of Directors on a quarterly basis.
Contractual obligations. Our principal contractual obligations consist of operating leases, inventory purchase commitments, and income tax obligations for unrecognized tax benefits. The following table summarizes our commitments to settle contractual obligations as of December 31, 2010:
| Contractual obligations |
Total | Less than 1 year |
1-3 years |
3-5 years |
||||||||||||
| (in thousands) | ||||||||||||||||
| Operating leases |
$ | 4,654 | $ | 1,307 | $ | 1,865 | $ | 1,482 | ||||||||
| Purchase commitments for inventory |
14,129 | 4,559 | 7,685 | 1,885 | ||||||||||||
| Payments to terminate foreign distributors |
1,223 | 1,123 | 100 | — | ||||||||||||
| Acquisition related liabilities |
441 | 441 | — | — | ||||||||||||
| Unrecognized tax benefits |
277 | 277 | — | — | ||||||||||||
| Total contractual obligations |
$ | 20,724 | $ | 7,707 | $ | 9,650 | $ | 3,367 | ||||||||
The commitments under our operating leases consist primarily of lease payments for our Burlington, Massachusetts, corporate headquarters and manufacturing facility, expiring in 2017; our Sulzbach, Germany office, expiring in 2016; our Tokyo, Japan office, expiring in 2013; and our Milan, Italy office, expiring in 2016.
The purchase commitments for inventory are to be used in operations over the normal course of business and do not represent excess commitments or loss contracts.
Critical Accounting Policies and Estimates
We have adopted various accounting policies to prepare our consolidated financial statements in accordance with U.S. generally accepted accounting principles (GAAP). Our most significant accounting policies are described in note 1 to our consolidated financial statements included elsewhere in this Annual Report on Form 10-K. The preparation of our consolidated financial statements in conformity with GAAP requires us to make estimates and assumptions that affect the amounts reported in our consolidated financial statements and accompanying notes. Our estimates and assumptions, including those related to bad debts, inventories, intangible assets, sales returns and discounts, and income taxes are reviewed on an ongoing basis and updated as appropriate. Actual results could differ from those estimates.
Certain of our more critical accounting policies require the application of significant judgment by management in selecting the appropriate assumptions for calculating financial estimates. By their nature, these judgments are subject to an inherent degree of uncertainty. These judgments are based on our historical experience, terms of existing contracts, and observance of trends in the industry, as appropriate. Different, reasonable estimates could have been used in the current period. Additionally, changes in accounting estimates are reasonably likely to occur from period to period. Both of these factors could have a material impact on the presentation of our financial condition, changes in financial condition, or results of operations.
59
Table of Contents
We believe that the following financial estimates and related accounting policies are both important to the portrayal of our financial condition and results of operations and require subjective or complex judgments. Further, we believe that the items discussed below are properly recorded in our consolidated financial statements for all periods presented. Management has discussed the development, selection and disclosure of our most critical financial estimates with the audit committee of our board of directors and our independent registered public accounting firm. The judgments about those financial estimates are based on information available as of the date of our consolidated financial statements. Those financial estimates and related policies include:
Revenue Recognition
Our revenue is derived primarily from the sale of disposable or implantable devices used during vascular surgery. We sell directly to hospitals and to distributors, as described below, and, during the periods presented in our consolidated financial statements, entered into consigned inventory arrangements with either hospitals or distributors on a limited basis.
We recognize revenue when four basic criteria are met: (1) persuasive evidence of an arrangement exists; (2) delivery has occurred or services have been rendered; (3) the fee is fixed or determinable; and (4) collectability is reasonably assured. We generally use customer purchase orders or contracts to determine the existence of an arrangement. Substantially all sales transactions are based on prices that are determinable at the time that the customer’s purchase order is accepted by us. In order to determine whether collection is reasonably assured, we assess a number of factors, including past transaction history with the customer and the creditworthiness of the customer. If we determine that collection is not reasonably assured, we would defer the recognition of revenue until collection becomes reasonably assured, which is generally upon receipt of payment. We provide for product returns at the time revenue is recognized based on our historical return product history. Based on these policies, we recognize revenue, net of allowances for returns and discounts, as products are shipped, based on shipping point terms, or at the time consigned inventory is consumed at which time title passes to customers. We recognize revenue net of allowances for returns and discounts, at the time of shipment of our products to our distributors.
Accounts Receivable
Our accounts receivable are with customers based in the United States and internationally. Accounts receivable generally are due within 30 to 90 days of invoice and are stated at amounts due from customers, net of an allowance for doubtful accounts and sales returns, other than in certain European markets where longer payment terms are customary. We perform ongoing credit evaluations of the financial condition of our customers and adjust credit limits based upon payment history and the current creditworthiness of the customers, as determined by a review of their current credit information. We continuously monitor aging reports, collections, and payments from customers, and maintain a provision for estimated credit losses based upon historical experience and any specific customer collection issues we identify.
We write off accounts receivable when they become uncollectible. While such credit losses have historically been within our expectations and allowances, we cannot guarantee the same credit loss rates will be experienced in the future. The allowance for doubtful accounts is our best estimate of the amount of probable credit losses in our existing accounts receivable. We review our allowance for doubtful accounts on a monthly basis and all past due balances are reviewed individually for collectability. The provision for doubtful accounts is recorded in general and administrative expenses.
Inventory
Inventory consists of finished products, work-in-process, and raw materials. We value inventory at the lower of cost or market value. Cost includes materials, labor, and manufacturing overhead and is determined using the first-in, first-out (FIFO) method. On a quarterly basis, we review inventory quantities on hand and analyze the
60
Table of Contents
provision for excess and obsolete inventory based primarily on product expiration dating and our estimated sales forecast, which is based on sales history and anticipated future demand. Our estimates of future product demand may not be accurate, and we may understate or overstate the provision required for excess and obsolete inventory. Accordingly, any significant unanticipated changes in demand could have a significant impact on the value of our inventory and results of operations.
Stock-based Compensation
We recognize, as expense, the estimated fair value of stock options to employees which is determined using the Black-Scholes option pricing model. We have elected to recognize the compensation cost of all share-based awards on a straight-line basis over the vesting period of the award. In periods that we grant stock options, fair value assumptions are based on volatility, interest, dividend yield, and expected term over which the stock options will be outstanding. The computation of expected volatility is based on the historical volatility of the company’s stock. The interest rate for periods within the contractual life of the award is based on the U.S. Treasury risk-free interest rate in effect at the time of grant. The expected lives of the options were estimated using the simplified method for “plain vanilla” options. Computation of expected forfeitures is based on historical forfeiture rates of our share-based awards.
We also issue restricted stock units (RSUs) as an additional form of equity compensation to our employees, officers, and directors, pursuant to our stockholder-approved 2006 Plan. RSUs entitle the grantee to an issuance of stock at no cost and generally vest over a period of time determined by our Board of Directors at the time of grant based upon the continued service to the company. The fair market value of the award is determined based on the number of RSUs granted and the market value of our common stock on the grant date and is amortized to expense over the period of vesting. Computation of expected forfeitures is based on historical forfeiture rates of our share-based awards. Unvested RSUs are forfeited and canceled as of the date that employment or service to the company terminates. RSUs are settled in shares of our common stock upon vesting. We may repurchase common stock upon our employees’ vesting in RSUs in order to cover any minimum tax withholding liability as a result of the RSUs having vested.
We used an expected forfeiture rate of approximately 16%, 18%, and 20% for 2010, 2009, and 2008, respectively. Share-based compensation charges are recorded net of the estimated forfeitures and will be adjusted in future periods to reflect the results of actual forfeitures and vesting. Share-based compensation charges are recorded across the consolidated statement of operations based upon the grantee’s primary function.
As disclosed more fully in the notes to our consolidated financial statements, we recorded expense of approximately $1.0 million in connection with share-based payment awards for the year ended December 31, 2010. The future expense of non-vested share-based awards of approximately $2.3 million is to be recognized over a weighted-average period of 3.3 years. During 2010, we granted stock options at a weighted average exercise price of $5.86 and restricted stock units with fair value weighted average price of $5.81.
Valuation of Goodwill, Other Intangibles
When we acquire a business, the purchase price is allocated, as applicable, among acquired tangible net assets, identifiable intangible assets, and goodwill as required by GAAP. Goodwill represents the excess of the aggregate purchase price over the fair value of net assets of the acquired businesses. Goodwill is tested for impairment annually or more frequently if changes in circumstance or the occurrence of events suggest impairment exists. We evaluate the December 31 balance of the carrying value of goodwill based on a single reporting unit. The first step of our goodwill impairment test, used to identify potential impairment, compares the fair value of our reporting unit with its carrying amount, including goodwill. If the fair value of our reporting unit exceeds its carrying amount, the goodwill of the reporting unit is considered not impaired, and thus the second step of the impairment test, used to measure the amount of the impairment loss, is unnecessary. If the carrying amount of our reporting unit exceeds its fair value, the second step of the goodwill impairment test is performed
61
Table of Contents
to measure the amount of impairment loss, if any. The second step of the goodwill impairment test, used to measure the amount of impairment loss, compares the implied fair value of the reporting unit goodwill as of the date of the impairment review with the carrying amount of that goodwill. The implied fair value of our goodwill is determined on the same basis as the amount of goodwill recognized in connection with a business combination. Specifically, we allocate the fair value of our reporting unit to all of the assets and liabilities of that unit (including any unrecognized intangible assets) as if the reporting unit had been acquired in a business combination as of the date of the impairment review and as if the fair value of the reporting unit was the price paid to acquire the reporting unit. The excess of the fair value of a reporting unit over the amounts assigned to its assets and liabilities is the implied fair value of goodwill. If the carrying amount of the reporting unit goodwill exceeds the implied fair value of that goodwill, an impairment loss shall be recognized in an amount equal to that excess. We have determined that no impairment charges were required during the year ended December 31, 2010 as our market capitalization as a whole has exceeded the carrying amount, and on that basis we concluded that goodwill was not impaired. Goodwill was $11.9 million and $11.0 million as of December 31, 2010 and 2009, respectively. Our annual impairment testing indicated no significant risk of impairment based upon changes in value that are reasonably likely to occur. However, changes in these estimates and assumptions could materially affect the estimated fair value of our reporting unit.
Other intangible assets consist primarily of purchased developed technology, patents, customer relationships, and trademarks and are amortized over their estimated useful lives, ranging from 2 to 15 years. We review intangible assets quarterly to determine if any adverse conditions exist for a change in circumstances has occurred that would indicate impairment. Conditions that may indicate impairment include, but are not limited to, a significant adverse change in legal factors or business climate that could affect the value of the asset, a change in the operating cash flows associated with the asset, or adverse action or assessment by a regulator. If an impairment indicator exists we test the intangible asset for recoverability. If the carrying value of the intangible asset exceeds the undiscounted cash flows expected to result from the use and eventual disposition of the intangible asset, we will write the carrying value down to the fair value in the period identified. We generally calculate fair value of our intangible assets as the present value of estimated future cash flows we expect to generate from the asset using a risk-adjusted discount rate. In determining our estimated future cash flows associated with our intangible assets, we use estimates and assumptions about future revenue contributions, cost structures, and remaining useful lives of the asset. These estimates and assumptions require significant judgment and actual results may differ from assumed or estimated amounts. Other intangible assets, net of accumulated amortization, were $3.3 million as of December 31, 2009, and $3.7 million as of December 31, 2010. We recognized impairment charges on our intangible assets of $0.1 million in 2009 and $0.5 million in 2010.
Contingencies
In the normal course of business, we are subject to proceedings, lawsuits, and other claims and assessments for matters related to, among other things, patent infringement, business acquisitions, employment, and product recalls. We assess the likelihood of any adverse judgments or outcomes to these matters as well as potential ranges of probable losses. A determination of the amount of reserves required, if any, for these contingencies is made after careful analysis of each individual issue. The required reserves may change in the future due to new developments in each matter or changes in approach such as a change in settlement strategy in dealing with these matters. We record charges for the costs we anticipate incurring in connection with litigation and claims against us when we determine a loss is probable and we can reasonably estimate these costs. During the years ended December 31, 2010, 2009, and 2008, we were not subject to any material litigation, claims or assessments.
Restructuring
We record restructuring charges incurred in connection with consolidation or relocation of operations, exited business lines, or distributor terminations. These restructuring charges, which reflect our commitment to a termination or exit plan that will begin within twelve months, are based on estimates of the expected costs associated with site closure, legal matters, contract terminations, or other costs directly related to the restructuring.
62
Table of Contents
If the actual cost incurred exceeds the estimated cost, an additional charge to earnings will result. If the actual cost is less than the estimated cost, a credit to earnings will be recognized.
Income Taxes
As part of the process of preparing our consolidated financial statements we are required to determine our income taxes in each of the jurisdictions in which we operate. This process involves estimating our actual current tax expense together with assessing temporary differences resulting from recognition of items for income tax and accounting purposes. These differences result in deferred tax assets and liabilities, which are included within our consolidated balance sheet. We must then assess the likelihood that our deferred tax assets will be recovered from taxable income during the carryback period or in the future; and to the extent we believe that recovery is not likely, we must establish a valuation allowance. To the extent we establish a valuation allowance or increase this allowance in a period, we must reflect this increase as an expense within the tax provision in the statement of operations. We do not provide for income taxes on undistributed earnings of foreign subsidiaries, as our current intention is to permanently reinvest these earnings.
We recognize, measure, present and disclose in our financial statements, uncertain tax positions that we have taken or expect to take on a tax return. We operate in multiple taxing jurisdictions, both within the United States and outside of the United States and may be subject to audits from various tax authorities regarding transfer pricing, the deductibility of certain expenses, intercompany transactions, and other matters. Within specific countries, we may be subject to audit by various tax authorities operating within the country and may be subject to different statutes of limitation expiration dates. Management’s judgment is required in determining our provision for income taxes, our deferred tax assets and liabilities, liabilities for uncertain tax positions, and any valuation allowance recorded against our net deferred tax assets. We will continue to monitor the realizability of our deferred tax assets and adjust the valuation allowance accordingly. We have recorded a valuation allowance on our net deferred tax assets of $4.3 million and $6.5 million as of December 31, 2010 and 2009, respectively.
Marketable Securities
Our investments consist primarily of marketable debt securities and U.S. government securities, and are classified as available-for-sale and are carried at fair market value at December 31, 2010. The unrealized gains (losses) on available-for-sale securities are recorded in accumulated other comprehensive income (loss). We consider all highly liquid investments with maturities of 90 days or less at the time of purchase to be cash equivalents, and investments with maturities of greater than 90 days at the time of purchase to be short-term investments. When a marketable security incurs a significant unrealized loss for a sustained period of time, we review the instrument to determine if it is other-than-temporarily impaired. If we conclude an instrument is other-than-temporarily impaired, we record the unrealized loss in the consolidated statement of operations.
Off-Balance Sheet Arrangements
We did not have any off-balance sheet arrangements as of December 31, 2010. We do not currently have, nor have we ever had, any relationships with unconsolidated entities or financial partnerships, such as entities often referred to as structured finance or special purpose entities, which would have been established for the purpose of facilitating off-balance sheet arrangements or other contractually narrow or limited purposes. In addition, we do not engage in trading activities involving non-exchange traded contracts. As a result, we are not materially exposed to any financing, liquidity, market, or credit risk that could arise if we had engaged in these relationships.
Recent Accounting Pronouncements
In January 2010, the Financial Accounting Standards Board (the FASB) issued new guidance to determine whether variable interests in third party entities grant a controlling financial interest in the entities. This amended
63
Table of Contents
guidance replaces the previous quantitative approach for identifying when enterprises should consolidate variable interest entities with a qualitative analysis, based on which enterprise has both (1) the power to direct the economic activities of a variable interest entity and (2) the obligation to absorb losses or receive benefits from the entity that could be significant to the variable interest entity. We adopted this guidance effective January 1, 2010. The adoption did not have an effect on our consolidated results of operations or financial condition.
| Item 7A. | Quantitative and Qualitative Disclosures About Market Risk |
This item is not applicable to us as a smaller reporting company.
| Item 8. | Financial Statements and Supplementary Data |
See the consolidated financial statements filed as part of this Annual Report on Form 10-K as listed under Item 15 below.
| Item 9. | Changes in and Disagreements with Accountants on Accounting and Financial Disclosure |
Not Applicable.
| Item 9A. | Controls and Procedures |
Evaluation of Disclosure Controls and Procedures
Based on their evaluation as of December 31, 2010, our Chief Executive Officer and Chief Financial Officer, with the participation of management, have concluded that our disclosure controls and procedures (as defined in Rules 13a-15(e) and 15d-15(e) of the Securities Exchange Act of 1934) were effective at reasonable assurance levels.
Management’s Report on Internal Control Over Financial Reporting
Our management is responsible for establishing and maintaining adequate internal control over financial reporting (as defined in Rules 13a-15(f) and 15d-15(f) under the Exchange Act) to provide reasonable assurance regarding the reliability of our financial reporting and the preparation of financial statements for external purposes in accordance with U.S. generally accepted accounting principles.
Management assessed the effectiveness of our internal controls over financial reporting as of December 31, 2010. Management based its assessment on criteria established in the Internal Control—Integrated Framework issued by the Committee of Sponsoring Organizations of the Treadway Commission. Management’s assessment included evaluation of elements such as the design and operating effectiveness of key financial reporting controls, process documentation, accounting policies, and our overall control environment.
Based on this assessment under the criteria set forth in the Internal Control—Integrated Framework, management has concluded that our internal control over financial reporting was effective as of December 31, 2010.
Pursuant to Item 308 of Regulation S-K, this management’s report on internal control over financing reporting shall not be deemed filed for purposes of Section 18 of the Exchange Act or otherwise subject to the liabilities of that section.
Changes in Internal Control over Financial Reporting
There was no change in the our internal control over financial reporting that occurred during the fiscal quarter ended December 31, 2010, that has materially affected, or is reasonably likely to materially affect our internal control over financial reporting.
64
Table of Contents
Inherent Limitations of Internal Controls
Our management, including our Chief Executive Officer and Chief Financial Officer, does not expect that our disclosure controls and procedures or our internal controls will prevent all error and all fraud. A control system, no matter how well conceived and operated, can provide only reasonable, not absolute, assurance that the objectives of the control system are met. Because of the inherent limitations in all control systems, no evaluation of controls can provide absolute assurance that all control issues and instances of fraud, if any, within the company have been detected. These inherent limitations include the realities that judgments in decision-making can be faulty, and that breakdowns can occur because of simple error or mistake. Additionally, controls can be circumvented by the individual acts of some persons, by collusion of two or more people, or by management override of the control. The design of any system of controls also is based in part upon certain assumptions about the likelihood of future events, and there can be no assurance that any design will succeed in achieving its stated goals under all potential future conditions. Over time, control may become inadequate because of changes in conditions, or the degree of compliance with the policies or procedures may deteriorate. Because of the inherent limitations in a cost-effective control system, misstatements due to error or fraud may occur and not be detected.
| Item 9B. | Other Information |
Not Applicable.
65
Table of Contents
The information responsive to this item is incorporated by reference herein from the information to be contained in our 2011 definitive proxy statement (the “2011 Definitive Proxy Statement”) for the 2011 annual meeting of stockholders to be filed with the Securities and Exchange Commission within 120 days after the year ended December 31, 2010.
| Item 10. | Directors, Executive Officers and Corporate Governance |
The information responsive to this item is incorporated by reference herein from the information to be contained in the sections entitled “Directors, Executive Officers and Key Employees,” “Corporate Governance,” and “Meeting and Committees of the Board of Directors” in our 2011 definitive proxy statement (the “2011 Definitive Proxy Statement”) for the 2011 annual meeting of stockholders to be filed with the Securities and Exchange Commission within 120 days after the year ended December 31, 2010.
The information required by this item concerning compliance with Section 16(a) of the Exchange Act is incorporated herein by reference from the information contained in the section entitled “Section 16(a) Beneficial Ownership Reporting Compliance” in our 2011 Definitive Proxy Statement.
Code of Ethics
Certain documents relating to our corporate governance, including our Code of Business Conduct and Ethics, which is applicable to our directors, officers, and employees, and the charters of the Audit Committee, Compensation Committee, and Corporate Governance and Nominating Committee of our Board of Directors, are available on our website at http://www.lemaitre.com. We intend to disclose substantive amendments to or waivers (including implicit waivers) of any provision of the Code of Business Conduct and Ethics that apply to our principal executive officer, principal financial officer, principal accounting officer, or controller, or persons performing similar functions, by posting such information on our website available at http://www.lemaitre.com.
| Item 11. | Executive Compensation |
The information responsive to this item is incorporated herein by reference from the information to be contained in the section entitled “Compensation of Executive Officers and Directors” in our 2011 Definitive Proxy Statement.
| Item 12. | Security Ownership of Certain Beneficial Owners and Management and Related Stockholder Matters |
The information responsive to this item is incorporated herein by reference from the information to be contained in the section entitled “Security Ownership of Certain Beneficial Owners and Management” in our 2011 Definitive Proxy Statement.
66
Table of Contents
Equity Compensation Plan Information
The following table sets forth information regarding our equity compensation plans in effect as of December 31, 2010. Each of our equity compensation plans is an “employee benefit plan” as defined by Rule 405 of Regulation C of the Securities Act of 1933.
| Plan category |
Number of securities to be issued upon exercise of outstanding options, warrants and rights |
Weighted-average exercise price of outstanding options, warrants and rights |
Number of securities remaining available for future issuance under equity compensation plans (excluding securities reflected in column (a)) |
|||||||||
| (a) | (b) | (c) | ||||||||||
| Equity compensation plans approved by security holders |
2,380,458 | $ | 5.07 | 1,364,149 | ||||||||
| Equity compensation plans not approved by security holders |
— | — | — | |||||||||
| Total |
2,380,458 | $ | 5.07 | 1,364,149 | ||||||||
| Item 13. | Certain Relationships and Related Transactions, and Director Independence |
The information required responsive to this item is incorporated herein by reference from the information to be contained in the sections entitled “Certain Relationships and Related Transactions” and “Corporate Governance” in our 2011 Definitive Proxy Statement.
| Item 14. | Principal Accountant Fees and Services |
The information responsive to this item is incorporated herein by reference from the information to be contained in the section entitled “Ratification of Independent Registered Public Accounting Firm” in our 2011 Definitive Proxy Statement.
67
Table of Contents
| Item 15. | Exhibits and Financial Statement Schedules |
| a) | Documents filed as part of this Report. |
| (1) | The following consolidated financial statements are filed herewith in Item 8 of Part II above. |
| (i) | Report of Independent Registered Public Accounting Firm |
| (ii) | Consolidated Balance Sheets |
| (iii) | Consolidated Statements of Operations |
| (iv) | Consolidated Statements of Changes in Stockholders’ Equity and Comprehensive Income (Loss) |
| (v) | Consolidated Statements of Cash Flows |
| (vi) | Notes to Consolidated Financial Statements |
| (2) | Financial Statement Schedules |
| (3) | Exhibits |
| Exhibit |
Exhibit Description |
Incorporated By Reference | ||||||||||||||
| Form | Date | Number | Filed Herewith |
|||||||||||||
| 3.1 | Amended and Restated By-laws of the Registrant | S-1/A | 5/26/06 | 3.1 | ||||||||||||
| 3.2 | Second Amended and Restated Certificate of Incorporation of the Registrant | 10-K | 3/29/10 | 3.2 | ||||||||||||
| 4.1 | Specimen Certificate evidencing shares of common stock | S-1/A | 6/22/06 | 4.1 | ||||||||||||
| 10.1 | Northwest Park Lease dated March 31, 2003, by and between the Registrant and Roger P. Nordblom and Peter C. Nordblom, as Trustees of Northwest Associates, as amended | S-1 | 4/25/06 | 10.1 | ||||||||||||
| 10.2 | Registration Rights Agreement dated June 17, 1998, by and between the Registrant and Housatonic Equity Investors, L.P. | S-1/A | 5/26/06 | 10.2 | ||||||||||||
| 10.3 | Patent Sublicense Agreement dated March 7, 2003, by and between IMPRA, Inc. and Endomed, Inc. | S-1 | 4/25/06 | 10.3 | ||||||||||||
| 10.4 | Confirmation and Agreement dated February 2, 2005, by and between the Registrant and Bard Peripheral Vascular, Inc. | S-1 | 4/25/06 | 10.4 | ||||||||||||
| 10.5 | License Agreement dated February 11, 1992, by and between United States Surgical Corporation and Spinnaker R&D Associates, as amended | S-1 | 4/25/06 | 10.5 | ||||||||||||
| 10.6 | Side Letter Agreement dated January 30, 2004, by and between the Registrant and Spinnaker R&D Associates | S-1 | 4/25/06 | 10.6 | ||||||||||||
| 10.7 | Executive Retention and Severance Agreement dated October 10, 2005, by and between the Registrant and George W. LeMaitre† | S-1/A | 5/26/06 | 10.7 | ||||||||||||
| 10.8 | Managing Director Employment Agreement dated October 1, 2008, by and between LeMaitre Vascular GmbH and Peter Gebauer, as amended† | 10-K | 3/31/09 | 10.8 | ||||||||||||
| 10.9 | Employment Agreement dated June 20, 2006, by and between the Registrant and David Roberts† | S-1/A | 6/22/06 | 10.24 | ||||||||||||
68
Table of Contents
| Exhibit |
Exhibit Description |
Incorporated By Reference | ||||||||||||||||
| Form | Date | Number | Filed Herewith |
|||||||||||||||
| 10.10 | Employment Agreement dated April 20, 2006, by and between the Registrant and Joseph P. Pellegrino (corrected)† | S-1/A | 6/22/06 | 10.10 | ||||||||||||||
| 10.11 | 1997 Stock Option Plan and form of agreements thereunder† | S-1 | 4/25/06 | 10.11 | ||||||||||||||
| 10.12 | 1998 Stock Option Plan and form of agreements thereunder† | S-1 | 4/25/06 | 10.12 | ||||||||||||||
| 10.13 | 2000 Stock Option Plan and form of agreements thereunder† | S-1 | 4/25/06 | 10.13 | ||||||||||||||
| 10.14 | 2004 Stock Option Plan and form of agreements thereunder† | S-1 | 4/25/06 | 10.14 | ||||||||||||||
| 10.15 | Second Amended and Restated 2006 Stock Option and Incentive Plan and form of agreements thereunder† | 8-K | 6/18/10 | 10.1 | ||||||||||||||
| 10.16 | Form of Indemnification Agreement between the Registrant and its directors and executive officers | S-1/A | 5/26/06 | 10.17 | ||||||||||||||
| 10.17 | Form of Restricted Stock Unit Award Agreement under the Registrant’s 2006 Stock Option and Incentive Plan† | 8-K | 12/26/06 | 99.1 | ||||||||||||||
| 10.18 | Management Incentive Compensation Plan† | 8-K | 4/27/07 | 10.1 | ||||||||||||||
| 10.19 | Second Amendment of Lease dated May 21, 2007, by and between Rodger P. Nordblom and Peter C. Nordblom, as Trustees of Northwest Associates, and Registrant | 8-K | 6/15/07 | 10.1 | ||||||||||||||
| 10.20 | Third Amendment of Lease dated February 26, 2008, by and between Rodger P. Nordblom and Peter C. Nordblom, as Trustees of Northwest Associates, and Registrant | 8-K | 4/10/08 | 10.1 | ||||||||||||||
| 10.21 | Fourth Amendment of Lease dated October 31, 2008, by and between Rodger P. Nordblom and Peter C. Nordblom, as Trustees of Northwest Associates, and Registrant | 10-K | 3/31/09 | 10.36 | ||||||||||||||
| 10.22 | First Amendment to Executive Retention and Severance Agreement dated December 23, 2008, by and between the Registrant and George W. LeMaitre† | 10-K | 3/31/09 | 10.37 | ||||||||||||||
| 10.23 | First Amendment to Employment Agreement dated December 19, 2008, by and between the Registrant and David Roberts† | 10-K | 3/31/09 | 10.38 | ||||||||||||||
| 10.24 | First Amendment to Employment Agreement dated December 19, 2008, by and between the Registrant and Joseph P. Pellegrino† | 10-K | 3/31/09 | 10.39 | ||||||||||||||
| 10.25 | Fifth Amendment of Lease dated March 23, 2010, by and between Rodger P. Nordblom and Peter C. Nordblom, as Trustees of Northwest Associates, and Registrant | 10-K | 3/29/10 | 10.33 | ||||||||||||||
| 10.26 | Northwest Park Lease dated March 23, 2010, by and between Rodger P. Nordblom and Peter C. Nordblom, as Trustees of Northwest Associates, and Registrant | 10-K | 3/29/10 | 10.34 | ||||||||||||||
| 21.1 | List of Subsidiaries | X | ||||||||||||||||
| 23.1 | Consent of Ernst & Young LLP | X | ||||||||||||||||
69
Table of Contents
| Exhibit |
Exhibit Description |
Incorporated By Reference | ||||||||||||||||
| Form | Date | Number | Filed Herewith |
|||||||||||||||
| 31.1 | Certification of Chief Executive Officer, as required by Rule 13a-14(a) or Rule 15d-14(a) | X | ||||||||||||||||
| 31.2 | Certification of Chief Financial Officer, as required by Rule 13a-14(a) or Rule 15d-14(a) | X | ||||||||||||||||
| 32.1 | Certification of Chief Executive Officer, as required by Rule 13a-14(b) or Rule 15d-14(b) and Section 1350 of Chapter 36 of Title 18 of the United States Code (18 U.S.C. §1350)** | X | ||||||||||||||||
| 32.2 | Certification of Chief Financial Officer, as required by Rule 13a-14(b) or Rule 15d-14(b) and Section 1350 of Chapter 36 of Title 18 of the United States Code (18 U.S.C. §1350)** | X | ||||||||||||||||
| † | Indicates a management contract or any compensatory plan, contract, or arrangement. |
| ** | The certifications attached as Exhibit 32.1 and 32.2 that accompany this Annual Report on Form 10-K are not deemed filed with the Securities and Exchange Commission and are not to be incorporated by reference into any filing of LeMaitre Vascular, Inc. under the Securities Act of 1933, as amended, or the Securities Exchange Act of 1934, as amended, whether made before or after the date of this Form 10-K, irrespective of any general incorporation language contained in such filing. |
70
Table of Contents
Pursuant to the requirements of Section 13 or 15(d) of the Securities Exchange Act of 1934, the registrant has duly caused this report to be signed on its behalf by the undersigned, thereunto duly authorized, on March 30, 2011.
| LEMAITRE VASCULAR | ||
| By: | /s/ GEORGE W. LEMAITRE | |
| George W. LeMaitre, Chief Executive Officer and Chairman of the Board | ||
Pursuant to the requirements of the Securities Exchange Act of 1934, this report has been signed below by the following persons on behalf of the registrant and in the capacities and on the dates indicated.
| Signature |
Title |
Date | ||
| /s/ GEORGE W. LEMAITRE George W. LeMaitre |
Chief Executive Officer and Chairman of the Board Principal Executive Officer |
March 30, 2011 | ||
| /s/ JOSEPH P. PELLEGRINO, Jr. Joseph P. Pellegrino, Jr. |
Chief Financial Officer |
March 30, 2011 | ||
| /s/ RUSSELL D. HAYS Russell D. Hays |
Director |
March 30, 2011 | ||
| /s/ MICHAEL C. JACKSON Michael C. Jackson |
Director |
March 30, 2011 | ||
| /s/ LAWRENCE J. JASINSKI Lawrence J. Jasinski |
Director |
March 30, 2011 | ||
| /s/ CORNELIA W. LEMAITRE Cornelia W. LeMaitre |
Vice President, Human Resources and Director |
March 30, 2011 | ||
| /s/ GEORGE D. LEMAITRE, M.D. George D. LeMaitre, M.D. |
Director |
March 30, 2011 | ||
| /s/ JOHN J. O’CONNOR John J. O’Connor |
Director |
March 30, 2011 | ||
| /s/ DAVID B. ROBERTS David B. Roberts |
President and Director |
March 30, 2011 | ||
| /s/ WILLIAM N. THORNDIKE, Jr. William N. Thorndike, Jr. |
Director |
March 30, 2011 | ||
71
Table of Contents
INDEX TO FINANCIAL STATEMENTS
| Page | ||||
| LeMaitre Vascular, Inc. |
||||
| Consolidated Financial Statements |
||||
| F-2 | ||||
| Consolidated Balance Sheets as of December 31, 2010 and 2009 |
F-3 | |||
| Consolidated Statements of Operations for the Years Ended December 31, 2010, 2009 and 2008 |
F-4 | |||
| F-5 | ||||
| Consolidated Statements of Cash Flows for the Years Ended December 31, 2010, 2009 and 2008 |
F-8 | |||
| F-9 | ||||
F-1
Table of Contents
Report of Independent Registered Public Accounting Firm
The Board of Directors and Stockholders of LeMaitre Vascular, Inc.
We have audited the accompanying consolidated balance sheets of LeMaitre Vascular, Inc. as of December 31, 2010 and 2009, and the related consolidated statements of operations, stockholders’ equity and comprehensive income (loss), and cash flows for each of the three years in the period ended December 31, 2010. These financial statements are the responsibility of the Company’s management. Our responsibility is to express an opinion on these financial statements based on our audits.
We conducted our audits in accordance with the standards of the Public Company Accounting Oversight Board (United States). Those standards require that we plan and perform the audit to obtain reasonable assurance about whether the financial statements are free of material misstatement. We were not engaged to perform an audit of the Company’s internal control over financial reporting. Our audits included consideration of internal control over financial reporting as a basis for designing audit procedures that are appropriate in the circumstances, but not for the purpose of expressing an opinion on the effectiveness of the Company’s internal control over financial reporting. Accordingly, we express no such opinion. An audit also includes examining, on a test basis, evidence supporting the amounts and disclosures in the financial statements, assessing the accounting principles used and significant estimates made by management, and evaluating the overall financial statement presentation. We believe that our audits provide a reasonable basis for our opinion.
In our opinion, the financial statements referred to above present fairly, in all material respects, the consolidated financial position of LeMaitre Vascular, Inc. at December 31, 2010 and 2009, and the consolidated results of its operations and its cash flows for each of the three years in the period ended December 31, 2010, in conformity with U.S. generally accepted accounting principles.
/s/ Ernst & Young LLP
Boston, Massachusetts
March 30, 2011
F-2
Table of Contents
Consolidated Balance Sheets
| December 31, 2010 |
December 31, 2009 |
|||||||
| (in thousands, except share data) |
||||||||
| Assets |
||||||||
| Current assets: |
||||||||
| Cash and cash equivalents |
$ | 22,614 | $ | 23,192 | ||||
| Marketable securities |
— | 808 | ||||||
| Accounts receivable, net of allowances of $184 at December 31, 2010, and $159 at December 31, 2009 |
8,475 | 7,778 | ||||||
| Inventory |
8,375 | 6,498 | ||||||
| Prepaid expenses and other current assets |
3,447 | 1,274 | ||||||
| Total current assets |
42,911 | 39,550 | ||||||
| Property and equipment, net |
3,806 | 2,101 | ||||||
| Goodwill |
11,917 | 11,022 | ||||||
| Other intangibles, net |
3,686 | 3,316 | ||||||
| Deferred tax assets |
134 | — | ||||||
| Other assets |
820 | 917 | ||||||
| Total assets |
$ | 63,274 | $ | 56,906 | ||||
| Liabilities and stockholders’ equity |
||||||||
| Current liabilities: |
||||||||
| Accounts payable |
$ | 1,320 | $ | 1,136 | ||||
| Accrued expenses |
8,628 | 5,412 | ||||||
| Acquisition-related obligations |
441 | — | ||||||
| Total current liabilities |
10,389 | 6,548 | ||||||
| Long-term debt |
— | 188 | ||||||
| Deferred tax liabilities |
443 | 1,546 | ||||||
| Other long-term liabilities |
86 | 411 | ||||||
| Total liabilities |
10,918 | 8,693 | ||||||
| Commitments and contingencies (Note 9) |
||||||||
| Stockholders’ equity: |
||||||||
| Preferred stock, $0.01 par value; authorized 5,000,000 shares; none issued or outstanding |
— | — | ||||||
| Common stock, $0.01 par value; authorized 100,000,000 shares; issued 16,117,201 shares at December 31, 2010, and 15,911,619 shares at December 31, 2009 |
161 | 159 | ||||||
| Additional paid-in capital |
64,642 | 63,475 | ||||||
| Accumulated deficit |
(8,583 | ) | (14,596 | ) | ||||
| Accumulated other comprehensive income (loss) |
(429 | ) | 94 | |||||
| Treasury stock, at cost; 637,916 shares at December 31, 2010, and 210,938 shares at December 31, 2009 |
(3,435 | ) | (919 | ) | ||||
| Total stockholders’ equity |
52,356 | 48,213 | ||||||
| Total liabilities and stockholders’ equity |
$ | 63,274 | $ | 56,906 | ||||
See accompanying notes to consolidated financial statements.
F-3
Table of Contents
Consolidated Statements of Operations
| Year ended December 31, | ||||||||||||
| 2010 | 2009 | 2008 | ||||||||||
| (in thousands, except per share data) |
||||||||||||
| Net sales |
$ | 56,060 | $ | 50,908 | $ | 48,720 | ||||||
| Cost of sales |
14,341 | 13,604 | 14,817 | |||||||||
| Gross profit |
41,719 | 37,304 | 33,903 | |||||||||
| Sales and marketing |
19,409 | 17,710 | 19,762 | |||||||||
| General and administrative |
10,506 | 9,852 | 9,999 | |||||||||
| Research and development |
5,488 | 5,910 | 5,328 | |||||||||
| Restructuring charges |
1,816 | 1,777 | 1,147 | |||||||||
| Impairment charges |
485 | 106 | 597 | |||||||||
| Total operating expenses |
37,704 | 35,355 | 36,833 | |||||||||
| Income (loss) from operations |
4,015 | 1,949 | (2,930 | ) | ||||||||
| Other income (expense): |
||||||||||||
| Interest income |
31 | 38 | 530 | |||||||||
| Interest expense |
(5 | ) | (26 | ) | (61 | ) | ||||||
| Investment impairment |
— | — | (168 | ) | ||||||||
| Foreign currency gain (loss) |
(30 | ) | 280 | (139 | ) | |||||||
| Other income (expense), net |
14 | (26 | ) | (53 | ) | |||||||
| Income (loss) before income taxes |
4,025 | 2,215 | (2,821 | ) | ||||||||
| Provision (benefit) for income taxes |
(1,988 | ) | 617 | 493 | ||||||||
| Net income (loss) |
$ | 6,013 | $ | 1,598 | $ | (3,314 | ) | |||||
| Net income (loss) per share available for common shareholders: |
||||||||||||
| Basic |
$ | 0.38 | $ | 0.10 | $ | (0.21 | ) | |||||
| Diluted |
$ | 0.37 | $ | 0.10 | $ | (0.21 | ) | |||||
| Weighted-average shares outstanding: |
||||||||||||
| Basic |
15,627 | 15,687 | 15,572 | |||||||||
| Diluted |
16,114 | 15,916 | 15,572 | |||||||||
See accompanying notes to consolidated financial statements.
F-4
Table of Contents
Consolidated Statements of Stockholders’ Equity and Comprehensive Income (Loss)
(in thousands, except share data)
| Common Stock | Additional Paid-in Capital |
Accumulated Deficit |
Accumulated Other Comprehensive Income (Loss) |
Treasury Stock | Total Stockholders’ Equity |
|||||||||||||||||||||||||||
| Shares | Amount | Shares | Amount | |||||||||||||||||||||||||||||
| Balance at December 31, 2007 |
15,516,412 | $ | 155 | $ | 61,187 | $ | (12,880 | ) | $ | 291 | 26,852 | $ | (167 | ) | $ | 48,586 | ||||||||||||||||
| Net loss |
(3,314 | ) | (3,314 | ) | ||||||||||||||||||||||||||||
| Unrealized loss on available for sale securities |
(190 | ) | (190 | ) | ||||||||||||||||||||||||||||
| Foreign currency translation adjustment |
(373 | ) | (373 | ) | ||||||||||||||||||||||||||||
| Comprehensive loss |
(3,877 | ) | ||||||||||||||||||||||||||||||
| Issuance of common stock for stock options exercised |
99,640 | 1 | 204 | 205 | ||||||||||||||||||||||||||||
| Issuance of common stock for employee stock plan purchases |
22,047 | 98 | 98 | |||||||||||||||||||||||||||||
| Vested restricted stock units |
65,423 | 1 | 1 | |||||||||||||||||||||||||||||
| Stock based compensation expense |
801 | 801 | ||||||||||||||||||||||||||||||
| Repurchase of common stock at cost |
23,432 | (66 | ) | (66 | ) | |||||||||||||||||||||||||||
| Balance at December 31, 2008 |
15,703,522 | $ | 157 | $ | 62,290 | $ | (16,194 | ) | $ | (272 | ) | 50,284 | $ | (233 | ) | $ | 45,748 | |||||||||||||||
See accompanying notes to consolidated financial statements.
F-5
Table of Contents
LeMaitre Vascular, Inc.
Consolidated Statements of Stockholders’ Equity and Comprehensive Income (Loss)—(continued)
(in thousands, except share data)
| Common Stock | Additional Paid-in Capital |
Accumulated Deficit |
Accumulated Other Comprehensive Income (Loss) |
Treasury Stock | Total Stockholders’ Equity |
|||||||||||||||||||||||||||
| Shares | Amount | Shares | Amount | |||||||||||||||||||||||||||||
| Balance at December 31, 2008 |
15,703,522 | $ | 157 | $ | 62,290 | $ | (16,194 | ) | $ | (272 | ) | 50,284 | $ | (233 | ) | $ | 45,748 | |||||||||||||||
| Net income |
1,598 | 1,598 | ||||||||||||||||||||||||||||||
| Unrealized gain on available for sale securities |
95 | 95 | ||||||||||||||||||||||||||||||
| Foreign currency translation adjustment |
271 | 271 | ||||||||||||||||||||||||||||||
| Comprehensive income |
1,964 | |||||||||||||||||||||||||||||||
| Issuance of common stock for stock options exercised |
51,250 | 1 | 156 | 157 | ||||||||||||||||||||||||||||
| Issuance of common stock for employee stock plan purchases |
18,378 | 44 | 44 | |||||||||||||||||||||||||||||
| Vested restricted stock units |
138,469 | 1 | 1 | |||||||||||||||||||||||||||||
| Stock based compensation expense |
985 | 985 | ||||||||||||||||||||||||||||||
| Repurchase of common stock at cost |
160,654 | (686 | ) | (686 | ) | |||||||||||||||||||||||||||
| Balance at December 31, 2009 |
15,911,619 | $ | 159 | $ | 63,475 | $ | (14,596 | ) | $ | 94 | 210,938 | $ | (919 | ) | $ | 48,213 | ||||||||||||||||
See accompanying notes to consolidated financial statements.
F-6
Table of Contents
LeMaitre Vascular, Inc.
Consolidated Statements of Stockholders’ Equity and Comprehensive Income (Loss)—(continued)
(in thousands, except share data)
| Common Stock | Additional Paid-in Capital |
Accumulated Deficit |
Accumulated Other Comprehensive Income (Loss) |
Treasury Stock | Total Stockholders’ Equity |
|||||||||||||||||||||||||||
| Shares | Amount | Shares | Amount | |||||||||||||||||||||||||||||
| Balance at December 31, 2009 |
15,911,619 | $ | 159 | $ | 63,475 | $ | (14,596 | ) | $ | 94 | 210,938 | $ | (919 | ) | $ | 48,213 | ||||||||||||||||
| Net income |
6,013 | 6,013 | ||||||||||||||||||||||||||||||
| Unrealized loss on available for sale securities |
(4 | ) | (4 | ) | ||||||||||||||||||||||||||||
| Foreign currency translation adjustment |
(519 | ) | (519 | ) | ||||||||||||||||||||||||||||
| Comprehensive income |
5,490 | |||||||||||||||||||||||||||||||
| Issuance of common stock for stock options exercised |
73,497 | 1 | 130 | 131 | ||||||||||||||||||||||||||||
| Vested restricted stock units |
132,085 | 1 | 1 | |||||||||||||||||||||||||||||
| Tax benefits from stock-based compensation awards |
70 | 70 | ||||||||||||||||||||||||||||||
| Stock based compensation expense |
967 | 967 | ||||||||||||||||||||||||||||||
| Repurchase of common stock at cost |
426,978 | (2,516 | ) | (2,516 | ) | |||||||||||||||||||||||||||
| Balance at December 31, 2010 |
16,117,201 | $ | 161 | $ | 64,642 | $ | (8,583 | ) | $ | (429 | ) | 637,916 | $ | (3,435 | ) | $ | 52,356 | |||||||||||||||
See accompanying notes to consolidated financial statements.
F-7
Table of Contents
Consolidated Statements of Cash Flows
| Year ended December 31, | ||||||||||||
| 2010 | 2009 | 2008 | ||||||||||
| (in thousands) | ||||||||||||
| Operating activities |
||||||||||||
| Net income (loss) |
$ | 6,013 | $ | 1,598 | $ | (3,314 | ) | |||||
| Adjustments to reconcile net income (loss) to net cash provided by operating activities: |
||||||||||||
| Depreciation and amortization |
1,376 | 1,419 | 1,593 | |||||||||
| Stock-based compensation |
967 | 985 | 801 | |||||||||
| Accretion of discount (amortization of premium) on marketable securities |
1 | 46 | (99 | ) | ||||||||
| Investment impairment charges |
— | — | 168 | |||||||||
| (Gain) loss on sales of marketable securities |
— | 34 | (5 | ) | ||||||||
| Impairment charges |
485 | 106 | 597 | |||||||||
| Provision for losses in accounts receivable |
55 | 75 | 27 | |||||||||
| Provision for inventory write-downs |
836 | 428 | 1,048 | |||||||||
| Provision for (benefit from) deferred income taxes |
(2,380 | ) | 226 | 249 | ||||||||
| Tax benefits from stock-based compensation awards |
(70 | ) | — | — | ||||||||
| Loss on disposal of property and equipment |
51 | 17 | 41 | |||||||||
| Abandonment of fixed assets |
108 | — | — | |||||||||
| Foreign currency transaction gain |
37 | 63 | 25 | |||||||||
| Changes in operating assets and liabilities, net of effect of business acquisitions: |
||||||||||||
| Accounts receivable |
(973 | ) | (486 | ) | (353 | ) | ||||||
| Inventory |
(1,735 | ) | 164 | 1,473 | ||||||||
| Prepaid expenses and other assets |
(846 | ) | 610 | 1,050 | ||||||||
| Accounts payable and other liabilities |
3,127 | 155 | (2,720 | ) | ||||||||
| Net cash provided by operating activities |
7,052 | 5,440 | 581 | |||||||||
| Investing activities |
||||||||||||
| Purchase of property and equipment |
(2,471 | ) | (577 | ) | (624 | ) | ||||||
| Payments related to acquisitions |
(3,520 | ) | (759 | ) | (835 | ) | ||||||
| Receipts related to divestitures |
40 | — | — | |||||||||
| Purchase of technology and licenses |
(87 | ) | (1,048 | ) | (114 | ) | ||||||
| Sales and maturities of marketable securities |
803 | 4,566 | 14,909 | |||||||||
| Purchase of marketable securities |
— | — | (4,323 | ) | ||||||||
| Net cash provided by (used in) investing activities |
(5,235 | ) | 2,182 | 9,013 | ||||||||
| Financing activities |
||||||||||||
| Proceeds from issuance of common stock |
132 | 202 | 304 | |||||||||
| Purchase of treasury stock |
(2,516 | ) | (686 | ) | (66 | ) | ||||||
| Tax benefits from stock-based compensation awards |
70 | — | — | |||||||||
| Proceeds from Italian government loan |
— | 108 | — | |||||||||
| Payments of Italian government loan |
(21 | ) | — | — | ||||||||
| Repayment of revolving line of credit |
— | — | (262 | ) | ||||||||
| Net cash used in financing activities |
(2,335 | ) | (376 | ) | (24 | ) | ||||||
| Effect of exchange rate changes on cash and cash equivalents |
(60 | ) | 51 | (72 | ) | |||||||
| Net increase (decrease) in cash and cash equivalents |
(578 | ) | 7,297 | 9,498 | ||||||||
| Cash and cash equivalents at beginning of year |
23,192 | 15,895 | 6,397 | |||||||||
| Cash and cash equivalents at end of year |
$ | 22,614 | $ | 23,192 | $ | 15,895 | ||||||
| Supplemental disclosures of cash flow information (see Note 15). |
||||||||||||
See accompanying notes to consolidated financial statements.
F-8
Table of Contents
Notes to Consolidated Financial Statements
December 31, 2010
1. Significant Accounting Policies and Related Matters
Description of Business
Unless the context requires otherwise, references to LeMaitre Vascular, we, our, and us refer to LeMaitre Vascular, Inc. and our subsidiaries. We develop, manufacture, and market medical devices and implants used primarily in the field of vascular surgery. We operate in a single segment in which our principal product lines are aortic stent grafts, balloon catheters, carotid shunts, laparoscopic cholecystectomy devices, radiopaque tape, remote endarterectomy devices, valvulotomes, vascular grafts, vascular patches, and vessel closure systems. We also have rights to distribute in several European countries an abdominal stent graft manufactured by a third party through June 30, 2013. In addition, we have rights to exclusively distribute in the United States and most of Europe a biologic vascular patch manufactured by a third party through January 26, 2016. Our offices are located in Burlington, Massachusetts, Sulzbach, Germany, Milan, Italy, Brindisi, Italy, Laguna Hills, California and Tokyo, Japan.
Consolidation and Basis of Presentation
Our consolidated financial statements include the accounts of LeMaitre Vascular and the accounts of our wholly-owned subsidiaries, LeMaitre Vascular GmbH, LeMaitre Vascular GK, Vascutech Acquisition LLC, LeMaitre Acquisition LLC, LeMaitre Vascular SAS, Biomateriali S.r.l., and LeMaitre Vascular S.r.l. All significant intercompany accounts and transactions have been eliminated in consolidation.
Foreign Currency Translation
Balance sheet accounts of foreign subsidiaries are translated into U.S. dollars at year-end exchange rates. Operating accounts are translated at average exchange rates for each year. Net translation gains or losses are adjusted directly to a separate component of other comprehensive income (loss) within stockholders’ equity.
Foreign exchange transaction gains (losses), substantially all of which relate to intercompany activity between us and our foreign subsidiaries, amounted to ($30,000) in 2010, $0.3 million in 2009, and ($0.1) million in 2008, and are included in other income (expense) in the accompanying consolidated statements of operations.
Estimates
The preparation of financial statements in conformity with U.S. generally accepted accounting principles (GAAP) requires us to make estimates and assumptions that affect the amounts reported in our consolidated financial statements and accompanying notes. Our estimates and assumptions, including those related to bad debts, inventories, intangible assets, sales returns and discounts, and income taxes are reviewed on an ongoing basis and updated as appropriate. Actual results could differ from those estimates.
Revenue Recognition
Our revenue is derived primarily from the sale of disposable or implantable devices used during vascular surgery. We sell directly to hospitals and to distributors, as described below, and, during the periods presented in our consolidated financial statements, entered into consigned inventory arrangements with either hospitals or distributors on a limited basis.
We recognize revenue when four basic criteria are met: (1) persuasive evidence of an arrangement exists; (2) delivery has occurred or services have been rendered; (3) the fee is fixed or determinable; and (4) collectability is reasonably assured. We assess whether the fee is fixed or determinable based on the terms of
F-9
Table of Contents
the agreement associated with the transaction. Substantially all sales transactions are based on prices that are determinable at the time the customer’s purchase order is accepted by us. Orders that are not accompanied with a purchase order are either confirmed in writing or verbally with the customer.
After the delivery of the product, there is no uncertainty about customer acceptance due to the nature of the product. There is no contingency for acceptance, warranty, or price protection. We do not recognize revenue on consigned sales until the customer notifies us that the products have been used. In order to determine whether collection is reasonably assured, we assess a number of factors, including past transaction history with the customer and the creditworthiness of the customer. If we determine that collection is not reasonably assured, we defer the recognition of revenue until collection becomes reasonably assured, which is generally upon receipt of payment. We provide for product returns at the time revenue is recognized based on our product return history.
Based on these policies, we recognize revenue, net of allowances for returns and discounts, as products are shipped, based on shipping point terms, or at the time consigned inventory is consumed at which time title passes to customers. We recognize revenue net of allowances for returns and discounts, at the time of shipment of our products to our distributors. Customers returning products are entitled to full or partial credit based on the condition and timing of the return. To be accepted, a returned product must be unopened (if sterile), unadulterated, and undamaged, and must have at least 18 months remaining prior to its expiration date, or twelve months for our hospital customers in Europe. These return policies apply to sales to both hospitals and distributors. Our products are subject to a limited warranty that our products have been manufactured with due care. The amount of products returned to us, either for exchange or credit, has not been material. Nevertheless, we provide for an allowance for future sales returns based on historical return experience. Our cost of replacing defective products has not been material and is accounted for at the time of replacement.
Research and Development Expense
Research and development costs, principally salaries, laboratory testing, and supplies, are expensed as incurred.
Shipping and Handling Costs
Shipping and handling fees paid by customers are recorded within net sales, with the related expense recorded in cost of sales.
Advertising Costs
Advertising costs are expensed as incurred and are included as a component of sales and marketing expense in the accompanying Consolidated Statements of Operations. Advertising costs amounted to $0.3 million in 2010, $0.4 million in 2009, and $0.6 million in 2008.
Cash and Cash Equivalents
We consider all highly liquid instruments purchased with maturity dates of 90 days or less to be cash equivalents. Cash and cash equivalents are primarily invested in fully collateralized overnight repurchase agreements and short-term U.S. treasury securities. These amounts are stated at cost, which approximates fair value.
Marketable Securities
Our investments consist primarily of marketable debt securities and U.S. government securities, which are classified as available-for-sale and are carried at fair market value at December 31, 2010 and December 31, 2009. The unrealized gains (losses) on available-for-sale securities are recorded in accumulated other comprehensive income (loss). We consider all highly liquid investments with maturities of 90 days or less at the time of purchase
F-10
Table of Contents
to be cash equivalents, and investments with maturities of greater than 90 days at the time of purchase to be marketable securities. When a marketable security incurs a significant unrealized loss for a sustained period of time, we review the instrument to determine if it is other-than-temporarily impaired. If we conclude an instrument is other-than-temporarily impaired, we record the unrealized loss in the consolidated statement of operations.
Concentrations of Credit Risk
Our financial instruments that are exposed to concentrations of credit risk consist primarily of cash and cash equivalents, marketable securities, and accounts receivable. Cash equivalents represent highly liquid investments with maturities of 90 days or less at the date of purchase. Marketable securities are investment grade, interest-earning securities and are diversified by type and industry. Credit risk related to cash, cash equivalents, and marketable securities are limited based on the creditworthiness of the financial institutions at which these funds are held.
Our accounts receivable are with customers based in the United States and internationally. Accounts receivable generally are due within 30 to 90 days of invoice and are stated at amounts due from customers, net of an allowance for doubtful accounts and sales returns, other than in certain European markets where longer payment terms are customary. We perform ongoing credit evaluations of the financial condition of our customers and adjust credit limits based upon payment history and the current creditworthiness of the customers, as determined by a review of their current credit information. We continuously monitor aging reports, collections, and payments from customers, and maintain a provision for estimated credit losses based upon historical experience and any specific customer collection issues we identify.
We write off accounts receivable when they become uncollectible. While such credit losses have historically been within our expectations and allowances, we cannot guarantee the same credit loss rates will be experienced in the future. The allowance for doubtful accounts is our best estimate of the amount of probable credit losses in our existing accounts receivable. We review our allowance for doubtful accounts on a monthly basis and all past due balances are reviewed individually for collectability. The provision for the allowance for doubtful accounts is recorded in general and administrative expenses. The following is a summary of our allowance for doubtful accounts and sales returns:
| Balance at Beginning of Period |
Additions Charged to Income |
Deductions from Reserves |
Balance at End of Period |
|||||||||||||
| (in thousands) | ||||||||||||||||
| Allowance for doubtful accounts and sales returns: |
||||||||||||||||
| Year ended December 31, 2010 |
$ | 159 | $ | 55 | $ | 30 | $ | 184 | ||||||||
| Year ended December 31, 2009 |
160 | 75 | 76 | 159 | ||||||||||||
| Year ended December 31, 2008 |
219 | 27 | 86 | 160 | ||||||||||||
Fair Value of Financial Instruments
Our financial instruments include cash and cash equivalents, marketable securities, accounts receivable, trade payables, and notes payable. The fair value of the majority of these instruments approximates their carrying value based upon their short-term nature or variable rates of interest.
Inventory
Inventory consists of finished products, work-in-process, and raw materials. We value inventory at the lower of cost or market value. Cost includes materials, labor, and manufacturing overhead and is determined using the first-in, first-out (FIFO) method. On a quarterly basis, we review inventory quantities on hand and analyze the provision for excess and obsolete inventory based primarily on product expiration dating and our estimated sales
F-11
Table of Contents
forecast, which is based on sales history and anticipated future demand. Our estimates of future product demand may not be accurate, and we may understate or overstate the provision required for excess and obsolete inventory. Accordingly, any significant unanticipated changes in demand could have a significant impact on the value of our inventory and results of operations.
Property and Equipment
Property and equipment are recorded at cost. Depreciation is provided over the estimated useful lives of the related assets using straight-line method as follows:
| Description |
Useful Life | |
| Computers and equipment | 3–5 years | |
| Machinery and equipment | 3–10 years | |
| Leasehold improvements | The shorter of its useful life or lease term |
Expenditures for maintenance and repairs are charged to operations when incurred, while additions and betterments are capitalized. When assets are retired or disposed, the asset’s original cost and related accumulated depreciation are eliminated from the accounts and any gain or loss is reflected in the statement of operations.
Valuation of Business Combinations
We assign the value of the consideration transferred to acquire a business to the tangible assets and identifiable intangible assets acquired and liabilities assumed on the basis of their fair values at the date of acquisition. We assess the fair value of assets, including intangible assets, using a variety of methods and are usually performed by an independent appraiser who measures fair value from the perspective of a market participant.
Beginning January 1, 2009, acquisitions have been accounted for using the acquisition method, and the acquired companies’ results have been included in the accompanying consolidated financial statements from their respective dates of acquisition. Acquisition transaction costs have been recorded in general and administrative expenses, and are expensed as incurred. Allocation of the purchase price for acquisitions is based on estimates of the fair value of the net assets acquired and, for acquisitions completed within the past year, is subject to adjustment upon finalization of the purchase price allocation.
Our acquisitions have historically been made at prices above the fair value of the acquired assets, resulting in goodwill, due to expectations of synergies of combining the businesses. These synergies include use of our existing commercial infrastructure to expand sales of the acquired businesses’ products, use of the commercial infrastructure of the acquired businesses to cost-effectively expand sales of our products, and the elimination of redundant facilities, functions and staffing.
Contingent Consideration
For business combinations completed after January 1, 2009, the FASB requires contingent consideration be recognized at the date of acquisition, based on the fair value at that date, and then re-measured periodically through adjustments to net income.
Impairment of Long-lived Assets
We review our long-lived assets (primarily property and equipment and intangible assets) subject to amortization quarterly to determine if any adverse conditions exist or a change in circumstances has occurred that would indicate impairment or a change in the remaining useful life. Conditions that may indicate impairment include, but are not limited to, a significant adverse change in legal factors or business climate that could affect
F-12
Table of Contents
the value of an asset, a product recall, or an adverse action or assessment by a regulator. If an impairment indicator exists, we test the intangible asset for recoverability. We record impairment losses on long-lived assets used in operations when events and circumstances indicate that the assets might be impaired and the undiscounted cash flows estimated to be generated by those assets are less than the carrying amount of those assets. Impairment is measured based on the fair market value of the affected asset using discounted cash flows.
In January 2008 we were notified by one of the customers of our Biomateriali subsidiary that they would no longer purchase a certain product line from us, and, as a result, we recorded an impairment charge of $0.4 million due to the write-down of related intangible assets. As of December 31, 2008, we determined that an impairment indicator existed with respect to the remaining product line with this Biomateriali customer. Consequently, we recorded an impairment charge of $84,000 to reduce the carrying value of these assets to their estimated fair value of $0.1 million. In June 2010, we determined that an impairment indicator existed with respect to the relationship with this Biomateriali customer. As a result, we recorded an impairment charge of $67,000 to write-off the remaining carrying value of the customer relationship with this Biomateriali customer. Fair value was determined by projected future cash flows discounted to their net present value.
In 2008, we also recognized impairment charges of $78,000 related to patents and trademarks which were deemed to have no value based upon a lack of future expected economic benefits. In March 2009 we determined that certain patents within our endovascular product category portfolio in the United States and Europe had no value based upon an analysis of expected economic benefits. As a result, we recorded an impairment charge of $0.1 million for the write-down of these patents. In 2009, we also recognized impairment charges of $30,000 related to patents and trademarks which were deemed to have no value based upon a lack of future expected economic benefits.
In 2010, we recognized impairment charges of $0.4 million related to our TAArget and UniFit products associated with certain technology, customer lists, and fixed assets. We determined that an impairment indicator existed with respect to these products as we suspended enrollment into our UNITE and ENTRUST clinical trials and ceased development efforts related to these products in October 2010. The fair value of the residual intangible assets of $0.2 million was determined by projected future cash flows discounted to their net present value and will be amortized over three years.
These impairment adjustments fall within Level 3 of the fair value hierarchy, due to the use of significant unobservable inputs to determine fair value. The fair value measurements were calculated using unobservable inputs, primarily using the income approach, specifically the discounted cash flow method. The amount and timing of future cash flows within our analysis was based on our most recent operational budgets, long range strategic plans and other estimates.
Goodwill
Goodwill represents the amount of consideration paid in connection with business acquisitions in excess of the fair value of assets acquired and liabilities assumed. Goodwill is evaluated for impairment annually or more frequently if indicators of impairment are present or changes in circumstances suggest that impairment may exist. We evaluate the December 31 balance of the carrying value of goodwill based on a single reporting unit annually. The first step of our goodwill impairment test, used to identify potential impairment, compares the fair value of our reporting unit with its carrying amount, including goodwill. If the fair value of our reporting unit exceeds its carrying amount, the goodwill of the reporting unit is considered not impaired, and the second step of the impairment test, used to measure the amount of the impairment loss, is unnecessary. If the carrying amount of our reporting unit exceeds its fair value, the second step of the goodwill impairment test is performed to measure the amount of impairment loss, if any. The second step of the goodwill impairment test, used to measure the amount of impairment loss, compares the implied fair value of the reporting unit goodwill as of the date of the impairment review with the carrying amount of that goodwill. The implied fair value of goodwill is determined on the same basis as the amount of goodwill recognized in connection with a business combination. Specifically, the fair value of a reporting unit is allocated to all of the assets and liabilities (including any unrecognized
F-13
Table of Contents
intangible assets) as if the reporting unit had been acquired in a business combination as of the date of the impairment review and as if the fair value of the reporting unit was the price paid to acquire the reporting unit. The excess of the fair value of a reporting unit over the amounts assigned to its assets and liabilities is the implied fair value of goodwill. If the carrying amount of the reporting unit goodwill exceeds the implied fair value of that goodwill, an impairment loss shall be recognized in an amount equal to that excess. We have determined that no goodwill impairment charges were required for the years ended December 31, 2010, 2009, or 2008.
Other Intangible Assets
Other intangible assets consist primarily of patents, trademarks, technology licenses, and customer relationships acquired in connection with business acquisitions and asset acquisitions and are amortized over their estimated useful lives, ranging from 2 to 15 years.
Stock-based Compensation
We recognize, as expense, the estimated fair value of stock options to employees which is determined using the Black-Scholes option pricing model. We have elected to recognize the compensation cost of all share-based awards on a straight-line basis over the vesting period of the award. In periods that we grant stock options, fair value assumptions are based on volatility, interest, dividend yield, and expected term over which the stock options will be outstanding. The computation of expected volatility is based on the historical volatility of the company’s stock. The interest rate for periods within the contractual life of the award is based on the U.S. Treasury risk-free interest rate in effect at the time of grant. The expected lives of the options were estimated using the simplified method for “plain vanilla” options. Computation of expected forfeitures is based on historical forfeiture rates of our share-based awards.
We also issue restricted stock units (RSUs) as an additional form of equity compensation to our employees, officers, and directors, pursuant to our stockholder-approved 2006 Plan. RSUs entitle the grantee to an issuance of stock at no cost and generally vest over a period of time determined by our Board of Directors at the time of grant based upon the continued service to the company. The fair market value of the award is determined based on the number of RSUs granted and the market value of our common stock on the grant date and is amortized to expense over the period of vesting. Computation of expected forfeitures is based on historical forfeiture rates of our share-based awards. Unvested RSUs are forfeited and canceled as of the date that employment or service to the company terminates. RSUs are settled in shares of our common stock upon vesting. We may repurchase common stock upon our employees’ vesting in RSUs in order to cover any minimum tax withholding liability as a result of the RSUs having vested.
We used an expected forfeiture rate of approximately 16%, 18%, and 20% for 2010, 2009, and 2008, respectively. Share-based compensation charges are recorded net of the estimated forfeitures and will be adjusted in future periods to reflect the results of actual forfeitures and vesting. Share-based compensation charges are recorded across the consolidated statement of operations based upon the grantee’s primary function.
Commitments and Contingencies
In the normal course of business, we are subject to proceedings, lawsuits, and other claims and assessments for matters related to, among other things, patent infringement, business acquisitions, employment, and product recalls. We assess the likelihood of any adverse judgments or outcomes to these matters as well as potential ranges of probable losses. A determination of the amount of reserves required, if any, for these contingencies is made after careful analysis of each individual issue. The required reserves may change in the future due to new developments in each matter or changes in approach such as a change in settlement strategy in dealing with these matters. We record charges for the losses we anticipate incurring in connection with litigation and claims against us when we conclude a loss is probable and we can reasonably estimate these losses. During the years ended December 31, 2010, 2009, and 2008, we were not subject to any material litigation or claims and assessments.
F-14
Table of Contents
Income Taxes
We account for income taxes under the asset and liability method of accounting for income taxes. Under the asset and liability method, deferred taxes are determined based on the difference between the financial reporting and tax bases of assets and liabilities using enacted tax rates in effect in the years in which the differences are expected to reverse. The provision for income taxes includes taxes currently payable and deferred taxes resulting from the tax effects of temporary differences between the financial statement and tax bases of assets and liabilities. We maintain valuation allowances where it is more likely than not that all or a portion of a deferred tax asset will not be realized. Changes in the valuation allowances are included in our tax provision in the period of change. In determining whether a valuation allowance is warranted, we evaluate factors such as prior earnings history, expected future earnings, carry-back and carry-forward periods and tax strategies that could potentially enhance the likelihood of the realization of a deferred tax asset.
We recognize, measure, present and disclose in our financial statements, uncertain tax positions that we have taken or expect to take on a tax return. We recognize in our financial statements the impact of tax positions that meet a “more likely than not” threshold, based on the technical merits of the position. The tax benefits recognized in the financial statements from such a position are measured based on the largest benefit that has a greater than fifty percent likelihood of being realized upon ultimate settlement.
Our policy is to classify interest and penalties related to unrecognized tax benefits as income tax expense, which is consistent with that of prior years.
Comprehensive Income (Loss)
Comprehensive income (loss) is defined as the change in equity of a business enterprise during a period from transactions and other events and circumstances from non-owner sources. Other than reported net income (loss), comprehensive income (loss) includes foreign currency translation adjustments and unrealized gains and losses on available-for-sale marketable securities, which are disclosed in the accompanying consolidated statements of stockholders’ equity and comprehensive income (loss).
As of December 31, 2010, accumulated other comprehensive loss consisted of foreign currency translation adjustment losses of $429,000. As of December 31, 2009, accumulated other comprehensive income consisted of unrealized gains on available-for-sale securities of $4,000 and foreign currency translation adjustment gains of $90,000.
Restructuring
We record restructuring charges incurred in connection with consolidation or relocation of operations, exited business lines, shutdowns of specific sites, or distributor terminations. These restructuring charges, which reflect our commitment to a termination or exit plan that will begin within twelve months, are based on estimates of the expected costs associated with site closure, legal matters, contract terminations, employee separation arrangements, or other costs directly related to the restructuring. If the actual cost incurred exceeds the estimated cost, an additional charge to earnings will result. If the actual cost is less than the estimated cost, a credit to earnings will be recognized.
Net Income (Loss) Per Share
We compute basic earnings per share by dividing net income available for common stockholders by the weighted average number of shares outstanding during the year. Except where the result would be anti-dilutive to net income (loss) per share, diluted earnings per share has been computed using the treasury stock method and reflects the potential vesting of restricted common stock and the potential exercise of stock options, as well as their related income tax effects.
F-15
Table of Contents
The computation of basic and diluted net income (loss) per share is as follows:
| Year ended December 31, | ||||||||||||
| 2010 | 2009 | 2008 | ||||||||||
| (in thousands, except per share data) | ||||||||||||
| Basic: |
||||||||||||
| Net income (loss) available for common stockholders |
$ | 6,013 | $ | 1,598 | $ | (3,314 | ) | |||||
| Weighted average shares outstanding |
15,627 | 15,687 | 15,572 | |||||||||
| Basic net income (loss) per share |
$ | 0.38 | $ | 0.10 | $ | (0.21 | ) | |||||
| Diluted: |
||||||||||||
| Net income (loss) available for common stockholders |
$ | 6,013 | $ | 1,598 | $ | (3,314 | ) | |||||
| Weighted-average shares outstanding |
15,627 | 15,687 | 15,572 | |||||||||
| Common stock equivalents, if dilutive |
487 | 229 | — | |||||||||
| Shares used in computing diluted net income (loss) per common share |
16,114 | 15,916 | 15,572 | |||||||||
| Diluted net income (loss) per share |
$ | 0.37 | $ | 0.10 | $ | (0.21 | ) | |||||
For 2010 shares used in computing diluted net income per common share excludes 58,363 weighted-average shares of common stock issuable upon exercise of outstanding stock options and vesting of RSUs, as the effect of including those shares would be anti-dilutive.
For 2009 shares used in computing diluted net income per common share excludes 303,958 weighted-average shares of common stock issuable upon exercise of outstanding stock options and vesting of RSUs, as the effect of including those shares would be anti-dilutive.
For 2008 shares used in computing diluted net loss per common share excludes 394,257 weighted-average shares of common stock issuable upon exercise of outstanding stock options and vesting of RSUs, as the effect of including those shares would be anti-dilutive. An additional 232,845 of common stock equivalents were excluded as a result of our net loss for the period.
Recent Accounting Pronouncements
In January 2010, the Financial Accounting Standards Board (the FASB) issued new guidance to determine whether variable interests in third party entities grant a controlling financial interest in the entities. This amended guidance replaces the previous quantitative approach for identifying when enterprises should consolidate variable interest entities with a qualitative analysis, based on which enterprise has both (1) the power to direct the economic activities of a variable interest entity and (2) the obligation to absorb losses or receive benefits from the entity that could be significant to the variable interest entity. We adopted this guidance effective January 1, 2010. The adoption did not have an effect on our consolidated results of operations or financial condition.
2. Marketable Securities
Marketable securities are primarily available-for-sale investments and consist of the following:
| As of December 31, 2009 | ||||||||||||||||
| Amortized Cost |
Gross Unrealized Gains |
Gross Unrealized Losses |
Fair Value |
|||||||||||||
| (in thousands) | ||||||||||||||||
| Corporate bonds |
$ | 450 | $ | — | $ | — | $ | 450 | ||||||||
| Asset backed securities |
354 | 4 | — | 358 | ||||||||||||
| Total marketable securities |
$ | 804 | $ | 4 | $ | — | $ | 808 | ||||||||
F-16
Table of Contents
We did not own any marketable securities as of December 31, 2010.
Gross realized gains and losses on the sales of available-for-sale marketable securities were not material and have been included in interest income in the consolidated statements of operations for 2010, 2009, and 2008.
In 2008, we recorded an investment impairment charge of $0.2 million which was attributed to the other-than-temporary decline in one asset backed security which we held as available-for-sale in our marketable securities portfolio at December 31, 2008.
3. Acquisitions and Divestitures
Biomateriali
In December 2007, we acquired all of the stock of Biomateriali, S.r.l. (Biomateriali) a privately held Italian company. Biomateriali manufactures polyester grafts for use in open abdominal aortic aneurysm and peripheral vascular procedures, which we branded the AlboGraft Vascular Graft. Our consolidated financial statements include the operating results for Biomateriali from the date of the acquisition.
The aggregate purchase price was $3.4 million in cash and included: a $1.9 million cash payment on the date of the acquisition; $1.1 million deferred payment for the assumption of outstanding debt to their shareholders and their officers, of which $0.5 million was paid in 2008 and $0.6 million was paid in 2009; $0.2 million of direct acquisition costs; and $0.2 million for a deferred purchase price payment which was paid in 2009.
In October 2010, we announced the transfer of the manufacturing of the AlboGraft Vascular Graft to our Burlington facility and the subsequent closure of the Biomateriali manufacturing plant as discussed in Note 13.
AlboGraft Distribution Agreement
In March 2009, we entered into a series of agreements with Edwards Lifesciences Corporation (Edwards) to terminate their distribution of our AlboGraft Vascular Graft product line in Europe and certain other international markets, for which they had exclusive rights through 2011, and to acquire certain assets and rights from Edwards. We paid $3.5 million to Edwards in exchange for this early termination, the purchase of their AlboGraft customer list, certain licenses and most of their remaining AlboGraft inventory. We allocated the payment to the tangible and intangible assets acquired, and to the settlement of our pre-existing relationship with Edwards, based on the estimated fair value of each of these elements to the transaction. As such, we recorded $1.0 million of intangible assets, recognized a $1.8 million restructuring charge related to the early termination of the distribution agreement, and $0.7 million of inventory.
LifeSpan Vascular Graft
In November 2010, we entered into an Asset Purchase Agreement (the Angiotech Agreement) with Angiotech Pharmaceuticals (US), Inc., and Angiodevice International GmbH (together, Sellers), to acquire substantially all the assets associated with the LifeSpan Vascular Graft and related manufacturing business. Assets acquired include inventory, fixed assets, select contractual commitments, permits and approvals, legal rights, and intellectual property. Other provisions of the Angiotech Agreement include transitional assistance from Sellers and mutual indemnification for losses arising out of or relating to certain breaches of, and misrepresentations under, the Angiotech Agreement.
The purchase price for this acquisition was $2.8 million dollars. We paid Angiotech $2.5 million at the closing of the acquisition. We will pay approximately $0.3 million on the first anniversary of the closing. The deferred payments have been included in Acquisition-related obligations in the December 31, 2010 consolidated balance sheet. We accounted for the acquisition as a business combination.
F-17
Table of Contents
We are not aware of any information that indicates the final purchase price allocations will differ materially from the preliminary estimates. The following table summarizes the preliminary purchase accounting for the fair value of the assets acquired and liabilities assumed at the date of the acquisition:
| Allocated Fair Value |
||||
| (in thousands) | ||||
| Current assets |
$ | 765 | ||
| Property and equipment |
209 | |||
| Intangible assets |
931 | |||
| Goodwill |
895 | |||
| Total assets acquired |
2,800 | |||
| Total liabilities assumed |
— | |||
| $ | 2,800 | |||
The goodwill of $0.9 million will be deductible for tax purposes over 15 years.
Of the $0.9 million of acquired intangible assets, the following table reflects the allocation of the acquired intangible assets and related estimated useful lives:
| Allocated Fair Value |
Weighted Average Useful Life |
|||||||
| (in thousands) | ||||||||
| Patents |
$ | 863 | 6.0 years | |||||
| Customer and contract relationships |
68 | 4.0 years | ||||||
| Total intangible assets |
$ | 931 | ||||||
In a related transaction, on November 30, 2010, we entered into an Asset Purchase Agreement and a Transition Agreement (together, the Edwards Agreements), each with Edwards Lifesciences Corporation (Edwards), and certain of Edwards’ affiliates, for an orderly transition of Edwards’ distribution business of the LifeSpan Vascular Graft in Europe and Japan from Edwards to LeMaitre, and to acquire from Edwards certain assets related to Edwards’ distribution of the product, including inventory, detailed customer lists for Europe and Japan, transfer of certain registrations, and the LifeSpan trademark. Under the Edwards Agreements, Edwards will provide sales and marketing cooperation through assignment of most assignable customer contracts and other transition assistance.
We paid Edwards $1.0 million on the closing date and paid $0.2 million in March 2011. The deferred payments have been included in Acquisition-related obligations in the December 31, 2010 balance sheet. We allocated the payment to the tangible and intangible assets acquired based on the estimated fair value of each of these elements to the transaction. As such, we recorded $0.6 million of inventory and $0.5 million of intangible assets. The weighted-average amortization period for these intangibles as of December 31, 2010 is 4.4 years. In addition, we recorded $0.1 million as prepaid transition services which will be amortized over its contractual life of three months.
The LifeSpan Vascular Graft fair value measurements fall within Level 3 of the fair value hierarchy, due to the use of significant unobservable inputs to determine fair value. The fair value measurements were calculated using unobservable inputs, primarily using the income approach, specifically the discounted cash flow method. The amount and timing of future cash flows within our analysis was based on our acquisition due diligence model, most recent operational budgets, long range strategic plans and other estimates.
F-18
Table of Contents
OptiLock Implantable Port
On June 1, 2010, we sold our OptiLock Implantable Port product line to Minvasive Ltd. (Minvasive). In exchange for consideration of approximately $0.2 million, Minvasive received our existing inventory, tangible and intangible assets, and a customer list associated with the product line. Payment terms included $30,000 due at signing, with the remaining balance to be paid in the form of a royalty of 30% of Minvasive’s OptiLock Implantable Port sales until the total consideration is paid in full. In 2014, any outstanding balance will become due in full. As a result of the transaction, we recorded the estimated present value of amounts due as a $0.1 million receivable in other long term assets. All royalty payments received from Minvasive will be applied to the receivable, and any payments received in excess of the outstanding receivable balance will be recognized as a gain on disposition in the periods in which they are received. We have received $40,000 as of December 31, 2010.
4. Inventory
Inventory consists of the following:
| As of December 31, | ||||||||
| 2010 | 2009 | |||||||
| (in thousands) | ||||||||
| Raw materials |
$ | 2,219 | $ | 1,624 | ||||
| Work-in-process |
1,469 | 1,244 | ||||||
| Finished products |
4,687 | 3,630 | ||||||
| Total inventory |
$ | 8,375 | $ | 6,498 | ||||
5. Property and Equipment
Property and equipment consists of the following:
| As of December 31, | ||||||||
| 2010 | 2009 | |||||||
| (in thousands) | ||||||||
| Computers and equipment |
$ | 2,066 | $ | 1,922 | ||||
| Machinery and equipment |
6,221 | 4,255 | ||||||
| Leasehold improvements |
1,205 | 1,171 | ||||||
| Gross property and equipment |
9,492 | 7,348 | ||||||
| Less accumulated depreciation |
(5,686 | ) | (5,247 | ) | ||||
| Property and equipment, net |
$ | 3,806 | $ | 2,101 | ||||
Depreciation expense amounted to approximately $0.7 million, $0.8 million, and $1.1 million in 2010, 2009, and 2008, respectively.
6. Goodwill and Other Intangibles
Goodwill consists of the following:
| As of December 31, | ||||||||
| 2010 | 2009 | |||||||
| (in thousands) | ||||||||
| Balance at beginning of year |
$ | 11,022 | $ | 11,022 | ||||
| Additions for acquisitions |
895 | — | ||||||
| Balance at end of year |
$ | 11,917 | $ | 11,022 | ||||
F-19
Table of Contents
Other intangibles consist of the following:
| 2010 | 2009 | |||||||||||||||||||||||
| Gross Carrying Value |
Accumulated Amortization |
Net Carrying Value of Intangible Assets |
Gross Carrying Value |
Accumulated Amortization |
Net Carrying Value of Intangible Assets |
|||||||||||||||||||
| (in thousands) | ||||||||||||||||||||||||
| Patents |
$ | 3,761 | $ | 1,529 | $ | 2,232 | $ | 2,251 | $ | 1,044 | $ | 1,207 | ||||||||||||
| Trademarks and technology licenses |
1,271 | 735 | 536 | 1,301 | 636 | 665 | ||||||||||||||||||
| Customer relationships |
1,662 | 848 | 814 | 1,738 | 478 | 1,260 | ||||||||||||||||||
| Other intangible assets |
312 | 208 | 104 | 303 | 119 | 184 | ||||||||||||||||||
| Total identifiable intangible assets |
$ | 7,006 | $ | 3,320 | $ | 3,686 | $ | 5,593 | $ | 2,277 | $ | 3,316 | ||||||||||||
These assets are being amortized over useful lives ranging from 2 to 15 years. The weighted-average amortization period for these intangibles as of December 31, 2010, is 5.7 years. Amortization expense amounted to $0.7 million, $0.6 million, and $0.5 million in 2010, 2009, and 2008, respectively. Amortization expense is included in general and administrative expense.
Estimated amortization expense for each of the five succeeding fiscal years, based upon the intangible assets at December 31, 2010, is as follows:
| (in thousands) | ||||
| 2011 |
$ | 848 | ||
| 2012 |
808 | |||
| 2013 |
737 | |||
| 2014 |
523 | |||
| 2015 |
323 | |||
7. Financing Arrangements
We terminated our revolving line of credit with Brown Brothers Harriman & Co. effective as of August 23, 2010. Our borrowing capacity under this facility was $10 million and the maximum principal amount of any letters of credit issued as part of this facility was $3 million. Loans made under this revolving line of credit bore interest at the bank’s base rate or LIBOR plus 200 basis points, at our discretion, and were collateralized by substantially all of our assets. The loan agreement required that we meet certain financial and operating covenants including a required leverage ratio and minimum tangible net worth. As of August 23, 2010 and December 31, 2009, we had no borrowings outstanding under this credit facility and were in compliance with these covenants.
As part of the purchase of Biomateriali S.r.l, we assumed a loan from the Italian government under a program that provides funding to certain businesses in Italy through a combination of grants and loans if certain requirements are met. The loan was stated to be payable in ten annual payments through 2018 of principal and interest at an interest rate of 0.74%. The present value of the loan was recorded as of the date the proceeds were received using our incremental borrowing rate. Interest was being imputed on the loan and the amortization was recorded as interest expense. In March 2011, the Italian government informed us that the loan and grants will become due in full as a result of the Biomateriali S.r.l plant closure. We expect to repay the previous grants received, the imputed interest on the outstanding loan balance, and certain additional interest and penalties of approximately $0.3 million, which has been recorded as restructuring expense for the year ended December 31, 2010. The outstanding amount of the accelerated loan and grant repayment was approximately $0.4 million as of December 31, 2010 and has been recorded in our balance sheet in accrued expenses. We expect that this matter will be settled in 2011.
F-20
Table of Contents
8. Accrued Expenses
Accrued expenses consist of the following:
| As of December 31, | ||||||||
| 2010 | 2009 | |||||||
| (in thousands) | ||||||||
| Compensation and related taxes |
$ | 4,116 | $ | 3,273 | ||||
| Income and other taxes |
802 | 421 | ||||||
| Factory build-out costs |
791 | — | ||||||
| Restructuring |
922 | — | ||||||
| Professional fees |
441 | 348 | ||||||
| Other |
1,556 | 1,370 | ||||||
| Total |
$ | 8,628 | $ | 5,412 | ||||
9. Commitments and Contingencies
Leases
We conduct certain of our operations in leased facilities, which are accounted for as operating leases. Certain leases include renewal options. Rent expense was $1.1 million in 2010, $1.3 million in 2009, and $1.5 million in 2008. In addition, we lease automobiles and equipment under operating leases. There were no assets held under capital leases at December 31, 2010 and 2009.
At December 31, 2010, the minimum rental commitments under all non-cancelable operating leases with initial or remaining terms of more than one year, for each of the following fiscal years, are as follows:
| Operating Leases |
||||
| (in thousands) | ||||
| 2011 |
$ | 1,307 | ||
| 2012 |
1,015 | |||
| 2013 |
850 | |||
| 2014 |
743 | |||
| 2015 |
739 | |||
On March 23, 2010, we extended our lease of our manufacturing facility in Burlington, Massachusetts through 2017. Additionally, we entered into a lease for an additional 17,617 square feet in an adjacent facility in Burlington, Massachusetts through 2017 while terminating the lease to our Burlington storage facility.
Purchase Commitments
As part of our normal course of business, we have purchase commitments to purchase $14.1 million of inventory through 2015. The purchase commitments for inventory are to be used in operations over the normal course of business and do not represent excess commitments or loss contracts.
Other Commitments
In 2007, we purchased certain patent applications and in-process research and development which included earn-out payments associated with the commercialization of The UnBalloon Non-Occlusive Modeling Catheter in the European Union and the United States as part of the consideration. The earn-out payments are payable quarterly at approximately the rate of two times sales for the four quarters. The European earn-out period was
F-21
Table of Contents
measured from December 23, 2009 through December 22, 2010. We recorded an intangible asset of approximately $27,000. The United States earn-out period will be measured for four quarters following the first commercial sale in the United States. We consider the earn-out payments associated with the commercialization of the products in Europe and the United States to be contingent consideration that will be recorded as additional intangible assets in the periods that the contingency is resolved.
We have deferred payments related to our November 2010 acquisition of the LifeSpan Vascular Graft (as discussed in Note 3) of approximately $0.2 million payable to Edwards in February 2011 and approximately $0.3 million payable to Angiotech in November 2011. The deferred payments have been included in Acquisition-related obligations in the December 31, 2010 balance sheet.
On December 28, 2010, we agreed with our Spanish distributor to terminate our relationship effective July 1, 2011. Our distributor will provide transition services from January 1, 2011 through June 30, 2011. We will acquire customer relationships, a non-compete agreement, and inventory from our Spanish distributor upon the transition. We will pay our distributor $0.9 million in 2011 under the terms of this agreement. Additionally, we have entered into a one-year consulting agreement beginning July 1, 2011 with an employee of our distributor for $0.2 million. Pursuant to this agreement, the assets are to be transferred and services are to be performed commencing in 2011, and as such we have not accrued the associated liabilities as of December 31, 2010.
On December 27, 2010, we agreed with our Danish distributor to terminate our relationship effective July 1, 2011. Our distributor will provide transition services from January 1, 2011 through June 30, 2011. We will acquire customer relationships, a non-compete agreement, and inventory from our Danish distributor upon the transition. We will pay our distributor $0.2 million in 2011 under the terms of this agreement. Pursuant to this agreement, the assets are to be transferred and services are to be performed commencing in 2011, and as such we have not accrued the associated liabilities as of December 31, 2010.
10. Income Taxes
Income (loss) before income taxes is as follows:
| Year ended December 31, | ||||||||||||
| 2010 | 2009 | 2008 | ||||||||||
| (in thousands) | ||||||||||||
| United States |
$ | 7,171 | $ | 5,127 | $ | 78 | ||||||
| Foreign |
(3,146 | ) | (2,912 | ) | (2,899 | ) | ||||||
| Total |
$ | 4,025 | $ | 2,215 | $ | (2,821 | ) | |||||
Certain of our foreign subsidiaries are included in the U.S. tax return as branches but are included as foreign for purposes of the table above.
The provision (benefit) for income taxes is as follows:
| Year ended December 31, | ||||||||||||
| 2010 | 2009 | 2008 | ||||||||||
| (in thousands) | ||||||||||||
| Current: |
||||||||||||
| Federal |
$ | 147 | $ | 133 | $ | 17 | ||||||
| State |
60 | 5 | 25 | |||||||||
| Foreign |
185 | 253 | 202 | |||||||||
| 392 | 391 | 244 | ||||||||||
| Deferred: |
||||||||||||
| Federal |
(2,105 | ) | 260 | 262 | ||||||||
| State |
(257 | ) | 22 | 9 | ||||||||
| Foreign |
(18 | ) | (56 | ) | (22 | ) | ||||||
| (2,380 | ) | 226 | 249 | |||||||||
| Provision (benefit) for income taxes |
$ | (1,988 | ) | $ | 617 | $ | 493 | |||||
F-22
Table of Contents
We have reviewed the tax positions taken, or to be taken, in our tax returns for all tax years currently open to examination by a taxing authority. As of December 31, 2010, the gross amount of unrecognized tax benefits exclusive of interest and penalties was $277,000. As a result of an indirect benefit from the IRC Section 199 deduction, the unrecognized tax benefits were reduced by $22,000. We have identified no uncertain tax positions for which it is reasonably possible that the total amount of unrecognized tax benefits will significantly increase or decrease within the 12 months ending December 31, 2011. We remain subject to examination until the statute of limitations expires for each respective tax jurisdiction. The Federal statute of limitations will be open with respect to these tax positions until 2014. A reconciliation of beginning and ending amount of our unrecognized tax benefits is as follows:
| 2010 | 2009 | 2008 | ||||||||||
| (in thousands) | ||||||||||||
| Unrecognized tax benefits at the beginning of year |
$ | 299 | $ | 299 | $ | 170 | ||||||
| Increases in unrecognized tax benefits as a result of tax positions taken during the period |
— | — | 129 | |||||||||
| Amount of decreases in the unrecognized tax benefits relating to an indirect IRC Section 199 benefit |
(22 | ) | — | — | ||||||||
| Unrecognized tax benefits at the end of the year |
$ | 277 | $ | 299 | $ | 299 | ||||||
Deferred taxes are attributable to the following temporary differences:
| As of December 31, | ||||||||
| 2010 | 2009 | |||||||
| (in thousands) | ||||||||
| Deferred tax assets: |
||||||||
| Inventory |
$ | 418 | $ | 563 | ||||
| Net operating loss carryforward |
3,830 | 3,238 | ||||||
| Tax credit carryforward |
822 | 891 | ||||||
| Reserves and accruals |
231 | 159 | ||||||
| Property and equipment |
33 | 79 | ||||||
| Intangible assets |
1,236 | 1,291 | ||||||
| Other |
400 | 347 | ||||||
| Total deferred tax assets |
6,970 | 6,568 | ||||||
| Deferred tax liabilities: |
||||||||
| Other intangibles |
(63 | ) | 0 | |||||
| Goodwill |
(1,760 | ) | (1,608 | ) | ||||
| Total deferred tax liabilities |
(1,823 | ) | (1,608 | ) | ||||
| Net deferred tax assets before valuation allowance |
5,147 | 4,960 | ||||||
| Valuation allowance |
(4,309 | ) | (6,510 | ) | ||||
| Net deferred tax asset (liability) |
$ | 838 | $ | (1,550 | ) | |||
| Deferred tax classification |
||||||||
| Short-term deferred tax asset |
$ | 1,205 | $ | — | ||||
| Short-term deferred tax liability |
(58 | ) | (4 | ) | ||||
| Net short-term deferred tax asset (liability) |
1,147 | (4 | ) | |||||
| Long-term deferred tax asset |
134 | — | ||||||
| Long-term deferred tax liability |
(443 | ) | (1,546 | ) | ||||
| Net long-term deferred tax asset (liability) |
(309 | ) | (1,546 | ) | ||||
| Net deferred tax asset (liability) |
$ | 838 | $ | (1,550 | ) | |||
F-23
Table of Contents
We have assessed the need for a valuation allowance against our deferred tax assets and concluded that we emerged from a cumulative loss position in the fourth quarter of 2010 in the United States. As a result we have released $3.3 million of our valuation allowance that was previously set up against certain U.S. deferred tax assets which based on the weight of available evidence; we believe it is more likely than not such assets will be realized. We continue to carry a valuation allowance against $4.3 million of state credits and foreign deferred tax assets; based on the weight of available evidence, we believe it is more likely than not such assets will not be realized. The valuation allowance against our deferred tax assets may require adjustment in the future based on changes in the mix of temporary differences, changes in tax laws, and operating performance.
As of December 31, 2010, we are no longer in a cumulative net operating loss position in the United States, measured over a three year period. In 2010, we used $1.4 million of net operating loss carryforwards that were available to offset our taxable income in the United States and as a result, have no remaining net operating loss carryforwards in the United States as of December 31, 2010. We have state net operating loss carryforwards of $0.7 million that expire at various times through 2029. In addition, we have net operating loss carryforwards in France of $2.7 million that have no expiration, Japan of $1.3 million that begin to expire in 2013 and Italy of $7.6 million of which $0.6 million does not expire and $7.0 million begin to expire in 2013. We also have federal research and development tax credit carryforwards of approximately $0.5 million and state tax credit carryforwards of approximately $0.5 million that are available to reduce future tax liabilities, which expire at various dates through 2030, or can be carried forward indefinitely. Included in the research and development credit carryforwards are stock option deductions of approximately $0.5 million. The benefit of these tax deductions will be credited to additional paid-in capital upon we receive a cash benefit from the stock options being utilized. Ownership changes, as defined by the Internal Revenue Code, may limit the amount of net operating losses and research and experimentation credit carryforwards that can be utilized annually to offset future taxable income and taxes payable.
A reconciliation of the federal statutory rate to our effective tax rate is as follows:
| 2010 | 2009 | 2008 | ||||||||||
| Federal statutory rate |
34.0 | % | 34.0 | % | 34.0 | % | ||||||
| State tax, net of federal benefit |
1.8 | % | 1.2 | % | (0.3 | %) | ||||||
| Effect of foreign taxes |
(0.8 | %) | 2.3 | % | 1.8 | % | ||||||
| Valuation allowance |
(87.7 | %) | (20.1 | %) | (49.3 | %) | ||||||
| Permanent differences |
6.4 | % | 9.3 | % | (2.6 | %) | ||||||
| Other |
(3.1 | %) | 1.2 | % | (1.1 | %) | ||||||
| Effective tax rate |
(49.4 | %) | 27.9 | % | (17.5 | %) | ||||||
We are not currently under audit in any tax jurisdictions. As of December 31, 2010, a summary of the tax years that remain subject to examination in our most significant tax jurisdictions are:
| United States—Federal |
2007 and forward | |||
| Germany |
2007 and forward | |||
| Italy |
2006 and forward | |||
| Japan |
2004 and forward |
11. Stockholders’ Equity
Stock Award Plans
Under our 1997, 1998, 2000, and 2004 stock option plans, we authorized for the granting of options in the form of incentive stock options or nonqualified options to employees, directors, and consultants to purchase up to 1,688,702 shares of common stock. The stock options provide the holder the right to purchase common stock at a specific exercise price and the expected term will not exceed ten years. Incentive stock options are required to be
F-24
Table of Contents
issued at not less than fair market value at the date of the grant and generally vest over four or five years. The term of the options is determined by our Board of Directors but in no event will exceed ten years from date of grant, except with respect to one non-qualified option issued under our 1997 stock option plan.
In May 2006 we approved a 2006 Stock Option and Incentive Plan (the 2006 Plan), which became effective upon the initial public offering. In June 2009 we amended the 2006 Plan to increase the aggregate pool of available shares from 750,000 to 1,500,000 of common stock, and in June 2010 we further amended the 2006 Plan to increase the aggregate pool of available shares from 1,500,000 to 3,000,000 of common stock. The plan allows for granting of incentive stock options, non-qualified stock options, stock appreciation rights, RSUs, unrestricted stock awards, and deferred stock awards to our officers, employees, directors, and consultants. In connection with the adoption of the 2006 Plan, no further option grants are permitted under the 1997, 1998, 2000, and 2004 stock option plans and any expirations, cancellations, or terminations under the previous plans are available for issuance under the 2006 Plan. We may satisfy awards upon exercise of stock options or RSUs with either newly issued or treasury shares. The total number of shares currently authorized for stock award plans is 4,618,003 of which approximately 1,364,149 remain available for grant as of December 31, 2010.
We have computed the fair value of employee stock options using the following weighted average assumptions:
| 2010 | 2009 | 2008 | ||||||||||
| Dividend yield |
0.0 | % | 0.0 | % | 0.0 | % | ||||||
| Volatility |
72.1 | % | 80.5 | % | 52.1 | % | ||||||
| Risk-free interest rate |
1.6 | % | 2.2 | % | 3.2 | % | ||||||
| Weighted average expected option term (in years) |
4.8 | 4.5 | 4.7 | |||||||||
| Weighted average fair value per share of options granted |
$ | 3.43 | $ | 1.88 | $ | 1.59 | ||||||
| Aggregate intrinsic value of options exercised |
$ | 343,185 | $ | 67,951 | $ | 155,054 | ||||||
A summary of option activity as of December 31, 2010 and the year then ended is presented below:
| Number of Shares |
Weighted Average Exercise Price |
Weighted Average Remaining Contractual Term |
Aggregate Intrinsic Value |
|||||||||||||
| (in years) | ||||||||||||||||
| Balance outstanding at December 31, 2009 |
1,722,610 | $ | 5.09 | 6.80 | $ | 2,697,509 | ||||||||||
| Granted(1) |
269,374 | $ | 5.86 | $ | — | |||||||||||
| Exercised(2) |
(73,497 | ) | $ | 1.79 | $ | 343,185 | ||||||||||
| Forfeited |
(15,551 | ) | $ | 5.40 | $ | — | ||||||||||
| Balance outstanding at December 31, 2010(3) |
1,902,936 | $ | 5.32 | 5.77 | $ | 4,444,950 | ||||||||||
| Vested and exercisable at December 31, 2010 |
1,159,688 | $ | 6.00 | 6.17 | $ | 2,567,136 | ||||||||||
| Expected to vest at December 31, 2010(4) |
624,150 | $ | 4.28 | 2.44 | — | |||||||||||
| Total |
1,783,838 | $ | 2,567,136 | |||||||||||||
| (1) | The aggregate intrinsic value represents the difference between the exercise price and the closing price of our stock on the day of grant. |
| (2) | The aggregate intrinsic value represents the difference between the exercise price and the closing price of our stock on the day of exercise. |
| (3) | The aggregate intrinsic value represents the difference between the exercise price and $6.77, the closing price of our stock on December 31, 2010, for all in-the-money options outstanding. |
| (4) | Options outstanding that are expected to vest are net of estimated future option forfeitures in accordance with the provisions set forth by the FASB. |
F-25
Table of Contents
Information about stock options outstanding and exercisable as of December 31, 2010, is as follows:
| Options Outstanding | Options Exercisable | |||||||||||||||||||
| Range of Exercise Prices |
Outstanding as of December 31, 2010 |
Weighted Average Remaining Contractual Life |
Weighted Average Exercise Price |
Shares | Weighted Average Exercise Price |
|||||||||||||||
| $ 0.00 – $ 1.50 |
246,245 | 16.42 | $ | 0.10 | 246,245 | $ | 0.10 | |||||||||||||
| $ 1.51 – $ 3.00 |
254,154 | 5.27 | $ | 3.00 | 55,220 | $ | 3.00 | |||||||||||||
| $ 3.01 – $ 4.50 |
440,959 | 3.91 | $ | 3.34 | 189,916 | $ | 3.37 | |||||||||||||
| $ 4.50 – $ 6.00 |
322,016 | 5.50 | $ | 5.84 | 59,048 | $ | 5.95 | |||||||||||||
| $ 6.01 – $ 7.50 |
203,757 | 2.17 | $ | 7.01 | 177,833 | $ | 7.10 | |||||||||||||
| $ 7.51 – $ 9.00 |
150,627 | 2.65 | $ | 8.26 | 150,627 | $ | 8.26 | |||||||||||||
| $ 9.00 – $10.50 |
37,115 | 4.07 | $ | 10.45 | 37,115 | $ | 10.45 | |||||||||||||
| $10.51 – $12.37 |
248,063 | 4.44 | $ | 11.82 | 243,684 | $ | 11.81 | |||||||||||||
| 1,902,936 | 5.77 | $ | 5.32 | 1,159,688 | $ | 6.00 | ||||||||||||||
We account for stock options issued to non-employees using the fair value method. We compute the fair value of non-employee stock options using the Black-Scholes option-pricing model using an appropriate volatility factor and record the fair value of non-employee stock options as expense over either the vesting term of the option or the service period with the following assumptions:
| 2008 | ||||
| Dividend yield |
0.0 | % | ||
| Volatility |
57.0 | % | ||
| Risk-free interest rate |
3.5 | % | ||
| Weighted average expected option term (in years) |
2.0 | |||
We recorded approximately ($8,000) during 2008 of compensation (credits) expense related to stock options granted to non-employees. There were no unvested options held by non-employees in 2010 and 2009.
Restricted Stock Units
During the year ended December 31, 2010, we repurchased 48,450 shares of our common stock at a per-share price of $5.59 and an aggregate purchase price of approximately $271,000 in order to cover any minimum tax withholding liability. During the year ended December 31, 2009, we repurchased 43,281 shares of our common stock at a per-share price of $3.80 and an aggregate purchase price of approximately $165,000 in order to cover any minimum tax withholding liability.
A summary of our RSU activity, which is subject to fair value accounting requirements, is as follows:
| Shares | Weighted Average Grant Date Fair Value |
|||||||
| Balance outstanding at December 31, 2009 |
547,533 | $ | 3.60 | |||||
| Granted |
117,486 | $ | 5.81 | |||||
| Vested(1) |
(132,085 | ) | $ | 3.76 | ||||
| Canceled |
(55,412 | ) | $ | 3.84 | ||||
| Balance outstanding at December 31, 2010 |
477,522 | $ | 4.07 | |||||
| (1) | The number of RSUs vested includes the shares that we withheld on behalf of employees to satisfy minimum statutory tax withholding requirements. |
F-26
Table of Contents
The fair values of the RSUs that vested during 2010, 2009, and 2008 were $0.5 million, $0.6 million, and $0.4 million, respectively.
Stock-based Compensation
The components of stock-based compensation expense included in the consolidated statements of operations are as follows:
| 2010 | 2009 | 2008 | ||||||||||
| (in thousands) | ||||||||||||
| Stock option awards to employees |
$ | 436 | $ | 300 | $ | 310 | ||||||
| Restricted common stock awards |
531 | 685 | 499 | |||||||||
| Stock option awards to non-employees |
— | — | (8 | ) | ||||||||
| Total stock-based compensation |
$ | 967 | $ | 985 | $ | 801 | ||||||
We expect to record the unamortized portion of share-based compensation expense of $2.3 million for existing stock options and RSUs outstanding at December 31, 2010, over a weighted-average period of 3.3 years.
Stock Repurchase Plan
In July 2009, our Board of Directors authorized the repurchase of up to $1.0 million of our common stock from time to time on the open market or in privately negotiated transactions. In October 2009, our Board of Directors increased this amount to $2.0 million, and in July 2010, our Board of Directors further increased this amount to $5.0 million. The timing and number of any shares repurchased will be determined based on our evaluation of market conditions and other factors. Repurchases may also be made under a Rule 10b5-1 plan, which would permit shares to be repurchased when we might otherwise be precluded from doing so under insider trading laws. The repurchase program may be suspended or discontinued at any time and will conclude no later than December 31, 2011, unless otherwise extended by our Board of Directors. The repurchase program is being funded using our available cash and cash equivalents. We repurchased 378,528 shares for $2.2 million in the year ended December 31, 2010. We repurchased 117,373 shares for $0.5 million in the year ended December 31, 2009. We had the authority to purchase up to an additional $2.2 million of common stock under the repurchase program as of December 31, 2010.
Employee Stock Purchase Plan
On July 13, 2009, our Board of Directors elected to terminate our Employee Stock Purchase Plan effective following the six-month offering period ending July 31, 2009. Our employee stock purchase plan had enabled eligible employees to purchase shares of our common stock. Eligible employees could purchase shares during six-month offering periods commencing on February 1 and August 1 of each year at a price per share equal to 90 percent of the fair market value of our common stock on the last date of each six-month offering period. Participating employees could elect to have up to ten percent of their base pay withheld and applied toward the purchase of such shares. The rights of participating employees terminate upon voluntary withdrawal from the plan at any time or upon termination of employment. On February 1, 2009, 10,698 shares were purchased at a purchase price of $1.91 per share. On July 31, 2009, 7,680 shares were purchased at a purchase price of $3.11 per share.
12. Profit-Sharing Plan
We offer a 401(k) profit-sharing plan (the Plan) covering eligible U.S. employees to make tax deferred contributions, a portion of which are matched by us. We may make discretionary profit sharing contributions to the Plan in an amount determined by our Board of Directors. Our contributions vest ratably over six years of employment and amounted to approximately $0.2 million for 2010, $0.1 million for 2009, and $0.2 million for 2008. Effective April 1, 2011, we ceased our discretionary matching on employee contributions.
F-27
Table of Contents
13. Restructuring Charges
In 2008, we initiated reductions in force of 32 and eight employees in the first and third quarters, respectively. We incurred $0.4 million of severance charges related to the reductions in force in 2008, of which $0.1 million was paid in February 2009. No further costs are expected to be incurred with respect to these reductions in force.
In March 2009, we incurred $1.8 million of restructuring charges, related to the termination of our Biomateriali subsidiary’s distribution agreement with Edward Lifesciences as discussed in Note 3.
In October 2010, we adopted a reorganization plan (the Plan) that is designed to eliminate redundant costs resulting from our 2007 acquisition of Biomateriali and to improve efficiencies in manufacturing operations. We intend to transition the production of our AlboGraft Vascular Graft to our existing corporate headquarters in Burlington, Massachusetts. The Plan provides for the termination of employees, relocation of manufacturing equipment, the eventual dissolution of our Biomateriali subsidiary, and the hiring of approximately 15 employees to staff the required functions in Burlington. In connection with the termination of the 29 employees of our Biomaterial subsidiary, we incurred $1.8 million of restructuring charges, of which $0.9 million was paid in December 2010. We paid $0.3 million of the severance charges in January 2011 and will pay the remaining $0.9 million of severance and loan charges in 2011. As discussed in Note 7, we incurred $0.3 million of charges related to the repayment of grants and loans received from the Italian government associated with business incentive programs for the Biomateriali facility. In addition, we incurred $0.1 million of charges related to the abandonment of fixed assets and legal fees associated with the negotiation of the severance agreements. We expect to exit the Biomateriali facility by March 31, 2011. We expect to incur approximately $1.2 million of additional restructuring charges, of which $0.7 million will be non-cash, related to the closure and transfer of this facility in 2011. We expect the liquidation and dissolution process to be completed by mid-2012.
The components of the restructuring charges are as follows:
| Year ended December 31, | ||||||||||||
| 2010 | 2009 | 2008 | ||||||||||
| (in thousands) | ||||||||||||
| Distributor termination costs |
$ | — | $ | 1,777 | $ | 712 | ||||||
| Employee severance costs |
1,431 | — | 435 | |||||||||
| Italian government loan and grant termination charge |
250 | — | — | |||||||||
| Other |
135 | — | — | |||||||||
| Total |
$ | 1,816 | $ | 1,777 | $ | 1,147 | ||||||
Activity related to accrued restructuring costs is as follows:
| Year ended December 31, | ||||||||||||
| 2010 | 2009 | 2008 | ||||||||||
| (in thousands) | ||||||||||||
| Balance at beginning of year |
$ | — | $ | 83 | $ | 1,129 | ||||||
| Plus: |
||||||||||||
| Current year restructuring costs |
1,816 | 1,777 | 1,147 | |||||||||
| Other |
155 | — | 22 | |||||||||
| Less: |
||||||||||||
| Payments for termination of contractual obligations |
— | 1,777 | 1,862 | |||||||||
| Payment of employee severance costs |
941 | 83 | 353 | |||||||||
| Non-cash fixed asset write-off |
108 | — | — | |||||||||
| Balance at end of year |
$ | 922 | $ | — | $ | 83 | ||||||
F-28
Table of Contents
14. Segment and Enterprise-wide Disclosures
The FASB establishes standards for reporting information regarding operating segments in annual financial statements. Operating segments are identified as components of an enterprise about which separate, discrete financial information is available for evaluation by the chief operating decision-maker in making decisions on how to allocate resources and assess performance. We view our operations and manage our business as one operating segment. No discrete operating information other than product sales is prepared by us, except by geographic location, for local reporting purposes.
We sell products in three product categories; Vascular, Endovascular, and General Surgery, and have also derived a limited amount of revenue from manufacturing devices under private label manufacturing arrangements. Net sales in these product categories were as follows:
| Year ended December 31, | ||||||||||||
| 2010 | 2009 | 2008 | ||||||||||
| (in thousands) | ||||||||||||
| Vascular |
$ | 40,022 | $ | 34,265 | $ | 31,316 | ||||||
| Endovascular |
12,040 | 12,363 | 13,203 | |||||||||
| General Surgery |
3,882 | 3,836 | 3,928 | |||||||||
| Branded product sales |
55,944 | 50,464 | 48,447 | |||||||||
| OEM |
116 | 444 | 273 | |||||||||
| Net sales |
$ | 56,060 | $ | 50,908 | $ | 48,720 | ||||||
Most of our revenues were generated in the United States, Europe, and Japan, and substantially all of our assets are located in the United States. We analyze our sales using a number of approaches, including sales by legal entity. LeMaitre Vascular GmbH, our German subsidiary, records all sales in Europe and to distributors worldwide, excluding sales in France (LeMaitre Vascular SAS); Italy (LeMaitre Vascular S.r.l.); Japan, Korea, and Taiwan (LeMaitre Vascular GK); and private label manufacturing sales (Biomateriali S.r.l.). Net sales to unaffiliated customers by legal entity were as follows:
| Year ended December 31, | ||||||||||||
| 2010 | 2009 | 2008 | ||||||||||
| (in thousands) | ||||||||||||
| LeMaitre Vascular, Inc. |
$ | 34,575 | $ | 29,420 | $ | 26,899 | ||||||
| LeMaitre Vascular GmbH |
15,382 | 15,802 | 16,356 | |||||||||
| Other |
6,103 | 5,686 | 5,465 | |||||||||
| Net sales |
$ | 56,060 | $ | 50,908 | $ | 48,720 | ||||||
Total property and equipment held by legal entity were as follows:
| As of December 31, | ||||||||
| 2010 | 2009 | |||||||
| (in thousands) | ||||||||
| LeMaitre Vascular, Inc. |
$ | 3,188 | $ | 1,254 | ||||
| LeMaitre Vascular GmbH |
268 | 324 | ||||||
| Other |
350 | 523 | ||||||
| Total property and equipment |
$ | 3,806 | $ | 2,101 | ||||
F-29
Table of Contents
15. Supplemental Cash Flow Information
Supplemental disclosures of cash flow information are as follows:
| Year ended December 31, | ||||||||||||
| 2010 | 2009 | 2008 | ||||||||||
| (in thousands) | ||||||||||||
| Cash paid (refund) for income taxes, net |
$ | 835 | $ | 431 | $ | (298 | ) | |||||
| Supplemental non-cash financing activities: |
||||||||||||
| Acquisition-related obligations to sellers |
— | — | 77 | |||||||||
| Common stock repurchased for RSU tax withholdings |
271 | 165 | 67 | |||||||||
16. Fair Value Measurements
The fair value accounting guidance requires that assets and liabilities carried at fair value be classified and disclosed in one of the following three categories:
| • | Level 1—Quoted prices in active markets for identical assets or liabilities. |
| • | Level 2—Observable inputs other than quoted prices included in Level 1, such as quoted prices for similar assets and liabilities in active markets; quoted prices for identical or similar assets and liabilities in markets that are not active; or other inputs that are observable or can be corroborated by observable market data. |
| • | Level 3—Unobservable inputs that are supported by little or no market activity and that are significant to the fair value of the assets or liabilities. This includes certain pricing models, discounted cash flow methodologies and similar techniques that use significant unobservable inputs. |
As of December 31, 2010, we had cash equivalents in repurchase agreements and U.S. treasury notes that were valued using Level 1 inputs (quoted market prices for identical assets) as follows:
| Repurchase agreements |
$ | 9,600 | ||
| US Treasury Notes |
9,498 | |||
| $ | 19,098 | |||
We had no Level 2 or Level 3 assets being measured at fair value on a recurring basis as of December 31, 2010.
17. Quarterly Financial Data (unaudited)
| Three months ended | ||||||||||||||||
| 2010 |
March 31 | June 30 | September 30 | December 31 | ||||||||||||
| (in thousands, except per share data) | ||||||||||||||||
| Total net sales |
$ | 13,815 | $ | 14,158 | $ | 13,656 | $ | 14,431 | ||||||||
| Gross profit |
10,318 | 10,656 | 10,398 | 10,347 | ||||||||||||
| Income (loss) from operations |
1,270 | 2,008 | 2,032 | (1,295 | ) | |||||||||||
| Net income |
1,021 | 1,511 | 1,517 | 1,964 | ||||||||||||
| Net income available to common stockholders: |
||||||||||||||||
| Basic |
$ | 0.07 | $ | 0.10 | $ | 0.10 | $ | 0.13 | ||||||||
| Diluted |
$ | 0.06 | $ | 0.09 | $ | 0.09 | $ | 0.12 | ||||||||
F-30
Table of Contents
| Three months ended | ||||||||||||||||
| 2009 |
March 31 | June 30 | September 30 | December 31 | ||||||||||||
| (in thousands, except per share data) | ||||||||||||||||
| Total net sales |
$ | 11,348 | $ | 12,630 | $ | 13,346 | $ | 13,584 | ||||||||
| Gross profit |
8,266 | 9,122 | 9,743 | 10,173 | ||||||||||||
| Income (loss) from operations |
(1,566 | ) | 993 | 1,293 | 1,229 | |||||||||||
| Net income (loss) |
(1,881 | ) | 925 | 1,285 | 1,269 | |||||||||||
| Net income (loss) available to common stockholders: |
||||||||||||||||
| Basic |
$ | (0.12 | ) | $ | 0.06 | $ | 0.08 | $ | 0.08 | |||||||
| Diluted |
$ | (0.12 | ) | $ | 0.06 | $ | 0.08 | $ | 0.08 | |||||||
18. Subsequent Event
On February 28, 2011, our Board of Directors approved a policy for the payment of regular quarterly cash dividends on our common stock of $0.02 per share. The first quarterly dividend is payable on April 5, 2011, to stockholders of record at the close of business on March 22, 2011 and will be approximately $0.3 million. Future declarations of quarterly dividends and the establishment of future record and payment dates are subject to the final determination of our Board of Directors on a quarterly basis.
F-31
Table of Contents
EXHIBIT INDEX
| Exhibit |
Exhibit Description |
Incorporated By Reference | ||||||||||||||
| Form | Date | Number | Filed Herewith |
|||||||||||||
| 3.1 | Amended and Restated By-laws of the Registrant | S-1/A | 5/26/06 | 3.1 | ||||||||||||
| 3.2 | Second Amended and Restated Certificate of Incorporation of the Registrant | 10-K | 3/29/10 | 3.2 | ||||||||||||
| 4.1 | Specimen Certificate evidencing shares of common stock | S-1/A | 6/22/06 | 4.1 | ||||||||||||
| 10.1 | Northwest Park Lease dated March 31, 2003, by and between the Registrant and Roger P. Nordblom and Peter C. Nordblom, as Trustees of Northwest Associates, as amended | S-1 | 4/25/06 | 10.1 | ||||||||||||
| 10.2 | Registration Rights Agreement dated June 17, 1998, by and between the Registrant and Housatonic Equity Investors, L.P. | S-1/A | 5/26/06 | 10.2 | ||||||||||||
| 10.3 | Patent Sublicense Agreement dated March 7, 2003, by and between IMPRA, Inc. and Endomed, Inc. | S-1 | 4/25/06 | 10.3 | ||||||||||||
| 10.4 | Confirmation and Agreement dated February 2, 2005, by and between the Registrant and Bard Peripheral Vascular, Inc. | S-1 | 4/25/06 | 10.4 | ||||||||||||
| 10.5 | License Agreement dated February 11, 1992, by and between United States Surgical Corporation and Spinnaker R&D Associates, as amended | S-1 | 4/25/06 | 10.5 | ||||||||||||
| 10.6 | Side Letter Agreement dated January 30, 2004, by and between the Registrant and Spinnaker R&D Associates | S-1 | 4/25/06 | 10.6 | ||||||||||||
| 10.7 | Executive Retention and Severance Agreement dated October 10, 2005, by and between the Registrant and George W. LeMaitre† | S-1/A | 5/26/06 | 10.7 | ||||||||||||
| 10.8 | Managing Director Employment Agreement dated October 1, 2008, by and between LeMaitre Vascular GmbH and Peter Gebauer, as amended† | 10-K | 3/31/09 | 10.8 | ||||||||||||
| 10.9 | Employment Agreement dated June 20, 2006, by and between the Registrant and David Roberts† | S-1/A | 6/22/06 | 10.24 | ||||||||||||
| 10.10 | Employment Agreement dated April 20, 2006, by and between the Registrant and Joseph P. Pellegrino (corrected)† | S-1/A | 6/22/06 | 10.10 | ||||||||||||
| 10.11 | 1997 Stock Option Plan and form of agreements thereunder† | S-1 | 4/25/06 | 10.11 | ||||||||||||
| 10.12 | 1998 Stock Option Plan and form of agreements thereunder† | S-1 | 4/25/06 | 10.12 | ||||||||||||
| 10.13 | 2000 Stock Option Plan and form of agreements thereunder† | S-1 | 4/25/06 | 10.13 | ||||||||||||
| 10.14 | 2004 Stock Option Plan and form of agreements thereunder† | S-1 | 4/25/06 | 10.14 | ||||||||||||
| 10.15 | Second Amended and Restated 2006 Stock Option and Incentive Plan and form of agreements thereunder† | 8-K | 6/18/10 | 10.1 | ||||||||||||
| 10.16 | Form of Indemnification Agreement between the Registrant and its directors and executive officers | S-1/A | 5/26/06 | 10.17 | ||||||||||||
| 10.17 | Form of Restricted Stock Unit Award Agreement under the Registrant’s 2006 Stock Option and Incentive Plan† | 8-K | 12/26/06 | 99.1 | ||||||||||||
| 10.18 | Management Incentive Compensation Plan† | 8-K | 4/27/07 | 10.1 | ||||||||||||
Table of Contents
| Exhibit |
Exhibit Description |
Incorporated By Reference | ||||||||||||||||
| Form | Date | Number | Filed Herewith |
|||||||||||||||
| 10.19 | Second Amendment of Lease dated May 21, 2007, by and between Rodger P. Nordblom and Peter C. Nordblom, as Trustees of Northwest Associates, and Registrant | 8-K | 6/15/07 | 10.1 | ||||||||||||||
| 10.20 | Third Amendment of Lease dated February 26, 2008, by and between Rodger P. Nordblom and Peter C. Nordblom, as Trustees of Northwest Associates, and Registrant | 8-K | 4/10/08 | 10.1 | ||||||||||||||
| 10.21 | Fourth Amendment of Lease dated October 31, 2008, by and between Rodger P. Nordblom and Peter C. Nordblom, as Trustees of Northwest Associates, and Registrant | 10-K | 3/31/09 | 10.36 | ||||||||||||||
| 10.22 | First Amendment to Executive Retention and Severance Agreement dated December 23, 2008, by and between the Registrant and George W. LeMaitre† | 10-K | 3/31/09 | 10.37 | ||||||||||||||
| 10.23 | First Amendment to Employment Agreement dated December 19, 2008, by and between the Registrant and David Roberts† | 10-K | 3/31/09 | 10.38 | ||||||||||||||
| 10.24 | First Amendment to Employment Agreement dated December 19, 2008, by and between the Registrant and Joseph P. Pellegrino† | 10-K | 3/31/09 | 10.39 | ||||||||||||||
| 10.25 | Fifth Amendment of Lease dated March 23, 2010, by and between Rodger P. Nordblom and Peter C. Nordblom, as Trustees of Northwest Associates, and Registrant | 10-K | 3/29/10 | 10.33 | ||||||||||||||
| 10.26 | Northwest Park Lease dated March 23, 2010, by and between Rodger P. Nordblom and Peter C. Nordblom, as Trustees of Northwest Associates, and Registrant | 10-K | 3/29/10 | 10.34 | ||||||||||||||
| 21.1 | List of Subsidiaries | X | ||||||||||||||||
| 23.1 | Consent of Ernst & Young LLP | X | ||||||||||||||||
| 31.1 | Certification of Chief Executive Officer, as required by Rule 13a-14(a) or Rule 15d-14(a) | X | ||||||||||||||||
| 31.2 | Certification of Chief Financial Officer, as required by Rule 13a-14(a) or Rule 15d-14(a) | X | ||||||||||||||||
| 32.1 | Certification of Chief Executive Officer, as required by Rule 13a-14(b) or Rule 15d-14(b) and Section 1350 of Chapter 36 of Title 18 of the United States Code (18 U.S.C. §1350)** | X | ||||||||||||||||
| 32.2 | Certification of Chief Financial Officer, as required by Rule 13a-14(b) or Rule 15d-14(b) and Section 1350 of Chapter 36 of Title 18 of the United States Code (18 U.S.C. §1350)** | X | ||||||||||||||||
| † | Indicates a management contract or any compensatory plan, contract, or arrangement. |
| ** | The certifications attached as Exhibit 32.1 and 32.2 that accompany this Annual Report on Form 10-K, are not deemed filed with the Securities and Exchange Commission and are not to be incorporated by reference into any filing of LeMaitre Vascular, Inc. under the Securities Act of 1933, as amended, or the Securities Exchange Act of 1934, as amended, whether made before or after the date of this Form 10-K, irrespective of any general incorporation language contained in such filing. |