Attached files
| file | filename |
|---|---|
| 8-K - FORM 8-K - DITECH HOLDING Corp | c14729e8vk.htm |
| EX-99.2 - EXHIBIT 99.2 - DITECH HOLDING Corp | c14729exv99w2.htm |
Exhibit 99.1

| Investor Presentation Walter Investment Makes Strategic Acquisition of Leading Business Services Company March 28, 2011 |

| Safe Harbor Statement Certain statements in this release and in any of Walter Investment Management Corp.'s public documents referred to herein, contain or incorporate by reference "forward-looking" statements as defined in Section 27A of the Securities Act of 1933, as amended, and Section 21E of the Securities Exchange Act of 1934, as amended. Walter Investment Management Corp. is including this cautionary statement to make applicable and take advantage of the safe harbor provisions of the Private Securities Litigation Reform Act of 1995. Statements that are not historical fact are forward-looking statements. Words such as "expect," "believe," "anticipate," "project," "estimate," "forecast," "objective," "plan," "goal" and similar expressions, and the opposites of such words and expressions are intended to identify forward-looking statements. Forward-looking statements are based on the Company's current beliefs, intentions and expectations; however, forward-looking statements involve known and unknown risks, uncertainties and other important factors that could cause actual results, performance or achievements, to differ materially from those reflected in the statements made or incorporated in this presentation. Thus, these forward-looking statements are not guarantees of future performance and should not be relied upon as predictions of future events. The risks and uncertainties referred to above include, but are not limited to, the satisfactory completion of all conditions precedent to the closing of the proposed transaction in accordance with the terms and conditions of the purchase agreement, including the receipt of anti-trust and other regulatory and customer approvals; the negotiation, execution and delivery of definitive financing agreements and the satisfaction of all conditions precedent that will be contained therein; the completion of asset sales contemplated by the purchase agreement; the obligation to pay a termination fee under the purchase agreement in certain circumstances if the closing does not occur; anticipated growth of the specialty servicing sector; future economic and business conditions; the effects of competition from a variety of local, regional, national and other mortgage servicers and other risks detailed from time to time in the Company's filings with the Securities and Exchange Commission (the "SEC"), including its Annual Report on Form 10-K for the year ended December 31, 2010 filed with the SEC on March 8, 2011. All forward-looking statements set forth herein are qualified by this cautionary statement and are made only as of March 28, 2011. The Company undertakes no obligation to update or revise the information contained herein, including without limitation, any forward-looking statements, whether as a result of new information, subsequent events or circumstances, or otherwise, unless otherwise required by law. Additional information can be found on the Walter Investment website at www.walterinvestment.com and the Green Tree website at www.greentreecreditservices.com, and in the Company's filings with the SEC. Forward Looking Statements |

| Management Team Brian Libman Chief Strategic Officer Charles Cauthen President & COO of WIMC Kim Perez CFO of WIMC Denmar Dixon Vice Chairman & EVP of WIMC Keith Anderson President & CEO of Green Tree Credit Solutions Cheryl Collins CFO of Green Tree Credit Solutions Mark O'Brien Chairman & CEO of WIMC |

| Green Tree is a premier "asset-light," fee-based business services company providing high-touch, third-party servicing of credit-sensitive consumer loans The two companies are a very solid fit: Similar business models with long, established track records of producing industry leading servicing results Experienced management teams with significant company and industry tenure and similar operating approaches focused on creating shareholder value Ability to leverage platforms and achieve cost and revenue synergies Combination positions Walter to take advantage of attractive sector trends Provides size and scale to compete on a nationwide basis Growing revenues and earnings result in significant long-term value creation for WIMC shareholders Strategic Rationale A leading business services company within a market segment that has very favorable growth prospects + = |

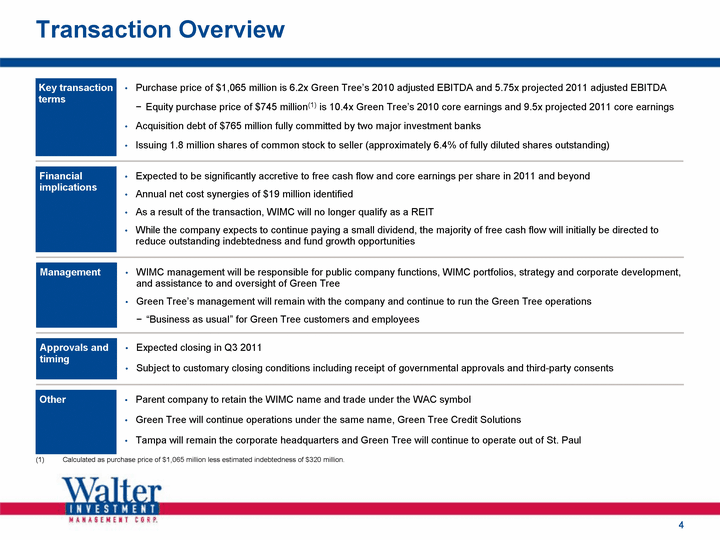
| Transaction Overview Key transaction terms Financial implications Management Approvals and timing Purchase price of $1,065 million is 6.2x Green Tree's 2010 adjusted EBITDA and 5.75x projected 2011 adjusted EBITDA Equity purchase price of $745 million(1) is 10.4x Green Tree's 2010 core earnings and 9.5x projected 2011 core earnings Acquisition debt of $765 million fully committed by two major investment banks Issuing 1.8 million shares of common stock to seller (approximately 6.4% of fully diluted shares outstanding) Expected to be significantly accretive to free cash flow and core earnings per share in 2011 and beyond Annual net cost synergies of $19 million identified As a result of the transaction, WIMC will no longer qualify as a REIT While the company expects to continue paying a small dividend, the majority of free cash flow will initially be directed to reduce outstanding indebtedness and fund growth opportunities WIMC management will be responsible for public company functions, WIMC portfolios, strategy and corporate development, and assistance to and oversight of Green Tree Green Tree's management will remain with the company and continue to run the Green Tree operations "Business as usual" for Green Tree customers and employees Expected closing in Q3 2011 Subject to customary closing conditions including receipt of governmental approvals and third-party consents Other Parent company to retain the WIMC name and trade under the WAC symbol Green Tree will continue operations under the same name, Green Tree Credit Solutions Tampa will remain the corporate headquarters and Green Tree will continue to operate out of St. Paul (1) Calculated as purchase price of $1,065 million less estimated indebtedness of $320 million. |

| Green Tree Overview Business overview Green Tree provides loan servicing to a $37.0 billion portfolio, consisting of over 745,000 loans in a diverse mix of residential mortgages, manufactured housing loans and consumer installment loans. Committed to a differentiated, high-touch servicing approach Utilizes geographically distributed, relationship-based collection methodologies Derives value and earnings through superior servicing performance Green Tree also provides complementary services that generate additional diversified, high-margin, fee-based earnings with negligible credit risk Green Tree's insurance agency services over 200,000 outstanding policies Asset recovery business services 215,000 active notional accounts Investment management business jointly manages a $1.4 billion fund focused on distressed mortgages Recurring, contractual revenues High margins Asset-light business model Minimal credit risk Accelerating Revenue and Adjusted EBITDA Growth Trends Growth: 9.3% Growth: 6.7% (1) Adjusted for VIE assets. New accounting literature (FAS 167) required Green Tree to prospectively consolidate certain variable interest entities beginning January 1, 2010. (1) Growth: 13.5% Growth: 11.9% Revenue ($ in millions) Adjusted EBITDA ($ in millions) |

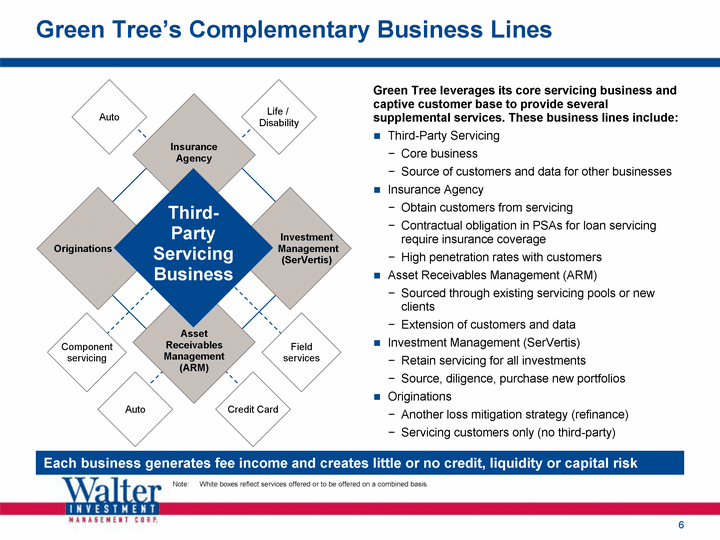
| Green Tree's Complementary Business Lines Green Tree leverages its core servicing business and captive customer base to provide several supplemental services. These business lines include: Third-Party Servicing Core business Source of customers and data for other businesses Insurance Agency Obtain customers from servicing Contractual obligation in PSAs for loan servicing require insurance coverage High penetration rates with customers Asset Receivables Management (ARM) Sourced through existing servicing pools or new clients Extension of customers and data Investment Management (SerVertis) Retain servicing for all investments Source, diligence, purchase new portfolios Originations Another loss mitigation strategy (refinance) Servicing customers only (no third-party) Each business generates fee income and creates little or no credit, liquidity or capital risk Investment Management (SerVertis) Insurance Agency Asset Receivables Management (ARM) Life / Disability Auto Auto Credit Card Component servicing Field services Originations Third- party Servicing Business Third- Party Servicing Business Note: White boxes reflect services offered or to be offered on a combined basis. |

| Insurance agency Commissions earned on voluntary and lender-placed insurance and ancillary income Penetration rate (i.e., number of insurance policies placed with existing base) Ancillary products (auto, warranty, life) Asset receivables management Fee based on percentage of cash collections from charged-off receivable balances Growth of industry-wide charge-offs Ability to enter new asset classes Investment management and third party originations $1.9 billion of UPB purchased since 2008 Base management fee plus performance incentives Fees earned based on origination volume Loan servicing Servicing fee based primarily on percentage of UPB and loan type Ancillary fees such as incentive, late, non-sufficient fund and speed pay fees Diverse Sources of Revenue ($ in millions) Growing Revenue with 60%+ Gross Margins Key revenue drivers (2) (1) Adjusted for VIE assets. New accounting literature (FAS 167) required Green Tree to prospectively consolidate certain variable interest entities beginning January 1, 2010. (2) Includes investment management and third party originations. (1) |

| New Servicing Business Profitability Legacy portfolio consists primarily of securitized manufactured housing loans Manufactured housing portfolio provides consistent profitable base to build from New business revenue as of first quarter 2011 exceeds legacy portfolio on a monthly basis Per loan profitability on new business exceeds legacy portfolio in every measure Profit margins continue to improve as new business grows Driven by increase in incentive and other performance based fees Margins improve with increase in volume and more revenue to cover fixed costs Gross margin (per loan basis) Revenue split 2008 2010 |

| Overview of Sector Trends Sector Trends Green Tree Strategy Aggressive origination and lending standards contributed to economic downturn Delinquencies, foreclosures and losses grew tremendously Traditional servicers couldn't handle increased volume of problem assets Credit risk owners suffered significant losses High level of credit-challenged assets persist Structural changes in servicing industry underway Shift toward specialized servicers Credit risk owners recognize the value of specialized, credit focused servicers There will continue to be high levels of credit sensitive assets in the mortgage market Regulatory environment for servicing will continue to evolve Basel III AG settlement Servicing compensation Client demands increase over "customer experience" The ability to flow assets to special servicers will become easier and the volume of transfers will accelerate Evolved manufactured housing loss mitigation strategies to first and second lien residential market Increased investment in technology Focused on high-touch collections and loss mitigation processes Developed complementary businesses Investment management ARM Building upon relationships with existing blue chip credit risk owners Differentiating performance against other servicers Customizing servicing protocols to meet client specific needs Robust pipeline of prospective business from existing and new clients Continue to drive growth through blue chip credit risk owners Expand capacity across platform Develop capabilities in other high risk mortgage products FHA Delinquency flow servicing Field Services Component servicing Continue to enhance compliance and control environment The Future Today During the Downturn |

| Significant Market Opportunity Cumulative Mortgage Delinquencies Drive Growth and Sustainability of Earnings Source: Wall Street research. Note: Reflects cumulative delinquencies beginning in 2005. ($ in trillions) Delinquency levels have experienced multiple years of rapid growth and there will continue to be a significant backlog of delinquent and non- performing assets in the system The volume of credit-sensitive assets that require the specialized servicing attention of providers like Green Tree will remain elevated for many years to come Management estimates $250 billion of assets were moved to special servicers during 2010 Capturing only a small percentage of these opportunities translates into significant revenue growth |

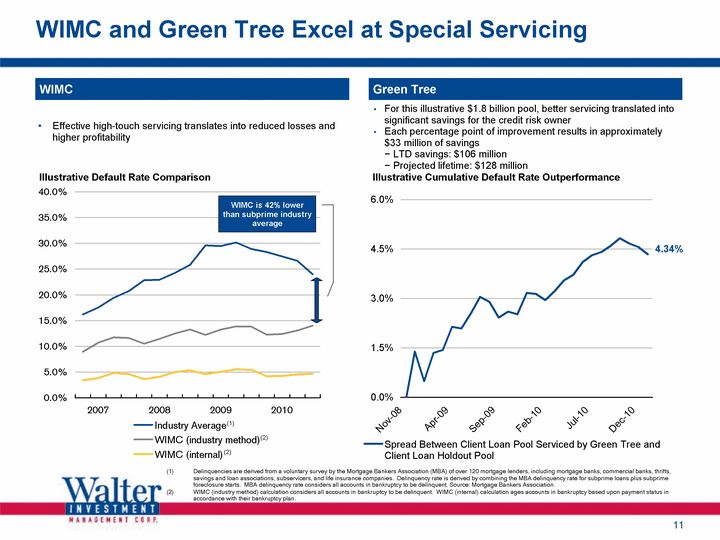
| WIMC and Green Tree Excel at Special Servicing (1) Delinquencies are derived from a voluntary survey by the Mortgage Bankers Association (MBA) of over 120 mortgage lenders, including mortgage banks, commercial banks, thrifts, savings and loan associations, subservicers, and life insurance companies. Delinquency rate is derived by combining the MBA delinquency rate for subprime loans plus subprime foreclosure starts. MBA delinquency rate considers all accounts in bankruptcy to be delinquent. Source: Mortgage Bankers Association. (2) WIMC (industry method) calculation considers all accounts in bankruptcy to be delinquent. WIMC (internal) calculation ages accounts in bankruptcy based upon payment status in accordance with their bankruptcy plan. For this illustrative $1.8 billion pool, better servicing translated into significant savings for the credit risk owner Each percentage point of improvement results in approximately $33 million of savings LTD savings: $106 million Projected lifetime: $128 million 4.34% WIMC Effective high-touch servicing translates into reduced losses and higher profitability Green Tree Illustrative Default Rate Comparison Illustrative Cumulative Default Rate Outperformance (1) (2) (2) |

| Best-In-Class Servicing Platform that Maximizes Value of Credit Sensitive Assets Borrower-Centric, High-Touch Business Model Combined WIMC and Green Tree Presence Traditional Servicers Focus on high performance Decentralized model with 31 offices across the U.S. Customer service representatives have full ownership and accountability for accounts and develop relationships with borrowers Begin calling borrowers at first sign of delinquency Begin manual calls at 30 days delinquent or earlier; <150 accounts per representative All U.S. employees in local communities Focus on cost reduction Centralized model with typically one large call center Standard approach with multiple hand-offs between different functional areas results in lack of personal customer knowledge Sends series of standard letters to delinquent borrowers Begin manual calls at 60 days delinquent; >200 accounts per representative Outsourced model sacrifices service level for reduced costs 25 Regional Green Tree Offices + 70 WIMC Branch Offices 30+ Collections Repossession / Disposition Six Servicing Centers Saint Paul, MN Tampa, FL Phoenix, AZ Corporate Headquarters - Tampa, FL and Saint Paul, MN Originations Center - Tustin, CA and Tampa, FL ARM Recovery Center - Cleveland, OH and Tempe, AZ Focus on high performance Decentralized model with 70 offices across the U.S. Customer service representatives have full ownership and accountability for accounts and develop relationships with borrowers Begin calling borrowers at first sign of delinquency Begin manual calls and field visits at 30 days delinquent All U.S. employees in local communities Regional offices Corporate office Third-party Originations center Servicing centers ARM Recovery center Northern Division Southern Division Central Division Southwestern Division Mississippi Division Oklahoma Division Western Division Represented by shaded regions Green Tree Locations WIMC Locations Rapid City, SD Fort Worth, TX Tempe, AZ Corporate headquarters |

| Green Tree Has a Proven Track Record of Adding New Business Since 2008, Green Tree has transferred $30.6 billion of attractive servicing from new or existing clients Majority of new business derived from existing client base Purchased first MSR transaction sold by FDIC Roll-ups from financial institutions re-organizing / exiting the sector (Irwin, Origin, BankUnited) $30.6 Billion of Servicing Portfolios Transferred to Green Tree Since 2008 By Customer Type By Asset Type By Contract Type (1) (1) In August 2008, SerVertis raised $1.4 billion of committed capital to invest in mortgage whole loans and securities, for which Green Tree performs all servicing. |

| Attractive Growth Prospects Fundamental industry shift toward credit-focused servicers Longstanding relationships with diverse, blue chip customer base generating repeat business Heavily invested in proprietary technology built specifically for servicing credit-sensitive customers Strong independent controls and processes for monitoring and managing compliance Proven ability to outperform traditional servicers WIMC and Green Tree are well positioned to take advantage of the opportunities available |

| Significant Synergies Cost synergies Revenue synergies Initial annual cost synergies of $30 million identified Revenues of $11 million previously projected for Marix are now assumed to be included in Green Tree's revenue Estimated one-time cost to implement of $15 million Expect to achieve over a 6 to 12 month period Sources: Overlapping staff and administrative functions Duplicative servicing platforms / business segments Cross deploying proprietary technology to avoid planned future expenditures Provide additional services to existing combined customers (e.g., component servicing, ARM services) Leverage existing capacity for expected growth and new business opportunities No revenue synergies reflected in financial projections |

| Financial Outlook - Run Rate Analysis (1) "Core EPS" is a non-GAAP measure that approximates recurring distributable income, and is defined as GAAP net income (loss) per share excluding amortization of intangibles, restructuring and transaction charges, impact of consolidated VIEs, change in fair value of MH servicing rights, impairment charges, impairment on professional fees in G&A, hedge/interest rate caps change in value and other non-cash charges. (2) IBES as of 3/25/11. Revenue Balance Sheet Adjusted EBITDA Core EPS Combined 2010 revenues of over $560 million Targeted revenue growth of 10% in 2011 and beyond Combined 2010 adjusted EBITDA of $236 million Target long-term EBITDA growth to match or exceed revenue growth Combined 2010 core EPS of $2.50 - $2.75 (1) 2011 IBES EPS estimate for WAC of $1.39 (2) Significantly accretive to EPS Combined book value of $500 million Asset-light business model requires minimum capital expenditures, funding for advances and other capital needs Significant free cash flow will be committed to de-levering the Company |

| Allows WIMC shareholders to participate in a significant growth opportunity in the sector Attractive shareholder returns can be achieved while taking less credit risk Adds a sustainable business services growth engine to the company that balances WIMC's current business profile Fit between two companies not available to either elsewhere in the market Strong management team of the combined enterprise will provide a deep bench to address growth opportunities and enhanced ability to execute strategy Strategic Rationale for the Acquisition of Green Tree |

| Appendix |

| Use of Non-GAAP Measures Generally Accepted Accounting Principles ("GAAP") is the standard framework of guidelines for financial accounting. It includes the standards, conventions and rules accountants follow in reporting and summarizing transactions, and in the preparation of financial statements. In addition to reporting financial results in accordance with GAAP, Walter Investment and Green Tree have provided non-GAAP financial measures which the companies believe are useful to help investors better understand the companies' financial performance and liquidity. These non-GAAP measures include earnings before interest, taxes, depreciation and amortization ("EBITDA") and adjusted EBITDA. Adjusted EBITDA excludes certain non-cash adjustments to income primarily related to provisions for losses, impairment charges, amortization of discount and deferred debt issuance costs, gain on debt extinguishment, share- based compensation and changes to the fair values of VIE assets/liabilities, derivatives and servicing rights. Non-GAAP measures should be considered in context with the GAAP financial presentation and should not be considered in isolation or as a substitute for GAAP earnings or liquidity. Further, the Companies' non-GAAP measures may be calculated differently from similarly titled measures of other companies. Further description and reconciliations of these non-GAAP measures to related GAAP measures is included in the following pages. |

| Reconciliation of Green Tree Revenue and Adjusted EBITDA (1) Interest expense on corporate debt excludes certain non-corporate debt related interest expense. (2) Depreciation and amortization excludes amortization of deferred debt issuance costs (included in interest expense adjustment). (3) Non-cash adjustments to income consist primarily of provisions for losses, impairment charges, share-based compensation and fair value adjustments of VIE assets/liabilities, derivatives, and servicing rights. (1) New accounting literature (FAS 167) required Green Tree to prospectively consolidate certain variable interest entities beginning January 1, 2010. (1) |

| Reconciliation of Combined Financials (1) WIMC GAAP revenue consists of interest income. (1) Interest expense on corporate debt excludes certain non-corporate debt related interest expense. Includes interest cost associated with MSR financing and LOC fees. (2) Depreciation and amortization excludes amortization of deferred debt issuance costs. (3) Non-cash adjustments to income consist primarily of provisions for losses, impairment charges, amortization of discount, amortization of deferred debt issuance costs, gain on debt extinguishment, share-based compensation, and fair value adjustments of VIE assets/liabilities, derivatives, and servicing rights. (4) Combined adjusted EBITDA excludes the effect of transaction costs, impact of purchase accounting and costs to implement these synergies. (5) Sale of assets and MSH bonds of approximately $2mm relate to earnings not achieved by WIMC if transaction had occurred 1/1/10. |

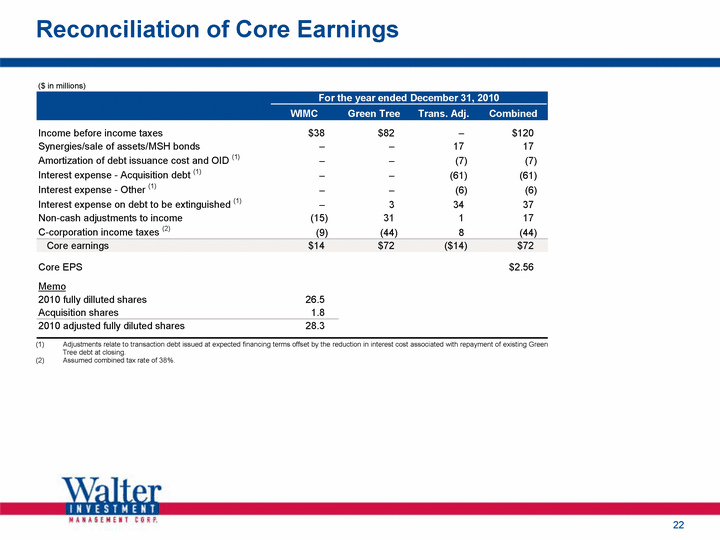
| Reconciliation of Core Earnings (1) Adjustments relate to transaction debt issued at expected financing terms offset by the reduction in interest cost associated with repayment of existing Green Tree debt at closing. (2) Assumed combined tax rate of 38%. |
