Attached files
| file | filename |
|---|---|
| EX-23 - EXHIBIT 23 - COLDWATER CREEK INC | a2202988zex-23.htm |
| EX-32 - EXHIBIT 32 - COLDWATER CREEK INC | a2202988zex-32.htm |
| EX-21 - EXHIBIT 21 - COLDWATER CREEK INC | a2202988zex-21.htm |
| EX-31.1 - EXHIBIT 31.1 - COLDWATER CREEK INC | a2202988zex-31_1.htm |
| EX-10.14 - EXHIBIT 10.14 - COLDWATER CREEK INC | a2202988zex-10_14.htm |
| EX-10.2.1 - EXHIBIT 10.2.1 - COLDWATER CREEK INC | a2202988zex-10_21.htm |
| EX-31.2 - EXHIBIT 31.2 - COLDWATER CREEK INC | a2202988zex-31_2.htm |
UNITED STATES
SECURITIES AND EXCHANGE COMMISSION
Washington, D.C. 20549
Form 10-K
ý |
ANNUAL REPORT PURSUANT TO SECTION 13 OR 15(d) OF THE SECURITIES EXCHANGE ACT OF 1934 |
For the Fiscal Year Ended January 29, 2011
Commission File Number 0-21915
COLDWATER CREEK INC.
(Exact name of registrant as specified in its charter)
| DELAWARE (State or other jurisdiction of incorporation or organization) |
82-0419266 (I.R.S. Employer Identification No.) |
ONE COLDWATER CREEK DRIVE, SANDPOINT, IDAHO 83864
(Address of principal executive offices)
(208) 263-2266
(Registrant's telephone number)
Securities registered pursuant to Section 12(b) of the Act:
Title of Each Class
|
Name of Each Exchange on Which Registered
|
|
|---|---|---|
| Common Stock $0.01 par value | NASDAQ Global Select Market |
Securities registered pursuant to Section 12(g) of the Act:
None
Indicate by check mark if the registrant is a well-known seasoned issuer, as defined in Rule 405 of the Securities Act. YES o NO ý
Indicate by check mark if the registrant is not required to file reports pursuant to Section 13 or Section 15(d) of the Act. YES o NO ý
Indicate by check mark whether the registrant: (1) has filed all reports required to be filed by Section 13 or 15(d) of the Securities Exchange Act
of 1934 during the preceding 12 months (or for such shorter period that the registrant was required to file such reports), and (2) has been subject to such filing requirements for the
past 90 days.
YES ý NO o
Indicate by check mark whether the registrant has submitted electronically and posted on its corporate Web site, if any, every Interactive Data File required to be submitted and posted pursuant to Rule 405 of Regulation S-T (§ 232.405 of this chapter) during the preceding 12 months (or for such shorter period that the registrant was required to submit and post such files). YES o NO o
Indicate by check mark if disclosure of delinquent filers pursuant to Item 405 of Regulation S-K (§ 229.405 of this chapter) is not contained herein, and will not be contained, to the best of registrant's knowledge, in definitive proxy or information statements incorporated by reference in Part III of this Form 10-K or any amendment to this Form 10-K. ý
Indicate by check mark whether the registrant is a large accelerated filer, an accelerated filer, a non-accelerated filer or a smaller reporting company. See the definitions of "large accelerated filer," "accelerated filer" and "smaller reporting company" in Rule 12b-2 of the Exchange Act (Check one):
| Large accelerated filer o | Accelerated filer ý | Non-accelerated filer o (Do not check if a smaller reporting company) |
Smaller reporting company o |
Indicate
by check mark whether the registrant is a shell company (as defined in Rule 12b-2 of the Act).
YES o NO ý
The aggregate market value of the voting and non-voting common equity held by non-affiliates of the registrant on July 30, 2010, the last business day of the registrant's most recently completed second fiscal quarter, based on the last reported trading price of the registrant's common stock on the NASDAQ was approximately $231,028,234
There were 92,503,103 shares of the registrant's $0.01 par value common stock outstanding on March 22, 2011.
DOCUMENTS INCORPORATED BY REFERENCE
Portions of the registrant's proxy statement to be filed with the Commission pursuant to Regulation 14A not later than 120 days after the end of the fiscal year covered by this Form are incorporated by reference into Part III of this Form 10-K.
Coldwater Creek Inc.
Annual Report on Form 10-K
For the Fiscal Year Ended January 29, 2011
Table of Contents
"We", "us", "our", "Company" and "Coldwater Creek", unless the context otherwise requires, means Coldwater Creek Inc. and its wholly-owned subsidiaries.
2
The following discussion contains various statements regarding our current strategies, financial position, results of operations, cash flows, operating and financial trends and uncertainties, as well as certain forward-looking statements regarding our future expectations. When used in this discussion, words such as "anticipate," "believe," "estimate," "expect," "could," "may," "will," "should," "plan," "predict," "potential," and similar expressions are intended to identify such forward-looking statements. Our forward-looking statements are based on our current expectations and are subject to numerous risks and uncertainties. As such, our actual future results, performance or achievements may differ materially from the results expressed in, or implied by, our forward-looking statements. Please refer to our "Risk Factors" in this Annual Report on Form 10-K. We assume no future obligation to update our forward-looking statements or to provide periodic updates or guidance.
General
Coldwater Creek Inc. is a specialty retailer of women's apparel, accessories, jewelry and gift items. Founded in 1984 as a catalog company, today we are a multi-channel specialty retailer. Our proprietary merchandise assortment reflects a sophisticated yet relaxed and casual lifestyle. A commitment to providing superior customer service is manifest in all aspects of our business. Our mission is to become one of the premier specialty retailers for women 35 years of age and older with average annual household incomes in excess of $75,000 by offering our customers a compelling merchandise assortment with superior customer service through all our sales channels.
References to a fiscal year refer to the calendar year in which the fiscal year commences. Our fiscal year ends on the Saturday nearest January 31st. This reporting schedule is followed by many national retail companies. This floating fiscal year end typically results in 13-week fiscal quarters and a 52-week fiscal year, but occasionally will contain an additional week resulting in a 14-week fiscal fourth quarter and a 53-week fiscal year.
Our Multi-Channel Approach
Since the opening of our first premium retail store in November 1999, we have gradually evolved from a direct marketer to a multi-channel specialty retailer. Our merchandise is offered through two distinct operating segments, retail and direct. Our retail segment includes premium retail stores and merchandise clearance outlet stores along with our day spa locations. Our direct segment encompasses our direct-to-consumer business through e-commerce and phone and mail operations. Our catalogs are prominently displayed in each premium retail store to encourage customers to continue shopping with us even after they have left our stores. This multi-channel approach also allows us to cross-promote our brand and provides customers with convenient access to our merchandise, regardless of their preferred shopping method. As part of our commitment to superior customer service, we accept returns virtually at any time and for any reason through any channel regardless of the initial point of purchase.
Information regarding segment performance is included in "Item 7. Management's Discussion and Analysis of Financial Condition and Results of Operations," of this Annual Report on Form 10-K. Additionally, selected financial data for our segments is presented in Note 16 to our consolidated financial statements.
Retail Segment
As of January 29, 2011, we operated 373 premium retail stores throughout the United States. Our premium retail stores average approximately 5,900 square feet in size per store. Approximately 42 percent of these stores are located in traditional malls, 53 percent in lifestyle centers and 5 percent
3
in street locations. During fiscal 2010 we opened 19 new stores and closed 2 stores. Approval of new store locations or changes in existing store leases is conducted upon presentation of a collaborative analysis involving our real estate, business intelligence and finance departments. Our real estate department uses its experience and current market knowledge to identify potential locations based upon an overall market plan. Our business intelligence department then analyzes each location by extracting data and information from our own extensive customer database and combining it with external demographic information. Our finance department analyzes, among other things, a store's historical and projected performance trends such as store earnings and cash flows. This comprehensive analysis includes such information as projected sales, average consumer age and income level, buying habits and the retail location of competitors within the same trade area.
We also operated 39 merchandise clearance outlet stores at the end of fiscal 2010. Our outlet stores average approximately 6,900 square feet in size per store. We conduct periodic seasonal sales events in our premium retail stores and excess merchandise is cleared through our merchandise clearance outlet stores. In October 2010, we began using a full-time sales section within our premium retail stores to clear excess merchandise. Although we currently use outlets exclusively to manage overstocked premium merchandise, we will begin testing product made solely for this channel in fiscal 2011.
We also operate our Coldwater Creek ~ The Spa concept in nine locations. These day spas offer a complete menu of spa treatments, including massages, facials, body treatments, manicures and pedicures. In addition to spa treatments, the day spas carry an assortment of relevant apparel as well as lines of personal care products for women. Our day spas are staffed with experienced professionals in all treatment areas. We currently have no plans to expand our day spa operations.
Direct Segment
Our direct segment consists of sales generated through our e-commerce web site and from orders taken from customers over the phone and though the mail. Our direct segment began with the mailing of our first catalog in 1985 and was expanded in 1999 to include our e-commerce business. We use our e-commerce web site, www.coldwatercreek.com, to cost-effectively expand our customer base and provide another convenient shopping alternative for customers. The web site features the entire full-price merchandise offering found in our catalogs. It also serves as an efficient promotional vehicle for the disposition of excess inventory.
Marketing
As a direct-to-consumer retailer we have been able to create an extensive proprietary database of customer information including customer demographics, purchasing history, and geographic proximity to an existing or planned premium retail store. We believe our ability to effectively design and manage our marketing and promotional programs is enhanced by this rich source of information, allowing us to adjust the frequency, timing and content of each marketing program to maximize its benefits.
We seek to present a consistent brand image throughout all of our marketing and promotion activities. Our merchandise is offered through one core catalog title: Coldwater Creek. The Coldwater Creek catalog is the primary branding and marketing vehicle designed to generate sales in all of our sales channels. We continue to evaluate our Coldwater Creek catalog to ensure that we are reaching the greatest number of customers in the most effective and efficient manner possible. We also use national magazine advertising and postcards targeting specific markets to drive traffic to all channels, while promoting overall brand awareness.
Customers are driven to our web site primarily by our catalogs, e-mail campaigns and online advertising. In addition, we participate in cost-per-click search and revenue share-based affiliate
4
programs whereby numerous popular Internet search engines and consumer web sites provide direct access to our web site.
We also offer customer loyalty programs such as onecreek and our co-branded credit card program. The onecreek program benefits include sneak peeks at upcoming trends and new merchandise, onecreek customer service specialists, exclusive onecreek savings and promotions, free shipping on returns, and a special birthday gift. The co-branded credit card program is operated through a third party. Customers who participate in our credit card reward program earn points on purchases made with the credit card at Coldwater Creek and at other businesses where the card is accepted. Cardholders who accumulate the requisite number of points are issued a coupon that is valid towards the purchase of our merchandise. In addition to earning points, all participants in the co-branded credit card program receive exclusive offers throughout the year. These offers have included special discounts, invitations to our shopping events, and periodic opportunities to earn double and triple points.
Merchandise Design and Procurement
We design and develop the majority of our apparel either in-house or through collaboration with independent designers. To ensure our designers stay abreast of trends in styles and fabrics, we operate a design center in New York City. Our New York design team merges the latest fashion trends with our customers' preferences to build an overall vision that guides the design and development of our seasonal merchandise assortment.
Our product development team translates the overall vision for each season into various product designs, fabrics and prints, indicating the construction and exact specifications for each item. Our team seeks inspiration from their extensive travels, fashion shows, and our direct sourcing team, which provides new fabrics and novelty prints along with product samples from various manufacturers. Our direct sourcing team also assists in identifying the appropriate manufacturers to supply each item and in negotiating price and delivery terms.
Once our merchandise assortment is selected, our inventory planning team determines the quantities of each item to purchase in order to meet anticipated demand. This determination is made through the analysis of information such as historical sales, planned merchandise presentation, scheduled store openings, and sales and margin projections. This process culminates in the issuance of various purchase orders. Coordinating with the direct sourcing department, quality assurance and quality compliance personnel monitor the production process to verify the merchandise is produced to exact specifications and within the designated timeline.
We alter the composition, magnitude and timing of merchandise offerings based upon an understanding of prevailing consumer demand, preferences and trends. The timing of merchandise offerings may be further impacted by, among other factors, the performance of various third parties on which we are dependent. Additionally, the net sales we realize from a particular merchandise offering may impact more than one fiscal quarter and year and the amount and pattern of the sales realization may differ from that realized by a similar merchandise offering in a prior fiscal quarter or year. We continually review inventory to identify excess and slow moving merchandise and clear this merchandise through markdown and other promotional offerings. We also dispose of excess and slow moving inventory internally through our full-time sales section within our premium retail stores, outlets and website, and we have on occasion used a third party liquidator.
Our apparel is purchased through both domestic importers who procure the merchandise on our behalf and international manufacturers through our direct sourcing program. During fiscal 2010, we had approximately 290 active vendors and our largest individual vendor represented less than 9 percent of our merchandise purchases. We have sourcing offices in Hong Kong and India to assist with product
5
development and production management, as well as monitoring compliance with our code of conduct and monitoring program discussed further below.
For fiscal 2010, we were the importer of record for approximately 60 percent of our total apparel purchases. We believe direct sourcing provides us with more control over the production, quality and transportation logistics of our apparel and results in faster speed to market and lower merchandise costs. Domestic importers will remain, however, a crucial component of our overall sourcing strategy, providing unique industry and marketplace knowledge along with product design and development capabilities.
We are committed to sourcing our products in a responsible manner, respecting both the countries in which we have a business presence and the business partners that manufacture our products. We have a code of conduct and monitoring program that applies to all factories contracted in the production of merchandise for Coldwater Creek. Within this code, we recognize that local customs and laws vary from one region of the world to another; however, we strongly believe the issues of business ethics, human rights, health, safety and environmental stewardship transcend geographical boundaries. The intention of this code is to communicate our expectations to each of our business partners.
Distribution Facility and Customer Contact Centers
We lease a 960,000 square-foot facility in Mineral Wells, West Virginia which houses our distribution operations and one of our customer contact centers. We also operate a customer contact center located in Coeur d'Alene, Idaho. Our single distribution facility fulfills merchandise needs for our retail locations and merchandise sold through our direct channel. We believe that our distribution facility is adequate to provide the capacity required for the foreseeable future.
Seasonality
Our quarterly results and cash flows can fluctuate significantly depending on a number of factors including the particular seasonal fashion lines and customer response to our merchandise offerings, shifts in the timing of certain holidays, including Valentine's Day, Easter, Mother's Day, Thanksgiving and Christmas, and weather related influences.
Competition
The women's retail apparel market is highly competitive. Competitors range from specialty apparel retail companies such as Chico's, Talbots, Christopher & Banks and Ann Taylor, to small single channel catalog, e-commerce and retail store companies. We also compete with national department store chains such as Macy's, Nordstrom, Dillard's and JC Penney, along with discount retailers that offer women's apparel and accessories, such as Kohl's and Target.
We believe that we compete principally on the basis of our high-quality, distinctive merchandise selection and exceptional customer service. We also believe that an integrated, multi-channel sales strategy enhances our ability to compete in the marketplace by providing convenient access to our merchandise, regardless of our customer's preferred shopping method.
Employees
As of January 29, 2011, we had 2,832 full-time employees and 6,366 part-time employees. During our peak selling season, which includes the months of November and December, we utilize a substantial number of temporary employees. None of our employees are covered by collective bargaining agreements.
6
Trademarks
Our registered trademarks include Coldwater Creek®, Coldwater Creek The Spa® and the stylized Coldwater Creek logo. We believe that our registered and common law trademarks have significant value and are instrumental to our ability to market and sustain demand for our merchandise and brand.
Available Information
We are subject to the reporting requirements of the Securities Exchange Act of 1934, as amended (the Exchange Act), and therefore file periodic reports and other information with the Securities and Exchange Commission (SEC). These reports may be obtained by visiting the Public Reference Room of the SEC at 100 F Street, NE, Washington, D.C. 20549, or by calling the SEC at 1-800-SEC-0330. In addition, the SEC maintains an Internet web site at www.sec.gov that contains reports, proxy information statements and other information regarding issuers that file electronically.
Our filings under the Exchange Act, including annual reports on Form 10-K, quarterly reports on Form 10-Q, current reports on Form 8-K and all amendments to these reports, are also available free of charge on the investor relations portion of our web site at www.coldwatercreek.com. These reports are available as soon as reasonably practicable after such material is electronically filed with or furnished to the SEC. The reference to our web site address does not constitute incorporation by reference of the information contained on the web site, and the information contained on the web site is not part of this document.
Executive Officers of the Registrant
The table below sets forth the name, current age and current position of our executive officers as of March 22, 2011:
Name
|
Age | Positions Held | |||
|---|---|---|---|---|---|
| Dennis C. Pence | 61 | Chairman of the Board of Directors, President and Chief Executive Officer | |||
| Jill Brown Dean | 54 | President, Chief Merchandising Officer | |||
| Jerome Jessup | 50 | President, Chief Creative Officer | |||
| James A. Bell | 43 | Senior Vice President, Chief Financial Officer | |||
| John E. Hayes III | 48 | Senior Vice President, General Counsel | |||
Executive Officers
Dennis C. Pence co-founded Coldwater Creek in 1984, and has served as a Director since our incorporation in 1988, serving as the Board's Chairman since July 1999 and as its Vice-Chairman prior to that. Mr. Pence has served as our Chief Executive Officer since September 2009, and previously from September 2002 through October 2007 and from 1984 through December 2000. Mr. Pence has also served as our President since September 2009 and from 1984 through 2000. From June 2002 to September 2002, he provided us with his executive management services. From January 2002 to June 2002, Mr. Pence served as our interim Chief Financial Officer and Treasurer. From January 2001 to January 2002, Mr. Pence was semi-retired. Mr. Pence has also served as Chairman of the Board's Executive Committee since its formation in May 2000, a member of the Succession Planning and Management Development committee since November 2007, and as Secretary from July 1998 to February 2009. From April 1999 to December 2000, he was also the President of our Internet Commerce Division. Prior to co-founding Coldwater Creek, Mr. Pence was employed by Sony Corp. of America, a subsidiary of Sony Corporation, a publicly held manufacturer of audio, video, communication, and information technology products, from 1975 to 1983, where his final position was National Marketing Manager—Consumer Video Products.
7
Jill Brown Dean joined us as President and Chief Merchandising Officer in February 2011. Prior to joining Coldwater Creek, Ms. Dean served as President of the Limited Too division of Tween Brands from October 2006 to April 2008. Prior to that, Ms. Dean spent 18 years with Limited Brands, serving as Executive Vice President, General Manager for Victoria's Secret flagship stores from July 2003 to October 2006, as well as President and Chief Executive Officer of Lane Bryant from June 1994 to October 2001. Ms. Dean began her career at Limited Brands in merchandising for the Express division.
Jerome Jessup was appointed President and Chief Creative Officer in February 2011, having joined the Company in August 2009 as Executive Vice President, Creative Director. Prior to joining Coldwater Creek, Mr. Jessup ran his own fashion collection and consulting practice for four years. Prior to that, he was the Senior Executive Vice President of Design and Merchandising for Ann Taylor. Mr. Jessup also spent ten years with The Gap, Inc., leading the design and product development functions for Banana Republic, as well as for The Gap, GapKids, babyGap and GapBody divisions.
James A. Bell has served as Senior Vice President and Chief Financial Officer since April 2010. Upon joining the Company, Mr. Bell served as Divisional Vice President of Financial Planning from September 2009 until December 2009. From December 2009 to April 2010, Mr. Bell served as Vice President of Financial Planning. Prior to joining Coldwater Creek, Mr. Bell served from April 2007 to June 2009 as Senior Vice President, Finance and Planning for Harry and David Holdings, Inc. From October 2002 to April 2007, Mr. Bell was Senior Director, Finance at The Gap, Inc. Prior to his role at Gap, Mr. Bell served in various senior finance roles at SmartPipes, Inc., a software company and in Piper Jaffray's Investment Banking group. Prior to his role at Piper Jaffray, Mr. Bell served in the U.S. Navy for nine years on active duty as a Naval Flight Officer.
John E. Hayes III joined us as Senior Vice President, General Counsel in February 2009 and served as the Company's interim Chief Financial Officer from November 2009 to April 2010, as well as our Human Resources executive from November 2009 to the present. Prior to joining Coldwater Creek, Mr. Hayes was engaged for 17 years in private law practice, most recently as a partner with Hogan & Hartson, LLP, from March 2003 to February 2009. While in private practice, Mr. Hayes served as our outside corporate and securities law counsel from 1999 until joining us. Prior to his legal career, Mr. Hayes practiced as an accountant with KPMG LLP.
8
In addition to the other information set forth in this report, you should carefully consider the following risk factors which could materially affect our business, financial condition or future results of operations. The risks described below are not the only risks we face. Additional risks and uncertainties not currently known or that are currently deemed immaterial may also adversely affect our business, financial condition, or future results of operations.
We must successfully gauge fashion trends and changing consumer preferences.
Forecasting consumer demand for our merchandise is difficult given the nature of changing fashion trends and consumer preferences, which can vary by season and from one geographic region to another and be affected by general economic conditions that are difficult to predict. The global specialty retail business fluctuates according to changes in consumer preferences dictated, in part, by fashion and season. In addition, our merchandise assortment differs in each seasonal flow and at any given time our assortment may not resonate with our customer base. On average, we begin the design process for apparel nine to ten months before merchandise is available to consumers, and we typically begin to make purchase commitments four to eight months in advance. These lead times make it difficult for us to respond quickly to changes in demand for our products. To the extent we misjudge the market for our merchandise or the products suitable for local markets, our sales will be adversely affected and the markdowns required to move the resulting excess inventory will adversely affect our results of operations.
We are working to improve our merchandise assortment to provide fashionable looks and current styles interpreted appropriately for our customer. Creating product with a new creative aesthetic designed for our core and target customer demographic increases our design risk. If our new design aesthetic and merchandise assortments do not resonate with our core and target customer demographic, our sales, gross margins and results of operations may be adversely affected.
Our inventory levels and merchandise assortments fluctuate seasonally, and at certain times of the year, such as during the holiday season, we maintain higher inventory levels and are particularly susceptible to risks related to demand for our merchandise. If the demand for our merchandise were to be lower than expected, causing us to hold excess inventory, we would be forced to further discount merchandise, which reduces our gross margins, results of operations and operating cash flows. If we were to carry low levels of inventory and demand is stronger than we anticipate, we may not be able to reorder merchandise on a timely basis to meet demand, which may adversely affect sales and customer satisfaction.
Economic conditions have impacted consumer spending and may adversely affect our financial position and results of operations.
Consumer spending patterns are highly sensitive to the economic climate and overall consumer confidence. Consumer spending continues to be impacted by the high levels of unemployment, declines in home values, restrictions on the availability of credit, volatile energy and food costs, and other negative economic conditions, nationally and regionally. We continue to be affected by challenging macroeconomic conditions which are evidenced in our business by a highly competitive retail selling environment and low retail store traffic. We believe these conditions will continue into fiscal 2011 and for the foreseeable future. If consumer spending on apparel and accessories continues to decline and demand for our products decreases further, we may be forced to further discount our merchandise or sell it at a loss, which would adversely affect revenues, gross margins, earnings and operating cash flows. In addition, higher costs for transportation, raw materials, labor, insurance and healthcare, and other negative economic factors may adversely affect our cost of sales and operating expenses.
9
We may be unable to maintain the value of our brand.
Our success is driven by the value of the Coldwater Creek brand. Maintaining, promoting and positioning our brand will depend largely on the success of our design, merchandise assortment, and marketing efforts and our ability to provide a consistent, high quality customer experience. Our brand could also be adversely affected by negative publicity targeting our public image and reputation. Deterioration of the value of our brand may adversely affect our business and results of operations.
Our credit facility contains borrowing base and other provisions that may restrict our ability to access it.
The distress in the financial markets has resulted in extreme volatility in securities prices and diminished liquidity and credit availability, which may adversely affect our liquidity. Additionally, lower than expected sales that negatively impact our cash flows could require us to borrow under our credit facility. Although we currently do not have any borrowings under our $70 million secured credit facility, we currently use it for letters of credit which reduces the amount available for borrowings. The actual amount of credit that is available from time to time under our credit facility is limited to a borrowing base amount that is determined according to, among other things, a percentage of the value of eligible inventory plus a percentage of the value of eligible credit card receivables, as reduced by certain reserve amounts that may be determined at the discretion of the lender. Consequently, it is possible that, should we need to access our credit facility, it may not be available in full. Additionally, our credit facility contains covenants related to capital expenditure levels and minimum inventory book value, and other customary matters. Our failure to comply with the covenants, terms and conditions of our credit facility could cause the facility not to be available to us. Tightening of the credit markets could make it difficult for us to enter into agreements for new indebtedness or obtain funding through the issuance of our securities.
We have incurred substantial financial commitments and fixed costs related to our retail stores that we will not be able to recover if our stores are not successful.
The success of an individual store location depends largely on the success of the lifestyle center or shopping mall where the store is located, and may be influenced by changing customer demographic and consumer spending patterns. These factors cannot be predicted with complete accuracy. Because we are required to make long-term financial commitments when leasing retail store locations, and to incur substantial fixed costs for each store's design, leasehold improvements, fixtures and management information systems, it would be costly for us to close a store that does not prove successful. The current economic environment may also adversely affect the ability of developers or landlords to meet commitments to us to pay for certain tenant improvement costs we incur in connection with building out new retail store locations.
The testing of our retail stores' long-lived assets for impairment requires us to make significant estimates about our future performance and cash flows that are inherently uncertain. These estimates can be affected by numerous factors, including changes in economic conditions, our operations, and competitive conditions in the industry. These factors, or changes in actual performance compared with estimates of our future performance, may affect the timing and the fair value estimates used in our testing of long-lived assets, which may result in impairment charges.
We are subject to potentially adverse outcomes in litigation matters.
We are, from time to time, involved in various legal proceedings incidental to the conduct of our business. Actions which may be filed against us include commercial, intellectual property infringement, customer and employment claims, including class action lawsuits alleging that we have violated federal and state wage and hour and other laws. These issues arise primarily in the ordinary course of business but could raise complex factual and legal issues, which are subject to multiple risks and uncertainties
10
and could require significant management time and costs to defend. We believe that our current litigation issues will not have a material adverse effect on our results of operations or financial condition. However, our assessment of current litigation could change in light of the discovery of facts not presently known to us with respect to pending legal actions, or adverse determinations by judges, juries or other finders of fact. Moreover, additional litigation that is not currently pending may adversely affect our results of operations or financial condition.
Our results of operations fluctuate and may be negatively impacted by seasonal influences.
Our net sales, results of operations, liquidity and cash flows have fluctuated, and will continue to fluctuate, on a quarterly basis, as well as on an annual basis, as a result of a number of factors, including, but not limited to, the following:
- •
- the composition, size and timing of various merchandise offerings;
- •
- the timing and number of premium retail store openings and closings;
- •
- the timing and number of promotions;
- •
- the timing and number of catalog mailings;
- •
- the ability to accurately estimate and accrue for merchandise returns and the costs of obsolete inventory disposition;
- •
- the timing of merchandise shipping and receiving, including any delays resulting from labor strikes or slowdowns, adverse
weather conditions, health epidemics or national security measures; and
- •
- shifts in the timing of important holiday selling seasons relative to our fiscal quarters, including Valentine's Day, Easter, Mother's Day, Thanksgiving and Christmas, and the day of the week on which certain important holidays fall.
Our results continue to depend materially on sales and profits from the November and December holiday shopping season. In anticipation of traditionally increased holiday sales activity, we incur certain significant incremental expenses, including the hiring of a substantial number of temporary employees to supplement the existing workforce. If, for any reason, we were to realize lower-than-expected sales or profits during the November and December holiday selling season, as we did in fiscal 2010, 2009 and 2008, our financial condition, results of operations, including related gross margins, and cash flows for the entire fiscal year may be adversely affected.
We may be unable to manage the complexities of our multi-channel business model, which could harm our results of operations.
The complexity of our multi-channel business model requires a level of expertise to successfully manage operations. As we continue to tightly control expenses, we may experience an increase in demands on our managerial, operational and administrative resources, as well as our control environment. If we do not manage these demands, we may not realize the full benefits of our multi-channel business model, which may adversely affect our results of operations.
We are subject to significant risks associated with our management information systems.
We have a number of complex management information systems that are critical to our operations, including systems such as accounting, human resources, inventory purchasing and management, financial planning, direct segment order processing, and retail segment point-of-sale systems. Installing new systems or maintaining and upgrading existing systems carries substantial risk, including potential loss of data or information, cost overruns, implementation delays, disruption of operations, lower
11
customer satisfaction resulting in lost customers, inability to deliver merchandise to our stores or our customers and our potential inability to meet reporting requirements, any of which would harm our business and may adversely affect our results of operations.
We depend on key vendors for timely and effective sourcing and delivery of our merchandise. If these vendors are unable to timely fill orders or meet quality standards, we may lose customer sales and our reputation may suffer.
We may experience difficulties in obtaining sufficient manufacturing capacity from our vendors. We generally maintain non-exclusive relationships with multiple vendors that manufacture our merchandise. However, we have no contractual assurances of continued supply, pricing or access to new products, and any vendor could discontinue selling to us at any time. Moreover, a key vendor may become unable to supply our inventory needs due to capacity constraints, financial instability, or other factors beyond our control, or we could decide to stop using a vendor due to quality or other issues. If we were required to change vendors or if a key vendor were unable to supply desired merchandise in sufficient quantities on acceptable terms, particularly in light of current global economic conditions, we could experience delays in filling customer orders or delivering inventory to stores until alternative supply arrangements were secured. These delays could result in lost sales and a decline in customer satisfaction. The inability of key vendors to access credit and liquidity, or the insolvency of key vendors, could lead to their failure to deliver our merchandise, which would result in lost sales and lower customer satisfaction. It is also possible that the inability of our vendors to access credit will cause them to extend less favorable terms to us, which could adversely affect our cash flows, margins and financial condition, as well as limit the availability under our credit facility. Additionally, delays by our vendors in supplying our inventory needs could cause us to incur more expensive air freight charges, which may adversely affect our margins.
Our reliance on foreign vendors subjects us to uncertainties that could impact our costs to source merchandise, delay or prevent merchandise shipments, or harm our business reputation.
We continue to source apparel directly from foreign vendors, particularly those located in Asia, India and Central America. We were the importer of record for approximately 60 percent of our total apparel purchases during fiscal 2010. Irrespective of our direct sourcing from foreign vendors, substantially all of our merchandise, including that which we buy from domestic vendors, is manufactured overseas. This exposes us to risks and uncertainties which could substantially impact our ability to realize any perceived cost savings. These risks include, among other things:
- •
- burdens associated with doing business overseas, including the imposition of, or increases in, tariffs or import duties,
or import/export controls or regulations, as well as credit assurances we are required to provide to foreign vendors;
- •
- declines in the relative value of the U.S. dollar to foreign currencies;
- •
- volatile fuel, energy and raw material costs, such as recent increases in the cost of cotton;
- •
- failure of vendors to adhere to our quality assurance standards, code of conduct and other environmental, labor, health,
and safety standards for the benefit of workers;
- •
- financial instability of a vendor or vendors, including their potential inability to obtain credit to manufacture the
merchandise they produce for us;
- •
- the potential inability of our vendors to meet our production needs due to raw material or labor shortages;
12
- •
- changing, uncertain or negative economic conditions, political uncertainties or unrest, or epidemics or other health or
weather-related events in foreign countries resulting in the disruption of trade from exporting countries; and
- •
- restrictions on the transfer of funds or transportation delays or interruptions.
We face substantial competition from other retailers in the women's apparel industry.
We face substantial competition from retailers for elements in our merchandise lines, and net sales may decline or grow more slowly if we are unable to differentiate our merchandise and shopping experience from those of other retailers. In addition, the retail apparel industry has experienced significant price deflation over the past several years largely due to the downward pressure on retail prices caused by discount retailers and, more recently, by declining consumer spending, resulting in increased promotional and competitive activity. We expect this price deflation to continue as a result of the recent expiration of quota restrictions on the importing of apparel into the United States from foreign countries that are members of the World Trade Organization. This price deflation may make it more difficult for us to maintain gross margins and to compete with retailers that have greater purchasing power than we have.
Consumer concerns about purchasing items via the Internet as well as external or internal infrastructure system failures could negatively impact our e-commerce sales or cause us to incur additional costs.
Our business is vulnerable to consumer privacy concerns relating to purchasing items over the Internet, security breaches, and failures of Internet infrastructure and communications systems. If consumer confidence in making purchases over the Internet declines as a result of privacy or other concerns, our e-commerce net sales may be adversely affected. We may be required to incur increased costs to address or remedy any system failures or security breaches or any actual or perceived consumer privacy concerns.
We may be unable to efficiently fill customer orders in our direct channel, which could harm customer satisfaction.
If we are unable to efficiently process and fill customer orders, customers may cancel or refuse to accept orders, and customer satisfaction could be harmed. We are subject to, among other things:
- •
- failures in the efficient and uninterrupted operation of our customer contact centers or our sole distribution center in
Mineral Wells, West Virginia, including system failures caused by telecommunications systems providers and order volumes that exceed our present telephone or Internet system capabilities;
- •
- delays or failures in the performance of third parties, such as vendors who supply our merchandise, shipping companies and
the U.S. postal and customs services, including delays associated with labor disputes, labor union activity, inclement weather, natural disasters, health epidemics and possible acts of terrorism; and
- •
- disruptions or slowdowns in our order processing or fulfillment systems resulting from increased security measures implemented by U.S. customs, or from homeland security measures, telephone or Internet down times, system failures, computer viruses, electrical outages, mechanical problems, human error or accidents, fire, natural disasters or comparable events.
13
We have a liberal merchandise return policy and we may experience a greater number of returns than we anticipate.
As part of our commitment to superior customer service, we accept returns virtually at any time and for any reason through any channel regardless of initial point of purchase. We make allowances in our financial statements for anticipated merchandise returns based on historical return rates and future expectations. These allowances may be exceeded, however, by actual merchandise returns as a result of many factors, including changes in the merchandise mix, size and fit, actual or perceived quality, differences between the actual product and its presentation in catalogs or on the web site, timeliness of delivery, competitive offerings and consumer preferences or confidence. Any significant increase in merchandise returns that exceed our estimates would result in adjustments to revenue and to cost of sales and may adversely affect our financial condition, results of operations and cash flows.
We may be unable to manage significant increases in the costs associated with the catalog business.
We incur substantial costs associated with catalog mailings, including paper, postage, merchandise acquisition and human resource costs associated with catalog layout and design, production and circulation and increased inventories. Significant increases in U.S. Postal Service rates and the cost of telecommunications services, paper and catalog production could significantly increase catalog production costs and result in lower profits for the catalog business. Most of our catalog-related costs are incurred prior to mailing, and as such we are not able to adjust the costs of a particular catalog mailing to reflect the actual subsequent performance of the catalog. Moreover, customer response rates have been volatile in recent years, particularly for mailings to prospective customers. Because the catalog business accounts for a significant portion of total net sales, any performance shortcomings experienced by the catalog business may adversely affect our overall business, financial condition, results of operations and cash flows.
Our success is dependent upon key personnel and our ability to attract and retain qualified employees.
Our future success depends largely on the contributions and abilities of key executives and other employees. The loss of any of our key employees may adversely affect our business. Furthermore, the current economic conditions or the location of our corporate headquarters in Sandpoint, Idaho, may make it more difficult or costly to attract qualified employees for key positions. We have made significant changes at all levels of our merchandising and creative teams, including both internal promotions and new hires. We believe that we now have the key people in place to enable us to reinvigorate our product assortment and reposition our brand. However, there can be no assurance that these key employees will be successful in executing our initiatives.
Our multi-channel business model may expose us to assessments for unpaid taxes.
Our multi-channel business model subjects us to state and local taxes in numerous jurisdictions, including state income, franchise, and sales and use tax. We collect these taxes in any jurisdiction in which we have a physical presence. While we believe we have appropriately paid or accrued for all taxes based on our interpretation of applicable law, tax laws are complex and interpretations differ from state to state. In the past, some taxing jurisdictions have assessed additional taxes and penalties on us, asserting either an error in our calculation or an interpretation of the law that differed from our own. It is possible that taxing authorities may make additional assessments in the future. In addition to taxes, penalties and interest, these assessments could cause us to incur legal fees associated with resolving disputes with taxing authorities.
Additionally, changes in state and local tax laws, such as temporary changes associated with "tax holidays" and other programs, require us to make continual changes to our collection and reporting systems that may relate to only one taxing jurisdiction. If we fail to update our collection and reporting
14
systems in response to these changes, any over collection or under collection of sales taxes could subject us to interest and penalties, as well as private lawsuits and damage to our reputation.
The majority of our cash and cash equivalents are concentrated with one financial institution.
We maintain the majority of our cash and cash equivalents with one major financial institution in the United States, in the form of demand deposits, money market accounts and other short-term investments. Deposits in this institution may exceed the amounts of insurance provided on such deposits. With the current financial environment and the instability of financial institutions, we cannot be assured that we will not experience losses on our deposits.
The stock price has fluctuated and may continue to fluctuate widely.
The market price for our common stock has fluctuated and has been and will continue to be significantly affected by, among other factors, quarterly operating results, changes in any earnings estimates publicly announced by us or by analysts, customer response to merchandise offerings, the size of catalog mailings, the timing of retail store openings or of important holiday seasons relative to our fiscal periods, seasonal effects on sales and various factors affecting the economy in general. In addition, stock markets generally have experienced a high level of price and volume volatility and market prices for the stock of many companies including ours, have experienced wide price fluctuations not necessarily related to their operating performance. The reported high and low sale prices of our common stock were $8.75 per share and $2.71 per share, respectively, during fiscal 2010. The fluctuation of the market price of our common stock may have a negative impact on our liquidity and access to capital. In addition, price volatility of our common stock may expose us to stockholder litigation which may adversely affect our financial condition, results of operations and cash flows.
Our largest stockholders may exert influence over our business regardless of the opposition of other stockholders or the desire of other stockholders to pursue an alternate course of action.
Dennis Pence, our Chairman of the Board of Directors, President, CEO and co-founder, may be deemed to beneficially own directly and indirectly, approximately 14.3 percent of our outstanding common stock as of March 22, 2011. Ann Pence, our co-founder, may be deemed to beneficially own, directly and indirectly, approximately 19.6 percent of our outstanding common stock as of March 22, 2011. Either Dennis Pence or Ann Pence acting independently, would have significant influence over, and should they act together, could effectively control the outcome of, any matters submitted to stockholders, including the election of directors and approval of business combinations, and could delay, deter or prevent a change of control of the Company, which may adversely affect the market price of our common stock. The interests of these stockholders may not always coincide with the interests of other stockholders.
Provisions in the charter documents and Delaware law may inhibit a takeover and discourage, delay or prevent stockholders from replacing or removing current directors or management.
Provisions in our Certificate of Incorporation and Bylaws may have the effect of delaying or preventing a merger with or acquisition of us, even where the stockholders may consider it to be favorable. These provisions could also prevent or hinder an attempt by stockholders to replace current directors and include:
- •
- providing for a classified Board of Directors with staggered, three-year terms;
- •
- prohibiting cumulative voting in the election of directors;
- •
- authorizing the Board to designate and issue "blank check" preferred stock;
- •
- limiting persons who can call special meetings of the Board of Directors or stockholders;
15
- •
- prohibiting stockholder action by written consent; and
- •
- establishing advance notice requirements for nominations for election to the Board of Directors or for proposing matters that can be acted on by stockholders at a stockholders meeting.
Because the Board of Directors appoints management, any inability to effect a change in the Board of Directors may also result in the entrenchment of management.
We are also subject to Section 203 of the Delaware General Corporation Law, which, subject to exceptions, prohibits a Delaware corporation from engaging in any business combination with an interested stockholder for a period of three years following the date that the stockholder became an interested stockholder. The preceding provisions of our Certificate of Incorporation and Bylaws, as well as Section 203 of the Delaware General Corporation Law, could discourage potential acquisition proposals, delay or prevent a change of control and prevent changes in our management.
The day spa concept may not be successful and may be abandoned at any time.
We operate the Coldwater Creek ~ The Spa concept in nine locations. To date, our day spas have had a negative impact on our earnings, as we experiment with marketing approaches and gather data regarding the spa business and, in particular, our spa customer. We have no plans to build additional day spas. There is no assurance that the day spa concept will ever be successful.
If we were to abandon the day spa concept, we would be required to write off any remaining net capitalized costs and may incur lease termination costs, which may adversely affect results of operations. Additionally, we may incur impairment charges related to our day spas if there were a continued deterioration in the spas' results of operations.
We may be unable to successfully grow our premium retail store base, which could result in lower long term revenue growth.
We continue to believe that retail expansion will be a key driver for our long term growth. However, due to our recent business performance, we have scaled back our store opening plans. During fiscal 2010, we opened 19 new premium retail stores and closed two, ending the year with 373 premium retail stores. We plan to limit new store openings in fiscal 2011 to five stores to which we have previously committed and to close between eight and 12 stores. However, there can be no assurance that these stores will be opened, will be opened in a timely manner, or, if opened, that these stores will be profitable. The ability to open retail stores depends on our ability to successfully:
- •
- identify or secure premium retail space;
- •
- negotiate site leases on favorable lease terms for the retail store locations we identify; and
- •
- prevent construction delays and cost overruns in connection with the build-out of new stores.
Any miscalculations or shortcomings we may make in the planning and control of our retail stores may adversely affect our financial position, results of operations and cash flows. In addition, current macroeconomic conditions could result in an inability on the part of real estate developers to obtain retail property in preferred locations.
We do not maintain a specific rollout plan beyond a one-year horizon. We continually reassess store rollout plans based on the overall retail environment, the performance of the retail business, our access to working capital and external financing and the availability of suitable store locations. For example, it is possible that in any year we will increase planned store openings, particularly if we experience strong retail sales and have access to the necessary working capital or external financing. Likewise, we would be inclined to further curtail our store rollout if we were to continue to experience
16
weak retail sales or if we did not have adequate working capital or access to financing, or as a part of a cost containment initiative.
We may be unable to protect our trademarks from infringement.
Our registered trademarks, which include Coldwater Creek®, Coldwater Creek The Spa® and the stylized Coldwater Creek logo, are important to our success. Even though we register and protect our trademarks and other intellectual property rights, there is no assurance that our actions will protect us from others infringing upon our trademarks and proprietary rights or seeking to block sales of our products as infringements of their trademarks and proprietary rights. If we cannot adequately protect our marks or prevent infringement of them, our business and results of operations may be adversely affected.
Item 1B. UNRESOLVED STAFF COMMENTS
None.
The general location, use and approximate size of our principal properties as of January 29, 2011 are as follows:
Facility
|
Address | Owned/ Leased |
Approximate Size | |||
|---|---|---|---|---|---|---|
Corporate Offices(a) |
Sandpoint, Idaho | Owned | 270,000 sq. ft. | |||
East Coast Operations Center, including Distribution and Customer Contact Center |
Mineral Wells, West Virginia |
Leased |
960,000 sq. ft. |
|||
Coeur d'Alene Customer Contact Center |
Coeur d'Alene, Idaho |
Leased |
69,000 sq. ft. |
|||
Foreign sourcing offices |
Hong Kong and Delhi, India |
Leased |
17,000 sq. ft. |
|||
New York Design Studio |
New York City, New York |
Leased |
20,000 sq. ft. |
|||
373 Premium Retail Stores(b) |
Various U.S. locations |
Leased |
2,186,000 sq. ft. |
|||
39 Outlet Stores(c) |
Various U.S. locations |
Leased |
270,000 sq. ft. |
|||
9 Day Spas(d) |
Various U.S. locations |
Leased |
49,000 sq. ft. |
- (a)
- Our
corporate offices include approximately 176,000 square feet of administrative office space and approximately 94,000 square feet occupied by our employee
fitness center, spa, virtual retail stores, photo studio, and employee training center.
- (b)
- Our
premium retail stores average approximately 5,900 square feet in size per store. The base term of our premium retail store leases is generally ten
years. Store count includes 372 premium retail stores and one flagship store located in Manhattan, New York.
- (c)
- Our
outlet stores average approximately 6,900 square feet in size per store. The base term of our outlet store leases is generally five years.
- (d)
- Our day spas average approximately 5,400 square feet in size per spa. The base term of our day spa leases is generally ten years.
We believe that our corporate offices, distribution center and customer contact centers will meet our operational needs for the foreseeable future.
17
We are, from time to time, involved in various legal proceedings incidental to the conduct of business. Actions filed against us from time to time include commercial, intellectual property infringement, customer and employment claims, including class action lawsuits alleging that we violated federal and state wage and hour and other laws. We believe that we have meritorious defenses to all lawsuits and legal proceedings currently pending against us. Though we will continue to vigorously defend such lawsuits and legal proceedings, we are unable to predict with certainty whether or not we will ultimately be successful.
On September 12, 2006, as amended on April 25, 2007, Brighton Collectibles, Inc. (Brighton) filed a complaint against us in the United States District Court for the Southern District of California. The complaint alleged, among other things, that we violated trade dress and copyright laws. On November 21, 2008, a jury found us liable to Brighton for copyright and trade dress infringement. In January 2009, the court entered a judgment in the total amount of $8.0 million, which includes damages of $2.7 million on the trade dress claim, $4.1 million in damages and profits on the copyright claim and $1.2 million in attorneys' fees. We have appealed the judgment as we believe there are legitimate grounds to overturn the judgment. Pending the appeal, the court entered a temporary stay of execution conditioned on us posting an $8.0 million bond, which has been posted. On December 12, 2008, as amended on September 17, 2009, Brighton filed another complaint against us in the United States District Court for the Southern District of California. This additional complaint alleges copyright infringement of three different Brighton designs and seeks to recover damages of approximately $0.7 million, plus attorneys' fees and costs. We are vigorously defending this matter. We believe it is without merit and we are asserting various defenses to the action. We believe that the amount of loss, if any, related to these legal proceedings is adequately reserved for or covered by insurance.
18
Item 5. MARKET FOR REGISTRANT'S COMMON EQUITY, RELATED STOCKHOLDER MATTERS AND ISSUER PURCHASES OF EQUITY SECURITIES
Price Range of Common Stock and Dividend Policy
Our common stock has been quoted on the NASDAQ Stock Market under the symbol "CWTR" since our initial public offering on January 29, 1997. On March 22, 2011, we had 6,471 stockholders of record and 92,503,103 shares of common stock, $0.01 par value per share, outstanding.
The following table sets forth the high and low sales price data for our common stock for the periods indicated:
| |
Price Range of Common Stock |
||||||
|---|---|---|---|---|---|---|---|
| |
High | Low | |||||
Fiscal 2010: |
|||||||
First Quarter |
$ | 8.75 | $ | 4.22 | |||
Second Quarter |
$ | 7.37 | $ | 3.13 | |||
Third Quarter |
$ | 5.89 | $ | 3.27 | |||
Fourth Quarter |
$ | 3.58 | $ | 2.71 | |||
Fiscal 2009: |
|||||||
First Quarter |
$ | 3.96 | $ | 1.42 | |||
Second Quarter |
$ | 7.48 | $ | 3.48 | |||
Third Quarter |
$ | 9.20 | $ | 5.62 | |||
Fourth Quarter |
$ | 6.43 | $ | 4.14 | |||
We have never paid a cash dividend on our common stock nor do we expect to declare a cash dividend in the foreseeable future. In addition, the payment of dividends is subject to certain restrictions under our Credit Agreement.
19
Performance Graph
The following graph compares the cumulative five-year total return to stockholders on Coldwater Creek Inc.'s common stock to the cumulative total returns of the NASDAQ Composite Index, and a customized peer group of the following four companies: AnnTaylor Stores Corp., Chico's FAS Inc., Christopher & Banks Corp. and Talbots Inc. The stock price performance shown below is not necessarily indicative of future performance.
COMPARISON OF 5 YEAR CUMULATIVE TOTAL RETURN*
Among Coldwater Creek Inc., the NASDAQ Composite Index and a Peer Group
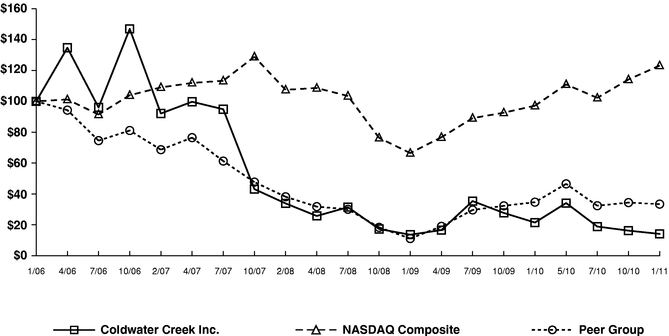
* $100 invested on 1/28/06 in stock or 1/31/06 in index, including reinvestment of dividends. Index calculated on month-end basis.
| |
1/06 | 4/06 | 7/06 | 10/06 | 2/07 | 4/07 | 7/07 | 10/07 | 2/08 | 4/08 | |||||||||||||||||||||
|---|---|---|---|---|---|---|---|---|---|---|---|---|---|---|---|---|---|---|---|---|---|---|---|---|---|---|---|---|---|---|---|
Coldwater Creek Inc. |
$ | 100.00 | $ | 134.68 | $ | 96.00 | $ | 146.87 | $ | 92.10 | $ | 99.71 | $ | 94.85 | $ | 43.11 | $ | 33.86 | $ | 25.72 | |||||||||||
NASDAQ Composite |
$ | 100.00 | $ | 101.18 | $ | 91.44 | $ | 103.94 | $ | 109.00 | $ | 111.90 | $ | 113.32 | $ | 128.85 | $ | 107.45 | $ | 108.61 | |||||||||||
Peer Group |
$ | 100.00 | $ | 94.27 | $ | 74.53 | $ | 81.09 | $ | 68.65 | $ | 76.46 | $ | 61.30 | $ | 47.66 | $ | 38.16 | $ | 31.76 | |||||||||||
| 7/08 | 10/08 | 1/09 | 4/09 | 7/09 | 10/09 | 1/10 | 5/10 | 7/10 | 10/10 | 1/11 | ||||||||||||||||||||||
|---|---|---|---|---|---|---|---|---|---|---|---|---|---|---|---|---|---|---|---|---|---|---|---|---|---|---|---|---|---|---|---|---|
| $ | 31.41 | $ | 17.29 | $ | 13.58 | $ | 16.62 | $ | 35.36 | $ | 27.70 | $ | 21.48 | $ | 34.10 | $ | 18.88 | $ | 16.23 | $ | 14.11 | |||||||||||
| $ | 103.45 | $ | 76.32 | $ | 66.46 | $ | 76.73 | $ | 89.08 | $ | 92.62 | $ | 97.13 | $ | 110.92 | $ | 102.23 | $ | 114.12 | $ | 123.13 | |||||||||||
| $ | 30.05 | $ | 18.34 | $ | 11.11 | $ | 18.98 | $ | 29.62 | $ | 32.29 | $ | 34.67 | $ | 46.51 | $ | 32.35 | $ | 34.40 | $ | 33.40 | |||||||||||
The information required by this item concerning equity compensation plans is incorporated by reference to "Item 12. Security Ownership of Certain Beneficial Owners and Management and Related Stockholder Matters" of this Annual Report on Form 10-K.
20
Item 6. SELECTED FINANCIAL DATA
The following statements of operations and balance sheet data have been derived from our audited financial statements. The information presented below should be read in conjunction with Management's Discussion and Analysis of Financial Condition and Results of Operations and our consolidated financial statements and related notes included elsewhere herein. All information is presented in thousands except per share, average square feet per store and store count data.
| |
Fiscal Year Ended(a) | ||||||||||||||||
|---|---|---|---|---|---|---|---|---|---|---|---|---|---|---|---|---|---|
| |
January 29, 2011 |
January 30, 2010(b) |
January 31, 2009 |
February 2, 2008 |
February 3, 2007(c) |
||||||||||||
| |
(52 weeks) |
(52 weeks) |
(52 weeks) |
(52 weeks) |
(53 weeks) |
||||||||||||
Statement of Operations Data: |
|||||||||||||||||
Net sales |
$ | 981,101 | $ | 1,038,581 | $ | 1,024,221 | $ | 1,151,472 | $ | 1,054,611 | |||||||
Gross profit |
$ | 307,285 | $ | 334,281 | $ | 350,560 | $ | 450,183 | $ | 471,007 | |||||||
Net income (loss) |
$ | (44,111 | ) | $ | (56,132 | ) | $ | (25,963 | ) | $ | (2,488 | ) | $ | 55,372 | |||
Net income (loss) per common share—Basic |
$ | (0.48 | ) | $ | (0.61 | ) | $ | (0.29 | ) | $ | (0.03 | ) | $ | 0.60 | |||
Net income (loss) per common share—Diluted |
$ | (0.48 | ) | $ | (0.61 | ) | $ | (0.29 | ) | $ | (0.03 | ) | $ | 0.59 | |||
Weighted average common shares outstanding—Basic |
92,316 | 91,597 | 91,037 | 92,801 | 92,616 | ||||||||||||
Weighted average common shares outstanding—Diluted |
92,316 | 91,597 | 91,037 | 92,801 | 94,485 | ||||||||||||
Cash dividends declared per common share |
$ | — | $ | — | $ | — | $ | — | $ | — | |||||||
Selected Segment Data: |
|||||||||||||||||
Net sales: |
|||||||||||||||||
Retail |
$ | 732,430 | $ | 782,429 | $ | 751,352 | $ | 775,082 | $ | 664,170 | |||||||
Direct |
$ | 248,671 | $ | 256,152 | $ | 272,869 | $ | 376,390 | $ | 390,441 | |||||||
Operating income: |
|||||||||||||||||
Retail |
$ | 27,083 | $ | 37,479 | $ | 30,396 | $ | 76,585 | $ | 107,566 | |||||||
Direct |
40,483 | 41,837 | 42,108 | 55,878 | 98,595 | ||||||||||||
Segment operating income |
67,566 | 79,316 | 72,504 | 132,463 | 206,161 | ||||||||||||
Unallocated corporate and other |
(110,945 | ) | (124,494 | ) | (118,716 | ) | (143,132 | ) | (122,266 | ) | |||||||
Income (loss) from operations |
$ | (43,379 | ) | $ | (45,178 | ) | $ | (46,212 | ) | $ | (10,669 | ) | $ | 83,895 | |||
Selected Operating Data: |
|||||||||||||||||
Total catalogs mailed |
83,125 | 91,365 | 85,950 | 128,551 | 118,690 | ||||||||||||
Average premium retail store size in square feet |
5,900 | 5,900 | 5,900 | 5,800 | 5,600 | ||||||||||||
Balance Sheet Data: |
|||||||||||||||||
Cash and cash equivalents |
$ | 51,613 | $ | 84,650 | $ | 81,230 | $ | 62,479 | $ | 148,680 | |||||||
Inventory |
$ | 156,481 | $ | 161,546 | $ | 135,376 | $ | 139,993 | $ | 126,953 | |||||||
Working capital |
$ | 81,846 | $ | 98,885 | $ | 92,989 | $ | 115,750 | $ | 173,319 | |||||||
Total assets |
$ | 506,723 | $ | 583,523 | $ | 628,627 | $ | 624,259 | $ | 580,475 | |||||||
Total long-term debt, including capital leases(d) |
$ | 12,241 | $ | 11,454 | $ | 13,316 | $ | 14,467 | $ | 1,008 | |||||||
Stockholders' equity |
$ | 193,009 | $ | 235,561 | $ | 282,496 | $ | 301,863 | $ | 317,456 | |||||||
Premium Retail Store Count: |
|||||||||||||||||
Beginning of the fiscal year(e) |
356 | 348 | 306 | 240 | 174 | ||||||||||||
Opened during the period |
19 | 8 | 42 | 66 | 65 | ||||||||||||
Closed during the period |
2 | — | — | — | — | ||||||||||||
End of the fiscal year |
373 | 356 | 348 | 306 | 239 | ||||||||||||
- (a)
- References
to a fiscal year refer to the calendar year in which the fiscal year commences. Our fiscal year end is the Saturday nearest
January 31st. This floating fiscal year end typically results in 13-week fiscal quarters and a 52-week fiscal year, but occasionally will contain an
additional week resulting in a 14-week fiscal fourth quarter and a 53-week fiscal year.
- (b)
- During fiscal 2009, we recorded a $24.4 million non-cash income tax charge, or $0.27 per share, related to a valuation allowance against net deferred tax assets. U.S. GAAP requires that we assess whether a valuation allowance should be established against our deferred tax assets based on the consideration of all available evidence using a "more likely than not" standard. In making such judgments, significant weight is given to evidence that can be objectively verified. A company's current or previous losses are given more weight than its projected future performance. Consequently, based on available evidence, in particular our three-year historical cumulative losses, we recorded a valuation allowance against our net deferred tax asset. The recording of a valuation allowance has no impact on cash and does not preclude us from utilizing the full amount of the deferred tax asset in future profitable periods.
21
- (c)
- Effective
January 29, 2006, we adopted the accounting standard related to Share-Based Payments using the modified prospective method. On
February 3, 2007, we adopted the accounting standard related to Employers' Accounting for Defined Benefit Pension and Other Postretirement Plans, resulting in a $3.2 million decrease in
stockholders' equity.
- (d)
- We
maintain a revolving line of credit up to $70.0 million, with subfacilities for the issuance of up to $70.0 million in letters of credit
and swingline advances of up to $10.0 million.
- (e)
- As of February 4, 2007, we reclassified our Jackson Hole, WY store from a resort to a premium store.
22
Item 7. MANAGEMENT'S DISCUSSION AND ANALYSIS OF FINANCIAL CONDITION AND RESULTS OF OPERATIONS
The following discussion contains various statements regarding our current initiatives, financial position, results of operations, cash flows, operating and financial trends and uncertainties, as well as certain forward-looking statements regarding our future expectations. When used in this discussion, words such as "anticipate," "believe," "estimate," "expect," "could," "may," "will," "should," "plan," "predict," "potential," and similar expressions are intended to identify such forward-looking statements. Our forward-looking statements are based on our current expectations and are subject to numerous risks and uncertainties. As such, our actual future results, performance or achievements may differ materially from the results expressed in, or implied by, our forward-looking statements. Please refer to our "Risk Factors" elsewhere in this Annual Report on Form 10-K for the fiscal year ended January 29, 2011. The forward-looking statements in this Annual Report are as of the date such report is filed with the SEC, and we assume no obligation to update our forward-looking statements or to provide periodic updates or guidance.
Overview
We encourage you to read this Management's Discussion and Analysis of Financial Condition and Results of Operations in conjunction with the accompanying consolidated financial statements and related notes. The fiscal years ended January 29, 2011 (fiscal 2010), January 30, 2010 (fiscal 2009) and January 31, 2009 (fiscal 2008) each consisted of 52 weeks.
Executive Summary
Net loss for fiscal 2010 was $44.1 million, or $0.48 per share, compared with a net loss of $56.1 million, or $0.61 per share, for fiscal 2009. Net loss for fiscal 2010 includes impairment charges of $3.9 million, or $0.04 per share. Net loss for fiscal 2009 included a $24.4 million non-cash income tax charge, or $0.27 per share, related to a valuation allowance against net deferred tax assets; a $3.8 million after-tax charge, or $0.04 per share, related to the separation from our former CEO; and a $0.6 million non-cash charge, or $0.01 per share, related to premium retail store asset impairments.
Net sales decreased to $981.1 million in fiscal 2010 compared to $1,038.6 million in fiscal 2009. This 5.5 percent decrease in net sales for the year was primarily driven by a decrease in comparable premium retail store sales1 of 8.5 percent in our retail segment and a decrease in our direct segment sales of 2.9 percent.
Gross profit for fiscal 2010 was $307.3 million, or 31.3 percent of net sales, compared with $334.3 million, or 32.2 percent of net sales, in fiscal 2009. The 90 basis point decline in gross profit margin was primarily due to deleveraging of occupancy expenses, offsetting a slight improvement in merchandise margins.
Selling, general and administrative expenses for fiscal 2010 were $346.7 million, or 35.3 percent of net sales, compared with $378.9 million, or 36.5 percent of net sales, for fiscal 2009. The decline in SG&A was primarily related to lower employee-related and marketing expenses and other fixed and variable costs.
- (1)
- We define comparable premium retail stores as those stores in which the gross square footage has not changed by more than 20 percent in the previous 16 months and which have been open for at least 16 consecutive months (provided that store has been considered comparable for the entire quarter) without closure for seven consecutive days or moving to a different temporary or permanent location. Due to the extensive promotions that occur as part of the opening of a premium store, we believe waiting sixteen months rather than twelve months to consider a store to be comparable provides a better view of the growth pattern of the premium retail store base. The calculation of comparable store sales varies across the retail industry and as a result, the calculations of other retail companies may not be consistent with our calculation.
23
We ended fiscal 2010 with $51.6 million in cash and cash equivalents, compared to $84.7 million at the prior year end. Working capital was $81.8 million at the end of fiscal 2010, compared to $98.9 million at the end of fiscal 2009. Premium retail inventory, including the retail inventory in our distribution center, decreased 15.3 percent per square foot compared to fiscal 2009. Total inventory decreased 3.1 percent to $156.5 million at the end fiscal 2010 from $161.5 million at the end of fiscal 2009.
Company Initiatives
We believe that the most important change we need to make in order to improve our sales and profitability is to offer our core and target customer an assortment that she finds more appealing. We recognize that our target customer's style orientation has changed over the last several years, and that our collections have not evolved to meet her needs.
We have talked extensively to our customer to better understand her needs and what she expects from Coldwater Creek. Our findings have consistently told us that, among other things, a) color is important to her and she is looking for colors that are seasonally appropriate, b) she finds the bold prints and patterns we have offered in the past too matronly, c) she looks to us for jackets in flattering silhouettes that give her shape and d) she wants versatility in her wardrobe.
We have made significant changes at all levels of our merchandising and creative teams to better address the needs of both our core and target customer demographic. Most recently, we announced that Jill Dean has joined us as President and Chief Merchandising Officer. In addition to a select number of internal promotions within our merchandising team, we have recently added two senior level merchants for both our retail and direct businesses.
Additionally, Jerome Jessup was promoted to President and Chief Creative Officer. Under Jerome Jessup's leadership, we have added new talent to our New York design center specifically in the areas of product design and development, fabric research and development, and in the design leadership of several key categories including sweaters and pants. We have also added key senior level talent in product development focusing on fit as well as our wovens business. We believe that we now have the right people in place to enable us to reinvigorate our product assortment and reposition our brand to better address the needs of our target demographic.
For fiscal 2011, we are focused on three primary objectives: improving our financial performance, elevating the appeal of our product, and revitalizing our brand perception.
We are intensely focused on improving our financial performance. We continue to look for ways to further reduce expenses and expect to see some further reductions in 2011. Our biggest opportunity for improvement in financial performance is to restore our gross margin through improved full-price sales. We continue to analyze our inventory buys and believe there is additional room to adjust our inventory commitments as we move through the year. We have also evaluated our promotional and markdown strategy and will continue to offer shorter sale events. We will also continue to offer a full-time sale section in our premium stores, which we began in the third quarter of 2010. We believe this will enable us to clear excess inventory more profitably than through our outlet stores and in the clearance section of our website. In addition, in our outlet stores, which have historically been used for clearing excess inventory only, we will begin testing product made exclusively for this channel. We expect that this will enable us to realize better gross margins for this business.
To elevate the appeal of our assortment, we are focused on rebuilding several of our key merchandising categories. We are working to restore our jacket business by offering more variety in lengths and silhouettes. In 2011 we will roll out the next stage of our pant fit initiative which focuses on providing consistency in our fits across all of our pant offerings. We believe that there is a significant opportunity to expand our pant offering to cater to other aspects of our customers'
24
wardrobing needs. We are also introducing a wear-to-work style orientation to our collection that offers her the versatility she is looking for in pants and tops, as well as re-establishing our skirt and dress businesses.
We recognize that we need to reposition the Coldwater Creek brand and communicate to our customer that we are changing. In this regard, our catalog is our most important vehicle to reach our customer and we are refining our creative presentations to convey this message. We are also investing in national magazine ads throughout 2011 to reach our target customers and communicate our new brand aesthetic.
We are in a transition period and it may take time for our core and target customers to respond to the changes we are making; however, we believe that these changes will position us for improved long-term performance.
Outlook
Our operating results for fiscal 2010 were negatively impacted by our fall and holiday merchandise assortments which were not well received by our customers. We expect the product acceptance challenges we experienced with our fall and holiday assortments to continue in the near-term. In addition, weakness in consumer spending persists as a result of continued uncertain macroeconomic conditions reflected in reduced incomes, high unemployment and deterioration in household net worth. We believe these conditions continue to have a negative impact on our sales, gross margin and operating performance. As long as these conditions continue, we expect that consumer spending will remain subdued. As such, we will continue our focus on expense and inventory control.
During fiscal 2010, we made significant efforts to clear excess inventory by utilizing promotional events in our stores, outlets, and on our web site. We also began offering a full-time sale section at all of our premium retail stores. For fiscal 2011, we will maintain our disciplined management of inventory levels through tighter inventory buys. As such, we expect total inventory at the end of the first quarter of fiscal 2011 to be down in the mid- to high-single digit percent range compared to our inventory level at the end of the first quarter of fiscal 2010.
We have recently seen an increase in sourcing costs such as raw materials, freight and labor. We continue to work to mitigate cost pressures by refining our sourcing strategies through vendor consolidation and material diversification, although we do not believe that it will be enough to offset the cost pressures we are facing, and we expect to pass some of these costs to consumers via select price increases. However, it will be necessary to absorb some of these cost pressures internally and, as a result, we believe our initial merchandise markups will decrease by 100 to 200 basis points for the fall 2011 assortment.
Other Developments
On January 18, 2011, we amended our Credit Agreement with Wells Fargo Retail Finance, LLC, to extend the maturity date one additional year to February 13, 2013. The major terms of the agreement and the amount available under the facility were unchanged by the amendment.
25
Results of Operations
Fiscal 2010 Compared to Fiscal 2009
Highlights of results of operations for fiscal years ended January 29, 2011 and January 30, 2010 are as follows:
| |
Fiscal Year Ended | |||||||||||||||||||
|---|---|---|---|---|---|---|---|---|---|---|---|---|---|---|---|---|---|---|---|---|
| |
January 29, 2011 |
% of net sales |
January 30, 2010 |
% of net sales |
$ change | % change | ||||||||||||||
| |
(dollars in thousands, except per share data) |
|||||||||||||||||||
Net sales: |
||||||||||||||||||||
Retail |
$ | 732,430 | 74.7 | % | $ | 782,429 | 75.3 | % | $ | (49,999 | ) | (6.4 | )% | |||||||
Direct |
248,671 | 25.3 | % | 256,152 | 24.7 | % | (7,481 | ) | (2.9 | )% | ||||||||||
|
981,101 | 100.0 | % | 1,038,581 | 100.0 | % | (57,480 | ) | (5.5 | )% | ||||||||||
Cost of sales |
673,816 | 68.7 | % | 704,300 | 67.8 | % | (30,484 | ) | (4.3 | )% | ||||||||||
Gross profit |
307,285 | 31.3 | % | 334,281 | 32.2 | % | (26,996 | ) | (8.1 | )% | ||||||||||
Selling, general and administrative expenses |
346,733 | 35.3 | % | 378,852 | 36.5 | % | (32,119 | ) | (8.5 | )% | ||||||||||
Loss on asset impairments |
3,931 | 0.4 | % | 607 | 0.1 | % | 3,324 | 547.6 | % | |||||||||||
Loss from operations |
(43,379 | ) | (4.4 | )% | (45,178 | ) | (4.3 | )% | 1,799 | (4.0 | )% | |||||||||
Interest, net and other |
(830 | ) | (0.1 | )% | (797 | ) | (0.1 | )% | (33 | ) | 4.1 | % | ||||||||
Loss before income taxes |
(44,209 | ) | (4.5 | )% | (45,975 | ) | (4.4 | )% | 1,766 | (3.8 | )% | |||||||||
Income tax provision (benefit) |
(98 | ) | (0.3 | )% | 10,157 | 1.0 | % | (10,255 | ) | * | ||||||||||
Net Loss |
$ | (44,111 | ) | (4.3 | )% | $ | (56,132 | ) | (5.4 | )% | $ | 12,021 | (21.4 | )% | ||||||
Net loss per common share—Diluted |
$ | (0.48 | ) | $ | (0.61 | ) | ||||||||||||||
Effective income tax rate |
0.2 | % | (22.1 | )% | ||||||||||||||||
- *
- Percentage comparisons for changes between positive and negative values are not considered meaningful.
Net Sales
The $50.0 million decrease in retail segment net sales for fiscal 2010 as compared with fiscal 2009 is primarily due to a decrease in comparable premium retail store sales of 8.5 percent, driven by a decline in comparable premium retail store traffic of 8.7 percent and a 0.5 percentage point decrease in comparable premium retail store conversion rate, partially offset by an increase of 1.2 percent in realized average unit retail2 and the impact of new stores.
Also contributing to the decrease in retail segment net sales during fiscal 2010 as compared with fiscal 2009 was a $0.8 million decrease in net sales from merchandise clearance outlet stores. These decreases were partially offset by increases of $1.1 million and $0.1 million in co-branded credit card program revenue and net sales from our day spas, respectively, during fiscal 2010 as compared with fiscal 2009.
- (2)
- We define average unit retail as the average price per item sold.
26
Comparable premium retail store sales by quarter are as follows:
| |
|
|
Comparable Premium Retail Store Base | ||||||||||
|---|---|---|---|---|---|---|---|---|---|---|---|---|---|
| |
Percentage increase (decrease) | ||||||||||||
| |
Fiscal 2010 | Fiscal 2009 | |||||||||||
| |
Fiscal 2010 | Fiscal 2009 | |||||||||||
Fourth Quarter |
(20.5 | )% | 8.9 | % | 351 | 315 | |||||||
Third Quarter |
(20.1 | )% | 14.4 | % | 344 | 307 | |||||||
Second Quarter |
4.8 | % | (10.2 | )% | 343 | 300 | |||||||
First Quarter |
1.0 | % | (18.6 | )% | 324 | 273 | |||||||
Direct segment net sales decreased $7.5 million or 2.9 percent during fiscal 2010 as compared to fiscal 2009. The decrease is primarily the result of a 2.6 percent decrease in average order value and a 0.6 percent decrease in order volume. We believe the decrease in our direct segment order volume is attributed to a decrease in overall consumer response to our product assortment.
Direct segment net sales were also negatively impacted by decreases of $3.6 million and $1.5 million in shipping revenue and co-branded credit card program revenue, respectively, during fiscal 2010 as compared with fiscal 2009. The decrease in shipping revenue is primarily associated with decreases in realized shipping rates and order volume, as well as an increase in free shipping promotions.
Cost of Sales/Gross Profit
The gross profit rate decreased by 0.9 percentage points during fiscal 2010 as compared to fiscal 2009. The gross profit rate was negatively impacted by deleveraging of our retail occupancy costs and higher buying and distribution costs of 0.9 percentage points and 0.7 percentage points, respectively. These decreases in gross profit rate were offset by a 0.6 percentage point increase attributable to higher initial merchandise markups, which was partially offset by increases in promotional discounts3 and our markdown4 rate. The gross margin rate was also impacted by lower shipping and handling costs of 0.1 percentage points due to lower direct sales.
Selling, General and Administrative Expenses
Selling, general and administrative expenses (SG&A) decreased $32.1 million during fiscal 2010 as compared with fiscal 2009, primarily driven by decreased employee-related expenses, marketing expenses and other fixed and variable costs. As a percentage of net sales, SG&A decreased by 1.2 percentage points in fiscal 2010 as compared with fiscal 2009. This decrease in SG&A rate was primarily the result of a 0.6 percentage point decrease in employee expenses and a 0.7 percentage point decrease in other fixed and variable costs, partially offset by deleveraging of marketing costs of 0.1 percentage points. The decrease in employee-related expenses and other fixed and variable costs as a percentage of sales is primarily the result of our continued efforts to control expenses. Employee-related expenses during fiscal 2009 included separation agreement charges of $6.0 million. The decrease in marketing expense was driven by decreased catalog circulation and magazine advertising.
Loss on Asset Impairment
During fiscal 2010, we recorded impairment charges of $3.9 million related to leasehold improvements and furniture and fixtures at certain retail store locations and certain computer software. During fiscal 2009, we recorded impairment charges of $0.6 million related to leasehold improvements and furniture and fixtures at certain premium retail store locations.
- (3)
- We define promotional discounts generally as temporary offerings. These include coupons and in-store
promotions to customers for specified dollar or percentage discounts.
- (4)
- We define markdowns generally as permanent reductions from the original selling price.
27
Loss from Operations
We evaluate the performance of our operating segments based upon segment operating income, as shown below, along with segment net sales:
| |
Fiscal Year Ended | ||||||||||||||||
|---|---|---|---|---|---|---|---|---|---|---|---|---|---|---|---|---|---|
| |
January 29, 2011 |
% of segment sales |
January 30, 2010 |
% of segment sales |
% Change | ||||||||||||
| |
(dollars in thousands) |
||||||||||||||||
Segment operating income: |
|||||||||||||||||
Retail |
$ | 27,083 | 3.7 | % | $ | 37,479 | 4.8 | % | (27.7 | )% | |||||||
Direct |
40,483 | 16.3 | % | 41,837 | 16.3 | % | (3.2 | )% | |||||||||
Segment operating income |
67,566 | 79,316 | (14.8 | )% | |||||||||||||
Unallocated corporate and other |
(110,945 | ) | (124,494 | ) | (10.9 | )% | |||||||||||
Loss from operations |
$ | (43,379 | ) | $ | (45,178 | ) | (4.0 | )% | |||||||||
Retail segment operating income rate expressed as a percentage of retail segment sales for fiscal 2010 as compared with fiscal 2009 decreased by 1.1 percentage points. Retail segment operating income was negatively impacted by deleveraging of occupancy costs, employee-related expenses and marketing expenses of 1.4, 0.7 and 0.3 percentage points, respectively. In addition, impairment charges related to leasehold improvements and furniture and fixtures at certain premium retail store locations decreased operating income by 0.4 percentage points. These decreases were offset by a 1.5 percentage point increase in merchandise margins attributable to higher merchandise markups, partially offset by increased promotional discounts. Also, reductions to other fixed and variable costs increased operating income by 0.2 percentage points.
Direct segment operating income rate expressed as a percentage of direct segment sales for fiscal 2010 as compared with fiscal 2009 remained flat. Increased clearance activity, partially offset by higher merchandise markups, resulted in a 1.5 percentage point decrease in merchandise margins. The deleveraging of marketing expenses also contributed a 0.3 percentage point decrease in operating income. These decreases in operating income were offset by a 1.2 and 0.6 percentage point decrease in employee-related expenses and other fixed and variable costs, respectively.
Corporate and other expenses decreased $13.5 million in fiscal 2010 as compared to fiscal 2009. This decrease is primarily the result of:
- •
- $5.5 million decrease in employee-related expenses;
- •
- $4.4 million decrease in corporate support costs;
- •
- $2.6 million decrease in marketing, primarily as a result of decreased national magazine advertising campaigns; and
- •
- $1.6 million decrease in occupancy costs; offset by a
- •
- $0.6 million impairment charge related to certain computer software.
Interest, Net and Other
The increase in interest, net and other for fiscal 2010 as compared with fiscal 2009 was primarily the result of an increase in interest expense on our capital lease and other financing obligations.
Provision for Income Taxes
The tax benefit of $0.1 million for fiscal 2010 primarily reflects the continuing impact of the valuation allowance against our deferred tax assets. The provision for income taxes of $10.2 million in fiscal 2009 reflects the establishment of valuation allowances for substantially all of our net deferred tax assets.
28
Fiscal 2009 Compared to Fiscal 2008
Highlights of results of operations for fiscal years ended January 30, 2010 and January 31, 2009 are as follows:
| |
Fiscal Year Ended | |||||||||||||||||||
|---|---|---|---|---|---|---|---|---|---|---|---|---|---|---|---|---|---|---|---|---|
| |
January 30, 2010 |
% of net sales |
January 31, 2009 |
% of net sales |
$ change | % change | ||||||||||||||
| |
(dollars in thousands, except per share data) |
|||||||||||||||||||
Net sales: |
||||||||||||||||||||
Retail |
$ | 782,429 | 75.3 | % | $ | 751,352 | 73.4 | % | $ | 31,077 | 4.1 | % | ||||||||
Direct |
256,152 | 24.7 | % | 272,869 | 26.6 | % | (16,717 | ) | (6.1 | )% | ||||||||||
|
1,038,581 | 100.0 | % | $ | 1,024,221 | 100.0 | % | 14,360 | 1.4 | % | ||||||||||
Cost of sales |
704,300 | 67.8 | % | 673,661 | 65.8 | % | 30,639 | 4.5 | % | |||||||||||
Gross profit |
334,281 | 32.2 | % | 350,560 | 34.2 | % | (16,279 | ) | (4.6 | )% | ||||||||||
Selling, general and administrative expenses |
378,852 | 36.5 | % | 395,320 | 38.6 | % | (16,468 | ) | (4.2 | )% | ||||||||||
Loss on asset impairments |
607 | 0.1 | % | 1,452 | 0.1 | % | (845 | ) | (58.2 | )% | ||||||||||
Loss from operations |
(45,178 | ) | (4.3 | )% | (46,212 | ) | (4.5 | )% | 1,034 | (2.2 | )% | |||||||||
Interest, net and other |
(797 | ) | (0.1 | )% | 1,508 | 0.1 | % | (2,305 | ) | * | ||||||||||
Loss before income taxes |
(45,975 | ) | (4.4 | )% | (44,704 | ) | (4.4 | )% | (1,271 | ) | 2.8 | % | ||||||||
Income tax provision (benefit) |
10,157 | 1.0 | % | (18,741 | ) | (1.8 | )% | 28,898 | * | |||||||||||
Net loss |
$ | (56,132 | ) | (5.4 | )% | $ | (25,963 | ) | (2.5 | )% | $ | (30,169 | ) | 116.2 | % | |||||
Net loss per common share—Diluted |
$ | (0.61 | ) | $ | (0.29 | ) | ||||||||||||||
Effective income tax rate |
(22.1 | )% | 41.9 | % | ||||||||||||||||
- *
- Percentage comparisons for changes between positive and negative values are not considered meaningful.
Net Sales
The $31.1 million increase in retail segment net sales for fiscal 2009 as compared with fiscal 2008 is primarily the result of the addition of eight premium retail stores and two merchandise clearance outlet stores, partially offset by the closure of one merchandise clearance outlet store and a decrease in our comparable premium retail store sales. The decrease in our comparable premium retail store sales of 1.4 percent reflects a decrease in comparable premium retail store traffic of 5.3 percent and a 7.4 percent decline in realized average unit retail, partially offset by an increase in comparable premium retail store conversion rate of 2.8 percentage points.
Also contributing to the increase in retail segment net sales during fiscal 2009 as compared with fiscal 2008 was a $6.7 million and $1.2 million increase in net sales from merchandise clearance outlet stores and co-branded credit card program revenue, respectively. These increases were partially offset by a $0.9 million decrease in net sales from our day spas during fiscal 2009 as compared with fiscal 2008.
29
Comparable premium retail store sales by quarter are as follows:
| |
|
|
Comparable Premium Retail Store Base | ||||||||||
|---|---|---|---|---|---|---|---|---|---|---|---|---|---|
| |
Percentage increase (decrease) | ||||||||||||
| |
Fiscal 2009 | Fiscal 2008 | |||||||||||
| |
Fiscal 2009 | Fiscal 2008 | |||||||||||
Fourth Quarter |
8.9 | % | (21.4 | )% | 315 | 254 | |||||||
Third Quarter |
14.4 | % | (20.5 | )% | 307 | 246 | |||||||
Second Quarter |
(10.2 | )% | (13.7 | )% | 300 | 236 | |||||||
First Quarter |
(18.6 | )% | (19.0 | )% | 273 | 211 | |||||||
Direct segment net sales decreased $16.7 million or 6.1 percent during fiscal 2009 as compared to fiscal 2008. The decrease is primarily the result of a 10.4 percent decrease in average order value. Average order value in our Internet channel and our phone and mail channel were down approximately 9.2 percent and 11.0 percent, respectively, during fiscal 2009 as compared with fiscal 2008, as a result of value pricing and increased promotional discounts, partially offset by a decrease in Internet markdowns. However, we believe that the increase of 6.3 percent in catalogs mailed during fiscal 2009 compared to fiscal 2008 had a positive impact on direct segment orders and net sales.
Direct segment net sales were also negatively impacted by a $5.5 million decrease in shipping revenue during fiscal 2009 as compared with fiscal 2008, which is primarily associated with a decrease in realized shipping rates as a result of lower average order values and increased free shipping promotions. The decrease was partially offset by a $1.5 million increase in co-branded credit card program revenue over the same period.
Cost of Sales/Gross Profit
The gross profit rate decreased by 2.0 percentage points during fiscal 2009 as compared to fiscal 2008. The decrease in our gross profit rate was primarily the result of a 1.7 percentage point decline attributable to value-pricing and an increase in promotional discounts, which were partially offset by a decrease in our markdown rate. Our gross profit rate was also negatively impacted by a deleveraging of our retail occupancy costs and higher buying and distribution costs of 0.3 percentage points and 0.1 percentage points, respectively. These decreases were offset by lower shipping and handling costs of 0.1 percentage points due to lower direct sales.
Selling, General and Administrative Expenses
SG&A decreased $16.5 million during fiscal 2009 as compared with fiscal 2008, primarily driven by decreased employee, marketing and certain overhead expenses related to our cost savings initiatives. As a percentage of net sales, SG&A decreased by 2.1 percentage points in fiscal 2009 as compared with fiscal 2008. This decrease in SG&A rate was primarily the result of a 1.3 percentage point decrease in employee expenses. Also contributing to the decrease in SG&A rate was a 0.4 percentage point decline in both marketing expenses and certain overhead costs.
Loss on Asset Impairment
During fiscal 2009, we recorded an impairment charge of $0.6 million related to leasehold improvements and furniture and fixtures at certain premium retail store locations. During fiscal 2008, we recorded an impairment charge of $1.5 million related to leasehold improvements and furniture and fixtures at certain day spa locations.
30
Loss from Operations
We evaluate the performance of our operating segments based upon segment operating income, as shown below, along with segment net sales:
| |
Fiscal Year Ended | ||||||||||||||||
|---|---|---|---|---|---|---|---|---|---|---|---|---|---|---|---|---|---|
| |
January 30, 2010 |
% of segment sales |
January 31, 2009 |
% of segment sales |
% Change | ||||||||||||
| |
(dollars in thousands) |
||||||||||||||||
Segment operating income: |
|||||||||||||||||
Retail |
$ | 37,479 | 4.8 | % | $ | 30,396 | 4.1 | % | 23.3 | % | |||||||
Direct |
41,837 | 16.3 | % | 42,108 | 15.4 | % | (0.6 | )% | |||||||||
Segment operating income |
79,316 | 72,504 | 9.4 | % | |||||||||||||
Unallocated corporate and other |
(124,494 | ) | (118,716 | ) | 4.9 | % | |||||||||||
Loss from operations |
$ | (45,178 | ) | $ | (46,212 | ) | (2.2 | )% | |||||||||
Retail segment operating income rate expressed as a percentage of retail segment sales for fiscal 2009 as compared with fiscal 2008 increased by 0.7 percentage points. The increase was primarily the result of a decrease in employee related costs and certain overhead costs, which contributed to a 2.3 and 0.5 percentage point improvement, respectively. These decreases in expenses were partially offset by a 1.2 and 0.3 percentage point increase in marketing expenses and retail occupancy costs, respectively, which includes impairment charges of $0.6 million and $1.5 million in fiscal 2009 and fiscal 2008, respectively. In addition, increased promotional discounts and value pricing, partially offset by a decrease in markdown rate, contributed to a 0.6 percentage point decline in merchandise margins.
Direct segment operating income rate expressed as a percentage of direct segment sales for fiscal 2009 as compared with fiscal 2008 increased by 0.9 percentage points. The direct segment operating income rate was positively impacted by a 5.1, 0.7 and 0.4 percentage point decrease in marketing expenses, certain overhead costs and employee related costs, respectively. Increased promotional discounting and value pricing, partially offset by a decrease in markdown rate, resulted in a 5.3 percentage point decrease in merchandise margins.
Corporate and other expenses increased $5.8 million in fiscal 2009 as compared to fiscal 2008. This increase is primarily the result of:
- •
- $2.4 million increase in marketing expenses, primarily as a result of an increase in national magazine advertising
campaigns;
- •
- $2.1 million increase in corporate support costs; and
- •
- $1.5 million increase in employee expenses, primarily consisting of a $6.0 million pre-tax
charge associated with the departure of our former CEO, offset by decreases related to a reduction in salaries and incentive compensation; offset by a
- •
- $0.2 million decrease in occupancy costs.
Interest, Net and Other
The decrease in interest, net and other for fiscal 2009 as compared with fiscal 2008 was primarily the result of lower interest income rates on our cash balances and an increase in interest expense on our capital leases.
Provision for Income Taxes
The provision for income taxes of $10.2 million in fiscal 2009 reflects the establishment of a valuation allowance for substantially all of our net deferred tax assets. During fiscal 2009, we evaluated
31
all positive and negative evidence related to our ability to utilize our deferred tax assets and recorded a valuation allowance of $24.4 million due to our three-year historical cumulative losses and recent operating losses. The income tax benefit for fiscal 2008 was the result of a pre-tax loss.
Seasonality
As with many apparel retailers, our net sales, results of operations, liquidity and cash flows have fluctuated, and will continue to fluctuate, as a result of a number of factors, including the following:
- •
- the composition, size and timing of various merchandise offerings;
- •
- the timing and number of premium retail store openings and closings;
- •
- the timing and number of promotions;
- •
- the timing and number of catalog mailings;
- •
- customer response to merchandise offerings, including the impact of economic and weather-related influences, the actions
of competitors and similar factors;
- •
- the ability to accurately estimate and accrue for merchandise returns and the costs of obsolete inventory;
- •
- market price fluctuations in critical materials and services, including paper, production, postage and telecommunications
costs;
- •
- the timing of merchandise shipping and receiving, including any delays resulting from labor strikes or slowdowns, adverse
weather conditions, health epidemics or national security measures; and
- •
- shifts in the timing of important holiday selling seasons relative to our fiscal quarters, including Valentine's Day, Easter, Mother's Day, Thanksgiving and Christmas.
Our results continue to depend materially on sales and profits from the November and December holiday shopping season. In anticipation of traditionally increased holiday sales activity, we incur certain significant incremental expenses, including the hiring of a substantial number of temporary employees to supplement our existing workforce. Additionally, as gift items and accessories are more prominently represented in the November and December holiday season merchandise offerings, we typically expect, absent offsetting factors, to realize higher consolidated gross margins and earnings in the second half of our fiscal year.
Liquidity and Capital Resources
In recent fiscal years, we financed ongoing operations and growth initiatives primarily from cash flow generated by operations and trade credit arrangements. However, as we produce catalogs, open retail stores and purchase inventory in anticipation of future sales realization, and as we experience operating cash flows and working capital fluctuations, we may occasionally need to utilize our secured credit facility.
Our credit facility with Wells Fargo Retail Finance, LLC, which is secured primarily by our inventory and credit card receivables, provides a revolving line of credit up to $70.0 million, with subfacilities for the issuance of up to $70.0 million in letters of credit and swingline advances of up to $10.0 million. The credit facility has a maturity date of February 13, 2013. The actual amount of credit that is available from time to time under the credit facility is limited to a borrowing base amount that is determined according to, among other things, a percentage of the value of eligible inventory plus a percentage of the value of eligible credit card receivables, as reduced by certain reserve amounts that may be required by the lender. The proceeds of any borrowings under the credit facility are available for working capital and other general corporate purposes. As of January 29, 2011 and January 30, 2010,
32
we had no borrowings under the credit facility. As of January 29, 2011 and January 30, 2010, we had $27.2 million and $19.5 million in letters of credit issued, respectively, resulting in $42.8 million and $50.5 million, respectively, available for borrowing under our credit facility.
The credit facility contains financial covenant requirements with respect to capital expenditures, minimum inventory book value and maximum facility usage as a percentage of the borrowing base value. The credit facility also contains various restrictive covenants relating to, among other things, indebtedness, liens, investments, acquisitions, mergers, dispositions and dividends. We were in compliance with all covenants for all periods presented.
The credit facility generally contains customary events of default for credit facilities of this type. Upon an event of default that is not cured or waived within any applicable cure periods, in addition to other remedies that may be available to the lender, the obligations under the credit facility may be accelerated, outstanding letters of credit may be required to be cash collateralized and remedies may be exercised against the collateral.
Net cash used in operating activities was $1.0 million during fiscal 2010 compared to net cash provided by operating activities of $24.6 million and $95.5 million during fiscal years 2009 and 2008, respectively.
The $25.6 million decrease in cash flows from operating activities during fiscal 2010 as compared with fiscal 2009 resulted primarily from decreased net sales and gross margins as well as a decrease in tax refunds received of $8.5 million. We also experienced decreases of $6.3 million and $3.2 million in cash collected on tenant allowances and fees collected from the co-branded credit card program, respectively. These decreases were offset by lower operating expenses. In addition, we made a cash severance payment of $2.0 million to our former CEO during fiscal 2009.
The $70.9 million decrease in cash flows from operating activities in fiscal 2009 from 2008 resulted primarily from decreased gross margins and increased payments on inventory purchases. We also experienced a decrease in cash collected on tenant allowances of $27.0 million as total cash collected on tenant allowances was $9.6 million during fiscal 2009 as compared to $36.6 million during fiscal 2008. In addition, we made a cash severance payment of $2.0 million to our former CEO and we experienced a $1.2 million decrease in interest income collected during fiscal 2009. These decreases were offset by lower operating expenses, reduced marketing costs and an increase of $3.6 million in fees collected from the co-branded credit card program, which includes a $6.5 million payment received related to the revenue sharing component of our co-branded credit card program and a $6.5 million increase in tax refunds received.
Cash outflows from investing activities principally consisted of capital expenditures which totaled $31.1 million, $21.7 million and $81.2 million during fiscal 2010, fiscal 2009 and fiscal 2008, respectively. Capital expenditures in fiscal 2010 primarily related to leasehold improvements and furniture and fixtures associated with the opening of 19 additional premium retail stores, four merchandise clearance outlet stores and to a lesser extent the remodeling of certain existing stores and the expansion of our IT infrastructure. Capital expenditures in fiscal 2009 primarily related to leasehold improvements and furniture and fixtures associated with the opening of eight additional premium retail stores, two merchandise clearance outlet stores, two premium retail stores under construction, the remodeling of certain existing stores, the relocation of our New York design office, and the expansion of our IT and distribution infrastructure. Capital expenditures in fiscal 2008 primarily related to leasehold improvements and furniture and fixtures associated with the opening of 42 additional premium retail stores, five merchandise clearance outlet stores and four premium retail stores under construction; and to a lesser extent the remodeling of certain existing stores, and the expansion of our IT and distribution infrastructure. Cash outflows for fiscal 2010, fiscal 2009 and fiscal 2008 were offset by cash inflows of $0.1 million, $0.1 million and $3.1 million, respectively, related to the proceeds from the sale of certain assets.
33
Cash outflows from financing activities were $1.9 million during fiscal 2010 compared to $0.5 million during fiscal 2009 and cash inflows from financing activities of $0.5 million for fiscal 2008. During fiscal 2010, cash outflows of $2.9 million related to payments on capital lease and other financing obligations along with tax withholding payments made on restricted stock units were offset by $0.9 million in cash inflows related to proceeds from stock option exercises and the purchase of shares under our employee stock purchase plan. During fiscal 2009, cash outflows of $3.1 million related to costs associated with our new credit facility, tax withholding payments made on restricted stock units, and payments made on our capital lease and other financing obligations were offset by $2.6 million in cash inflows related to proceeds we received from stock option exercises, the purchase of shares under our employee stock purchase plan and tax benefits related to the exercise of stock options. During fiscal 2008, cash inflows of $1.6 million related to stock option exercises, purchases of shares under our employee stock purchase plan and tax benefits related to the exercise of stock options were offset by $1.1 million in cash outflows related to payments on our capital lease and other financing obligations and tax withholding payments made on restricted stock units.
As a result of the foregoing, we had $81.8 million in working capital at January 29, 2011, compared with $98.9 million in working capital at January 30, 2010. Our current ratio was 1.50 at January 29, 2011 compared with 1.53 at January 30, 2010.
We plan to limit new store openings in fiscal 2011 to five stores to which we have previously committed and to close between eight and 12 stores. As a result, our capital expenditures in 2011 will be substantially lower than our capital expenditures in fiscal 2010. Capital expenditures for the full year in fiscal 2011 are expected to be between $9.0 million and $12.0 million.
We do not anticipate borrowing under our credit facility during fiscal 2011 as we believe cash flow from operations and current cash on hand will be sufficient to fund current needs. However, lower than expected sales or lower merchandise margins that negatively impact our cash flows could require us to borrow under our credit facility. It is also possible that should we need to access our credit facility, it may not be available in full, or at all, for future borrowings, due to borrowing base and other limitations.
Off-Balance Sheet Liabilities and Other Contractual Obligations
We do not have any off-balance sheet arrangements as defined by Item 303(a)(4) of Regulation S-K.
The following tables summarize our minimum contractual commitments and commercial obligations as of January 29, 2011:
| |
Payments Due in Fiscal Year | ||||||||||||||||
|---|---|---|---|---|---|---|---|---|---|---|---|---|---|---|---|---|---|
| |
Total | 2011 | 2012-2013 | 2014-2015 | Thereafter | ||||||||||||
| |
(in thousands) |
||||||||||||||||
Contractual Obligations |
|||||||||||||||||
Operating leases(a)(c) |
$ | 567,164 | $ | 82,694 | $ | 152,040 | $ | 132,414 | $ | 200,016 | |||||||
Contractual commitments(b) |
163,518 | 154,773 | 8,745 | — | — | ||||||||||||
Capital leases(c) |
24,778 | 1,366 | 2,872 | 2,386 | 18,154 | ||||||||||||
Other long-term liabilities(d) |
12,367 | 606 | 1,417 | 1,036 | 9,308 | ||||||||||||
Total |
$ | 767,827 | $ | 239,439 | $ | 165,074 | $ | 135,836 | $ | 227,478 | |||||||
- (a)
- We have a significant operating lease for our 960,000 square foot distribution center and customer contact center located in Mineral Wells, West Virginia, with a remaining lease commitment as of January 29, 2011 of $64.1 million. All other operating leases primarily pertain to retail and outlet stores, day spas and various equipment. Certain store leases have provisions to adjust the payment based on certain criteria, for example additional rent for our store sales above a specified minimum or less rent based on landlord vacancy rates below a specified minimum. The operating lease obligations noted
34
above do not include any of these adjustments or payments made for maintenance, insurance and real estate taxes. Several lease agreements provide renewal options or allow for termination rights under certain circumstances. Future operating lease obligations would change if these renewal options or termination rights were exercised.
- (b)
- Contractual
commitments include commitments to purchase inventory of $162.2 million and capital expenditures of $1.3 million. The timing of
the payments is subject to change based upon actual receipt of the inventory or capital asset and the terms of payment with the vendor.
- (c)
- The
primary capital lease is for our 69,000 square foot facility located in Coeur d'Alene, Idaho, which functions as a customer contact center, IT data
center, and office space. This lease was amended on April 22, 2009 resulting in the lease classified as a capital lease through fiscal 2028, with a remaining lease commitment as of
January 29, 2011 of $19.8 million, and as an operating lease from fiscal 2029 through fiscal 2038, with a remaining lease commitment as of January 29, 2011 of
$16.3 million. All other capital leases pertain to various technology equipment and other real estate. The capital lease obligations represent the minimum payments including principal and
interest, and excluding maintenance, insurance and real estate taxes.
- (d)
- Other long-term liabilities primarily include amounts representing obligations under our Supplemental Employee Retirement Plan of $10.2 million. The timing of cash flows associated with these obligations is subject to change based upon circumstances not necessarily within our control.
Unrecognized tax benefits as of January 29, 2011 of $2.4 million are expected to be resolved within the next 12 months but are not included in the contractual obligations table presented above because the timing of the settlement of unrecognized tax benefits cannot be fully determined.
Critical Accounting Policies and Estimates
Preparation of our consolidated financial statements requires management to make estimates and assumptions that affect the reported amount of assets, liabilities, revenues and expenses. Note 2 to our consolidated financial statements describes the significant accounting policies used in the preparation of our consolidated financial statements. Management believes the most complex and sensitive judgments, because of the significance to our consolidated financial statements, result primarily from the need to make estimates about effects of matters that are inherently uncertain. The most significant areas involving management judgments are described below. Actual results in these areas could differ from management's estimates.
Sales Returns
We recognize sales and the related cost of sales for our direct segment at the time the merchandise is expected to be delivered to our customer and for our retail segment at the point of sale with a customer in a store. We reduce our sales and costs of sales and establish an accrual for expected sales returns based on historical experience and future expectations. The ability to reasonably estimate sales returns is made more complex by the fact that we offer our customers a return policy whereby they may return merchandise for any reason and at any time without any restrictions as to condition or time of purchase to any of our locations. The actual amount of sales returns we subsequently realize may fluctuate from estimates due to several factors, including size and fit, merchandise mix, actual or perceived quality, differences between the actual product and its presentation in the catalog or web site, timeliness of delivery and competitive offerings. We continually track subsequent sales return experience, compile customer feedback to identify any pervasive issues, reassess the marketplace,
35
compare our findings to previous estimates and adjust the sales return accrual and cost of sales accordingly. Provisions for sales returns were as follows:
| |
Fiscal Year Ended | |||||||||
|---|---|---|---|---|---|---|---|---|---|---|
| |
January 29, 2011 |
January 30, 2010 |
January 31, 2009 |
|||||||
| |
(in thousands) |
|||||||||
Balance at beginning of period |
$ | 4,365 | $ | 4,295 | $ | 7,177 | ||||
Additions charged to income |
77,475 | 81,100 | 106,044 | |||||||
Deductions for actual returns |
(77,337 | ) | (80,020 | ) | (106,952 | ) | ||||
Adjustments recorded to income |
(1,120 | ) | (1,010 | ) | (1,974 | ) | ||||
Balance at end of period |
$ | 3,383 | $ | 4,365 | $ | 4,295 | ||||
Inventory Reserves
Our inventories consist of merchandise purchased for resale and are recorded at the lower of cost or market. The nature of our business requires that we make substantially all of our merchandising and marketing decisions and corresponding inventory purchase commitments with vendors several months in advance of the time in which a particular merchandise item is intended to be included in the merchandise offerings. These decisions and commitments are based upon, among other possible considerations, historical sales with identical or similar merchandise, our understanding of then-prevailing fashion trends and influences, and an assessment of likely economic conditions and various competitive factors. We continually make assessments as to whether the carrying cost of inventory exceeds its market value, and, if so, by what dollar amount. To determine whether inventory should be written down we consider current and anticipated demand and customer preferences in addition to the current and future estimated selling price. The carrying value of the inventory is reduced to its net realizable value with a corresponding charge to cost of sales. Actual results may differ from our estimates if we are required to markdown or discount merchandise beyond our current expectations. For slow moving or obsolete inventory marked down to net realizable value, a one percentage point increase in our reserve at January 29, 2011 would have affected net loss by less than $0.5 million.
We estimate our physical inventory losses that have occurred since our last physical inventory date by applying the most recent average physical inventory loss experience. We do not believe there is a reasonable likelihood that there will be a material change in the future estimates or assumptions we use to calculate our inventory loss reserve. However, if our estimates regarding physical inventory losses are inaccurate, we may be exposed to losses or gains that could be material.
Stock-Based Compensation
The calculation of stock-based compensation expense requires us to expense the fair value of equity awards over the requisite employee service period, which is generally the vesting period. Calculating the fair value of stock options on the date of grant requires judgment, including estimating the expected life of the award, the expected stock price volatility over the expected life and pre-vesting forfeitures. Our expected stock price volatility assumption is based upon a combination of both the implied and historical volatilities of our stock which is obtained from public data sources. The expected life represents the weighted average period of time that stock options are expected to be outstanding, giving consideration to vesting schedules and historical exercise patterns. If expected volatility or expected life were to increase, that would result in an increase in the fair value of our stock options resulting in higher compensation charges, while a decrease in expected volatility or expected life would result in a lower fair value of our stock options resulting in lower compensation charges. We also grant various restricted stock units which are generally less subjective in determining fair value as the fair
36
value of these awards is based primarily upon the fair market value of our common stock on the date of grant. We estimate forfeitures for all of our equity awards based upon historical experience, and only recognize expense for those awards expected to vest. We revise our estimated forfeitures in subsequent periods, when necessary, if actual forfeitures vary from those originally estimated. We believe that our estimates are based upon outcomes that are reasonably likely to occur. If actual forfeitures vary from our estimates, compensation expense would vary from what we record in the current and prior fiscal years. Total stock-based compensation expense during fiscal 2010, 2009 and 2008 was $2.5 million, $6.7 million and $4.8 million, respectively.
Impairment of Long-Lived Assets
Long-lived assets are subject to a review for impairment if events or changes in circumstances indicate that the carrying amount of the asset may not be recoverable. If the sum of the expected future undiscounted cash flows generated by an asset or asset group is less than its carrying amount, we then determine the fair value of the asset generally by using a discounted cash flow model. A loss is recognized, if any, equal to the amount by which the carrying amount of the asset or asset group exceeds the fair value. In assessing future cash flows, management is required to make assumptions and judgments, including forecasting future sales, margins and operating expenses over the estimated remaining useful life. These assumptions and judgments can be affected by consumer spending and overall economic conditions on a localized or regional basis, as well as other factors not necessarily within our control.
During fiscal 2010, we experienced a decrease in consumer spending and low traffic levels which had a negative impact on our revenue, gross margins, operating cash flows and earnings, resulting in our need to evaluate certain asset groups for impairment. During fiscal 2010, we recorded impairment charges of $3.9 million related to the long-lived assets of certain premium retail stores, day spas and other computer software. A decrease in our expected future cash flows of 15 percent throughout the forecast period would have increased our fiscal 2010 store impairment charges by less than $0.5 million. During fiscal 2009 and 2008, we recorded impairment charges of $0.6 million and $1.5 million, respectively, related to the long-lived assets at certain retail stores. If consumer spending on apparel and accessories remains subdued with low demand for our product, it is possible that we could record additional impairments of certain long-lived assets in the future.
Contingent Liabilities
An estimated loss from a contingency is charged to income if it is probable that an asset had been impaired or a liability had been incurred at the date of the financial statements and the amount of the loss can be reasonably estimated. Gain contingencies are not recorded until realized.
We are involved in litigation and administrative proceedings arising in the normal course of our business. Actions filed against us from time to time include commercial, intellectual property infringement, customer and employment claims, including class action lawsuits alleging that we violated federal and state wage and hour and other laws. The assessment of the outcome of litigation can be very difficult to predict as it is subject to many factors, including those not within our control, and is highly dependent on individual facts and circumstances. Litigation is subject to highly complex legal processes and the final outcome of these matters could vary significantly from the amounts that have been recorded in the financial statements.
Income Taxes
Deferred tax assets and liabilities are recognized for the future tax consequences attributable to differences between the financial statement carrying amounts of existing assets and liabilities and
37
respective tax bases, as measured by enacted tax rates that are expected to be in effect in the periods where deferred tax assets and liabilities are expected to be realized or settled.
Assessing the realizability of deferred tax assets requires significant judgment. We consider all available evidence to determine whether it is more likely than not that some portion or all of the deferred tax assets will not be realized. The ultimate realization of deferred tax assets is dependent upon the generation of future taxable income during the periods in which those temporary differences become realizable. In making such judgments, significant weight is given to evidence that can be objectively verified. Current or previous losses are given more weight than projected future performance. Consequently, based on all available evidence, in particular our three-year historical cumulative losses and recent operating losses, we have a valuation allowance against a significant portion of our net deferred tax assets. When the results of our operations demonstrate a sustained level of taxable income it may become more likely than not that all or a part of the net deferred tax assets will be realized which could result in the reduction of the valuation allowance. The determination of when to reduce a valuation allowance requires significant judgment by management in determining the appropriate level of evidence to objectively support the realization of the net deferred tax assets.
The valuation allowance activity on net deferred tax assets was as follows:
| |
Fiscal Year Ended | |||||||||
|---|---|---|---|---|---|---|---|---|---|---|
| |
January 29, 2011 |
January 30, 2010 |
January 31, 2009 |
|||||||
| |
(in thousands) |
|||||||||
Balance at beginning of period |
$ | 24,523 | $ | 19 | $ | — | ||||
Net additions charged to income tax expense |
17,393 | 24,403 | 19 | |||||||
Other adjustments to comprehensive income |
— | 101 | — | |||||||
Balance at end of period |
$ | 41,916 | $ | 24,523 | $ | 19 | ||||
Recently Issued Accounting Standards
See Note 2 to our consolidated financial statements.
Item 7A. QUANTITATIVE AND QUALITATIVE DISCLOSURES ABOUT MARKET RISK
We have not been materially impacted by fluctuations in foreign currency exchange rates as substantially all of our business is transacted in U.S. dollars or U.S. dollar-based currencies. As of January 29, 2011, we did not have borrowings under our credit facility and, consequently, did not have any material exposure to interest rate market risks during or at the end of this period. However, as any future borrowings under our amended and restated bank credit facility will be at a variable rate of interest, we could potentially be materially adversely impacted should we require significant borrowings in the future, particularly during a period of rising interest rates. We have not used, and currently do not anticipate using, any derivative financial instruments.
38
ITEM 8. CONSOLIDATED FINANCIAL STATEMENTS AND SUPPLEMENTARY DATA
INDEX TO THE CONSOLIDATED FINANCIAL STATEMENTS
39
REPORT OF INDEPENDENT REGISTERED PUBLIC ACCOUNTING FIRM
To
the Board of Directors and Stockholders of
Coldwater Creek Inc.
Sandpoint, Idaho
We have audited the accompanying consolidated balance sheets of Coldwater Creek Inc. and subsidiaries (the "Company") as of January 29, 2011 and January 30, 2010, and the related consolidated statements of operations, stockholders' equity, and cash flows for each of the three years in the period ended January 29, 2011. These financial statements are the responsibility of the Company's management. Our responsibility is to express an opinion on these financial statements based on our audits.
We conducted our audits in accordance with the standards of the Public Company Accounting Oversight Board (United States). Those standards require that we plan and perform the audit to obtain reasonable assurance about whether the financial statements are free of material misstatement. An audit includes examining, on a test basis, evidence supporting the amounts and disclosures in the financial statements. An audit also includes assessing the accounting principles used and significant estimates made by management, as well as evaluating the overall financial statement presentation. We believe that our audits provide a reasonable basis for our opinion.
In our opinion, such consolidated financial statements present fairly, in all material respects, the financial position of Coldwater Creek Inc. and subsidiaries as of January 29, 2011 and January 30, 2010, and the results of their operations and their cash flows for each of the three years in the period ended January 29, 2011, in conformity with accounting principles generally accepted in the United States of America.
We have also audited, in accordance with the standards of the Public Company Accounting Oversight Board (United States), the Company's internal control over financial reporting as of January 29, 2011, based on the criteria established in Internal Control—Integrated Framework issued by the Committee of Sponsoring Organizations of the Treadway Commission and our report dated March 25, 2011 expressed an unqualified opinion on the Company's internal control over financial reporting.
/s/ Deloitte & Touche LLP
Boise,
Idaho
March 25, 2011
40
COLDWATER CREEK INC. AND SUBSIDIARIES
CONSOLIDATED BALANCE SHEETS
(in thousands, except for per share data)
| |
January 29, 2011 |
January 30, 2010 |
|||||||
|---|---|---|---|---|---|---|---|---|---|
ASSETS |
|||||||||
CURRENT ASSETS: |
|||||||||
Cash and cash equivalents |
$ | 51,613 | $ | 84,650 | |||||
Receivables |
9,561 | 5,977 | |||||||
Inventories |
156,481 | 161,546 | |||||||
Prepaid and other |
12,217 | 9,385 | |||||||
Income taxes recoverable |
1,489 | 12,074 | |||||||
Prepaid and deferred marketing costs |
6,902 | 5,867 | |||||||
Deferred income taxes |
6,029 | 6,938 | |||||||
Total current assets |
244,292 | 286,437 | |||||||
Property and equipment, net |
259,349 | 295,012 | |||||||
Deferred income taxes |
1,915 | — | |||||||
Restricted cash |
— | 890 | |||||||
Other |
1,167 | 1,184 | |||||||
Total assets |
$ | 506,723 | $ | 583,523 | |||||
LIABILITIES AND STOCKHOLDERS' EQUITY |
|||||||||
CURRENT LIABILITIES: |
|||||||||
Accounts payable |
$ | 76,354 | $ | 99,234 | |||||
Accrued liabilities |
81,605 | 83,103 | |||||||
Current deferred marketing fees and revenue sharing |
4,487 | 5,215 | |||||||
Total current liabilities |
162,446 | 187,552 | |||||||
Deferred rents |
116,875 | 125,337 | |||||||
Capital lease obligations |
12,241 | 11,454 | |||||||
Supplemental Employee Retirement Plan |
10,013 | 9,202 | |||||||
Deferred marketing fees and revenue sharing |
5,822 | 7,149 | |||||||
Deferred income taxes |
5,524 | 6,621 | |||||||
Other |
793 | 647 | |||||||
Total liabilities |
313,714 | 347,962 | |||||||
Commitments and contingencies |
|||||||||
STOCKHOLDERS' EQUITY: |
|||||||||
Preferred stock, $.01 par value, 1,000 shares authorized, none issued and outstanding |
— | — | |||||||
Common stock, $.01 par value, 300,000 shares authorized, 92,503 and 92,164 shares issued, respectively |
925 | 922 | |||||||
Additional paid-in capital |
125,795 | 124,148 | |||||||
Accumulated other comprehensive loss |
(464 | ) | (373 | ) | |||||
Retained earnings |
66,753 | 110,864 | |||||||
Total stockholders' equity |
193,009 | 235,561 | |||||||
Total liabilities and stockholders' equity |
$ | 506,723 | $ | 583,523 | |||||
The accompanying notes are an integral part of these consolidated financial statements.
41
COLDWATER CREEK INC. AND SUBSIDIARIES
CONSOLIDATED STATEMENTS OF OPERATIONS
(in thousands except for per share data)
| |
Fiscal Year Ended | ||||||||||
|---|---|---|---|---|---|---|---|---|---|---|---|
| |
January 29, 2011 |
January 30, 2010 |
January 31, 2009 |
||||||||
Net sales |
$ | 981,101 | $ | 1,038,581 | $ | 1,024,221 | |||||
Cost of sales |
673,816 | 704,300 | 673,661 | ||||||||
Gross profit |
307,285 | 334,281 | 350,560 | ||||||||
Selling, general and administrative expenses |
346,733 | 378,852 | 395,320 | ||||||||
Loss on asset impairments |
3,931 | 607 | 1,452 | ||||||||
Loss from operations |
(43,379 | ) | (45,178 | ) | (46,212 | ) | |||||
Interest, net, and other |
(830 | ) | (797 | ) | 1,508 | ||||||
Loss before income taxes |
(44,209 | ) | (45,975 | ) | (44,704 | ) | |||||
Income tax provision (benefit) |
(98 | ) | 10,157 | (18,741 | ) | ||||||
Net loss |
(44,111 | ) | $ | (56,132 | ) | $ | (25,963 | ) | |||
Net loss per share—Basic and Diluted |
$ | (0.48 | ) | $ | (0.61 | ) | $ | (0.29 | ) | ||
Weighted average shares outstanding—Basic and Diluted |
92,316 | 91,597 | 91,037 | ||||||||
The accompanying notes are an integral part of these consolidated financial statements.
42
COLDWATER CREEK INC. AND SUBSIDIARIES
CONSOLIDATED STATEMENTS OF STOCKHOLDERS' EQUITY
(in thousands)
| |
Common Stock | |
Accumulated Other Comprehensive Loss |
|
|
||||||||||||||
|---|---|---|---|---|---|---|---|---|---|---|---|---|---|---|---|---|---|---|---|
| |
Additional Paid-in Capital |
Retained Earnings |
|
||||||||||||||||
| |
Shares | Par Value | Total | ||||||||||||||||
Balance at February 2, 2008 |
90,797 | $ | 908 | $ | 110,010 | $ | (2,014 | ) | $ | 192,959 | $ | 301,863 | |||||||
Net loss |
— | — | — | — | (25,963 | ) | (25,963 | ) | |||||||||||
Supplemental Employee Retirement Plan liability adjustment, net of tax of $435 |
— | — | — | 680 | — | 680 | |||||||||||||
Comprehensive loss |
(25,283 | ) | |||||||||||||||||
Net proceeds from exercise of stock options |
194 | 2 | 568 | — | — | 570 | |||||||||||||
Tax deficiency from exercise of stock options |
— | — | (181 | ) | — | — | (181 | ) | |||||||||||
Issuance of shares under the employee stock purchase plan |
216 | 2 | 907 | — | — | 909 | |||||||||||||
Tax withholding payments |
— | — | (161 | ) | — | — | (161 | ) | |||||||||||
Stock-based compensation |
58 | 1 | 4,778 | — | — | 4,779 | |||||||||||||
Balance at January 31, 2009 |
91,265 | $ | 913 | $ | 115,921 | $ | (1,334 | ) | $ | 166,996 | $ | 282,496 | |||||||
Net loss |
— | — | — | — | (56,132 | ) | (56,132 | ) | |||||||||||
Supplemental Employee Retirement Plan liability adjustment, net of tax of $780 |
— | — | — | 961 | — | 961 | |||||||||||||
Comprehensive loss |
(55,171 | ) | |||||||||||||||||
Net proceeds from exercise of stock options |
553 | 5 | 1,315 | — | — | 1,320 | |||||||||||||
Excess tax benefit from exercise of stock options |
— | — | 295 | — | — | 295 | |||||||||||||
Issuance of shares under the employee stock purchase plan |
151 | 2 | 676 | — | — | 678 | |||||||||||||
Tax withholding payments |
— | — | (775 | ) | — | — | (775 | ) | |||||||||||
Stock-based compensation |
195 | 2 | 6,716 | — | — | 6,718 | |||||||||||||
Balance at January 30, 2010 |
92,164 | $ | 922 | $ | 124,148 | $ | (373 | ) | $ | 110,864 | $ | 235,561 | |||||||
Net loss |
— | — | — | — | (44,111 | ) | (44,111 | ) | |||||||||||
Supplemental Employee Retirement Plan liability adjustment, net of tax of $0 |
— | — | — | (91 | ) | — | (91 | ) | |||||||||||
Comprehensive loss |
(44,202 | ) | |||||||||||||||||
Net proceeds from exercise of stock options |
126 | 1 | 363 | — | — | 364 | |||||||||||||
Issuance of shares under the employee stock purchase plan |
142 | 1 | 563 | — | — | 564 | |||||||||||||
Tax withholding payments |
— | — | (93 | ) | — | — | (93 | ) | |||||||||||
Reduction in valuation allowance from shortfall in stock-based compensation |
— | — | (1,661 | ) | — | — | (1,661 | ) | |||||||||||
Stock-based compensation |
71 | 1 | 2,475 | — | — | 2,476 | |||||||||||||
Balance at January 29, 2011 |
92,503 | $ | 925 | $ | 125,795 | $ | (464 | ) | $ | 66,753 | $ | 193,009 | |||||||
The accompanying notes are an integral part of these consolidated financial statements.
43
COLDWATER CREEK INC. AND SUBSIDIARIES
CONSOLIDATED STATEMENTS OF CASH FLOWS
(in thousands)
| |
Fiscal Year Ended | ||||||||||||
|---|---|---|---|---|---|---|---|---|---|---|---|---|---|
| |
January 29, 2011 |
January 30, 2010 |
January 31, 2009 |
||||||||||
OPERATING ACTIVITIES: |
|||||||||||||
Net loss |
$ | (44,111 | ) | $ | (56,132 | ) | $ | (25,963 | ) | ||||
Adjustments to reconcile net loss to net cash (used in) provided by operating activities: |
|||||||||||||
Depreciation and amortization |
63,329 | 63,721 | 61,811 | ||||||||||
Stock-based compensation expense |
2,476 | 6,718 | 4,779 | ||||||||||
Supplemental Employee Retirement Plan expense |
886 | 3,011 | 1,293 | ||||||||||
Deferred income taxes |
(1,200 | ) | 22,169 | (8,930 | ) | ||||||||
Valuation allowance adjustments |
(2,564 | ) | — | — | |||||||||
Excess tax benefit from exercises of stock options |
— | (650 | ) | (82 | ) | ||||||||
Net loss on asset dispositions |
447 | 1,120 | 405 | ||||||||||
Loss on asset impairments |
3,931 | 607 | 1,452 | ||||||||||
Other |
18 | 211 | 318 | ||||||||||
Net change in current assets and liabilities: |
|||||||||||||
Receivables |
(3,584 | ) | 10,014 | 12,529 | |||||||||
Inventories |
5,065 | (26,170 | ) | 4,617 | |||||||||
Prepaid and other and income taxes recoverable |
8,203 | 5,072 | 6,199 | ||||||||||
Prepaid and deferred marketing costs |
(1,035 | ) | (506 | ) | 8,301 | ||||||||
Accounts payable |
(21,776 | ) | 6,177 | 23,126 | |||||||||
Accrued liabilities |
(1,236 | ) | (276 | ) | (7,472 | ) | |||||||
Change in deferred marketing fees and revenue sharing |
(2,055 | ) | 1,623 | (1,575 | ) | ||||||||
Change in deferred rents |
(7,249 | ) | (11,285 | ) | 16,353 | ||||||||
Other changes in non-current assets and liabilities |
(534 | ) | (799 | ) | (1,628 | ) | |||||||
Net cash (used in) provided by operating activities |
(989 | ) | 24,625 | 95,533 | |||||||||
INVESTING ACTIVITIES: |
|||||||||||||
Purchase of property and equipment |
(31,084 | ) | (21,681 | ) | (81,215 | ) | |||||||
Proceeds from asset dispositions |
73 | 58 | 3,086 | ||||||||||
Change in restricted cash |
890 | 886 | 888 | ||||||||||
Net cash used in investing activities |
(30,121 | ) | (20,737 | ) | (77,241 | ) | |||||||
FINANCING ACTIVITIES: |
|||||||||||||
Net proceeds from exercises of stock options and ESPP purchases |
928 | 1,998 | 1,479 | ||||||||||
Excess tax benefit from exercises of stock options |
— | 650 | 82 | ||||||||||
Payments on capital lease and other financing obligations |
(2,762 | ) | (1,723 | ) | (941 | ) | |||||||
Tax withholding payments |
(93 | ) | (775 | ) | (161 | ) | |||||||
Credit facility financing costs |
— | (618 | ) | — | |||||||||
Net cash (used in) provided by financing activities |
(1,927 | ) | (468 | ) | 459 | ||||||||
Net (decrease) increase in cash and cash equivalents |
(33,037 | ) | 3,420 | 18,751 | |||||||||
Cash and cash equivalents, beginning |
84,650 | 81,230 | 62,479 | ||||||||||
Cash and cash equivalents, ending |
$ | 51,613 | $ | 84,650 | $ | 81,230 | |||||||
NON-CASH INVESTING AND FINANCING ACTIVITIES: |
|||||||||||||
Property and equipment purchases not yet paid |
$ | 540 | $ | 1,644 | $ | 1,938 | |||||||
Financing of other assets |
742 | 552 | 541 | ||||||||||
Reclassification of restricted cash from long-term assets to current assets |
890 | 886 | 888 | ||||||||||
Capital leases |
1,205 | — | — | ||||||||||
SUPPLEMENTAL CASH FLOW DATA: |
|||||||||||||
Cash paid for interest, net of amount capitalized |
$ | 1,817 | $ | 1,515 | $ | 634 | |||||||
Cash refunded for income taxes, net |
7,261 | 15,806 | 9,310 | ||||||||||
The accompanying notes are an integral part of these consolidated financial statements.
44
COLDWATER CREEK INC. AND SUBSIDIARIES
NOTES TO THE CONSOLIDATED FINANCIAL STATEMENTS
1. Nature of Business and Organizational Structure
Coldwater Creek Inc., a Delaware corporation, together with its wholly-owned subsidiaries, headquartered in Sandpoint, Idaho, is a multi-channel specialty retailer of women's apparel, accessories, jewelry and gift items. We operate in two operating segments: retail and direct. The retail segment consists of our premium retail stores, merchandise clearance outlet stores and day spas. The direct segment consists of sales generated through our e-commerce web site and from orders taken from customers over the phone and through the mail.
2. Significant Accounting Policies
Principles of Consolidation
The consolidated financial statements include the accounts of the Company and its wholly-owned subsidiaries. Intercompany balances and transactions have been eliminated.
Fiscal Periods
References to a fiscal year refer to the calendar year in which the fiscal year commences. Our fiscal year ends on the Saturday nearest January 31st. This reporting schedule is followed by many national retail companies. This floating fiscal year-end typically results in 13-week fiscal quarters and a 52-week fiscal year, but occasionally will contain an additional week resulting in a 14-week fiscal fourth quarter and a 53-week fiscal year. The fiscal years ended January 29, 2011 (fiscal 2010), January 30, 2010 (fiscal 2009) and January 31, 2009 (fiscal 2008) consisted of 52 weeks.
Use of Estimates
The preparation of consolidated financial statements in conformity with accounting principles generally accepted in the United States requires management to make estimates and assumptions that affect the reported amounts and timing of revenue and expenses, the reported amounts and classification of assets and liabilities, and the disclosure of contingent assets and liabilities. These estimates and assumptions are embodied in our sales returns accrual, stock-based compensation, contingent liabilities, income taxes, impairment of long-lived assets, and our inventory reserves calculations. These estimates and assumptions are based on historical results as well as management's future expectations. Actual results may vary from these estimates and assumptions.
Revenue Recognition and Sales Return Estimate
We recognize sales, including shipping and handling income and the related cost of those sales at the time of estimated receipt by the customer for orders placed from a catalog or on our e-commerce web site and at the point of sale for retail store transactions. We exclude the related sales tax from revenue as sales tax amounts are recorded on a net basis. We maintain a sales return accrual based on historical experience and future expectations.
45
COLDWATER CREEK INC. AND SUBSIDIARIES
NOTES TO THE CONSOLIDATED FINANCIAL STATEMENTS (Continued)
2. Significant Accounting Policies (Continued)
Provisions for sales returns (included in accrued liabilities) were as follows:
| |
Fiscal Year Ended | |||||||||
|---|---|---|---|---|---|---|---|---|---|---|
| |
January 29, 2011 |
January 30, 2010 |
January 31, 2009 |
|||||||
| |
(in thousands) |
|||||||||
Balance at beginning of period |
$ | 4,365 | $ | 4,295 | $ | 7,177 | ||||
Additions charged to income |
77,475 | 81,100 | 106,044 | |||||||
Deductions for actual returns |
(77,337 | ) | (80,020 | ) | (106,952 | ) | ||||
Adjustments recorded to income |
(1,120 | ) | (1,010 | ) | (1,974 | ) | ||||
Balance at end of period |
$ | 3,383 | $ | 4,365 | $ | 4,295 | ||||
Gift certificates and cards. Our policy regarding gift certificates and gift cards is to record revenue as certificates and cards are redeemed for merchandise or when the probability of redemption is remote. We also remit gift certificates and gift cards to the appropriate government agency under applicable unclaimed property laws. Prior to these events, amounts received from the sale of gift certificates and gift cards are recorded as a liability. Income on unredeemed gift cards and gift certificates was $0.5 million, $0.6 million, and $0.4 million in fiscal 2010, 2009 and 2008, respectively.
Co-branded credit card. Under our co-branded customer credit card program, we receive from the issuing bank a non-refundable up-front marketing fee for each new credit card account that is opened and activated. The initial up-front marketing fee is deferred and recognized into revenue over the estimated customer relationship period. We are also eligible to receive an annual revenue sharing payment if certain profitability measures of the program are met. The revenue sharing payment we receive annually, if any, is deferred and recognized into revenue over the remaining expected life of the co-branded credit card program. In addition, we receive an ongoing sales royalty which is based on a percentage of purchases made by the card holders. Cardholders receive reward coupons from their credit card purchases that can be used to purchase our merchandise. The sales royalty is deferred and subsequently recognized as revenue over the redemption period of the reward coupons, adjusted for that portion of awards that we estimate will not be redeemed by customers (breakage). We recognize the breakage for unredeemed awards in proportion to the actual awards that are redeemed by customers. We determine our breakage rate based upon Company specific historical redemption patterns.
Onecreek. Our onecreek customer loyalty program benefits include sneak peeks at upcoming trends and new merchandise, onecreek customer service specialists, exclusive onecreek savings and promotions, free shipping on returns, and a special birthday gift. The promotions and birthday gifts are typically provided, at our discretion, in the form of customer appreciation discount coupons that can be used to purchase merchandise. We recognize these discount coupons at the time the sale is recognized.
Cash and Cash Equivalents
Cash equivalents consist of highly liquid debt instruments with an original maturity date of three months or less at the date of purchase. As of January 29, 2011 and January 30, 2010, these instruments consisted mainly of direct investments in money market funds that invest entirely in U.S. Treasury Securities. We maintain a substantial portion of our cash and cash equivalents with a well-known and
46
COLDWATER CREEK INC. AND SUBSIDIARIES
NOTES TO THE CONSOLIDATED FINANCIAL STATEMENTS (Continued)
2. Significant Accounting Policies (Continued)
stable financial institution. However, we have significant amounts of cash and cash equivalents at this financial institution that are in excess of federally insured limits. Though we have not experienced any losses on our cash and cash equivalents to date and we do not anticipate incurring any losses, given the current financial environment and the instability of financial institutions, we cannot be assured that we will not experience losses on our deposits.
Fair Value
Fair value is defined as the price that would be received to sell an asset or paid to transfer a liability in an orderly transaction between market participants at the measurement date. Assets and liabilities recorded at fair value are categorized using defined hierarchical levels related to the subjectivity associated with the inputs to fair value measurements as follows:
- •
- Level 1—Quoted prices in active markets for identical assets or liabilities;
- •
- Level 2—Quoted prices for similar assets or liabilities in active markets or inputs that are
observable;
- •
- Level 3—Unobservable inputs in which little or no market activity exists.
As of January 29, 2011 and January 30, 2010 we held $39.1 million and $81.1 million, respectively, in money market funds that are measured at fair value on a recurring basis using level 1 inputs.
During fiscal 2010, certain long-lived assets with a net carrying amount of $9.2 million were written down to their fair value of $5.3 million, resulting in an impairment charge of $3.9 million. During fiscal 2009, certain long-lived store assets, primarily leasehold improvements and equipment, with a net carrying amount of $0.7 million were written down to their fair value of $0.1 million, resulting in a net impairment charge of $0.6 million. These impairment charges were measured at fair value using Level 3 inputs (discounted cash flows).
We also have financial assets and liabilities, not required to be measured at fair value on a recurring basis, which primarily consist of cash, restricted cash, receivables, payables and financing obligations, the carrying value of which approximate their fair values.
Trade Accounts Receivable
Our trade accounts receivable are associated primarily with credit card sales to individuals and are recorded at the invoiced amount. These receivables do not bear interest and are generally converted to cash in two to three days.
Inventories
Inventories primarily consist of merchandise purchased for resale. Inventory in our distribution center and in our premium retail stores, outlet stores and day spas is stated at the lower of weighted average cost or market.
Advertising Costs
Direct response advertising includes catalogs and national magazine advertisements that contain an identifying code which allows us to track related sales. All direct costs associated with the development,
47
COLDWATER CREEK INC. AND SUBSIDIARIES
NOTES TO THE CONSOLIDATED FINANCIAL STATEMENTS (Continued)
2. Significant Accounting Policies (Continued)
production and circulation of direct response advertisements are accumulated as prepaid marketing costs. Once the related catalog or national magazine advertisement is either mailed or first appears in print, these costs are reclassified to deferred marketing costs. These costs are then amortized to selling, general and administrative expenses over the expected sales realization cycle, typically several weeks. For fiscal 2010, 2009 and 2008, direct response advertising expense was $47.7 million, $54.5 million and $57.3 million, respectively.
Advertising costs other than direct response advertising include store and event promotions, signage expenses and other general customer acquisition activities. These advertising costs are expensed as incurred or when the particular store promotion begins. For fiscal 2010, 2009 and 2008, advertising expenses other than those related to direct response advertising was $25.9 million, $22.3 million and $22.9 million, respectively, and are included in selling, general and administrative expenses.
Property and Equipment
Property and equipment, including any major additions and improvements made to property and equipment, are recorded at cost. Minor additions and improvements, as well as maintenance and repairs that do not materially extend the useful life of property or equipment, are charged to operations as incurred. The net book value of property or equipment sold or retired is removed from the asset and related accumulated depreciation accounts with any resulting net gain or loss included in results of operations.
Depreciation and amortization expense is computed using the straight-line method. The estimated useful lives for buildings and land improvements are 15 to 30 years. The estimated useful lives for furniture and fixtures, technology hardware and internal use software and machinery and equipment are three to 12 years. Leasehold improvements are amortized over the contractual lives of the underlying operating leases or the estimated useful lives of the improvements, currently three to 20 years, whichever is less.
Impairment of Long-Lived Assets
Long-lived assets are subject to a review for impairment if events or changes in circumstances indicate that the carrying amount of the asset may not be recoverable. If the sum of the expected future undiscounted cash flows generated by an asset or asset group is less than its carrying amount, we then determine the fair value of the asset generally by using a discounted cash flow model. A loss is recognized, if any, by the amount by which the carrying amount of the asset or asset group exceeds the fair value. In assessing future cash flows, management is required to make assumptions and judgments, including forecasting future sales, margins and operating expenses over the estimated remaining useful life. These assumptions and judgments can be affected by consumer spending and overall economic conditions on a localized or regional basis, as well as other factors not necessarily within our control.
Internal-Use Software Costs
Costs related to software developed or obtained for internal use are expensed as incurred until the application development stage has been reached. Once the application development stage has been reached, certain qualifying costs are capitalized until the software is ready for its intended use.
48
COLDWATER CREEK INC. AND SUBSIDIARIES
NOTES TO THE CONSOLIDATED FINANCIAL STATEMENTS (Continued)
2. Significant Accounting Policies (Continued)
Restricted Cash
In connection with the lease of our distribution center we entered into a $4.0 million standby letter of credit during fiscal 2005, which required $4.4 million in cash collateral. This restricted cash was initially recorded as a non-current asset in our consolidated balance sheet. The principal amount of the letter of credit and the related restricted cash amount reduce at a rate of 20 percent per year over five years commencing January 1, 2008. As of January 29, 2011 we had $0.9 million in restricted cash recorded in current assets related to the $0.8 million remaining letter of credit.
Accounting for Leases
We lease our distribution center, customer contact centers, and all of our premium retail, outlet and day spa space, as well as certain other property and equipment. Nearly all of our leases are accounted for as operating leases. Our fixed, non-cancelable terms of our premium retail, outlet and day spa leases are generally five to 10 years. Most of our leases include renewal options that allow us to extend the term beyond the initial non-cancelable term. Several of our leases require additional rent based on sales, which is recorded as rent expense when the additional rent payments become probable. Also, most of the leases require payment of real estate taxes, insurance and certain common area maintenance costs in addition to future minimum lease payments. We have four capital leases with terms ranging from approximately four to 30 years.
Certain of our operating leases contain predetermined fixed escalations of the minimum rental payments over the lease. For these leases, we recognize the related rental expense on a straight-line basis over the term of the lease, which commences for accounting purposes on the date we have access and control over the leased store (possession). Possession occurs prior to the making of any lease payments and approximately 60 to 90 days prior to the opening of a store. In the early years of a lease with rent escalations, the recorded rent expense will exceed the actual cash payments. The amount of rent expense that exceeds the cash payments is recorded as deferred rent in the consolidated balance sheet. In the later years of a lease with rent escalations, the recorded rent expense will be less than the actual cash payments. The amount of cash payments that exceed the rent expense is then recorded as a reduction to deferred rent. Deferred rent related to lease agreements with escalating rent payments was $36.1 and $34.0 million at January 29, 2011 and January 30, 2010, respectively.
Additionally, certain operating leases contain terms which obligate the landlord to remit cash to us as an incentive to enter into the lease agreement. These lease incentives are commonly referred to as "tenant allowances". We record the amount to be remitted by the landlord as a tenant allowance receivable as we earn it under the terms of the contract. At the same time, we record deferred rent in an equal amount in the consolidated balance sheet. The tenant allowance receivable is reduced as cash is received from the landlord, while the deferred rent is amortized as a reduction to rent expense over the lease term. Deferred rent related to tenant allowances, including both the current and long-term portions, was $101.6 million and $110.9 million at January 29, 2011 and January 30, 2010, respectively.
49
COLDWATER CREEK INC. AND SUBSIDIARIES
NOTES TO THE CONSOLIDATED FINANCIAL STATEMENTS (Continued)
2. Significant Accounting Policies (Continued)
Income Taxes
Income taxes are accounted for under the asset and liability method. Deferred tax assets and liabilities are recognized for the future tax consequences attributable to differences between the financial statement carrying amounts of existing assets and liabilities and their respective tax bases and operating loss and tax credit carryforwards. Deferred tax assets and liabilities are measured using enacted tax rates expected to apply to taxable income in the years in which those temporary differences are expected to be recovered or settled. The effect on deferred tax assets and liabilities of a change in tax rates is recognized in income in the period that includes the enactment date.
On a quarterly basis, we review and update our tax positions as necessary to add any new uncertain tax positions taken, or to remove previously identified uncertain positions that have been adequately resolved. Additionally, uncertain positions may be remeasured as warranted by changes in facts or law. Accounting for uncertain tax positions requires significant judgments, including estimating the amount, timing and likelihood of ultimate settlement. Although we believe that these estimates are reasonable, actual results could differ from these estimates.
Contingent Liabilities
We record an estimated loss from a loss contingency when it is probable that an asset had been impaired or a liability had been incurred at the date of the financial statements and the amount of the loss can be reasonably estimated. If a probable loss cannot be reasonably estimated no accrual is recorded but disclosure of the contingency in the notes to the financial statements is required. Gain contingencies are not recorded until realized. Legal costs related to the loss contingencies are expensed as incurred.
50
COLDWATER CREEK INC. AND SUBSIDIARIES
NOTES TO THE CONSOLIDATED FINANCIAL STATEMENTS (Continued)
2. Significant Accounting Policies (Continued)
Cost of Sales and Selling, General and Administrative Expenses
The following table illustrates the primary costs classified in each major expense category:
| Cost of Sales | Selling, General and Administrative Expenses | |
|---|---|---|
• Design costs; |
• Payroll, bonus and benefit costs for retail and corporate
associates; |
Stock-Based Compensation
We provide equity awards to employees in the form of stock options and restricted stock units (RSUs). We expense the estimated fair value of these awards over the requisite employee service period, which is generally the vesting period. Stock-based compensation is included in selling, general and administrative expenses.
Supplemental Employee Retirement Plan
We provide a Supplemental Employee Retirement Plan (SERP) to certain of our executive officers. The SERP is an unfunded, non-qualified benefit plan that provides eligible participants with monthly benefits upon retirement, termination of employment, death or disability, subject to certain conditions.
We fully recognize a liability for the underfunded projected benefit obligation of the SERP in our financial statements. Actuarial gains and losses, prior service costs, and any remaining transition obligations are recognized as a component of accumulated other comprehensive income (loss), net of tax, until they are amortized as a component of net periodic pension cost. Any changes to the funded
51
COLDWATER CREEK INC. AND SUBSIDIARIES
NOTES TO THE CONSOLIDATED FINANCIAL STATEMENTS (Continued)
2. Significant Accounting Policies (Continued)
status are recognized through accumulated other comprehensive income (loss) and then amortized as a component of net periodic pension cost. We use our fiscal year end as our measurement date.
Store Pre-Opening Costs
We incur rent, preparation and training costs prior to the opening of a retail store or day spa. These pre-opening costs are expensed as incurred and are included in selling, general and administrative expenses. Pre-opening costs were $1.0 million, $0.6 million and $2.6 million during fiscal 2010, fiscal 2009, and fiscal 2008, respectively.
List rental income
Net customer list rental income is recorded as a reduction to selling, general and administrative expenses. We recognize rental income and accrue rental expense, as applicable, at the time the related catalog is mailed to the names contained in the rented lists. The amounts of income netted against selling, general and administrative expense are as follows:
| |
Fiscal Year Ended | |||||||||
|---|---|---|---|---|---|---|---|---|---|---|
| |
January 29, 2011 |
January 30, 2010 |
January 31, 2009 |
|||||||
| |
(in thousands) |
|||||||||
List rental income |
$ | 395 | $ | 513 | $ | 1,190 | ||||
List rental expense |
(51 | ) | (68 | ) | (169 | ) | ||||
Net list rental income |
$ | 344 | $ | 445 | $ | 1,021 | ||||
Interest, net, and other
Interest, net, and other consists of the following:
| |
Fiscal Year Ended | |||||||||
|---|---|---|---|---|---|---|---|---|---|---|
| |
January 29, 2011 |
January 30, 2010 |
January 31, 2009 |
|||||||
| |
(in thousands) |
|||||||||
Interest expense, including financing fees |
$ | (1,822 | ) | $ | (1,568 | ) | $ | (747 | ) | |
Interest income |
86 | 19 | 1,250 | |||||||
Other income |
1,861 | 1,771 | 1,892 | |||||||
Other expense |
(955 | ) | (1,019 | ) | (887 | ) | ||||
Interest, net and other |
$ | (830 | ) | $ | (797 | ) | $ | 1,508 | ||
The amounts of capitalized interest were not material for all periods presented.
Vendor Allowances
We account for allowances received from merchandise vendors as an adjustment to the prices of the vendor's products. This adjustment is recorded as a reduction of the carrying amount of inventory and, when sold, as a reduction to cost of sales. The terms of the vendor allowance arrangements are
52
COLDWATER CREEK INC. AND SUBSIDIARIES
NOTES TO THE CONSOLIDATED FINANCIAL STATEMENTS (Continued)
2. Significant Accounting Policies (Continued)
generally one year in length and settle semi-annually. We earned allowances from merchandise vendors of $5.9 million, $6.0 million, and $6.5 million in fiscal 2010, fiscal 2009 and fiscal 2008, respectively.
Self-Insurance
We have a self-insurance plan for health and welfare benefits and provide an accrual to cover our obligation. The accrual for our self-insurance liability is based on claims filed and an estimate of claims incurred but not yet reported, and is not discounted. Management considers a number of factors, including historical claims information, when determining the amount of the accrual. We maintain third-party stop-loss insurance policies to cover certain liability costs in excess of predetermined retained amounts. Costs related to the administration of the plan and related claims are expensed as incurred.
Recently Issued Accounting Standards
In October 2009, the Financial Accounting Standards Board (FASB) issued Accounting Standards Update (ASU) No. 2009-13, Multiple-Deliverable Revenue Arrangements—a consensus of the FASB Emerging Issues Task Force. This ASU provides amendments to the criteria for separating consideration in multiple-deliverable arrangements. The amendments in this ASU replace the term "fair value" in the revenue allocation guidance with "selling price" to clarify that the allocation of revenue is based on entity-specific assumptions rather than assumptions of a marketplace participant. The amendments in this ASU also establish a selling price hierarchy for determining the selling price of a deliverable. The amendments in this ASU eliminate the residual method of allocation and require that arrangement consideration be allocated at the inception of the arrangement to all deliverables using the relative selling price method. The amendments in this ASU are effective prospectively for revenue arrangements entered into or materially modified in fiscal years beginning after June 15, 2010. The initial adoption of this ASU did not have a material impact on our revenue recognition policies, particularly our co-branded credit card program.
3. Receivables
Receivables consist of the following:
| |
January 29, 2011 |
January 30, 2010 |
|||||
|---|---|---|---|---|---|---|---|
| |
(in thousands) |
||||||
Trade |
$ | 3,430 | $ | 3,503 | |||
Tenant improvement allowances |
3,552 | 923 | |||||
Other |
2,579 | 1,551 | |||||
|
9,561 | $ | 5,977 | ||||
We evaluate the credit risk associated with our receivables to determine if an allowance for doubtful accounts is necessary. At January 29, 2011 and January 30, 2010 no allowance for doubtful accounts was deemed necessary.
53
COLDWATER CREEK INC. AND SUBSIDIARIES
NOTES TO THE CONSOLIDATED FINANCIAL STATEMENTS (Continued)
4. Property and Equipment, net
Property and equipment, net, consist of the following:
| |
January 29, 2011 |
January 30, 2010 |
|||||
|---|---|---|---|---|---|---|---|
| |
(in thousands) |
||||||
Land |
$ | 242 | $ | 242 | |||
Buildings and land improvements |
29,646 | 29,475 | |||||
Leasehold improvements |
290,447 | 277,045 | |||||
Furniture and fixtures |
124,837 | 115,653 | |||||
Technology hardware and software |
93,495 | 91,253 | |||||
Machinery and equipment and other |
37,863 | 37,297 | |||||
Capital leases |
11,816 | 11,500 | |||||
Construction in progress |
14,207 | 14,524 | |||||
|
602,553 | 576,989 | |||||
Less—Accumulated depreciation and amortization |
(343,204 | ) | (281,977 | ) | |||
|
$ | 259,349 | $ | 295,012 | |||
Construction in progress is comprised primarily of the construction of a new office building and leasehold improvements and furniture and fixtures related to unopened premium retail stores, as well as internal-use software under development. Capital leases primarily include real estate assets and technology equipment.
As of January 29, 2011 and January 30, 2010, internal-use software capitalized within property and equipment, net of accumulated amortization, was $20.5 and $25.6 million, respectively. Amortization of internal-use software was $6.2 million, $6.6 million and $6.1 million in fiscal 2010, fiscal 2009 and fiscal 2008, respectively.
5. Accrued Liabilities
Accrued liabilities consist of the following:
| |
January 29, 2011 |
January 30, 2010 |
|||||
|---|---|---|---|---|---|---|---|
| |
(in thousands) |
||||||
Accrued payroll and benefits |
$ | 12,506 | $ | 14,351 | |||
Gift cards and coupon rewards |
35,031 | 33,014 | |||||
Current portion of deferred rents |
20,842 | 19,629 | |||||
Accrued sales returns |
3,383 | 4,365 | |||||
Accrued taxes |
4,815 | 5,999 | |||||
Other |
5,028 | 5,745 | |||||
|
$ | 81,605 | $ | 83,103 | |||
6. Credit Facility
Our credit facility with Wells Fargo Retail Finance, LLC, which is secured primarily by our inventory and credit card receivables, provides a revolving line of credit up to $70.0 million with
54
COLDWATER CREEK INC. AND SUBSIDIARIES
NOTES TO THE CONSOLIDATED FINANCIAL STATEMENTS (Continued)
6. Credit Facility (Continued)
subfacilities for the issuance of up to $70.0 million in letters of credit and swingline advances of up to $10.0 million. The credit facility has a maturity date of February 13, 2013. The actual amount of credit that is available from time to time under the credit facility is limited to a borrowing base amount that is determined according to, among other things, a percentage of the value of eligible inventory plus a percentage of the value of eligible credit card receivables, as reduced by certain reserve amounts that may be required by the lender. The proceeds of any borrowings under the credit facility are available for working capital and other general corporate purposes. As of January 29, 2011 and January 30, 2010, we had no borrowings outstanding under the credit facility. As of January 29, 2011 and January 30, 2010, we had $27.2 million and $19.5 million in letters of credit issued, respectively, resulting in $42.8 million and $50.5 million, respectively, available for borrowing under our credit facility.
Borrowings under the credit facility will generally accrue interest at a margin ranging from 2.25% to 2.75% (determined according to the average unused availability under the credit facility) over a reference rate of, at our election, either LIBOR or a base rate, as defined in the agreement. Letters of credit under the credit facility accrue fees at a rate equal to the interest margin that is in effect from time to time. Commitment fees accrue at a rate of 0.50%, which is assessed on the average unused portion of the credit facility maximum amount.
The credit facility has financial covenants that are limited to capital expenditures, minimum inventory book value and maximum facility usage as a percentage of the borrowing base value. The credit facility also contains various restrictive covenants relating to customary matters, such as indebtedness, liens, investments, acquisitions, mergers, dispositions and dividends. We were in compliance with all covenants for all periods presented.
The credit facility generally contains customary events of default for credit facilities of this type. Upon an event of default that is not cured or waived within any applicable cure periods, in addition to other remedies that may be available to the lender, the obligations under the credit facility may be accelerated, outstanding letters of credit may be required to be cash collateralized and remedies may be exercised against the collateral.
7. Income Taxes
Our income tax expense (benefit) consists of the following:
| |
Fiscal Year Ended | ||||||||||
|---|---|---|---|---|---|---|---|---|---|---|---|
| |
January 29, 2011 |
January 30, 2010 |
January 31, 2009 |
||||||||
| |
(in thousands) |
||||||||||
Current income tax expense (benefit): |
|||||||||||
Federal |
$ | 665 | $ | (12,429 | ) | $ | (11,531 | ) | |||
State |
1,132 | 298 | 1,687 | ||||||||
Foreign |
206 | 119 | 33 | ||||||||
Deferred income tax (benefit): |
|||||||||||
Federal |
— | 17,838 | (7,031 | ) | |||||||
State |
(2,025 | ) | 4,288 | (1,856 | ) | ||||||
Foreign |
(76 | ) | 43 | (43 | ) | ||||||
|
$ | (98 | ) | $ | 10,157 | $ | (18,741 | ) | |||
55
COLDWATER CREEK INC. AND SUBSIDIARIES
NOTES TO THE CONSOLIDATED FINANCIAL STATEMENTS (Continued)
7. Income Taxes (Continued)
Income tax expense (benefit) attributable to income before provision for income taxes differed from the amounts computed by applying the U.S. Federal income tax rate to income before provision for income taxes as a result of the following:
| |
Fiscal Year Ended | |||||||||
|---|---|---|---|---|---|---|---|---|---|---|
| |
January 29, 2011 |
January 30, 2010 |
January 31, 2009 |
|||||||
| |
(in thousands) |
|||||||||
Statutory income tax benefit |
$ | (15,473 | ) | $ | (16,092 | ) | $ | (15,646 | ) | |
State income taxes, net of federal benefit |
(1,093 | ) | (818 | ) | (1,123 | ) | ||||
Stock compensation expense, net of disqualifying dispositions and shortfalls |
(1,093 | ) | 1,533 | 483 | ||||||
Provision adjustments |
(612 | ) | 586 | (2,478 | ) | |||||
Foreign activity |
150 | 264 | (14 | ) | ||||||
Other differences |
630 | 281 | 18 | |||||||
Valuation allowance |
17,393 | 24,403 | 19 | |||||||
|
$ | (98 | ) | $ | 10,157 | $ | (18,741 | ) | ||
Our income tax expense from fiscal year 2009 includes the recording of a valuation allowance against substantially all of our net deferred tax assets with corresponding charges of $24.4 million to tax expense and $0.1 million to other comprehensive loss during fiscal 2009.
Our income tax benefit for fiscal year 2008 includes an out-of-period adjustment related to the correction of errors in the calculation of previous year's income taxes. This adjustment increased our tax benefit by $2.5 million in fiscal year 2008. This adjustment was primarily related to stock options in addition to fixed asset basis differences that accumulated over several previous years. Management has determined the resulting correction was not material to fiscal year 2008.
U.S. federal income taxes have not been provided on unremitted foreign earnings as those earnings are considered to be permanently reinvested. However, if these earnings were not considered permanently reinvested, under current law, the incremental tax on such undistributed earnings would not be material.
We received tax credits from the States of West Virginia and Idaho, which are reflected as state income taxes, net of federal benefit. The West Virginia tax credits, which are available through 2012, and the Idaho tax credits, which are available through 2019, are subject to annual limitations and are recognized in the year in which they are available to reduce taxable income. We have accumulated $0.3 million and $0.5 million of West Virginia and Idaho tax credits, respectively, as of January 29, 2011 that are carried over to utilize in subsequent years.
As of January 29, 2011, we had approximately $35.3 million and $4.9 million of federal and state net operating losses. We generated approximately $35.3 million federal and $1.7 million state net operating losses during fiscal 2010. The federal net operating losses are carried forward and available to reduce taxable income through fiscal 2030. The state net operating losses are carried forward and available to reduce taxable income in the various states through fiscal 2015 to fiscal 2030, depending upon the state.
56
COLDWATER CREEK INC. AND SUBSIDIARIES
NOTES TO THE CONSOLIDATED FINANCIAL STATEMENTS (Continued)
7. Income Taxes (Continued)
The tax effects of temporary differences that give rise to significant portions of the deferred tax assets and deferred tax liabilities are as follows:
| |
January 29, 2011 | January 30, 2010 | ||||||||||||
|---|---|---|---|---|---|---|---|---|---|---|---|---|---|---|
| |
Current | Noncurrent | Current | Noncurrent | ||||||||||
| |
(in thousands) |
|||||||||||||
Deferred tax assets: |
||||||||||||||
Accrued sales returns |
$ | 1,241 | $ | — | $ | 1,556 | $ | — | ||||||
Accrued employee benefits |
802 | 1,694 | 1,062 | 1,661 | ||||||||||
Supplemental Employee Retirement Plan |
— | 3,870 | — | 3,445 | ||||||||||
Tenant improvements |
6,831 | 33,580 | 6,702 | 38,014 | ||||||||||
Deferred rents |
1,361 | 12,885 | 1,032 | 12,272 | ||||||||||
Deferred revenue |
5,542 | 3,553 | 2,047 | 4,112 | ||||||||||
Inventory |
802 | — | 298 | — | ||||||||||
Charitable contribution carryover |
— | 1,994 | 2,180 | — | ||||||||||
Federal net operating loss carryover |
— | 12,358 | — | — | ||||||||||
State credit carryover |
— | 827 | — | 855 | ||||||||||
State net operating loss carryover |
103 | 3,093 | — | 1,948 | ||||||||||
Other |
1,273 | 76 | — | 442 | ||||||||||
|
17,955 | 73,930 | 14,877 | 62,749 | ||||||||||
Valuation allowance |
(7,845 | ) | (34,071 | ) | (4,854 | ) | (19,669 | ) | ||||||
Total deferred tax assets |
10,110 | 39,859 | 10,023 | 43,080 | ||||||||||
Deferred tax liabilities: |
||||||||||||||
Prepaid and deferred marketing costs |
(4,081 | ) | — | (2,934 | ) | — | ||||||||
Fixed assets |
— | (43,468 | ) | — | (49,701 | ) | ||||||||
Other |
— | — | (151 | ) | — | |||||||||
Total deferred tax liabilities |
(4,081 | ) | (43,468 | ) | (3,085 | ) | (49,701 | ) | ||||||
Net deferred tax assets (liabilities) |
$ | 6,029 | $ | (3,609 | ) | $ | 6,938 | $ | (6,621 | ) | ||||
Management assesses the available positive and negative evidence to estimate if sufficient future taxable income will be generated to utilize the existing deferred tax assets. A significant piece of objective negative evidence evaluated was the cumulated loss incurred over the three-year period ended January 29, 2011. Such objective evidence limits the ability to consider other subjective evidence. We have a valuation allowance to reduce deferred tax assets to the amount that is more likely than not to be realized. The amount of the deferred tax asset considered realizable, however, could be adjusted if objective negative evidence in the form of cumulative losses is no longer present and additional weight may be given to subjective evidence.
57
COLDWATER CREEK INC. AND SUBSIDIARIES
NOTES TO THE CONSOLIDATED FINANCIAL STATEMENTS (Continued)
7. Income Taxes (Continued)
The valuation allowance activity on deferred tax assets was as follows:
| |
Fiscal Year Ended | |||||||||
|---|---|---|---|---|---|---|---|---|---|---|
| |
January 29, 2011 |
January 30, 2010 |
January 31, 2009 |
|||||||
| |
(in thousands) |
|||||||||
Balance at beginning of period |
$ | 24,523 | $ | 19 | $ | — | ||||
Net additions charged to income tax expense |
17,393 | 24,403 | 19 | |||||||
Other adjustments to comprehensive income |
— | 101 | — | |||||||
Balance at end of period |
$ | 41,916 | $ | 24,523 | $ | 19 | ||||
Changes in unrecognized tax benefits were as follows:
| |
Fiscal Year Ended | |||||||||
|---|---|---|---|---|---|---|---|---|---|---|
| |
January 29, 2011 |
January 30, 2010 |
January 31, 2009 |
|||||||
| |
(in thousands) |
|||||||||
Balance at beginning of period |
$ | 77 | $ | 146 | $ | 32 | ||||
Increase based on tax positions related to prior years |
3,825 | 45 | 114 | |||||||
Settlements |
(1,518 | ) | (114 | ) | — | |||||
Balance at end of period |
$ | 2,384 | $ | 77 | $ | 146 | ||||
The unrecognized tax benefits represent items in which we may not prevail with certain taxing authorities, based upon varying interpretations of the applicable law. We expect to resolve $2.4 million in unrecognized tax benefits within fiscal year 2011 due to the anticipated completion of our current Internal Revenue Service examination with no impact to our effective rate in future periods.
We recognize interest and penalties related to unrecognized tax benefits as a component of tax expense. An immaterial amount of interest and penalties were recognized during fiscal 2010, 2009 and 2008.
We file income tax returns in the U.S. federal jurisdiction and in various state and local and foreign jurisdictions. We are no longer subject to Internal Revenue Service examinations for fiscal years prior to fiscal 2006. The Internal Revenue Service is currently conducting an examination of our federal income tax returns for fiscal 2006 through fiscal 2009. With limited exceptions, we are no longer subject to state or local examinations for our fiscal years prior to fiscal 2003. Currently several state examinations are in progress. Income tax returns filed in foreign jurisdictions are immaterial to our financial position, results of operations and cash flows.
8. Net Earnings (Loss) Per Common Share
Basic net earnings (loss) per common share is computed by dividing net income (loss) by the weighted average number of common shares outstanding during the period. Diluted net earnings (loss) per common share is computed by dividing net income (loss) by the combination of other potentially dilutive weighted average common shares and the weighted average number of common shares outstanding during the period. Other potentially dilutive weighted average common shares include the dilutive effect of stock options, RSUs and shares to be purchased under our Employee Stock Purchase Plan (ESPP) for each period using the treasury stock method. Under the treasury stock method, the
58
COLDWATER CREEK INC. AND SUBSIDIARIES
NOTES TO THE CONSOLIDATED FINANCIAL STATEMENTS (Continued)
8. Net Earnings (Loss) Per Common Share (Continued)
exercise price of a share, the amount of compensation expense, if any, for future service that has not yet been recognized, and the amount of benefits that would be recorded in additional paid-in-capital, if any, when the share is exercised are assumed to be used to repurchase shares in the current period.
The following table sets forth the computation of basic and diluted net loss per common share:
| |
Fiscal Year Ended | ||||||||||
|---|---|---|---|---|---|---|---|---|---|---|---|
| |
January 29, 2011 |
January 30, 2010 |
January 31, 2009 |
||||||||
| |
(in thousands, except per share amounts) |
||||||||||
Net loss |
$ | (44,111 | ) | $ | (56,132 | ) | $ | (25,963 | ) | ||
Weighted average common shares outstanding during the period (for basic calculation) |
92,316 | 91,597 | 91,037 | ||||||||
Dilutive effect of other potential common shares |
— | — | — | ||||||||
Weighted average common shares and potential common shares (for diluted calculation) |
92,316 | 91,597 | 91,037 | ||||||||
Net loss per common share—Basic |
$ | (0.48 | ) | $ | (0.61 | ) | $ | (0.29 | ) | ||
Net loss per common share—Diluted |
$ | (0.48 | ) | $ | (0.61 | ) | $ | (0.29 | ) | ||
The computation of the dilutive effect of other potential common shares excluded options, RSUs and shares to be purchased under our ESPP representing 2.7 million, 3.3 million and 3.1 million shares of common stock in fiscal 2010, 2009 and 2008, respectively. Under the treasury stock method, the inclusion of these stock awards would have resulted in lower loss per share, causing their effect to be antidilutive.
9. Stock-Based Compensation
Our Amended and Restated Stock Option/Stock Issuance Plan (the Plan) was adopted by the Board of Directors in March 2005 and approved by shareholders in June 2005. The Plan provides for share-based compensation for officers and key employees, directors and consultants, and other independent advisors. The Plan replaced the 1996 Stock Option/Stock Issuance Plan (the 1996 Plan), but did not affect awards granted under that plan, some of which remain outstanding.
Eligible individuals may, at the discretion of the Compensation Committee of the Board of Directors, be granted stock options, shares of restricted or unrestricted stock, RSUs and stock appreciation rights. The maximum number of shares of common stock underlying awards which may be issued over the term of the Plan cannot exceed 16,838,402 shares, subject to adjustment for stock splits and similar capitalization changes. We issue new shares of common stock upon exercise of stock options and vesting of RSUs. As of January 29, 2011, 1.0 million shares of common stock remain available for future grants under the Plan. The Plan will terminate on March 25, 2015, subject to earlier termination by the Board of Directors.
59
COLDWATER CREEK INC. AND SUBSIDIARIES
NOTES TO THE CONSOLIDATED FINANCIAL STATEMENTS (Continued)
9. Stock-Based Compensation (Continued)
Total stock-based compensation recognized from stock options and RSUs during fiscal 2010, 2009 and 2008 was as follows:
| |
Fiscal Year Ended | |||||||||
|---|---|---|---|---|---|---|---|---|---|---|
| |
January 29, 2011 |
January 30, 2010 |
January 31, 2009 |
|||||||
| |
(in thousands) |
|||||||||
Stock Options |
$ | 1,961 | $ | 4,235 | $ | 2,980 | ||||
RSUs |
515 | 2,483 | 1,799 | |||||||
Total |
$ | 2,476 | $ | 6,718 | $ | 4,779 | ||||
There was no related tax benefit for fiscal 2010, compared with a tax benefit of $2.0 million and $1.4 million for fiscal 2009 and 2008, respectively. During fiscal 2009, a valuation allowance was recorded against substantially all of our net deferred tax assets, including those generated by the stock-based compensation expense related tax benefits. Stock-based compensation capitalized into inventory and fixed assets for fiscal 2010, 2009 and 2008 was not material.
As of January 29, 2011, total unrecognized compensation expense related to nonvested share-based compensation arrangements was $4.5 million. This expense is expected to be recognized over a weighted-average period of 2.5 years.
On September 12, 2009, our former director, President and Chief Executive Officer (CEO) resigned. As a result, we recorded stock-based compensation of $2.1 million during fiscal 2009, related to the acceleration of all our former CEO's unvested equity awards, per the original terms of his employment agreement.
Stock Options
Options are granted with an exercise price per share equal to the fair market value of our common stock on the grant date. Options generally vest and become exercisable on a pro rata basis over a three-, four- or five-year period from the date of grant. The maximum term of each grant may not exceed ten years, subject to earlier expiration for vested options not exercised following termination of employment.
The fair value for stock option awards was estimated at the grant date using the Black-Scholes option valuation model with the following weighted average assumptions for fiscal years 2010, 2009 and 2008:
| |
Directors and Officers | |||||||||
|---|---|---|---|---|---|---|---|---|---|---|
| |
January 29, 2011 |
January 30, 2010 |
January 31, 2009 |
|||||||
Risk free interest rate |
2.4 | % | 3.0 | % | 3.8 | % | ||||
Expected volatility |
76.0 | % | 78.1 | % | 67.2 | % | ||||
Expected life (in years) |
5.8 | 5.8 | 5.8 | |||||||
Expected dividends |
None | None | None | |||||||
Weighted average fair value per option granted |
$ | 2.80 | $ | 3.61 | $ | 3.75 | ||||
60
COLDWATER CREEK INC. AND SUBSIDIARIES
NOTES TO THE CONSOLIDATED FINANCIAL STATEMENTS (Continued)
9. Stock-Based Compensation (Continued)
| |
All Other Employees | |||||||||
|---|---|---|---|---|---|---|---|---|---|---|
| |
January 29, 2011 |
January 30, 2010 |
January 31, 2009 |
|||||||
Risk free interest rate |
1.7 | % | 2.0 | % | 2.7 | % | ||||
Expected volatility |
80.5 | % | 82.3 | % | 72.1 | % | ||||
Expected life (in years) |
4.4 | 4.4 | 4.5 | |||||||
Expected dividends |
None | None | None | |||||||
Weighted average fair value per option granted |
$ | 2.35 | $ | 2.45 | $ | 2.50 | ||||
The risk-free interest rate is based on the U.S. Treasury strip rates in effect at the time of the grant with an equivalent remaining term. The expected volatility of our stock price is based on a combination of historical volatility and the implied volatility of our exchange traded options. Expected life is derived from historical experience, taking into consideration expected future employee behavior.
Stock-based compensation expense is recognized only for those awards that are expected to vest, with forfeitures estimated at the date of grant based on our historical experience and future expectations. The forfeiture rate will be revised, if necessary, in subsequent periods if actual forfeitures differ from the amount estimated.
The following table summarizes the activity for outstanding stock options for fiscal 2010:
| |
Shares Subject to Options |
Weighted Average Exercise Price Per Share |
Weighted Average Remaining Contractual Life |
Aggregate Intrinsic Value |
|||||||||
|---|---|---|---|---|---|---|---|---|---|---|---|---|---|
| |
|
|
|
(in thousands) |
|||||||||
Outstanding, January 30, 2010 |
2,852,840 | $ | 8.79 | ||||||||||
Granted |
892,300 | $ | 4.10 | ||||||||||
Exercised |
(126,342 | ) | $ | 2.91 | |||||||||
Forfeited/Expired |
(571,096 | ) | $ | 8.07 | |||||||||
Outstanding, January 29, 2011 |
3,047,702 | $ | 7.79 | 4.65 | $ | 219 | |||||||
Vested and expected to vest, January 29, 2011 |
2,728,143 | $ | 8.15 | 4.77 | $ | 206 | |||||||
Exercisable, January 29, 2011 |
1,514,416 | $ | 10.55 | 3.39 | $ | 104 | |||||||
During fiscal years 2010, 2009 and 2008, the total intrinsic value of stock options exercised was $0.2 million, $2.5 million and $0.6 million, respectively.
RSU Awards
During fiscal 2010 and 2009, we granted 261,887 and 79,659 RSUs, respectively, with only service conditions at a weighted average grant date fair market value of $4.08 and $7.02, respectively. During fiscal 2010, we also granted 273,000 RSUs that, in addition to service conditions also contained performance conditions, at a weighted average grant date fair value of $3.90, of which 257,750 remained outstanding as of January 29, 2011. The awards with the additional performance conditions are subject to the achievement of combined earnings before interest expense and taxes (EBIT) target for fiscal 2010, 2011 and 2012, as well as continued employment with the Company and the receipt of
61
COLDWATER CREEK INC. AND SUBSIDIARIES
NOTES TO THE CONSOLIDATED FINANCIAL STATEMENTS (Continued)
9. Stock-Based Compensation (Continued)
satisfactory performance reviews. The number of shares actually awarded will range from 0 to 200 percent of the base award amount, depending on our EBIT during the performance period.
During fiscal 2009, we granted 156,000 RSUs that, in addition to service conditions, contained performance and market conditions, at a weighted average grant date fair value of $5.23, of which 30,000 remained outstanding at January 29, 2011. The awards with the additional performance and market conditions are independent of each other and equally weighted, and are based on three metrics: operating income, comparable store growth (CSG) relative to a peer group, and total shareholder return (TSR) relative to a peer group. The fair value of the RSUs with operating income and CSG goals are based on the fair market value at the date of grant. The fair value of the RSUs containing the TSR condition was determined using a statistical model that incorporates the probability of meeting performance targets based on historical returns relative to a peer group. All awards with performance and market conditions are measured over the vesting period and are charged to compensation expense over the requisite service period based on the number of shares expected to vest. RSUs generally vest over a one- or three-year period from date of grant.
The following table summarizes the activity for unvested RSUs for fiscal 2010:
| |
Number of Shares |
Weighted Average Grant Date Fair Value |
|||||
|---|---|---|---|---|---|---|---|
Unvested, January 30, 2010 |
382,659 | $ | 8.69 | ||||
Granted |
534,887 | 3.99 | |||||
Vested |
(92,659 | ) | 17.37 | ||||
Forfeited |
(134,500 | ) | 5.59 | ||||
Unvested, January 29, 2011 |
690,387 | $ | 4.44 | ||||
During the fiscal years ended 2010, 2009 and 2008, the total fair market value of RSUs vested was $0.4 million, $2.3 million and $0.5 million, respectively.
10. Employee Stock Purchase Plan
Our 2006 Employee Stock Purchase Plan (ESPP) was adopted by the Board or Directors in March 2006 and approved by our shareholders in June 2006. Through participation in the ESPP employees can purchase Coldwater Creek common stock at a five percent discount to the closing market price on the last trading day of each calendar quarter. Employees may not purchase more than 1,000 shares of common stock during any purchase period and may at no point in any calendar year purchase shares of common stock having an aggregate fair market value in excess of $25,000. Additionally, an employee who owns, or would own as a result of ESPP participation, five percent or more of the total combined voting power of all classes of our stock is not eligible for participation in the ESPP. The aggregate number of shares of common stock that may be made available for purchase under the ESPP is 1.8 million. As of January 29, 2011, approximately 1.2 million shares of common stock remain available for purchase under the ESPP. The shares that are available for purchase may be unissued authorized shares, treasury shares, or shares purchased on the open market. We have determined that the ESPP is a non-compensatory plan; therefore no compensation expense related to the ESPP has been recognized in the consolidated financial statements. Our employees purchased approximately 141,000, 162,000 and 215,000 shares during fiscal 2010, 2009 and 2008 at an average share price of $3.99, $4.20 and $4.21, respectively.
62
COLDWATER CREEK INC. AND SUBSIDIARIES
NOTES TO THE CONSOLIDATED FINANCIAL STATEMENTS (Continued)
11. Defined Contribution Plan
We provide a tax-qualified employee savings, retirement and profit sharing plan qualified under Section 401(k) of the Internal Revenue Code (the 401(k) Plan). Under the 401(k) Plan eligible employees may elect to defer a portion of their current compensation, up to certain statutorily prescribed annual limits, and make corresponding periodic contributions into the 401(k) Plan. We match a certain percentage of the employee's overall contribution, which we discontinued from February 1, 2009 to May 8, 2010. In addition, we may make a discretionary profit sharing contribution based on our overall profitability. We recognized contribution expense of $1.2 million, $0.1 million and $4.2 million for fiscal 2010, 2009 and 2008, respectively.
12. Supplemental Employee Retirement Plan
The funded status of the SERP as of January 29, 2011 and January 30, 2010 was as follows:
| |
January 29, 2011 |
January 30, 2010 |
|||||||
|---|---|---|---|---|---|---|---|---|---|
| |
(in thousands) |
||||||||
Change in projected benefit obligation: |
|||||||||
Projected benefit obligation at beginning of period |
$ | 9,202 | $ | 8,204 | |||||
Service cost |
169 | 242 | |||||||
Interest cost |
529 | 511 | |||||||
Net actuarial loss |
279 | 908 | |||||||
Benefits paid |
— | (272 | ) | ||||||
Effect of curtailments |
— | (391 | ) | ||||||
Projected benefit obligation at end of period |
10,179 | 9,202 | |||||||
Funded status: |
|||||||||
Fair value of plan assets |
— | — | |||||||
Unfunded status at end of fiscal year |
$ | 10,179 | $ | 9,202 | |||||
Amounts Recognized in the Consolidated Balance Sheet: |
|||||||||
Current liabilities |
$ | 166 | $ | — | |||||
Long-term liabilities |
10,013 | 9,202 | |||||||
|
$ | 10,179 | $ | 9,202 | |||||
The accumulated benefit obligation for the SERP was $10.2 million and $9.2 million at January 29, 2011 and January 30, 2010, respectively.
63
COLDWATER CREEK INC. AND SUBSIDIARIES
NOTES TO THE CONSOLIDATED FINANCIAL STATEMENTS (Continued)
12. Supplemental Employee Retirement Plan (Continued)
Amounts recognized in accumulated other comprehensive loss consist of the following:
| |
January 29, 2011 |
January 30, 2010 |
|||||
|---|---|---|---|---|---|---|---|
| |
(in thousands) |
||||||
Net actuarial loss |
$ | (537 | ) | $ | (258 | ) | |
Prior service costs |
— | (188 | ) | ||||
Total recognized in accumulated other comprehensive loss |
$ | (537 | ) | $ | (446 | ) | |
Total recognized in accumulated other comprehensive loss, net of tax |
$ | (464 | ) | $ | (373 | ) | |
The components of net periodic benefit expense and other changes in projected benefit obligations recognized in other comprehensive loss are as follows:
| |
Fiscal Year Ended | |||||||||||
|---|---|---|---|---|---|---|---|---|---|---|---|---|
| |
January 29, 2011 |
January 30, 2010 |
January 31, 2009 |
|||||||||
| |
(in thousands) |
|||||||||||
Net Periodic Benefit Expense: |
||||||||||||
Service cost |
$ | 169 | $ | 242 | $ | 302 | ||||||
Interest cost |
529 | 511 | 497 | |||||||||
Amortization of prior service cost |
188 | 344 | 494 | |||||||||
Net curtailment loss |
— | 1,914 | — | |||||||||
Net periodic benefit expense |
$ | 886 | $ | 3,011 | $ | 1,293 | ||||||
Other Changes in Projected Benefit Obligations Recognized in Other Comprehensive Loss: |
||||||||||||
Amortization of unrecognized prior service cost |
$ | 188 | $ | 344 | $ | 494 | ||||||
Unrecognized net actuarial gain (loss) |
(279 | ) | (908 | ) | 621 | |||||||
Effect of curtailments |
— | 2,305 | — | |||||||||
Tax effect |
— | (780 | ) | (435 | ) | |||||||
Total recognized in other comprehensive loss |
$ | (91 | ) | $ | 961 | $ | 680 | |||||
Total recognized in net periodic benefit expense and other comprehensive loss |
$ | 795 | $ | 3,972 | $ | 1,973 | ||||||
We do not expect to amortize any unrecognized actuarial loss during fiscal 2011.
64
COLDWATER CREEK INC. AND SUBSIDIARIES
NOTES TO THE CONSOLIDATED FINANCIAL STATEMENTS (Continued)
12. Supplemental Employee Retirement Plan (Continued)
The following assumptions were utilized in calculating the SERP projected benefit obligation and net periodic benefit cost:
| |
Benefit Obligation |
Net Periodic Benefit Cost |
||||||||||||||
|---|---|---|---|---|---|---|---|---|---|---|---|---|---|---|---|---|
| |
Fiscal 2010 |
Fiscal 2009 |
Fiscal 2010 |
Fiscal 2009 |
Fiscal 2008 |
|||||||||||
Discount rate |
5.50 | % | 5.75 | % | 5.75 | % | 6.50 | % | 6.00 | % | ||||||
Rate of compensation increase |
— | 4.00 | % | 4.00 | % | 4.00 | % | 4.00 | % | |||||||
The assumed discount rate is based, in part, upon a modeling process that considers both high quality long term indices and the duration of the SERP relative to the durations implicit in the broader indices. The discount rate is utilized principally in calculating the actuarial present value of the obligation and periodic expense pursuant to the SERP. To the extent the discount rate increases or decreases, the SERP obligation is decreased or increased, accordingly. When calculating the projected benefit obligation at January 29, 2011, the rate of compensation increase is not applicable as there are no employees currently accruing benefits.
As the SERP is an unfunded plan, we were not required to make any contributions during fiscal 2010 and 2009. The following table summarizes the expected future benefit payments:
(in thousands)
|
|
|||
|---|---|---|---|---|
Fiscal 2011 |
$ | 166 | ||
Fiscal 2012 |
166 | |||
Fiscal 2013 |
166 | |||
Fiscal 2014 |
214 | |||
Fiscal 2015 |
822 | |||
Fiscal Years 2016-2020 |
4,110 | |||
13. Commitments
Leases
During fiscal 2010, 2009 and 2008, we incurred aggregate rent expense under operating leases of $79.1 million, $78.5 million and $73.9 million, respectively, including $15.7 million, $15.2 million and $14.1 million, respectively, of common area maintenance costs (CAM), $0.3 million, $0.6 million and $1.1 million, respectively, of rent expense classified as store pre-opening costs and an immaterial amount of contingent rent expense for each period. Aggregate rent expense under operating leases does not include related real estate taxes of $11.2 million, $10.6 million and $9.5 million for fiscal years 2010, 2009 and 2008, respectively.
65
COLDWATER CREEK INC. AND SUBSIDIARIES
NOTES TO THE CONSOLIDATED FINANCIAL STATEMENTS (Continued)
13. Commitments (Continued)
As of January 29, 2011 our minimum lease payment requirements, which include the predetermined fixed escalations of the minimum rentals and exclude contingent rental payments, CAM, real estate taxes and the amortization of lease incentives for our operating leases, are as follows:
| |
Operating Leases | Capital Lease | |||||
|---|---|---|---|---|---|---|---|
| |
(in thousands) |
||||||
Fiscal 2011 |
$ | 82,694 | $ | 1,366 | |||
Fiscal 2012 |
77,480 | 1,424 | |||||
Fiscal 2013 |
74,560 | 1,448 | |||||
Fiscal 2014 |
70,013 | 1,272 | |||||
Fiscal 2015 |
62,401 | 1,114 | |||||
Thereafter |
200,016 | 18,154 | |||||
Total |
$ | 567,164 | 24,778 | ||||
Less—interest on capital lease obligations |
(12,158 | ) | |||||
Total principal payable on capital lease obligations |
12,620 | ||||||
Less—Current obligations |
(379 | ) | |||||
Long-term capital lease obligations |
$ | 12,241 | |||||
The primary capital lease is for our 69,000 square foot facility located in Coeur d'Alene, Idaho, which functions as a customer contact center, IT data center and office space. This lease was amended on April 22, 2009 resulting in the lease classified as a capital lease through fiscal 2028, with a remaining lease commitment as of January 29, 2011 of $19.8 million, and as an operating lease from fiscal 2029 through fiscal 2038, with a remaining lease commitment as of January 29, 2011 of $16.3 million. All other capital leases pertain to various technology equipment and other real estate.
Other
We had future non-cancelable commitments to purchase inventory of $162.2 million and capital expenditures of $1.3 million at January 29, 2011. As of January 29, 2011 we had $0.8 million committed under our standby letter of credit related to the lease of our distribution center.
14. Contingencies
Legal Proceedings
We are, from time to time, involved in various legal proceedings incidental to the conduct of business. Actions filed against us from time to time include commercial, intellectual property infringement, customer and employment claims, including class action lawsuits alleging that we violated federal and state wage and hour and other laws. We believe that we have meritorious defenses to all lawsuits and legal proceedings currently pending against us. Though we will continue to vigorously defend such lawsuits and legal proceedings, we are unable to predict with certainty whether or not we will ultimately be successful. However, based on management's evaluation, we believe that the resolution of these matters, taking into account existing contingency accruals and the availability of insurance and other indemnifications, will not materially impact our consolidated financial position, results of operations or cash flows.
66
COLDWATER CREEK INC. AND SUBSIDIARIES
NOTES TO THE CONSOLIDATED FINANCIAL STATEMENTS (Continued)
14. Contingencies (Continued)
On September 12, 2006, as amended on April 25, 2007, Brighton Collectibles, Inc. (Brighton) filed a complaint against us in the United States District Court for the Southern District of California. The complaint alleged, among other things, that we violated trade dress and copyright laws. On November 21, 2008, a jury found us liable to Brighton for copyright and trade dress infringement. In January 2009, the court entered a judgment in the total amount of $8.0 million, which includes damages of $2.7 million on the trade dress claim, $4.1 million in damages and profits on the copyright claim and $1.2 million in attorneys' fees. We have appealed the judgment as we believe there are legitimate grounds to overturn the judgment. Pending the appeal, the court entered a temporary stay of execution conditioned on us posting an $8.0 million bond, which has been posted. On December 12, 2008, as amended on September 17, 2009, Brighton filed another complaint against us in the United States District Court for the Southern District of California. This additional complaint alleges copyright infringement of three different Brighton designs and seeks to recover damages of approximately $0.7 million, plus attorneys' fees and costs. We are vigorously defending this matter. We believe it is without merit and are asserting various defenses to the action. We believe that the amount of loss, if any, related to these legal proceedings is adequately reserved for or covered by insurance.
Other
Our multi-channel business model subjects us to state and local taxes in numerous jurisdictions, including state income, franchise, and sales and use tax. We collect these taxes in jurisdictions in which we have a physical presence. While we believe we have paid or accrued for all taxes based on our interpretation of applicable law, tax laws are complex and interpretations differ from state to state. In the past, some taxing jurisdictions have assessed additional taxes and penalties on us, asserting either an error in our calculation or an interpretation of the law that differed from our own. It is possible that taxing authorities may make additional assessments in the future. In addition to taxes, penalties and interest, these assessments could cause us to incur legal fees associated with resolving disputes with taxing authorities.
Additionally, changes in state and local tax laws, such as temporary changes associated with "tax holidays" and other programs, require us to make continual changes to our collection and reporting systems that may relate to only one taxing jurisdiction. If we fail to update our collection and reporting systems in response to these changes, any over collection or under collection of sales taxes could subject us to interest and penalties, as well as private lawsuits and damage to our reputation.
67
COLDWATER CREEK INC. AND SUBSIDIARIES
NOTES TO THE CONSOLIDATED FINANCIAL STATEMENTS (Continued)
15. Co-Brand Credit Card Program
Deferred marketing fees and revenue sharing
The following table summarizes the deferred marketing fee and revenue sharing activity for fiscal 2010 and 2009:
| |
January 29, 2011 |
January 30, 2010 |
|||||
|---|---|---|---|---|---|---|---|
| |
(in thousands) |
||||||
Deferred marketing fees and revenue sharing—beginning of period |
$ | 12,364 | $ | 10,741 | |||
Marketing fees received |
4,884 | 3,010 | |||||
Revenue sharing received |
— | 6,549 | |||||
Marketing fees recognized to revenue |
(5,180 | ) | (5,325 | ) | |||
Revenue sharing recognized to revenue |
(1,759 | ) | (2,611 | ) | |||
Deferred marketing fees and revenue sharing—end of period |
10,309 | 12,364 | |||||
Less—Current deferred marketing fees and revenue sharing |
(4,487 | ) | (5,215 | ) | |||
Long-term deferred marketing fees and revenue sharing |
$ | 5,822 | $ | 7,149 | |||
The following table provides an estimate of when we expect to amortize the deferred marketing fees and the deferred revenue sharing into revenue:
| |
Deferred Marketing Fees |
Deferred Revenue Sharing |
Total | |||||||
|---|---|---|---|---|---|---|---|---|---|---|
| |
(in thousands) |
|||||||||
Fiscal 2011 |
$ | 2,728 | $ | 1,759 | $ | 4,487 | ||||
Fiscal 2012 |
1,587 | 1,759 | 3,346 | |||||||
Fiscal 2013 |
1,013 | 806 | 1,819 | |||||||
Fiscal 2014 |
554 | — | 554 | |||||||
Fiscal 2015 |
103 | — | 103 | |||||||
|
$ | 5,985 | $ | 4,324 | $ | 10,309 | ||||
Sales Royalty
The amount of sales royalty recognized as revenue during fiscal 2010, 2009 and 2008 was $7.3 million, $6.6 million and $5.1 million, respectively. The amount of deferred sales royalty recorded in accrued liabilities was $3.1 million and $3.3 million at January 29, 2011 and January 30, 2010, respectively.
16. Segment Reporting
Our merchandise is sold through two operating segments, retail and direct. The performance of each operating segment is based on segment operating income, which is defined as net sales less the cost of merchandise and related acquisition costs and certain directly identifiable and allocable operating costs. For the direct segment, these operating costs primarily consist of catalog development, production, and circulation costs, e-commerce advertising costs and order processing costs. For the retail segment, these operating costs primarily consist of store selling and occupancy costs. Corporate and other expenses consist of unallocated shared-service costs and general and administrative expenses.
68
COLDWATER CREEK INC. AND SUBSIDIARIES
NOTES TO THE CONSOLIDATED FINANCIAL STATEMENTS (Continued)
16. Segment Reporting (Continued)
Unallocated shared-service costs include merchandising, distribution, inventory planning and quality assurance costs, as well as corporate occupancy costs. General and administrative expenses include costs associated with general corporate management and shared departmental services (i.e., finance, accounting, information technology and human resources). Operating segment depreciation and amortization is allocated to each operating segment. Corporate and other depreciation and amortization and capital expenditures are related to corporate headquarters, merchandise distribution, and technology infrastructure. We do not review total assets by segment. We have determined that the Chief Operating Decision Maker is our Chief Executive Officer.
The following table provides certain financial data for the retail and direct segments as well as reconciliations to the consolidated financial statements:
| |
Fiscal Year Ended | ||||||||||||
|---|---|---|---|---|---|---|---|---|---|---|---|---|---|
| |
January 29, 2011 |
January 30, 2010 |
January 31, 2009 |
||||||||||
| |
(in thousands) |
||||||||||||
Net sales(a): |
|||||||||||||
Retail |
$ | 732,430 | $ | 782,429 | $ | 751,352 | |||||||
Direct |
$ | 248,671 | 256,152 | 272,869 | |||||||||
Net sales |
$ | 981,101 | $ | 1,038,581 | $ | 1,024,221 | |||||||
Segment operating income: |
|||||||||||||
Retail |
$ | 27,083 | $ | 37,479 | $ | 30,396 | |||||||
Direct |
40,483 | 41,837 | 42,108 | ||||||||||
Total segment operating income |
67,566 | 79,316 | 72,504 | ||||||||||
Corporate and other |
(110,945 | ) | (124,494 | ) | (118,716 | ) | |||||||
Loss from operations |
$ | (43,379 | ) | $ | (45,178 | ) | $ | (46,212 | ) | ||||
Depreciation and amortization: |
|||||||||||||
Retail |
$ | 48,456 | $ | 47,570 | $ | 44,743 | |||||||
Direct |
896 | 1,342 | 1,717 | ||||||||||
Corporate and other |
13,977 | 14,809 | 15,351 | ||||||||||
Depreciation and amortization |
$ | 63,329 | $ | 63,721 | $ | 61,811 | |||||||
Purchase of property and equipment: |
|||||||||||||
Retail |
$ | 26,306 | $ | 12,778 | $ | 57,517 | |||||||
Direct |
9 | — | 199 | ||||||||||
Corporate and other |
4,769 | 8,903 | 23,499 | ||||||||||
Purchase of property and equipment |
$ | 31,084 | $ | 21,681 | $ | 81,215 | |||||||
- (a)
- There were no inter-segment sales between the retail and direct segments during the periods presented.
Our products are principally marketed to individuals within the United States. Net sales realized from other geographic markets, primarily Canada and Japan, have collectively been insignificant in each reported period. No single customer accounts for ten percent or more of net sales. Apparel sales have constituted at least 85 percent of the net sales during fiscal 2010, 2009 and 2008, with sales of jewelry,
69
COLDWATER CREEK INC. AND SUBSIDIARIES
NOTES TO THE CONSOLIDATED FINANCIAL STATEMENTS (Continued)
16. Segment Reporting (Continued)
accessories and gift items constituting the respective balances. Substantially all of our long-lived assets reside within the United States.
17. Quarterly Results of Operations (unaudited)
The following tables contain selected quarterly consolidated financial data for fiscal 2010 and 2009 that have been prepared on the same basis as the accompanying audited consolidated financial statements and include all adjustments necessary for a fair statement, in all material respects, of the information set forth therein on a consistent basis.
| |
Fiscal 2010 | ||||||||||||
|---|---|---|---|---|---|---|---|---|---|---|---|---|---|
| |
First Quarter |
Second Quarter |
Third Quarter |
Fourth Quarter |
|||||||||
| |
(in thousands, except per share amounts) |
||||||||||||
Net sales |
$ | 243,086 | $ | 253,498 | $ | 232,412 | $ | 252,105 | |||||
Gross profit |
$ | 90,905 | $ | 84,736 | $ | 70,937 | $ | 60,707 | |||||
Net income (loss) |
$ | 2,322 | $ | 1,469 | $ | (10,857 | ) | (37,045 | ) | ||||
Net income (loss) per common share—Basic |
$ | 0.03 | $ | 0.02 | $ | (0.12 | ) | $ | (0.40 | ) | |||
Net income (loss) per common share—Diluted |
$ | 0.03 | $ | 0.02 | $ | (0.12 | ) | $ | (0.40 | ) | |||
| |
Fiscal 2009 | ||||||||||||
|---|---|---|---|---|---|---|---|---|---|---|---|---|---|
| |
First Quarter |
Second Quarter |
Third Quarter |
Fourth Quarter |
|||||||||
| |
(in thousands, except per share amounts) |
||||||||||||
Net sales |
$ | 228,367 | $ | 225,192 | $ | 266,658 | $ | 318,364 | |||||
Gross profit |
$ | 71,100 | $ | 75,728 | $ | 97,129 | $ | 90,324 | |||||
Net loss |
$ | (7,562 | ) | $ | (4,922 | ) | $ | (33,970 | ) | $ | (9,678 | ) | |
Net loss per common share—Basic and Diluted |
$ | (0.08 | ) | $ | (0.05 | ) | $ | (0.37 | ) | $ | (0.11 | ) | |
During the third quarter of fiscal 2009 we recorded a $26.3 million non-cash income tax charge in continuing operations, or $0.29 per share, related to a valuation allowance against net deferred tax assets. U.S. GAAP requires that we assess whether a valuation allowance should be established against our deferred tax assets based on the consideration of all available evidence using a "more likely than not" standard. In making such judgments, significant weight is given to evidence that can be objectively verified. A company's current or previous losses are given more weight than its projected future performance. Consequently, based on available evidence, in particular our three-year historical cumulative losses, we recorded a valuation allowance against our net deferred tax asset. The recording of a valuation allowance has no impact on cash and does not preclude the company from utilizing the full amount of the deferred tax asset in future profitable periods.
70
Item 9. CHANGES IN AND DISAGREEMENTS WITH ACCOUNTANTS ON ACCOUNTING AND FINANCIAL DISCLOSURE
None
Item 9A. CONTROLS AND PROCEDURES
Disclosure Controls and Procedures
We maintain a system of disclosure controls and procedures that are designed to ensure that information required to be disclosed in the Company's reports under the Securities Exchange Act of 1934, as amended (the "Exchange Act"), is recorded, processed, summarized and reported within the time periods specified in the SEC's rules and forms, and that such information is accumulated and communicated to management, including our Chief Executive Officer and the Chief Financial Officer, as appropriate, to allow timely decisions regarding required disclosure. In designing and evaluating the disclosure controls and procedures, management recognizes that any controls and procedures, no matter how well designed and operated, can provide only reasonable assurance of achieving the desired control objectives.
Our management, with the participation of our Chairman, President and Chief Executive Officer and our Senior Vice President and Chief Financial Officer, has evaluated the effectiveness of our disclosure controls and procedures, as defined in Rule 13a-15(e) of the Exchange Act, as of January 29, 2011. Based on that evaluation, our Chairman, President and Chief Executive Officer and Senior Vice President and Chief Financial Officer concluded that our disclosure controls and procedures were effective as of January 29, 2011.
Management's Report on Internal Control over Financial Reporting
Our management is responsible for establishing and maintaining adequate internal control over financial reporting, as such term is defined in Rule 13a-15(f) of the Exchange Act. Internal control over financial reporting is a process designed to provide reasonable assurance regarding the reliability of financial reporting and the preparation of financial statements for external reporting purposes in accordance with accounting principles generally accepted in the United States of America. Because of its inherent limitations, internal control over financial reporting may not prevent or detect misstatements. Our management has assessed the effectiveness of our internal control over financial reporting as of January 29, 2011. In making its assessment, management has utilized the criteria set forth by the Committee of Sponsoring Organizations of the Treadway Commission in Internal Control—Integrated Framework. Our management concluded that based on its assessment, our internal control over financial reporting was effective as of January 29, 2011. The effectiveness of our internal control over financial reporting as of January 29, 2011 has been audited by Deloitte & Touche LLP, an independent registered public accounting firm, as stated in their report which appears below.
Changes in Internal Control over Financial Reporting
There were no changes in our internal control over financial reporting during the fourth quarter of fiscal 2010 that have materially affected, or are reasonably likely to materially affect, our internal control over financial reporting.
71
REPORT OF INDEPENDENT REGISTERED PUBLIC ACCOUNTING FIRM
To
the Board of Directors and Stockholders of
Coldwater Creek Inc.
Sandpoint, Idaho
We have audited the internal control over financial reporting of Coldwater Creek Inc. and subsidiaries (the "Company") as of January 29, 2011, based on criteria established in Internal Control—Integrated Framework issued by the Committee of Sponsoring Organizations of the Treadway Commission. The Company's management is responsible for maintaining effective internal control over financial reporting and for its assessment of the effectiveness of internal control over financial reporting, included in the accompanying Management's Report on Internal Control over Financial Reporting. Our responsibility is to express an opinion on the Company's internal control over financial reporting based on our audit.
We conducted our audit in accordance with the standards of the Public Company Accounting Oversight Board (United States). Those standards require that we plan and perform the audit to obtain reasonable assurance about whether effective internal control over financial reporting was maintained in all material respects. Our audit included obtaining an understanding of internal control over financial reporting, assessing the risk that a material weakness exists, testing and evaluating the design and operating effectiveness of internal control based on the assessed risk, and performing such other procedures as we considered necessary in the circumstances. We believe that our audit provides a reasonable basis for our opinion.
A company's internal control over financial reporting is a process designed by, or under the supervision of, the company's principal executive and principal financial officers, or persons performing similar functions, and effected by the company's board of directors, management, and other personnel to provide reasonable assurance regarding the reliability of financial reporting and the preparation of financial statements for external purposes in accordance with generally accepted accounting principles. A company's internal control over financial reporting includes those policies and procedures that (1) pertain to the maintenance of records that, in reasonable detail, accurately and fairly reflect the transactions and dispositions of the assets of the company; (2) provide reasonable assurance that transactions are recorded as necessary to permit preparation of financial statements in accordance with generally accepted accounting principles, and that receipts and expenditures of the company are being made only in accordance with authorizations of management and directors of the company; and (3) provide reasonable assurance regarding prevention or timely detection of unauthorized acquisition, use, or disposition of the company's assets that could have a material effect on the financial statements.
Because of the inherent limitations of internal control over financial reporting, including the possibility of collusion or improper management override of controls, material misstatements due to error or fraud may not be prevented or detected on a timely basis. Also, projections of any evaluation of the effectiveness of the internal control over financial reporting to future periods are subject to the risk that the controls may become inadequate because of changes in conditions, or that the degree of compliance with the policies or procedures may deteriorate.
In our opinion, the Company maintained, in all material respects, effective internal control over financial reporting as of January 29, 2011, based on the criteria established in Internal Control—Integrated Framework issued by the Committee of Sponsoring Organizations of the Treadway Commission.
We have also audited, in accordance with the standards of the Public Company Accounting Oversight Board (United States), the consolidated financial statements as of and for the year ended January 29, 2011 of the Company and our report dated March 25, 2011 expressed an unqualified opinion on those financial statements.
/s/ Deloitte & Touche LLP
Boise,
Idaho
March 25, 2011
None
72
Item 10. DIRECTORS, EXECUTIVE OFFICERS AND CORPORATE GOVERNANCE
For information with respect to the executive officers of the Registrant, see Item 1—"Executive Officers of the Registrant" of Part I of this report.
We have a Code of Ethics applicable to our principal executive officer, principal financial officer and principal accounting officer. A copy of this Code of Ethics is available on the Investor Relations section of our web site at www.coldwatercreek.com. Any future changes or amendments to this Code of Ethics, and any waiver that applies to these individuals, will also be posted on www.coldwatercreek.com.
The other information required by this Item is incorporated herein by reference to our Proxy Statement for the Annual Meeting of Stockholders to be held on June 11, 2011 to be filed with the Commission no later than 120 days after January 29, 2011, pursuant to Regulation 14A.
Item 11. EXECUTIVE COMPENSATION
The information required by this Item is incorporated herein by reference to our Proxy Statement for the Annual Meeting of Stockholders to be held on June 11, 2011, to be filed with the Commission no later than 120 days after January 29, 2011, pursuant to Regulation 14A.
Item 12. SECURITY OWNERSHIP OF CERTAIN BENEFICIAL OWNERS AND MANAGEMENT AND RELATED STOCKHOLDER MATTERS
The information required by this Item is incorporated herein by reference to our Proxy Statement for the Annual Meeting of Stockholders to be held on June 11, 2011, to be filed with the Commission no later than 120 days after January 29, 2011, pursuant to Regulation 14A.
Item 13. CERTAIN RELATIONSHIPS AND RELATED TRANSACTIONS, AND DIRECTOR INDEPENDENCE
The information required by this Item is incorporated herein by reference to our Proxy Statement for the Annual Meeting of Stockholders to be held on June 11, 2011, to be filed with the Commission no later than 120 days after January 29, 2011, pursuant to Regulation 14A.
Item 14. PRINCIPAL ACCOUNTANT FEES AND SERVICES
The information required by this Item is incorporated herein by reference to our Proxy Statement for the Annual Meeting of Stockholders to be held on June 11, 2011, to be filed with the Commission no later than 120 days after January 29, 2011, pursuant to Regulation 14A.
73
Item 15. EXHIBITS AND FINANCIAL STATEMENT SCHEDULES
- (A)
- Documents
filed as part of this report are as follows:
- 1.
- Financial Statements.
- 2.
- Financial Statement Schedules:
See listing of financial statements included as part of this Form 10-K in Item 8 of Part II.
- 3.
- Exhibits:
Financial statement schedules are omitted because they are not applicable or the required information is shown in the consolidated financial statements or notes thereto.
The following list of exhibits includes exhibits submitted with this Form 10-K as filed with the SEC and those incorporated by reference to other filings.
| Exhibit Number |
Description of Document | ||
|---|---|---|---|
| 3.1* | Amended and Restated Certificate of Incorporation (filed with the Company's S-1, file No. 333-16651) | ||
3.1.1* |
Certificate of Amendment of Amended and Restated Certificate of Incorporation (filed with Company's Fiscal 2004 Third Quarter Report on Form 10-Q) |
||
3.2.2* |
Amended and Restated Bylaws (filed as Exhibit 3.1 to Form 8-K dated March 23, 2007) |
||
3.2.3* |
Amendment to Amended and Restated Bylaws (filed as Exhibit 3.1 to Form 8-K dated December 8, 2007) |
||
3.2.4* |
Second Amendment to Amended and Restated Bylaws (filed as Exhibit 3.1 to Form 8-K dated February 6, 2009) |
||
4.1* |
Specimen of Stock Certificate (filed with the Company's S-1/A, file No. 333-16651) |
||
10.1* |
Amended and Restated Form of Indemnity Agreement between the Registrant and each of its Directors (filed with the Company's fiscal 2003 Annual Report on Form 10-K) |
||
10.2* |
Credit Agreement dated February 13, 2009 between the Company and Wells Fargo Retail Finance, LLC (filed with the Company's Fiscal 2008 Annual Report on Form 10-K and Fiscal 2010 Second Quarter Report on Form 10-Q) |
||
10.2.1 |
Second Amendment to the Amended and Restated Credit Agreement originally dated February 13, 2009 between the Company and Wells Fargo Retail Finance, LLC |
||
10.3* |
Amended and Restated Stock Option/Stock Issuance Plan (filed with the Company's Definitive Proxy Statement filed May 10, 2005) |
||
10.4* |
Form of Stock Option Agreement under 1996 Stock Option/Stock Issuance Plan (filed with the Company's S-1, file No. 333-16651) |
||
10.4.1* |
Form of Stock Option Agreement under Amended and Restated Stock Option/Stock Issuance Plan (filed with the Company's Fiscal 2005 Annual Report on Form 10-K) |
||
10.4.2* |
Form of Incentive Stock Option Agreement under Amended and Restated Stock Option/Stock Issuance Plan (filed with the Company's Fiscal 2006 Annual Report on Form 10-K) |
||
74
| Exhibit Number |
Description of Document | ||
|---|---|---|---|
| 10.5* | Amended and Restated Parkersburg Distribution Center Lease Agreement, dated January 10, 2006 (filed as Exhibit 10.1 to Form 8-K dated January 10, 2006) | ||
10.5.1* |
Sublease Agreement between the Company and Parkersburg-Wood County Area Development Corporation, dated January 12, 2006 (filed as Exhibit 10.2 to Form 8-K dated January 10, 2006) |
||
10.5.2* |
First Amendment to Amended and Restated Lease Agreement, dated October 25, 2006, between the company and Wood County Development Authority (filed as Exhibit 10.1 to Form 8-K dated October 25, 2006) |
||
10.6.1*+ |
2006 Incentive Award Program for Executives (filed as Exhibit 99.1 to Form 8-K dated February 13, 2006) |
||
10.6.2*+ |
2007 Incentive Award Program for Executives (filed as Exhibit 10.1 to Form 8-K dated March 10, 2007) |
||
10.6.3*+ |
2008 Incentive Award Program for Executives (filed as Exhibit 10.1 to Form 8-K dated March 18, 2008) |
||
10.7*+ |
Form of Stock Unit Agreement under the Amended and Restated Stock Option/Stock Issuance Plan (filed with the Company's Fiscal 2004 Annual Report on Form 10-K) |
||
10.8*+ |
Summary of Non-Management Director Compensation (filed as Exhibit 10.1 to Form 8-K dated October 1, 2005) |
||
10.9*+ |
Form of Non-Management Director Restricted Stock Unit Agreement (filed as Exhibit 10.2 to Form 8-K dated October 1, 2005) |
||
10.10*+ |
Supplemental Employee Retirement Plan (filed as Exhibit 10.3 to Form 8-K dated October 1, 2005) |
||
10.10.1*+ |
Amendment No. 1 to Supplemental Employee Retirement Plan (filed with the Company's Fiscal 2005 Third Quarter Report on Form 10-Q) |
||
10.10.2*+ |
Amendment No. 2 to Supplemental Employee Retirement Plan (filed as Exhibit 99.1 to Form 8-K dated August 28, 2006) |
||
10.10.3*+ |
Amendment No. 3 to Supplemental Employee Retirement Plan (filed with the Company's Fiscal 2009 Annual Report on Form 10-K) |
||
10.11*+ |
Amended and Restated Employment Agreement between the Company and Georgia Shonk Simmons dated December 23, 2008 (filed with the Company's Fiscal 2008 Annual Report on Form 10-K) |
||
10.12*+ |
Employment Agreement between the Company and John E. Hayes III dated February 23, 2009 (filed with the Company's Fiscal 2008 Annual Report on Form 10-K) |
||
10.13*+ |
Employment Agreement between the Company and Jerome M. Jessup dated August 3, 2009 (filed with the Company's Fiscal 2010 Third Quarter Report on Form 10-Q) |
||
10.14+ |
Severance and Change of Control Agreement between the Company and Jill Brown Dean dated January 19, 2011 |
||
10.15*+ |
Supplemental Bonus for Dennis C. Pence (filed with the Company's Fiscal 2006 Third Quarter Report on Form 10-Q) |
||
75
| Exhibit Number |
Description of Document | ||
|---|---|---|---|
| 10.15.1*+ | Supplemental Bonus for Dennis C. Pence (filed as Exhibit 10.1 to Form 8-K dated March 23, 2007) | ||
21 |
List of Significant Subsidiaries of the Registrant |
||
23 |
Consent of Deloitte and Touche LLP, Independent Registered Public Accounting Firm |
||
24 |
Power of attorney (included on signature page hereto) |
||
31.1 |
Certification by Dennis C. Pence of annual report pursuant to Rule 13a-14(a) or Rule 15d-14(a) |
||
31.2 |
Certification by James A. Bell of annual report pursuant to Rule 13a-14(a) or Rule 15d-14(a) |
||
32 |
Certification by Dennis C. Pence and James A. Bell pursuant to 18 U.S.C. Section 1350, as adopted pursuant to Section 906 of the Sarbanes-Oxley Act of 2002 |
||
- *
- PREVIOUSLY
FILED
- +
- Represent management contracts or compensatory plans, contracts or arrangements in which the Company's directors or named executive officers participate and that are required to be filed by Item 601(10) of Regulation S-K of the Securities and Exchange Act of 1934, as amended.
76
Pursuant to the requirements of Section 13 or 15(d) of the Securities Exchange Act of 1934, the Registrant has duly caused this report to be signed on its behalf by the undersigned; thereunto duly authorized, in the City of Sandpoint, State of Idaho, on this 25th day of March 2011.
| COLDWATER CREEK INC. | ||||
By: |
/s/ DENNIS C. PENCE Dennis C. Pence Chairman of the Board of Directors, President and Chief Executive Officer (Principal Executive Officer) |
|||
I hereby appoint Dennis C. Pence and John E. Hayes, III my true and lawful attorneys-in-fact, each with full power to act without the other and each with full power of substitution, to sign on my behalf, as an individual and in the capacity stated below, and to file the Annual Report on Form 10-K of Coldwater Creek Inc. for its fiscal year ended January 29, 2011 and any amendment that such attorney-in-fact may deem appropriate or necessary. I further grant unto such attorneys and each of them full power and authority to perform each and every act necessary to be done in order to accomplish the foregoing as fully as I might do.
Pursuant to the requirements of the Securities Act of 1934, this report has been signed by the following persons on behalf of the registrant and in the capacities and on the dates indicated:
| Signature | Title | Date | ||
|---|---|---|---|---|
| /s/ DENNIS C. PENCE Dennis C. Pence |
Chairman of the Board of Directors, President and Chief Executive Officer (Principal Executive Officer) | March 25, 2011 | ||
/s/ JAMES A. BELL James A. Bell |
Senior Vice President and Chief Financial Officer (Principal Financial Officer and Principal Accounting Officer) |
March 25, 2011 |
||
/s/ MICHAEL J. POTTER Michael J. Potter |
Director |
March 25, 2011 |
||
/s/ JAMES R. ALEXANDER James R. Alexander |
Director |
March 25, 2011 |
||
/s/ JERRY GRAMAGLIA Jerry Gramaglia |
Director |
March 25, 2011 |
||
/s/ CURT HECKER Curt Hecker |
Director |
March 25, 2011 |
77
| Signature | Title | Date | ||
|---|---|---|---|---|
| /s/ KAY ISAACSON-LEIBOWITZ Kay Isaacson-Leibowitz |
Director | March 25, 2011 | ||
/s/ ROBERT H. MCCALL Robert H. McCall |
Director |
March 25, 2011 |
||
/s/ FRANK M. LESHER Frank M. Lesher |
Director |
March 25, 2011 |
78
| Exhibit Number |
Description of Document | |
|---|---|---|
| 10.2.1 | Second Amendment to the Amended and Restated Credit Agreement originally dated February 13, 2009 between the Company and Wells Fargo Retail Finance, LLC | |
10.14 |
Severance and Change of Control Agreement between the Company and Jill Brown Dean dated January 19, 2011 |
|
21 |
List of Significant Subsidiaries of the Registrant |
|
23 |
Consent of Deloitte and Touche LLP, Independent Registered Public Accounting Firm |
|
24 |
Power of attorney (included on signature page hereto) |
|
31.1 |
Certification by Dennis C. Pence of annual report pursuant to Rule 13a-14(a) or Rule 15d-14(a) |
|
31.2 |
Certification by James A. Bell of annual report pursuant to Rule 13a-14(a) or Rule 15d-14(a) |
|
32 |
Certification by Dennis C. Pence and James A. Bell pursuant to 18 U.S.C. Section 1350, as adopted pursuant to Section 906 of the Sarbanes-Oxley Act of 2002 |
79