Attached files
| file | filename |
|---|---|
| 8-K - CURRENT REPORT ON FORM 8-K - DELTA AIR LINES, INC. | delta_8k-032211.htm |
Exhibit 99.1

Delta: Building a Better Airline
J.P. Morgan Aviation, Transportation & Defense Conference
March 22, 2011

1
1
Safe Harbor
This presentation contains various projections and other forward-looking statements which
represent Delta’s estimates or expectations regarding future events. All forward-looking
statements involve a number of assumptions, risks and uncertainties, many of which are
beyond Delta’s control, that could cause the actual results to differ materially from the
projected results. Factors which could cause such differences include, without limitation,
business, economic, competitive, industry, regulatory, market and financial uncertainties
and contingencies, as well as the “Risk Factors” discussed in Delta’s Form 10-K for the year
ended December 31, 2010. Caution should be taken not to place undue reliance on Delta’s
forward-looking statements, which represent Delta’s views only as of the date of this
presentation, and which Delta has no current intention to update.
In this presentation, we will discuss certain non-GAAP financial measures. You can find the
reconciliations of those measures to comparable GAAP measures on our website at
delta.com.
reconciliations of those measures to comparable GAAP measures on our website at
delta.com.

2
2
Delta: Building a Better Airline
Higher revenues plus solid cost performance
drove $2.5 billion year-over-year improvement
in profitability for 2010
drove $2.5 billion year-over-year improvement
in profitability for 2010
Strong free cash flow
generation
generation
Solid financial foundation and low cost structure,
coupled with improved risk profile, positions
Delta to effectively address impact of high fuel
prices and events in Japan
coupled with improved risk profile, positions
Delta to effectively address impact of high fuel
prices and events in Japan
A successful 2010
Despite recent run-up in fuel prices, strong
operating cash flows with limited capital
requirements allow for sustainable free cash
flow generation
operating cash flows with limited capital
requirements allow for sustainable free cash
flow generation
Positioned to succeed in the
long-term
long-term

3
3
2010 Results Show Delta’s Solid Foundation….
2010 Operating Income ($M)
Note: All results exclude special items.
Delta’s industry-leading results are among the best in its history
In 2010, Delta:
• Improved pre-tax income by more
than $2.5 billion over 2009
than $2.5 billion over 2009
• Generated a 10% return on
invested capital
invested capital
• Increased unit revenues by 13%
• Maintained consolidated ex-fuel
unit costs at 2009 levels
unit costs at 2009 levels
• Reduced adjusted net debt by $2
billion to $15 billion
billion to $15 billion
• Successfully completed merger
integration
integration
EBIT
Margin
Margin
8.4%
5.6%
8.8%
1.8%
6.7%
9.6%
7.3%

4
…But Industry Faces Dramatic Rise in Fuel Prices
Today’s market prices reflect 2011 fuel price range of $3.05 - $3.10 per gallon
May - September
$2.02 - $2.11
$2.02 - $2.11
May 2010
Dec 2011
Prices to drive Delta’s fuel expense up by $3 billion, or 35%, over 2010
June - December
$3.13 - $3.18
$3.13 - $3.18

5
5
5
Higher Fuel Prices Driving Reduced Earnings
$325M
Capital Expenditures
Up 10 - 11%
Consolidated unit cost
March quarter 2011
Operating margin
(2 - 3%)
Fuel price
$2.90
Total unrestricted liquidity
$5.4 billion
March quarter 2011 vs.
March quarter 2010
March quarter 2010
Passenger unit revenue
Up 7 - 8%
Consolidated ex-fuel unit cost
Up 2 - 3%
System capacity
Up 4 - 5%
Domestic
Up 1 - 2%
International
Up 12 - 13%
Note: Excludes special items Fuel price is net of hedge impact, and includes taxes, transportation, and option premiums
March quarter fuel price creates over $600 million higher expense

6
• Strong revenue environment, combined with
industry fare actions, driving higher yields
industry fare actions, driving higher yields
Higher Revenues
Reduce Capacity
Fleet Efficiency
Hedge Portfolio
• Retire 120 of our least efficient aircraft over next 18
months, including DC9-50 and Saab turbo-prop
fleets, and 60 50-seat regional jets
months, including DC9-50 and Saab turbo-prop
fleets, and 60 50-seat regional jets
• Reducing 2H capacity by 4 points versus plan, with
a focus on entities where revenue has not kept pace
with fuel
a focus on entities where revenue has not kept pace
with fuel
• Reshaping hedge portfolio and locking in
hedge gains
hedge gains
Using revenues and capacity reductions to address higher fuel expense
Adapting Quickly To The New Fuel Environment

7
Revenues in all entities except transatlantic keeping pace with fuel increase
March Quarter 2011 YOY Change
|
Entity
|
Unit Revenue
|
Unit Cost
|
|
Domestic
|
Up 9 - 10%
|
Up 9 - 10%
|
|
Latin
|
Up 15 - 16%
|
Up 13 - 14%
|
|
Pacific
|
Up 11 - 12% *
|
Up 11 - 12%
|
|
Atlantic
|
Down 2 - 3%
|
Up 11 - 12%
|
|
System
|
Up 7 - 8%
|
Up 10 - 11%
|
* Prior to impact of events in Japan
Successfully Passing Fuel Cost through Revenue

8
Targeted reductions where revenue not keeping pace with costs
2H11 YOY Capacity Change
|
|
Original
Plan |
Revised
Plan |
Change |
|
Domestic
|
2%
|
(3%)
|
(5 pts)
|
|
Atlantic
|
(1%)
|
(4%)
|
(3 pts)
|
|
Latin
|
7%
|
6%
|
(1 pt)
|
|
Pacific
|
13%
|
5%
|
(8 pts)
|
|
System
|
2%
|
(2%)
|
(4 pts)
|
Capacity Actions
• Pulldown of 15-20% Japan
capacity through May,
including suspension of
Haneda
capacity through May,
including suspension of
Haneda
• Reducing Memphis hub
departures by 25%
departures by 25%
• Reduction of capacity in
underperforming Transatlantic
markets, in conjunction with JV
partners
underperforming Transatlantic
markets, in conjunction with JV
partners
Reducing 2H11 Schedule by Four Points

9
Preliminary estimates range 2011 net impact at $250 - $400 million
The situation in Japan continues to evolve….
Other Actions
• $1 million donation of cash and in-kind
support for disaster relief
support for disaster relief
• Dedicated Delta-Red Cross website to
receive donations from employees and
customers
receive donations from employees and
customers
• Standing offer of complimentary cargo
and passenger space for the American
Red Cross
and passenger space for the American
Red Cross
• Working with USAid and other
organizations to provide charter service
for evacuations and supplies
organizations to provide charter service
for evacuations and supplies
Delta Response to Japan Events
Capacity Response
• Reduce Japan capacity by 15-20%
through May to reflect likely decrease
in short-term demand
through May to reflect likely decrease
in short-term demand
• Suspend service to Haneda
• Pull back on capacity between Narita
and the beaches
and the beaches
• Selectively upgauge Asia over-flights
and increase charter operations
and increase charter operations
10
10
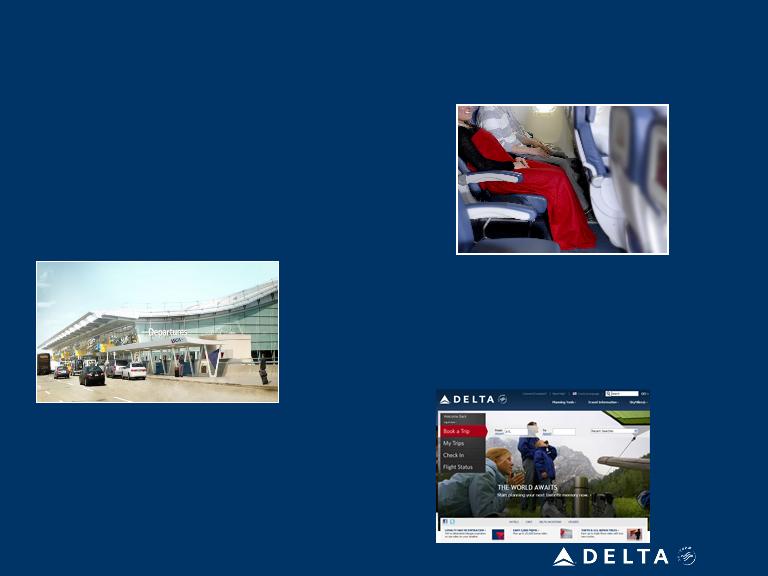
Targeting Incremental Revenue of $1 Billion by 2013
Technology, product investments underway to unlock untapped revenue streams
Deliver a Consistent, Quality Experience for Customers
• Improved seat experience with flat-beds, Economy
Comfort and more domestic first class seats
Comfort and more domestic first class seats
• State of the art facilities in JFK and Atlanta
• Customer service is a key differentiator
Offer New Products and Services Customers Value
• Seat-related products (e.g. Economy Comfort)
• SkyPriority recognizes our highest-value customers
• Ancillary products to improve the travel experience (e.g.,
hotels, SkyClub passes, Wi-Fi)
hotels, SkyClub passes, Wi-Fi)
Invest in Technology To Sustain Innovation
• Revamped eCommerce platforms enable revenue
innovation
innovation
• Improved revenue management from stronger pricing
tools
tools
JFK Terminal 4

11
% of Fuel Consumption Hedged
Responding to dislocation of WTI to jet fuel
Avg Jet Equivalent Cap $2.91 $2.89 $2.95 $2.84
Avg Jet Equivalent Floor $2.74 $2.62 $2.54 $2.62
Repositioning Fuel Hedge Portfolio
• Converted nearly all WTI hedge
positions to Brent crude or
heating oil
positions to Brent crude or
heating oil
• Current mark to market value of
$500 million with $360 million in
locked-in gains
$500 million with $360 million in
locked-in gains
• Utilizing cashless collar
structures to provide for
downside participation
structures to provide for
downside participation
12
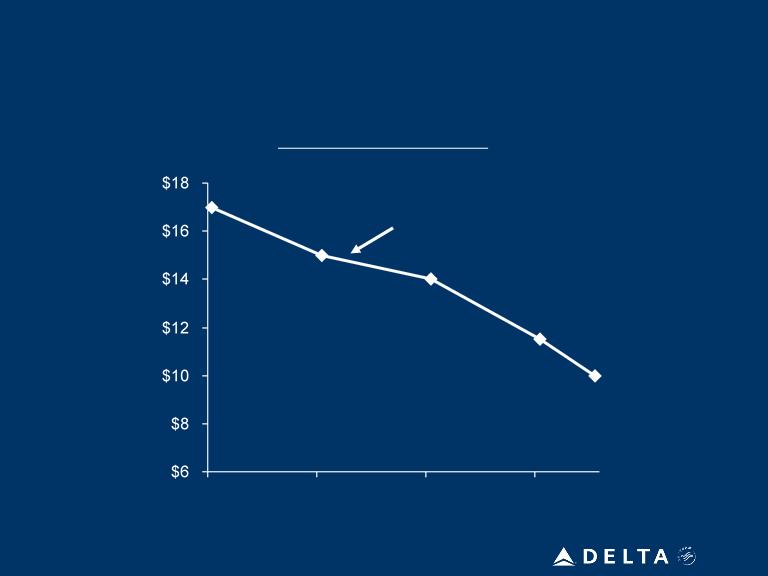
Commitment to Debt Reduction Remains Intact
Adjusted Net Debt
12/31/09
Mid-2013
High fuel will shift timing of achieving $10 billion adjusted net debt target
3/31/11
$14.6 billion
$14.6 billion
$17 billion
$10 billion

13
Scheduled Debt Maturities ($B)
Proactively Managing Near-Term Debt Maturities
$1.6
$2.1
$2.5 *
EETC
Other debt / capital leases
Exit facility
Amex
• Strong liquidity position will be maintained
by a combination of financing and
refinancing activities in addition to solid
free cash flow generation
by a combination of financing and
refinancing activities in addition to solid
free cash flow generation
• Taking advantage of market opportunities
to proactively address future maturities
and reduce cost of debt
to proactively address future maturities
and reduce cost of debt
• $200 million of 2011 EETC bullet maturity
has already been refinanced, with an
additional 26 aircraft becoming available
for future refinancing
has already been refinanced, with an
additional 26 aircraft becoming available
for future refinancing
• $1.2B of revolver commitments in hand to
refinance the 2012 exit facility
refinance the 2012 exit facility
Plan in place to maintain minimum $5 billion in liquidity
* Does not include $900 million in revolver expiration

14
Commitment To $1.3 Billion Annual CapEx
Annual Capital Spending Levels (billions)
Prudent capital management enables sustainable annual free cash flows
14
2008 2009 2010 2011 2012 2013 2014+
$2.2 $1.3 $1.3 $1.25 $1.2 $1.4 $1.3
Merger
Integration
International
Product &
Facilities
Product &
Facilities
Domestic
Narrowbody
Replacement
Narrowbody
Replacement

15
15
Path To Improving Shareholder Returns
10 - 12% operating margin
$5 billion EBITDAR
Minimize capital reinvestment
requirements
requirements
Use cash to delever the balance
sheet
sheet
Generate sustainable 10%+ return on invested capital

16
|
Non-GAAP Financial Measures
|
||||||||||
|
We sometimes use information that is derived from our Condensed Consolidated Financial Statements, but that is not presented in accordance with accounting principles generally accepted in the U.S. (“GAAP”). Certain of this information is considered “non-GAAP financial measures” under the U.S. Securities and Exchange Commission rules. The non-GAAP financial measures should be considered in addition to results prepared in accordance with GAAP, but should not be considered a substitute for or superior to GAAP results.
|
||||||||||
|
Delta is unable to reconcile certain forward-looking projections to GAAP as the nature or amount of special items cannot be estimated at this time.
|
||||||||||
|
Delta excludes special items because management believes the exclusion of these items is helpful to investors to evaluate the company’s recurring operational performance.
|
||||||||||
|
Delta presents net investing activities because management believes this metric is helpful to investors to evaluate the company’s investing activities.
|
||||||||||
|
Delta uses adjusted total debt, including aircraft rent, in addition to long-term adjusted debt and capital leases, to present estimated financial obligations. Delta reduces adjusted total debt by cash, cash equivalents and short-term investments, resulting in adjusted net debt, to present the amount of additional assets needed to satisfy the debt.
|
||||||||||
|
Delta presents return on invested capital (ROIC) as management believes it is helpful to investors in assessing the company's ability to generate returns using its invested capital. ROIC represents operating income excluding special items divided by the sum of average market value of equity and average adjusted net debt.
|
||||||||||
|
Delta presents free cash flow because management believes this metric is helpful to investors to evaluate the company’s ability to generate cash.
|
||||||||||
17
|
Pre-Tax Income
|
||||||||
|
Full Year
|
Full Year
|
|||||||
|
(in millions)
|
2010
|
2009
|
||||||
|
Pre-tax income (loss)
|
$ | 608 | $ | (1,581 | ) | |||
|
Items excluded:
|
||||||||
|
Restructuring and merger-related items
|
450 | 407 | ||||||
|
Loss on extinguishment of debt
|
391 | 83 | ||||||
|
Other
|
10 | - | ||||||
|
Pre-tax income (loss) excluding special items
|
$ | 1,459 | $ | (1,091 | ) | |||
18
|
Operating Income & Margin
|
||||
|
Full Year
|
||||
|
(in billions)
|
2010
|
|||
|
Operating income
|
$ | 2,217 | ||
|
Item excluded:
|
||||
|
Restructuring and merger-related items
|
450 | |||
|
Operating income excluding special items
|
$ | 2,667 | ||
|
Total operating revenue
|
$ | 31,755 | ||
|
Operating margin excluding special items
|
8.4 | % | ||
19
|
Total capital expenditures
|
||||||||
|
Full Year
|
Full Year
|
|||||||
|
(in billions)
|
2009
|
2008
|
||||||
|
Delta property and equipment additions (GAAP)
|
$ | 1.2 | $ | 1.5 | ||||
|
Northwest property and equipment additions (GAAP) for the period from January 1 to October 29, 2008
|
- | 1.1 | ||||||
|
Other
|
0.1 | (0.4 | ) | |||||
|
Total capital expenditures
|
$ | 1.3 | $ | 2.2 | ||||
20
|
Adjusted Net Debt & ROIC
|
||||||||||||||||
| (in billions) |
December 31, 2010
|
September 30, 2010
|
June 30, 2010
|
March 31, 2010
|
December 31, 2009
|
|||||||||||||||||||||||||||||||||||
|
Debt and capital lease obligations
|
$ | 15.3 | $ | 15.4 | $ | 15.8 | $ | 16.9 | $ | 17.2 | ||||||||||||||||||||||||||||||
|
Plus: unamortized discount, net from purchase accounting and fresh start reporting
|
0.6 | 0.7 | 1.0 | 1.1 | 1.1 | |||||||||||||||||||||||||||||||||||
|
Adjusted debt and capital lease obligations
|
$ | 15.9 | $ | 16.1 | $ | 16.8 | $ | 18.0 | $ | 18.3 | ||||||||||||||||||||||||||||||
|
Plus: 7x last twelve months' aircraft rent
|
2.7 | 3.0 | 3.2 | 3.3 | 3.4 | |||||||||||||||||||||||||||||||||||
|
Adjusted total debt
|
18.6 | 19.1 | 20.0 | 21.3 | 21.7 | |||||||||||||||||||||||||||||||||||
|
Less: cash, cash equivalents and short-term investments
|
(3.6 | ) | (3.9 | ) | (4.4 | ) | (4.9 | ) | (4.7 | ) | ||||||||||||||||||||||||||||||
|
Adjusted net debt
|
$ | 15.0 | $ | 15.2 | $ | 15.6 | $ | 16.4 | $ | 17.0 | ||||||||||||||||||||||||||||||
|
(in billions, except % return)
|
2010 | |||||||||||||||||||||||||||||||||||||||
|
Operating income
|
$ | 2.7 | ||||||||||||||||||||||||||||||||||||||
|
Market value of equity (assuming $12.60/ share)
|
$ | 10.6 | ||||||||||||||||||||||||||||||||||||||
|
Adjusted net debt
|
$ | 15.5 | ||||||||||||||||||||||||||||||||||||||
|
Total invested capital
|
$ | 26.1 | ||||||||||||||||||||||||||||||||||||||
|
Return on invested capital
|
10 | % | ||||||||||||||||||||||||||||||||||||||
21