Attached files
| file | filename |
|---|---|
| EX-23 - ROME BANCORP INC | c64837_ex23.htm |
| EX-32.1 - ROME BANCORP INC | c64837_ex32-1.htm |
| EX-31.2 - ROME BANCORP INC | c64837_ex31-2.htm |
| EX-31.1 - ROME BANCORP INC | c64837_ex31-1.htm |
| EX-32.2 - ROME BANCORP INC | c64837_ex32-2.htm |
| EX-10.21 - ROME BANCORP INC | c64837_ex10-21.htm |
| EX-10.19 - ROME BANCORP INC | c64837_ex10-19.htm |
| EX-10.16 - ROME BANCORP INC | c64837_ex10-16.htm |
| EX-10.18 - ROME BANCORP INC | c64837_ex10-18.htm |
| EX-10.20 - ROME BANCORP INC | c64837_ex10-20.htm |
| EX-10.17 - ROME BANCORP INC | c64837_ex10-17.htm |
U.S. SECURITIES AND EXCHANGE COMMISSION
WASHINGTON, D. C. 20549
FORM 10-K
ANNUAL
REPORT PURSUANT TO SECTION 13 OR 15(d) OF THE
SECURITIES EXCHANGE ACT OF 1934
For the fiscal year ended December 31, 2010
Commission File No.: 000-27481
|
|
|
ROME BANCORP, INC. |
|
(Exact name of registrant as specified in its charter) |
|
|
|
|
|
Delaware |
|
16-1573070 |
|
(State or other jurisdiction of |
|
(I.R.S. Employer |
100
W. Dominick Street, Rome, New York 13440-5810
(Address of principal executive offices)
(315) 336-7300
(Registrant’s Telephone
Number)
Securities registered pursuant to Section 12(b) of the Act:
|
|
|
|
Title of Class |
Name of exchange on which registered |
|
Common Stock, par value $0.01 per share |
The NASDAQ Stock Market, LLC |
Indicate by check mark if the registrant is a well-known seasoned issuer, as defined in Rule 405 of the Securities Act. Yes o No x
Indicate by check mark if the registrant is not required to file reports pursuant to Section 13 or Section 15(d) of the Securities Exchange Act of 1934. Yes o No x
Indicate by check mark whether the registrant (1) has filed all reports required to be filed by Section 13 or 15(d) of the Securities Act during the preceding 12 months (or for such shorter period that the registrant was required to file such reports), and (2) has been subject to such filing requirements for the past 90 days. Yes x No o
Indicate by check mark if disclosure of delinquent filers in response to Item 405 of Regulation S-K (Sect. 229.405 of this chapter) is not contained herein, and will not be contained, to the best of registrant’s knowledge, in definitive proxy or information statements incorporated by reference in Part III of this Form 10-K or any amendment to this Form 10-K. x
Indicate by check mark whether the registrant is a large accelerated filer, an accelerated filer, or a non-accelerated filer. See definition of “large accelerated filer”, “accelerated filer” and “smaller reporting company” in Rule 12b-2 of the Exchange Act. (Check one):
Large accelerated filer o Accelerated filer o Non-accelerated filer o Smaller reporting company x
Indicate by check mark whether the registrant is a shell company (as defined in Rule 12b-2 of the Exchange Act. Yes o No x
Based on the closing sales price on June 30, 2010, the aggregate market value of the voting stock held by non-affiliates of the registrant was $49,112,000.
Rome Bancorp had 6,777,551 shares of common stock outstanding as of March 15, 2011.
TABLE OF CONTENTS
Forward Looking Statements
This Annual Report on Form 10-K contains “forward-looking statements” which may be identified by the use of such words as “believe,” “expect,” “anticipate,” “should,” “planned,” “estimated,” and “potential.” Examples of forward-looking statements include, but are not limited to, estimates with respect to our financial condition and results of operation and business that are subject to various factors which could cause actual results to differ materially from these estimates including, but not limited to, changes in the real estate market or local economy, changes in interest rates, changes in laws and regulations to which we are subject, and competition in our primary market area.
Any or all of our forward-looking statements in this Annual Report on Form 10-K and in any other public statements we make may turn out to be wrong. They can be affected by inaccurate assumptions we might make or unknown risks and uncertainties. Consequently, no forward-looking statements can be guaranteed. We disclaim any obligation to subsequently revise any forward-looking statements to reflect events or circumstances after the date of such statements, or to reflect the occurrence of anticipated or unanticipated events.
|
|
|
|
BUSINESS |
Available Information
The Company files annual reports, quarterly reports, proxy statements and other documents with the Securities and Exchange Commission (“SEC”) under the Securities Exchange Act of 1934 (“Exchange Act”). The public may read and copy any materials that the Company files with the SEC at the SEC’s Public Reference Room at 100 F. Street, N.E., Room 1580, Washington, D.C. 20549. The public may obtain information on the operation of the Public Reference Room by calling the SEC at 1-800-SEC-0330. Also, the SEC maintains a website that contains reports, proxy and information statements, and other information regarding issuers, including the Company, that file electronically with the SEC. The public can obtain any documents that the Company files with the SEC at www.sec.gov.
The Company also makes available free of charge through its website (www.romesavings.com) the Company’s Annual Report on Form 10-K, Quarterly Reports on Form 10-Q, Current Reports on Form 8-K, and, if applicable, amendments to those reports filed or furnished pursuant to the Exchange Act as soon as reasonably practicable after the Company electronically files such material with, or furnishes it to, the SEC.
General
Rome Bancorp, Inc. (“Rome Bancorp” or the “Company”) is a Delaware corporation organized on June 9, 1999 as the stock holding company for The Rome Savings Bank (“Rome Savings” or the “Bank”), a federally chartered stock savings bank headquartered in Rome, New York. Rome Bancorp’s principal business is to hold the capital stock of Rome Savings.
Rome Savings is a federal stock savings bank and the wholly-owned subsidiary of Rome Bancorp. Rome Savings was originally chartered in 1851 as a New York mutual savings bank. On October 6, 1999, Rome Savings reorganized into a mutual holding company structure and formed Rome Bancorp and Rome, MHC. On April 27, 2004, Rome, MHC, Rome Bancorp and Rome Savings completed their conversions from New York-chartered companies to federally-chartered companies regulated by the Office of Thrift Supervision (the “OTS”). On March 30, 2005, Rome, MHC completed its second-step conversion and related stock
4
offering and ceased to exist.
On October 12, 2010, Berkshire Hills Bancorp, Inc., the parent company of Berkshire Bank, and the Company entered into an Agreement and Plan of Merger pursuant to which the Company will merge with and into Berkshire Hills Bancorp, Inc. Concurrent with the merger, it is expected that the Bank will merge with and into Berkshire Bank. The transaction is subject to customary closing conditions, including the receipt of regulatory approvals and approval by the shareholders of the Company, and is currently expected to be completed on or about April 1, 2011.
Rome Savings is a community and customer-oriented retail savings bank that offers traditional deposit products, residential real estate mortgage loans and consumer, commercial and commercial real estate loans. In addition, Rome Savings purchases securities issued by the U.S. Government and government agencies, municipal securities, mortgage-backed securities and other investments permitted by applicable laws and regulations. At December 31, 2010, Rome Bancorp had assets of $327.2 million, deposits of $225.3 million and stockholders’ equity of $60.7 million.
Business Strategy
Our business is to hold the capital stock of Rome Savings. Our revenues are derived principally from interest on our loans and interest and dividends on our investment securities. Our primary sources of funds are deposits, payments of loan principal and mortgage-backed securities, maturities and calls of investment securities, borrowings from the Federal Home Loan Bank, and funds provided by operations.
Market Area
Operations are conducted out of our executive office in Rome, New York and four branch offices located in Oneida County, New York, two of which are located in Rome, one in New Hartford, New York and one in Lee, New York. As of June 30, 2010, Rome Savings maintained a 7.34% share of all Oneida County, New York deposits, ranking sixth in size of deposits in Oneida County. Rome Savings also maintained a 40.95% market share of all reported funds on deposit in the City of Rome as of June 30, 2010, making it the largest depository institution in Rome.
Our geographic market area for loans and deposits is principally Oneida County, New York. The local economy is not dependent on one key employer. The principal employment sectors are service-related (excluding financial industries), wholesale and retail trade, and manufacturing.
Similar to national trends, in recent years most of the job growth realized in Oneida County has been in service related industries, and service jobs now account for the largest portion of the workforce. Our market area also includes a growing number of healthcare, engineering, software, and technical firms that have located in Oneida County in order to take advantage of its well-educated work force, including current and former military and defense industry personnel. Rome, New York is located 15 miles west of Utica and approximately 45 miles east of Syracuse. Depending on market conditions, we also occasionally originate loans in the greater New York City metropolitan area, typically through loan participations, and outside of New York State. At December 31, 2010, Rome Savings’ total loan portfolio consisted of $265.9 million in loans located in the State of New York, while $2.5 million of such portfolio consisted of loans made outside of New York.
Our future growth opportunities will be influenced by growth and stability in the regional and statewide economies, other demographic trends and the competitive environment. We believe that Rome Savings has developed lending products and marketing strategies to address the credit-related needs of the residents in our local market area.
5
Competition
Rome Savings faces intense competition both in making loans and attracting deposits. New York has a high concentration of financial institutions, many of which are branches of large money center and regional banks which have resulted from the consolidation of the banking industry in New York and surrounding states. Some of these competitors have greater resources than we do and may offer services that we do not provide. For example, Rome Savings does not provide trust or investment services, or credit cards. Customers who seek “one-stop shopping” may be drawn to these institutions.
Competition for loans comes principally from commercial banks, savings institutions, mortgage banking firms, credit unions, finance companies, insurance companies, and brokerage and investment banking firms. The most direct competition for deposits has historically come from credit unions, commercial banks, savings banks, and savings and loan associations. Rome Savings faces additional competition for deposits from short-term money market funds, corporate and government securities funds, and from brokerage firms, mutual funds, and insurance companies.
Lending Activities
General. Rome Savings has a long-standing commitment to originate commercial real estate, commercial and consumer loans, in addition to a traditional emphasis on residential lending. We retain the majority of the loans that we originate. Currently, we are selling most of the longer term residential mortgage loans we originate into the secondary market. At December 31, 2010, Rome Savings had total loans of $268.4 million, of which $144.7 million, or 53.91%, were one- to four-family residential mortgages and residential construction loans. Of residential mortgage loans outstanding at that date, 20.43% were adjustable-rate mortgage loans and 79.57% were fixed-rate loans. The remainder of Rome Savings’ loans at December 31, 2010, amounting to $123.7 million, or 46.09% of total loans, consisted of commercial real estate, commercial loans, and consumer loans. Rome Savings originates commercial real estate and commercial business loans both within and outside of Oneida County, New York. As of December 31, 2010, 18.07% of Rome Savings’ loan portfolio was in commercial real estate loans and 11.17% was in commercial loans. In addition, as of December 31, 2010, 16.85% of Rome Savings’ loan portfolio was in consumer loans.
Our loans are subject to federal and state laws and regulations. The interest rates we charge on loans are affected principally by the demand for loans, the supply of money available for lending purposes and the interest rates offered by our competitors. These factors are, in turn, affected by general and local economic conditions, monetary policies of the federal government, including the Federal Reserve Board, legislative tax policies and governmental budgetary matters.
6
Loan Portfolio. The following table sets forth the composition of our mortgage and other loan portfolios, by type of loan, in dollar amounts and in percentages at the dates indicated.
|
|
|
|
|
|
|
|
|
|
|
|
|
|
|
|
|
|
|
|
|
|
|
|
|
|
|
|
|
|
|
|
|
|
|
|
2010 |
|
2009 |
|
2008 |
|
2007 |
|
2006 |
|
||||||||||||||||||||
|
|
|
|
|
|
|
|
|
|
|
|
|
||||||||||||||||||||
|
|
|
Amount |
|
Percent |
|
Amount |
|
Percent |
|
Amount |
|
Percent |
|
Amount |
|
Percent |
|
Amount |
|
Percent |
|
||||||||||
|
|
|
|
|
|
|
|
|
|
|
|
|
|
|
|
|
|
|
|
|
|
|
||||||||||
|
Mortgage loans: |
|
|
|
|
|
|
|
|
|
|
|
|
|
|
|
|
|
|
|
|
|
|
|
|
|
|
|
|
|
|
|
|
|
|
|
|
|
|
|
|
|
|
|
|
|
|
|
|
|
|
|
|
|
|
|
|
|
|
|
|
|
|
|
|
|
One- to four-family |
|
$ |
141,741 |
|
|
52.81 |
% |
$ |
155,547 |
|
|
54.06 |
% |
$ |
170,197 |
|
|
56.65 |
% |
$ |
149,702 |
|
|
52.91 |
% |
$ |
135,078 |
|
|
51.06 |
% |
|
Commercial real estate |
|
|
48,510 |
|
|
18.07 |
|
|
52,557 |
|
|
18.26 |
|
|
49,231 |
|
|
16.39 |
|
|
49,795 |
|
|
17.60 |
|
|
54,493 |
|
|
20.60 |
|
|
Construction and land |
|
|
2,951 |
|
|
1.10 |
|
|
4,381 |
|
|
1.52 |
|
|
5,827 |
|
|
1.95 |
|
|
5,258 |
|
|
1.86 |
|
|
2,562 |
|
|
0.97 |
|
|
|
|
|
|
|
|
|
|
|
|
|
|
|
|
|
|
|
|
|
|
|
|
|
|
|
|
|
|
|
|
|
|
|
Total mortgage loans |
|
|
193,202 |
|
|
71.98 |
|
|
212,485 |
|
|
73.84 |
|
|
225,255 |
|
|
74.99 |
|
|
204,755 |
|
|
72.37 |
|
|
192,133 |
|
|
72.63 |
|
|
|
|
|
|
|
|
|
|
|
|
|
|
|
|
|
|
|
|
|
|
|
|
|
|
|
|
|
|
|
|
|
|
|
Commercial loans |
|
|
29,994 |
|
|
11.17 |
|
|
30,429 |
|
|
10.58 |
|
|
28,472 |
|
|
9.48 |
|
|
29,127 |
|
|
10.29 |
|
|
24,189 |
|
|
9.14 |
|
|
|
|
|
|
|
|
|
|
|
|
|
|
|
|
|
|
|
|
|
|
|
|
|
|
|
|
|
|
|
|
|
|
|
Consumer loans: |
|
|
|
|
|
|
|
|
|
|
|
|
|
|
|
|
|
|
|
|
|
|
|
|
|
|
|
|
|
|
|
|
Automobile |
|
|
7,526 |
|
|
2.80 |
|
|
9,377 |
|
|
3.26 |
|
|
12,927 |
|
|
4.30 |
|
|
16,009 |
|
|
5.66 |
|
|
17,779 |
|
|
6.72 |
|
|
Property improvement |
|
|
23,485 |
|
|
8.75 |
|
|
19,251 |
|
|
6.69 |
|
|
17,459 |
|
|
5.81 |
|
|
15,829 |
|
|
5.59 |
|
|
15,536 |
|
|
5.87 |
|
|
Other |
|
|
14,220 |
|
|
5.30 |
|
|
16,207 |
|
|
5.63 |
|
|
16,276 |
|
|
5.42 |
|
|
17,232 |
|
|
6.09 |
|
|
14,900 |
|
|
5.64 |
|
|
|
|
|
|
|
|
|
|
|
|
|
|
|
|
|
|
|
|
|
|
|
|
|
|
|
|
|
|
|
|
|
|
|
Total consumer loans |
|
|
45,231 |
|
|
16.85 |
|
|
44,835 |
|
|
15.58 |
|
|
46,662 |
|
|
15.53 |
|
|
49,070 |
|
|
17.34 |
|
|
48,215 |
|
|
18.23 |
|
|
|
|
|
|
|
|
|
|
|
|
|
|
|
|
|
|
|
|
|
|
|
|
|
|
|
|
|
|
|
|
|
|
|
|
|
|
|
|
|
|
|
|
|
|
|
|
|
|
|
|
|
|
|
|
|
|
|
|
|
|
|
|
|
|
|
|
Total loans |
|
|
268,427 |
|
|
100.00 |
% |
|
287,749 |
|
|
100.00 |
% |
|
300,389 |
|
|
100.00 |
% |
|
282,952 |
|
|
100.00 |
% |
|
264,537 |
|
|
100.00 |
% |
|
|
|
|
|
|
|
|
|
|
|
|
|
|
|
|
|
|
|
|
|
|
|
|
|
|
|
|
|
|
|
|
|
|
|
|
|
|
|
|
|
|
|
|
|
|
|
|
|
|
|
|
|
|
|
|
|
|
|
|
|
|
|
|
|
|
|
Less: Allowance for loan losses |
|
|
2,490 |
|
|
|
|
|
2,132 |
|
|
|
|
|
1,936 |
|
|
|
|
|
1,910 |
|
|
|
|
|
1,965 |
|
|
|
|
|
|
|
|
|
|
|
|
|
|
|
|
|
|
|
|
|
|
|
|
|
|
|
|
|
|
|
|
|
|
|
|
|
|
Loans, net |
|
$ |
265,937 |
|
|
|
|
$ |
285,617 |
|
|
|
|
$ |
298,453 |
|
|
|
|
$ |
281,042 |
|
|
|
|
$ |
262,572 |
|
|
|
|
|
|
|
|
|
|
|
|
|
|
|
|
|
|
|
|
|
|
|
|
|
|
|
|
|
|
|
|
|
|
|
|
|
7
Loan Maturity. The following table presents the contractual maturity of our loan portfolio at December 31, 2010. The table does not include the effect of prepayments or scheduled principal amortization.
|
|
|
|
|
|
|
|
|
|
|
|
|
|
|
|
|
|
At December 31, 2010 |
|
||||||||||
|
|
|
|
|
||||||||||
|
|
|
Residential |
|
Commercial Real |
|
Consumer |
|
Commercial |
|
||||
|
|
|
|
|
|
|
|
|
|
|
||||
|
|
|
(In thousands) |
|
||||||||||
|
Amounts due: |
|
|
|
|
|
|
|
|
|
|
|
|
|
|
Within one year |
|
$ |
48 |
|
$ |
2,410 |
|
$ |
1,646 |
|
$ |
10,748 |
|
|
After one year: |
|
|
|
|
|
|
|
|
|
|
|
|
|
|
One to three years |
|
|
1,117 |
|
|
450 |
|
|
7,138 |
|
|
1,525 |
|
|
Three to five years |
|
|
1,319 |
|
|
1,766 |
|
|
10,906 |
|
|
3,158 |
|
|
Five to ten years |
|
|
12,888 |
|
|
3,964 |
|
|
18,234 |
|
|
5,995 |
|
|
Ten to twenty years |
|
|
58,152 |
|
|
33,069 |
|
|
3,761 |
|
|
3,091 |
|
|
After twenty years |
|
|
71,131 |
|
|
6,888 |
|
|
3,546 |
|
|
5,477 |
|
|
|
|
|
|
|
|
|
|
|
|
|
|
|
|
|
Total due after one year |
|
|
144,607 |
|
|
46,137 |
|
|
43,585 |
|
|
19,246 |
|
|
|
|
|
|
|
|
|
|
|
|
|
|
|
|
|
Total loans |
|
$ |
144,655 |
|
$ |
48,547 |
|
$ |
45,231 |
|
$ |
29,994 |
|
|
|
|
|
|
|
|
|
|
|
|
|
|
|
|
The following table presents, as of December 31, 2010, the dollar amount of all loans, due after December 31, 2011, and whether these loans have fixed interest rates or adjustable interest rates.
|
|
|
|
|
|
|
|
|
|
|
|
|
|
|
Due After December 31, 2011 |
|
|||||||
|
|
|
|
|
|||||||
|
|
|
Fixed |
|
Adjustable |
|
Total |
|
|||
|
|
|
|
|
|
|
|
|
|||
|
|
|
(In thousands) |
|
|||||||
|
|
|
|
|
|
|
|
|
|
|
|
|
Residential mortgage loans |
|
$ |
119,383 |
|
$ |
25,224 |
|
$ |
144,607 |
|
|
Commercial real estate loans |
|
|
22,512 |
|
|
23,625 |
|
|
46,137 |
|
|
Consumer loans |
|
|
18,993 |
|
|
24,592 |
|
|
43,585 |
|
|
Commercial loans |
|
|
15,797 |
|
|
3,449 |
|
|
19,246 |
|
|
|
|
|
|
|
|
|
|
|
|
|
|
Total loans |
|
$ |
176,685 |
|
$ |
76,890 |
|
$ |
253,575 |
|
|
|
|
|
|
|
|
|
|
|
|
|
The following table presents Rome Savings’ loan originations, purchases, sales, and principal payments for the periods indicated.
|
|
|
|
|
|
|
|
|
|
|
|
|
|
|
For the Year Ended December 31, |
|
|||||||
|
|
|
|
|
|||||||
|
|
|
2010 |
|
2009 |
|
2008 |
|
|||
|
|
|
|
|
|
|
|
|
|||
|
|
|
|
|
|
|
|
|
|
|
|
|
Total loans: |
|
|
|
|
|
|
|
|
|
|
|
Balance outstanding at beginning of period |
|
$ |
287,749 |
|
$ |
300,389 |
|
$ |
282,952 |
|
|
|
|
|
|
|
|
|
|
|
|
|
|
Originations: |
|
|
|
|
|
|
|
|
|
|
|
Mortgage loans |
|
|
44,984 |
|
|
38,563 |
|
|
53,687 |
|
|
Commercial and consumer loans |
|
|
11,890 |
|
|
12,909 |
|
|
12,706 |
|
|
|
|
|
|
|
|
|
|
|
|
|
|
Total originations |
|
|
56,874 |
|
|
51,472 |
|
|
66,393 |
|
|
|
|
|
|
|
|
|
|
|
|
|
|
Principal repayments: |
|
|
|
|
|
|
|
|
|
|
|
Mortgage loans |
|
|
43,968 |
|
|
40,300 |
|
|
33,136 |
|
|
Commercial and consumer loans |
|
|
11,084 |
|
|
12,432 |
|
|
13,804 |
|
|
|
|
|
|
|
|
|
|
|
|
|
|
Total principal payments |
|
|
55,052 |
|
|
52,732 |
|
|
46,940 |
|
|
|
|
|
|
|
|
|
|
|
|
|
|
Transfers to foreclosed real estate |
|
|
65 |
|
|
192 |
|
|
505 |
|
|
|
|
|
|
|
|
|
|
|
|
|
|
Loan sales |
|
|
19,574 |
|
|
11,018 |
|
|
1,163 |
|
|
|
|
|
|
|
|
|
|
|
|
|
|
Loans charged off |
|
|
1,505 |
|
|
170 |
|
|
348 |
|
|
|
|
|
|
|
|
|
|
|
|
|
|
|
|
|
|
|
|
|
|
|
|
|
|
Balance outstanding at end of period |
|
$ |
268,427 |
|
$ |
287,749 |
|
$ |
300,389 |
|
|
|
|
|
|
|
|
|
|
|
|
|
8
Residential Mortgage Lending. Rome Savings emphasizes the origination of mortgage loans secured by one- to four-family properties that serve as the primary residence of the owner. Rome Savings does not originate subprime or interest only mortgage loans. As of December 31, 2010, loans on one-to four-family residential properties accounted for $144.7 million, or 53.91%, of Rome Savings’ total loan portfolio. Of residential mortgage loans outstanding on that date, 20.43% were adjustable-rate mortgage loans and 79.57% were fixed-rate loans. Rome Savings has expanded its residential lending activities primarily through the marketing and sale to the secondary market of longer term fixed-rate mortgage loans. Management of Rome Savings believes that the expansion of Rome Savings’ residential lending will enhance its reputation as a service-oriented institution that meets the needs of its local community.
Most of Rome Savings’ loan originations are from existing or past customers, members of Rome Savings’ local communities or referrals from local real estate agents, attorneys, and builders. Management of Rome Savings believes that its branch offices are a significant source of new loan generation.
Rome Savings’ mortgage loan originations are generally for terms from 10 to 30 years, amortized on a monthly basis with interest and principal due each month. Residential real estate loans may remain outstanding for significantly shorter periods than their contractual terms as borrowers may refinance or prepay loans at their option without penalty. Conventional residential mortgage loans granted by Rome Savings customarily contain “due-on-sale” clauses that permit Rome Savings to accelerate the indebtedness of the loan upon transfer of ownership of the mortgage property.
Rome Savings’ residential lending policies and procedures conform to secondary market guidelines. Currently, Rome Savings’ sells the majority of its newly originated qualifying fixed-rate longer-term loans into the secondary market, but continues to retain fixed rate loans with maturities of shorter terms. Rome Savings originates residential mortgage loans with a loan to value ratio up to 95%. Private mortgage insurance is not required on loans with an 80% or less loan to value ratio. All mortgages originated with a loan to value above 80% and up to 95% require private mortgage insurance with 17% to 30% coverage. Rome Savings at times may originate mortgages outside of secondary market guidelines, tailored to the needs of its customers. Commitments issued in these situations are reviewed with the Board of Directors on a monthly basis.
Rome Savings also offers residential construction loans to customers in its primary lending market. Private mortgage insurance is not currently available on construction loans. Rome Savings will make construction loans up to a 90% loan to value ratio. The program allows for mortgagors to receive up to five advances during the construction phase. Rome Savings uses third-party Board-approved inspectors to determine the advance amount and obtains a clear title report prior to making each advance. The loan converts to permanent financing at the end of six months from the initial closing whether the house is completed or not. The interest rate on the permanent financing is locked in at the time of application for the construction/permanent mortgage. Construction loans up to an 80% loan to value ratio carry a pricing premium of 0.50% to the interest rate. Construction loans with a loan to value ratio of over 80% and up to 90% carry an additional pricing premium to the interest rate of 0.25% to 0.50%. All construction loans carry a fee of 0.50% of the loan amount payable at closing in addition to standard fees and closing costs.
Rome Savings’ adjustable-rate mortgages currently in portfolio include limits on increase or decrease in the interest rate of the loan. The interest rate may increase or decrease by a maximum 2.0% per adjustment period with a ceiling rate of 11% over the life of the loan. The retention of adjustable-rate mortgage loans in our loan portfolio helps reduce exposure to changes in interest rates. However, there are unquantifiable credit risks resulting from potential increased costs to the borrower as a result of the pricing of adjustable-rate mortgage loans. During periods of rising interest rates, the risk of default on adjustable-rate mortgage loans may increase due to the upward adjustment of interest cost to the borrower.
During the year ended December 31, 2010, Rome Savings originated no adjustable-rate residential mortgage loans and $41.9 million in fixed-rate one- to four- family residential loans. Approximately 32.64% of all residential loan originations during fiscal 2010 were refinancings of loans already in Rome Savings’ portfolio. At December 31, 2010, Rome Savings’ loan portfolio included $29.6 million in adjustable-rate one to four-family residential mortgage loans, or 11.03% of its total loan portfolio, and $115.1 million in fixed-rate one to four-family residential mortgage loans, or 42.88% of its total loan portfolio.
9
Commercial Real Estate Loans. We originate commercial real estate loans to finance the purchase of real property, which generally consists of developed real estate. In underwriting commercial real estate loans, consideration is given to the property’s’ historic cash flow, current and projected occupancy, location and physical condition. At December 31, 2010, our commercial real estate loan portfolio consisted of 149 loans, totaling $48.5 million, or 18.07%, of total loans. Most of the commercial real estate portfolio consists of loans which are collateralized by properties in our normal lending area. To a lesser extent, commercial real estate loans are secured by out of market properties. A portion of Rome Savings’ commercial mortgages are participation loans. Our commercial real estate loan portfolio is diverse, and does not have any significant loan concentration by type of industry or borrower. We lend up to a maximum loan-to-value ratio of 75% on commercial properties and require a minimum debt coverage ratio of 1.25. Commercial real estate lending involves additional risks compared with one-to-four-family residential lending. Because payments on loans secured by commercial real estate properties are often dependent on the successful operation or management of the properties, or on the successful operation of the owner’s business for owner occupied properties, repayment of such loans may be affected by adverse conditions in the real estate market or the economy. Also, commercial real estate loans typically involve large loan balances to single borrowers or groups of related borrowers. Rome Savings’ loan policies limit the amount of loans to a single borrower or group of borrowers to reduce this risk.
Rome Savings commercial real estate loan portfolio includes $38,000 of construction loans. From time to time Rome Savings approves commercial construction mortgages. Recognizing the risks inherent to this type of lending, it is Rome Savings’ practice to minimize lending risk by carefully studying project feasibility, developing a detailed knowledge of the borrower/guarantor’s entire business operation, assessing both primary and secondary sources of repayment, and by structuring the credit in a manner appropriate to the project.
Rome Savings will only consider construction lending where it holds a first position mortgage lien on the subject premises. No construction loan will be advanced without permanent financing approved by Rome Savings or another lender. Commitments from any source other than this bank must be reviewed for capacity and conditions. Rome Savings’ exposure cannot exceed 75% of the project cost. Rome Savings requires that up-front equity requirements be met in cash or free and clear value of the land directly associated with the project. The ratio of projected cash flow versus debt service coverage must equal or exceed 1.25. Construction loans may have interest only payments until completion of the project but not beyond 12 months. Personal guaranties are required of the principals of closely held entities. Funds are disbursed only after proper documentation of work completed. A 5% to 10% retainage is normally required.
Commercial Loans. In addition to commercial real estate loans, we also engage in small business commercial lending, including business term loans, lines of credit and other commercial loans. At December 31, 2010, our commercial loan portfolio consisted of 459 loans, totaling $30.0 million, or 11.17% of total loans. A portion of Rome Savings’ commercial loans are participation loans. Term loans are typically limited to a term of five years. Substantially all lines of credit have variable interest rates tied to the prime rate. Typically, Rome Savings collateralizes these loans with a lien on business assets and equipment, occasionally commercial real estate, plus the personal guarantees from principals of the borrower. Interest rates on commercial loans generally have higher yields than residential mortgages.
Rome Savings offers commercial services administered by Rome Savings’ commercial loan department that are designed to give business owners borrowing opportunities for modernization, inventory, equipment, construction, consolidation, real estate, working capital, vehicle purchases, and the refinancing of existing corporate debt.
Commercial loans are generally considered to involve a higher degree of risk than residential mortgage loans because the collateral may be in the form of intangible assets and/or inventory subject to market obsolescence. Commercial loans may also involve relatively large loan balances to single borrowers or groups of related borrowers, with the repayment of such loans typically dependent on the successful operation and income stream of the borrower. Such risks can be significantly affected by economic conditions. In addition, commercial business lending generally requires substantially greater oversight efforts compared to residential real estate lending. Rome Savings utilizes the services of an outside consultant to conduct on-site reviews of the commercial loan portfolio to ensure adherence to underwriting standards and policy requirements.
10
Consumer Loans. Rome Savings offers a variety of consumer loans. At December 31, 2010, the consumer loan portfolio totaled $45.2 million or 16.85% of total loans. Consumer loans generally are offered for terms of up to 10 years, depending on the collateral, at fixed interest rates. Rome Savings’ consumer loan portfolio consists primarily of property improvement loans (i.e., home equity loans and home equity lines of credit) and used automobile loans. To a lesser extent, the consumer loan portfolio also includes:
|
|
|
|
|
|
• |
new automobile loans; |
|
|
|
|
|
|
• |
recreational vehicles, boats, and conversion vans; |
|
|
|
|
|
|
• |
motorcycles, ATVs, snowmobiles, and equipment loans; |
|
|
|
|
|
|
• |
secured passbook loans; |
|
|
|
|
|
|
• |
unsecured loans; |
|
|
|
|
|
|
• |
education loans; and |
|
|
|
|
|
|
• |
mobile or manufactured home loans. |
Rome Savings expects consumer lending to be a continuing source of loan volume, with installment loans continuing to account for the major portion of our consumer lending volume. Property improvement loans, currently comprises the largest portion of the consumer loan portfolio at 51.92%. Rome Savings makes loans secured by deposit accounts up to 90% of the amount of the depositor’s savings account balance. Rome Savings also makes other consumer loans, which may or may not be secured. The terms of such loans vary depending on the collateral.
Rome Savings provides home equity lines of credit for any purpose, using the applicant’s principal residence. The normal loan to value for these lines is 90%. This product has a ten-year interest-only draw period. During this period, principal reductions are at the applicant’s discretion. At the end of the ten-year period, any outstanding principal balance due is termed out over 15 years with payments to principal plus interest monthly. These lines have a variable interest at prime rate. Access to these lines is by customer checks. All closing costs are waived providing that the line remains open for at least three years. In addition, Rome Savings offers fixed rate amortizing installment home equity loans with terms of up to fifteen years.
Rome Savings makes loans for automobiles, both new and used, directly to the borrowers. The term of automobile loans is generally limited to five years. The financial terms of the loans are determined by the age of the collateral. Rome Savings obtains a title lien on the vehicle and collision insurance policies are required on all these loans. Rome Savings pays a referral fee of no more than $225 to automobile dealers who refer it customers. There is no difference in the interest rates and terms offered to customers who are referred and those who are not.
Consumer loans are generally originated at higher interest rates than residential mortgage loans, but also tend to have a higher credit risk than residential loans due to the loan being unsecured or secured by rapidly depreciating assets. Despite these risks, Rome Savings’ level of consumer loan delinquencies generally has been low. No assurance can be given, however, that Rome Savings’ delinquency rate on consumer loans will continue to remain low in the future, or that it will not incur future losses on these activities.
Loan Approval Procedures and Authority. Rome Savings’ lending policies are established by its Board of Directors. The policies differ depending on the type of loan involved.
|
|
|
|
|
|
• |
Residential Mortgage Loans: Following underwriting, each mortgage application is reviewed by a designated employee or officer who has authority to approve mortgages up to $417,000. Mortgages over $417,000 must be presented to the Bank’s Lending Committee, Executive Committee, or Board of Directors for approval. |
11
|
|
|
|
|
|
• |
Commercial Loans and Commercial Mortgage Loans: The maximum commercial loan or commercial mortgage amount is dictated by Rome Savings’ portfolio management guidelines. The total of all credit extended to one borrower may not exceed $7.0 million. The maximum amount of any single loan, or combination of loans secured by the same collateral, is $3.0 million. Rome Savings may not exceed the legal limits of lending to one borrower, currently 15% of unimpaired capital, not including accumulated other comprehensive income. See “– Regulation and Supervision – Regulation of Federal Savings Associations – Loans to One Borrower.” Per Rome Savings’ internal policies, loans to one borrower include group credit. A group credit is broadly defined as any credit, either direct, indirect, or contingent, including unused lines of credit and other commitments by Rome Savings to lend, extended either jointly or severally to individuals, joint ventures, partnerships, corporations, subsidiaries or affiliates, which are commonly controlled or where the credit reliance is similar. The minimum amount for a commercial loan is not specific in policy but loans under $5,000 are unusual. The minimum amount for a commercial mortgage is not specified in policy but mortgages under $25,000 are unusual. |
|
|
|
|
|
|
|
One designated vice president of Rome Savings Bank has the authority to approve commercial loans which are secured by liquid collateral up to $425,000 and may approve other commercial loans up to $300,000. Rome Savings’ President and Chief Executive Office may approve commercial loans which are secured by liquid collateral up to $650,000, and all other commercial loans up to $400,000. Jointly these two officers may approve commercial loans which are secured by liquid collateral up to $800,000 and may approve all other commercial loans up to $500,000. Any commercial loan request in excess of the approval authority outlined above must be presented to the bank’s Lending Committee, Executive Committee, or Board of Directors for approval. |
|
|
|
|
|
|
|
One designated vice president of Rome Savings Bank has the authority to approve commercial mortgages up to $325,000. Rome Savings’ President and Chief Executive Officer has authority to approve commercial mortgages up to $500,000. Jointly these two officers may approve a commercial mortgage up to $700,000. Any commercial mortgage request in excess of the approval authorities outlined above must be presented to Rome Savings’ Lending Committee, Executive Committee, or Board of Directors for approval. |
|
|
|
|
|
|
• |
Consumer Loans: Rome Savings extends consumer loans in amounts starting at a minimum of $1,000, and with no upper limit, other than the portfolio management guidelines. Approvals begin at the interviewer level with various approval authorities ranging from $5,000 to $75,000. Loan requests above these amounts are then addressed up to $100,000 with the Vice President of Consumer Loans, or the Senior Loan Officer, and up to $400,000 with the President and Chief Executive Officer. Requests above $400,000 are referred to the Lending Committee, Executive Committee, or the Board of Directors. |
|
|
|
|
|
|
• |
Home Equity Lines of Credit: Lines of credit against an applicant’s principal residence extend from $7,500 to $250,000. Approvals for these lines are handled as follows: up to $100,000 by the assistant to the head of the Consumer Lending Department; $250,000 by the Vice President of Consumer Lending or the Senior Loan Officer or Rome Savings’ President and Chief Executive Officer. Any exceptions to the normal parameters are approved by the Lending Committee, Executive Committee, or the Board of Directors. |
Current Lending Procedures. Upon receipt of a completed loan application from a prospective borrower, Rome Savings orders a credit report and verifies certain other information. If necessary, Rome Savings obtains additional financial or credit related information. Rome Savings requires an appraisal for all mortgage loans, including loans made to refinance existing mortgage loans. Appraisals are performed by licensed or certified third-party appraisal firms that have been approved by Rome Savings’ Board of Directors. Rome Savings requires title insurance on all secondary market mortgage loans and certain other loans. Rome Savings requires borrowers to obtain hazard insurance, and if applicable, Rome Savings requires borrowers to obtain flood insurance prior to closing. Also available to borrowers is the option to advance funds on a monthly basis, together with each payment of principal and interest, to a
12
mortgage escrow account from which Rome Savings makes disbursements for items such as real estate taxes, flood insurance, and private mortgage insurance premiums, if required.
Asset Quality
One of Rome Savings’ key operating objectives has been and continues to be maintaining a high level of asset quality. Through a variety of strategies, including but not limited to borrower workout arrangements and aggressive marketing of foreclosed properties, Rome Savings has been proactive in addressing problem and non-performing assets. These strategies, as well as Rome Savings’ high proportion of one-to-four family mortgage loans, the maintenance of sound credit standards for new loan originations, and loan administration procedures, have resulted in low delinquency ratios and, in comparison to peer institutions, a relatively low level of non-performing assets. These factors have helped strengthen Rome Savings’ financial condition.
Collection Procedures. When a borrower fails to make required payments on a loan, Rome Savings takes a number of steps to induce the borrower to cure the delinquency and restore the loan to a current status. In the case of mortgage loans, Rome Savings’ servicing department is responsible for collection procedures from the 15th day up to the 120th day of delinquency. A late charge notice is sent at 15 days. A reminder letter requesting prompt payment is sent on the 25th day. At 30 days, Rome Savings also attempts to establish telephone contact with the borrower. If no contact is established, progressively stronger collection letters are sent on the 45th and 55th days of delinquency. Late charge notices are sent on the 30th and 60th days of the delinquency. Between the 60th and 90th day of delinquency, if telephone contact has not been established or if there has been mail returned, the collector or his or her assistant makes a physical inspection of the property. When contact is made with the borrower at any time prior to foreclosure, Rome Savings attempts to obtain full payment of the amount delinquent or work out a repayment schedule with the borrower in order to avoid foreclosure. It has been Rome Savings’ experience that most loan delinquencies are cured within 105 days and no legal action is taken.
Rome Savings sends the “right to cure” foreclosure notice when a loan is approximately 75 days delinquent. This contains a “right to cure” clause that gives the customer the terms that must be met within 30 days of the date the letter is sent in order to avoid foreclosure action. After this letter expires, a recommendation for foreclosure is presented to the Board of Directors for approval. Upon approval the loan is forwarded to outside legal counsel to commence the foreclosure action. If a foreclosure action is commenced and the loan is brought current, paid in full, or refinanced before the foreclosure sale, is held, the foreclosure action would be terminated. If Rome Savings becomes the owner of the real property at the foreclosure sale, it is held as other real estate owned. The property is valued at fair market value less estimated selling costs. Other real estate property is actively marketed and sold by the Bank as soon as practical. The collection procedures for Federal Housing Association (“FHA”) and Veterans’ Administration (“VA”) one-to four-family mortgage loans follow the collection guidelines outlined by those agencies.
The collection procedures for consumer, commercial, and other loans, include the sending of periodic late notices and letters to a borrower once a loan is past due. Rome Savings attempts to make direct contact with a borrower once a loan is 15 days past due. Rome Savings follows the same collection procedure as mortgages in an attempt to reach individuals by telephone and sending them letters and notices. Supervisory personnel in Rome Savings’ lending area and in its collection area review loans 30 days or more delinquent on a regular basis. If collection activity is unsuccessful after 120 days, Rome Savings may charge off a loan and/or refer the matter to an outside collection agency or to the Bank’s legal counsel for further collection effort. Monthly, loans deemed uncollectible are proposed for charge-off. Charge-offs up to $10,000 may be approved by the Bank’s senior loan officer. Charge-offs $10,000 and greater require approval of both the senior loan officer and the President of Rome Savings. All charge-offs are reported to the Board of Directors of Rome Savings at its next scheduled meeting.
Rome Savings’ policies require that management continuously monitor the status of the loan portfolio and report to the Board of Directors on a monthly basis. These reports include information on delinquent loans and foreclosed real estate and Rome Savings’ actions and plans to cure the delinquent status of the loans and to dispose of the real estate.
Non-Performing Assets. Non-performing assets totaled $3.0 million and $1.9 million at December 31, 2010 and December 31, 2009, respectively.
13
The following table presents information regarding non-accrual mortgage and consumer and other loans, accruing loans delinquent 90 days or more, and foreclosed real estate as of the dates indicated.
|
|
|
|
|
|
|
|
|
|
|
|
|
|
|
|
|
|
|
|
|
At December 31, |
|
|||||||||||||
|
|
|
|
|
|||||||||||||
|
|
|
2010 |
|
2009 |
|
2008 |
|
2007 |
|
2006 |
|
|||||
|
|
|
|
|
|
|
|
|
|
|
|
|
|||||
|
|
|
(Dollars in thousands) |
|
|||||||||||||
|
Nonaccruing loans: |
|
|
|
|
|
|
|
|
|
|
|
|
|
|
|
|
|
Mortgage loans |
|
$ |
1,590 |
|
$ |
1,165 |
|
$ |
1,094 |
|
$ |
653 |
|
$ |
575 |
|
|
Commercial loans |
|
|
311 |
|
|
528 |
|
|
105 |
|
|
271 |
|
|
423 |
|
|
Consumer loans |
|
|
291 |
|
|
179 |
|
|
74 |
|
|
44 |
|
|
98 |
|
|
|
|
|
|
|
|
|
|
|
|
|
|
|
|
|
|
|
|
Total |
|
|
2,192 |
|
|
1,872 |
|
|
1,273 |
|
|
968 |
|
|
1,096 |
|
|
Accruing loans delinquent 90 days or more |
|
|
847 |
|
|
43 |
|
|
— |
|
|
35 |
|
|
8 |
|
|
|
|
|
|
|
|
|
|
|
|
|
|
|
|
|
|
|
|
Total non-performing loans |
|
|
3,039 |
|
|
1,915 |
|
|
1,273 |
|
|
1,003 |
|
|
1,104 |
|
|
Foreclosed real estate, net |
|
|
— |
|
|
— |
|
|
331 |
|
|
97 |
|
|
45 |
|
|
|
|
|
|
|
|
|
|
|
|
|
|
|
|
|
|
|
|
Total non-performing assets |
|
$ |
3,039 |
|
$ |
1,915 |
|
$ |
1,604 |
|
$ |
1,100 |
|
$ |
1,149 |
|
|
|
|
|
|
|
|
|
|
|
|
|
|
|
|
|
|
|
|
Non-performing loans to total loans |
|
|
1.13 |
% |
|
0.67 |
% |
|
0.42 |
% |
|
0.35 |
% |
|
0.42 |
% |
|
Non-performing assets to total assets |
|
|
0.93 |
% |
|
0.58 |
% |
|
0.47 |
% |
|
0.35 |
% |
|
0.38 |
% |
With the exception of first mortgage loans insured or guaranteed by the FHA or VA or for which the borrower has obtained private mortgage insurance, Rome Savings stops accruing income on loans when interest or principal payments are 90 days in arrears or earlier when the timely collectibility of such interest or principal is doubtful. Rome Savings designates loans on which it stops accruing income as non-accrual loans and it reverses outstanding interest that it previously credited. Rome Savings may recognize income in the period that it collects such income, when the ultimate collectibility of principal is no longer in doubt. Rome Savings returns a non-accrual loan to accrual status when factors indicating doubtful collection no longer exist. Rome Savings defines non-performing loans as both non-accruing and accruing loans for which payments are 90 days or more past due.
We define the population for evaluation of impaired loans to be all non-accrual commercial real estate and commercial loans greater than $250,000. Impaired loans are individually assessed to determine whether a loan’s carrying value is not in excess of the fair value of the collateral or the present value of the loan’s cash flows. Smaller balance homogeneous loans that are collectively evaluated for impairment, such as residential mortgage loans and consumer loans, are specifically excluded from the impaired loan portfolio. The Company’s recorded investment in loans that are considered impaired totaled $3.2 million and $698,000 at December 31, 2010 and 2009, respectively. If all non-accrual loans had been current in accordance with their terms during the year ended December 31, 2010, 2009 and 2008, interest income on such loans would have amounted to $33,800, $65,300 and $85,800, respectively. At December 31, 2010, Rome Savings had no loans which were considered to be a “troubled debt restructuring”.
14
Allowance for Loan Losses. The following table sets forth activity in Rome Savings’ allowance for loan losses and other ratios at or for the dates indicated.
|
|
|
|
|
|
|
|
|
|
|
|
|
|
|
|
|
|
|
|
|
At December 31, |
|
|||||||||||||
|
|
|
|
|
|||||||||||||
|
|
|
2010 |
|
2009 |
|
2008 |
|
2007 |
|
2006 |
|
|||||
|
|
|
|
|
|
|
|
|
|
|
|
|
|||||
|
|
|
(Dollars in thousands) |
|
|||||||||||||
|
Balance at beginning of year |
|
$ |
2,132 |
|
$ |
1,936 |
|
$ |
1,910 |
|
$ |
1,965 |
|
$ |
1,960 |
|
|
Provision for loan losses |
|
|
1,796 |
|
|
300 |
|
|
300 |
|
|
50 |
|
|
147 |
|
|
Charge-offs: |
|
|
|
|
|
|
|
|
|
|
|
|
|
|
|
|
|
Mortgage loans |
|
|
— |
|
|
15 |
|
|
15 |
|
|
— |
|
|
19 |
|
|
Commercial loans |
|
|
1,395 |
|
|
26 |
|
|
215 |
|
|
78 |
|
|
50 |
|
|
Consumer loans |
|
|
110 |
|
|
129 |
|
|
118 |
|
|
155 |
|
|
303 |
|
|
|
|
|
|
|
|
|
|
|
|
|
|
|
|
|
|
|
|
Total |
|
|
1,505 |
|
|
170 |
|
|
348 |
|
|
233 |
|
|
372 |
|
|
Recoveries |
|
|
|
|
|
|
|
|
|
|
|
|
|
|
|
|
|
Mortgage loans |
|
|
4 |
|
|
4 |
|
|
1 |
|
|
1 |
|
|
10 |
|
|
Commercial loans |
|
|
4 |
|
|
1 |
|
|
1 |
|
|
21 |
|
|
79 |
|
|
Consumer loans |
|
|
59 |
|
|
61 |
|
|
71 |
|
|
106 |
|
|
141 |
|
|
|
|
|
|
|
|
|
|
|
|
|
|
|
|
|
|
|
|
Total |
|
|
67 |
|
|
66 |
|
|
74 |
|
|
128 |
|
|
230 |
|
|
|
|
|
|
|
|
|
|
|
|
|
|
|
|
|
|
|
|
Net charge-offs |
|
|
1,438 |
|
|
104 |
|
|
274 |
|
|
105 |
|
|
142 |
|
|
|
|
|
|
|
|
|
|
|
|
|
|
|
|
|
|
|
|
Balance at end of year |
|
$ |
2,490 |
|
$ |
2,132 |
|
$ |
1,936 |
|
$ |
1,910 |
|
$ |
1,965 |
|
|
|
|
|
|
|
|
|
|
|
|
|
|
|
|
|
|
|
|
Ratio of net charge-offs to average loans outstanding during the period |
|
|
0.51 |
% |
|
0.04 |
% |
|
0.09 |
% |
|
0.04 |
% |
|
0.06 |
% |
|
Allowance for loan losses as a percent of loans |
|
|
0.92 |
% |
|
0.74 |
% |
|
0.64 |
% |
|
0.68 |
% |
|
0.74 |
% |
|
Allowance for loan losses as a percent of non-performing loans |
|
|
81.93 |
% |
|
111.40 |
% |
|
152.08 |
% |
|
190.40 |
% |
|
177.99 |
% |
The allowance for loan losses is a valuation account that reflects our evaluation of the losses inherent in our loan portfolio. We maintain the allowance through provisions for loan losses that we charge to income. We charge losses on loans against the allowance for loan losses when we believe the collection of loan principal is unlikely.
Our evaluation of risk in maintaining the allowance for loan losses includes the review of all loans on which the collectibility of principal may not be reasonably assured. We consider the following factors as part of this evaluation: our historical loan loss experience, known and inherent risks in the loan portfolio, the estimated value of the underlying collateral and current economic and market trends. There may be other factors that may warrant our consideration in maintaining an allowance at a level sufficient to provide for probable losses. Although we believe that we have established and maintained the allowance for loan losses at adequate levels, future additions may be necessary if economic and other conditions in the future differ substantially from the current operating environment.
In addition, various regulatory agencies, as an integral part of their examination process, periodically review our loan and foreclosed real estate portfolios and the related allowance for loan losses and valuation allowance for foreclosed real estate. These agencies, including the OTS, may require us to increase the allowance for loan losses or the valuation allowance for foreclosed real estate based on their judgments of information available to them at the time of their examination, thereby adversely affecting our results of operations.
For the year ended December 31, 2010, we increased our allowance for loan losses through a $1.8 million provision for loan losses based on our evaluation of the items discussed above. We believe that the allowance for loan losses accurately reflects the level of risk in the loan portfolio. In addition to the non-performing loans, management has identified, through normal internal credit review procedures, $12.61 million in “potential problem loans” at December 31, 2010. Payments are current on $9.10 million or 72.14% of these loans. These problem loans are defined as loans not included as non-performing loans, but about which management has developed information regarding possible credit problems, which may cause the borrowers future difficulties in complying with loan repayments. Rome
15
Savings will continue to be aggressive in identifying, monitoring and resolving potential problem loans. See “Management’s Discussion and Analysis of Financial Condition and Results of Operations - Comparison of Results of Operations for the Years Ended December 31, 2010 and December 31, 2009 - Provision for Loan Losses” included in the document.
16
The following table presents our allocation of the allowance for loan losses by loan category and the percentage of loans in each category to total loans at the periods indicated.
|
|
|
|
|
|
|
|
|
|
|
|
|
|
|
|
|
|
|
|
|
|
|
|
|
|
|
|
|
|
|
|
|
|
|
|
At December 31, |
|
||||||||||||||||||||||||||||
|
|
|
|
|
||||||||||||||||||||||||||||
|
|
|
2010 |
|
2009 |
|
2008 |
|
2007 |
|
2006 |
|
||||||||||||||||||||
|
|
|
|
|
|
|
|
|
|
|
|
|
||||||||||||||||||||
|
|
|
Amount |
|
Loans in |
|
Amount |
|
Loans in |
|
Amount |
|
Loans in |
|
Amount |
|
Loans in |
|
Amount |
|
Loans in |
|
||||||||||
|
|
|
|
|
|
|
|
|
|
|
|
|
|
|
|
|
|
|
|
|
|
|
||||||||||
|
|
|
(Dollars in thousands) |
|
||||||||||||||||||||||||||||
|
Mortgage loans: |
|
|
|
|
|
|
|
|
|
|
|
|
|
|
|
|
|
|
|
|
|
|
|
|
|
|
|
|
|
|
|
|
One to four-family |
|
$ |
251 |
|
|
52.81 |
% |
$ |
160 |
|
|
54.06 |
% |
$ |
132 |
|
|
56.65 |
% |
$ |
141 |
|
|
52.91 |
% |
$ |
117 |
|
|
51.06 |
% |
|
Commercial real estate |
|
|
513 |
|
|
18.07 |
|
|
514 |
|
|
18.26 |
|
|
746 |
|
|
16.39 |
|
|
618 |
|
|
17.60 |
|
|
721 |
|
|
20.60 |
|
|
Construction & land |
|
|
2 |
|
|
1.10 |
|
|
0 |
|
|
1.52 |
|
|
0 |
|
|
1.95 |
|
|
0 |
|
|
1.86 |
|
|
0 |
|
|
0.97 |
|
|
|
|
|
|
|
|
|
|
|
|
|
|
|
|
|
|
|
|
|
|
|
|
|
|
|
|
|
|
|
|
|
|
|
Total mortgage loans |
|
|
766 |
|
|
71.98 |
|
|
674 |
|
|
73.84 |
|
|
878 |
|
|
74.99 |
|
|
759 |
|
|
72.37 |
|
|
838 |
|
|
72.63 |
|
|
|
|
|
|
|
|
|
|
|
|
|
|
|
|
|
|
|
|
|
|
|
|
|
|
|
|
|
|
|
|
|
|
|
Commercial loans |
|
|
1,259 |
|
|
11.17 |
|
|
940 |
|
|
10.58 |
|
|
575 |
|
|
9.48 |
|
|
689 |
|
|
10.29 |
|
|
667 |
|
|
9.14 |
|
|
|
|
|
|
|
|
|
|
|
|
|
|
|
|
|
|
|
|
|
|
|
|
|
|
|
|
|
|
|
|
|
|
|
Consumer loans |
|
|
465 |
|
|
16.85 |
|
|
518 |
|
|
15.58 |
|
|
483 |
|
|
15.53 |
|
|
462 |
|
|
17.34 |
|
|
460 |
|
|
18.23 |
|
|
|
|
|
|
|
|
|
|
|
|
|
|
|
|
|
|
|
|
|
|
|
|
|
|
|
|
|
|
|
|
|
|
|
|
|
|
|
|
|
|
|
|
|
|
|
|
|
|
|
|
|
|
|
|
|
|
|
|
|
|
|
|
|
|
|
|
Total allowance for loan losses |
|
$ |
2,490 |
|
|
100.00 |
% |
$ |
2,132 |
|
|
100.00 |
% |
$ |
1,936 |
|
|
100.00 |
% |
$ |
1,910 |
|
|
100.00 |
% |
$ |
1,965 |
|
|
100.00 |
% |
|
|
|
|
|
|
|
|
|
|
|
|
|
|
|
|
|
|
|
|
|
|
|
|
|
|
|
|
|
|
|
|
|
17
Investment Activities
General. The Board of Directors reviews and approves our investment policy on an annual basis. The Board of Directors has delegated primary responsibility for ensuring that the guidelines in the investment policy are followed to the Executive Vice President/Chief Financial Officer. The Executive Vice President/Chief Financial Officer reports to the Asset Liability Committee (ALCO) and to the Executive Committee monthly.
Our investment policy is designed primarily to manage the interest rate sensitivity of our assets and liabilities, to generate a favorable return without incurring undue interest rate and credit risk, to complement our lending activities and to provide and maintain liquidity within established guidelines. In establishing our investment strategies, we consider our interest rate sensitivity, the types of securities to be held, liquidity and other factors. Federal chartered savings banks have authority to invest in various types of assets, including U.S. Government obligations, securities of various federal agencies, obligations of states and municipalities, mortgage-backed securities, certain time deposits of insured banks and savings institutions, certain bankers’ acceptances, repurchase agreements, loans of federal funds, and, subject to certain limits, corporate debt and commercial paper.
Rome Savings classifies securities as held to maturity or available for sale at the date of purchase. Held to maturity securities are reported at cost, adjusted for amortization of premium and accretion of discount. Available for sale securities are reported at fair market value. Rome Savings classifies U.S. Government securities and U.S. Government agency securities, as available for sale. These securities predominately have maturities of less than five years although Rome Savings also invests in adjustable rate U.S. Government agency securities with maturities up to 15 years.
Rome Savings also invests in privately insured state and municipal obligations with a maturity of fifteen years or less rated AAA by Moody’s, Standard & Poors, or Fitch. Rome Savings invests in these securities because of their favorable after tax yields in comparison to U.S. Government and U.S. Government Agency securities of comparable maturity. These securities are classified as available for sale. Rome Savings purchases A and AA rated corporate bonds, principally of financial institutions, as means of increasing yields on available for sale investments while minimizing risk. Finally, Rome Savings and Rome Bancorp have investments in Federal Home Loan Bank (“FHLB”) stock and other equity securities, which are classified as available for sale.
18
The following table presents the composition of our securities portfolios in dollar amount and in percentage of each investment type at the dates indicated. It also presents the coupon type for the mortgage-backed securities portfolio.
|
|
|
|
|
|
|
|
|
|
|
|
|
|
|
|
|
|
|
|
|
|
|
|
At December 31, |
|
||||||||||||||||
|
|
|
|
|
||||||||||||||||
|
|
|
2010 |
|
2009 |
|
2008 |
|
||||||||||||
|
|
|
|
|
|
|
|
|
||||||||||||
|
|
|
Amortized |
|
Fair |
|
Amortized |
|
Fair |
|
Amortized |
|
Fair |
|
||||||
|
|
|
|
|
|
|
|
|
|
|
|
|
|
|
||||||
|
|
|
(Dollars in thousands) |
|
||||||||||||||||
|
Held to Maturity: |
|
|
|
|
|
|
|
|
|
|
|
|
|
|
|
|
|
|
|
|
Mortgage-backed securities |
|
|
|
|
|
|
|
|
|
|
|
|
|
|
|
|
|
|
|
|
|
|||||||||||||||||||
|
GNMA |
|
$ |
— |
|
$ |
— |
|
$ |
1 |
|
$ |
1 |
|
$ |
7 |
|
$ |
7 |
|
|
U.S. Government securities |
|
|
1,309 |
|
|
1,352 |
|
|
1,316 |
|
|
1,387 |
|
|
1,322 |
|
|
1,436 |
|
|
Other bonds |
|
|
107 |
|
|
107 |
|
|
114 |
|
|
114 |
|
|
118 |
|
|
118 |
|
|
|
|
|
|
|
|
|
|
|
|
|
|
|
|
|
|
|
|
|
|
|
Total held to maturity |
|
|
1,416 |
|
|
1,459 |
|
|
1,431 |
|
|
1,502 |
|
|
1,447 |
|
|
1,561 |
|
|
|
|
|
|
|
|
|
|
|
|
|
|
|
|
|
|
|
|
|
|
|
|
|
|
|
|
|
|
|
|
|
|
|
|
|
|
|
|
|
|
|
|
Available for sale: |
|
|
|
|
|
|
|
|
|
|
|
|
|
|
|
|
|
|
|
|
Corporate bonds |
|
|
10,672 |
|
|
10,926 |
|
|
6,597 |
|
|
6,643 |
|
|
— |
|
|
— |
|
|
State and Municipal obligations |
|
|
1,670 |
|
|
1,785 |
|
|
2,294 |
|
|
2,413 |
|
|
2,620 |
|
|
2,663 |
|
|
|
|
|
|
|
|
|
|
|
|
|
|
|
|
|
|
|
|
|
|
|
Mortgage-backed securities |
|
|
|
|
|
|
|
|
|
|
|
|
|
|
|
|
|
|
|
|
FHLMC |
|
|
— |
|
|
— |
|
|
— |
|
|
— |
|
|
24 |
|
|
24 |
|
|
FNMA |
|
|
— |
|
|
— |
|
|
— |
|
|
— |
|
|
4 |
|
|
4 |
|
|
|
|
|
|
|
|
|
|
|
|
|
|
|
|
|
|
|
|
|
|
|
Total available for sale debt securities |
|
|
12,342 |
|
|
12,711 |
|
|
8,891 |
|
|
9,056 |
|
|
2,648 |
|
|
2,691 |
|
|
|
|
|
|
|
|
|
|
|
|
|
|
|
|
|
|
|
|
|
|
|
Equity securities |
|
|
350 |
|
|
359 |
|
|
872 |
|
|
968 |
|
|
872 |
|
|
872 |
|
|
|
|
|
|
|
|
|
|
|
|
|
|
|
|
|
|
|
|
|
|
|
Total available for sale |
|
|
12,692 |
|
|
13,070 |
|
|
9,763 |
|
|
10,024 |
|
|
3,520 |
|
|
3,563 |
|
|
|
|
|
|
|
|
|
|
|
|
|
|
|
|
|
|
|
|
|
|
|
FHLB stock |
|
|
3,385 |
|
|
3,385 |
|
|
3,222 |
|
|
3,222 |
|
|
3,578 |
|
|
3,578 |
|
|
|
|
|
|
|
|
|
|
|
|
|
|
|
|
|
|
|
|
|
|
|
|
|
|
|
|
|
|
|
|
|
|
|
|
|
|
|
|
|
|
|
|
Total investment securities |
|
$ |
17,493 |
|
$ |
17,914 |
|
$ |
14,416 |
|
$ |
14,748 |
|
$ |
8,545 |
|
$ |
8,702 |
|
|
|
|
|
|
|
|
|
|
|
|
|
|
|
|
|
|
|
|
|
|
19
Carrying Values, Yields and Maturities. The following table sets forth the scheduled maturities, book value, market value and weighted average yields for Rome Savings’ debt securities at December 31, 2010.
|
|
|
|
|
|
|
|
|
|
|
|
|
|
|
|
|
|
|
|
|
|
|
|
|
|
|
|
|
|
|
|
|
|
|
|
One Year or Less |
|
More Than
One Year |
|
More Than
Five Years |
|
More Than Ten Years |
|
Total |
|
||||||||||||||||||||
|
|
|
|
|
|
|
|
|
|
|
|
|
||||||||||||||||||||
|
|
|
|
|
|
|
|
|
|
|
|
|
|
|
|
|
|
|
|
|
|
|
||||||||||
|
|
|
Carrying |
|
Weighted |
|
Carrying |
|
Weighted |
|
Carrying |
|
Weighted |
|
Carrying |
|
Weighted |
|
Carrying |
|
Weighted |
|
||||||||||
|
|
|
|
|
|
|
|
|
|
|
|
|
|
|
|
|
|
|
|
|
|
|
||||||||||
|
|
|
(Dollars in thousands) |
|
||||||||||||||||||||||||||||
|
Available for sale securities: |
|
|
|
|
|
|
|
|
|
|
|
|
|
|
|
|
|
|
|
|
|
|
|
|
|
|
|
|
|
|
|
|
State and municipal obligations (1) |
|
$ |
— |
|
|
— |
|
$ |
1,057 |
|
|
5.22 |
% |
$ |
728 |
|
|
5.63 |
% |
$ |
— |
|
|
— |
|
$ |
1,785 |
|
|
5.38 |
% |
|
Corporate bonds |
|
|
1,939 |
|
|
3.42 |
% |
|
8,104 |
|
|
4.20 |
% |
|
883 |
|
|
3.58 |
|
|
— |
|
|
— |
|
|
10,926 |
|
|
4.01 |
% |
|
|
|
|
|
|
|
|
|
|
|
|
|
|
|
|
|
|
|
|
|
|
|
|
|
|
|
|
|
|
|
|
|
|
Held to maturity securities: |
|
|
|
|
|
|
|
|
|
|
|
|
|
|
|
|
|
|
|
|
|
|
|
|
|
|
|
|
|
|
|
|
U.S. Government securities |
|
|
1,000 |
|
|
4.61 |
% |
|
309 |
|
|
2.25 |
% |
|
— |
|
|
— |
|
|
— |
|
|
— |
|
|
1,309 |
|
|
4.05 |
% |
|
Other |
|
|
— |
|
|
— |
|
|
— |
|
|
— |
|
|
— |
|
|
— |
|
|
107 |
|
|
5.55 |
% |
|
107 |
|
|
5.55 |
% |
|
|
|
|
|
|
|
|
|
|
|
|
|
|
|
|
|
|
|
|
|
|
|
|
|
|
|
|
|
|
|
|
|
|
|
|
|
|
|
|
|
|
|
|
|
|
|
|
|
|
|
|
|
|
|
|
|
|
|
|
|
|
|
|
|
|
|
Total debt securities |
|
$ |
2,939 |
|
|
3.82 |
% |
$ |
9,470 |
|
|
4.25 |
% |
$ |
1,611 |
|
|
4.51 |
% |
$ |
107 |
|
|
5.55 |
% |
$ |
14,127 |
|
|
4.20 |
% |
|
|
|
|
|
|
|
|
|
|
|
|
|
|
|
|
|
|
|
|
|
|
|
|
|
|
|
|
|
|
|
|
|
|
|
|
|
|
|
|
(1) |
Yields are presented on a tax-equivalent basis. |
20
Deposit Activity and Other Sources of Funds
General. Deposits, borrowings, scheduled amortization and prepayments of loan principal, maturities and calls of investments securities and funds provided by operations are our primary sources of funds for use in lending, investing and for other general purposes.
Deposits. We offer a variety of deposit accounts having a range of interest rates and terms. We currently offer regular savings deposits (consisting of passbook and statement savings accounts), interest-bearing demand accounts, non-interest-bearing demand accounts, money market accounts and time deposits.
Deposit flows are influenced significantly by general and local economic conditions, changes in prevailing interest rates, pricing of deposits and competition. Our deposits are primarily obtained from areas surrounding our offices and we rely primarily on paying competitive rates, service and long-standing relationships with customers to attract and retain these deposits. We do not use brokers to obtain deposits.
When we determine our deposit rates, we consider local competition, U.S. Treasury securities offerings and the rates charged on other sources of funds. Core deposits (defined as savings deposits, money market accounts and demand accounts) represented 69.3% and 66.8% of total deposits on December 31, 2010 and 2009, respectively. At December 31, 2010 and 2009, time deposits with remaining terms to maturity of less than one year amounted to $48.8 million and $50.4 million, respectively. See “Management’s Discussion and Analysis of Financial Condition and Results of Operations - Analysis of Net Interest Income” for information relating to the average balances and costs of our deposit accounts for the years ended December 31, 2010, 2009 and 2008.
At December 31, 2010, we had $17.0 million in time deposits with balances of $100,000 or more maturing as follows:
|
|
|
|
|
|
|
Maturity Period |
|
Amount |
|
|
|
|
|
|
|
|
|
|
|
(In thousands) |
|
|
|
Three months or less |
|
$ |
3,579 |
|
|
Over three months through six months |
|
|
3,401 |
|
|
Over six months through 12 months |
|
|
4,342 |
|
|
Over 12 months |
|
|
5,708 |
|
|
|
|
|
|
|
|
Total |
|
$ |
17,030 |
|
|
|
|
|
|
|
Borrowings. At December 31, 2010, we had outstanding borrowings of $35.7 million which were used to fund loans, purchase treasury stock and finance other investments. In the future, we expect to continue to utilize borrowings as a funding source and may borrow funds pursuant to repurchase agreements, whereby we sell an asset with an agreement to repurchase it at some future date. We are a member of the Federal Home Loan Bank of New York and have available a line of credit of $61.2 million, all of which million remained available at December 31, 2010. The Company also had unused short term borrowing capacity at the Federal Reserve Bank of New York totaling $8.3 million which is collateralized by a portion of the consumer loan portfolio.
Subsidiary Activities
Rome Savings has four subsidiaries: 100 On the Mall Corporation, Clocktower Insurance Agency Incorporated, RSB Properties, Inc. and RSB Capital Inc. RSB Properties, Inc. is a real estate investment trust. 100 On the Mall, Clocktower Insurance and RSB Capital, Inc. are currently inactive.
Employees
At December 31, 2010, Rome Savings had 93 full-time employees and 7 part-time employees. Rome Savings’ employees are not represented by a collective bargaining agreement, and Rome Savings considers its relationship with its employees to be good.
21
REGULATION AND SUPERVISION
General
Rome Bancorp is regulated as a savings and loan holding company by the OTS. Rome Savings, as a federally-chartered savings bank, is subject to regulation, examination and supervision by the OTS, as its primary regulator, and the Federal Deposit Insurance Corporation (the “FDIC”), as its deposit insurer. Rome Savings must file reports with the OTS concerning its activities and financial condition. Rome Bancorp is also required to file reports with, and otherwise comply with, the rules and regulations of the OTS and of the SEC under the federal securities laws. The OTS and the FDIC have significant discretion in connection with their supervisory and enforcement activities and examination policies or any other policies, including policies with respect to Rome Savings’ capital levels, classification of assets and establishment of adequate loan loss reserves for regulatory purposes. Any change in such policies, whether by the OTS, the FDIC, the SEC or the United States Congress, could have a material adverse impact on Rome Bancorp, Rome Savings, and their operations and stockholders.
The Dodd-Frank Wall Street Reform and Consumer Protection Act, signed by the President on July 21, 2010 (the “Dodd-Frank Act”), provides for the regulation and supervision of federal savings associations like Rome Savings to be transferred to the Office of the Comptroller of the Currency (the “OCC”), the agency that regulates national banks. The OCC will assume primary responsibility for implementing and enforcing many of the laws and regulations applicable to federal savings associations. The transfer will occur over a transition period of up to one year, subject to a possible six month extension. At the same time, the responsibility for supervising savings and loan holding companies like Rome Bancorp will be transferred to the Federal Reserve Board. The Dodd-Frank Act also provides for the creation of a new agency, the Consumer Financial Protection Bureau, as an independent bureau of the Federal Reserve Board, to take over the implementation of federal consumer financial protection and fair lending laws from the depository institution regulators. However, institutions of $10 billion or fewer in assets will continue to be examined for compliance with such laws and regulations by, and subject to the enforcement authority of, the prudential regulator rather than the Consumer Financial Protection Bureau.
The description of statutory provisions and regulations applicable to federally chartered savings associations and their holding companies and of tax matters set forth in this document does not purport to be a complete description of all such statutes and regulations and their effects on Rome Bancorp and Rome Savings.
Recent Government Actions
On July 21, 2010, President Obama signed the Dodd-Frank Act, which is legislation that restructures the regulation of depository institutions. In addition to eliminating the OTS and creating the Consumer Financial Protection Bureau, the Dodd-Frank Act, among other things, requires changes in the way that institutions are assessed for deposit insurance, mandates the imposition of consolidated capital requirements on savings and loan holding companies, requires that originators of securitized loans retain a percentage of the risk for the transferred loans, reduces the federal preemption afforded to federal savings associations and contains a number of reforms related to mortgage origination. Many of the provisions of the Dodd-Frank Act require the issuance of regulations before their impact on operations can be assessed by management. However, there is a significant possibility that the Dodd-Frank Act will, at a minimum, result in increased regulatory burden and increase compliance and possibly interest expense costs for Rome Bancorp and Rome Savings.
Regulation of Federal Savings Associations
Business Activities. Rome Savings derives its lending and investment powers from the Home Owners’ Loan Act, as amended (the “HOLA”), and OTS regulations. Under these laws and regulations, Rome Savings may invest in mortgage loans secured by residential and commercial real estate, commercial and consumer loans, certain types of debt securities, and certain other assets. Rome Savings may also establish service corporations that may engage in activities not otherwise permissible for Rome Savings, including certain real estate equity investments and securities and brokerage activities. Rome Savings’ authority to make certain types of loans or other investments is limited by federal law and regulation.
The Dodd-Frank Act authorizes depository institutions to pay interest on demand deposits effective July 31, 2011. Depending upon competitive responses, that change could have an adverse impact on Rome Savings’s interest expense.
22
Loans to One Borrower. Rome Savings is generally subject to the same limits on loans to one borrower as a national bank. With specified exceptions, Rome Savings’ total loans or extensions of credit to a single borrower cannot exceed 15% of Rome Savings’ unimpaired capital and surplus which does not include accumulated other comprehensive income. Rome Savings may lend additional amounts up to 10% of its unimpaired capital and surplus which does not include accumulated other comprehensive income, if the loans or extensions of credit are fully-secured by readily-marketable collateral. Rome Savings currently complies with applicable loans-to-one borrower limitations.
QTL Test. Under federal law, Rome Savings must comply with the qualified thrift lender, or “QTL” test. Under the QTL test, Rome Savings is required to maintain at least 65% of its “portfolio assets” in certain “qualified thrift investments” in at least nine months of the most recent 12-month period. “Portfolio assets” means, in general, Rome Savings’ total assets less the sum of:
|
|
|
|
|
|
• |
specified liquid assets up to 20% of total assets; |
|
|
|
|
|
|
• |
goodwill and other intangible assets; and |
|
|
|
|
|
|
• |
the value of property used to conduct Rome Savings’ business. |
Rome Savings may also satisfy the QTL test by qualifying as a “domestic building and loan association” as defined in the Internal Revenue Code of 1986. Rome Savings met the QTL test at December 31, 2009, and in each of the prior 12 months, and therefore is a “qualified thrift lender.” If Rome Savings fails the QTL test, and is unable to correct that failure for a period of time, it must either operate under certain restrictions on its activities or convert to a bank charter. The Dodd-Frank Act also makes noncompliance with the qualified thrift lender test subject to agency enforcement action for a violation of law and a basis for dividend restrictions.
Capital Requirements. OTS regulations require savings associations to meet three minimum capital standards:
|
|
|
|
|
|
(1) |
a tangible capital ratio requirement of 1.5% of total assets as adjusted under the OTS regulations; |
|
|
|
|
|
|
(2) |
a leverage ratio requirement of 3.0% of core capital to such adjusted total assets, if a savings association has been assigned the highest composite rating of 1 under the Uniform Financial Institutions Rating System; and |
|
|
|
|
|
|
(3) |
a total risk-based capital ratio requirement of 8.0% of core and supplementary capital to total risk-based assets, provided that the amount of supplementary capital used to satisfy this requirement shall not exceed the amount of core capital. |
The minimum leverage capital ratio for any other depository institution that does not have a composite rating of 1 will be 4.0%, unless a higher leverage capital ratio is warranted by the particular circumstances or risk profile of the depository institution. In determining the amount of risk-weighted assets for purposes of the risk-based capital requirement, a savings association must compute its risk-based assets by multiplying its assets and certain off-balance sheet items by risk-weights, which range from 0% for cash and obligations issued by the United States Government or its agencies and certain other assets to 100% for consumer, commercial, home equity and construction loans and certain other assets, as assigned by the OTS capital regulations based on the risks found by the OTS to be inherent in the type of asset.
Tangible capital is defined, generally, as common stockholder’s equity (including retained earnings), certain noncumulative perpetual preferred stock and related earnings, minority interests in equity accounts of fully consolidated subsidiaries, less intangible assets (other than certain servicing rights and nonsecurity financial instruments) and investments in and loans to subsidiaries engaged in activities not permissible for a national bank. Core capital (or tier 1 capital) is defined similarly to tangible capital, but core capital also includes certain qualifying supervisory goodwill and certain purchased credit card relationships. Supplementary capital (or tier 2 capital) includes cumulative and other preferred stock, mandatory convertible debt securities, subordinated debt and intermediate preferred stock and the allowance for loan and lease losses. In addition, up to 45% of unrealized gains on available-for-sale equity securities with a readily determinable fair value may be included in supplementary capital. The allowance for loan and lease losses includable in tier 2 capital is limited to a maximum of 1.25% of risk-weighted assets.
23
At December 31, 2010, Rome Savings met and exceeded each of its capital requirements. The table below presents Rome Savings’ regulatory capital as compared to the OTS regulatory capital requirements at December 31, 2010:
|
|
|
|
|
|
|
|
|
|
|
|
|
|
|
Bank |
|
Capital |
|
Excess |
|
|||
|
|
||||||||||
|
|
|
(In thousands) |
|
|||||||
|
|
||||||||||
|
Tangible capital |
|
$ |
57,829 |
|
$ |
13,165 |
|
$ |
44,664 |
|
|
|
||||||||||
|
Core capital |
|
$ |
57,829 |
|
$ |
13,165 |
|
$ |
44,664 |
|
|
|
||||||||||
|
Risk-based capital |
|
$ |
60,319 |
|
$ |
18,993 |
|
$ |
41,326 |
|
Interest Rate Risk. The Federal Deposit Insurance Corporation Improvement Act requires that the OTS and other federal bank regulatory agencies (the “Agencies”) revise their risk-based capital standards, with appropriate transition rules, to ensure that they take into account IRR concentration of risk and the risks of non-traditional activities. The OTS regulations do not include a specific IRR component of the risk-based capital requirement. However, the OTS monitors the IRR of individual institutions through a variety of means, including an analysis of the change in net portfolio value, or NPV. NPV is defined as the net present value of the expected future cash flows of an entity’s assets and liabilities and, therefore, hypothetically represents the value of an institution’s net worth. In addition, OTS Thrift Bulletin 13a provides guidance on the management of IRR and the responsibility of boards of directors in that area.
In January 2010, the Agencies released an Advisory on Interest Rate Risk Management (the “IRR Advisory”) to remind institutions of the supervisory expectations regarding sound practices for managing IRR. While some degree of IRR is inherent in the business of banking, the Agencies expect institutions to have sound risk management practices in place to measure, monitor and control IRR exposures, and IRR management should be an integral component of an institution’s risk management infrastructure. The Agencies expect all institutions to manage their IRR exposures using processes and systems commensurate with their earnings and capital levels, complexity, business model, risk profile and scope of operations, and the IRR Advisory reiterates the importance of effective corporate governance, policies and procedures, risk measuring and monitoring systems, stress testing, and internal controls related to the IRR exposures of institutions.
The IRR Advisory encourages institutions to use a variety of techniques to measure IRR exposure, including simple maturity gap analysis, income measurement and valuation measurement for assessing the impact of changes in market rates, as well as simulation modeling to measure IRR exposure. Institutions are encouraged to use the full complement of analytical capabilities of their IRR simulation models. The IRR Advisory also reminds institutions that stress testing, which includes both scenario and sensitivity analysis, is an integral component of IRR management. The IRR Advisory indicates that institutions should regularly assess IRR exposures beyond typical industry conventions, including changes in rates of greater magnitude (e.g., up and down 300 and 400 basis points, as compared to up and down 200 basis points, which has been the general practice) across different tenors to reflect changing slopes and twists of the yield curve. The Company utilizes a simulation model to track liquidity, portfolio value and interest rate sensitivity of its financial instruments over a range of possible interest rate scenario. These results are reviewed at least quarterly by the company’s Asset Liability Committee, which includes certain members of the Company’s Board of Directors and Senior Management.
Community Reinvestment Act. Under the Community Reinvestment Act (“CRA”), as implemented by OTS regulations, Rome Savings has a continuing and affirmative obligation, consistent with its safe and sound operation, to ascertain and help meet the credit needs of its entire community, including low and moderate income neighborhoods. The CRA does not establish specific lending requirements or programs for Rome Savings nor does it limit Rome Savings’ discretion to develop the types of products and services that it believes are best suited to its particular community, consistent with the CRA. Rather, the CRA requires the OTS, in connection with its examination of a federally chartered savings association, to assess the association’s record of meeting the credit needs of its community and to take such record into account in its evaluation of certain applications by such association.
The CRA regulations rate an institution on its actual performance in meeting community needs. In particular, the assessment system focuses on three tests:
24
|
|
|
|
|
|
• |
a lending test, to evaluate the institution’s record of making loans in its assessment areas; |
|
|
|
|
|
|
• |
an investment test, to evaluate the institution’s record of investing in community development projects, affordable housing, and programs benefiting low or moderate income individuals and businesses in its assessment area or a broader area that includes its assessment area; and |
|
|
|
|
|
|
• |
a service test, to evaluate the institution’s delivery of services through its retail banking channels and the extent and innovativeness of its community development services. |
The CRA also requires all institutions to make public disclosure of their CRA ratings. Rome Savings received a “Satisfactory” CRA rating in its most recent examination. Regulations require that Rome Savings publicly disclose certain agreements that are in fulfillment of CRA. There are no such agreements at this time.
Transactions with Affiliates. Rome Savings’ authority to engage in transactions with its “affiliates” is limited by the Sections 23A and 23B of the Federal Reserve Act (the “FRA”) and Regulation W issued by the Federal Reserve Board, as made applicable to federal savings associations by the HOLA and the OTS regulations. In general, these transactions must be on terms which are as favorable to Rome Savings as comparable transactions with non-affiliates. In addition, certain types of these transactions referred to as “covered transaction” are subject to quantitative limits based on a percentage of Rome Savings’ capital, thereby restricting the total dollar amount of transactions Rome Savings may engage in with each individual affiliate and with all affiliates in the aggregate. Affiliates must pledge qualifying collateral in amounts between 100% and 130% of the covered transaction in order to receive loans from Rome Savings. In addition, applicable regulations prohibit a savings association from lending to any of its affiliates that engage in activities that are not permissible for bank holding companies and from purchasing low-quality (i.e., non-performing) assets from an affiliate or purchasing the securities of any affiliate, other than a subsidiary.
Loans to Insiders. Rome Savings’ authority to extend credit to its directors, executive officers and principal shareholders, as well as to entities controlled by such persons, is currently governed by the requirements of Sections 22(g) and 22(h) of the FRA and Regulation O issued by the Federal Reserve Board, as made applicable to federal savings associations by the HOLA and the OTS regulations. Among other things, these provisions require that extensions of credit to insiders:
|
|
|
|
|
|
• |
be made on terms that are substantially the same as, and follow credit underwriting procedures that are not less stringent than, those prevailing for comparable transactions with third parties and that do not involve more that the normal risk of repayment or present other features that are unfavorable to Rome Savings; and |
|
|
|
|
|
|
• |
not exceed certain limitations on the amount of credit extended to such persons, individually and in the aggregate, which limits are based, in part, on the amount of Rome Savings’ capital. |
In addition, extensions for credit in excess of certain limits must be approved by Rome Savings’ Board of Directors.
Enforcement. The OTS has primary enforcement responsibility over federally chartered savings associations, including Rome Savings. This enforcement authority includes, among other things, the ability to assess civil money penalties, to issue cease and desist orders and to remove directors and officers. In general, these enforcement actions may be initiated in response to violations of laws and regulations and to unsafe or unsound practices.
Standards for Safety and Soundness. Pursuant to the Federal Deposit Insurance Act, the OTS has adopted a set of guidelines prescribing safety and soundness standards. These guidelines establish general standards relating to internal controls, information systems, internal audit systems, loan documentation, credit underwriting, interest rate risk exposure, asset growth, asset quality, earnings standards, compensation, fees and benefits. In general, the guidelines require appropriate systems and practices to identify and manage the risks and exposures specified in the guidelines.
In addition, the OTS adopted regulations that authorize, but do not require, the OTS to order a savings association that has been given notice that it is not satisfying these safety and soundness standards to submit a compliance plan. If, after being notified, a savings association fails to submit an acceptable plan or fails in any material respect to implement an accepted plan, the OTS must issue an order directing action to correct the deficiency. Further, the OTS
25
may issue an order directing corrective actions and may issue an order directing other actions of the types to which an undercapitalized association is subject under the “prompt corrective action” provisions of federal law. If a savings association fails to comply with such an order, the OTS may seek to enforce such order in judicial proceedings and to impose civil money penalties.
Limitation on Capital Distributions. The OTS imposes various restrictions or requirements on Rome Savings’ ability to make capital distributions, including the payment of cash dividends. A savings association that is the subsidiary of a savings and loan holding company must file a notice with the OTS at least 30 days before making a capital distribution. Rome Savings must file an application for prior approval if the total amount of its capital distributions, including the proposed distribution, for the applicable calendar year would exceed an amount equal to Rome Savings’ net income for that year plus Rome Savings’ retained net income for the previous two years.
The OTS may disapprove a notice or application if:
|
|
|
|
|
|
• |
Rome Savings would be undercapitalized following the distribution; |
|
|
|
|
|
|
• |
the proposed capital distribution raises safety and soundness concerns; or |
|
|
|
|
|
|
• |
the capital distribution would violate a prohibition contained in any statute, regulation or agreement. |
Liquidity. Rome Savings is required to maintain a sufficient amount of liquid assets to ensure its safe and sound operation.
Prompt Corrective Action Regulations. Under the OTS prompt corrective action regulations, the OTS is required to take certain, and is authorized to take other, supervisory actions against undercapitalized savings associations. For this purpose, a savings association is placed in one of the following four categories based on the association’s capital:
|
|
|
|
|
|
• |
well capitalized; |
|
|
|
|
|
|
• |
adequately capitalized; |
|
|
|
|
|
|
• |
undercapitalized; or |
|
|
|
|
|
|
• |
critically undercapitalized. |
At December 31, 2010, Rome Savings met the criteria for being considered “well-capitalized.” When appropriate, the OTS can require corrective action by a savings association holding company under the “prompt corrective action” provision of federal law.
Insurance of Deposit Accounts. Rome Savings is a member of the Deposit Insurance Fund (“DIF”) maintained by the FDIC, and Rome Savings pays its deposit insurance assessments to the DIF. The DIF was formed on March 31, 2006, following the merger of the Bank Insurance Fund and the Savings Association Insurance Fund in accordance with the Federal Deposit Insurance Reform Act of 2005 (“DIF Act”). In addition to merging the insurance funds, the DIF Act established a statutory minimum and maximum designated reserve ratio for the Deposit Insurance Fund and granted the FDIC greater flexibility in establishing the required reserve ratio.
As a result of the recent failures of a number of banks and thrifts, there has been a significant increase in the loss provisions of the DIF of the FDIC. This has resulted in a decline in the DIF reserve ratio. Because the DIF reserve ratio declined below 1.15% the FDIC was required to establish a restoration plan to restore the reserve ratio to 1.15% within five years. In order to restore the reserve ratio to 1.15%, the FDIC increased risk-based assessment rates uniformly by 7 basis points (annualized) during the first quarter of 2009. Thereafter, the FDIC further increased the initial base assessment rates, beginning with the second quarter of 2009, depending on an institution’s risk category, with adjustments resulting in increased assessment rates for institutions with a significant reliance on secured liabilities and brokered deposits. In May of 2009 the FDIC imposed a five basis point special assessment on each insured depository institution’s assets minus Tier 1 capital as of June 30, 2009. The special assessment was $142,000 for Rome Savings and was collected on September 30, 2009.
On September 29, 2009, the FDIC adopted an amendment to the restoration plan that increases the deposit insurance
26
assessment rate schedule uniformly across all four risk categories by three basis points (annualized) of insured deposits beginning January 1, 2011. In addition, on November 17, 2009 the FDIC adopted a final rule which required insured depository institutions to prepay their estimated quarterly risk-based assessments for the fourth quarter of 2009 and for all of 2010, 2011 and 2012. The prepaid assessment for these periods was collected on December 30, 2009 and Rome Savings’ prepaid assessment was $752,000 which was recorded as a prepaid expense.
The Dodd-Frank Act increased the minimum target Deposit Insurance Fund ratio from 1.15% of estimated insured deposits to 1.35% of estimated insured deposits. The FDIC must seek to achieve the 1.35% ratio by September 30, 2020. Insured institutions with assets of $10 billion or more are supposed to fund the increase. The Dodd-Frank Act eliminated the 1.5% maximum fund ratio, instead leaving it to the discretion of the FDIC.
The FDIC has authority to increase insurance assessments. A significant increase in insurance premiums would likely have an adverse effect on the operating expenses and results of operations of Rome Savings. Management cannot predict what insurance assessment rates will be in the future.
In addition, all FDIC-insured institutions are required to pay a pro rata portion of the interest due on obligations issued by the Financing Corporation to fund the closing and disposal of failed thrift institutions by the Resolution Trust Corporation. At December 31, 2009, the FDIC assessed DIF-insured deposits 1.06 basis points per $100 of deposits to cover those obligations. The Financing Corporation rate is adjusted quarterly to reflect changes in assessment bases of the DIF. This obligation will continue until the Financing Corporation bonds mature in 2017 through 2019.
Due to the recent difficult economic conditions, deposit insurance per account owner has been raised to $250,000. That limit was made permanent by the Dodd-Frank Act.
Insurance of deposits may be terminated by the FDIC upon a finding that the institution has engaged in unsafe or unsound practices, is in an unsafe or unsound condition to continue operations or has violated any applicable law, regulation, rule, order or regulatory condition imposed in writing. The management of Rome Savings does not know of any practice, condition or violation that might lead to termination of deposit insurance.
Federal Home Loan Bank System. Rome Savings is a member of the FHLB of New York, which is one of the regional FHLBs composing the FHLB System. Each FHLB provides a central credit facility primarily for its member institutions. Rome Savings, as a member of the FHLB of New York, is required to acquire and hold shares of capital stock in the FHLB of New York. While the required percentages of stock ownership are subject to change by the FHLB, Rome Savings was in compliance with this requirement with an investment in FHLB of New York stock at December 31, 2010 of $3.4 million. Any advances from a FHLB must be secured by specified types of collateral, and all long-term advances may be obtained only for the purpose of providing funds for residential housing finance.
The FHLBs are required to provide funds for the resolution of insolvent thrifts and to contribute funds for affordable housing programs. These requirements could reduce the amount of earnings that the FHLBs can pay as dividends to their members and could also result in the FHLBs imposing a higher rate of interest on advances to their members. If dividends were reduced, or interest on future FHLB advances increased, Rome Savings’ net interest income would be affected.
Federal Reserve System. Under regulations of the Federal Reserve Board, Rome Savings is required to maintain noninterest-earning reserves against its transaction accounts (primarily NOW and regular checking accounts). The Federal Reserve Board regulations exempt $10.7 million of otherwise reservable balances (subject to adjustment by the Federal Reserve Board) from the reserve requirements. A 3% reserve is required for net transaction account balances between $10.7 million and $55.2 million (subject to adjustment by the Federal Reserve Board) plus a reserve requirement 10% (subject to adjustment by the Federal Reserve Board between 8% and 14%) against that portion of total transaction accounts in excess of $55.2 million. Rome Savings is in compliance with the foregoing reserve requirements. Because required reserves must be maintained in the form of vault cash, a noninterest-bearing account at a Federal Reserve Bank, or a pass-through account as defined by the Federal Reserve Board, the effect of this reserve requirement is to reduce the Bank’s interest-earning assets. The balances maintained to meet the reserve requirements imposed by the Federal Reserve Board may be used to satisfy liquidity requirements imposed by the OTS. FHLB System members are also authorized to borrow from the Federal Reserve discount window, but Federal Reserve Board regulations require such institutions to exhaust all FHLB sources before borrowing from a Federal Reserve Bank.
27
Prohibitions Against Tying Arrangements. Federal savings associations are subject to prohibitions on certain tying arrangements. A depository institution is prohibited, subject to certain exceptions, from extending credit or offering any other service, or fixing or varying the consideration for such extension of credit or service, on the condition that the customer obtain some additional product or service from the institution or its affiliates or not obtain services of a competitor of the institution.
The Bank Secrecy Act. Rome Savings and Rome Bancorp are subject to the Bank Secrecy Act, as amended by the USA PATRIOT Act, which gives the federal government powers to address money laundering and terrorist threats through enhanced domestic security measures, expanded surveillance powers, and mandatory transaction reporting obligations. By way of example, the Bank Secrecy Act imposes an affirmative obligation on Rome Savings to report currency transactions that exceed certain thresholds and to report other transactions determined to be suspicious.
Title III of the USA PATRIOT Act takes measures intended to encourage information sharing among financial institutions, bank regulatory agencies and law enforcement bodies. Further, certain provisions of Title III impose affirmative obligations on a broad range of financial institutions, including banks, thrifts, brokers, dealers, credit unions, money transfer agents and parties registered under the Commodity Exchange Act. Among other requirements, the USA PATRIOT Act imposes the following obligations on financial institutions:
|
|
|
|
|
|
• |
financial institutions must establish anti-money laundering programs that include, at minimum: (i) internal policies, procedures, and controls, (ii) specific designation of an anti-money laundering compliance officer, (iii) ongoing employee training programs, and (iv) an independent audit function to test the anti-money laundering program; |
|
|
|
|
|
|
• |
financial institutions must establish and meet minimum standards for customer due diligence, identification and verification; |
|
|
|
|
|
|
• |
financial institutions that establish, maintain, administer, or manage private banking accounts or correspondent accounts in the United States for non-United States persons or their representatives (including foreign individuals visiting the United States) must establish appropriate, specific, and, where necessary, enhanced due diligence policies, procedures, and controls designed to detect and report money laundering through those accounts; |
|
|
|
|
|
|
• |
financial institutions are prohibited from establishing, maintaining, administering or managing correspondent accounts for foreign shell banks (foreign banks that do not have a physical presence in any country), and are subject to certain recordkeeping obligations with respect to correspondent accounts of foreign banks; and |
|
|
|
|
|
|
• |
bank regulators are directed to consider a bank’s or holding company’s effectiveness in combating money laundering when ruling on Federal Reserve Act and Bank Merger Act applications. |
On July 26, 2010, Rome Savings stipulated and consented to a Cease and Desist Order (the “Order”) issued by the Office of Thrift Supervision. The Order became effective on July 26, 2010. The Order was issued as a result of weaknesses in Rome Savings’s Secrecy Act/Anti-Money Laundering (“BSA”) compliance program identified this year. The Order requires Rome Savings to cease and desist from violating certain BSA laws and regulation identified in the Order, revise its current BSA compliance program, implement a system of internal controls to ensure compliance with BSA laws and regulations and to take certain other actions identified by the Office of Thrift Supervision in the Order. Rome Savings believes that it has addressed all of the matters mentioned in the Order and has completed all of the actions required to be taken by the deadline dates stated in the Order. The Order will not have a material impact on the financial condition or results of operations of Rome Savings or Rome Bancorp.
Office of Foreign Asset Control. Rome Savings and Rome Bancorp, like all United States companies and individuals, are prohibited from transacting business with certain individuals and entities named on the Office of Foreign Asset Control’s list of Specially Designated Nationals and Blocked Persons. Failure to comply may result in fines and other penalties. The Office of Foreign Asset Control issued guidance directed at financial institutions in which it asserted that it may, in its discretion, examine institutions determined to be high-risk or to be lacking in their efforts to comply with these prohibitions.
28
Regulation of Savings and Loan Holding Companies
Rome Bancorp is a savings and loan holding company regulated by the OTS. As such, Rome Bancorp is registered with and subject to OTS examination and supervision, as well as certain reporting requirements. In addition, the OTS has enforcement authority over Rome Bancorp and any of its non-savings association subsidiaries. Among other things, this authority permits the OTS to restrict or prohibit activities that are determined to be a serious risk to the financial safety, soundness or stability of a subsidiary savings association.
In general, a savings and loan holding company, with the prior approval of the OTS, may engage in all activities that bank holding companies may engage in under any regulation that the Federal Reserve Board has promulgated under Section 4(c) of the BHC Act. Current regulations limit such authority to those activities that the Federal Reserve Board has, by regulation, determined to be permissible under Section 4(c)(8) of the BHC Act, as noted below. Prior approval from the OTS is not required, however, if: (1) the savings and loan holding company received a rating of satisfactory or above prior to January 1, 2008, or a composite rating of “1” or “2” thereafter, in its most recent examination, and its not in troubled condition, and the holding company does not propose to commence the activity by an acquisition of a going concern, or (2) the activity is otherwise permissible under another provision of HOLA, for which prior notice to or approval from the OTS is not required.
In addition, a savings and loan holding company is precluded from acquiring more than 5% of a non-subsidiary thrift unless the savings and loan holding company receives prior approval from the OTS. No savings and loan holding company may, directly or indirectly, or through one or more subsidiaries or through one or more transactions, acquire control of an uninsured institution or retain, for more than one year after the date any savings association subsidiary becomes uninsured, control of such association.
Because Rome Bancorp was organized after May 4, 1999, under the Gramm Leach Bliley Act of 1999 (the “GLB Act”) it is prohibited from engaging in non-financial activities. Unitary savings and loan holding companies that existed before this date and that have not undergone certain reorganization or restructuring transactions are “grandfathered” under the GLB Act and generally have no restrictions on their business activities. Rome Bancorp’s activities, however, are restricted to:
|
|
|
|
|
|
• |
furnishing or performing management services for its savings institution subsidiary; |
|
|
|
|
|
|
• |
conducting an insurance agency or escrow business; |
|
|
|
|
|
|
• |
holding, managing or liquidating assets owned or acquired from its savings institution subsidiary; |
|
|
|
|
|
|
• |
holding or managing properties used or occupied by its savings institution subsidiary; |
|
|
|
|
|
|
• |
acting as trustee under a deed of trust; |
|
|
|
|
|
|
• |
any other activity (a) that the Federal Reserve Board, by regulation, has determined to be permissible for bank holding companies under Section 4(c) of the Bank Holding Company Act of 1956 (“BHCA”), unless the |
|
|
|
|
|
|
• |
Director of the OTS, by regulation, prohibits or limits any such activity for savings and loan holding companies, or (b) in which multiple savings and loan holding companies were authorized by regulation to directly engage on March 5, 1987; |
|
|
|
|
|
|
• |
purchasing, holding or disposing of stock acquired in connection with a qualified stock issuance if the purchase of such stock is approved by the Director of the OTS; and |
|
|
|
|
|
|
• |
any activity permissible for financial holding companies under section 4(k) of the BHCA. |
|
|
|
|
|
|
Permissible activities which are deemed to be financial in nature or incidental thereto under section 4(k) of the BHCA include: |
|
|
|
|
|
|
|
• |
lending, exchanging, transferring, investing for others or safeguarding money or securities; |
|
|
|
|
|
|
• |
insurance activities or providing and issuing annuities, and acting as principal, agent or broker; |
29
|
|
|
|
|
|
• |
financial, investment or economic advisory services; |
|
|
|
|
|
|
• |
issuing or selling instruments representing interests in pools of assets that a bank is permitted to hold directly; |
|
|
|
|
|
|
• |
underwriting, dealing in or making a market in securities; |
|
|
|
|
|
|
• |
activities previously determined by the Federal Reserve Board to be closely related to banking; |
|
|
|
|
|
|
• |
activities that bank holding companies are permitted to engage in outside of the U.S.; and |
|
|
|
|
|
|
• |
portfolio investments made by an insurance company. |
Transactions between the Rome Savings and Rome Bancorp and its other subsidiaries are subject to various conditions and limitations. See “Regulation of Federal Savings Associations - Transactions with Affiliates” and “Regulation of Federal Savings Associations - Limitation on Capital Distributions.”
Consolidated Holding Company Capital Requirements. Unlike bank holding companies, federal savings and loan holding companies are not currently subject to any regulatory capital requirements or to supervision by the Federal Reserve Board. The Dodd-Frank Act requires the federal banking agencies to establish consolidated risk-based and leverage capital requirements for insured depository institutions, depository institution holding companies and systemically important nonbank financial companies. These requirements must be no less than those to which insured depository institutions are currently subject, and the new requirements will effectively eliminate the use of trust preferred securities as a component of Tier 1 capital for depository institution holding companies of our size. As a result, not later than the fifth anniversary of the effective date of the Dodd-Frank Act, the Company will become subject to consolidated capital requirements to which it has not been subject to previously.
The Sarbanes-Oxley Act. As a public company, Rome Bancorp is subject to the Sarbanes-Oxley Act of 2002, which implements a broad range of corporate governance and accounting measures for public companies designed to promote honesty and transparency in corporate America and better protect investors from corporate wrongdoing. The Sarbanes-Oxley Act’s principal legislation and the derivative regulation and rule making promulgated by the SEC includes:
|
|
|
|
|
|
• |
the creation of an independent accounting oversight board; |
|
|
|
|
|
|
• |
auditor independence provisions which restrict non-audit services that accountants may provide to their audit clients; |
|
|
|
|
|
|
• |
additional corporate governance and responsibility measures, including the requirement that the chief executive officer and chief financial officer certify financial statements; |
|
|
|
|
|
|
• |
a requirement that companies establish and maintain a system of internal control over financial reporting and that a company’s management provide an annual report regarding its assessment of the effectiveness of such internal control over financial reporting to the company’s independent accountants and that such accountants provide an attestation report with respect to management’s assessment of the effectiveness of the company’s internal control over financial reporting; |
|
|
|
|
|
|
• |
the forfeiture of bonuses or other incentive-based compensation and profits from the sale of an issuer’s |
|
|
|
|
|
|
• |
securities by directors and senior officers in the twelve month period following initial publication of any financial statements that later require restatement; |
|
|
|
|
|
|
• |
an increase in the oversight of, and enhancement of certain requirements relating to audit committees of public companies and how they interact with the company’s independent auditors; |
|
|
|
|
|
|
• |
requirement that audit committee members must be independent and are absolutely barred from accepting consulting, advisory or other compensatory fees from the issuer; |
30
|
|
|
|
|
|
• |
requirement that companies disclose whether at least one member of the committee is a “financial expert” (as such term is defined by the Securities and Exchange Commission) and if not, why not; |
|
|
|
|
|
|
• |
expanded disclosure requirements for corporate insiders, including accelerated reporting of stock transactions by insiders and a prohibition on insider trading during pension blackout periods; |
|
|
|
|
|
|
• |
a prohibition on personal loans to directors and officers, except certain loans made by insured financial institutions; |
|
|
|
|
|
|
• |
disclosure of a code of ethics and filing a Form 8-K for a change or waiver of such code; |
|
|
|
|
|
|
• |
mandatory disclosure by analysts of potential conflicts of interest; and |
|
|
|
|
|
|
• |
a range of enhanced penalties for fraud and other violations. |
Section 402 of the Sarbanes-Oxley Act of 2002 prohibits the extension of personal loans to directors and executive officers of issuers. The prohibition, however, does not apply to mortgages advanced by an insured depository institution, such as Rome Savings, that are subject to the insider lending restrictions of Section 22(h) of the Federal Reserve Act.
Although Rome Bancorp anticipates that it will incur additional expense in complying with the provisions of the Sarbanes-Oxley Act and the resulting regulations, management does not expect that such compliance will have a material impact on its results of operations or financial condition.
Federal Securities Laws. Rome Bancorp’s common stock is registered with the SEC under Section 12(b) of the Exchange Act. Rome Bancorp is subject to information, proxy solicitation, insider trading restrictions and other requirements under the Exchange Act.
Quotation on Nasdaq. Rome Bancorp’s common stock is quoted on The Nasdaq Global Market. In order to maintain such quotation, Rome Bancorp is subject to certain corporate governance requirements, including:
|
|
|
|
|
|
• |
a majority of its board must be composed of independent directors; |
|
|
|
|
|
|
• |
it is required to have an audit committee composed of at least three directors, each of whom is an independent director, as such term is defined by the rules of the Nasdaq Stock Market and the Exchange Act regulations; |
|
|
|
|
|
|
• |
its nominating committee and compensation committee must also be composed entirely of independent directors; and |
|
|
|
|
|
|
• |
each of the audit committee, and nominating committee must have a publicly available written charter. |
|
|
|
|
RISK FACTORS |
|
|
Not applicable. |
|
|
|
|
|
UNRESOLVED STAFF COMMENTS |
|
|
None. |
|
31
|
|
|
|
DESCRIPTION OF PROPERTY |
We conduct our business through our executive office, operations center, which includes both the Mortgage Center and the Accounting Center listed below, and four banking offices. In addition, we have purchased land in Oneida, New York for potential expansion into that market. At December 31, 2010, the net book value of the computer equipment and other furniture, fixtures and equipment of Rome Savings and Rome Bancorp at their offices totaled $724,000. For more information, see Note 5 of Notes to Consolidated Financial Statements.
|
|
|
|
|
|
|
|
|
|
|
|
|
|
|
|
|
|
|
|
|
Location |
|
Leased or |
|
Original Date |
|
|
Net Book Value |
|
|
|
|
|
|
|
|
|
|
|
|
Executive Office: |
|
|
|
|
|
|
|
|
|
100
West Dominick St. |
|
Owned |
|
1956 |
|
|
$1,079 |
|
|
Branch Offices: |
|
|
|
|
|
|
|
|
|
1629
Black River Boulevard |
|
Owned |
|
1963 |
|
|
207 |
|
|
|
|
|
|
|
|
|
|
|
|
1300
Erie Boulevard |
|
Owned |
|
1997 |
|
|
954 |
|
|
|
|
|
|
|
|
|
|
|
|
82
Seneca Turnpike |
|
Owned |
|
1983 |
|
|
99 |
|
|
|
|
|
|
|
|
|
|
|
|
Rt.
26 and Elmer Hill Rd |
|
Owned |
|
2006 |
|
|
1,593 |
|
|
|
|
|
|
|
|
|
|
|
|
Mortgage Center: |
|
|
|
|
|
|
|
|
|
137
West Dominick Street |
|
Owned |
|
2002 |
|
|
402 |
|
|
Accounting Center: |
|
|
|
|
|
|
|
|
|
139
West Dominick Street |
|
Owned |
|
1995 |
|
|
302 |
|
|
Undeveloped Land: |
|
|
|
|
|
|
|
|
|
Oneida, NY |
|
Owned |
|
2006 |
|
|
454 |
|
|
|
|
|
LEGAL PROCEEDINGS |
On October 18, 2010, Stephen Bushansky filed a stockholder class action lawsuit in the Supreme Court of the State of New York, County of the Bronx, on October 27, 2010, James and Liliana DiCastro filed a stockholder class action lawsuit in the Chancery Court of the State of Delaware, and on November 15, 2010, and Samuel S. Rapasodi filed a stockholder class action lawsuit in the Supreme Court of the State of New York, County of Oneida, each against Rome Bancorp, Berkshire Hills, and the directors of Rome Bancorp. The lawsuit filed in Delaware was subsequently withdrawn voluntarily. The Bushansky and Rapasodi lawsuits purported to be brought on behalf of all of Rome Bancorp’s public stockholders and alleged that the directors of Rome Bancorp breached their fiduciary duties to Rome Bancorp’s stockholders by failing to take steps necessary to obtain a fair and adequate price for Rome Bancorp’s common stock and that Berkshire Hills knowingly aided and abetted Rome Bancorp directors’ breach of fiduciary duty.
On February 23, 2011, solely to avoid the costs, risks and uncertainties inherent in litigation and to allow stockholders to vote on the proposals required in connection with the merger at the scheduled meeting, Rome Bancorp entered into a memorandum of understanding with plaintiffs’ counsel and other named defendants regarding the settlement of two putative class action lawsuits filed in the Supreme Court of the State of New York, County of the Bronx and the Supreme Court of the State of New York, County of Oneida on behalf of Rome Bancorp’s stockholders following the public announcement of the execution of the merger agreement with Berkshire (the “Merger Agreement”).
Under the terms of the memorandum negotiated by Rome Bancorp, Rome Bancorp, the other named defendants and the plaintiffs have agreed to settle the two lawsuits subject to court approval. If the court approves the settlement contemplated in the memorandum, the lawsuits will be dismissed with prejudice. Pursuant to the terms of the
32
memorandum, Rome Bancorp agreed to make available additional information to its stockholders in a Current Report on Form 8-K filed with the Commission on February 23, 2011. In return, the plaintiffs agreed to the dismissal of the lawsuits and to withdraw all motions filed in connection with such lawsuits. In connection with the settlement, plaintiffs intend to seek an award of attorneys’ fees and expenses not to exceed $395,000, subject to court approval. Rome Bancorp and its insurance carrier have agreed to pay the legal fees and expenses of plaintiffs’ counsel, in an amount not to exceed $395,000 and ultimately to be determined by the court. This payment will not affect the amount of merger consideration to be paid in the merger. If the settlement is finally approved by the court, it is anticipated that it will resolve and release all claims in all actions that were or could have been brought challenging any aspect of the proposed merger, the Merger Agreement, and any disclosure made in connection therewith (but excluding claims for appraisal under Section 262 of the Delaware General Corporation Law). There can be no assurance that the parties will ultimately enter into a stipulation of settlement or that the court will approve the settlement even if the parties were to enter into such stipulation. In such event, the proposed settlement as contemplated by the memorandum of understanding may be terminated. The details of the settlement will be set forth in a notice to be sent to Rome Bancorp’s stockholders prior to a hearing before the court to consider both the settlement and plaintiffs’ fee application.
The settlement will not affect the merger consideration to be paid to stockholders of Rome Bancorp in connection with the proposed merger between Rome Bancorp and Berkshire. Rome Bancorp and the other defendants deny all of the allegations in the lawsuits and believe the disclosures are appropriate under the law. Nevertheless, Rome Bancorp and the other defendants have agreed to settle the putative class action litigation in order to avoid costly litigation and reduce the risk of any delay to the closing of the merger.
Rome Bancorp and the other defendants have vigorously denied, and continue to vigorously deny, that they have committed or aided and abetted in the commission of any violation of law or engaged in any of the wrongful acts that were or could have been alleged in the lawsuits, and expressly maintain that, to the extent applicable, they diligently and scrupulously complied with their fiduciary and other legal burdens and are entering into the contemplated settlement solely to eliminate the burden and expense of further litigation, to put the claims that were or could have been asserted to rest, and to avoid any possible delay in the consummation of the merger. Nothing in the Company’s Exchange Act reports, the Memorandum of Understanding or any stipulation of settlement shall be deemed an admission of the legal necessity or materiality under applicable laws of any of the disclosures set forth herein.
As of the date of this Annual Report on Form 10-K, the Company is not involved in any other pending legal proceedings other than routine legal proceedings occurring in the ordinary course of business. The Company believes believe that these routine legal proceedings, in the aggregate, are immaterial to its financial condition and results of operations.
33
|
|
|
|
MARKET FOR ROME BANCORP’S COMMON EQUITY, RELATED STOCKHOLDER MATTERS AND ISSUER PURCHASES OF EQUITY SECURITIES |
Rome Bancorp’s common stock is traded on the Nasdaq Global Market under the symbol “ROME”.
At December 31, 2010, the last trading date in Rome Bancorp’s fiscal year, the common stock of Rome Bancorp closed at $12.02 per share. At March 2, 2011, there were 6,777,551 shares of Rome Bancorp’s common stock outstanding, which were held of record by approximately 1,500 registered shareholders.
The table below shows the high and low sales price of Rome Bancorp’s common stock during the periods indicated.
|
|
|
|
|
|
|
|
|
|
|
|
|
|
|
Price Range |
|
|||||||
|
|
|
|
|
|||||||
|
Date |
|
High |
|
Low |
|
Dividends |
|
|||
|
|
|
|
|
|
|
|
|
|||
|
Year ended December 31, 2010 |
|
|
|
|
|
|
|
|
|
|
|
|
|
|
|
|
|
|
|
|
|
|
|
Quarter ended March 31, 2010 |
|
$ |
9.66 |
|
$ |
7.61 |
|
$ |
0.09 |
|
|
Quarter ended June 30, 2010 |
|
|
9.95 |
|
|
8.12 |
|
|
0.09 |
|
|
Quarter ended September 30, 2010 |
|
|
9.90 |
|
|
8.73 |
|
|
0.09 |
|
|
Quarter ended December 31, 2010 |
|
|
12.96 |
|
|
9.20 |
|
|
0.09 |
|
|
|
|
|
|
|
|
|
|
|
|
|
|
Year ended December 31, 2009 |
|
|
|
|
|
|
|
|
|
|
|
|
|
|
|
|
|
|
|
|
|
|
|
Quarter ended March 31, 2009 |
|
$ |
9.10 |
|
$ |
7.00 |
|
$ |
0.085 |
|
|
Quarter ended June 30, 2009 |
|
|
9.70 |
|
|
7.52 |
|
|
0.085 |
|
|
Quarter ended September 30, 2009 |
|
|
9.10 |
|
|
7.75 |
|
|
0.085 |
|
|
Quarter ended December 31, 2009 |
|
|
8.69 |
|
|
7.70 |
|
|
0.085 |
|
Rome Bancorp paid cash dividends of $0.36 per share in 2010. Rome Bancorp also paid a 2011 quarterly cash dividend of $0.09 per share to shareholders of record as of February 4, 2011. Our ability to pay dividends depends on a number of factors including:
|
|
|
|
|
|
• |
investment opportunities available to the Bank or Rome Bancorp; |
|
|
|
|
|
|
• |
the Bank’s capital requirements; |
|
|
|
|
|
|
• |
federal laws and regulations; |
|
|
|
|
|
|
• |
our financial results; |
|
|
|
|
|
|
• |
tax considerations; and |
|
|
|
|
|
|
• |
general economic conditions. |
We do not guarantee that we will pay dividends, or that we will not reduce or eliminate dividends in the future.
34
Stock Price Performance Graph
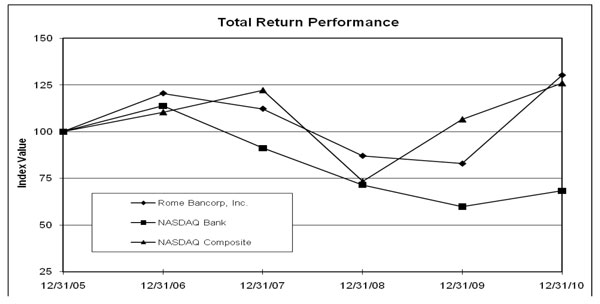
|
|
|
|
|
|
|
|
|
|
|
|
|
|
|
|
|
|
|
|
|
|
|
|
Period Ending |
|
||||||||||||||||
|
|
|
|
|
||||||||||||||||
|
Index |
|
12/31/05 |
|
12/31/06 |
|
12/31/07 |
|
12/31/08 |
|
12/31/09 |
|
12/31/10 |
|
||||||
|
|
|
|
|
|
|
|
|
|
|
|
|
|
|
||||||
|
Rome Bancorp, Inc. |
|
|
100.00 |
|
|
120.51 |
|
|
112.25 |
|
|
87.07 |
|
|
82.92 |
|
|
130.20 |
|
|
NASDAQ Bank |
|
|
100.00 |
|
|
113.82 |
|
|
91.16 |
|
|
71.52 |
|
|
59.87 |
|
|
68.34 |
|
|
NASDAQ Composite |
|
|
100.00 |
|
|
110.39 |
|
|
122.15 |
|
|
73.32 |
|
|
106.57 |
|
|
125.91 |
|
35
|
|
|
|
SELECTED FINANCIAL DATA |
|
|
|
|
|
|
|
|
|
|
|
|
|
|
|
(in thousands) |
|
|||||||
|
|
|
|
|
|
|
|
|
|||
|
|
|
2010 |
|
2009 |
|
2008 |
|
|||
|
|
|
|
|
|
|
|
|
|||
|
|
||||||||||
|
Selected Financial Condition Data: |
|
|
|
|
|
|
|
|
|
|
|
Total assets |
|
$ |
327,211 |
|
$ |
329,922 |
|
$ |
337,886 |
|
|
Loans, net |
|
|
265,937 |
|
|
285,617 |
|
|
298,453 |
|
|
Securities |
|
|
17,871 |
|
|
14,677 |
|
|
8,588 |
|
|
Total cash and cash equivalents |
|
|
18,805 |
|
|
7,574 |
|
|
9,579 |
|
|
Total deposits |
|
|
225,325 |
|
|
216,638 |
|
|
205,932 |
|
|
Borrowings |
|
|
35,661 |
|
|
47,869 |
|
|
66,324 |
|
|
Total equity |
|
|
60,655 |
|
|
60,365 |
|
|
60,344 |
|
|
Allowance for loan losses |
|
|
2,490 |
|
|
2,132 |
|
|
1,936 |
|
|
Non-performing loans |
|
|
3,039 |
|
|
1,915 |
|
|
1,273 |
|
|
Non-performing assets |
|
|
3,039 |
|
|
1,915 |
|
|
1,604 |
|
|
|
|
|
|
|
|
|
|
|
|
|
|
Selected Operating Data: |
|
|
|
|
|
|
|
|
|
|
|
Interest income |
|
$ |
16,687 |
|
$ |
17,291 |
|
$ |
17,954 |
|
|
Interest expense |
|
|
3,017 |
|
|
4,250 |
|
|
4,887 |
|
|
|
|
|
|
|
|
|
|
|
|
|
|
Net interest income |
|
|
13,670 |
|
|
13,041 |
|
|
13,067 |
|
|
Provision for loan losses |
|
|
1,796 |
|
|
300 |
|
|
300 |
|
|
|
|
|
|
|
|
|
|
|
|
|
|
Net interest income after provision for loan losses |
|
|
11,874 |
|
|
12,741 |
|
|
12,767 |
|
|
|
|
|
|
|
|
|
|
|
|
|
|
Non-interest income: |
|
|
|
|
|
|
|
|
|
|
|
Service charges and other income |
|
|
2,775 |
|
|
2,449 |
|
|
2,209 |
|
|
Net gain (loss) on securities and real estate |
|
|
575 |
|
|
73 |
|
|
(265 |
) |
|
|
|
|
|
|
|
|
|
|
|
|
|
Total non-interest income |
|
|
3,350 |
|
|
2,522 |
|
|
1,944 |
|
|
Total non-interest expense |
|
|
11,861 |
|
|
10,689 |
|
|
10,410 |
|
|
|
|
|
|
|
|
|
|
|
|
|
|
Income before income taxes |
|
|
3,363 |
|
|
4,574 |
|
|
4,301 |
|
|
Income taxes |
|
|
1,102 |
|
|
1,487 |
|
|
1,396 |
|
|
|
|
|
|
|
|
|
|
|
|
|
|
Net income |
|
$ |
2,261 |
|
$ |
3,087 |
|
$ |
2,905 |
|
|
|
|
|
|
|
|
|
|
|
|
|
36
|
|
|
|
|
|
|
|
|
|
|
|
|
|
|
At or for the Year Ended December 31, |
|
|||||||
|
|
|
|
|
|||||||
|
|
|
2010 |
|
2009 |
|
2008 |
|
|||
|
|
|
|
|
|
|
|
|
|||
|
|
||||||||||
|
Selected Financial Ratios and Other Data |
|
|
|
|
|
|
|
|
|
|
|
Performance Ratios: |
|
|
|
|
|
|
|
|
|
|
|
Basic earnings per share |
|
$ |
0.35 |
|
$ |
0.47 |
|
$ |
0.42 |
|
|
Diluted earnings per share |
|
$ |
0.35 |
|
$ |
0.47 |
|
$ |
0.41 |
|
|
Return on average assets |
|
|
0.69 |
% |
|
0.92 |
% |
|
0.89 |
% |
|
Return on average equity |
|
|
3.80 |
% |
|
5.27 |
% |
|
4.47 |
% |
|
Net interest rate spread (tax equivalent) |
|
|
4.24 |
% |
|
3.85 |
% |
|
3.90 |
% |
|
Net interest margin (tax equivalent) |
|
|
4.55 |
% |
|
4.24 |
% |
|
4.40 |
% |
|
Non-interest expense to average assets |
|
|
3.61 |
% |
|
3.18 |
% |
|
3.18 |
% |
|
Efficiency ratio (1) |
|
|
72.11 |
% |
|
68.95 |
% |
|
68.04 |
% |
|
Average interest earning assets to average interest-bearing liabilities |
|
|
131.71 |
% |
|
128.39 |
% |
|
130.86 |
% |
|
|
|
|
|
|
|
|
|
|
|
|
|
Capital Ratios: |
|
|
|
|
|
|
|
|
|
|
|
Average equity to average assets |
|
|
18.16 |
% |
|
17.46 |
% |
|
19.84 |
% |
|
Equity to total assets at end of period |
|
|
18.54 |
% |
|
18.30 |
% |
|
17.86 |
% |
|
Book value per share |
|
$ |
8.95 |
|
$ |
8.88 |
|
$ |
8.55 |
|
|
|
|
|
|
|
|
|
|
|
|
|
|
Bank Regulatory Capital Ratios: |
|
|
|
|
|
|
|
|
|
|
|
Core capital (Tier 1 capital) (2) |
|
|
17.57 |
% |
|
16.27 |
% |
|
17.15 |
% |
|
Total risk-based capital (2) |
|
|
25.41 |
% |
|
23.04 |
% |
|
24.45 |
% |
|
|
|
|
|
|
|
|
|
|
|
|
|
Asset Quality Ratios: |
|
|
|
|
|
|
|
|
|
|
|
Nonperforming loans as percent of loans |
|
|
1.13 |
% |
|
0.67 |
% |
|
0.42 |
% |
|
Nonperforming assets as percent of total assets |
|
|
0.93 |
% |
|
0.58 |
% |
|
0.47 |
% |
|
Allowance for loan losses as a percent of loans |
|
|
0.93 |
% |
|
0.74 |
% |
|
0.64 |
% |
|
Allowance for loan losses as a percent of non-performing loans |
|
|
81.9 |
% |
|
111.4 |
% |
|
152.1 |
% |
|
|
|
|
|
|
|
|
|
|
|
|
|
Other Data: |
|
|
|
|
|
|
|
|
|
|
|
Number of: |
|
|
|
|
|
|
|
|
|
|
|
Deposit accounts |
|
|
34,029 |
|
|
34,618 |
|
|
35,159 |
|
|
Full service offices |
|
|
5 |
|
|
5 |
|
|
5 |
|
|
|
|
|
(1) |
Non-interest expense divided by the sum of net interest income, the tax equivalent adjustment on tax-exempt municipal securities and other non-interest income, excluding investment gains/losses. |
|
|
|
|
(2) |
Regulatory capital ratios are computed for The Rome Savings Bank. |
37
|
|
|
|
MANAGEMENT’S DISCUSSION AND ANALYSIS OF FINANCIAL CONDITION AND RESULTS OF OPERATIONS |
Forward-Looking Statements
This Annual Report on Form 10-K contains “forward-looking statements” which may be identified by the use of such words as “believe,” “expect,” “anticipate,” “should,” “planned,” “estimated,” and “potential.” Examples of forward-looking statements include, but are not limited to, estimates with respect to our financial condition and results of operation and business that are subject to various factors which could cause actual results to differ materially from these estimates including, but not limited to, changes in the real estate market or local economy, changes in interest rates, changes in laws and regulations to which we are subject, and competition in our primary market area.
Any or all of our forward-looking statements in this Annual Report and in any other public statements we make may turn out to be wrong. They can be affected by inaccurate assumptions we might make or unknown risks and uncertainties. Consequently, no forward-looking statements can be guaranteed. We disclaim any obligation to subsequently revise any forward-looking statements to reflect events or circumstances after the date of such statements, or to reflect the occurrence of anticipated or unanticipated events.
General
Rome Bancorp commenced operations on October 6, 1999, when Rome Savings converted from a New York mutual savings bank to a New York mutual holding company structure whereby Rome Savings became a wholly-owned subsidiary of Rome Bancorp, a majority owned subsidiary of Rome, MHC.
On April 27, 2004, Rome Savings converted from a New York-chartered savings bank regulated by the New York State Banking Department and the FDIC to a federal savings bank regulated by the OTS.
On March 30, 2005, Rome, MHC converted from mutual to stock form (the “Conversion”). In connection with the Conversion, the 61.5% of outstanding shares of Rome Bancorp common stock owned by Rome, MHC were sold to depositors of Rome Savings and the public (the “Offering”). Following the completion of the Conversion and Offering, Rome Bancorp was succeeded by a new, fully public, Delaware corporation with the same name and Rome, MHC ceased to exist.
On October 12, 2010, Berkshire Hills Bancorp, Inc., the parent company of Berkshire Bank, and the Company entered into an Agreement and Plan of Merger pursuant to which the Company will merge with and into Berkshire Hills Bancorp, Inc. Concurrent with the merger, it is expected that the Bank will merge with and into Berkshire Bank. The transaction is subject to customary closing conditions, including the receipt of regulatory approvals and approval by the shareholders of the Company, and is currently expected to be completed on or about April 1, 2011.
Rome Bancorp’s sole business is conducted by its wholly-owned subsidiary, Rome Savings. Rome Savings’ principal business is accepting deposits from the general public and using those deposits to make residential and commercial real estate loans, as well as commercial and consumer loans to individuals and small businesses primarily in Oneida County and also elsewhere in New York State. Rome Savings also invests in long and short-term marketable securities and other liquid investments.
2010 Highlights and Overview
The following discussion focuses on the factors affecting the consolidated financial condition of Rome Bancorp as of the two years ended December 31, 2010 and 2009 and Rome Bancorp’s results of operations for the three years ended December 31, 2010. The consolidated financial statements and related notes for the three years ended December 31, 2010 should be read in conjunction with this review.
The preparation of consolidated financial statements requires management to make estimates and assumptions. Changes in these estimates and assumptions affect the reported amounts of certain assets, liabilities, revenue and expenses. Different amounts could be reported under different conditions, or if different assumptions were used in the application of these accounting policies.
Rome Savings’ results of operations depend primarily on its net interest income, which is the difference between the
38
interest income it earns on its loans and investments and the interest it pays on its deposits and other interest-bearing liabilities. Net interest income is affected by the relative amounts of interest-bearing assets and interest-bearing liabilities and the interest rates earned or paid on these balances. Rome Savings’ operations are also affected by non-interest income, such as service fees and gains and losses on sales of securities and loans, the provision for loan losses and non-interest expense such as salaries and employee benefits, occupancy costs, and other general and administrative expenses. Financial institutions in general, including Rome Savings, are significantly affected by economic conditions, competition and the monetary and fiscal policies of the federal government. Lending activities are influenced by the demand for and supply of housing, competition among lenders, interest rate conditions and fund availability. Rome Savings’ operations and lending are principally concentrated in the Central New York area, and therefore its operations and earnings are influenced by the economics of the area it operates in. Deposit balances and cost of funds are influenced by prevailing market rates on competing investments, customer preferences and levels of personal income and savings in Rome Savings’ primary market area.
Net income for 2010 decreased to $2.3 million compared to $3.1 million in the prior year. The significant factors and trends impacting 2010, which are discussed in greater depth below, were as follows:
|
|
|
|
• |
Net interest income before loan loss provision for 2010 increased to $13.7 million from $13.0 million in 2009. Decreases in average year over year market rates resulted in declines in both the yields earned on earning assets and the Company’s cost of funds. Rome Bancorp’s ratio of interest earning assets to interest bearing liabilities increased to 131.71% in 2010 from 128.39% in the prior year, while the yield on earning assets decreased to 5.56% in 2010 from 5.62% in 2009. The cost of funds decreased to 1.32% in 2010 from 1.77% the previous year. |
|
• |
Rome Bancorp’s provision for loan losses increased to $1.8 million in 2010 from $300,000 in 2009. The higher provision in 2010 was primarily necessitated by credit quality declines for two commercial credits and an increase in non-performing loans. |
|
• |
Non-interest income increased to $3.4 million in 2010 from $2.5 million in 2009. This current year increase was primarily due to gains realized on the sales of real estate, securities and residential mortgage originations. |
|
• |
Non-interest expense increased from $10.7 million in 2009 to $11.9 in 2010. The majority of this increase is related to strategic planning and acquisition expenses incurred. |
Critical Accounting Policies
It is management’s opinion that accounting estimates covering certain aspects of the business have more significance than others due to the relative importance of those areas to overall performance, or the level of subjectivity required in making these estimates. Management of Rome Bancorp considers the accounting policy relating to the allowance for loan losses to be a critical accounting policy given the uncertainty in evaluating the level of the allowance required for probable incurred credit losses and the material effect that such judgments can have on the results of operations. Management’s quarterly evaluation of the adequacy of the allowance considers Rome Bancorp’s historical loan loss experience, review of specific loans, current economic conditions and such other factors considered appropriate to estimate losses. Management uses presently available information to estimate probable incurred losses on loans; however, future additions to the allowance may be necessary based on changes in estimates, assumptions or economic conditions. Significant factors that could give rise to changes in these estimates include, but are not limited to, changes in economic conditions in the local area, concentrations of risk and declines of local property values.
Management also considers the accounting policy relating to the impairment of long lived assets to be a critical accounting policy due to the subjectivity and judgment involved and the material effect an impairment loss could have on the results of operations. A decline in the fair value of a long lived asset below cost that is deemed to be other than temporary is charged to earnings resulting in the establishment of a new cost basis for the asset. Management continually reviews the current value of its long lived assets for evidence of other than temporary impairment.
These critical policies and their application are reviewed periodically by the Audit Committee and the Board of Directors. All accounting policies are important, and as such, we encourage the reader to review each of the policies included in the notes to the Consolidated Financial Statements to obtain a better understanding of how our financial performance is reported.
39
Management of Interest Rate Risk
Interest rate risk is the most significant market risk affecting Rome Bancorp. Other types of market risk, such as movements in foreign currency exchange rates and commodity prices, do not arise in the normal course of Rome Bancorp’s business operations. Interest rate risk can be defined as an exposure to a movement in interest rates that could have an adverse effect on Rome Bancorp’s net interest income. Interest rate risk arises naturally from the imbalance in the repricing, maturity, and/or cash flow characteristics of assets and liabilities. In periods of falling interest rates, prepayments of loans typically increase, which would lead to reduced net interest income if such proceeds could not be reinvested at a comparable spread. Also in a falling rate environment, certain categories of deposits may reach a point where market forces prevent further reduction in the interest rate paid on those instruments. Generally, during extended periods when short-term and long-term interest rates are relatively close, a flat yield curve may lead to smaller net interest margins thereby reducing net interest income. The net effect of these circumstances is reduced interest income, offset only by a nominal decrease in interest expense, thereby narrowing the net interest margin.
Managing interest rate risk is of primary importance to Rome Bancorp. The responsibility for interest rate risk management is the function of Rome Bancorp’s ALCO, which includes the President and Chief Executive Officer, Executive Vice President and Chief Financial Officer, Vice President and Controller, other members of Senior Management and certain members of Rome Bancorp’s Board of Directors. Rome Bancorp’s ALCO meets at least quarterly to review Rome Bancorp’s asset/liability policies and identify and measure potential risks to earnings due to changes in interest rates. The primary goal of Rome Bancorp’s interest rate risk management is to minimize the potential loss in net interest income that could arise from changes in interest rates.
A simulation model is the primary tool used to assess the impact of changes in interest rates on net interest income. Key assumptions used in the model include prepayment speeds on loans and mortgage-backed securities, loan volumes and pricing and customer preferences, and sensitivity to changing rates. These assumptions are compared to actual results and revised as necessary. Rome Bancorp’s analysis compares net interest income under a scenario of no change from current interest rates with one of a 100, 200 and 300 basis point increase in interest rates and one of a 100 basis point decrease in rates. The change in interest rates is assumed to occur in the first twelve months following the current financial statement date. Net interest income is measured for each of the three forecasted twelve-month periods following the balance sheet date. Rome Bancorp’s policy is that net interest income should not vary by more than 20% for each of the three forecasted twelve-month periods. At December 31, 2010, based on simulation model results, Rome Bancorp was within these guidelines.
40
The following table sets forth at December 31, 2010 and 2009 the estimated percentage and dollar change in Rome Bancorp’s net interest income resulting from changes in interest rates over a one year period. Certain assumptions have been made in preparing the table below. Although management believes these assumptions to be reasonable, the interest rate sensitivity of assets and liabilities and the estimated effects of changes in interest rates on net interest income indicated in the following table could vary substantially if different assumptions were used or if actual experience differs from such assumptions.
|
|
|
|
|
|
|
|
|
|
|
|
|
|
|
|
|
|
|
|
|
|
|
|
|
2010 |
|
2009 |
|
|||||||||||||||
|
|
|
|
|
|
|
|||||||||||||||
|
|
|
Annual Net Interest Income |
|
Annual Net Interest Income |
|
|||||||||||||||
|
|
|
|
|
|
|
|||||||||||||||
|
Change in |
|
Dollar |
|
Dollar |
|
Percentage |
|
Dollar |
|
Dollar |
|
Percentage |
|
|||||||
|
|
|
|
|
|
|
|
|
|
|
|
|
|
|
|||||||
|
|
|
|
|
|
|
(Dollars in thousands) |
|
|
|
|
|
|||||||||
|
+300 |
|
|
$ |
13,362 |
|
$ |
443 |
|
|
3.43 |
% |
$ |
13,456 |
|
$ |
(280 |
) |
|
(2.04 |
)% |
|
+200 |
|
|
|
13,217 |
|
|
298 |
|
|
2.31 |
|
|
13,537 |
|
|
(199 |
) |
|
(1.45 |
) |
|
+100 |
|
|
|
13,067 |
|
|
148 |
|
|
1.15 |
|
|
13,599 |
|
|
(137 |
) |
|
(1.00 |
) |
|
Base |
|
|
|
12,919 |
|
|
— |
|
|
— |
|
|
13,736 |
|
|
— |
|
|
— |
|
|
-100 |
|
|
|
12,254 |
|
|
(665 |
) |
|
(5.15 |
) |
|
13,240 |
|
|
(496 |
) |
|
(3.61 |
) |
|
|
|
|
(1) |
Assumes an instantaneous uniform change in interest rates. Basis point equals 0.01%. |
The above table reflects that as of both December 31, 2010 and 2009, Rome Bancorp had a relatively low risk of volatility in net interest income due to interest rate fluctuations. The interest rate risk modeled as of December 31, 2010 exhibited positive variances in periods of rising interest rates and a negative variance in a model depicting decreasing interest rates. In the upward rate environments, the most immediate interest rate risk lies with the Company’s $69.2 million of time deposits, a portion of which will reprice upwards during the period in relation to changes in prevailing interest rates. However, in the simulation of a 100 basis point decrease in rates, the decrease in net interest income is primarily attributable to assumed reductions in the rates on the Company’s loan portfolio which would not be entirely offset by the cost decreases on interest bearing liabilities.
41
Analysis of Net Interest Income
Average Balances, Interest and Average Yields. The following table sets forth certain information relating to Rome Bancorp’s average balance sheets and reflects the average yield on interest-earnings assets and average cost of interest-bearing liabilities, interest earned and interest paid for the periods indicated. Such yields and costs are derived by dividing income or expense by the average balance of interest-earning assets or interest-bearing liabilities, respectively, for the periods presented. Average balances are derived from daily balances over the periods indicated. The average balances for loans are net of allowance for loan losses, but include non-accrual loans. Interest income on securities includes a tax equivalent adjustment for bank qualified municipals.
|
|
|
|
|
|
|
|
|
|
|
|
|
|
|
|
|
|
|
|
|
|
|
|
|
|
|
|
|
|
|
|
|
Average Balances, Interest and Average Yields for the years ended |
||||||||||||||||||||||||||
|
|
|
|
||||||||||||||||||||||||||
|
|
|
|
||||||||||||||||||||||||||
|
|
|
December 31, 2010 |
|
December 31, 2009 |
|
December 31, 2008 |
|
|||||||||||||||||||||
|
|
|
|
|
|
|
|
|
|||||||||||||||||||||
|
|
|
Average |
|
Interest |
|
Average |
|
Average |
|
Interest |
|
Average |
|
Average |
|
Interest |
|
Average |
|
|||||||||
|
|
|
|
|
|
|
|
|
|
|
|
|
|
|
|
|
|
|
|
|
|||||||||
|
|
|
(Dollars in thousands) |
|
|||||||||||||||||||||||||
|
Assets: |
|
|
|
|
|
|
|
|
|
|
|
|
|
|
|
|
|
|
|
|
|
|
|
|
|
|
|
|
|
Interest-earning assets: |
|
|
|
|
|
|
|
|
|
|
|
|
|
|
|
|
|
|
|
|
|
|
|
|
|
|
|
|
|
Loans |
|
$ |
279,391 |
|
$ |
15,968 |
|
|
5.72 |
% |
$ |
289,010 |
|
$ |
16,763 |
|
|
5.80 |
% |
$ |
288,630 |
|
$ |
17,561 |
|
|
6.08 |
% |
|
Securities |
|
|
16,303 |
|
|
715 |
|
|
4.38 |
|
|
11,557 |
|
|
529 |
|
|
4.58 |
|
|
7,488 |
|
|
392 |
|
|
5.24 |
|
|
Federal funds sold & other interest bearing deposits |
|
|
4,632 |
|
|
8 |
|
|
0.17 |
|
|
7,456 |
|
|
11 |
|
|
0.15 |
|
|
1,250 |
|
|
26 |
|
|
2.04 |
|
|
|
|
|
|
|
|
|
|
|
|
|
|
|
|
|
|
|
|
|
|
|
|
|
|
|
|
|
|
|
|
|
|
|
|
|
|
|
|
|
|
|
|
|
|
|
|
|
|
|
|
|
|
|
|
|
|
|
|
|
|
Total interest-earnings assets |
|
|
300,326 |
|
|
16,691 |
|
|
5.56 |
|
|
308,023 |
|
|
17,303 |
|
|
5.62 |
|
|
297,368 |
|
|
17,979 |
|
|
6.05 |
|
|
Noninterest-earning assets |
|
|
28,086 |
|
|
|
|
|
|
|
|
27,609 |
|
|
|
|
|
|
|
|
29,994 |
|
|
|
|
|
|
|
|
|
|
|
|
|
|
|
|
|
|
|
|
|
|
|
|
|
|
|
|
|
|
|
|
|
|
|
|
|
|
Total assets |
|
$ |
328,412 |
|
|
|
|
|
|
|
$ |
335,632 |
|
|
|
|
|
|
|
$ |
327,362 |
|
|
|
|
|
|
|
|
|
|
|
|
|
|
|
|
|
|
|
|
|
|
|
|
|
|
|
|
|
|
|
|
|
|
|
|
|
|
Liabilities and Shareholders’ Equity: |
|
|
|
|
|
|
|
|
|
|
|
|
|
|
|
|
|
|
|
|
|
|
|
|
|
|
|
|
|
Interest-bearing liabilities: |
|
|
|
|
|
|
|
|
|
|
|
|
|
|
|
|
|
|
|
|
|
|
|
|
|
|
|
|
|
Savings accounts |
|
$ |
84,776 |
|
$ |
339 |
|
|
0.40 |
|
$ |
82,315 |
|
$ |
330 |
|
|
0.40 |
|
$ |
80,971 |
|
$ |
446 |
|
|
0.55 |
|
|
Time deposits |
|
|
70,651 |
|
|
1,252 |
|
|
1.77 |
|
|
72,291 |
|
|
1,852 |
|
|
2.56 |
|
|
72,347 |
|
|
2,634 |
|
|
3.64 |
|
|
Money market accounts |
|
|
18,145 |
|
|
176 |
|
|
0.97 |
|
|
15,125 |
|
|
189 |
|
|
1.25 |
|
|
9,833 |
|
|
193 |
|
|
1.97 |
|
|
Other interest bearing deposits |
|
|
15,481 |
|
|
59 |
|
|
0.38 |
|
|
13,970 |
|
|
55 |
|
|
0.40 |
|
|
13,357 |
|
|
69 |
|
|
0.51 |
|
|
|
|
|
|
|
|
|
|
|
|
|
|
|
|
|
|
|
|
|
|
|
|
|
|
|
|
|
|
|
|
Total interest-bearing deposits |
|
|
189,053 |
|
|
1,826 |
|
|
0.97 |
|
|
183,701 |
|
|
2,426 |
|
|
1.32 |
|
|
176,508 |
|
|
3,342 |
|
|
1.89 |
|
|
Borrowings |
|
|
38,970 |
|
|
1,191 |
|
|
3.06 |
|
|
56,216 |
|
|
1,824 |
|
|
3.25 |
|
|
50,737 |
|
|
1,545 |
|
|
3.04 |
|
|
|
|
|
|
|
|
|
|
|
|
|
|
|
|
|
|
|
|
|
|
|
|
|
|
|
|
|
|
|
|
Total interest-bearing liabilities |
|
|
228,023 |
|
|
3,017 |
|
|
1.32 |
|
|
239,917 |
|
|
4,250 |
|
|
1.77 |
|
|
227,245 |
|
|
4,887 |
|
|
2.15 |
|
|
|
|
|
|
|
|
|
|
|
|
|
|
|
|
|
|
|
|
|
|
|
|
|
|
|
|
|
|
|
|
Noninterest-bearing deposits |
|
|
33,730 |
|
|
|
|
|
|
|
|
30,065 |
|
|
|
|
|
|
|
|
29,331 |
|
|
|
|
|
|
|
|
Other liabilities |
|
|
7,022 |
|
|
|
|
|
|
|
|
7,033 |
|
|
|
|
|
|
|
|
5,849 |
|
|
|
|
|
|
|
|
|
|
|
|
|
|
|
|
|
|
|
|
|
|
|
|
|
|
|
|
|
|
|
|
|
|
|
|
|
|
Total liabilities |
|
|
268,775 |
|
|
|
|
|
|
|
|
277,015 |
|
|
|
|
|
|
|
|
262,425 |
|
|
|
|
|
|
|
|
Shareholders’ equity |
|
|
59,637 |
|
|
|
|
|
|
|
|
58,617 |
|
|
|
|
|
|
|
|
64,937 |
|
|
|
|
|
|
|
|
|
|
|
|
|
|
|
|
|
|
|
|
|
|
|
|
|
|
|
|
|
|
|
|
|
|
|
|
|
|
Total liabilities and shareholders’ equity |
|
$ |
328,412 |
|
|
|
|
|
|
|
$ |
335,632 |
|
|
|
|
|
|
|
$ |
327,362 |
|
|
|
|
|
|
|
|
|
|
|
|
|
|
|
|
|
|
|
|
|
|
|
|
|
|
|
|
|
|
|
|
|
|
|
|
|
|
Net interest income |
|
|
|
|
|
13,674 |
|
|
|
|
|
|
|
|
13,053 |
|
|
|
|
|
|
|
|
13,092 |
|
|
|
|
|
Tax equivalent adjustment on securities |
|
|
|
|
|
(4 |
) |
|
|
|
|
|
|
|
(12 |
) |
|
|
|
|
|
|
|
(25 |
) |
|
|
|
|
|
|
|
|
|
|
|
|
|
|
|
|
|
|
|
|
|
|
|
|
|
|
|
|
|
|
|
|
|
|
Net interest income per consolidated financial statements |
|
|
|
|
$ |
13,670 |
|
|
|
|
|
|
|
$ |
13,041 |
|
|
|
|
|
|
|
$ |
13,067 |
|
|
|
|
|
|
|
|
|
|
|
|
|
|
|
|
|
|
|
|
|
|
|
|
|
|
|
|
|
|
|
|
|
|
|
|
|
|
|
|
|
|
|
|
|
|
|
|
|
|
|
|
|
|
|
|
|
|
|
|
|
|
|
|
|
Net interest rate spread |
|
|
|
|
|
|
|
|
4.24 |
% |
|
|
|
|
|
|
|
3.85 |
% |
|
|
|
|
|
|
|
3.90 |
% |
|
Net interest margin |
|
|
|
|
|
|
|
|
4.55 |
% |
|
|
|
|
|
|
|
4.24 |
% |
|
|
|
|
|
|
|
4.40 |
% |
|
Ratio of interest-earning assets to interest-bearing liabilities |
|
|
|
|
|
|
|
|
1.32 |
x |
|
|
|
|
|
|
|
1.28 |
x |
|
|
|
|
|
|
|
1.31 |
x |
42
Rate Volume Analysis. The following table analyzes the dollar amount of changes in interest income and interest expense for major components of interest-earning assets and interest-bearing liabilities. It shows the amount of the change in interest income or expense caused by either changes in outstanding balances (volume) or changes in interest rates. The effect of a change in volume is measured by applying the average rate during the first period to the volume change between the two periods. The effect of changes in rate is measured by applying the change in rate between the two periods to the average volume during the first period. Changes attributable to both rate and volume, which cannot be segregated, have been allocated proportionately to the absolute value of the change due to volume and the change due to rate.
|
|
|
|
|
|
|
|
|
|
|
|
|
|
|
|
|
|
|
|
|
|
|
|
Rate Volume Analysis |
|
||||||||||||||||
|
|
|
|
|
||||||||||||||||
|
|
|
Year Ended December 31, 2010 |
|
Year Ended December 31, 2009 |
|
||||||||||||||
|
|
|
|
|
|
|
||||||||||||||
|
|
|
Increases (decreases) due to |
|
Increases (decreases) due to |
|
||||||||||||||
|
|
|
|
|
|
|
||||||||||||||
|
|
|
Rate |
|
Volume |
|
Net |
|
Rate |
|
Volume |
|
Net |
|
||||||
|
|
|
|
|
|
|
|
|
|
|
|
|
|
|
||||||
|
|
|
( in thousands) |
|
||||||||||||||||
|
|
|
|
|
||||||||||||||||
|
Assets: |
|
|
|
|
|
|
|
|
|
|
|
|
|
|
|
|
|
|
|
|
Interest-earning assets: |
|
|
|
|
|
|
|
|
|
|
|
|
|
|
|
|
|
|
|
|
Loans |
|
$ |
(245 |
) |
$ |
(550 |
) |
$ |
(795 |
) |
$ |
(837 |
) |
$ |
39 |
|
$ |
(798 |
) |
|
Securities |
|
|
(32 |
) |
|
218 |
|
|
186 |
|
|
(76 |
) |
|
213 |
|
|
137 |
|
|
Federal funds sold & other |
|
|
|
|
|
|
|
|
|
|
|
|
|
|
|
|
|
|
|
|
Interest bearing deposits |
|
|
1 |
|
|
(4 |
) |
|
(3 |
) |
|
(142 |
) |
|
127 |
|
|
(15 |
) |
|
|
|
|
|
|
|
|
|
|
|
|
|
|
|
|
|
|
|
|
|
|
Total interest-earnings assets |
|
|
(276 |
) |
|
(336 |
) |
|
(612 |
) |
|
(1,055 |
) |
|
379 |
|
|
(676 |
) |
|
|
|
|
|
|
|
|
|
|
|
|
|
|
|
|
|
|
|
|
|
|
Interest-bearing liabilities: |
|
|
|
|
|
|
|
|
|
|
|
|
|
|
|
|
|
|
|
|
Savings accounts |
|
|
(1 |
) |
|
10 |
|
|
9 |
|
|
(123 |
) |
|
7 |
|
|
(116 |
) |
|
Time deposits |
|
|
(558 |
) |
|
(42 |
) |
|
(600 |
) |
|
(780 |
) |
|
(2 |
) |
|
(782 |
) |
|
Money market accounts |
|
|
(50 |
) |
|
37 |
|
|
(13 |
) |
|
(109 |
) |
|
104 |
|
|
(5 |
) |
|
Other interest bearing deposits |
|
|
(2 |
) |
|
6 |
|
|
4 |
|
|
(16 |
) |
|
3 |
|
|
(13 |
) |
|
|
|
|
|
|
|
|
|
|
|
|
|
|
|
|
|
|
|
|
|
|
Total interest-bearing deposits |
|
|
(611 |
) |
|
11 |
|
|
(600 |
) |
|
(1,028 |
) |
|
112 |
|
|
(916 |
) |
|
|
|
|
|
|
|
|
|
|
|
|
|
|
|
|
|
|
|
|
|
|
Borrowings |
|
|
(74 |
) |
|
(559 |
) |
|
(633 |
) |
|
113 |
|
|
166 |
|
|
279 |
|
|
|
|
|
|
|
|
|
|
|
|
|
|
|
|
|
|
|
|
|
|
|
Total interest-bearing liabilities |
|
|
(685 |
) |
|
(548 |
) |
|
(1,233 |
) |
|
(915 |
) |
|
278 |
|
|
(637 |
) |
|
|
|
|
|
|
|
|
|
|
|
|
|
|
|
|
|
|
|
|
|
|
|
|
|
|
|
|
|
|
|
|
|
|
|
|
|
|
|
|
|
|
|
Net change in interest income |
|
$ |
409 |
|
$ |
212 |
|
$ |
621 |
|
$ |
(140 |
) |
$ |
101 |
|
$ |
(39 |
) |
|
|
|
|
|
|
|
|
|
|
|
|
|
|
|
|
|
|
|
|
|
Comparison of Financial Condition at December 31, 2010 and December 31, 2009
Rome Bancorp’s total assets at December 31, 2010 were $327.2 million, a decrease of $2.7 million from $329.9 million at December 31, 2009. The majority of this decrease was attributable to contraction of the Company’s loan portfolio.
Cash and cash equivalents increased to $18.8 million at December 31, 2010 from $7.6 million a year earlier due to deposit inflows and the proceeds from sales of mortgages originated. Securities available for sale were $13.1 million at December 31, 2010, an increase of $3.1 million from $10.0 million at December 31, 2009. This increase was due to the purchase of ten bonds, partially offset by sales, principal reductions and maturities in the existing securities portfolio.
Total gross loans decreased by $19.3 million, or 6.7%, to $268.4 million at December 31, 2010 from $287.7 million at December 31, 2009. During the year ended December 31, 2010, Rome Bancorp originated approximately $56.9 million of loans. The Company’s residential mortgage loan portfolio, decreased by $13.8 million, or 8.7%, primarily due to the sale of the majority of the Company’s 2010 originations of thirty year termed fixed-rate mortgages into the secondary market. The decision to sell these originations was made to control potential interest rate risk in periods of future rising interest rates. The Company’s non-performing loans as a percentage of total loans increased to 1.13% at December 31, 2010 as compared to 0.67% at December 31, 2009, primarily due to increased delinquencies and decreased loan balances. The allowance for loan losses as a percent of non-performing loans decreased to 81.9% at December 31, 2010, from 111.4% at December 31, 2009.
43
Total deposits increased by $8.7 million or 4.0% from $216.6 million at December 31, 2009 to $225.3 million at December 31, 2010, as depositors chose insured bank deposit accounts over other available investments. The Company recorded growth in all deposit categories except for time deposits, which declined by $2.7 million, or 3.8%. Money market balances grew by $3.8 million, or 24.1%, in 2010, increasing from $15.7 million at December 31, 2009 to $19.5 million at December 31, 2010. Non-interest bearing deposits increased by $2.7 million, or 8.5%, over the past year. Savings deposits increased $3.2 million from $82.0 million at December 31, 2009 to $85.2 million at December 31, 2010. Other interest bearing deposits increased by $1.7 million, or 11.2%, from $15.2 million at December 31, 2009 to $16.9 million at year end 2010.
Comparison of Results of Operations for the Years Ended December 31, 2010 and December 31, 2009
General. Net income for the year ended December 31, 2010 decreased to $2.3 million from $3.1 million for the year ended December 31, 2009. The decrease in net income was attributable to an increase the provision for loan losses of $1.5 million and an increase in non-interest expense of $1.2 million which were partially offset by increases in net interest income before provision for loan losses and non-interest income of $629,000 and $828,000 respectively and a decrease in income tax expense of $385,000.
Net Interest Income. The Company recorded net interest income before provision for loan losses of $13.7 million in 2010 and $13.0 million in 2009. The changes in the components of net interest income are discussed in detail below.
Interest Income. Interest income decreased by $604,000 for the year ended December 31, 2010, from $17.3 million for the year ended December 31, 2009. Interest income earned on the loan portfolio decreased to $16.0 million in 2010 from $16.8 million in 2009. Average balances of the loan portfolio declined to $279.4 million in 2010 from $289.0 million in 2009, primarily due to the continued sale of the Company’s residential mortgage originations into the secondary market. The yield on loans in 2010 decreased to 5.72% compared to 5.80% in 2009 concurrent with the decline in overall underlying interest rates. Interest and dividend income on securities increased in 2010 primarily due to growth in the available for sale portfolio. Average securities increased to $16.3 million in 2010 from $11.6 million in 2009 while their tax equivalent yields decreased to 4.38% from 4.58% over the same period. Interest income of other short-term investments, including federal funds sold, dropped from $11,000 in 2009 to $8,000 in 2010.
Interest Expense. Interest expense decreased to $3.0 million in 2010 from $4.3 million in 2009 due to decreases in both the average balances of outstanding interest bearing liabilities and the cost of those funds. Interest expense on borrowings decreased from $1.8 million in 2009 to $1.2 million in 2010 as the average balances decreased from $56.2 million in 2009 to $39.0 million in the current year. The Company utilized deposit inflows and loan sale proceeds to reduce fixed rate advances upon maturity. The average rate paid on borrowings decreased to 3.06% in 2010 from 3.25% in 2009. The average rate paid on interest bearing deposits in 2010 decreased to 0.97% from 1.32% in 2009, principally due to lower rates paid on time deposits, consistent with current market trends. The average balance of interest bearing deposits increased to $189.1 million in 2010 from $183.7 million in 2009.
Provision for Loan Losses. The Company recorded a provision for loan losses of $1.8 million in 2010, compared to $300,000 in 2009. The majority of the loan loss provision is attributable to the decline in collateral value securing one commercial credit facility and the charge-off of a large commercial credit in the fourth quarter of 2010. This charge-off was necessitated by deterioration late in 2010 of the borrower’s financial position, raising uncertainty as to the source of loan repayment. Management is continuing to closely monitor these credits. In addition, the balance of non-performing loans increased in 2010. The majority of the non-performing loans are in the mortgage portfolio and management believes these loans are generally well collateralized. The allowance for loan losses increased to $2.5 million or 0.93% of total loans at December 31, 2010 compared to $2.1 million and 0.74% of total loans at December 31, 2009. The allowance for loan losses as a percent of non-performing loans decreased to 81.9% at December 31, 2010 from 111.4% at December 31, 2009. Management considers these ratios to be appropriate due to the current composition of the loan portfolio and level of non-performing loans. Non-performing loans, consisting of non-accrual loans and loans 90 days past due and still accruing, were $3.0 million or 1.13% of total loans at December 31, 2010 compared to $1.9 million or 0.67% at December 31, 2009. Rome Savings does not originate or hold subprime mortgage loans or securities collateralized by subprime loans.
44
In determining the level of the provision for loan losses necessary to absorb probable incurred credit losses, management considers historical loan loss experience, review of specific loans, the level of and trend in non-performing loans, the level of and trend in net loan charge-offs, the dollar amount and mix of the loan portfolio, as well as general economic conditions and real estate trends in Rome Bancorp’s market area, which can impact the inherent risk of loss in Rome Bancorp’s loan portfolio. As a result of these factors, management determined that a provision of $1.8 million was appropriate in 2010.
Non-Interest Income. The following table summarizes changes in the major components of non-interest income:
|
|
|
|
|
|
|
|
|
|
|
|
|
|
|
|
|
|
2010 |
|
2009 |
|
$ Change |
|
% Change |
|
||||
|
|
|
|
|
|
|
|
|
|
|
||||
|
Gain on securities |
|
$ |
156 |
|
$ |
73 |
|
$ |
83 |
|
|
113.70 |
% |
|
Gain on sale of real estate |
|
|
419 |
|
|
2 |
|
|
417 |
|
|
99.52 |
|
|
Gain on sale of loans |
|
|
493 |
|
|
155 |
|
|
338 |
|
|
218.06 |
|
|
Service charges |
|
|
1,861 |
|
|
1,815 |
|
|
46 |
|
|
2.53 |
|
|
Other income |
|
|
421 |
|
|
477 |
|
|
(56 |
) |
|
(11.74 |
) |
|
|
|
|
|
|
|
|
|
|
|
|
|
|
|
|
Total non-interest income |
|
$ |
3,350 |
|
$ |
2,522 |
|
$ |
828 |
|
|
32.83 |
% |
|
|
|
|
|
|
|
|
|
|
|
|
|
|
|
Non-interest income increased $828,000 to $3.4 million in 2010 from $2.5 million in 2009. During 2010, the Company sold six investment securities, yielding gains of $156,000; in 2009, two investments were sold at a total gain of $73,000. Also, in 2010, the Company sold a commercial real estate parcel adjacent to one of its branch locations at a gain of $419,000. The increase in gains realized on loan sales represents an increase in both the volume of loans sold and the average gain per sale. Service charge income increased commensurate with deposit and loan activity. The decrease in other income is primarily attributable to the loss of rental income on the aforementioned commercial real estate parcel sold.
Non-Interest Expense. Non-interest expense increased to $11.9 million for the year ended December 31, 2010 compared to $10.7 million for the year ended December 31, 2009. The following table summarizes changes in the major components of non-interest expense:
|
|
|
|
|
|
|
|
|
|
|
|
|
|
|
|
|
|
2010 |
|
2009 |
|
$ Change |
|
% Change |
|
||||
|
|
|
|
|
|
|
|
|
|
|
||||
|
Salaries and employee benefits |
|
$ |
6,295 |
|
$ |
6,143 |
|
$ |
152 |
|
|
2.47 |
% |
|
Occupancy and equipment expense |
|
|
1,941 |
|
|
1,918 |
|
|
23 |
|
|
1.20 |
|
|
Regulatory assessments |
|
|
321 |
|
|
416 |
|
|
(95 |
) |
|
(22.84 |
) |
|
Outside consulting and professional fees |
|
|
1,414 |
|
|
421 |
|
|
993 |
|
|
235.87 |
|
|
Other expense |
|
|
1,890 |
|
|
1,791 |
|
|
99 |
|
|
5.53 |
|
|
|
|
|
|
|
|
|
|
|
|
|
|
|
|
|
Total non-interest expense |
|
$ |
11,861 |
|
$ |
10,689 |
|
$ |
1,172 |
|
|
10.96 |
% |
|
|
|
|
|
|
|
|
|
|
|
|
|
|
|
The increase in 2010 salaries and employee benefits expense is principally due to higher costs related to stock-based benefit plans, which increased directly with increases in the Company’s average stock price throughout 2010. The current year decline in regulatory assessment rates reflects the special assessment charged in 2009 to all banks insured by the FDIC. The 2010 increase in outside consulting and professional fees is the result of costs incurred by the Company for strategic planning activities, culminating with the impending merger with Berkshire Hills Bancorp, Inc., as discussed in Note 20 of the Notes to the Consolidated Financial Statements. Major components of the increase in other expenses were in the areas of advertising, loan operations expense and insurance expense.
Income Tax Expense. Income tax expense decreased to $1.1 million for 2010 from 2009 income tax expense of $1.5 million. The decrease is attributable to lower pre-tax earnings, partially offset by the nondeductible nature of some acquisition costs incurred.
Comparison of Results of Operations for the Years Ended December 31, 2009 and December 31, 2008
General. Net income for the year ended December 31, 2009 increased to $3.1 million from $2.9 million for the year ended December 31, 2008. The increase in net income was attributable to an increase in non-interest income of $578,000, partially offset by a decrease in net interest income before provision for loan losses of $26,000, and increases in non-interest expense and income tax expense of $279,000 and $91,000, respectively.
45
Net Interest Income. The Company recorded net interest income of $13.0 million in 2009 and $13.1 million in 2008. The changes in the components of net interest income are discussed in detail below.
Interest Income. Interest income decreased by $663,000 for the year ended December 31, 2009, from $18.0 million for the year ended December 31, 2008. Interest income earned on the loan portfolio decreased to $16.8 million in 2009 from $17.6 million in 2008. Average balances of the loan portfolio remained constant at approximately $289 million in both 2009 and 2008. The yield on loans in 2009 decreased to 5.80% compared to 6.08% in 2008 concurrent with the decline in overall underlying interest rates. Interest and dividend income on securities increased in 2009 primarily due to growth in the available for sale portfolio. Average securities increased to $11.6 million in 2009 from $7.5 million in 2008 while their tax equivalent yields decreased to 4.58% from 5.24% over the same period. Interest income of other short-term investments, including federal funds sold, dropped from $26,000 in 2008 to $11,000 in 2009, as a result of a decrease in the yield earned on these funds, again driven by declines in market interest rates throughout latter 2008 and into 2009.
Interest Expense. Interest expense decreased to $4.3 million in 2009 from $4.9 million in 2008 primarily due to a decrease in the cost of funds, consistent with current market trends, partially offset by increases in the average balances of outstanding borrowings and deposits. Interest expense on borrowings increased from $1.5 million in 2008 to $1.8 million in 2009 as the average balances increased from $50.7 million in 2008 to $56.2 million in 2009. The average rate paid on these borrowings increased to 3.25% in 2009 from 3.04% in 2008, as the Company restructured its floating rate debt into longer term fixed-rate maturities in order to take advantage of the historically low interest rate levels. The average rate paid on interest bearing deposits in 2009 decreased to 1.32% from 1.89% in 2008, principally due to lower rates paid on time deposits and savings accounts.
Provision for Loan Losses. The Company recorded a provision for loan losses of $300,000 in both 2009 and 2008. While the level of non-performing loans has increased in 2009, the Company had a reduction in its actual loan losses from 2008 levels. Net loan charge-offs decreased to $104,000 in 2009 from $274,000 in the prior year. The allowance for loan losses increased to $2.1 million or 0.74% of total loans at December 31, 2009 compared to $1.9 million and 0.64% of total loans at December 31, 2008. The allowance for loan losses as a percent of non-performing loans decreased to 111.4% at December 31, 2009 compared to 152.1% at December 31, 2008. Management considered these ratios to be appropriate due to the composition of the loan portfolio and level of non-performing loans. Non-performing loans, consisting of non-accrual loans and loans 90 days past due and still accruing, were $1.9 million or 0.67% of total loans at December 31, 2009 compared to $1.3 million or 0.42% at December 31, 2008.
In determining the level of the provision for loan losses necessary to absorb probable incurred credit losses, management considers historical loan loss experience, review of specific loans, the level of and trend in non-performing loans, the level of and trend in net loan charge-offs, the dollar amount and mix of the loan portfolio, as well as general economic conditions and real estate trends in Rome Bancorp’s market area, which can impact the inherent risk of loss in Rome Bancorp’s loan portfolio. As a result of these factors, management determined that a provision of $300,000 was appropriate in 2009.
46
Non-Interest Income. The following table summarizes changes in the major components of non-interest income:
|
|
|
|
|
|
|
|
|
|
|
|
|
|
|
|
|
|
2009 |
|
2008 |
|
$ Change |
|
% Change |
|
||||
|
|
|
|
|
|
|
|
|
|
|
||||
|
Gain (loss) on securities |
|
$ |
73 |
|
$ |
(265 |
) |
$ |
338 |
|
|
127.55 |
% |
|
Gain on sale of loans |
|
|
155 |
|
|
17 |
|
|
138 |
|
|
811.76 |
|
|
Service charges |
|
|
1,815 |
|
|
1,706 |
|
|
109 |
|
|
6.39 |
|
|
Other income |
|
|
479 |
|
|
486 |
|
|
(7 |
) |
|
(1.44 |
) |
|
|
|
|
|
|
|
|
|
|
|
|
|
|
|
|
Total non-interest income |
|
$ |
2,522 |
|
$ |
1,944 |
|
$ |
578 |
|
|
29.73 |
% |
|
|
|
|
|
|
|
|
|
|
|
|
|
|
|
Non-interest income increased $578,000 to $2.5 million in 2009 from $1.9 million in 2008. During 2009, the Company sold two investment securities, yielding gains of $73,000; no investments were sold in 2008. In contrast, in 2008, in relation to declines in global investment markets, the Company recognized a write-down of $265,000 on its investment in a large blue chip mutual fund, due to impairment that was determined to be “other than temporary” under generally accepted accounting principles. In light of the low interest rate environment existent in 2009, the Company opted to sell the majority of its current year fixed-rate thirty year termed residential mortgage originations into the secondary market. Loan sales increased to $11.2 million in 2009, compared to $1.2 million in 2008, accounting for the increase in gains on loan sales. Service charge income increased commensurate with deposit and loan activity.
Non-Interest Expense. Non-interest expense increased to $10.7 million for the year ended December 31, 2009 compared to $10.4 million for the year ended December 31, 2008. The following table summarizes changes in the major components of non-interest expense:
|
|
|
|
|
|
|
|
|
|
|
|
|
|
|
|
|
|
2009 |
|
2008 |
|
$ Change |
|
% Change |
|
||||
|
|
|
|
|
|
|
|
|
|
|
||||
|
Salaries and employee benefits |
|
$ |
6,143 |
|
$ |
5,733 |
|
$ |
410 |
|
|
7.15 |
% |
|
Occupancy and equipment expense |
|
|
1,918 |
|
|
1,903 |
|
|
15 |
|
|
0.79 |
|
|
Regulatory assessments |
|
|
416 |
|
|
140 |
|
|
276 |
|
|
197.14 |
|
|
Outside consulting and professional fees |
|
|
421 |
|
|
580 |
|
|
(159 |
) |
|
(27.41 |
) |
|
Other expense |
|
|
1,791 |
|
|
2,054 |
|
|
(263 |
) |
|
(12.80 |
) |
|
|
|
|
|
|
|
|
|
|
|
|
|
|
|
|
Total non-interest expense |
|
$ |
10,689 |
|
$ |
10,410 |
|
$ |
279 |
|
|
(2.68 |
)% |
|
|
|
|
|
|
|
|
|
|
|
|
|
|
|
The increase in salaries and employee benefits is largely related to higher defined benefit pension plan expense resulting from a 2008 decline in the market value of plan assets. Due to overall higher assessment rates charged to all banks insured by the FDIC, as well as a special assessment, the Company’s FDIC and regulatory assessment expense increased to $416,000 in 2009 from $140,000 in the prior year. In 2009 the Company required less legal, professional and consulting services. Major components of the decrease in other expenses were in the areas of other real estate owned and contribution expense. Due to a reduction in other real estate owned during 2009, the Company’s expense decreased by $98,000 to $10,000 in 2009. Contribution expense decreased from $151,000 in 2008 to $17,000 in 2009 due to the 2008 donation of a parcel of Company owned real estate to the Rome Rescue Mission, Inc.
Income Tax Expense. Income tax expense was $1.5 million for 2009, an increase of $91,000 from 2008 income tax expense of $1.4 million. The increase is attributable to higher pre-tax earnings.
Liquidity and Capital Resources
Liquidity describes our ability to meet the financial obligations that arise during the ordinary course of business. Liquidity is primarily needed to meet the borrowing and deposit withdrawal requirements of our customers and to fund current and planned expenditures. Rome Bancorp’s primary sources of funds consist of deposits, scheduled amortization and prepayments of loans and mortgage-backed securities, maturities and sales of investments, interest bearing deposits at other financial institutions and funds provided from operations. Rome Savings also has a written agreement with the Federal Home Loan Bank of New York that allows it to borrow up to $61.2 million on a line of credit. At December 31, 2010, Rome Savings had no outstanding borrowings against this line of credit, but did have bullet maturity and amortizing notes totaling $35.7 million. At December 31, 2010, the Company also had approximately $8.3 million in unused short term borrowing capacity at the Federal Reserve Bank of New York.
47
Loan repayments and maturing investment securities are a relatively predictable source of funds. However, deposit flows, calls of investment securities, and prepayments of loans and mortgage-backed securities are strongly influenced by interest rates, general and local economic conditions, and competition in the marketplace. These factors reduce the predictability of the timing of these sources of funds.
Rome Bancorp’s primary investing activities include the origination of loans and to a lesser extent the purchase of investment securities. In 2010, Rome Bancorp originated approximately $56.9 million in loans compared to approximately $51.5 million in 2009. Purchases of investment securities were $5.6 million in 2010 and $7.5 million in 2009. At December 31, 2010, Rome Bancorp had loan commitments to borrowers of approximately $13.3 million, and customer available letters and lines of credit of approximately $18.6 million.
Total deposits were $225.3 million at December 31, 2010, an increase of 4.0% from $216.6 million at December 31, 2009. Time deposit accounts scheduled to mature within one year were $48.8 million at December 31, 2010. Based on our deposit retention experience and current pricing strategy, we anticipate that a significant portion of these time deposits will remain with Rome Bancorp. We are committed to maintaining a strong liquidity position therefore, Rome Bancorp monitors its liquidity position on a daily basis. Rome Bancorp anticipates that it will have sufficient funds to meet its current funding commitments. The marginal cost of new funding however, whether from deposits or from borrowings from the Federal Home Loan Bank, will be carefully considered as Rome Bancorp monitors its liquidity needs. Therefore, in order to minimize its cost of funds, Rome Bancorp may consider additional borrowings from the Federal Home Loan Bank in the future.
During 2010 Rome Bancorp repurchased 22,568 outstanding shares of its common stock at a total cost of $201,000. Rome Bancorp paid cash dividends of $0.36 per share in 2010, requiring a cash outlay of $2.3 million.
At December 31, 2010 and 2009, Rome Savings exceeded each of the applicable regulatory capital requirements. Rome Savings’ leverage (Tier 1) capital at December 31, 2010 and 2009 was $57.8 million and $54.0 million or 17.57% and 16.27% of adjusted assets, respectively. In order to be classified as “well-capitalized” by the OTS and the FDIC at December 31, 2010 and 2009, Rome Savings was required to have leverage (Tier 1) capital of $16.5 million and $16.6 million, respectively, or 5.0% of adjusted assets. To be classified as a “well-capitalized” bank by the OTS and FDIC, Rome Savings must also have a risk-based total capital ratio of 10.0%. At December 31, 2010 and 2009, Rome Savings had a risk-based total capital ratio of 25.41% and 23.04%, respectively.
Rome Bancorp does not anticipate any material capital expenditures, nor does it have any balloon or other payments due on any long-term obligations or any off-balance sheet items other than debt as described in Note 7 of Notes to the Consolidated Financial Statements and the commitments and unused lines and letters of credit noted above.
Off-Balance Sheet Arrangements
Rome Bancorp does not have any off-balance sheet arrangements that have or are reasonably likely to have a current or future effect on Rome Bancorp’s financial condition, revenues or expenses, results of operations, liquidity, capital expenditures or capital resources that is material to investors.
Recently Adopted Accounting Pronouncements
In June 2009, FASB issued Accounting Standard Update (“ASU”) Number 2009-16, “Accounting for Transfers of Financial Assets – an Amendment of FASB Statement No. 140.” The new accounting requirement amends previous guidance relating to the transfers of financial assets and eliminates the concept of a qualifying special purpose entity. This statement must be applied as of the beginning of each reporting entity’s first annual reporting period that begins after November 15, 2009, for interim periods within that first annual reporting period and for interim and annual reporting periods thereafter. This statement must be applied to transfers occurring on or after the effective date. Additionally, on and after the effective date, the concept of a qualifying special-purpose entity is no longer relevant for accounting purposes. Therefore, formerly qualifying special-purpose entities should be evaluated for consolidation by reporting entities on and after the effective date in accordance with the applicable consolidation guidance. Additionally, the disclosure provisions of this statement were also amended and apply to transfers that occurred both before and after the effective date of this statement. The adoption did not have a material impact on the Company’s consolidated financial position, results of operations or cash flows.
48
ASC Topic 810-10-65-2, “Amendments to FASB Interpretation No. 46(R),” which amended guidance for consolidation of variable interest entities by replacing the quantitative-based risks and rewards calculation for determining which enterprise, if any, has a controlling financial interest in a variable interest entity with an approach focused on identifying which enterprise has the power to direct the activities of a variable interest entity that most significantly impact the entity’s economic performance and (1) the obligation to absorb losses of the entity of (2) the right to receive benefits from the entity. This statement also requires additional disclosures about an enterprise’s involvement in variable interest entities. This statement became effective as of the beginning of each reporting entity’s first annual reporting period that begins after November 15, 2009, for interim periods within the first annual reporting period, and for interim and annual reporting periods thereafter. Early adoption is prohibited. The adoption did not have a material impact on the Company’s consolidated financial position, results of operations or cash flows.
On July 21, 2010, the FASB issued ASU No 2010-20,”Disclosures about the Credit Quality of Financing Receivables and the Allowance for Credit Losses,” which requires significant new disclosures about the allowance for credit losses and the credit quality of financing receivables. The requirements are intended to enhance transparency regarding credit losses and the credit quality of loan and lease receivables. Under this statement, allowance for credit losses and fair value are to be disclosed by portfolio segment, which credit quality information, impaired financing receivables and non-accrual status are to be presented by class of financing receivable. The disclosures are to be presented at the level of disaggregation that management uses when assessing and monitoring the portfolio’s risk and performance. This ASU is effective for interim and annual reporting periods on or after December 15, 2010. See Note 4 to the Notes to the Financial Statements – Loans.
In January 2011, FASB issued Accounting Standards Update No 2011-11, “Deferral of the Effective Date of Disclosures about Troubled Debt Restructurings in Update No. 2010-20.” The amendments in this update temporarily delay the effective date of the disclosures about troubled debt restructurings in Accounting Standards Update No. 2010-20, Receivables (Topic 310): Disclosures about the Credit Quality of Financing Receivables and the Allowance for Credit Losses,” for public entities. The delay is intended to allow the Board time to complete its deliberations on what constitutes a troubled debt restructuring. The effective date of the new disclosures about troubled debt restructurings for public entities and the guidance for determining what constitutes a troubled debt restructuring will then be coordinated.
|
|
|
|
QUANTITATIVE AND QUALITATIVE DISCLOSURES ABOUT MARKET RISK. |
The information is included in “Management’s Discussion and Analysis of Financial Condition and Results of Operations - Management of Interest Rate Risk.”
49
|
|
|
|
FINANCIAL STATEMENTS AND SUPPLEMENTARY DATA |
Rome Bancorp, Inc and Subsidiary
Index to Consolidated Financial Statements
50
REPORT OF INDEPENDENT REGISTERED PUBLIC ACCOUNTING FIRM
The Board of
Directors
Rome Bancorp, Inc.
Rome, New York
We have audited the accompanying consolidated balance sheets of Rome Bancorp, Inc. and subsidiary as of December 31, 2010 and 2009 and the related consolidated statements of income, shareholders’ equity and comprehensive income, and cash flows for each of the three years in the period ended December 31, 2010. These financial statements are the responsibility of the Company’s management. Our responsibility is to express an opinion on these financial statements based on our audits.
We conducted our audits in accordance with the standards of the Public Company Accounting Oversight Board (United States). Those standards require that we plan and perform the audit to obtain reasonable assurance about whether the consolidated financial statements are free of material misstatement. The Company is not required to have, nor were we engaged to perform, an audit of its internal control over financial reporting. Our audit included consideration of internal control over financial reporting as a basis for designing audit procedures that are appropriate in the circumstances, but not for the purpose of expressing an opinion on the effectiveness of the Company’s internal control over financial reporting. Accordingly, we express no such opinion. An audit includes examining, on a test basis, evidence supporting the amounts and disclosures in the financial statements. An audit also includes assessing the accounting principles used and significant estimates made by management, as well as evaluating the overall consolidated financial statement presentation. We believe that our audits provide a reasonable basis for our opinion.
In our opinion, the consolidated financial statements referred to above present fairly, in all material respects, the financial position of Rome Bancorp, Inc. and subsidiary as of December 31, 2010 and 2009 and the results of their operations and their cash flows for each of the three years in the period ended December 31, 2010, in conformity with U.S. generally accepted accounting principles.
|
|
|
|
/s/ Crowe Horwath LLP |
|
|
|
|
|
Crowe Horwath LLP |
|
|
Cleveland, Ohio |
|
|
March 18, 2011 |
|
51
ROME BANCORP, INC. AND SUBSIDIARY
December 31, 2010 and 2009
(In thousands, except share data)
|
|
|
|
|
|
|
|
|
|
|
|
2010 |
|
2009 |
|
||
|
Assets |
|
|
|
|
|
|
|
|
Cash and due from banks |
|
$ |
5,707 |
|
$ |
6,547 |
|
|
Federal funds sold and other short-term investments |
|
|
13,098 |
|
|
1,027 |
|
|
|
|
|
|
|
|
|
|
|
Total cash and cash equivalents |
|
|
18,805 |
|
|
7,574 |
|
|
Securities available for sale, at fair value |
|
|
13,070 |
|
|
10,024 |
|
|
Securities held to maturity (fair value of $1,459 and $1,502 at December 31, 2010 and 2009, respectively) |
|
|
1,416 |
|
|
1,431 |
|
|
Federal Home Loan Bank stock |
|
|
3,385 |
|
|
3,222 |
|
|
Loans held for sale |
|
|
920 |
|
|
— |
|
|
Loans, net of allowance of $2,490 and $2,132 |
|
|
265,937 |
|
|
285,617 |
|
|
|
|
|
|
|
|
|
|
|
Premises and equipment, net |
|
|
5,814 |
|
|
6,041 |
|
|
Accrued interest receivable |
|
|
1,100 |
|
|
1,117 |
|
|
Bank-owned life insurance |
|
|
9,812 |
|
|
9,415 |
|
|
Other assets |
|
|
6,952 |
|
|
5,481 |
|
|
|
|
|
|
|
|
|
|
|
Total assets |
|
$ |
327,211 |
|
$ |
329,922 |
|
|
|
|
|
|
|
|
|
|
|
|
|
|
|
|
|
|
|
|
Liabilities and Shareholders’ Equity |
|
|
|
|
|
|
|
|
Liabilities: |
|
|
|
|
|
|
|
|
Deposits: |
|
|
|
|
|
|
|
|
Non-interest bearing |
|
$ |
34,502 |
|
$ |
31,790 |
|
|
Savings |
|
|
85,211 |
|
|
82,031 |
|
|
Money market |
|
|
19,516 |
|
|
15,726 |
|
|
Time |
|
|
69,204 |
|
|
71,903 |
|
|
Other interest bearing |
|
|
16,892 |
|
|
15,189 |
|
|
|
|
|
|
|
|
|
|
|
Total deposits |
|
|
225,325 |
|
|
216,639 |
|
|
|
|
|
|
|
|
|
|
|
Federal home Loan Bank advances |
|
|
35,661 |
|
|
47,869 |
|
|
Other liabilities |
|
|
5,570 |
|
|
5,049 |
|
|
|
|
|
|
|
|
|
|
|
Total liabilities |
|
|
266,556 |
|
|
269,557 |
|
|
|
|
|
|
|
|
|
|
|
Commitments and contingencies (Note 14) |
|
|
— |
|
|
— |
|
|
|
|
|
|
|
|
|
|
|
Shareholders’ equity: |
|
|
|
|
|
|
|
|
Common stock, $.01 par value; 30,000,000 shares authorized; issued: 9,895,757 shares; outstanding: 6,777,551 and 6,800,119 shares at December 31, 2010 and 2009, respectively; |
|
|
99 |
|
|
99 |
|
|
Additional paid-in capital |
|
|
63,194 |
|
|
62,794 |
|
|
Retained earnings |
|
|
37,507 |
|
|
37,588 |
|
|
Treasury stock, at cost; 3,118,206 and 3,095,638 shares at December 31, 2010 and 2009, respectively |
|
|
(36,921 |
) |
|
(36,720 |
) |
|
Accumulated other comprehensive income (loss) |
|
|
(1,621 |
) |
|
(1,574 |
) |
|
Unallocated shares of employee stock ownership plan (ESOP) 232,309 and 278,275 shares at December 31, 2010 and 2009, respectively |
|
|
(1,603 |
) |
|
(1,822 |
) |
|
|
|
|
|
|
|
|
|
|
Total shareholders’ equity |
|
|
60,655 |
|
|
60,365 |
|
|
|
|
|
|
|
|
|
|
|
Total liabilities and shareholders’ equity |
|
$ |
327,211 |
|
$ |
329,922 |
|
|
|
|
|
|
|
|
|
|
See accompanying notes to consolidated financial statements.
52
ROME BANCORP, INC. AND SUBSIDIARY
Consolidated Statements of Income
Years ended December 31, 2010, 2009 and 2008
(In thousands, except share data)
|
|
|
|
|
|
|
|
|
|
|
|
|
|
|
2010 |
|
2009 |
|
2008 |
|
|||
|
Interest income: |
|
|
|
|
|
|
|
|
|
|
|
Loans |
|
$ |
15,968 |
|
$ |
16,763 |
|
$ |
17,561 |
|
|
Securities |
|
|
711 |
|
|
517 |
|
|
367 |
|
|
Other short-term investments |
|
|
8 |
|
|
11 |
|
|
26 |
|
|
|
|
|
|
|
|
|
|
|
|
|
|
Total interest income |
|
|
16,687 |
|
|
17,291 |
|
|
17,954 |
|
|
|
|
|
|
|
|
|
|
|
|
|
|
Interest expense: |
|
|
|
|
|
|
|
|
|
|
|
Deposits |
|
|
1,826 |
|
|
2,426 |
|
|
3,342 |
|
|
Borrowings |
|
|
1,191 |
|
|
1,824 |
|
|
1,545 |
|
|
|
|
|
|
|
|
|
|
|
|
|
|
Total interest expense |
|
|
3,017 |
|
|
4,250 |
|
|
4,887 |
|
|
|
|
|
|
|
|
|
|
|
|
|
|
Net interest income |
|
|
13,670 |
|
|
13,041 |
|
|
13,067 |
|
|
|
|
|
|
|
|
|
|
|
|
|
|
Provision for loan losses |
|
|
1,796 |
|
|
300 |
|
|
300 |
|
|
|
|
|
|
|
|
|
|
|
|
|
|
|
|
|
|
|
|
|
|
|
|
|
|
Net interest income after provision for loan losses |
|
|
11,874 |
|
|
12,741 |
|
|
12,767 |
|
|
|
|
|
|
|
|
|
|
|
|
|
|
|
|
|
|
|
|
|
|
|
|
|
|
Non-interest income: |
|
|
|
|
|
|
|
|
|
|
|
Service charges |
|
|
1,861 |
|
|
1,815 |
|
|
1,706 |
|
|
Gain on sale of loans |
|
|
493 |
|
|
155 |
|
|
17 |
|
|
Net gain (loss) on securities |
|
|
156 |
|
|
73 |
|
|
(265 |
) |
|
Gain (loss) on sale of real estate |
|
|
419 |
|
|
2 |
|
|
(18 |
) |
|
Earnings on bank owned life insurance |
|
|
397 |
|
|
409 |
|
|
408 |
|
|
Other income |
|
|
24 |
|
|
68 |
|
|
96 |
|
|
|
|
|
|
|
|
|
|
|
|
|
|
Total non-interest income |
|
|
3,350 |
|
|
2,522 |
|
|
1,944 |
|
|
|
|
|
|
|
|
|
|
|
|
|
|
|
|
|
|
|
|
|
|
|
|
|
|
Non-interest expense: |
|
|
|
|
|
|
|
|
|
|
|
Salaries and employee benefits |
|
|
6,295 |
|
|
6,143 |
|
|
5,733 |
|
|
Building, occupancy and equipment |
|
|
1,941 |
|
|
1,918 |
|
|
1,903 |
|
|
FDIC and OTS assessments |
|
|
321 |
|
|
416 |
|
|
140 |
|
|
Outside consulting and professional fees |
|
|
1,414 |
|
|
421 |
|
|
580 |
|
|
ATM service fees |
|
|
210 |
|
|
251 |
|
|
236 |
|
|
Other |
|
|
1,680 |
|
|
1,540 |
|
|
1,818 |
|
|
|
|
|
|
|
|
|
|
|
|
|
|
Total non-interest expense |
|
|
11,861 |
|
|
10,689 |
|
|
10,410 |
|
|
|
|
|
|
|
|
|
|
|
|
|
|
|
|
|
|
|
|
|
|
|
|
|
|
Income before income tax expense |
|
|
3,363 |
|
|
4,574 |
|
|
4,301 |
|
|
|
|
|
|
|
|
|
|
|
|
|
|
Income tax expense |
|
|
1,102 |
|
|
1,487 |
|
|
1,396 |
|
|
|
|
|
|
|
|
|
|
|
|
|
|
|
|
|
|
|
|
|
|
|
|
|
|
Net income |
|
$ |
2,261 |
|
$ |
3,087 |
|
$ |
2,905 |
|
|
|
|
|
|
|
|
|
|
|
|
|
|
|
|
|
|
|
|
|
|
|
|
|
|
Basic earnings per share |
|
$ |
0.35 |
|
$ |
0.47 |
|
$ |
0.42 |
|
|
|
|
|
|
|
|
|
|
|
|
|
|
Diluted earnings per share |
|
$ |
0.35 |
|
$ |
0.47 |
|
$ |
0.41 |
|
|
|
|
|
|
|
|
|
|
|
|
|
See accompanying notes to consolidated financial statements.
53
ROME BANCORP, INC. AND SUBSIDIARY
Consolidated Statements of Shareholders’ Equity and Comprehensive Income
Years ended December 31, 2010, 2009 and 2008
(In thousands, except share data)
|
|
|
|
|
|
|
|
|
|
|
|
|
|
|
|
|
|
|
|
|
|
|
|
|
|
|
Common |
|
Additional |
|
Retained |
|
Treasury |
|
Accumulated |
|
Unallocated |
|
Total |
|
|||||||
|
|
|
|
|
|
|
|
|
|
|
|
|
|
|
|
|
|||||||
|
Balances at December 31, 2007 |
|
$ |
99 |
|
$ |
61,884 |
|
$ |
36,179 |
|
$ |
(26,488 |
) |
$ |
(376 |
) |
$ |
(2,261 |
) |
$ |
69,037 |
|
|
Comprehensive income: |
|
|
|
|
|
|
|
|
|
|
|
|
|
|
|
|
|
|
|
|
|
|
|
Net income |
|
|
— |
|
|
— |
|
|
2,905 |
|
|
— |
|
|
— |
|
|
— |
|
|
2,905 |
|
|
Other comprehensive income |
|
|
— |
|
|
— |
|
|
— |
|
|
— |
|
|
(1,836 |
) |
|
— |
|
|
(1,836 |
) |
|
|
|
|
|
|
|
|
|
|
|
|
|
|
|
|
|
|
|
|
|
|
|
|
|
Total comprehensive income |
|
|
|
|
|
|
|
|
|
|
|
|
|
|
|
|
|
|
|
|
1,069 |
|
|
|
|
|
|
|
|
|
|
|
|
|
|
|
|
|
|
|
|
|
|
|
|
|
|
Purchase of 731,750 treasury shares |
|
|
— |
|
|
— |
|
|
— |
|
|
(8,174 |
) |
|
— |
|
|
— |
|
|
(8,174 |
) |
|
Exercise of stock options and related tax benefit 2,201 shares, net |
|
|
— |
|
|
— |
|
|
— |
|
|
— |
|
|
— |
|
|
— |
|
|
— |
|
|
Amortization and tax benefits of stock option and restricted share grants |
|
|
|
|
|
280 |
|
|
|
|
|
|
|
|
|
|
|
|
|
|
280 |
|
|
Dividends paid ($0.34 per share) |
|
|
— |
|
|
— |
|
|
(2,387 |
) |
|
— |
|
|
— |
|
|
— |
|
|
(2,387 |
) |
|
ESOP shares released for allocation (45,965 shares) |
|
|
— |
|
|
276 |
|
|
— |
|
|
— |
|
|
— |
|
|
219 |
|
|
495 |
|
|
Adjustment to initially apply pension guidance, net of tax (Note 9) |
|
|
— |
|
|
— |
|
|
24 |
|
|
— |
|
|
— |
|
|
— |
|
|
24 |
|
|
|
|
|
|
|
|
|
|
|
|
|
|
|
|
|
|
|
|
|
|
|
|
|
|
Balances at December 31, 2008 |
|
|
99 |
|
|
62,440 |
|
|
36,721 |
|
|
(34,662 |
) |
|
(2,212 |
) |
|
(2,042 |
) |
|
60,344 |
|
|
Comprehensive income: |
|
|
|
|
|
|
|
|
|
|
|
|
|
|
|
|
|
|
|
|
|
|
|
Net income |
|
|
— |
|
|
— |
|
|
3,087 |
|
|
— |
|
|
— |
|
|
— |
|
|
3,087 |
|
|
Other comprehensive loss |
|
|
— |
|
|
— |
|
|
— |
|
|
— |
|
|
638 |
|
|
— |
|
|
638 |
|
|
|
|
|
|
|
|
|
|
|
|
|
|
|
|
|
|
|
|
|
|
|
|
|
|
Total comprehensive income |
|
|
|
|
|
|
|
|
|
|
|
|
|
|
|
|
|
|
|
|
3,725 |
|
|
|
|
|
|
|
|
|
|
|
|
|
|
|
|
|
|
|
|
|
|
|
|
|
|
Purchase of 260,788 treasury shares |
|
|
— |
|
|
— |
|
|
— |
|
|
(2,058 |
) |
|
— |
|
|
— |
|
|
(2,058 |
) |
|
Exercise of stock options and related tax benefit 2,041 shares, net |
|
|
— |
|
|
— |
|
|
— |
|
|
— |
|
|
— |
|
|
— |
|
|
— |
|
|
Amortization and tax benefits of stock option and restricted share grants |
|
|
— |
|
|
190 |
|
|
— |
|
|
— |
|
|
— |
|
|
— |
|
|
190 |
|
|
Dividends paid ($0.34 per share) |
|
|
— |
|
|
— |
|
|
(2,220 |
) |
|
— |
|
|
— |
|
|
— |
|
|
(2,220 |
) |
|
ESOP shares released for allocation (45,964 shares) |
|
|
— |
|
|
164 |
|
|
— |
|
|
— |
|
|
— |
|
|
220 |
|
|
384 |
|
|
|
|
|
|
|
|
|
|
|
|
|
|
|
|
|
|
|
|
|
|
|
|
|
|
Balances at December 31, 2009 |
|
|
99 |
|
|
62,794 |
|
|
37,588 |
|
|
(36,720 |
) |
|
(1,574 |
) |
|
(1,822 |
) |
|
60,365 |
|
|
Comprehensive income: |
|
|
|
|
|
|
|
|
|
|
|
|
|
|
|
|
|
|
|
|
|
|
|
Net income |
|
|
— |
|
|
— |
|
|
2,261 |
|
|
— |
|
|
— |
|
|
— |
|
|
2,261 |
|
|
Other comprehensive loss |
|
|
— |
|
|
— |
|
|
— |
|
|
— |
|
|
(47 |
) |
|
— |
|
|
(47 |
) |
|
|
|
|
|
|
|
|
|
|
|
|
|
|
|
|
|
|
|
|
|
|
|
|
|
Total comprehensive income |
|
|
|
|
|
|
|
|
|
|
|
|
|
|
|
|
|
|
|
|
2,214 |
|
|
|
|
|
|
|
|
|
|
|
|
|
|
|
|
|
|
|
|
|
|
|
|
|
|
Purchase of 22,568 treasury shares |
|
|
— |
|
|
— |
|
|
— |
|
|
(201 |
) |
|
— |
|
|
— |
|
|
(201 |
) |
|
Amortization and tax benefits of stock option and restricted share grants |
|
|
— |
|
|
188 |
|
|
— |
|
|
— |
|
|
— |
|
|
— |
|
|
188 |
|
|
Dividends paid ($0.36 per share) |
|
|
— |
|
|
— |
|
|
(2,342 |
) |
|
— |
|
|
— |
|
|
— |
|
|
(2,342 |
) |
|
ESOP shares released for allocation (45,966 shares) |
|
|
— |
|
|
212 |
|
|
— |
|
|
— |
|
|
— |
|
|
219 |
|
|
431 |
|
|
|
|
|
|
|
|
|
|
|
|
|
|
|
|
|
|
|
|
|
|
|
|
|
|
Balances at December 31, 2010 |
|
$ |
99 |
|
$ |
63,194 |
|
$ |
37,507 |
|
$ |
(36,921 |
) |
$ |
(1,621 |
) |
$ |
(1,603 |
) |
$ |
60,655 |
|
|
|
|
|
|
|
|
|
|
|
|
|
|
|
|
|
|
|
|
|
|
|
|
|
See accompanying notes to consolidated financial statements.
54
ROME
BANCORP, INC. AND SUBSIDIARY
Consolidated Statements of Cash Flows
Years ended December 31, 2010, 2009 and 2008
(In thousands)
|
|
|
|
|
|
|
|
|
|
|
|
|
|
|
2010 |
|
2009 |
|
2008 |
|
|||
|
Cash flows from operating activities: |
|
|
|
|
|
|
|
|
|
|
|
Net income |
|
$ |
2,261 |
|
$ |
3,087 |
|
$ |
2,905 |
|
|
Adjustments to reconcile net income to net cash provided by operating activities: |
|
|
|
|
|
|
|
|
|
|
|
Depreciation |
|
|
478 |
|
|
513 |
|
|
563 |
|
|
Decrease (increase) in accrued interest receivable |
|
|
17 |
|
|
(32 |
) |
|
39 |
|
|
Provision for loan losses |
|
|
1,796 |
|
|
300 |
|
|
300 |
|
|
Net loss on other than temporary securities impairment |
|
|
— |
|
|
— |
|
|
265 |
|
|
Net gains on securities transactions |
|
|
(156 |
) |
|
(73 |
) |
|
— |
|
|
Gain on sales of loans |
|
|
(493 |
) |
|
(155 |
) |
|
(17 |
) |
|
Proceeds from sale of loans |
|
|
20,067 |
|
|
11,173 |
|
|
1,180 |
|
|
Origination of loans for sale |
|
|
(20,494 |
) |
|
(11,018 |
) |
|
(1,163 |
) |
|
Net accretion/amortization on securities |
|
|
121 |
|
|
7 |
|
|
3 |
|
|
Increase in cash surrender value of Bank-owned life insurance |
|
|
(397 |
) |
|
(409 |
) |
|
(408 |
) |
|
(Gain) loss on sale of other real estate |
|
|
(410 |
) |
|
(2 |
) |
|
18 |
|
|
Increase (decrease) in other liabilities |
|
|
521 |
|
|
(237 |
) |
|
(3,527 |
) |
|
|
|
|
|
|
|
|
|
|
|
|
|
Deferred income tax (benefit) expense |
|
|
(143 |
) |
|
(107 |
) |
|
126 |
|
|
(Increase) decrease in other assets |
|
|
(1,822 |
) |
|
(526 |
) |
|
3,122 |
|
|
Allocation of ESOP shares |
|
|
431 |
|
|
384 |
|
|
495 |
|
|
Amortization of stock-based compensation |
|
|
228 |
|
|
228 |
|
|
280 |
|
|
|
|
|
|
|
|
|
|
|
|
|
|
Net cash provided by operating activities |
|
|
2,005 |
|
|
3,133 |
|
|
4,181 |
|
|
|
|
|
|
|
|
|
|
|
|
|
|
|
|
|
|
|
|
|
|
|
|
|
|
Cash flows from investing activities: |
|
|
|
|
|
|
|
|
|
|
|
Net decrease (increase) in loans |
|
|
18,379 |
|
|
12,344 |
|
|
(18,216 |
) |
|
Proceeds from sales of securities available for sale |
|
|
1,303 |
|
|
1,314 |
|
|
— |
|
|
Proceeds from maturities and principal reductions of securities available for sale |
|
|
1,198 |
|
|
349 |
|
|
921 |
|
|
Purchases of securities available for sale |
|
|
(5,553 |
) |
|
(7,477 |
) |
|
(3,244 |
) |
|
Purchases of securities held to maturity |
|
|
— |
|
|
— |
|
|
(326 |
) |
|
Proceeds from maturities and principal reductions of securities held to maturity |
|
|
10 |
|
|
9 |
|
|
23 |
|
|
Proceeds from sale of real estate owned |
|
|
205 |
|
|
525 |
|
|
253 |
|
|
Purchases of premises and equipment, net |
|
|
(251 |
) |
|
(176 |
) |
|
(361 |
) |
|
|
|
|
|
|
|
|
|
|
|
|
|
Net cash provided by (used in) investing activities |
|
|
15,291 |
|
|
6,888 |
|
|
(20,950 |
) |
|
|
|
|
|
|
|
|
|
|
|
|
|
|
|
|
|
|
|
|
|
|
|
|
|
Cash flows from financing activities: |
|
|
|
|
|
|
|
|
|
|
|
Decrease in time deposits |
|
|
(2,699 |
) |
|
(235 |
) |
|
(1,071 |
) |
|
Increase in other deposits |
|
|
11,385 |
|
|
10,942 |
|
|
3,971 |
|
|
Repayments of borrowings |
|
|
(27,083 |
) |
|
(33,409 |
) |
|
(12,709 |
) |
|
Advances on borrowings |
|
|
14,875 |
|
|
14,954 |
|
|
38,700 |
|
|
Purchase of treasury stock |
|
|
(201 |
) |
|
(2,058 |
) |
|
(8,174 |
) |
|
Dividends |
|
|
(2,342 |
) |
|
(2,220 |
) |
|
(2,387 |
) |
|
|
|
|
|
|
|
|
|
|
|
|
|
Net cash (used in) provided by financing activities |
|
|
(6,065 |
) |
|
(12,026 |
) |
|
18,330 |
|
|
|
|
|
|
|
|
|
|
|
|
|
|
|
|
|
|
|
|
|
|
|
|
|
|
Net increase (decrease) in cash and cash equivalents |
|
|
11,231 |
|
|
(2,005 |
) |
|
1,561 |
|
|
Cash and cash equivalents at beginning of year |
|
|
7,574 |
|
|
9,579 |
|
|
8,018 |
|
|
|
|
|
|
|
|
|
|
|
|
|
|
Cash and cash equivalents at end of year |
|
$ |
18,805 |
|
$ |
7,574 |
|
$ |
9,579 |
|
|
|
|
|
|
|
|
|
|
|
|
|
(Continued)
55
ROME BANCORP, INC. AND SUBSIDIARY
Consolidated Statements of Cash Flows (continued)
Years ended December 31, 2010, 2009 and 2008
(In thousands)
|
|
|
|
|
|
|
|
|
|
|
|
|
|
|
2010 |
|
2009 |
|
2008 |
|
|||
|
Other non-cash activities: |
|
|
|
|
|
|
|
|
|
|
|
Transfers from loans to real estate owned |
|
$ |
65 |
|
$ |
192 |
|
$ |
505 |
|
|
Financing of sale of real estate owned |
|
|
563 |
|
|
— |
|
|
— |
|
|
Cash paid during the year for: |
|
|
|
|
|
|
|
|
|
|
|
Interest |
|
|
3,044 |
|
|
4,244 |
|
|
4,795 |
|
|
Income taxes |
|
|
2,075 |
|
|
1,097 |
|
|
1,514 |
|
See accompanying notes to consolidated financial statements.
56
|
|
|
|
|
(1) |
||
|
|
|
|
|
|
Rome Bancorp, Inc. (the “Company”) is a registered savings and loan holding company, organized under the laws of Delaware and is the parent company of The Rome Savings Bank and its subsidiaries (“Rome Savings “ or the “Bank”). The Company provides traditional community banking services for individuals and small-to medium-sized businesses, through the Bank’s five branches in Oneida County of New York State. |
|
|
|
|
|
|
(2) |
Summary of Significant Accounting Policies |
|
|
|
|
|
|
|
(a) Basis of Presentation |
|
|
|
|
|
|
|
|
The consolidated financial statements have been prepared in conformity with U.S. generally accepted accounting principles. Amounts in the prior year’s consolidated financial statements are reclassified when necessary to conform with the current year’s presentation. Reclassifications had no affect on prior year net income or shareholders’ equity. A description of the significant accounting policies is presented below. To prepare financial statements in conformity with U.S. generally accepted accounting principles, management makes estimates and assumptions based on the available information. Management is required to make estimates and assumptions that affect the reported amounts of assets and liabilities as of the date of the balance sheet and disclosures of contingent assets and liabilities and the reported amounts of revenues and expenses for the period. Significant estimates include the allowance for loan losses, valuation of securities, deferred tax assets and employee benefit obligations. Actual results could differ from those estimates. |
|
|
|
|
|
|
|
The consolidated financial statements include the accounts of the Rome Bancorp, Inc. and its wholly-owned subsidiary. All significant inter-company accounts and transactions are eliminated in consolidation. |
|
|
|
|
|
|
(b) Securities |
|
|
|
|
|
|
|
|
The Company classifies its debt securities as either available-for-sale or held-to-maturity as the Company does not hold any securities considered to be trading. Held-to-maturity securities are those debt securities the Company has the ability and intent to hold until maturity. All other debt securities are classified as available for sale. Equity securities with readily determinable fair values are classified as available for sale. |
|
|
|
|
|
|
|
Held-to-maturity securities are recorded at amortized cost. Available-for-sale securities are recorded at fair value. Unrealized holding gains and losses, net of the related deferred tax effect, on available-for-sale securities are excluded from earnings and reported as accumulated other comprehensive income, a component of shareholders’ equity, until realized. |
|
|
|
|
|
|
|
Management evaluates securities for other than temporary impairment (“OTTI”) at least on a quarterly basis and more frequently when economic or market conditions warrant such an evaluation. |
|
|
|
|
|
|
|
Premiums and discounts are amortized or accreted over the life of the related security as an adjustment to yield using the interest method. Dividend and interest income are recognized when earned on the accrual method. Purchases and sales are recorded on a trade date basis with settlement occurring shortly thereafter. Realized gains and losses on securities sold are derived using the specific identification method for determining the cost of securities sold. |
|
|
|
|
|
|
|
Management evaluates securities for other-than-temporary impairment (“OTTI”) on at least a quarterly basis, and more frequently when economic or market conditions warrant such an evaluation. For securities in an unrealized loss position, management considers the extent and |
57
|
|
|
|
|
|
|
duration of the unrealized loss, and the financial condition and near-term prospects of the issuer. Management also assesses whether it intends to sell, or it is more likely than not that it will be required to sell, a security in an unrealized loss position before recovery of its amortized cost basis. If either of the criteria regarding intent or requirement to sell is met, the entire difference between amortized cost and the fair market value is recognized as impairment through earnings. For debt securities that do not meet the aforementioned criteria, the amount of impairment is split into two components as follows: 1) OTTI related to credit loss, which must be recognized in the income statement and 2) OTTI related to other factors, which is recognized in other comprehensive income. The credit loss is defined as the difference between the present value of the cash flows expected to be collected and the amortized cost basis. For equity securities, the entire amount of impairment is recognized through earnings. |
|
|
|
|
|
|
|
In order to determine OTTI for purchased beneficial interests that, on the purchase date, were not highly rated, the Company compares the present value of the remaining cash flows as estimated at the preceding evaluation date to the current expected remaining cash flows. OTTI is deemed to have occurred if there has been an adverse change in the remaining expected future cash flows. |
|
|
|
|
|
|
(c) Federal Home Loan Bank (FHLB) Stock |
|
|
|
|
|
|
|
|
The Bank is a member of the FHLB system. Members are required to own a certain amount of stock based on the level of borrowings and other factors, and may invest in additional amounts. FHLB stock is carried at cost, classified as a restricted security, and periodically evaluated for impairment based on ultimate recovery of par value. Both cash and stock dividends are reported as income. |
|
|
|
|
|
|
(d) Loans Held for Sale |
|
|
|
|
|
|
|
|
Mortgage loans originated and intended for sale in the secondary market are carried at the lower of the aggregate cost or fair value, as determined by outstanding commitments from investors. Net unrealized losses, if any, are recorded as a valuation reserve and charged to earnings. |
|
|
|
|
|
|
|
Mortgage loans held for sale are generally sold with servicing rights retained. The carrying value of mortgage loans sold is reduced by the amount allocated to the servicing right. Gains and losses on sales of mortgage loans are based on the difference between the selling price and the carrying value of the related loan sold. |
|
|
|
|
|
|
(e) Loans |
|
|
|
|
|
|
|
|
Loans are reported at the principal amount outstanding net of loans in process, net deferred loan fees and costs and an allowance for loan losses. Origination fees and certain direct origination costs related to lending activities are deferred and amortized over the life of the related loans. The Company has the ability and intent to hold its loans for the foreseeable future or until maturity or payoff. |
|
|
|
|
|
|
|
Interest on loans is accrued and included in income at contractual rates applied to principal outstanding. The accrual of interest on loans (including impaired loans) is generally discontinued, and previously accrued interest is reversed, when loan payments are 90 days or more past due, or when, by the judgment of management, collectibility becomes uncertain. Subsequent recognition of income occurs only to the extent that payment is received. Loans are generally returned to an accrual status when both principal and interest become current and the loan is determined to be performing in accordance with the applicable loan terms. |
|
|
|
|
|
|
|
Most of the Company’s business activity is with customers located within Oneida County, New York. Therefore, the Company’s exposure to credit risk is significantly affected by changes in the economy in the Oneida County area. The majority of the Company’s loan |
58
|
|
|
|
|
|
|
portfolio is 1-4 family real estate, commercial real estate and consumer loans. These loans are largely secured by underlying real estate or consumer collateral. Repayment of these loans is dependent on general economic conditions and unemployment levels in the Company’s market area. |
|
|
|
|
|
|
|
The repayment of commercial loans depends on a large degree on the results of operations, cash flow and management of the related businesses. These loans may be affected to a greater extent by adverse commerce conditions or the economy in general. Accordingly, the nature of these loans makes them more difficult for management to monitor and evaluate. |
|
|
|
|
|
|
(f) Allowance for Loan Losses |
|
|
|
|
|
|
|
|
The allowance for loan losses is a valuation allowance for probable incurred credit losses. The allowance for loan losses is increased by the provision for loan losses charged to operations and is decreased by the charge-off of loans, net of recoveries. Loans are charged off when management determines that ultimate success of the loan’s collectibility is remote. |
|
|
|
|
|
|
|
Management’s evaluation of the adequacy of the allowance considers the Company’s historical loan loss experience, review of specific loans, current economic conditions and such other factors considered appropriate to estimate losses. Management uses presently available information to estimate probable losses on loans; however, future additions to the allowance may be necessary based on changes in estimates, assumptions or economic conditions. In addition, various regulatory agencies, as an integral part of their examination process, periodically review the Company’s allowance for loan losses and may require the Company to recognize additions to the allowance based on their judgment of information available to them at the time of their examination. |
|
|
|
|
|
|
|
The allowance consists of specific and general components. The specific component relates to loans that are individually classified as impaired or loans otherwise classified as substandard or doubtful. The general component covers non-classified loans and is based on historical loss experience adjusted for current factors. |
|
|
|
|
|
|
|
The allowance for loan losses is evaluated on a quarterly basis by management in order to maintain the allowance at a level sufficient to absorb probable incurred loan losses based upon known and inherent risks in the loan portfolio. |
|
|
|
|
|
|
|
The Company estimates losses on impaired loans based on the present value of expected future cash flows (discounted at the loan’s effective interest rate) or the fair value of the underlying collateral if the loan is collateral dependent. An impairment loss exists if the recorded investment in a loan exceeds the value of the loan as measured by the aforementioned methods. Impairment losses are included as a component of the allowance for loan losses. A loan is considered impaired when it is probable that the Company will be unable to collect all amounts due according to the contractual terms of the loan agreement. Generally, all commercial mortgage loans and commercial loans greater than $250,000 in a non-accrual status are considered impaired. Commercial mortgage loans and commercial loans less than $250,000 and all residential mortgage loans, consumer loans and education loans are evaluated collectively for impairment by portfolio since they are homogeneous and generally carry smaller individual balances. The Company recognizes interest income on impaired loans using the cash basis of income recognition. Cash receipts on impaired loans are generally applied according to the terms of the loan agreement, or as a reduction of principal, based upon management’s judgment and the related factors discussed above. All classes of residential 1-4 family, commercial real estate, commercial loans and other commercial loans that become delinquent beyond 90 days are analyzed and a charge-off is taken when it is determined that the underlying collateral, if any, is not sufficient to offset the indebtedness. |
59
|
|
|
|
|
|
|
The general component covers non-impaired loans and is based on historical loss experience adjusted for current factors. The historical loss experience is determined by portfolio segment and is based on the actual loss history experienced by the Company over the most recent four years. This actual loss experience is supplemented with other economic factors based on the risks present for each portfolio segment. These economic factors include consideration of the following: levels of and trends in delinquencies and impaired loans; levels of and trends in charge-offs and recoveries; trends in volume and terms of loans; effects of any changes in underwriting standards; other changes in lending policies, procedures and practices; experience, ability and depth of lending management and other related staff; national and local economic trends and conditions; industry conditions and effects of changes in credit concentrations. The following portfolio segments have been identified: Residential 1-4 Family Mortgage, Commercial Real Estate, Commercial Loans, and Other Consumer Loans. The risk characteristics of each of the identified portfolio segments are as follows: |
|
|
|
|
|
|
|
Residential 1-4 Family Mortgage - Subject to adverse employment conditions in the local economy leading to increased default rate; decreased market values from oversupply in a geographic area; impact to borrowers’ ability to maintain payments in the event of incremental rate increases on adjustable rate mortgages. |
|
|
|
|
|
|
|
Commercial Real Estate - Subject to adverse various market conditions that cause a decrease in market value or lease rates; the potential for environmental impairment from events occurring on subject or neighboring properties; obsolescence in location or function. |
|
|
|
|
|
|
|
Commercial Loans - Borrowers may be subject to industry conditions including decreases in product demand; increasing material or other production costs that cannot be immediately recaptured in the sales or distribution cycle; interest rate increases that could have an adverse impact on profitability; non-payment of credit that has been extended under normal vendor terms for goods sold or services extended; interruption related to the importing or exporting of production materials or sold products. |
|
|
|
|
|
|
|
Other Consumer Loans - Subject to adverse employment conditions in the local economy which may lead to higher default rates; decreases in the value of underlying collateral. |
|
|
|
|
|
|
|
If a troubled debt restructuring is considered to be a collateral dependent loan, the loan is reported, net, at the fair value of the collateral. For troubled debt restructurings that subsequently default, the Company determines the amount of reserve in accordance with the accounting policy for the allowance for loan losses. |
|
|
|
|
|
|
(g) Real Estate Owned |
|
|
|
|
|
|
|
|
Real estate acquired through foreclosure or deed in lieu of foreclosure is recorded at fair value less estimated costs to sell. Write-downs from cost to fair value which are required at the time of foreclosure are charged to the allowance for loan losses. Adjustments to the carrying value of such properties that result from subsequent declines in value are charged to operations in the period in which the declines occur. Operating costs associated with the properties are charged to expense as incurred. |
|
|
|
|
|
|
(h) Premises and Equipment |
|
|
|
|
|
|
|
|
Land is carried at cost and buildings and improvements and furniture and equipment are carried at cost less accumulated depreciation and amortization. Depreciation is computed on the straight-line method over the estimated useful lives of the assets (7 to 40 years for buildings and 3 to 10 years for furniture and equipment). |
|
|
|
|
|
|
(i) Employee Benefit Plans |
|
60
|
|
|
|
|
|
|
The Company maintains a non-contributory defined benefit pension plan that covers approximately 50% of all current full time employees. The Company’s Board of Directors amended the plan in December of 2002 to cease the accrual of any further benefits. The benefits under the pension plan are based on the employee’s years of service and compensation. Pension expense is the net of service cost and interest cost, return on plan assets and amortization of gains and losses not immediately recognized. The Company’s funding policy is to contribute annually at least the minimum required to meet the funding standards set forth under provisions of the Employee Retirement Income Security Act of 1974. |
|
|
|
|
|
|
|
The Company provides health care and life insurance benefits to certain retired full time employees. The estimated costs of providing benefits are accrued over the years the employees render services necessary to earn those benefits. |
|
|
|
|
|
|
|
The Company has a defined contribution 401(k) Savings Plan for all employees. Employees are permitted to contribute up to 75% of base pay to the Savings Plan, subject to certain limitations. The Company matches 50% of each employee’s contributions up to a limit of 3% of the employee’s base pay. |
|
|
|
|
|
|
|
The Company also sponsors a non-contributory Employee Stock Ownership Plan (ESOP) covering substantially all full time employees. The number of shares allocable to participants of the Plan is determined by the Board of Directors. Allocations to individual participant accounts are based on participant compensation. As shares are committed to be released to participants, the Company reports compensation expense equal to the current market price of the shares and the shares become outstanding for earnings per share computations. Dividends on allocated shares reduce retained earnings; dividends on unallocated ESOP shares reduce debt and accrued interest. |
|
|
|
|
|
|
(j) Income Taxes |
|
|
|
|
|
|
|
|
The Company and its subsidiaries file a consolidated tax return. Deferred tax assets and liabilities are the expected future amounts attributable to temporary differences between the financial statement carrying amounts of assets and liabilities and their respective tax bases. The effect on deferred tax assets and liabilities of a change in tax rates is recognized in the period that includes the enactment date. |
|
|
|
|
|
|
|
A tax position is recognized as a benefit only if it is “more likely than not” that the tax position would be sustained in a tax examination, with a tax examination being presumed to occur. The amount recognized is the largest amount of tax benefit that is greater than 50% likely of being realized on examination. For tax positions not meeting the “more likely than not” test, no tax benefit is recorded. The Company recognizes interest and or penalties related to income tax matters in income tax expense. |
|
|
|
|
|
|
(k) Cash and Cash Equivalents |
|
|
|
|
|
|
|
|
For purposes of reporting cash flows, cash and cash equivalents include cash on hand, amounts due from banks, and federal funds sold which represents short-term highly liquid investments. Net cash flows are reported for customer loan and deposit transactions, interest bearing deposits in other financial institutions, and federal funds purchased agreements. |
|
|
|
|
|
|
(l) Financial Instruments With Off-Balance Sheet Risk |
|
|
|
|
|
|
|
|
The Company’s off-balance sheet financial instruments are limited to commitments to extend credit and standby letters of credit. The Company’s policy is to record such instruments when funded. |
|
|
|
|
|
|
(m) Comprehensive Income |
|
61
|
|
|
|
|
|
|
Comprehensive income consists of net income and other comprehensive income. Other comprehensive income includes unrealized gains and losses on securities available for sale and changes in the funded status of the pension plan, which are also recognized as separate components of equity. |
|
|
|
|
|
|
(n) Loss Contingencies |
|
|
|
|
|
|
|
|
Loss contingencies, including claims and legal actions arising in the ordinary course of business, are recorded as liabilities when the likelihood of loss is probable and an amount or range of loss can be reasonably estimated. Management does not believe there now are such matters that will have a material effect on the financial statements. |
|
|
|
|
|
|
(o) Earnings Per Share |
|
|
|
|
|
|
|
|
Basic earnings per common share is net income divided by the weighted average number of common shares outstanding during the period. ESOP shares are considered outstanding for this calculation unless unearned. All outstanding unvested share-based payment awards that contain rights to nonforfeitable dividends are considered participating securities for this calculation. Diluted earnings per common share includes the dilutive effect of additional potential common shares issuable under stock options. Earnings and dividends per share are restated for all stock splits and stock dividends through the date of issuance of the financial statements. |
|
|
|
|
|
|
(p) Segment Reporting |
|
|
|
|
|
|
|
|
The Company’s operations are solely in the financial services industry providing traditional community banking services in the geographical region of Oneida County and surrounding areas in New York State. While revenue streams and costs of various products and services are monitored, operations are managed and financial performance is evaluated on a Company-wide basis. Accordingly, the Company has determined that it has no reportable business segments. |
|
|
|
|
|
|
(q) Bank Owned Life Insurance |
|
|
|
|
|
|
|
|
The Company has purchased life insurance policies on certain key officers and employees. Company owned life insurance is recorded at the amount that can be realized under the insurance contract at the balance sheet date, which is the cash surrender value adjusted for other charges or other amounts due that are probable at settlement. |
|
|
|
|
|
|
(r) Stock-based compensation |
|
|
|
|
|
|
|
|
Compensation cost is recognized for stock options and restricted stock awards issued to employees, based on the fair value of these awards at the date of grant. A Black-Scholes model is utilized to estimate the fair value of stock options, while the market price of the Company’s common stock at the date of grant is used for restricted stock awards. Compensation cost is recognized over the required service period, generally defined as the vesting period. For awards with graded vesting, compensation cost is recognized on a straight-line basis over the requisite service period for the entire award |
|
|
|
|
|
|
(s) Transfers of Financial Assets |
|
|
|
|
|
|
|
|
Transfers of financial assets are accounted for as sales, when control over the assets has been relinquished. Control over transferred assets is deemed to be surrendered when the assets have been isolated from the Company, the transferee obtains the right (free of conditions that constrain it from taking advantage of that right) to pledge or exchange the transferred assets, |
62
|
|
|
|
|
|
|
and the Company does not maintain effective control over the transferred assets through an agreement to repurchase them before their maturity. |
|
|
|
|
|
|
(t) Dividend Restriction |
|
|
|
|
|
|
|
|
Banking regulations require maintaining certain capital levels and may limit the dividends paid by the bank to the holding company or by the holding company to shareholders. |
|
|
|
|
|
|
(u) Fair Value of Financial Instruments |
|
|
|
|
|
|
|
|
Fair values of financial instruments are estimated using relevant market information and other assumptions, as more fully disclosed in a separate note. Fair value estimates involve uncertainties and matters of significant judgment regarding interest rates, credit risk, prepayments, and other factors, especially in the absence of broad markets for particular items. Changes in assumptions or in market conditions could significantly affect these estimates. |
|
|
|
|
|
|
(v) Recently Adopted Accounting Pronouncements |
|
|
|
|
|
|
|
|
In June 2009, FASB issued Accounting Standard Update (“ASU”) Number 2009-16, “Accounting for Transfers of Financial Assets – an Amendment of FASB Statement No. 140.” The new accounting requirement amends previous guidance relating to the transfers of financial assets and eliminates the concept of a qualifying special purpose entity. This statement must be applied as of the beginning of each reporting entity’s first annual reporting period that begins after November 15, 2009, for interim periods within that first annual reporting period and for interim and annual reporting periods thereafter. This statement must be applied to transfers occurring on or after the effective date. Additionally, on and after the effective date, the concept of a qualifying special-purpose entity is no longer relevant for accounting purposes. Therefore, formerly qualifying special-purpose entities should be evaluated for consolidation by reporting entities on and after the effective date in accordance with the applicable consolidation guidance. Additionally, the disclosure provisions of this statement were also amended and apply to transfers that occurred both before and after the effective date of this statement. The adoption did not have a material impact on the Company’s consolidated financial position, results of operations or cash flows. |
|
|
|
|
|
|
|
ASC Topic 810-10-65-2, “Amendments to FASB Interpretation No. 46(R),” which amended guidance for consolidation of variable interest entities by replacing the quantitative-based risks and rewards calculation for determining which enterprise, if any, has a controlling financial interest in a variable interest entity with an approach focused on identifying which enterprise has the power to direct the activities of a variable interest entity that most significantly impact the entity’s economic performance and (1) the obligation to absorb losses of the entity of (2) the right to receive benefits from the entity. This statement also requires additional disclosures about an enterprise’s involvement in variable interest entities. This statement became effective as of the beginning of each reporting entity’s first annual reporting period that begins after November 15, 2009, for interim periods within the first annual reporting period, and for interim and annual reporting periods thereafter. Early adoption is prohibited. The adoption did not have a material impact on the Company’s consolidated financial position, results of operations or cash flows. |
|
|
|
|
|
|
|
On July 21, 2010, the FASB issued ASU No 2010-20,”Disclosures about the Credit Quality of Financing Receivables and the Allowance for Credit Losses,” which requires significant new disclosures about the allowance for credit losses and the credit quality of financing receivables. The requirements are intended to enhance transparency regarding credit losses and the credit quality of loan and lease receivables. Under this statement, allowance for credit losses and fair value are to be disclosed by portfolio segment, which credit quality information, impaired financing receivables and non-accrual status are to be presented by class of financing receivable. The disclosures are to be presented at the level of disaggregation that management |
63
|
|
|
|
|
|
|
uses when assessing and monitoring the portfolio’s risk and performance. This ASU is effective for interim and annual reporting periods on or after December 15, 2010. See Note 4 to the Notes to the Financial Statements – Loans. |
|
|
|
|
|
|
|
In January 2011, FASB issued Accounting Standards Update No 2011-11, “Deferral of the Effective Date of Disclosures about Troubled Debt Restructurings in Update No. 2010-20.” The amendments in this update temporarily delay the effective date of the disclosures about troubled debt restructurings in Accounting Standards Update No. 2010-20, Receivables (Topic 310): Disclosures about the Credit Quality of Financing Receivables and the Allowance for Credit Losses,” for public entities. The delay is intended to allow the Board time to complete its deliberations on what constitutes a troubled debt restructuring. The effective date of the new disclosures about troubled debt restructurings for public entities and the guidance for determining what constitutes a troubled debt restructuring will then be coordinated. |
64
|
|
|
|
(3) |
Securities |
|
|
|
|
|
Securities are summarized as follows (dollars in thousands): |
|
|
|
|
|
|
|
|
|
|
|
|
|
|
|
|
|
|
December 31, 2010 |
|
||||||||||
|
|
|
|
|
||||||||||
|
|
|
Amortized |
|
Gross |
|
Gross |
|
Fair |
|
||||
|
|
|
|
|
|
|
|
|
|
|
||||
|
Available-for-sale: |
|
|
|
|
|
|
|
|
|
|
|
|
|
|
State and municipal obligations |
|
$ |
1,670 |
|
$ |
115 |
|
$ |
— |
|
$ |
1,785 |
|
|
Corporate bonds |
|
|
10,672 |
|
|
258 |
|
|
4 |
|
|
10,926 |
|
|
|
|
|
|
|
|
|
|
|
|
|
|
|
|
|
Total debt securities |
|
|
12,342 |
|
|
373 |
|
|
4 |
|
|
12,711 |
|
|
|
|
|
|
|
|
|
|
|
|
|
|
|
|
|
Equity and other securities |
|
|
350 |
|
|
9 |
|
|
— |
|
|
359 |
|
|
|
|
|
|
|
|
|
|
|
|
|
|
|
|
|
|
|
$ |
12,692 |
|
$ |
382 |
|
$ |
4 |
|
$ |
13,070 |
|
|
|
|
|
|
|
|
|
|
|
|
|
|
|
|
|
|
|
|
|
|
|
|
|
|
|
|
|
|
|
|
Held-to-maturity: |
|
|
|
|
|
|
|
|
|
|
|
|
|
|
U.S. Government securities |
|
$ |
1,309 |
|
$ |
43 |
|
$ |
— |
|
$ |
1,352 |
|
|
Other bonds |
|
|
107 |
|
|
— |
|
|
— |
|
|
107 |
|
|
|
|
|
|
|
|
|
|
|
|
|
|
|
|
|
|
|
|
|
|
|
|
|
|
|
|
|
|
|
|
|
|
$ |
1,416 |
|
$ |
43 |
|
$ |
— |
|
$ |
1,459 |
|
|
|
|
|
|
|
|
|
|
|
|
|
|
|
|
|
|
|
|
|
|
|
|
|
|
|
|
|
|
|
|
|
|
December 31, 2009 |
|
||||||||||
|
|
|
|
|
||||||||||
|
|
|
Amortized |
|
Gross |
|
Gross |
|
Fair |
|
||||
|
|
|
|
|
|
|
|
|
|
|
||||
|
Available-for-sale: |
|
|
|
|
|
|
|
|
|
|
|
|
|
|
State and municipal obligations |
|
$ |
2,294 |
|
$ |
119 |
|
$ |
— |
|
$ |
2,413 |
|
|
Corporate bonds |
|
|
6,597 |
|
|
85 |
|
|
39 |
|
|
6,643 |
|
|
|
|
|
|
|
|
|
|
|
|
|
|
|
|
|
Total debt securities |
|
|
8,891 |
|
|
204 |
|
|
39 |
|
|
9,056 |
|
|
|
|
|
|
|
|
|
|
|
|
|
|
|
|
|
Equity and other securities |
|
|
872 |
|
|
96 |
|
|
— |
|
|
968 |
|
|
|
|
|
|
|
|
|
|
|
|
|
|
|
|
|
|
|
$ |
9,763 |
|
$ |
300 |
|
$ |
39 |
|
$ |
10,024 |
|
|
|
|
|
|
|
|
|
|
|
|
|
|
|
|
|
Held-to-maturity: |
|
|
|
|
|
|
|
|
|
|
|
|
|
|
U.S. Government securities |
|
$ |
1,316 |
|
$ |
71 |
|
$ |
— |
|
$ |
1,387 |
|
|
Mortgage-backed securities-residential: |
|
|
|
|
|
|
|
|
|
|
|
|
|
|
GNMA |
|
|
1 |
|
|
— |
|
|
— |
|
|
1 |
|
|
Other bonds |
|
|
114 |
|
|
— |
|
|
— |
|
|
114 |
|
|
|
|
|
|
|
|
|
|
|
|
|
|
|
|
|
|
|
$ |
1,431 |
|
$ |
71 |
|
$ |
— |
|
$ |
1,502 |
|
|
|
|
|
|
|
|
|
|
|
|
|
|
|
|
|
|
|
|
|
The investment securities shown above with unrealized losses at December 31, 2010 and 2009 were in a continuous loss position for less than 12 months. |
|
|
|
|
|
As of December 31, 2010, the Company’s security portfolio consisted of 43 securities, 4 of which were in an unrealized loss position. All of unrealized losses are related to the Company’s corporate bond portfolio. These bonds are of high credit quality (rated A or higher.) The fair value is expected to recover as the bond(s) approach maturity. Because the decline in fair value is attributable to changes in interest rates and current market conditions, and not credit quality, and because the Company does not have the intent to sell these securities and it is likely that it will not be required to sell the securities before their anticipated recovery, the Company does not consider these securities to be other-than-temporarily impaired at December 31, 2010. |
65
|
|
|
|
|
Included in the Company’s equity securities is an investment in a mutual fund which purchases blue chip common stocks. The downturn in the equity markets during 2008 caused a decrease in the market value of such fund. During the fourth quarter of 2008, in connection with its ongoing review of long term asset values, the Company determined that this investment had been other than temporarily impaired, as defined by generally accepted accounting principles. Accordingly, an impairment charge of $265,000 (pre-tax) was recorded to lower the carrying value of this security to then current fair market value of $472,000. This charge reduced 2008 net earnings by $162,000, net of tax, or $0.02 per diluted share. As this investment is classified as an available for sale security, shareholders’ equity had already been reduced by the amount of the unrealized loss, net of taxes. The “other than temporary” write-down does not necessarily mean that the value has been permanently lost. During the second quarter of 2010, the Company sold the majority of its investment in this security at a gain of $119,000. At December 31, 2010, the Company’s remaining investment in this equity fund had an unrealized gain of $9,000. |
|
|
|
|
|
The following table presents the amortized cost and fair value of debt securities based on the contractual maturity date (dollars in thousands). Expected maturities will differ from contractual maturities because issuers may have the right to call or prepay obligations without call or prepayment penalties. |
|
|
|
|
|
|
|
|
|
|
|
|
December 31, 2010 |
|
||||
|
|
|
|
|
||||
|
|
|
Amortized |
|
Fair |
|
||
|
|
|
|
|
|
|
||
|
Available-for-sale: |
|
|
|
|
|
|
|
|
Due within one year |
|
$ |
1,917 |
|
$ |
1,939 |
|
|
Due after one year through five years |
|
|
8,872 |
|
|
9,161 |
|
|
Due after five years through ten years |
|
|
1,553 |
|
|
1,611 |
|
|
Due after ten years |
|
|
— |
|
|
— |
|
|
|
|
|
|
|
|
|
|
|
|
|
$ |
12,342 |
|
$ |
12,711 |
|
|
|
|
|
|
|
|
|
|
|
Held-to-maturity: |
|
|
|
|
|
|
|
|
Due within one year |
|
$ |
1,000 |
|
$ |
1,036 |
|
|
|
|||||||
|
Due after one year through five years |
|
|
309 |
|
|
316 |
|
|
Due after five years through ten years |
|
|
— |
|
|
— |
|
|
Due after ten years |
|
|
107 |
|
|
107 |
|
|
|
|
|
|
|
|
|
|
|
|
|||||||
|
|
|
$ |
1,416 |
|
$ |
1,459 |
|
|
|
|
|
|
|
|
|
|
|
|
|
|
|
Gross gains of $156,000, $73,000 and $0 were realized on sales of securities in 2010, 2009 and 2008, respectively. The proceeds from the sales of securities were $1.3 million, $1.3 million and $0 in 2010, 2009 and 2008, respectively. The tax provision related to these realized gains was $62,000, $29,000 and $0, respectively. |
|
|
|
|
|
Securities pledged at both year ends 2010 and 2009 had a carrying amount of $1.3 million. These securities collateralize state and Treasury department programs. At year end 2010 and 2009, there were no holdings of securities of any one issuer in an amount greater than 10% of shareholders’ equity. |
66
|
|
|
|
(4) |
Loans |
|
|
|
|
|
Loans are summarized as follows at December 31(dollars in thousands): |
|
|
|
|
|
|
|
|
|
|
|
|
2010 |
|
2009 |
|
||
|
|
|
|
|
|
|
||
|
Mortgage loans: |
|
|
|
|
|
|
|
|
Residential (1-4 family) |
|
$ |
141,741 |
|
$ |
155,547 |
|
|
|
|
|
|
|
|
|
|
|
Commercial |
|
|
48,510 |
|
|
52,557 |
|
|
Construction and land |
|
|
2,951 |
|
|
4,381 |
|
|
|
|
|
|
|
|
|
|
|
Total mortgage loans |
|
|
193,202 |
|
|
212,485 |
|
|
|
|
|
|
|
|
|
|
|
Other loans: |
|
|
|
|
|
|
|
|
Commercial |
|
|
29,994 |
|
|
30,429 |
|
|
Automobile loans |
|
|
7,526 |
|
|
9,377 |
|
|
Property improvement and equipment |
|
|
23,485 |
|
|
19,251 |
|
|
Other consumer |
|
|
14,220 |
|
|
16,207 |
|
|
|
|
|
|
|
|
|
|
|
Total loans |
|
|
268,427 |
|
|
287,749 |
|
|
Allowance for loan losses |
|
|
2,490 |
|
|
2,132 |
|
|
|
|
|
|
|
|
|
|
|
Net loans |
|
$ |
265,937 |
|
$ |
285,617 |
|
|
|
|
|
|
|
|
|
|
|
|
|
|
|
The Company serviced loans for third parties totaling $34,339,000 and $18,101,000 at December 31, 2010 and 2009, respectively. |
|
|
|
|
|
Changes in the allowance for loan losses are summarized as follows (dollars in thousands): |
|
|
|
|
|
|
|
|
|
|
|
|
|
|
|
Years ended December 31, |
|
|||||||
|
|
|
|
|
|||||||
|
|
|
2010 |
|
2009 |
|
2008 |
|
|||
|
|
|
|
|
|
|
|
|
|||
|
Balance at beginning of period |
|
$ |
2,132 |
|
$ |
1,936 |
|
$ |
1,910 |
|
|
Provision charged to operations |
|
|
1,796 |
|
|
300 |
|
|
300 |
|
|
Loans charged off |
|
|
(1,505 |
) |
|
(170 |
) |
|
(348 |
) |
|
Recoveries |
|
|
67 |
|
|
66 |
|
|
74 |
|
|
|
|
|
|
|
|
|
|
|
|
|
|
|
|
|
|
|
|
|
|
|
|
|
|
Balance at end of period |
|
$ |
2,490 |
|
$ |
2,132 |
|
$ |
1,936 |
|
|
|
|
|
|
|
|
|
|
|
|
|
|
|
|
|
|
The recorded investment in loans presented in the tables that follow, includes principal outstanding adjusted for net unearned loan origination fees and costs. The recorded investment does not include accrued interest receivable, as the effect is not considered to be material. |
67
|
|
|
|
|
The following table presents the balance in the allowance for loan losses and the recorded investment in loans by portfolio segment and based on impairment method as of December 31, 2010 (dollars in thousands): |
|
|
|
|
|
|
|
|
|
|
|
|
|
|
|
|
|
|
|
|
|
|
|
|
|
|
|
|
|
|
Residential |
|
Commercial |
|
Construction |
|
Commercial |
|
Auto |
|
Property |
|
Other |
|
Total |
|
||||||||
|
|
|
|
|
|
|
|
|
|
|
|
|
|
|
|
|
|
|
||||||||
|
Allowance for loan losses: |
|
|
|
|
|
|
|
|
|
|
|
|
|
|
|
|
|
|
|
|
|
|
|
|
|
|
Ending allowance balance |
|
|
|
|
|
|
|
|
|
|
|
|
|
|
|
|
|
|
|
|
|
|
|
|
|
|
Attributable to loans: |
|
|
|
|
|
|
|
|
|
|
|
|
|
|
|
|
|
|
|
|
|
|
|
|
|
|
Individually evaluated for impairment |
|
$ |
— |
|
$ |
267 |
|
$ |
— |
|
$ |
580 |
|
$ |
— |
|
$ |
— |
|
$ |
— |
|
$ |
847 |
|
|
Collectively evaluated for impairment |
|
|
251 |
|
|
246 |
|
|
2 |
|
|
679 |
|
|
63 |
|
|
191 |
|
|
211 |
|
|
1,643 |
|
|
|
|
|
|
|
|
|
|
|
|
|
|
|
|
|
|
|
|
|
|
|
|
|
|
|
|
|
Total ending allowance balance |
|
$ |
251 |
|
$ |
513 |
|
$ |
2 |
|
$ |
1,259 |
|
$ |
63 |
|
$ |
191 |
|
$ |
211 |
|
$ |
2,490 |
|
|
|
|
|
|
|
|
|
|
|
|
|
|
|
|
|
|
|
|
|
|
|
|
|
|
|
|
|
|
|
|
|
|
|
|
|
|
|
|
|
|
|
|
|
|
|
|
|
|
|
|
|
|
|
|
Loans: |
|
|
|
|
|
|
|
|
|
|
|
|
|
|
|
|
|
|
|
|
|
|
|
|
|
|
Individually evaluated for impairment |
|
$ |
— |
|
$ |
944 |
|
$ |
— |
|
$ |
2,232 |
|
$ |
— |
|
$ |
— |
|
$ |
— |
|
$ |
3,176 |
|
|
Collectively evaluated for impairment |
|
|
141,741 |
|
|
47,566 |
|
|
2,951 |
|
|
27,762 |
|
|
7,526 |
|
|
23,485 |
|
|
14,220 |
|
|
265,251 |
|
|
|
|
|
|
|
|
|
|
|
|
|
|
|
|
|
|
|
|
|
|
|
|
|
|
|
|
|
Total ending loans balance |
|
$ |
141,741 |
|
$ |
48,510 |
|
$ |
2,951 |
|
$ |
29,994 |
|
$ |
7,526 |
|
$ |
23,485 |
|
$ |
14,220 |
|
$ |
268,427 |
|
|
|
|
|
|
|
|
|
|
|
|
|
|
|
|
|
|
|
|
|
|
|
|
|
|
|
|
|
|
|
|
|
The Company has no commitments to lend additional amounts to customers with loans that are classified as troubled debt restructurings. |
68
|
|
|
|
|
Impaired loans were as follows at December 31, 2010 and 2009 (dollars in thousands): |
|
|
|
|
|
|
|
|
|
|
|
|
2010 |
|
2009 |
|
||
|
|
|
|
|
|
|
|
|
|
|
|||||||
|
Year end loans – with no allocated allowance for loan losses |
|
$ |
— |
|
$ |
165 |
|
|
Year end loans – with allocated allowance for loan losses |
|
|
3,176 |
|
|
533 |
|
|
|
|
|
|
|
|
|
|
|
Amount of the allowance for loan losses allocated |
|
|
847 |
|
|
242 |
|
|
|
|
|
|
|
|
|
|
|
Net investment in impaired loans |
|
$ |
2,329 |
|
$ |
456 |
|
|
|
|
|
|
|
|
|
|
Following is information related to impaired loans for the three years ended December 31, 2010 (dollars in thousands):
|
|
|
|
|
|
|
|
|
|
|
|
|
|
|
2010 |
|
2009 |
|
2008 |
|
|||
|
|
|
|
|
|
|
|
|
|||
|
|
|
|
|
|
|
|
|
|
|
|
|
Average of individually impaired loans during year |
|
$ |
2,356 |
|
$ |
704 |
|
$ |
904 |
|
|
Interest income recognized during impairment |
|
|
63 |
|
|
— |
|
|
— |
|
|
Cash-basis interest income recognized |
|
|
63 |
|
|
— |
|
|
— |
|
The following table presents loans individually evaluated for impairment by class of loans as of December, 31, 2010. All evaluated loans had related loan loss allowances (dollars in thousands):
|
|
|
|
|
|
|
|
|
|
|
|
|
|
|
Unpaid |
|
Recorded |
|
Allowance
for |
|
|||
|
|
|
|
|
|
|
|
|
|||
|
Commercial Real Estate |
|
$ |
944 |
|
$ |
944 |
|
$ |
267 |
|
|
Commercial Loans |
|
|
2,232 |
|
|
2,232 |
|
|
580 |
|
|
|
|
|
|
|
|
|
|
|
|
|
|
Total |
|
$ |
3,176 |
|
$ |
3,176 |
|
$ |
847 |
|
|
|
|
|
|
|
|
|
|
|
|
|
The principal balances of loans not accruing interest amounted to $2.2 million and $1.9 million at December 31, 2010 and 2009, respectively. Loans 90 days or more past due and accruing interest amounted to $847,000 and $43,000 at December 31, 2010 and 2009, respectively. The balance of impaired loans is higher than loans in non-accrual status at December 31, 2010 because a commercial credit that has been identified as impaired due to a decline in collateral value continues to perform in accordance with the terms of the loan. The differences between the amount of interest income that would have been recorded if non-accrual loans had been paid in accordance with their original terms and the amount of interest income that was recorded during the years ended December 31, 2010, 2009 and 2008 was $33,800, $65,300 and $85,800, respectively. There are no commitments to extend further credit on non-accruing loans. Nonaccrual loans and loans past 90 days still on accrual include both smaller balance homogenous loans that are collectively evaluated for impairment and individually classified impaired loans.
69
The following table presents the recorded investment in nonaccrual and loans past due over 90 days still on accrual by class of loans as of December 31, 2010 (dollars in thousands):
|
|
|
|
|
|
|
|
|
|
|
|
Nonaccrual |
|
Loans
Past Due |
|
||
|
|
|
|
|
|
|
||
|
|
|||||||
|
Residential Mortgages |
|
$ |
609 |
|
$ |
837 |
|
|
Commercial Mortgages |
|
|
981 |
|
|
— |
|
|
Construction and Land Loans |
|
|
— |
|
|
— |
|
|
Commercial Loans |
|
|
311 |
|
|
— |
|
|
Auto Loans |
|
|
42 |
|
|
— |
|
|
Property Improvement Loans |
|
|
232 |
|
|
10 |
|
|
Other Consumer Loans |
|
|
17 |
|
|
— |
|
|
|
|
|
|
|
|
|
|
|
Total |
|
$ |
2,192 |
|
$ |
847 |
|
|
|
|
|
|
|
|
|
|
|
|
|
|
|
The following table presents the aging of the recorded investment in past due loans, including nonaccrual loans, as of December 31, 2010 by class of loans (dollars in thousands): |
|
|
|
|
|
|
|
|
|
|
|
|
|
|
|
|
|
|
|
|
|
30-59 |
|
60-89 |
|
Greater |
|
Total |
|
Loans |
|
|||||
|
|
|
|
|
|
|
|
|
|
|
|
|
|||||
|
|
||||||||||||||||
|
Residential Mortgages |
|
$ |
826 |
|
$ |
449 |
|
$ |
1,446 |
|
$ |
2,721 |
|
$ |
139,020 |
|
|
Commercial Mortgages |
|
|
— |
|
|
227 |
|
|
981 |
|
|
1,208 |
|
|
47,302 |
|
|
Construction and Land Loans |
|
|
— |
|
|
— |
|
|
— |
|
|
— |
|
|
2,951 |
|
|
Commercial Loans |
|
|
221 |
|
|
137 |
|
|
311 |
|
|
669 |
|
|
29,325 |
|
|
Auto Loans |
|
|
109 |
|
|
62 |
|
|
42 |
|
|
213 |
|
|
7,313 |
|
|
Property Improvement Loans |
|
|
— |
|
|
30 |
|
|
242 |
|
|
272 |
|
|
23,213 |
|
|
Other Consumer Loans |
|
|
245 |
|
|
25 |
|
|
17 |
|
|
287 |
|
|
13,933 |
|
|
|
|
|
|
|
|
|
|
|
|
|
|
|
|
|
|
|
|
Total |
|
$ |
1,401 |
|
$ |
930 |
|
$ |
3,039 |
|
$ |
5,370 |
|
$ |
263,057 |
|
|
|
|
|
|
|
|
|
|
|
|
|
|
|
|
|
|
|
The Company categorizes loans into risk categories based on relevant information about the ability of borrowers to service their debt such as: current financial information, historical payment experience, credit documentation, public information, and current economic trends, among other factors. The Company analyzes loans individually by classifying the loans as to credit risk. This analysis includes loans with an outstanding balance greater than $400,000 and non-homogeneous loans, such as commercial and commercial real estate loans. This analysis is performed on an annual basis. The Company uses the following definitions for risk ratings:
|
|
|
|
|
Special Mention. Loans classified as special mention are generally protected but have one or more potential weaknesses that deserves management’s close attention. If left uncorrected, these potential weaknesses may result in deterioration of the repayment prospects for the loan or of the institution’s credit position at some future date. |
|
|
|
|
|
Substandard. Loans classified as substandard are inadequately protected by the current net worth and paying capacity of the obligor or of the collateral pledged, if any. Loans so classified have a well-defined weakness or weaknesses that jeopardize the liquidation of the debt. They are characterized by the distinct possibility that the institution will sustain some loss if the deficiencies are not corrected. |
|
|
|
|
|
Doubtful. Loans classified as doubtful have all the weaknesses inherent in those classified as substandard, with the added characteristic that the weaknesses make collection or liquidation in full, on the basis of currently existing facts, conditions, and values, highly questionable and improbable. |
Loans not meeting the criteria above that are analyzed individually as part of the above described process are
70
considered to be pass rated loans. Loans listed as not rated are either less than $400,000 or are included in groups of homogeneous loans. As of December 31, 2010, and based on the most recent analysis performed, the risk category of loans by class of loans is as follows (dollars in thousands:
|
|
|
|
|
|
|
|
|
|
|
|
|
|
|
|
|
|
|
|
|
|
|
|
Not |
|
Pass |
|
Special |
|
Sub- |
|
Doubtful |
|
Total |
|
||||||
|
|
|
|
|
|
|
|
|
|
|
|
|
|
|
||||||
|
Residential Mortgages |
|
$ |
139,609 |
|
$ |
686 |
|
$ |
— |
|
$ |
1,446 |
|
$ |
— |
|
$ |
141,741 |
|
|
Commercial Mortgages |
|
|
10,027 |
|
|
34,634 |
|
|
227 |
|
|
3,622 |
|
|
— |
|
|
48,510 |
|
|
Construction Loans |
|
|
2,951 |
|
|
— |
|
|
— |
|
|
— |
|
|
— |
|
|
2,951 |
|
|
Commercial Loans |
|
|
11,043 |
|
|
13,572 |
|
|
2,084 |
|
|
3,276 |
|
|
19 |
|
|
29,994 |
|
|
Consumer Loans |
|
|
43,831 |
|
|
1,400 |
|
|
|
|
|
— |
|
|
— |
|
|
45,231 |
|
|
|
|
|
|
|
|
|
|
|
|
|
|
|
|
|
|
|
|
|
|
|
Total Loans |
|
$ |
207,461 |
|
$ |
50,292 |
|
$ |
2,311 |
|
$ |
8,344 |
|
$ |
19 |
|
$ |
268,427 |
|
|
|
|
|
|
|
|
|
|
|
|
|
|
|
|
|
|
|
|
|
|
|
|
|
|
|
A substantial portion of the Company’s loans are mortgage and consumer loans in Oneida County. Accordingly, the ultimate collectibility of a substantial portion of the Company’s loan portfolio is susceptible to changes in market conditions in this area. A majority of the Company’s loan portfolio is secured by real estate. Other than general economic risks, management is not aware of any material concentrations of credit risk to any industry or individual borrower. The Company does not originate sub-prime mortgage loans and has not purchased investments collateralized by sub-prime loans. |
|
|
|
|
(5) |
Premises and Equipment |
|
|
|
|
|
Premises and equipment at December 31 are summarized as follows (dollars in thousands): |
|
|
|
|
|
|
|
|
|
|
|
|
2010 |
|
2009 |
|
||
|
|
|
|
|
|
|
|
|
|
|
|||||||
|
Land |
|
$ |
2,627 |
|
$ |
2,638 |
|
|
Buildings and improvements |
|
|
6,407 |
|
|
6,374 |
|
|
Furniture and equipment |
|
|
8,356 |
|
|
8,186 |
|
|
|
|
|
|
|
|
|
|
|
|
|
|
17,390 |
|
|
17,198 |
|
|
Less accumulated depreciation and amortization |
|
|
11,576 |
|
|
11,157 |
|
|
|
|
|
|
|
|
|
|
|
|
|||||||
|
|
|
$ |
5,814 |
|
$ |
6,041 |
|
|
|
|
|
|
|
|
|
|
|
|
|
|
|
Depreciation and amortization expense included in building, occupancy and equipment expense amounted to $478,000, $513,000 and $563,000 during the years ended December 31, 2010, 2009 and 2008, respectively. |
71
|
|
|
|
(6) |
Deposits |
|
|
|
|
|
Contractual maturities of time deposits at December 31 are summarized as follows (dollars in thousands): |
|
|
|
|
|
|
|
|
|
2010 |
|
|
|
|
|
|
|
|
|
|
||||
|
Within one year |
|
$ |
48,834 |
|
|
One through two years |
|
|
11,178 |
|
|
Two through three years |
|
|
2,591 |
|
|
Three through four years |
|
|
3,565 |
|
|
Four through five years |
|
|
3,036 |
|
|
|
|
|
|
|
|
Total time deposits |
|
$ |
69,204 |
|
|
|
|
|
|
|
|
|
|
|
|
At December 31, 2010 and 2009, time deposits with balances of $100,000 or more totaled approximately $17,030,000 and $16,485,000, respectively. |
|
|
|
|
|
Interest expense on deposits for the years ended December 31 is summarized as follows (dollars in thousands): |
|
|
|
|
|
|
|
|
|
|
|
|
|
|
|
2010 |
|
2009 |
|
2008 |
|
|||
|
|
|
|
|
|
|
|
|
|||
|
|
|
|
|
|
|
|
|
|
|
|
|
Savings |
|
$ |
339 |
|
$ |
330 |
|
$ |
446 |
|
|
Money market |
|
|
176 |
|
|
189 |
|
|
193 |
|
|
Time |
|
|
1,252 |
|
|
1,852 |
|
|
2,634 |
|
|
Other interest bearing |
|
|
59 |
|
|
55 |
|
|
69 |
|
|
|
|
|
|
|
|
|
|
|
|
|
|
|
|
$ |
1,826 |
|
$ |
2,426 |
|
$ |
3,342 |
|
|
|
|
|
|
|
|
|
|
|
|
|
|
|
|
|
(7) |
Federal Home Loan Bank Advances |
|
|
|
|
|
The Company is a member of the Federal Home Loan Bank of New York (FHLB-NY). As a member, the Company is required to own capital stock in the FHLB-NY and is authorized to apply for advances from the FHLB-NY. Each advance is payable at its maturity date with a prepayment penalty for fixed rate advances. The Company has a blanket pledge on $98.8 million of their one-to-four family mortgage loans as collateral for these borrowings. The following is a summary of advances and amortizing notes from the FHLB-NY at December 31 (dollars in thousands): |
|
|
|
|
|
|
|
|
|
|
|
|
2010 |
|
2009 |
|
||
|
|
|
|
|
|
|
||
|
|
|
|
|
|
|
|
|
|
Overnight line of credit |
|
$ |
— |
|
$ |
1,100 |
|
|
Fixed rate advances |
|
|
35,661 |
|
|
46,769 |
|
|
|
|
|
|
|
|
|
|
|
Total borrowings |
|
$ |
35,661 |
|
$ |
47,869 |
|
|
|
|
|
|
|
|
|
|
72
|
|
|
|
|
Advances at December 31, 2010 have maturity dates as follows (dollars in thousands): |
|
|
|
|
|
|
|
|
|
|
|
|
|
|
|
Range of Rates |
|
Average Rate |
|
Balance |
|
|||
|
|
|
|
|
|
|
|
|
|||
|
|
||||||||||
|
2011 |
|
1.27% - 3.91 |
% |
|
3.20 |
% |
|
$ |
11,267 |
|
|
2012 |
|
1.31% - 2.75 |
% |
|
2.68 |
% |
|
|
9,132 |
|
|
2013 |
|
1.84% - 3.36 |
% |
|
3.10 |
% |
|
|
4,712 |
|
|
2014 |
|
2.45% - 3.64 |
% |
|
3.27 |
% |
|
|
3,931 |
|
|
2015 |
|
2.07% - 4.24 |
% |
|
3.35 |
% |
|
|
3,619 |
|
|
Due after 2015 |
|
4.29% - 4.36 |
% |
|
4.34 |
% |
|
|
3,000 |
|
|
|
|
|
|
|
|
|
|
|
|
|
|
Total |
|
|
|
|
|
|
|
$ |
35,661 |
|
|
|
|
|
|
|
|
|
|
|
|
|
|
|
|
|
|
At December 31, 2010, the Company had additional availability on its FHLB line of credit of $61.2 million. This line of credit is subject to periodic review and renewal. At December 31, 2010, the Company also had approximately $8.3 million in unused short term borrowing capacity at the Federal Reserve Bank of New York, which is collateralized by a portion of the consumer loan portfolio. |
|
|
|
|
(8) |
Income Taxes |
|
|
|
|
|
The components of income tax expense (benefit) attributable to income from operations for the years ended December 31 consist of (in thousands): |
|
|
|
|
|
|
|
|
|
|
|
|
|
|
|
2010 |
|
2009 |
|
2008 |
|
|||
|
|
|
|
|
|
|
|
|
|||
|
Current: |
|
|
|
|
|
|
|
|
|
|
|
Federal |
|
$ |
1,112 |
|
$ |
1,513 |
|
$ |
1,143 |
|
|
State |
|
|
133 |
|
|
81 |
|
|
127 |
|
|
|
|
|
|
|
|
|
|
|
|
|
|
|
|
|
1,245 |
|
|
1,594 |
|
|
1,270 |
|
|
|
|
|
|
|
|
|
|
|
|
|
|
Deferred: |
|
|
|
|
|
|
|
|
|
|
|
Federal |
|
|
12 |
|
|
(130 |
) |
|
172 |
|
|
State |
|
|
(155 |
) |
|
23 |
|
|
(46 |
) |
|
|
|
|
|
|
|
|
|
|
|
|
|
|
|
|
(143 |
) |
|
(107 |
) |
|
126 |
|
|
|
|
|
|
|
|
|
|
|
|
|
|
|
|
|
|
|
|
|
|
|
|
|
|
Total income tax expense |
|
$ |
1,102 |
|
$ |
1,487 |
|
$ |
1,396 |
|
|
|
|
|
|
|
|
|
|
|
|
|
73
|
|
|
|
|
Actual tax expense differs from “expected” tax expense, computed by applying the U.S. Federal statutory tax rate of 34% to income before income taxes for the years ended December 31, as follows (dollars in thousands): |
|
|
|
|
|
|
|
|
|
|
|
|
|
|
|
2010 |
|
2009 |
|
2008 |
|
|||
|
|
|
|
|
|
|
|
|
|||
|
Computed “expected” tax expense |
|
$ |
1,143 |
|
$ |
1,555 |
|
$ |
1,462 |
|
|
Increases (decreases) in income taxes resulting from: |
|
|
|
|
|
|
|
|
|
|
|
State taxes, net of Federal tax benefit |
|
|
(14 |
) |
|
69 |
|
|
54 |
|
|
Tax exempt interest, net |
|
|
(6 |
) |
|
(11 |
) |
|
(19 |
) |
|
Tax exempt increase in cash surrender value of life insurance |
|
|
(135 |
) |
|
(139 |
) |
|
(139 |
) |
|
Non-deductible ESOP expense |
|
|
24 |
|
|
16 |
|
|
57 |
|
|
Non-deductible transaction costs |
|
|
92 |
|
|
— |
|
|
— |
|
|
Other, net |
|
|
(2 |
) |
|
(3 |
) |
|
(19 |
) |
|
|
|
|
|
|
|
|
|
|||
|
|
||||||||||
|
|
|
$ |
1,102 |
|
$ |
1,487 |
|
$ |
1,396 |
|
|
|
|
|
|
|
|
|
|
|||
|
Effective tax rate |
|
|
32.7 |
% |
|
32.5 |
% |
|
32.5 |
% |
|
|
|
|
|
|
|
|
|
|||
|
|
|
|
|
The tax effects of temporary differences that give rise to significant portions of the deferred tax assets and deferred tax liabilities for December 31 are (dollars in thousands): |
|
|
|
|
|
|
|
|
|
|
|
|
2010 |
|
2009 |
|
||
|
|
|
|
|
|
|
|
|
|
Deferred tax assets: |
|
|
|
|
|
|
|
|
Allowance for loan losses |
|
$ |
963 |
|
$ |
758 |
|
|
Accrued postretirement benefits |
|
|
1,080 |
|
|
922 |
|
|
Deferred compensation |
|
|
674 |
|
|
639 |
|
|
Stock-based compensation and benefits |
|
|
412 |
|
|
488 |
|
|
Unrealized loss on investments due to other than temporary impairment charge |
|
|
2 |
|
|
100 |
|
|
Accrued pension cost |
|
|
366 |
|
|
329 |
|
|
Nonaccrual interest |
|
|
63 |
|
|
53 |
|
|
Other |
|
|
48 |
|
|
9 |
|
|
|
|
|
|
|
|
|
|
|
Total gross deferred tax assets |
|
|
3,608 |
|
|
3,298 |
|
|
|
|
|
|
|
|
|
|
|
|
|
|
|
|
|
|
|
|
Deferred tax liabilities: |
|
|
|
|
|
|
|
|
Depreciation |
|
|
(215 |
) |
|
(217 |
) |
|
Undistributed income of subsidiary |
|
|
(67 |
) |
|
— |
|
|
Unrealized gains on available-for-sale securities |
|
|
(151 |
) |
|
(104 |
) |
|
Deferred loan costs |
|
|
(86 |
) |
|
(113 |
) |
|
Mortgage servicing rights |
|
|
(105 |
) |
|
(49 |
) |
|
Other |
|
|
(1 |
) |
|
(8 |
) |
|
|
|
|
|
|
|
|
|
|
Total gross deferred tax liabilities |
|
|
(625 |
) |
|
(491 |
) |
|
|
|
|
|
|
|
|
|
|
Net deferred tax assets |
|
$ |
2,983 |
|
$ |
2,807 |
|
|
|
|
|
|
|
|
|
|
74
|
|
|
|
|
Realization of deferred tax assets is dependent upon the generation of future taxable income or the existence of sufficient taxable income within the carryback period. A valuation allowance is provided when it is more likely than not that some portion of the deferred tax assets will not be realized. In assessing the need for a valuation allowance, management considers the scheduled reversal of the deferred tax liabilities, the level of historical taxable income and projected future taxable income over the periods in which the temporary differences comprising the deferred tax assets will be deductible. Management believes that no valuation allowance is necessary. |
|
|
|
|
|
In accordance with ASC 740, the Company has not recognized deferred tax liabilities with respect to Rome Savings’ Federal and state base-year reserves of approximately $3.4 million at December 31, 2010, since the Company does not expect that these amounts will become taxable in the foreseeable future. Under the tax laws, as amended, events that would result in taxation of these reserves include redemptions of Rome Savings’ stock or certain excess distributions to Rome Bancorp, Inc. The unrecognized deferred tax liability at December 31, 2010 with respect to the base-year reserve was approximately $1.3 million. |
|
|
|
|
|
At December 31, 2010 and 2009, the Company had approximately $52,000 and $27,000, respectively, of unrecognized tax benefits and interest. As of December 31, 2010 and 2009, $52,000 and $27,000, respectively, of these tax benefits would affect the effective tax rate if recognized. As of December 31, 2010 and 2009, accrued interest related to uncertain tax positions was $4,000 and $3,000, respectively, net of the related federal tax benefit. The Company accounts for interest and penalties related to uncertain tax positions as part of its provision for federal and state income taxes. |
|
|
|
|
|
The Company is subject to U.S. federal income tax as well as New York state income tax. The Company is no longer subject to federal examination for years prior to 2007 and for New York State examination for years prior to 2006. The Company’s 2006-2008 tax years are currently under New York State examination. Management anticipates no material impact to the Company’s financial position as a result of this examination. |
|
|
|
|
|
Unrecognized Tax Benefits |
|
|
|
|
|
A reconciliation of the beginning and ending amount of unrecognized tax benefits (excluding interest and the federal income tax benefit of unrecognized state tax benefits) is as follows (in thousands): |
|
|
|
|
|
|
|
|
|
|
|
|
|
|
|
|
2010 |
|
|
2009 |
|
|
2008 |
|
|
|
|
|
|
|
|
|
|
|||
|
Balance at January 1 |
|
$ |
34 |
|
$ |
24 |
|
$ |
64 |
|
|
Additions based on tax positions related to the current year |
|
|
31 |
|
|
3 |
|
|
3 |
|
|
Additions based on tax positions of prior years |
|
|
5 |
|
|
7 |
|
|
21 |
|
|
Reductions for tax positions of prior years |
|
|
(9 |
) |
|
— |
|
|
— |
|
|
Reductions due to statute of limitations |
|
|
(2 |
) |
|
— |
|
|
— |
|
|
Settlements |
|
|
— |
|
|
— |
|
|
(64 |
) |
|
|
|
|
|
|
|
|
|
|
|
|
|
Balance at December 31 |
|
$ |
59 |
|
$ |
34 |
|
$ |
24 |
|
|
|
|
|
|
|
|
|
|
|
|
|
|
|
|
|
(9) |
Pension and Postretirement Benefits |
|
|
|
|
|
The Company maintains a non-contributory defined benefit pension plan that covers approximately 50% of all current full time employees. The Company’s Board of Directors amended the plan in December of 2002 to cease the accrual of any further benefits. In addition, the Company provides health care and life insurance benefits to certain retired full time employees. |
|
|
|
|
|
The following table sets forth the changes in the Company’s pension and postretirement plans’ accumulated benefit obligations, fair value of assets and funded status and amounts recognized in the consolidated balance sheets at December 31, 2010 and 2009(dollars in thousands): |
75
|
|
|
|
|
|
|
|
|
|
|
|
|
|
|
|
|
|
Pension benefits |
|
Postretirement benefits |
|
||||||||
|
|
|
|
|
|
|
||||||||
|
|
|||||||||||||
|
|
|
2010 |
|
2009 |
|
2010 |
|
2009 |
|
||||
|
|
|
|
|
|
|
|
|
|
|
||||
|
Change in benefit obligation: |
|
|
|
|
|
|
|
|
|
|
|
|
|
|
Benefit obligation at beginning of year |
|
$ |
6,043 |
|
$ |
5,951 |
|
$ |
2,363 |
|
$ |
2,564 |
|
|
Service cost |
|
|
— |
|
|
— |
|
|
17 |
|
|
19 |
|
|
Interest cost |
|
|
351 |
|
|
346 |
|
|
138 |
|
|
149 |
|
|
Amendments and settlements |
|
|
(95 |
) |
|
(112 |
) |
|
— |
|
|
— |
|
|
Actuarial(gain)/ loss |
|
|
273 |
|
|
204 |
|
|
292 |
|
|
(315 |
) |
|
Benefits paid |
|
|
(340 |
) |
|
(346 |
) |
|
(105 |
) |
|
(97 |
) |
|
Participant contributions |
|
|
— |
|
|
— |
|
|
47 |
|
|
43 |
|
|
|
|
|
|
|
|
|
|
|
|
|
|
|
|
|
Benefit obligation at end of year |
|
|
6,232 |
|
|
6,043 |
|
|
2,752 |
|
|
2,363 |
|
|
|
|
|
|
|
|
|
|
|
|
|
|
|
|
|
Change in plan assets: |
|
|
|
|
|
|
|
|
|
|
|
|
|
|
Fair value of plan assets at beginning of year |
|
|
5,306 |
|
|
4,971 |
|
|
— |
|
|
— |
|
|
|
|||||||||||||
|
Actual return on plan assets |
|
|
522 |
|
|
793 |
|
|
— |
|
|
— |
|
|
|
|||||||||||||
|
Employer contributions |
|
|
— |
|
|
— |
|
|
58 |
|
|
54 |
|
|
Settlements |
|
|
(95 |
) |
|
(112 |
) |
|
— |
|
|
— |
|
|
Participant contributions |
|
|
— |
|
|
— |
|
|
47 |
|
|
43 |
|
|
Benefits paid |
|
|
(340 |
) |
|
(346 |
) |
|
(105 |
) |
|
(97 |
) |
|
|
|
|
|
|
|
|
|
|
|
|
|
|
|
|
Fair value of plan assets at end of year |
|
|
5,393 |
|
|
5,306 |
|
|
— |
|
|
— |
|
|
|
|
|
|
|
|
|
|
|
|
|
|
|
|
|
|
|
|
|
|
|
|
|
|
|
|
|
|
|
|
Funded status at end of year (plan assets less benefit obligations) |
|
$ |
(839 |
) |
$ |
(737 |
) |
$ |
(2,752 |
) |
$ |
(2,363 |
) |
|
|
|
|
|
|
|
|
|
|
|
|
|
|
|
|
|
|
|
|
|
|
|
|
|
|
|
|
|
|
|
Assumptions as of measurement dates - December 31, 2010 and 2009: |
|
|
|
|
|
|
|
|
|
|
|
|
|
|
Discount rate |
|
|
5.50 |
% |
|
6.00 |
% |
|
5.50 |
% |
|
6.00 |
% |
|
Expected return on plan assets |
|
|
9.00 |
% |
|
9.00 |
% |
|
— |
|
|
— |
|
|
|
|||||||||||||
|
Rate of compensation increase |
|
|
N/A |
|
|
N/A |
|
|
— |
|
|
— |
|
Amounts recognized in accumulated other comprehensive income (net of tax) at December 31 consist of (dollars in thousands):
|
|
|
|
|
|
|
|
|
|
|
|
|
|
|
|
|
|
Pension benefits |
|
Postretirement benefits |
|
||||||||
|
|
|
|
|
|
|
||||||||
|
|
|||||||||||||
|
|
|
2010 |
|
2009 |
|
2010 |
|
2009 |
|
||||
|
|
|
|
|
|
|
|
|
|
|
||||
|
Net actuarial gain (loss) |
|
$ |
(1,918 |
) |
$ |
(1,988 |
) |
$ |
58 |
|
$ |
240 |
|
|
Prior service credit (cost) |
|
|
— |
|
|
— |
|
|
12 |
|
|
17 |
|
|
|
|
|
|
|
|
|
|
|
|
|
|
|
|
|
Total |
|
$ |
(1,918 |
) |
$ |
(1,988 |
) |
$ |
70 |
|
$ |
257 |
|
|
|
|
|
|
|
|
|
|
|
|
|
|
|
|
|
|
|
|
|
The estimated net unrecognized loss and prior service credit that will be amortized from other comprehensive loss into net periodic benefit cost over the next fiscal year are $(317,000) and $7,000, respectively. |
|
|
|
|
|
The long term rate of return on plan assets assumption was set based on historical returns earned by equities and fixed income securities, adjusted to reflect expectations of future returns as applied to the plan’s target allocation of asset classes. Equities and fixed income securities were assumed to earn real rates of return in the ranges of 5-9% and 2-6%, respectively. The long term inflation rate was estimated to be 3%. When |
76
|
|
|
|
|
these overall return expectations are applied to the plan’s target allocation, the expected rate of return is determined to be 9%, which is roughly the midpoint of the range of expected return. |
|
|
|
|
|
The Company’s pension plan weighted average allocations at December 31, 2010 and 2009, by asset category are summarized in the following table: |
|
|
|
|
|
|
|
|
|
|
|
|
Plan assets at December 31, |
|
||||
|
|
|
|
|
||||
|
Asset Category |
|
2010 |
|
2009 |
|
||
|
|
|
|
|
|
|
||
|
Equity Securities |
|
|
65 |
% |
|
63 |
% |
|
Debt Securities |
|
|
35 |
% |
|
37 |
% |
|
|
|
|
|
|
|
|
|
|
Total |
|
|
100 |
% |
|
100 |
% |
|
|
|
|
|
|
|
|
|
|
|
|
|
|
The Company’s long-term investment objective is to be invested 65% in equity securities and 35% in debt securities. Plan assets are invested in diversified investment funds of the RSI Retirement Trust (the “Trust”), a private placement investment fund. The investment funds include a series of equity and bond mutual funds or commingled trust funds, each with its own investment objectives, investment strategies and risks, as detailed in the statement of Investment Objectives and Guidelines. The Trust has been given discretion by the Plan Sponsor to determine the appropriate strategic asset allocation versus plan liabilities as governed by the Trust’s Statement of Investment Objectives and Guidelines (the “Guidelines”). The Trust is prohibited from investing in securities of investment companies. If the plan is underfunded under the Guidelines, the bond fund will be temporarily increased to 50% in order to lessen asset volatility. When the plan is no longer underfunded, the bond fund portion will be decreased back to 35%. Asset rebalancing is performed at least annually, with interim adjustments made when the equity and fixed income allocations vary by more than 10% from their respective targets (i.e., a 20% policy range guideline). |
|
|
|
|
|
The long-term investment objectives are to maintain plan assets at a level that will sufficiently cover long-term obligations and to generate a return on plan assets that will meet or exceed the rate at which long-term obligations will grow. The investment goal is to achieve investment results that will contribute o the proper funding of the pension plan by exceeding the rate of inflation over the long-term. In addition, investment managers for the Trust are expected to provide above average performance when compared to their peer managers. Performance volatility is also monitored. Risk/volatility is further managed by the distinct investment objectives of each of the Trust funds and the diversification within each fund. |
|
|
|
|
|
Fair Value of Plan Assets: |
|
|
Fair value is the exchange price that would be received for an asset in the principal or most advantageous market for the asset in an orderly transaction between market participants on the measurement date. There are three levels of inputs that may be used to measure fair value. Entities are required to maximize the use of observable inputs and minimize the use of unobservable inputs when measuring fair value. |
|
|
|
|
|
The Company used the following methods and significant assumptions to estimate the fair value of the investments held as plan assets. The fair values for investment securities are determined by quoted market prices, if available (Level 1). For securities where quoted prices are not available, fair values are calculated based on market prices of similar securities (Level 2). For securities where quoted prices or market prices of similar securities are not available, fair values are calculated using discounted cash flows or other market indicators (Level 3). The Plan assets include no investments that are classified as Level 3 for basis of fair market valuation. |
77
|
|
|
|
|
The fair value of plan assets at December 31, 2010, by asset category, is as follows (dollars in thousands): |
|
|
|
|
|
|
|
|
|
|
|
|
|
|
|
|
|
Fair Value Measurements at |
|
|||||
|
Plan Assets: |
|
Carrying |
|
Quoted Prices |
|
Significant |
|
|||
|
|
|
|
|
|
|
|
|
|||
|
Equity Mutual Funds: |
|
|
|
|
|
|
|
$ |
— |
|
|
|
|
|
|
|
|
|
|
|||
|
Large-Cap Funds |
|
$ |
487 |
|
|
487 |
|
|
— |
|
|
|
|
|
|
|
|
|
|
|||
|
Small-Cap Funds |
|
|
646 |
|
|
646 |
|
|
— |
|
|
Equity Trusts: |
|
|
|
|
|
|
|
|
|
|
|
Large-Cap |
|
|
1,631 |
|
|
— |
|
|
1,631 |
|
|
International |
|
|
741 |
|
|
— |
|
|
741 |
|
|
Fixed Income Trusts |
|
|
1,888 |
|
|
— |
|
|
1,888 |
|
|
|
|
|
|
|
|
|
|
|
|
|
|
Total |
|
$ |
5,393 |
|
$ |
1,133 |
|
$ |
4,260 |
|
|
|
|
|
|
|
|
|
|
|
|
|
|
|
|
|
|
For the fiscal year ended December 31, 2011, the Company expects to make the minimum required contribution of $5,000 to the pension plan. The following estimated future benefit payments, which reflect expected future service, as appropriate, are expected to be paid (dollars in thousands): |
|
|
|
|
|
|
|
|
|
|
|
|
|
|
Asset Category |
|
Pension Benefits |
|
Postretirement Benefits |
|
||||||
|
|
|
|
|
|
|
||||||
|
Fiscal 2011 |
|
|
$ |
365 |
|
|
|
$ |
141 |
|
|
|
Fiscal 2012 |
|
|
|
383 |
|
|
|
|
144 |
|
|
|
Fiscal 2013 |
|
|
|
409 |
|
|
|
|
152 |
|
|
|
Fiscal 2014 |
|
|
|
419 |
|
|
|
|
155 |
|
|
|
Fiscal 2015 |
|
|
|
434 |
|
|
|
|
155 |
|
|
|
Fiscal 2016-2020 |
|
|
|
2,288 |
|
|
|
|
816 |
|
|
|
|
|
|
|
|
|
|
|
|
|
|
|
|
|
|
|
|
The components of net periodic benefit cost and other amounts recognized in other comprehensive income include the following (dollars in thousands): |
|
|
|
|
|
|
|
|
|
|
|
|
|
|
|
|
|
|
|
|
|
|
|
|
Pension benefits |
|
Postretirement benefits |
|
||||||||||||||
|
|
|
|
|
|
|
||||||||||||||
|
|
|
2010 |
|
2009 |
|
2008 |
|
2010 |
|
2009 |
|
2008 |
|
||||||
|
|
|
|
|
|
|
|
|
|
|
|
|
|
|
||||||
|
Service cost |
|
$ |
— |
|
$ |
— |
|
$ |
— |
|
$ |
17 |
|
$ |
19 |
|
$ |
21 |
|
|
Interest cost |
|
|
351 |
|
|
346 |
|
|
353 |
|
|
138 |
|
|
149 |
|
|
147 |
|
|
Expected return on assets |
|
|
(460 |
) |
|
(431 |
) |
|
(673 |
) |
|
— |
|
|
— |
|
|
— |
|
|
Settlement charge |
|
|
— |
|
|
— |
|
|
134 |
|
|
— |
|
|
— |
|
|
— |
|
|
Amortization |
|
|
325 |
|
|
383 |
|
|
— |
|
|
(19 |
) |
|
(8 |
) |
|
(8 |
) |
|
|
|
|
|
|
|
|
|
|
|
|
|
|
|
|
|
|
|
|
|
|
|
|
|
|
|
|
|
|
|
|
|
|
|
|
|
|
|
|
|
|
|
Net periodic cost (benefit) |
|
|
216 |
|
|
298 |
|
|
(186 |
) |
|
136 |
|
|
160 |
|
|
160 |
|
|
|
|
|
|
|
|
|
|
|
|
|
|
|
|
|
|
|
|
|
|
|
Net (gain) loss |
|
|
211 |
|
|
(157 |
) |
|
3,280 |
|
|
292 |
|
|
(315 |
) |
|
(30 |
) |
|
Recognition of loss |
|
|
— |
|
|
— |
|
|
(134 |
) |
|
|
|
|
— |
|
|
— |
|
|
Amortization of prior service cost |
|
|
(325 |
) |
|
(383 |
) |
|
— |
|
|
19 |
|
|
8 |
|
|
8 |
|
|
|
|
|
|
|
|
|
|
|
|
|
|
|
|
|
|
|
|
|
|
|
Total recognized in other comprehensive income |
|
|
(114 |
) |
|
(540 |
) |
|
3,146 |
|
|
311 |
|
|
(307 |
) |
|
(22 |
) |
|
|
|
|
|
|
|
|
|
|
|
|
|
|
|
|
|
|
|
|
|
|
Total recognized in net periodic benefit cost and other comprehensive income |
|
$ |
102 |
|
$ |
(242 |
) |
$ |
2,960 |
|
$ |
447 |
|
$ |
(147 |
) |
$ |
138 |
|
|
|
|
|
|
|
|
|
|
|
|
|
|
|
|
|
|
|
|
|
|
|
|
|
|
|
During the quarter ended March 31, 2008, the Company recorded a curtailment charge of $134,000 related to a partial settlement of the defined benefit pension plan. In December of 2002, the Company’s Board of |
78
|
|
|
|
|
Directors amended the defined benefit pension plan to cease the accrual of further benefits. There is no assumed increase in the per capita cost of current health care benefits since the employer contributions are fixed with the retiree paying for any cost increases. |
|
|
|
|
(10) |
Stock Option Plan |
On May 3, 2000, the Company’s shareholders approved the Rome Bancorp, Inc. 2000 Stock Option Plan (the “2000 Stock Option Plan”). The primary objective of the 2000 Stock Option Plan is to provide officers and directors with a proprietary interest in the Company and an incentive to encourage such persons to remain with the Company.
Under the 2000 Stock Option Plan, 517,952 shares of authorized but unissued common stock are reserved for issuance upon option exercises. The Company also has the alternative to fund the 2000 Stock Option Plan with treasury stock. Options under the plan may be either non-qualified stock options or incentive stock options. Each option entitles the holder to purchase one share of common stock at an exercise price equal to the fair market value on the date of grant. On June 28, 2000, 382,357 options were awarded at an exercise price of $2.19 per share. These options have a ten-year term and vested at a rate of 20% per year from the grant date. At December 31, 2010 and 2009 the remaining contractual life of these options was 0 years and 0.5 years, respectively.
On May 3, 2006, the Company’s shareholders approved the Rome Bancorp, Inc. 2006 Stock Option Plan (the “2006 Stock Option Plan”), which also has the primary objective of providing officers and directors with a proprietary interest in the Company and an incentive to encourage such persons to remain with the Company. Under the 2006 Stock Option Plan, 590,000 shares of authorized but unissued common stock are reserved for issuance upon option exercises. The Company also has the alternative to fund the 2006 Stock Option Plan with treasury stock. Options under the plan may be either non-qualified stock options or incentive stock options.
Each option entitles the holder to purchase one share of common stock at an exercise price equal to the fair market value on the date of grant. On May 24, 2006, 354,000 options were awarded at an exercise price of $12.84 per share. These options have a ten-year term and vest at a rate of 20% per year from the grant date. The fair value of the 2006 options awarded was estimated on the date of grant using a closed form option valuation (Black-Scholes) model and the following assumptions: risk free interest rate 4.60%, an expected term of 6.5 years, expected stock price volatility of 8.25% and a dividend yield of 2.52%. At December 31, 2010 and December 31, 2009 the remaining contractual life of these options was 5.4 years and 6.4 years, respectively.
Under FASB guidance, stock-based compensation expense of $1.69 per option granted under the 2006 Stock Option Plan is being recorded over the sooner of the vesting period of the options, or upon the date at which a recipient becomes eligible for normal or early retirement under the Company’s defined benefit plan. At May 24, 2006, certain awardees met the retirement eligibility criteria and accordingly, stock-based compensation expense of $350,000 related to their options was expensed immediately. Total compensation cost related to the Company’s stock option plans was $50,000 for each of the three years ended December 31, 2010.
Information related to the stock option plans during each year follows:
|
|
|
|
|
|
|
|
|
|
|
|
|
|
|
2010 |
|
2009 |
|
2008 |
|
|||
|
|
|
|
|
|
|
|
|
|||
|
|
||||||||||
|
Intrinsic value of options exercised |
|
$ |
— |
|
$ |
18,000 |
|
$ |
25,000 |
|
|
Cash received from option exercises |
|
|
— |
|
|
— |
|
|
— |
|
|
Tax benefit realized from option exercises |
|
|
— |
|
|
— |
|
|
— |
|
|
Weighted average fair value of options granted |
|
|
— |
|
|
— |
|
|
— |
|
|
|
|
|
|
As of December 31, 2010, there was $21,000 of total unrecognized compensation cost related to nonvested stock options granted under the Plan. The cost is expected to be recognized over a weighted-average period of 0.42 years. At December 31, 2010, the intrinsic value of all outstanding options and exercisable options was $0. |
79
The following table presents the stock option activity for the year ended December 31, 2010:
|
|
|
|
|
|
|
|
|
|
|
|
2010 |
|
||||
|
|
|
|
|
||||
|
|
|
Shares |
|
Weighted Average |
|
||
|
|
|
|
|
|
|
||
|
|
|||||||
|
Outstanding at beginning of year |
|
|
354,000 |
|
$ |
12.84 |
|
|
Exercised |
|
|
— |
|
|
— |
|
|
Granted |
|
|
— |
|
|
— |
|
|
|
|
|
|
|
|
|
|
|
Outstanding at end of year |
|
|
354,000 |
|
$ |
12.84 |
|
|
|
|
|
|
|
|
|
|
|
Exercisable at end of year |
|
|
283,200 |
|
$ |
12.84 |
|
|
|
|
|
|
|
|
|
|
|
|
|
|
|
All outstanding stock options are expected to vest. |
|
|
|
|
(11) |
Recognition and Retention Plan |
|
|
|
|
|
The Company’s shareholders approved the Rome Bancorp, Inc. 2000 Recognition and Retention Plan (“2000 RRP”) on May 3, 2000. The purpose of the plan is to promote the long-term interests of the Company and its shareholders by providing a stock-based compensation program to attract and retain officers and directors. During 2000, 119,742 shares were awarded under the 2000 RRP. The shares vested at a rate of 20% per year from the grant date. The fair market value of the shares awarded under the plan was $262,000 at the grant date, and was amortized to compensation expense on a straight-line basis over the vesting periods of the underlying shares. |
|
|
|
|
|
The Company’s shareholders approved the Rome Bancorp, Inc. 2006 Recognition and Retention Plan (“2006 RRP”) on May 3, 2006 in order to further promote the long-term interests of the Company and its shareholders by providing a stock-based compensation program to attract and retain officers and directors. |
|
|
|
|
|
On May 24, 2006, 168,300 shares were awarded under the 2006 RRP. These shares vest at a rate of 20% per year from the grant date. The fair market value of the shares awarded under the plan was $2.2 million at the grant date, and is being amortized over the sooner of the vesting period of the awards, or upon the date at which a recipient becomes eligible for normal or early retirement under the Company’s defined benefit plan. At May 24, 2006, certain awardees met the retirement eligibility criteria and accordingly, stock-based compensation expense of $1.1 million related to their 2006 RRP awards was expensed immediately. Stock-based compensation expense of $178,000, $178,000 and $231,000 related to RRP awards was recorded in 2010, 2009 and 2008, respectively. The remaining unearned compensation cost has been shown as a reduction of shareholders’ equity. The shares awarded under the RRP were transferred from treasury stock at cost with the difference between the fair market value on the grant date and the cost of the shares recorded as additional paid-in capital. |
|
|
|
|
|
A summary of changes in the Company’s nonvested shares for the year follows: |
|
|
|
|
|
|
|
|
|
|
|
|
Shares |
|
Weighted-Average |
|
||
|
|
|
|
|
|
|
||
|
Nonvested at January 1, 2010 |
|
|
67,320 |
|
|
— |
|
|
Granted |
|
|
— |
|
|
— |
|
|
Vested |
|
|
33,660 |
|
$ |
12.84 |
|
|
Forfeited |
|
|
— |
|
|
— |
|
|
|
|
|
|
|
|
|
|
|
Nonvested at December 31, 2010 |
|
|
33,660 |
|
$ |
12.84 |
|
|
|
|
|
|
|
|
|
|
As of December 31, 2010, there was $74,000 of total unrecognized compensation cost related to nonvested shares granted under the RRP. The cost is expected to be recognized over a weighted-average period of 0.4 years. The total fair value of shares vested during the years ended December 31, 2010, 2009 and 2008 was $303,000, $300,000 and $384,000.
80
|
|
|
|
(12) |
Other Employee Benefits |
|
|
|
|
|
The Company has a defined contribution 401(k) Savings Plan for all full time salaried employees. Employees are permitted to contribute up to 75% of base pay to the Savings Plan, subject to certain limitations. The Company matches 50% of each employee’s contributions up to a limit of 3% of the employee’s base pay. Contributions to the defined contribution 401(k) Savings Plan were $92,000, $88,000 and $86,000 during the years ended December 31, 2010, 2009 and 2008, respectively. |
|
|
|
|
|
In connection with establishing an ESOP in 1999, the ESOP borrowed $933,000 from the Company to purchase 453,488 shares of the Company’s common stock. The loan bears interest at 8% and is payable in fifteen annual installments. At December 31, 2010, 362,780 of the original ESOP shares had been released or committed to be released of which 90,708 remained as unallocated shares. |
|
|
|
|
|
On March 30, 2005, in connection with the Company’s second-step conversion and stock offering, the ESOP borrowed $2,360,000 from the Company to purchase an additional 236,000 shares of the Company’s common stock. The loan bears interest at 5% and is payable in fifteen annual installments. At December 31, 2010, 94,399 of these shares had been released or committed to be released and 141,601 remained as unallocated shares. |
|
|
|
|
|
The fair value of the unallocated shares on December 31, 2010 was $2.9 million. The Company recognized compensation expense of $431,000, $384,000 and $495,000 in 2010, 2009 and 2008, respectively in connection with the ESOP. |
|
|
|
|
|
The Company has also adopted a Benefit Restoration Plan for the Company’s CEO. This plan provides the beneficiary with the benefits that would otherwise be due to him as a participant in the 401(k) plan and the employee stock ownership plan if such benefits were not limited by certain provisions of the Internal Revenue Code. In addition, in the event the beneficiary retires prior to the end of the ESOP loan term, the plan will provide him a benefit equal to the value of the shares of Rome Bancorp that would have been allocated to his account under the ESOP had he remained employed through the end of the ESOP loan term. The liability associated with this plan was $665,000 and $527,000 at December 31, 2010 and December 31, 2009, respectively. |
81
|
|
|
|
(13) |
Comprehensive Income (Loss) |
|
|
|
|
|
Comprehensive income represents net income and other comprehensive income (loss) which is the net change in the unrealized gains or losses on securities available-for-sale and unrealized gains and losses on pension and postretirement liabilities, net of taxes. The following summarizes the components of other comprehensive income (loss) (dollars in thousands): |
|
|
|
|
|
|
|
|
|
|
|
|
|
|
|
Years ended December 31, |
|
|||||||
|
|
|
|
|
|||||||
|
|
|
2010 |
|
2009 |
|
2008 |
|
|||
|
|
|
|
|
|
|
|
|
|||
|
Unrealized holding gains (losses) arising during the period |
|
$ |
78 |
|
$ |
1,136 |
|
$ |
(3,325 |
) |
|
Reclassification adjustment for net realized (gain) loss included in net income |
|
|
(156 |
) |
|
(73 |
) |
|
265 |
|
|
|
|
|
|
|
|
|
|
|
|
|
|
|
|
|
|
|
|
|
|
|
|
|
|
Other comprehensive income (loss), before tax |
|
|
(78 |
) |
|
1,063 |
|
|
(3,060 |
) |
|
Deferred tax expense (benefit) |
|
|
(31 |
) |
|
425 |
|
|
(1,224 |
) |
|
|
|
|
|
|
|
|
|
|
|
|
|
|
|
|
|
|
|
|
|
|
|
|
|
Other comprehensive income (loss), net of tax |
|
$ |
(47 |
) |
$ |
638 |
|
$ |
(1,836 |
) |
|
|
|
|
|
|
|
|
|
|
|
|
|
|
|
|
|
The following is a summary of the accumulated other comprehensive income (loss) balances, net of tax (dollars in thousands): |
|
|
|
|
|
|
|
|
|
|
|
|
|
|
|
Balance
at |
|
2010 |
|
Balance
at |
|
|||
|
|
|
|
|
|
|
|
|
|||
|
Unrealized gains on available for sale securities |
|
$ |
156 |
|
$ |
71 |
|
$ |
227 |
|
|
Unrealized gains (losses) on pension and postretirement benefits |
|
|
(1,730 |
) |
|
(118 |
) |
|
(1,848 |
) |
|
|
|
|
|
|
|
|
|
|
|
|
|
|
|
$ |
(1,574 |
) |
$ |
(47 |
) |
$ |
(1,621 |
) |
|
|
|
|
|
|
|
|
|
|
|
|
|
|
|
|
(14) |
Commitments and Contingencies |
|
|
|
|
|
The Company is a party to financial instruments with off-balance sheet risk in the normal course of business to meet the financing needs of its customers. These financial instruments consist of commitments to extend credit and involve, to varying degrees, elements of credit, market and interest rate risk in excess of the amounts recognized in the consolidated balance sheet. Credit risk represents the accounting loss that would be recognized at the reporting date if obligated counterparties failed completely to perform as contracted. Market risk represents risk that future changes in market prices make financial instruments less valuable. |
|
|
|
|
|
Commitments to extend credit are agreements to lend to a customer as long as there is no violation of any condition established in the contract. Commitments generally have fixed expiration dates or other termination clauses and may require payment of a fee. Since some of the commitments are expected to expire without being drawn upon, the total commitment amounts do not necessarily represent future cash requirements. The Company evaluates each customer’s creditworthiness on a case-by-case basis. The amount of collateral obtained, if deemed necessary by the Company upon extension of credit, is based on management’s evaluation of the customer’s financial position. Collateral held varies, but may include real estate, accounts receivable, inventory, property, plant and equipment and income-producing commercial properties. Substantially all commitments to extend credit, if exercised, will represent loans secured by real estate. |
82
|
|
|
|
|
At December 31, 2010 and 2009 the Company was committed to originate mortgage and other loans of approximately $13.3 million and $7.5 million, respectively. At December 31, 2010 and December 31, 2009, the Company’s fixed rate loan commitments totaled $12.6 million and $7.5 million, respectively. The range of interest rates on these fixed rate commitments was 4.125% to 7.00% at December 31, 2010 and 4.50% to 6.75% at December 31, 2009. Commitments under unused lines of credit and letters of credit were approximately $18.6 million and $19.4 million at December 31, 2010 and 2009, respectively. |
|
|
|
|
|
The Company’s exposure to credit loss in the event of nonperformance by the other party to the financial instrument for loan commitments is represented by the contractual or notional amount of these instruments. The Company uses the same credit policies in making commitments as it does for on-balance sheet instruments. The Company controls its credit risk through credit approvals, limits, and monitoring procedures. |
|
|
|
|
|
In the normal course of business, there are various outstanding legal proceedings. In the opinion of management, the aggregate amount involved in such proceedings is not material to the financial condition or results of operations of the Company. |
|
|
|
|
(15) |
Earnings Per Share |
|
|
|
|
|
The following summarizes the computation of earnings per share for the years ended December 31 (in thousands): |
|
|
|
|
|
|
|
|
|
|
|
|
|
|
|
2010 |
|
2009 |
|
2008 |
|
|||
|
|
|
|
|
|
|
|
|
|||
|
Basic earnings per share: |
|
|
|
|
|
|
|
|
|
|
|
Net Income |
|
$ |
2,261 |
|
$ |
3,087 |
|
$ |
2,905 |
|
|
|
|
|
|
|
|
|
|
|
|
|
|
Weighted average basic shares outstanding |
|
|
6,784 |
|
|
6,900 |
|
|
7,353 |
|
|
Less: Average unallocated ESOP shares |
|
|
(261 |
) |
|
(307 |
) |
|
(353 |
) |
|
|
|
|
|
|
|
|
|
|
|
|
|
Average basic shares |
|
|
6,523 |
|
|
6,593 |
|
|
7,000 |
|
|
Basic earnings per share |
|
$ |
0.35 |
|
$ |
0.47 |
|
$ |
0.42 |
|
|
|
|
|
|
|
|
|
|
|
|
|
|
Diluted earnings per share: |
|
|
|
|
|
|
|
|
|
|
|
Net Income |
|
$ |
2,261 |
|
$ |
3,087 |
|
$ |
2,905 |
|
|
|
|
|
|
|
|
|
|
|
|
|
|
Weighted average basic shares outstanding |
|
|
6,523 |
|
|
6,593 |
|
|
7,000 |
|
|
Effect of dilutive securities: |
|
|
|
|
|
|
|
|
|
|
|
Stock options |
|
|
— |
|
|
1 |
|
|
3 |
|
|
|
|
|
|
|
|
|
|
|
|
|
|
|
|
|
6,523 |
|
|
6,594 |
|
|
7,003 |
|
|
Diluted earnings per share |
|
$ |
0.35 |
|
$ |
0.47 |
|
$ |
0.41 |
|
|
|
|
|
|
|
|
|
|
|
|
|
|
|
|
|
|
Stock options for 354,000 shares of common stock were not considered in computing diluted earnings per common share for each of the three years ended December 31, 2010 because they were anti-dilutive. |
|
|
|
|
(16) |
Shareholders’ Equity and Regulatory Matters |
|
|
|
|
|
The Company and Rome Savings are subject to various regulatory requirements administered by the federal banking agencies and Rome Savings is a federal savings bank regulated by the Office of Thrift Supervision (“OTS”). The Company is a Delaware corporation and is regulated as a savings and loan holding company by the OTS. The Bank must obtain regulatory approval to pay cash dividends to the Company. |
83
|
|
|
|
|
Rome Savings is required to maintain certain reserves of vault cash and/or deposits with the Federal Reserve Bank of New York. The amount of this reserve requirement, included in cash on hand, is $1.9 million at December 31, 2010. |
|
|
|
|
|
The Company’s ability to pay dividends is primarily dependent upon the ability of its subsidiary bank to pay dividends to the Company. The payment of dividends by Rome Savings is subject to continued compliance with minimum regulatory capital requirements. In addition, regulatory approval is generally required prior to Rome Savings declaring dividends in an amount in excess of net income for that year plus net income retained in the preceding two years. Further, under the OTS’ conversion regulations, the Company could not return any capital, other than ordinary dividends, to its stockholders during the three years following the conversion and offering completed in March of 2005. |
|
|
|
|
|
Under capital adequacy guidelines and the regulatory framework for prompt corrective action, Rome Savings must meet specific guidelines that involve quantitative measures of assets, liabilities, and certain off-balance sheet items as calculated under regulatory accounting practices. |
|
|
|
|
|
Capital amounts are also subject to qualitative judgments by the regulators about components, risk weightings, and other factors. Failure to meet minimum capital requirements can initiate certain mandatory and possibly additional discretionary, actions by the regulators that, if undertaken, could have a direct material effect on the Company’s and Bank’s financial statements. |
|
|
|
|
|
The Federal Deposit Insurance Corporation Improvement Act of 1991 (FDICIA), established capital levels for which insured institutions are categorized as well capitalized, adequately capitalized, undercapitalized, significantly undercapitalized, or critically undercapitalized. |
|
|
|
|
|
As of May 17, 2010, the most recent notification from the OTS categorized Rome Savings as well capitalized under the regulatory framework for prompt corrective actions. There have been no conditions or events since that notification that management believes have changed Rome Savings’ category. Management believes, as of December 31, 2010, that the Company and Bank meet and exceed all capital adequacy requirements to which they are subject. |
|
|
|
|
|
The Qualified Thrift lender test requires at least 65% of assets be maintained in housing-related finance and other specified areas. If this test is not met, limits are placed on growth, branching, new investments, FHLB advances and dividends, or the Bank must convert to a commercial bank charter. Management believes that this test is met. |
84
|
|
|
|
|
The following is a summary of Rome Savings’ actual capital amounts and ratios compared to the regulatory minimum capital adequacy requirements and the OTS and FDIC requirements for classification as a well capitalized institution under prompt corrective action provisions (dollars in thousands): |
|
|
|
|
|
|
|
|
|
|
|
|
|
|
|
|
|
|
|
|
|
Actual |
|
adequacy |
|
To be classified as |
|
|||||||||
|
|
|
|
|
|
|
|
|
|||||||||
|
|
|
Amount |
|
Ratio |
|
Amount |
|
Ratio |
|
Amount |
|
Ratio |
|
|||
|
|
|
|
|
|
|
|
|
|
|
|
|
|
|
|||
|
As of December 31, 2010: |
|
|
|
|
|
|
|
|
|
|
|
|
|
|
|
|
|
|
|
|
|
|
|
|
|
|
|
|
|
|
|
|
|
|
|
Total capital (to risk weighted assets): |
|
$ |
60,319 |
|
25.41 |
% |
$ |
18,993 |
|
>=8 |
% |
$ |
23,741 |
|
>=10 |
% |
|
|
|
|
|
|
|
|
|
|
|
|
|
|
|
|
|
|
|
Tier 1 Capital (to risk weighted assets): |
|
|
57,829 |
|
24.36 |
% |
|
9,497 |
|
>=4 |
% |
|
14,245 |
|
>=6 |
% |
|
|
|
|
|
|
|
|
|
|
|
|
|
|
|
|
|
|
|
Tier 1 Capital (to adjusted assets): |
|
|
57,829 |
|
17.57 |
% |
|
13,165 |
|
>=4 |
% |
|
16,456 |
|
>=5 |
% |
|
|
|
|
|
|
|
|
|
|
|
|
|
|
|
|
|
|
|
As of December 31, 2009: |
|
|
|
|
|
|
|
|
|
|
|
|
|
|
|
|
|
Total capital (to risk weighted assets): |
|
$ |
55,866 |
|
23.04 |
% |
$ |
19,394 |
|
>=8 |
% |
$ |
24,243 |
|
>=10 |
% |
|
|
|
|
|
|
|
|
|
|
|
|
|
|
|
|
|
|
|
Tier 1 Capital (to risk weighted assets): |
|
|
54,046 |
|
22.29 |
% |
|
9,697 |
|
>=4 |
% |
|
14,546 |
|
>=6 |
% |
|
|
|
|
|
|
|
|
|
|
|
|
|
|
|
|
|
|
|
Tier 1 Capital (to adjusted assets): |
|
|
54,046 |
|
16.27 |
% |
|
9,963 |
|
>=3 |
% |
|
16,605 |
|
>=5 |
% |
85
|
|
|
|
|
Following is a reconciliation of Rome Savings’ GAAP shareholders’ equity to regulatory Tier 1 capital at December 31, 2010 and 2009 (dollars in thousands). |
|
|
|
|
|
|
|
|
|
|
|
|
December 31, |
|
December 31, |
|
||
|
|
|
|
|
|
|
||
|
GAAP Shareholders’ Equity |
|
$ |
56,473 |
|
$ |
52,540 |
|
|
Plus: Minority interest in consolidated subsidiary and other comprehensive loss related to ASC 715 |
|
|
1,848 |
|
|
1,730 |
|
|
Less: Disallowed assets and unrealized gains on available-for- sale securities, net of tax |
|
|
(492 |
) |
|
(224 |
) |
|
|
|
|
|
|
|
|
|
|
|
|
|
|
|
|
|
|
|
Tier 1 Capital |
|
|
57,829 |
|
|
54,046 |
|
|
|
|
|
|
|
|
|
|
|
|
|
|
|
|
|
|
|
|
Plus: Allowance for loan losses |
|
|
2,490 |
|
|
2,132 |
|
|
Allowed unrealized gain on available-for-sale securities |
|
|
— |
|
|
— |
|
|
Less: Real estate held for investment |
|
|
— |
|
|
(312 |
) |
|
|
|
|
|
|
|
|
|
|
|
|
|
|
|
|
|
|
|
Total Regulatory Capital |
|
$ |
60,319 |
|
$ |
55,866 |
|
|
|
|
|
|
|
|
|
|
|
|
|
|
|
(17) |
Fair Value |
|
|
|
|
|
|
|
Fair value is the exchange price that would be received for an asset or paid to transfer a liability (exit price) in the principal or most advantageous market for the asset or liability in an orderly transaction between market participants on the measurement date. There are three levels of inputs that may be used to measure fair values: |
|
|
|
|
|
|
|
|
Level 1: Quoted prices (unadjusted) for identical assets or liabilities in active markets that the entity has the ability to access as of the measurement date. |
|
|
|
|
|
|
|
Level 2: Significant other observable inputs other than Level 1 prices such as quoted prices for similar assets or liabilities; quoted prices in markets that are not active; or other inputs that are observable or can be corroborated by observable market data. |
|
|
|
|
|
|
|
Level 3: Significant unobservable inputs that reflect a reporting entity’s own assumptions about the assumptions that market participants would use in pricing an asset or liability. |
|
|
|
|
|
|
The fair values of securities available for sale are determined by obtaining quoted prices on nationally recognized securities exchanges (Level 1 inputs) or matrix pricing, which is a mathematical technique widely used to in the industry to value debt securities without relying exclusively on quoted prices for the specific securities but rather by relying on the securities’ relationship to other benchmark quoted securities (Level 2 inputs). |
|
|
|
|
|
|
|
The fair value of impaired loans with specific allocations of the allowance for loan losses is generally based on recent real estate appraisals. These appraisals may utilize a single valuation approach or a combination of approaches including comparable sales and the income approach. Adjustments are routinely made in the appraisal process by the independent appraisers to adjust for differences between the comparable sales and income data available. Such adjustments are usually significant and typically result in a Level 3 classification of the inputs for determining fair value. |
|
86
Assets measured at fair value on a recurring basis are summarized below (in thousands):
|
|
|
|
|
|
|
|
|
|
|
|
Fair Value Measurements |
|
||||
|
|
|
|
|
||||
|
|
|
Quoted Prices in |
|
Significant |
|
||
|
|
|
|
|
|
|
||
|
Available for sale securities: |
|
|
|
|
|
|
|
|
State and municipal obligations |
|
$ |
— |
|
$ |
1,785 |
|
|
Corporate bonds |
|
|
1,605 |
|
|
9,321 |
|
|
Equity and other securities |
|
|
39 |
|
|
320 |
|
|
|
|
|
|
|
|
|
|
|
Total |
|
$ |
1,644 |
|
$ |
11,426 |
|
|
|
|
|
|
|
|
|
|
|
|
|
|
|
|
|
|
|
|
|
|
Fair Value Measurements |
|
||||
|
|
|
|
|
||||
|
|
|
Quoted Prices in |
|
Significant |
|
||
|
|
|
|
|
|
|
||
|
Available for sale securities: |
|
|
|
|
|
|
|
|
State and municipal obligations |
|
$ |
— |
|
$ |
2,413 |
|
|
Corporate bonds |
|
|
— |
|
|
6,643 |
|
|
Equity and other securities |
|
|
568 |
|
|
400 |
|
|
|
|
|
|
|
|
|
|
|
Total |
|
$ |
568 |
|
$ |
9,456 |
|
|
|
|
|
|
|
|
|
|
Assets measured at fair value on a non-recurring basis are summarized below (in thousands):
|
|
|
|
|
|
|
|
|
|
|
|
|
|
|
Fair Value Measurements |
|
|||||||
|
|
|
|
|
|||||||
|
|
|
Quoted Prices in |
|
Significant |
|
Significant |
|
|||
|
|
|
|
|
|
|
|
|
|||
|
Impaired loans: |
|
|
|
|
|
|
|
|
|
|
|
Commercial real estate |
|
$ |
— |
|
$ |
— |
|
$ |
677 |
|
|
Commercial loans |
|
|
— |
|
|
— |
|
|
1,652 |
|
|
|
|
|
|
|
|
|
|
|
|
|
|
Total |
|
$ |
— |
|
$ |
— |
|
$ |
2,329 |
|
|
|
|
|
|
|
|
|
|
|
|
|
|
|
|
|
|
|
|
|
|
|
|
|
|
|
|
Fair Value Measurements |
|
|||||||
|
|
|
|
|
|||||||
|
|
|
Quoted Prices in |
|
Significant |
|
Significant |
|
|||
|
|
|
|
|
|
|
|
|
|||
|
Impaired loans: |
|
|
|
|
|
|
|
|
|
|
|
Commercial real estate |
|
$ |
— |
|
$ |
— |
|
$ |
396 |
|
|
Commercial loans |
|
|
— |
|
|
— |
|
|
60 |
|
|
|
|
|
|
|
|
|
|
|
|
|
|
Total |
|
$ |
— |
|
$ |
— |
|
$ |
456 |
|
|
|
|
|
|
|
|
|
|
|
|
|
87
|
|
|
|
|
The following represent impairment charges recognized during the period: |
||
|
|
|
|
|
|
Impaired loans, which are measured for impairment using the fair value of the collateral for collateral dependent loans, had a carrying amount of $3.2 million, with a valuation allowance of $847,000, resulting in a $348,000 additional provision for loan losses for the year ended December 31, 2010. At December 31, 2009, impaired loans had a carrying amount of $698,000, with a valuation allowance of $242,000, resulting in no additional provision for loan losses for the year ended December 31, 2009. |
|
|
|
|
|
|
|
The following methods and assumptions were used by the Company in estimating fair values of financial instruments: |
|
|
|
|
|
|
|
|
Cash and cash equivalents: For these short-term instruments that generally mature in ninety days or less, the carrying value approximates fair value. |
|
|
|
|
|
|
|
Securities: The fair values of securities available for sale are determined by obtaining quoted prices on nationally recognized securities exchanges (Level 1 inputs) or matrix pricing, which is a mathematical technique widely used to in the industry to value debt securities without relying exclusively on quoted prices for the specific securities but rather by relying on the securities’ relationship to other benchmark quoted securities (Level 2 inputs). |
|
|
|
|
|
|
|
Federal Home Loan Bank Stock: It is not practicable to determine the value of FHLB stock due to restrictions placed on its transferability. |
|
|
|
|
|
|
|
Loans: The fair values for all loans are estimated using discounted cash flow analyses, using interest rates currently being offered for loans with similar terms to borrowers of similar credit rating. The carrying amount of accrued interest receivable approximates its fair value. The Company has not considered market illiquidity in estimating the fair value of loans due to uncertain and inconsistent market pricing being experienced at December 31, 2010 and 2009. |
|
|
|
|
|
|
|
Deposits: The fair values of demand deposits (interest and non-interest checking) savings accounts and money market accounts are, by definition, equal to the amount payable on demand at the reporting date (i.e., their carrying amounts). Fair values for fixed-rate certificates of deposits, are estimated using a discounted cash flow calculation that applies interest rates currently being offered on these products to a schedule of aggregated expected monthly maturities on time deposits. |
|
|
|
|
|
|
|
FHLB advances: Fair values of long-term borrowings are estimated using a discounted cash flow approach, based on current market rates for similar borrowings. The fair value of accrued interest approximates carrying value. |
|
|
|
|
|
|
|
Off-balance-sheet instruments: Fair values for the Company’s off-balance-sheet instruments (lines of credit and commitments to fund loans) are based on fees currently charged to enter into similar agreements, taking into account the remaining terms of the agreements and the counterparties’ credit standing. The fair value of these financial instruments is immaterial and has therefore been excluded from the table below. |
88
|
|
|
|
|
The estimated carrying values and fair values of the Company’s financial instruments, not previously presented, for December 31 are as follows (in thousands): |
|
|
|
|
|
|
|
|
|
|
|
|
|
|
|
|
|
|
2010 |
|
2009 |
|
||||||||
|
|
|
|
|
|
|
||||||||
|
|
|
Carrying |
|
Fair |
|
Carrying |
|
Fair |
|
||||
|
|
|
|
|
|
|
|
|
|
|
||||
|
Financial assets: |
|
|
|
|
|
|
|
|
|
|
|
|
|
|
Cash and cash equivalents |
|
$ |
18,805 |
|
$ |
18,805 |
|
$ |
7,574 |
|
$ |
7,574 |
|
|
Securities available for sale |
|
|
13,070 |
|
|
13,070 |
|
|
10,024 |
|
|
10,024 |
|
|
Securities held to maturity |
|
|
1,416 |
|
|
1,459 |
|
|
1,431 |
|
|
1,502 |
|
|
Loans, net |
|
|
265,937 |
|
|
269,942 |
|
|
285,617 |
|
|
288,524 |
|
|
Loans held for sale |
|
|
920 |
|
|
937 |
|
|
— |
|
|
— |
|
|
Federal Home Loan Bank |
|
|
3,385 |
|
|
n/a |
|
|
3,222 |
|
|
n/a |
|
|
Stock |
|
|
|
|
|
|
|
|
|
|
|
|
|
|
Accrued interest receivable |
|
|
1,100 |
|
|
1,100 |
|
|
1,117 |
|
|
1,117 |
|
|
Financial liabilities: |
|
|
|
|
|
|
|
|
|
|
|
|
|
|
Non-interest bearing deposits |
|
|
34,502 |
|
|
34,502 |
|
|
31,790 |
|
|
31,790 |
|
|
Interest bearing deposits |
|
|
190,823 |
|
|
191,028 |
|
|
184,849 |
|
|
185,320 |
|
|
FHLB advances |
|
|
35,661 |
|
|
36,580 |
|
|
47,869 |
|
|
48,342 |
|
|
Accrued interest payable |
|
|
100 |
|
|
100 |
|
|
127 |
|
|
127 |
|
|
|
|
|
|
It is not practicable to determine the fair value of FHLB stock due to restrictions placed on its transferability. Fair value estimates are made at a specific point in time, based on relevant market information and information about the financial instrument. These estimates are subjective in nature and involve uncertainties and matters of significant judgment and, therefore, cannot be determined with precision. Changes in assumptions could significantly affect the estimates. |
|
|
|
|
(18) |
Parent Company Only Financial Statements |
|
|
|
|
|
Presented below is the condensed balance sheet of the Parent Company as of December 31, 2010 and 2009 and statement of income and statement of cash flows for the years ended December 31, 2010, 2009 and 2008 (in thousands): |
|
|
|
|
|
|
|
|
|
|
Condensed Balance Sheets |
|
2010 |
|
2009 |
|
||
|
|
|
|
|
|
|
||
|
Assets: |
|
|
|
|
|
|
|
|
Cash and due from banks |
|
$ |
1,736 |
|
$ |
4,106 |
|
|
Investment in subsidiary bank |
|
|
56,403 |
|
|
52,470 |
|
|
|
|
|
|
|
|
|
|
|
Loan receivable from ESOP |
|
|
1,862 |
|
|
2,075 |
|
|
Other assets |
|
|
850 |
|
|
1,756 |
|
|
|
|
|
|
|
|
|
|
|
Total assets |
|
$ |
60,851 |
|
$ |
60,407 |
|
|
|
|
|
|
|
|
|
|
|
|
|
|
|
|
|
|
|
|
Total liabilities |
|
$ |
196 |
|
$ |
42 |
|
|
Total shareholders’ equity |
|
|
60,655 |
|
|
60,365 |
|
|
|
|
|
|
|
|
|
|
|
Total liabilities and shareholders’ equity |
|
$ |
60,851 |
|
$ |
60,407 |
|
|
|
|
|
|
|
|
|
|
89
|
|
|
|
|
|
|
|
|
|
|
|
|
Condensed Statements of Income |
|
2010 |
|
2009 |
|
2008 |
|
|||
|
|
|
|
|
|
|
|
|
|||
|
Interest and investment income |
|
$ |
279 |
|
$ |
182 |
|
$ |
172 |
|
|
Dividends from subsidiary bank |
|
|
— |
|
|
8,000 |
|
|
10,300 |
|
|
|
|
|
|
|
|
|
|
|
|
|
|
Total operating income |
|
|
279 |
|
|
8,182 |
|
|
10,472 |
|
|
|
|
|
|
|
|
|
|
|
|
|
|
|
|
|
|
|
|
|
|
|
|
|
|
Net loss on securities |
|
|
— |
|
|
— |
|
|
265 |
|
|
Other operating expenses |
|
|
1,414 |
|
|
507 |
|
|
574 |
|
|
|
|
|
|
|
|
|
|
|
|
|
|
Income (loss) before income taxes and dividends in excess of net income/equity in undistributed income of subsidiary bank |
|
|
(1,135 |
) |
|
7,675 |
|
|
9,633 |
|
|
Equity in undistributed income (dividends in excess of net income) of subsidiary bank |
|
|
3,396 |
|
|
(4,588 |
) |
|
(6,728 |
) |
|
|
|
|
|
|
|
|
|
|
|
|
|
|
|
|
|
|
|
|
|
|
|
|
|
Net income |
|
$ |
2,261 |
|
$ |
3,087 |
|
$ |
2,905 |
|
|
|
|
|
|
|
|
|
|
|
|
|
|
|
|
|
|
|
|
|
|
|
|
|
|
Condensed Statements of Cash Flows |
|
2010 |
|
2009 |
|
2008 |
|
|||
|
|
|
|
|
|
|
|
|
|||
|
Operating activities: |
|
|
|
|
|
|
|
|
|
|
|
Net income |
|
$ |
2,261 |
|
$ |
3,087 |
|
$ |
2,905 |
|
|
Adjustments to reconcile net income to cash provided by operating activities: |
|
|
|
|
|
|
|
|
|
|
|
(Equity in undistributed earnings of)/dividends in excess of net income of subsidiary bank |
|
|
(3,396 |
) |
|
4,588 |
|
|
6,728 |
|
|
Amortization of stock-based compensation |
|
|
228 |
|
|
228 |
|
|
280 |
|
|
Net loss on securities other than temporarily impaired |
|
|
— |
|
|
— |
|
|
265 |
|
|
Decrease (increase) in other assets |
|
|
311 |
|
|
(99 |
) |
|
(139 |
) |
|
Increase (decrease) in other liabilities |
|
|
154 |
|
|
(43 |
) |
|
29 |
|
|
|
|
|
|
|
|
|
|
|
|
|
|
Net cash (used in) provided by operating activities |
|
|
(442 |
) |
|
7,761 |
|
|
10,068 |
|
|
|
|
|
|
|
|
|
|
|
|
|
|
|
|
|
|
|
|
|
|
|
|
|
|
Investing activities: |
|
|
|
|
|
|
|
|
|
|
|
Decrease in loan to ESOP |
|
|
213 |
|
|
202 |
|
|
190 |
|
|
|
|
|
|
|
|
|
|
|
|
|
|
Net cash provided by investing activities |
|
|
213 |
|
|
202 |
|
|
190 |
|
|
|
|
|
|
|
|
|
|
|
|
|
|
|
|
|
|
|
|
|
|
|
|
|
|
Financing activities: |
|
|
|
|
|
|
|
|
|
|
|
Purchase of treasury stock |
|
|
(201 |
) |
|
(2,058 |
) |
|
(8,174 |
) |
|
Dividends |
|
|
(2,342 |
) |
|
(2,220 |
) |
|
(2,387 |
) |
|
|
|
|
|
|
|
|
|
|
|
|
|
|
|
|
|
|
|
|
|
|
|
|
|
Net cash used in financing activities |
|
|
(2,141 |
) |
|
(4,278 |
) |
|
(10,561 |
) |
|
|
|
|
|
|
|
|
|
|
|
|
|
|
|
|
|
|
|
|
|
|
|
|
|
Net (decrease) increase in cash and cash equivalents |
|
|
(2,370 |
) |
|
3,685 |
|
|
(303 |
) |
|
|
|
|
|
|
|
|
|
|
|
|
|
|
|
|
|
|
|
|
|
|
|
|
|
Cash and cash equivalents at beginning of year |
|
|
4,106 |
|
|
421 |
|
|
724 |
|
|
|
|
|
|
|
|
|
|
|
|
|
|
Cash and cash equivalents at end of year |
|
$ |
1,736 |
|
$ |
4,106 |
|
$ |
421 |
|
|
|
|
|
|
|
|
|
|
|
|
|
90
(19) Selected Quarterly Financial Data (Unaudited)
Selected quarterly financial data for 2010 and 2009 are as follows:
|
|
|
|
|
|
|
|
|
|
|
|
|
|
|
|
|
|
2010 Quarter Ending |
|
||||||||||
|
|
|
|
|
||||||||||
|
|
|
March 31, |
|
June 30, |
|
September 30, |
|
December 31, |
|
||||
|
|
|
(In thousands, except per share amounts) |
|||||||||||
|
Net interest income |
|
$ |
3,467 |
|
$ |
3,434 |
|
$ |
3,436 |
|
$ |
3,333 |
|
|
Net interest income after provision for loan losses |
|
|
3,417 |
|
|
3,019 |
|
|
3,361 |
|
|
2,077 |
|
|
Net income |
|
|
1,146 |
|
|
694 |
|
|
838 |
|
|
(417 |
) |
|
Earnings per common share: |
|
|
|
|
|
|
|
|
|
|
|
|
|
|
Basic: |
|
$ |
0.18 |
|
$ |
0.11 |
|
$ |
0.13 |
|
$ |
(0.06 |
) |
|
Diluted |
|
|
0.18 |
|
|
0.11 |
|
|
0.13 |
|
|
(0.06 |
) |
The 2010 fourth quarter loss was primarily the result of the recording of a loan loss provision of $1.3 million.
|
|
|
|
|
|
|
|
|
|
|
|
|
|
|
|
|
|
2009 Quarter Ending |
|
||||||||||
|
|
|
|
|
||||||||||
|
|
|
March 31, |
|
June 30, |
|
September 30, |
|
December 31, |
|
||||
|
|
|
(In thousands, except per share amounts) |
|
||||||||||
|
Net interest income |
|
$ |
3,250 |
|
$ |
3,230 |
|
$ |
3,257 |
|
$ |
3,304 |
|
|
Net interest income after provision for loan losses |
|
|
3,250 |
|
|
3,030 |
|
|
3,257 |
|
|
3,204 |
|
|
Net income |
|
|
707 |
|
|
647 |
|
|
908 |
|
|
825 |
|
|
Earnings per common share: |
|
|
|
|
|
|
|
|
|
|
|
|
|
|
Basic: |
|
$ |
0.11 |
|
$ |
0.10 |
|
$ |
0.14 |
|
$ |
0.13 |
|
|
Diluted |
|
|
0.11 |
|
|
0.10 |
|
|
0.14 |
|
|
0.13 |
|
(20) Impending Merger
On October 12, 2010, Berkshire Hills Bancorp, Inc. (“Berkshire”), the parent company of Berkshire Bank, and the Company entered into an Agreement and Plan of Merger pursuant to which the Company will merge with and into Berkshire. Under the terms of the Merger Agreement, 70% of the outstanding shares of Rome Bancorp common stock will be converted into the right to receive 0.5658 shares of Berkshire common stock for each share of Rome Bancorp and the remaining 30% of outstanding shares of Rome Bancorp will be exchanged for $11.25 in cash. Rome Bancorp stockholders will have the right to elect to receive cash or Berkshire common stock as outlined above, subject to 70% of Rome Bancorp common stock receiving Berkshire common stock and the proration procedures contained in the Merger Agreement. Concurrent with the merger, it is expected that the Bank will merge with and into Berkshire Bank. The transaction is subject to customary closing conditions, including the receipt of regulatory approvals and approval by the shareholders of the Company, and is currently expected to be completed on or about April 1, 2011. The directors and executive officers of Rome Bancorp have agreed to vote their shares in favor of the approval of the Merger Agreement at the stockholders meeting to be held to vote on the proposed transaction. If the merger is not consummated under certain circumstances, Rome Bancorp has agreed to pay Berkshire a termination fee of $3.5 million.
91
|
|
|
|
CHANGES AND DISAGREEMENTS WITH ACCOUNTANTS ON ACCOUNTING AND FINANCIAL DISCLOSURE |
None.
|
|
|
|
CONTROLS AND PROCEDURES |
Evaluation of Disclosure Controls and Procedures
Management, including the Company’s President and Chief Executive Officer and Executive Vice President and Chief Financial Officer, has evaluated the effectiveness of the Company’s disclosure controls and procedures (as defined in Exchange Act Rules 13a-15(e) and 15d-15(e)) as of the end of the period covered by this report. Based upon that evaluation, the Company’s President and Chief Executive Officer and Executive Vice President and Chief Financial Officer concluded that the disclosure controls and procedures were effective to ensure that information required to be disclosed in the reports the Company files and submits under the Exchange Act is (i) recorded, processed, summarized and reported as and when required, and (ii) accumulated and communicated to the Company’s management, including the President and Chief Executive Officer and Executive Vice President and Chief Financial Officer, as appropriate to allow timely decisions regarding required disclosure.
MANAGEMENT’S REPORT ON INTERNAL CONTROL OVER FINANCIAL REPORTING
The management of Rome Bancorp is responsible for establishing and maintaining adequate internal control over financial reporting. Rome Bancorp’s internal control over financial reporting is designed to provide reasonable assurance regarding the reliability of financial reporting and the preparation of financial statements for external purposes in accordance with U.S. generally accepted accounting principles. Rome Bancorp’s internal control over financial reporting includes those policies and procedures that (i) pertain to the maintenance of records that, in reasonable detail, accurately and fairly reflect the transactions and dispositions of assets of Rome Bancorp; (ii) provide reasonable assurance that transactions are recorded as necessary to permit preparation of financial statements in accordance with generally accepted accounting principles, and that receipts and expenditures of Rome Bancorp are being made only in accordance with authorizations of management and directors of Rome Bancorp and (iii) provide reasonable assurance regarding prevention or timely detection of unauthorized acquisition, use or disposition of Rome Bancorp’s assets that could have a material effect on the financial statements.
Because of its inherent limitations, internal control over financial reporting may not prevent or detect misstatements. Also, projections of any evaluation of effectiveness to future periods are subject to the risk that controls may become inadequate because of changes in conditions, or that the degree of compliance with the policies or procedures may deteriorate. Management assessed the effectiveness of Rome Bancorp’s internal control over financial reporting as of December 31, 2010. In making this assessment, management used the criteria set forth by the Committee for Sponsoring Organizations of the Treadway Commission (COSO) in Internal Control-Integrated Framework. Based on our assessment and those criteria, management concluded that Rome Bancorp maintained effective internal control over financial reporting as of December 31, 2010.
92
This annual report does not contain an attestation report of the Company’s registered public accounting firm regarding internal control over financial reporting. Management’s report was not subject to attestation by the Company’s registered public accounting firm pursuant to temporary rules of the SEC that permit the Company to provide only management’s report in this annual report.
|
|
|
|
/s/ Charles M. Sprock |
|
|
|
|
|
Charles M. Sprock |
|
|
Chairman of the Board, President and Chief Executive Officer |
|
|
March 18, 2011 |
|
|
|
|
|
/s/ David C. Nolan |
|
|
|
|
|
David C. Nolan |
|
|
Executive Vice President and Chief Financial Officer |
|
|
March 18, 2011 |
|
There have been no changes in the Company’s internal control over financial reporting identified in connection with the evaluation that occurred during the Company’s last fiscal quarter that has materially affected, or that is reasonably likely to materially affect, the Company’s internal control over financial reporting.
|
|
|
|
OTHER INFORMATION |
None.
93
|
|
|
|
DIRECTORS, EXECUTIVE OFFICERS AND CORPORATE GOVERNANCE |
The names of the directors and certain other information about them as of December 31, 2010 are set forth below:
|
|
|
|
|
|
|
|
|
|
|
|
|
Name |
|
Age(1) |
|
Term Expires |
|
Position(s) |
|
Director |
|
|
|
|
|
|
|
|
|
|
|
|
|
|
|
Bruce R. Engelbert |
|
73 |
|
2013 |
|
Director |
|
1982 |
(2) |
|
|
|
|
|
|
|
|
|
|
|
|
|
|
David C. Grow |
|
67 |
|
2013 |
|
Director |
|
1992 |
(2) |
|
|
|
|
|
|
|
|
|
|
|
|
|
|
Kirk B. Hinman |
|
59 |
|
2011 |
|
Director |
|
1994 |
(2) |
|
|
|
|
|
|
|
|
|
|
|
|
|
|
Dale A. Laval |
|
62 |
|
2012 |
|
Director |
|
2006 |
|
|
|
|
|
|
|
|
|
|
|
|
|
|
|
John A. Reinhardt |
|
73 |
|
2013 |
|
Director |
|
2007 |
|
|
|
|
|
|
|
|
|
|
|
|
|
|
|
Charles M. Sprock |
|
71 |
|
2011 |
|
Chairman,
President and |
|
1980 |
(2) |
|
|
|
|
|
|
|
|
|
|
|
|
|
|
Michael J. Valentine |
|
68 |
|
2011 |
|
Director |
|
1993 |
(2) |
|
|
|
|
|
|
|
|
|
|
(1) |
As of December 31, 2010. |
|
|
(2) |
Includes service as a trustee of Rome Savings prior to the formation of Rome Bancorp in 1999. |
|
The principal occupation and business experience of each director and named executive officer is set forth below. Unless otherwise indicated, each of the following persons has held his or her present position for the last five years.
Bruce R. Engelbert is a retired President of Engelbert’s Jewelers, Inc., a retail jewelry business.
David C. Grow has been a partner at the law firm of McMahon and Grow since 1975. The firm serves as counsel to Rome Savings.
Kirk B. Hinman has served as the President of Rome Strip Steel Company, Inc. since 1989.
Dale A. Laval is the retired Chairman of Independent Audit Associates, Inc. (“IAA”), a regional outsource company specializing in financial institution internal audit and loan review. Mr. Laval has over thirty-seven years experience in the financial services industry.
John A. Reinhardt is a retired Executive Director of the Madison County Industrial Development Agency. In addition, Mr. Reinhardt has over thirty years experience in the financial services industry. Mr. Reinhardt was elected to the Madison County Board of Supervisors in November 2007.
Charles M. Sprock is the Chairman of the Board, President and Chief Executive Officer of Rome Savings and Rome Bancorp.
Michael J. Valentine is the Chairman and retired President of Mele Manufacturing Company, Inc., which manufactures and imports products in the jewel case, stationery, custom packaging and sports flooring businesses.
94
Executive Officers Who Are Not Directors
David C. Nolan, age 57, was named Executive Vice-President and Chief Financial Officer of Rome Bancorp in January of 2006. Prior to being named Executive Vice-President he served as Treasurer and Chief Financial Officer of Rome Bancorp since its inception and Rome Savings since 1984.
The Board of Directors annually elects the executive officers of Rome Bancorp. The elected officers hold office until their respective successors have been elected and qualified, or until death, resignation or removal by the Board of Directors.
Meetings of the Board of Directors and Committees
Rome Bancorp’s Board of Directors currently consists of seven members. Rome Bancorp’s Certificate of Incorporation provides that the Board shall be divided into three classes, as nearly equal in number as possible. The Board of Directors oversees our business and monitors the performance of our management. In accordance with our corporate governance procedures, the Board of Directors does not involve itself in the day-to-day operations of Rome Bancorp. Rome Bancorp’s executive officers and management oversee the day-to-day operations of Rome Bancorp. Our directors fulfill their duties and responsibilities by attending regular meetings of the Board which are held on a monthly basis. Our directors also discuss business and other matters with the Chairman, other key executives, and our principal external advisers (legal counsel, auditors, financial advisors and other consultants).
The Board of Directors held 13 meetings during the fiscal year ended December 31, 2010. Each incumbent director attended at least 75% of the meetings of the Board of Directors.
Committees of the Board
The Board of Directors of Rome Bancorp has established the following committees:
Executive Committee. The Executive Committee exercises the powers of the Board of Directors between Board meetings. It approves loans within Rome Savings’ authority and reviews the loan portfolio. Directors Grow, Reinhardt, Sprock and Valentine currently serve as members of the committee. Mr. Sprock is the Chairman of the Committee. The Executive Committee met twelve times in the 2010 fiscal year.
Management Committee. The Management Committee assesses the structure of the management team and the overall performance of Rome Bancorp and Rome Savings. The Committee oversees executive compensation by approving salary increases and reviews general personnel matters such as staff performance evaluations. Directors Engelbert, Hinman and Valentine serve on the committee. Mr. Valentine is the Chairman of the Committee. All members of the Management Committee are independent directors as defined in The Nasdaq Stock Market listing standards. The Management Committee met one time in the 2010 fiscal year.
Audit Committee. The Audit Committee oversees and monitors our financial reporting process and internal control system, reviews and evaluates the audit performed by our independent auditors and reports any substantive issues found during the audit to the Board. The Audit Committee is directly responsible for the appointment, compensation and oversight of the work of our independent auditors. The Committee also reviews and approves all transactions with affiliated parties. The Audit Committee is chaired by Director Hinman, with Directors Engelbert and Valentine as members. The Board of Directors of Rome Bancorp adopted a written charter for the Audit Committee, a copy of which was attached as Appendix A to the proxy statement filed by Rome Bancorp on April 1, 2010. All members of the Audit Committee are independent directors as defined in The Nasdaq Stock Market listing standards and the Securities Exchange Act of 1934, as amended, and the regulations promulgated thereunder. Rome Bancorp believes that Director Hinman qualifies as an “audit committee financial expert,” as that term is defined by applicable SEC regulations, and the Board of Directors has designated him as such. The committee met four times in the 2010 fiscal year.
95
Nominating and Corporate Governance Committee. The Nominating and Corporate Governance Committee meets to recommend the nomination of Directors to the full Board to fill the terms for the upcoming year or to fill vacancies during a term. The Nominating and Corporate Governance Committee will consider recommendations from shareholders if submitted in a timely manner in accordance with the procedures established in the bylaws and will apply the same criteria to all persons being considered. Directors Engelbert, Grow, Laval and Reinhardt currently serve on the Committee with Director Engelbert serving as Chairman of the Committee. All members of the Nominating and Corporate Governance Committee are independent directors as defined in The Nasdaq Stock Market listing standards. The Nominating and Corporate Governance Committee met one time during the 2010 fiscal year. The Board of Directors has adopted a written charter for the Nominating and Corporate Governance Committee, which was attached as Appendix B to the proxy statement filed by Rome Bancorp on March 30, 2007.
In accordance with our bylaws, recommendations or nominations of individuals for election to the Board at an annual meeting of shareholders may be made by any shareholder of record of Rome Bancorp entitled to vote for the election of directors at such meeting who provides timely notice in writing to the secretary. With respect to an election of directors to be held at an annual meeting of shareholders, to be timely, a shareholders notice must be delivered to or received by the secretary not later than sixty (60) days in advance of such meeting if such meeting is to be held on a day which is within thirty (30) days preceding the anniversary of the previous year’s annual meeting, or ninety (90) days in advance of the meeting if the meeting is to be held on or after the anniversary of the previous year’s annual meeting. With respect to an election to be held at an annual meeting of shareholders held at another time, or at a special meeting of shareholders for the election of directors, a shareholder’s notice must be received by the secretary by the close of business on the tenth (10th) day following the date on which notice of such meeting is first given to shareholders. The shareholder’s notice to the secretary must set forth certain information regarding the proposed nominee and the shareholder making such recommendation or nomination. If a nomination is not properly brought before the meeting in accordance with Rome Bancorp’s bylaws, the chairperson of the meeting may determine that the nomination was not properly brought before the meeting and shall not be considered. For additional information about Rome Bancorp’s director nomination requirements, please see Rome Bancorp’s bylaws.
It is the policy of the Committee to select individuals as director nominees who shall have the highest personal and professional integrity, who shall have demonstrated exceptional ability and judgment and who shall be most effective, in conjunction with the other nominees to the Board, in collectively serving the long-term interests of the shareholders. Shareholder nominees are analyzed by the Committee in the same manner as nominees that are identified by the Committee. Rome Bancorp does not pay a fee to any third party to identify or evaluate nominees.
Code of Ethics
Rome Bancorp has adopted a Code of Conduct and Ethics, which applies to all employees, directors and officers of Rome Bancorp including the principal executive officer, principal financial officer, principal accounting officer, or controller, or persons performing similar functions. The Code of Conduct and Ethics meets the requirements of a “code of ethics” as defined by Item 406 of Regulation S-K. The Code of Conduct and Ethics was filed as Exhibit 14.1 to the Form 10-KSB for the year ended December 31, 2003, and has not changed.
You may obtain a copy of the Code of Conduct and Ethics, free of charge, by sending a request in writing to Crystal M. Seymore, Secretary, Rome Bancorp, Inc., 100 W. Dominick Street, Rome, New York 13440-5810.
96
|
|
|
|
EXECUTIVE COMPENSATION |
Director Compensation
Meeting Fees. Each non-employee director of Rome Bancorp receives an annual retainer equal to $8,000. In addition, the non-employee Chairmen of the Audit and Management Committees receive annual retainers of $5,000 and $2,000, respectively. Other non-employee members of the Audit Committee also receive an annual retainer of $2,500. Employee directors of Rome Bancorp do not receive fees for attendance at Board of Directors or committee meetings. Each non-employee director receives the following fees:
|
|
|
|
• |
fee of $800 per Board of Directors meeting attended; |
|
|
|
|
• |
fee of $375 per Executive Committee meeting attended; |
|
|
|
|
• |
fee of $325 per committee meeting attended for all other committees; and |
|
|
|
|
• |
fee of $275 per conference attended. |
Total directors’ meeting and committee fees for fiscal 2010 were $180,200. Directors are also entitled to the protection of certain indemnification provisions in our Certificate of Incorporation and bylaws.
Deferred Compensation Plan, Recognition and Retention Plans and Stock Option Plans. In addition, our directors are eligible to participate the in Directors’ Deferred Compensation Plan of Rome Bancorp, Inc. as well as each of the two Stock Option Plans and Recognition and Retention Plans maintained by Rome Bancorp. These benefit plans are discussed under “Deferred Compensation Plan,” “Stock Option Plans” and “Recognition and Retention Plans.”
The following table sets forth information regarding compensation earned by the non-employee directors of Rome Bancorp during the last fiscal year.
|
|
|
|
|
|
|
|
|
|
|
|
|
|
|
|
Name |
|
Fees
Earned or |
|
Stock |
|
Option |
|
Total |
|
||||
|
|
|
|
|
|
|
|
|
|
|
||||
|
Bruce R. Engelbert |
|
|
39,275 |
|
|
30,302 |
|
|
9,986 |
|
|
79,563 |
|
|
David C. Grow |
|
|
29,925 |
|
|
30,302 |
|
|
9,986 |
|
|
70,213 |
|
|
Kirk B. Hinman |
|
|
35,125 |
|
|
30,302 |
|
|
9,986 |
|
|
75,413 |
|
|
Dale A. Laval |
|
|
22,755 |
|
|
30,302 |
|
|
9,986 |
|
|
63,043 |
|
|
John A. Reinhardt |
|
|
29,725 |
|
|
— |
|
|
— |
|
|
29,725 |
|
|
Michael J. Valentine |
|
|
39,720 |
|
|
30,302 |
|
|
9,986 |
|
|
80,008 |
|
|
|
|
|
|
|
|
|
|
(1) |
Includes retainer payments, meeting fees, and committee and/or chairmanship fees earned during the fiscal year, whether such fees were paid currently or deferred. |
|
|
(2) |
Represents the aggregate grant date fair value calculated in accordance with FASB ASC 718 for financial statement purposes. For more information concerning the assumptions used for these calculations, please refer to the footnotes to the audited financial statements. This amount does not reflect the value of dividends paid on unvested restricted stock. The total number of unvested restricted stock awards outstanding to each non-employee director at December 31, 2010 was: Director Engelbert, 2,360; Director Grow, 2,360; Director Hinman, 2,360; Director Laval, 2,360; Director Reinhardt, 0; Director Valentine, 2,360. |
|
|
(3) |
Represents the aggregate grant date fair value calculated in accordance with FASB ASC 718 for financial statement purposes. For more information concerning the assumptions used for these calculations, please refer to the footnotes to the audited financial statements. The total number of unexercised options outstanding to each non-employee director at December 31, 2010 was: Director Engelbert, 29,500; Director Grow, 29,500; Director Hinman, 29,500; Director Laval, 29,500; Director Reinhardt, 0; Director Valentine, 29,500. |
|
97
Executive Compensation
The table below sets forth the compensation of each of our named executive officers for 2010 and 2009.
SUMMARY COMPENSATION TABLE
|
|
|
|
|
|
|
|
|
|
|
|
|
|
|
|
|
|
|
|
|
|
|
|
|
|
|
|
|
|
|
Name and |
|
Year |
|
Salary(1) |
|
Bonus(1) |
|
Stock |
|
Option |
|
Nonequity |
|
Nonqualified |
|
All Other |
|
Total |
|
|||||||||
|
|
|
|
|
|
|
|
|
|
|
|
|
|
|
|
|
|
|
|
|
|||||||||
|
Charles M. Sprock, |
|
|
|
|
|
|
|
|
|
|
|
|
|
|
|
|
|
|
|
|
|
|
|
|
|
|
|
|
|
Chairman, President |
|
|
|
|
|
|
|
|
|
|
|
|
|
|
|
|
|
|
|
|
|
|
|
|
|
|
|
|
|
and Chief Executive |
|
|
2010 |
|
|
275,000 |
|
|
0 |
|
|
0 |
|
|
0 |
|
|
0 |
|
|
0 |
|
|
84,337 |
|
|
359,337 |
|
|
Officer |
|
|
|
|
|
|
|
|
|
|
|
|
|
|
|
|
|
|
|
|
|
|
|
|
|
|
|
|
|
|
|
|
2009 |
|
|
275,000 |
|
|
0 |
|
|
0 |
|
|
0 |
|
|
55,000 |
|
|
0 |
|
|
77,084 |
|
|
407,084 |
|
|
|
|
|
|
|
|
|
|
|
|
|
|
|
|
|
|
|
|
|
|
|
|
|
|
|
|
|
|
|
|
David C. Nolan, |
|
|
|
|
|
|
|
|
|
|
|
|
|
|
|
|
|
|
|
|
|
|
|
|
|
|
|
|
|
Executive Vice |
|
|
|
|
|
|
|
|
|
|
|
|
|
|
|
|
|
|
|
|
|
|
|
|
|
|
|
|
|
President and Chief |
|
|
2010 |
|
|
136,000 |
|
|
0 |
|
|
0 |
|
|
0 |
|
|
0 |
|
|
0 |
|
|
38,479 |
|
|
174,479 |
|
|
Financial Officer |
|
|
|
|
|
|
|
|
|
|
|
|
|
|
|
|
|
|
|
|
|
|
|
|
|
|
|
|
|
|
|
|
2009 |
|
|
136,000 |
|
|
0 |
|
|
0 |
|
|
0 |
|
|
0 |
|
|
0 |
|
|
32,894 |
|
|
168,894 |
|
|
|
|
|
|
|
|
|
|
(1) |
The figures shown for salary and bonus represent amounts earned for the fiscal year, whether or not actually paid during such year. |
|
|
(2) |
Represents aggregate grant date fair value calculated in accordance with FASB ASC 718 for financial statement purposes. For more information concerning the assumptions used for these calculations, please refer to the audited financial statements. This amount does not reflect the value of dividends paid on unvested restricted stock, which are included in the Summary Compensation Table under the caption “All Other Compensation.” Under the provisions of FASB ASC 718, because Mr. Sprock and Mr. Nolan met the eligibility criteria for retirement or early retirement under the Company’s defined benefit plan, their grants were expensed in 2006, even though the awards vest ratably over a five year period. |
|
|
(3) |
Represents the aggregate grant date fair value calculated in accordance with FASB ASC 718 for financial statement purposes. For more information concerning the assumptions used for these calculations, please refer to the footnotes to the audited financial statements. Under the provisions of FASB ASC 718, because Mr. Sprock and Mr. Nolan met the eligibility criteria for retirement or early retirement under the Company’s defined benefit plan, their grants were expensed in 2006, even though the awards vest ratably over a five year period. |
|
|
(4) |
Includes for each named executive officer (a) the increase (if any) for the fiscal year in the present value of the individual’s accrued benefit (whether not vested) under each tax-qualified and non-qualified actuarial or defined benefit plan calculated by comparing the present value of each individual’s accrued benefit under each such plan in accordance with FASB ASC 715 as of the plan’s measurement date in such fiscal year to the present value of the individual’s accrued benefit as of the plan’s measurement date in the prior fiscal year. |
|
|
(5) |
For 2010, represents 401(k) plan contributions of $6,280 and $4,080, ESOP plan allocations of $43,924 and $31,083, interest and dividends earned on unvested RRP shares of $8,290 and $3,316 and Benefit Restoration Plan contributions of $25,843 and $0 for Mr. Sprock and Mr. Nolan, respectively. The named executive officers participate in certain group life, health, disability insurance and medical reimbursement plans, not disclosed in the Summary Compensation Table, that are generally available to salaried employees and do not discriminate in scope, terms and operation. We provide certain non-cash perquisites and personal benefits to Mr. Sprock that do not exceed $10,000 in the aggregate and are not included in the reported figures. |
|
Compensation Plan
Recognition and Retention Plans. The Rome Bancorp, Inc. 2000 Recognition and Retention Plan and the Rome Bancorp, Inc. 2006 Recognition and Retention Plan have each been adopted by our Board of Directors and approved by our shareholders. The Recognition and Retention Plans provide for the grant of restricted stock awards to certain officers, employees and non-employee directors of Rome Bancorp, Rome Savings or any affiliate approved by the administrative committee. These restricted stock awards (“Awards”) constitute a right to receive a certain number of shares of common stock of Rome Bancorp upon the Award holder’s satisfaction of certain requirements, such as completion of five years of service with Rome Bancorp, with accelerated vesting upon death, disability, retirement or change in control as defined in the plan. As a general rule, if the Award holder fails to fulfill the requirements contained in the restricted stock award, the Award will not vest. Instead, the Award will be forfeited and canceled. The Recognition and Retention Plans are not subject to the Employee Retirement Income Security Act of 1974, as amended, and are not a tax-qualified plan under the Internal Revenue Code.
As required by the terms of the Recognition and Retention Plans, Rome Bancorp has established a trust and contributed certain amounts of money or property as determined by the Board of Directors, in its discretion.
98
No contributions by participants will be permitted. The trustee will invest the assets of the trust primarily in the shares of our common stock that will be used to make restricted stock awards. The trust currently holds 118,000 shares available for future awards.
The Recognition and Retention Plans are administered by the Board, which has broad discretionary powers under the plans. The Board of Directors has the authority to suspend or terminate the plans in whole or in part at any time by giving written notice to the administrative committee, but the Recognition and Retention Plans may not be terminated while there are outstanding Awards that will vest in the future.
Stock Option Plans. The Rome Bancorp, Inc. 2000 Stock Option Plan and the Rome Bancorp, Inc. 2006 Stock Option Plan have each been adopted by our Board of Directors and approved by our shareholders. The Option Plans provide for the grant, to certain officers, employees and outside directors of Rome Bancorp, Rome Savings or any affiliate approved by the administrative committee, of options to purchase common stock of Rome Bancorp (“Options”) at a stated price during a specified period or term. If the Option is not exercised during its term, it will expire. The Stock Option Plans currently have 359,003 options reserved that may be granted in future. Options vest on a change in control as defined in the Option Plans. The Option Plans are not subject to the Employee Retirement Income Security Act of 1974, as amended, and are not tax-qualified plans under the Internal Revenue Code.
There were no stock-based grants made to the named executive officers in the last fiscal year.
Stock Awards and Stock Option Grants Outstanding
The following tables set forth information regarding stock awards, stock options and similar equity compensation outstanding at December 31, 2010, whether granted in 2010 or earlier, including awards that have been transferred other than for value.
OUTSTANDING EQUITY AWARDS AT FISCAL YEAR-END TABLE
|
|
|
|
|
|
|
|
|
|
|
|
|
|
|
|
|
|
|
|
|
|
|
|
Option Awards |
|
Stock Awards |
|
||||||||||||||
|
|
|
|
|
|
|
||||||||||||||
|
Name |
|
Number of |
|
Number of |
|
Option |
|
Option |
|
Number of |
|
Market Value |
|
||||||
|
|
|
|
|
|
|
|
|
|
|||||||||||
|
|
|
|
|
|
(#) |
|
($)(1) |
|
|||||||||||
|
|
|
|
|
|
|
|
|
|
|
|
|
|
|
||||||
|
Charles M. Sprock |
|
|
118,000 |
|
|
29,500 |
(2) |
|
12.84 |
|
|
5/24/2016 |
|
|
11,800 |
(2) |
|
141,836 |
|
|
|
|
|
|
|
|
|
|
|
|
|
|
|
|
|
|
|
|
|
|
|
David C. Nolan |
|
|
47,200 |
|
|
11,800 |
(2) |
|
12.84 |
|
|
5/24/2016 |
|
|
4,720 |
(2) |
|
56,734 |
|
|
|
|
|
|
|
|
|
|
(1) |
Market value is calculated on the basis of $12.02 per share, which is the closing sales price for our common stock on December 31, 2010. |
|
|
(2) |
Vest in 20% installments per year with first installment vesting on May 24, 2007 and each anniversary thereafter. Options vest on a change in control as defined in the plans. |
|
Pension Benefits
Pension Plan. Rome Savings maintains a tax-qualified pension plan that covers substantially all employees who are age 21 or older and have at least one year of service. Rome Savings froze benefits under this tax-qualified pension plan as of December 2002. Rome Savings continues to maintain this plan to provide benefits to those individuals who were participants and had accrued a benefit prior to December 2002.
99
Other Benefits
Employee Stock Ownership Plan. This plan is a tax-qualified plan that covers substantially all employees who have at least one year of service and are age 21 or older. Rome Bancorp has lent this plan enough money to purchase 232,309 shares that are currently unallocated.
Although contributions to this plan are discretionary, Rome Savings intends to contribute enough money each year to make the required principal and interest payments on the loans from Rome Bancorp. The plan has pledged the shares as collateral for the loans and is holding them in a suspense account.
The plan will release a portion of the pledged shares annually, allocating the shares released each year among the accounts of participants in proportion to their salary for the year. For example, if a participant’s salary for a year represents 1% of the total salaries of all participants for the year, the plan would allocate to that participant 1% of the shares released for the year. Participants direct the voting of shares allocated to their accounts. Shares in the suspense account will usually be voted in a way that mirrors the votes which participants cast for shares in their individual accounts. On a change in control as defined in the ESOP, all amounts are vested, the loan under the ESOP will repaid from the proceeds of unallocated shares, the remaining unallocated shares will be allocated to participants in the ESOP and the ESOP is terminated..
Benefit Restoration Plan. Rome Bancorp has also adopted a Benefit Restoration Plan for Mr. Sprock. This plan provides Mr. Sprock with the benefits that would otherwise be due to him as a participant in the 401(k) plan and the employee stock ownership plan if such benefits were not limited by certain provisions of the Internal Revenue Code. At the closing date of the Merger, the Benefit Restoration Plan will be terminated and Mr. Sprock will be entitled to a cash lump sum payment equal to $358,560, subject to applicable withholding. Deferred Compensation Plan. Rome Savings has established the Directors’ Deferred Compensation Plan of Rome Bancorp, Inc. for the benefit of non-employee directors. Under the Directors’ Deferred Compensation Plan, each non-employee director may make an annual election to defer receipt of all or a portion of his or her director fees received from Rome Bancorp and Rome Savings. The deferred amounts are allocated to a deferral account and credited with interest at an annual rate equal to the rate on the highest yielding one-year certificate of deposit issued by Rome Savings during the year or according to the investment return of other assets as may be selected by the Board of Directors.
The Directors’ Deferred Compensation Plan is an unfunded, non-qualified plan that provides for distribution of the amounts deferred to participants or their designated beneficiaries upon the occurrence of certain events such as death, retirement, disability or termination of employment (as those terms are defined in the Directors’ Deferred Compensation Plan). We have established an irrevocable “grantor trust” to hold assets for the payment of benefits under the Directors’ Deferred Compensation Plan. The assets of the trust are considered to be part of the general assets of Rome Savings and will be subject to the claims of its general creditors. Earnings on the trust’s assets will be taxable to Rome Savings. At the closing date of the Merger, the Directors’ Deferred Compensation Plan will be terminated and payments will be made to directors from the trust.
Termination and Change in Control Benefits
Employment Agreements. Rome Bancorp and Rome Savings have each entered into an employment agreement with Charles M. Sprock to secure his services as Chairman, President and Chief Executive Officer. The employment agreement with Rome Bancorp has a three-year term that will be automatically extended on a daily basis so that the remaining term will always be three years unless written notice of non-renewal is given by the Board of Directors of Rome Bancorp or Mr. Sprock. The employment agreement with Rome Savings also has a three-year term which may be extended by the Board in the absence of an objection by Mr. Sprock for an additional year upon the anniversary date of the agreement so that the remaining unexpired term will be three years. These agreements provide for a minimum annual salary of $275,000, and participation on generally applicable terms and conditions in other compensation and fringe benefit plans. They also guarantee customary
100
corporate indemnification and errors and omissions insurance coverage throughout the employment term and for six years after termination.
Rome Bancorp and Rome Savings may terminate Mr. Sprock’s employment, and he may resign, at any time with or without cause. However, in the event of termination by Rome Bancorp or Rome Savings during the term without cause, Rome Bancorp and Rome Savings will owe Mr. Sprock severance benefits generally equal to the value of the cash compensation and fringe benefits that he would have received if he had continued working for an additional three years. In particular, Mr. Sprock would be entitled to: (i) a lump sum payment equal to the present value of the amount he would have earned in salary had he continued working an additional three years, and (ii) a lump sum payment equal to the present value of the additional contributions or benefits that he would have earned under the Rome Savings pension plan, 401(k) plan, and ESOP had he continued to work an additional three years. The employment agreements also provide for the cash out of any stock options, stock appreciation rights, or restricted stock as if Mr. Sprock were fully vested at the time of his termination and the continuation of coverage under the life, health, and disability insurance plans of Rome Savings or Rome Bancorp for an additional three years. The same severance benefits would be payable if he resigns during the term following: (i) a loss of title, office or membership on the Board of Directors, (ii) a material reduction in duties, functions, or responsibilities, (iii) the involuntary relocation of Mr. Sprock’s principal place of employment to a location over 50 miles in distance from Rome Savings’ principal office in Rome, New York, or (iv) any other material breach of contract by Rome Bancorp that is not cured within 30 days. Mr. Sprock may resign for any reason following a change in control and collect severance benefits as if he had been discharged without cause. The employment agreements also provide certain uninsured death and disability benefits.
Under the employment agreements, Mr. Sprock has agreed that in the event his employment terminates, either voluntarily or involuntarily, under circumstances in which he is not entitled to severance benefits, he will not compete with Rome Savings or Rome Bancorp or take a position with any of its competitors within Oneida County, New York for a period of one year following termination.
If Rome Bancorp or Rome Savings experiences a change in ownership, a change in effective ownership or control or a change in the ownership of a substantial portion of their assets as contemplated by section 280G of the Internal Revenue Code, a portion of any severance payments under the employment agreement might constitute an “excess parachute payment” under current federal tax laws. Any excess parachute payment would be subject to a 20% federal excise tax payable by the executive. Neither Rome Savings nor Rome Bancorp could claim a federal income tax deduction for an excess parachute payment. The employment agreement with Rome Bancorp requires Rome Bancorp to indemnify Mr. Sprock against the financial effects of such an excise tax.
Contemporaneously with the execution of the Merger Agreement, Berkshire, Berkshire Bank, Rome Bancorp and Rome Savings entered into a settlement agreement (“Settlement Agreement”) with Mr. Sprock. In accordance with Mr. Sprock’s Settlement Agreement, at the closing date of the merger, Mr. Sprock’s employment agreements will be terminated and he will be entitled to a cash lump sum payment from Rome Bancorp equal to $1,025,067, in lieu of the payment due under the employment agreements. However, because Mr. Sprock is considered a “specified employee” under Section 409A of the Internal Revenue Code, such payment cannot be made to him until six months following his “separation from service” (as defined in Internal Revenue Code Section 409A) with Rome Bancorp or its successor, Berkshire. Accordingly, the Settlement Agreement provides for the cash severance payment to be held in a rabbi trust for the benefit of Mr. Sprock and invested in investment-grade fixed-income securities, mutual funds or other pooled investment vehicles. The cash severance payment, as adjusted for investment experience, will be distributed on the first day of the seventh month following Mr. Sprock’s separation from service, subject to applicable income withholding taxes.
Berkshire and Berkshire Bank have entered into a Non-Competition and Consulting Agreement with Mr. Sprock pursuant to which Mr. Sprock will perform consulting services as a liaison to The Rome Savings Bank Foundation for a period of six months following the merger. In addition, Mr. Sprock will agree not to compete with Berkshire and Berkshire Bank for a period of eighteen months following the merger for the benefit of any business within 25 miles of any office of Berkshire or Berkshire Bank or any subsidiary. During such eighteen month period, Mr. Sprock has also agreed not to solicit or offer employment to any
101
employee of Berkshire or Berkshire Bank or any of their subsidiaries or affiliates that would cause such person(s) to terminate employment and accept employment with or provide services to any business that competes with Berkshire or Berkshire Bank within 25 miles of any office of Berkshire or Berkshire Bank or any subsidiary. In exchange for the consulting services and the agreement not to compete or solicit, Berkshire and Berkshire Bank have agreed to pay Mr. Sprock $225,000, payable in monthly installments over the consulting period.
Change of Control Agreement. Rome Savings has entered into a three-year change of control agreement with Mr. David C. Nolan and into two-year change of control agreements with four other officers of Rome Savings and a one-year change in control agreement with one other officer of Rome Savings. The term of these agreements is for three years for Mr. Nolan and for one or two years for the other officers with annual one-year extensions. Generally, Rome Savings may terminate the employment of any officer covered by these agreements, with or without cause, at any time prior to a change of control without obligation for severance benefits. Rome Savings would pay severance benefits if the officer is terminated without cause within 12 months following a change of control (as such term is defined in the agreements) or if the officer resigns within 12 months after a change of control following a loss of title, office or membership on the Board of Directors, material reduction in duties, functions, compensation or responsibilities, or involuntary relocation of his or her principal place of employment to a location over 30 miles from Rome, New York. The severance benefits would generally be equal to the compensation reflected in the officer’s salary and bonus earned for the year prior to the year in which the change of control occurs multiplied by three in the case of Mr. Nolan and one or two in the case of the other officers.
If Rome Savings or Rome Bancorp experiences a change in ownership, a change in effective ownership or control or a change in the ownership of a substantial portion of their assets as contemplated by section 280G of the Internal Revenue Code, a portion of any severance payments under the change of control agreements might constitute an “excess parachute payment” under current federal tax laws. Any excess parachute payment would be subject to a federal excise tax payable by the officer and would be non-deductible by Rome Savings and Rome Bancorp for federal income tax purposes. The change of control agreements do not provide a tax indemnity for such amounts.
Rome Bancorp provides additional benefits, not included in the previous tables, to the named executive officers in the event of retirement or termination of employment in certain circumstances and in the event of a change in control.
Contemporaneously with the execution of the Merger Agreement, Berkshire, Berkshire Bank, Rome Bancorp and Rome Savings entered into settlement agreements (“Settlement Agreements”) with Mr. Nolan and five other senior officers of the Rome Bancorp and Rome Savings in order to quantify and settle the benefits owed to the executives under the Change of Control Agreements. In accordance with their respective Settlement Agreements, the change in control agreements for Mr. Nolan and five other senior officers of Rome Savings will be terminated, effective as of the closing date of the Merger, and in lieu of any payments or benefits under such change in control agreements, the executives will be entitled to the payments set forth in the Settlement Agreements on the earlier of the date of executive’s termination of employment by Berkshire, Berkshire Bank, Rome Bancorp or Rome Savings or 90 days after the closing date at which time, the executive’s employment will terminate. Notwithstanding the foregoing, an executive who is terminated for cause will not be entitled to any payment under either the change in control agreement or Settlement Agreement. For this purpose, cause will be defined as personal dishonesty, willful misconduct, breach of fiduciary duty involving personal profit, intentional failure to perform stated duties, willful violation of any law, rule or regulation (other than traffic violations or similar offenses) or a final cease and desist order and will be determined in the good faith and sole discretion of Mr. Sprock. Rome Savings or Berkshire Bank will pay lump sum cash severance payments to Mr. Nolan in the amount of $408,018, less tax withholding, and to the other five senior officers who are entitled to such payments under the Settlement Agreements an aggregate amount of $737,714, less tax withholding.
During the period prior to their termination of employment, the cash severance payment will be held in a
102
rabbi trust for the benefit of each officer and invested in investment-grade fixed-income securities, mutual funds or other pooled investment vehicles. Upon termination of employment, the cash severance payment, as adjusted for investment experience and subject to applicable withholding tax, will be distributed to the officer. In addition, for the period that each executive continues in the employment of Berkshire and Berkshire Bank following the closing date, such officer’s base salary will be increased to two times the officer’s current base salary.
|
|
|
|
SECURITY OWNERSHIP OF CERTAIN BENEFICIAL OWNERS AND MANAGEMENT AND RELATED STOCKHOLDER MATTERS |
Principal Shareholders of Rome Bancorp
The following table shows certain information for persons who we know “beneficially owned” 5% or more of our common stock as of December 31, 2010. In general, beneficial ownership includes those shares over which a person has voting or investment power. In this proxy statement, “voting power” is the power to vote or direct the voting of shares, and “investment power” includes the power to dispose or direct the disposition of shares. Beneficial ownership also includes the number of shares that a person has the right to acquire within 60 days (such as through the exercise of stock options) after December 31, 2010. We obtained the information provided in the following table from filings with the SEC and with Rome Bancorp.
|
|
|
|
|
|
|
|
|
|
Name and Address of |
|
Amount and Nature of |
|
Percent(1) |
|
||
|
|
|
|
|
|
|
||
|
Employee
Stock Ownership Plan Trust of Rome Bancorp, Inc. |
|
689,488 |
(2) |
|
10.17 |
% |
|
|
|
|||||||
|
Dimensional
Fund Advisors LP |
|
460,673 |
(3) |
|
6.80 |
% |
|
|
|
|||||||
|
Charles M.
Sprock, Chairman, CEO & President |
|
438,592 |
(4) |
|
6.47 |
% |
|
|
|
|||||||
|
Water Island
Capital LLC |
|
417,872 |
(5) |
|
6.17 |
|
|
|
|
|
|
|
|
|
|
||
|
(1) |
Percentages with respect to each person or group of persons have been calculated based upon 6,777,551 shares of Rome Bancorp common stock, the number of shares outstanding as of December 31, 2010. |
||
|
(2) |
The ESOP is administered by an ESOP Committee (“ESOP Committee”) and its assets are held in trust by a trustee (“Plan Trustee”). The number of shares listed as beneficially owned represents the entire number of shares of Rome Bancorp common stock held by RSGroup Trust Company, as Plan Trustee, as of December 31, 2010. As of December 31, 2010, 457,179 of such shares of Rome Bancorp common stock had been allocated to individual accounts established for participating employees and their beneficiaries, and 232,309 of such shares were held, unallocated, for allocation in future years. In general, participating employees and their beneficiaries have the power and authority to direct the voting of shares of Rome Bancorp common stock allocated to their individual accounts. Such allocated shares are, therefore, not included as shares over which the reporting person has sole or shared voting power. The reporting person, through the Plan Trustee, has shared voting power over unallocated Rome Bancorp common stock. Any unallocated Rome Bancorp common stock is generally required to be voted by the Plan Trustee in the same proportion as Rome Bancorp common stock which has been allocated to participants is directed to be voted. The ESOP, through the Plan Trustee (who is instructed by the ESOP Committee) shares dispositive power over all unallocated common stock held by the reporting person. The ESOP, |
||
103
|
|
|
|
|
|
|
acting through the Plan Trustee (who is instructed by the ESOP Committee) shares dispositive power over allocated Rome Bancorp common stock with participating employees and their beneficiaries, who have the right to determine whether Rome Bancorp common stock allocated to their respective accounts will be tendered in response to a tender offer but otherwise have no dispositive power. Any unallocated Rome Bancorp common stock is generally required to be tendered by the Plan Trustee in the same proportion as Rome Bancorp common stock which has been allocated to Participants is directed to be tendered. In limited circumstances, ERISA may confer upon the Plan Trustee the power and duty to control the voting and tendering of Rome Bancorp common stock allocated to the accounts of participating employees and beneficiaries who fail to exercise their voting and/or tender rights. The ESOP disclaims voting power with respect to such allocated Rome Bancorp common stock. |
||
|
(3) |
Based on a Schedule 13G/A dated December 31, 2010 and filed with the SEC on February 11, 2011 by Dimensional Fund Advisors LP. Dimensional Fund Advisors LP is an investment advisor to four investment companies registered under the Investment Company Act of 1940, and serves as investment manager to certain other commingled group trusts and separate accounts. In its role as investment advisor or manager, Dimensional Fund Advisors LP possesses investment and/or voting power over the shares owned by the investment companies, the trusts and the accounts. |
||
|
(4) |
Details of Mr. Sprock’s beneficial ownership are detailed on the Security Ownership of Management table, on the following page of this document. |
||
|
(5) |
Based on a Schedule 13G dated December 31, 2010 and filed with the SEC on February 9, 2011 by Water Island Capital LLC. Water Island Capital LLC is an investment advisor registered under the Investment Company Act of 1940. |
||
Security Ownership of Management
The following table shows the number of shares of Rome Bancorp’s common stock beneficially owned by each director and executive officer and all directors and executive officers of Rome Bancorp as a group, as of December 31, 2010. Except as otherwise indicated, each person and each group shown in the table has sole voting and investment power with respect to the shares of common stock listed next to their name. See “Principal Shareholders of Rome Bancorp” for a definition of “beneficial ownership.”
|
|
|
|
|
|
|
|
|
|
|
|
Name |
|
Position with Rome |
|
Amount and Nature of |
|
Percent of |
|
||
|
|
|
|
|
|
|
|
|
||
|
|
|
|
|
|
|
|
|
|
|
|
Bruce R. Engelbert (4) |
|
Director |
|
126,565 |
|
|
1.87 |
% |
|
|
|
|
|
|
|
|
|
|
|
|
|
David C. Grow (5) |
|
Director |
|
128,434 |
|
|
1.89 |
% |
|
|
|
|
|
|
|
|
|
|
|
|
|
Kirk B. Hinman (6) |
|
Director |
|
326,123 |
|
|
4.81 |
% |
|
|
|
|
|
|
|
|
|
|
|
|
|
Dale A. Laval (7) |
|
Director |
|
39,900 |
|
|
* |
|
|
|
|
|
|
|
|
|
|
|
|
|
|
David C. Nolan (8) |
|
Executive Vice President and Chief Financial Officer |
|
194,748 |
|
|
2.87 |
% |
|
|
|
|
|
|
|
|
|
|
|
|
|
John A. Reinhardt (11) |
|
Director |
|
1,450 |
|
|
* |
|
|
|
|
|
|
|
|
|
|
|
|
|
|
Charles M. Sprock (9) |
|
Chairman, President and Chief Executive Officer |
|
438,592 |
|
|
6.47 |
% |
|
|
|
|
|
|
|
|
|
|
|
|
|
Michael J. Valentine |
|
Director |
|
156,296 |
|
|
2.31 |
% |
|
|
|
|
|
|
|
|
|
|
|
|
|
All directors and executive officers as a group (8 persons)(12) |
|
|
|
1,690,383 |
|
|
24.94 |
% |
|
|
|
|
|
|
|
|
|
||
|
* Less than one percent of the total outstanding shares of common stock. |
|||
|
(1) |
Titles are for both Rome Bancorp and Rome Savings. |
||
|
(2) |
Includes unvested restricted stock awards of 2,360 shares made to each outside director, with the exception of Mr. Reinhardt, under the Rome Bancorp, Inc. 2006 Recognition and Retention Plan. Includes unvested restricted stock awards of 11,800 and 4,720 shares awarded to Mr. Sprock and Mr. Nolan, respectively, under the Rome Bancorp, |
||
104
|
|
|
|
|
|
Inc. 2006 Recognition and Retention Plan. Each recipient of a restricted share award has sole voting power, but no investment power, over the common stock covered by the award. The restricted stock will vest at the rate of 20% per year on each anniversary date of the grant, with accelerated vesting upon death, disability, retirement or change in control. |
|
|
(3) |
Based on a total of 6,777,551 shares of Rome Bancorp’s common stock outstanding as of December 31, 2010. |
|
|
(4) |
Includes 20,784 shares held in Mr. Engelbert’s Individual Retirement and Deferred Compensation Accounts and 16,918 shares held by Mr. Engelbert’s spouse. |
|
|
(5) |
Includes 24,152 shares held in Mr. Grow’s Individual Retirement Account and 2,381 shares held individually by Mr. Grow’s spouse. |
|
|
(6) |
Includes 3,401 shares held in Mr. Hinman’s Individual Retirement Account; 111,016 shares held jointly with Mr. Hinman’s spouse; 5,401 shares held as custodian for a minor; 5,000 shares held by a trust over which Mr. Hinman exercises control; and 125,123 shares held by Rome Strip Steel Co., Inc. of which Mr. Hinman serves as President. |
|
|
(7) |
Includes 3,500 shares held in Mr. Laval’s Individual Retirement Account. |
|
|
(8) |
Includes 22,401 shares held in trust pursuant to the Employee Stock Ownership Plan that have been allocated as of December 31, 2010 over which Mr. Nolan has voting power, subject to the legal duties of the ESOP Trustee, but no investment power, except in limited circumstances. |
|
|
(9) |
Includes 8,118 shares held individually by Mr. Sprock’s spouse and 34,011 shares held in trust pursuant to the ESOP that have been allocated as of December 31, 2010 over which Mr. Sprock has voting power, subject to the legal duties of the ESOP trustee, but no investment power, except in limited circumstances. |
|
|
(10) |
Includes 23,600 shares of common stock that may be acquired by each outside director with the exception of Mr. Reinhardt, pursuant to vested options granted to them under the Rome Bancorp, Inc. 2006 Stock Option Plan. Includes 47,200 and 118,000 shares of common stock that may be acquired by Mr. Nolan and Mr. Sprock, respectively, pursuant to vested options granted to them under the Rome Bancorp, Inc. 2006 Stock Option Plan. |
|
|
(11) |
Includes 750 shares held jointly with Mr. Reinhardt’s spouse and 700 shares held in Mr. Reinhardt’s spouse’s IRA. |
|
|
(12) |
The number of shares for all executive officers and directors as a group of eight persons includes 232,309 shares held by the ESOP Trust that have not been allocated to eligible participants as of December 31, 2010, over which certain directors and executive officers may be deemed to have shared investment power, thereby causing such directors and executive officers to be beneficial owners of such shares. Each of such directors and executive officers disclaims beneficial ownership of such shares and accordingly, such shares are not attributed to them individually. The individual participants in the ESOP have shared voting power with the ESOP Trustee. |
|
The following table sets forth the aggregate information of our equity compensation plans in effect as of December 31, 2010.
|
|
|
|
|
|
|
|
|
|
|
|
|
|
|
|
|
|
|
Plan category |
|
Number of securities |
|
Weighted-average |
|
Number of securities remaining |
|
|||||||||
|
|
|
|
|
|
|
|
|
|||||||||
|
|
|
(a) |
|
(b) |
|
(c) |
|
|||||||||
|
Equity compensation plans approved by security holders |
|
|
|
354,000 |
|
|
|
$ |
12.84 |
|
|
|
|
490,061 |
|
|
|
|
|
|
|
|
|
|
|
|
|
|
|
|
|
|
|
|
|
Equity compensation plans not approved by security holders |
|
|
|
— |
|
|
|
|
— |
|
|
|
|
— |
|
|
|
|
|
|
|
|
|
|
|
|
|
|
|
|
|
|
|
|
|
|
|
|
|
|
|
|
|
|
|
|
|
|
|
|
|
|
|
Total |
|
|
|
354,000 |
|
|
|
$ |
12.84 |
|
|
|
|
490,061 |
|
|
|
|
|
|
|
|
|
|
|
|
|
|
|
|
|
|
|
|
|
|
|
|
|
|
|
|
|
(1) |
The number of securities remaining for future issuance under equity compensation plans includes: 136,061 shares available for issuance under the 2000 Stock Option Plan, 236,000 shares available for issuance under the 2006 Stock Option Plan and 118,000 shares available for issuance under the 2006 Recognition and Retention Plan. |
|
105
|
|
|
|
CERTAIN RELATIONSHIPS AND RELATED TRANSACTIONS, AND DIRECTOR INDEPENDENCE |
Certain Relationships and Related Party Transactions
Rome Savings has made loans or extended credit to its executive officers and directors and also to certain persons related to executive officers and directors. All such loans were made by Rome Savings in the ordinary course of business and were not made on more favorable terms, nor did they involve more than the normal risk of collectibility or present unfavorable features. Residential mortgage loans are made to employees who are not offered a reduced rate. The mortgage loans have the same underwriting terms that apply to non-employee borrowers. All loans made by Rome Savings to related persons and employees were made on substantially the same terms, including interest rates and collateral, as those prevailing at the time for comparable loans with persons not related to the lender.
Rome Bancorp’s authority to extend credit to directors, executive officers, and 10% shareholders, as well as entities controlled by such persons, is currently governed by the requirements of Sections 22(g) and 22(h) of the Federal Reserve Board and Regulation O of the Federal Reserve Board thereunder. Among other things, these provisions require that extensions of credit to insiders: (i) be made on terms that are substantially the same as, and follow credit underwriting procedures that are not less stringent than, those prevailing for comparable transactions with unaffiliated persons and that do not involve more than the normal risk of repayment or present other unfavorable features; and (ii) do not exceed certain limitations on the amount of credit extended to such persons, individually and in aggregate, which limits are based, in part, on the amount of Rome Bancorp’s capital. Rome Bancorp intends that any transactions in the future between Rome Bancorp and its executive officers, directors, holders of 10% or more of the shares of any class of its common stock and affiliates thereof, will contain terms no less favorable to Rome Bancorp than could have been obtained by it in arm’s-length negotiations with unaffiliated persons and will be approved by a majority of independent outside directors of Rome Bancorp not having any interest in the transaction.
We retain the services of the law firm of McMahon and Grow. David C. Grow, a director of Rome Bancorp and Rome Savings, is a partner of McMahon and Grow. For 2010, we paid $35,433 in legal fees to this law firm. All future affiliated transactions will be made or entered into on terms that are no less favorable to Rome Bancorp than those that can be obtained from an unaffiliated third party. All related party transactions are approved by the Audit Committee.
Board of Directors Independence
The Board of Directors is comprised of a majority of directors who qualify as independent according to NASDAQ market listing standards. Based upon the term “independent” as defined by NASDAQ Stock Market listing standards, the Board of Directors has determined that six of our seven directors (Bruce R. Engelbert, David C. Grow, Kirk B. Hinman, Dale A. Laval, John A. Reinhardt and Michael J. Valentine) are independent. All members of each the Audit Committee and Compensation Committee are independent directors.
106
Annually, the Board of Directors reviews the relationships that each director has with the Company as well as the criteria and standards for determining independence. Upon review the Board of Directors affirmatively determines which directors are considered independent
Charles M. Sprock is the only executive officer who served as a member of the Company’s Board of Directors. Mr. Sprock did not serve as a member of the Compensation Committee or similar board committee of another entity during 2010, which entity had an executive officer serving on the Board of Directors of Rome Bancorp or its Compensation Committee. Consequently, there are no interlocking relationships that might affect the determination of the compensation of executive officers of Rome Bancorp.
|
|
|
|
PRINCIPAL ACCOUNTING FEES AND SERVICES |
During the fiscal years ended December 31, 2010 and December 31, 2009, Rome Bancorp retained and paid Crowe Horwath LLP, its independent registered public accounting firm, to provide audit and other services. The following table displays the aggregate fees for professional audit services for the audit of the financial statements for the years ended December 31, 2010 and 2009 and fees billed for other services during those periods by our independent registered public accounting firm.
|
|
|
|
|
|
|
|
|
|
|
|
Audit Fees |
|
||||
|
|
|
|
|
|
|
||
|
|
|
2010 |
|
2009 |
|
||
|
|
|
|
|
|
|
||
|
Audit fees (1) |
|
$ |
174,405 |
|
$ |
160,000 |
|
|
Audit related-fees (2) |
|
|
14,110 |
|
|
— |
|
|
Tax fees (3) |
|
|
22,300 |
|
|
19,100 |
|
|
All other fees |
|
|
16,020 |
|
|
— |
|
|
|
|
|
|
|
|
|
|
|
Total |
|
$ |
226,835 |
|
$ |
179,100 |
|
|
|
|
|
|
|
|
|
|
|
|
|
|
|
|
|
(1) |
Audit fees consisted of audit work performed in the preparation of financial statements as well as work generally only the independent auditors can reasonably be expected to provide, such as statutory audits. |
|
(2) |
Audit related fees consist of fees for services that are reasonably related to the performance of the audit of the consolidated financial statements and are not reported under “Audit Fees.” This category includes fees related to the issuance of consents issued for inclusions of the audited financial statements in S-4 and 10-K filings. |
|
(3) |
Tax fees consisted of assistance with matters related to tax compliance and consulting. |
|
(4) |
Other fees include services related to strategic planning and acquisition activities. |
Audit Committee Preapproval Policy
The Audit Committee shall preapprove all auditing services and permitted non-audit services (including the fees and terms) to be performed for Rome Bancorp by its independent registered public accounting firm, subject to the de minimis exception for non-audit services described below which are approved by the Committee prior to completion of the audit.
Exception. The preapproval requirement set forth above, shall not be applicable with respect to non-audit services if:
|
|
|
|
• |
the aggregate amount of all such services provided constitutes no more than five percent of the total amount of revenues paid by Rome Bancorp to its independent registered public accounting firm during the fiscal year in which the services are provided; |
|
|
|
|
• |
such services were not recognized by Rome Bancorp at the time of the engagement to be non-audit services; and |
107
|
|
|
|
• |
such services are promptly brought to the attention of the Committee and approved prior to the completion of the audit by the Committee or by one or more members of the Committee who are members of the Board of Directors to whom authority to grant such approvals has been delegated by the Committee. |
Delegation. The Committee may delegate to one or more designated members of the Committee the authority to grant required preapprovals. The decisions of any member to whom authority is delegated under this paragraph to preapprove activities under this subsection shall be presented to the full Committee at its next scheduled meeting.
The Audit Committee preapproved all of the services performed by Crowe Horwath LLP pursuant to the policies outlined above.
|
|
|
|
EXHIBITS, FINANCIAL STATEMENTS |
|
|
|
|
(a) Documents filed as part of the report: |
|
|
|
|
|
|
Report of Independent Registered Accounting Firm |
|
|
Consolidated Balance Sheets at December 31, 2010 and 2009 |
|
|
Consolidated Statements of Operations for the years ended December 31, 2010, 2009 and 2008 |
|
|
Consolidated Statements of Stockholders’ Equity for the years ended December 31, 2010, 2009 and 2008 |
|
|
Consolidated Statements of Cash Flows for the years ended December 31, 2010, 2009 and 2008 |
(b) The following exhibits are either filed as part of this report or are incorporated herein by reference:
|
|
|
|
2.1 |
Amended and Restated Plan of Conversion and Agreement and Plan of Reorganization. (1) |
|
2.2 |
Agreement and Plan of Merger By and Between Berkshire Hills Bancorp, Inc. and Rome Bancorp, Inc. (9) |
|
3.1 |
Certificate of Incorporation of New Rome Bancorp, Inc. (1) |
|
3.2 |
Bylaws of New Rome Bancorp, Inc. (1) |
|
4.1 |
Form of Stock Certificate of New Rome Bancorp, Inc. (1) |
|
10.1 |
Form of Employee Stock Ownership Plan of Rome Bancorp, Inc. (2) |
|
10.2 |
Amendment No. 1 to Employee Stock Ownership Plan of Rome Bancorp, Inc. (1) |
|
10.3 |
Amendment No. 2 to Employee Stock Ownership Plan of Rome Bancorp, Inc. (1) |
|
10.4 |
Form of Executive Employment Agreement by and between Charles M. Sprock and Rome Bancorp, Inc. (2) |
|
10.5 |
Amended and restated form of One Year Change in Control Agreement by and among certain officers and Rome Bancorp, Inc. and The Rome Savings Bank. (8) |
|
10.6 |
Amended and restated form of Employment Agreement between New Rome Bancorp, Inc. and Charles M. Sprock. (8) |
|
10.7 |
Amended and Restated form of Employment Agreement between The Rome Savings Bank and Charles M. Sprock. (8) |
|
10.8 |
Rome Bancorp, Inc. 2000 Stock Option Plan. (3) |
|
10.9 |
Rome Bancorp, Inc. 2000 Recognition and Retention Plan. (3) |
|
10.10 |
Amended and Restated Benefit Restoration Plan of Rome Bancorp, Inc. (4) |
|
10.11 |
Amended and Restated Directors’ Deferred Compensation Plan of Rome Bancorp, Inc. (4) |
|
10.12 |
Loan Agreement by and between the Employee Stock Ownership Plan Trust of Rome Bancorp, Inc. and Rome Bancorp, Inc. (5) |
|
10.13 |
Amendment No. 3 to the Employee Stock Ownership Plan of Rome Bancorp, Inc. (6) |
|
10.14 |
Rome Bancorp, Inc. 2006 Stock Option Plan. (7) |
108
|
|
|
|
10.15 |
Rome Bancorp, inc. 2006 Recognition and Retention Plan. (7) |
|
10.16 |
Amendment No. 4 to the Employee Stock Ownership Plan of Rome Bancorp, Inc. |
|
10.17 |
Amendment to the Amended and Restated Directors’ Deferred Compensation Plan of Rome Bancorp, Inc. |
|
10.18 |
Amendment to the Amended and Restated Benefit Restoration Plan of Rome Bancorp, Inc. |
|
10.19 |
Settlement Agreement between Berkshire Hills Bancorp, Inc., Berkshire Bank, Rome Bancorp, Inc., The Rome Savings Bank and Charles M. Sprock. |
|
10.20 |
Settlement Agreement between Berkshire Hills Bancorp, Inc., Berkshire Bank, Rome Bancorp, Inc., The Rome Savings Bank and David C. Nolan. |
|
10.21 |
Non-Competition and Consulting Agreement between Berkshire Hills Bancorp, Inc., Berkshire Bank and Charles M. Sprock.14.1 |
|
14.1 |
Code of Conduct and Ethics. (7) |
|
21.1 |
Subsidiaries of the Company. (1) |
|
23.1 |
Consent of Crowe Horwath LLP. |
|
31.1 |
Rule 13a-14a/15d-14a Certifications. |
|
32.1 |
Section 1350 Certifications. |
|
|
|
|
|
|
|
(1) |
Incorporated by reference to Rome Bancorp, Inc.’s Form S-1 (Registration No. 333-121245), filed with the Commission on December 14, 2004, as amended. |
|
(2) |
Incorporated by reference to Rome Bancorp, Inc.’s Form SB-2 (Registration No. 333-80487), filed with the Commission on June 11, 1999, as amended. |
|
(3) |
Incorporated by reference to Rome Bancorp, Inc.’s Proxy Statement on Schedule 14A, filed with the Commission on April 5, 2000 and amended on April 2, 2001. |
|
(4) |
Incorporated by reference to Rome Bancorp, Inc.’s Form 8-K filed with the Commission on December 27, 2005. |
|
(5) |
Incorporated by reference to Rome Bancorp, Inc.’s Form 8-K filed with the Commission on March 29, 2005. |
|
(6) |
Incorporated by reference to Rome Bancorp, Inc.’s Form 8-K filed with the Commission on August 29, 2005. |
|
(7) |
Incorporated by reference to Rome Bancorp, Inc.’s Form S-8 filed with the commission on May 19, 2006, as amended. |
|
(8) |
Incorporated by reference to Rome Bancorp Inc.’s Form 8-K filed with the commission on December 3, 2007. |
|
(9) |
Incorporated by reference to Rome Bancorp, Inc.’s Proxy Statement on Schedule 14A, filed with the Commission on February 2, 2011. |
109
SIGNATURES
Pursuant to the requirements of Section 13 or 15(d) of the Securities Exchange Act of 1934, the registrant has duly caused this report to be signed on its behalf by the undersigned, thereunto duly authorized.
|
|
|
|
|
ROME BANCORP, INC. |
|
|
|
|
|
By: /s/Charles M. Sprock |
|
|
President, Chairman of the Board and |
|
|
Chief Executive Officer |
Pursuant to the requirements of Section 13 or 15(d) of the Securities Exchange Act of 1934, this report has been signed below by the following persons on behalf of the registrant and in the capacities and on the dates indicated.
|
|
|
|
|
|
|
Name |
|
Title |
|
Date |
|
|
|
|
|
|
|
/s/Charles M. Sprock |
|
Chairman of
the Board, |
|
March 18, 2011 |
|
|
|
|
|
|
|
Charles M. Sprock |
|
|
|
|
|
|
|
|
|
|
|
|
|
|
|
|
|
/s/David C. Nolan |
|
Executive
Vice-President |
|
March 18, 2011 |
|
|
|
|
|
|
|
David C. Nolan |
|
|
|
|
|
|
|
|
|
|
|
/s/Mary Faith Messenger |
|
Vice
President and |
|
March 18, 2011 |
|
|
|
|
|
|
|
|
|
|
|
|
|
|
|
|
|
|
|
|
|
|
|
|
|
/s/Bruce R. Engelbert |
|
Director |
|
March 18, 2011 |
|
|
|
|
|
|
|
Bruce R. Engelbert |
|
|
|
|
|
|
|
|
|
|
|
/s/David C. Grow |
|
Director |
|
March 18, 2011 |
|
|
|
|
|
|
|
David C. Grow |
|
|
|
|
|
|
|
|
|
|
|
/s/Kirk B. Hinman |
|
Director |
|
March 18, 2011 |
|
|
|
|
|
|
|
Kirk B. Hinman |
|
|
|
|
|
|
|
|
|
|
|
/s/Michael J. Valentine |
|
Director |
|
March 18, 2011 |
|
|
|
|
|
|
|
Michael J. Valentine |
|
|
|
|
|
|
|
|
|
|
|
/s/Dale A. Laval |
|
Director |
|
March 18, 2011 |
|
|
|
|
|
|
|
Dale A. Laval |
|
|
|
|
|
|
|
|
|
|
|
/s/John A. Reinhardt |
|
Director |
|
March 18, 2011 |
|
|
|
|
|
|
|
John A. Reinhardt |
|
|
|
|
110