Attached files
| file | filename |
|---|---|
| 8-K - FORM 8K BARCLAYS CONFERENCE - WEST PHARMACEUTICAL SERVICES INC | form8k.htm |

WEST PHARMACEUTICAL SERVICES OVERVIEW
Solutions for Injectable Drug Delivery NYSE:WST www.westpharma.com
Barclays Capital
2011 Global Healthcare Conference
Miami, FL March 16, 2011

Safe Harbor Statement
2
Cautionary Statement Under the Private Securities Litigation Reform Act of 1995
This presentation and any accompanying management commentary contain “forward-looking statements” as
that term is defined in the Private Securities Litigation Reform Act of 1995. Such statements include, but are
not limited to statements about expected financial results for 2011 and future years.
that term is defined in the Private Securities Litigation Reform Act of 1995. Such statements include, but are
not limited to statements about expected financial results for 2011 and future years.
Each of these estimates is based on preliminary information, and actual results could differ from these
preliminary estimates. We caution investors that the risk factors listed under “Cautionary Statement” in our
press releases, as well as those set forth under the caption "Risk Factors" in our most recent Annual Report
on Form 10-K as filed with the Securities and Exchange Commission and as revised or supplemented by our
quarterly reports on Form 10-Q, could cause our actual results to differ materially from those estimated or
predicted in the forward-looking statements. You should evaluate any statement in light of these important
factors. Except as required by law or regulation, we undertake no obligation to publicly update any forward-
looking statements, whether as a result of new information, future events, or otherwise.
Non-GAAP Financial Measures
Certain financial measures included in these presentation materials, and which may be referred to in
management’s discussion of the Company’s results and outlook, are Non-GAAP (Generally Accepted
Accounting Principles) financial measures. Please refer to the “Non-GAAP Financial Measures” and “Notes
to Non-GAAP Financial Measures” at the end of these materials for more information. Non-GAAP financial
measures should not be considered in isolation or as an alternative to such measures determined in
accordance with GAAP.

West is a globally diversified manufacturer of products consumed in the healthcare and
consumer markets.
consumer markets.
Every day over 80 million components manufactured by West, and our partner Daikyo, are
used to enhance the quality of healthcare worldwide.
used to enhance the quality of healthcare worldwide.
3
A Diverse, Stable Customer Base
Pharmaceutical/Biotech
Generic
Medical Device
4
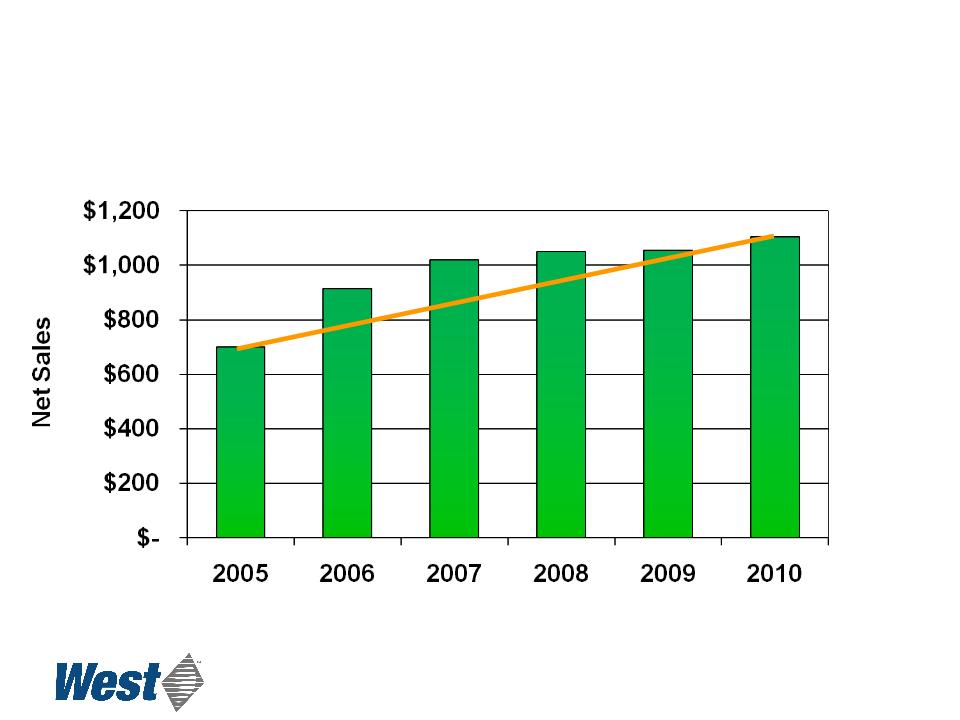
Sales
($ in millions)
($ in millions)
5
Compound annual growth rate: 8.9%

Summary 2010 Results
6
|
|
Three Months
Ended December 31
|
Year
Ended
December 31
|
||
|
2010
|
2009
|
2010
|
2009
|
|
|
|
|
|
|
|
|
Net Sales
|
$ 276.8
|
$ 293.4
|
$ 1,104.7
|
$ 1,055.7
|
|
Gross Profit
|
78.0
|
83.9
|
318.1
|
303.6
|
|
Reported Operating Profit
|
5.9
|
21.7
|
90.7
|
97.5
|
|
Adjusted Operating Profit (1)
|
20.6
|
32.0
|
104.8
|
105.0
|
|
Reported Diluted EPS
|
$ 0.18
|
$ 0.59
|
$ 1.89
|
$ 2.12
|
|
Adjusted Diluted EPS(1)
|
$ 0.42
|
$ 0.67
|
$ 2.10
|
$ 2.11
|
(1) See “Non-GAAP Financial Measures” and “Notes to Non-GAAP Financial Measures” (Slides 33 - 36)

2010 vs. 2009
Adjusted Diluted EPS
Adjusted Diluted EPS
7
|
2009 Adjusted Diluted EPS(1)
|
$ 2.11
|
|
|
|
|
Foreign Exchange
|
(0.17)
|
|
|
|
|
Lost H1N1 Sales
|
(0.16)
|
|
|
|
|
R&D
|
(0.09)
|
|
|
|
|
Other Operations
|
0.45
|
|
|
|
|
All Other
|
(0.04)
|
|
|
|
|
2010 Adjusted Diluted EPS(1)
|
$ 2.10
|
(1) See “Non-GAAP Financial Measures” and “Notes to Non-GAAP Financial Measures” (Slides 33 - 36)

Market Issues
• Asymmetric global economic recovery
– Europe, US, Japan remain sluggish
– China, India, Brazil stronger
– Continuing Fx, commodity price volatility
• More demanding regulatory environment
• Broader trends in Pharma/Device markets continue:
– Unknown impact of healthcare legislation
– Thin near term pipelines
– Pharma M&A - shift to large molecules
– Increased manufacturing outsourcing (India generic growth)
8

• Pharmaceutical Packaging Segment
– Demographics and increasing prevalence of chronic disease
– Biologics
– Growth in Emerging Markets
– Increased access to Healthcare
– Escalating quality expectations: “Zero Defects”
• Delivery Systems Segment
– Demand for combination products that promote safety, dosing accuracy,
ease of use, and deliver cost savings
ease of use, and deliver cost savings
– Drug product life cycle management
– Glass compatibility/breakage issues
What will Drive Future Growth?
9
|
Category
|
Key Customers
|
Projected
Growth |
|
Diabetes
|
|
> 10 %
|
|
Oncology
|
|
> 10 %
|
|
Vaccines
|
|
> 10 %
|
|
Autoimmune
|
|
> 8%
|
IMS April 2010 Report; Business Insights 2009; GBI Research 2009
10
Therapeutic Category Growth Drivers
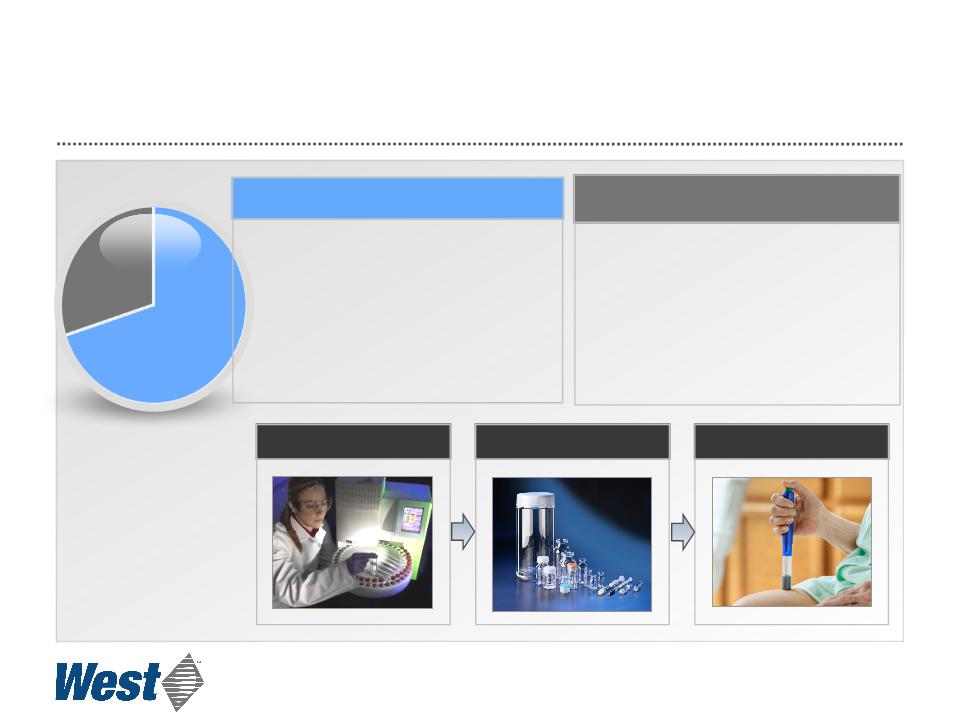
2010 Segment Reorganization
Packaging Systems
• Established leadership
• High market share
• Stable growth rate
Delivery Systems
• Proprietary devices
• Contract manufacturing
• High projected growth rate
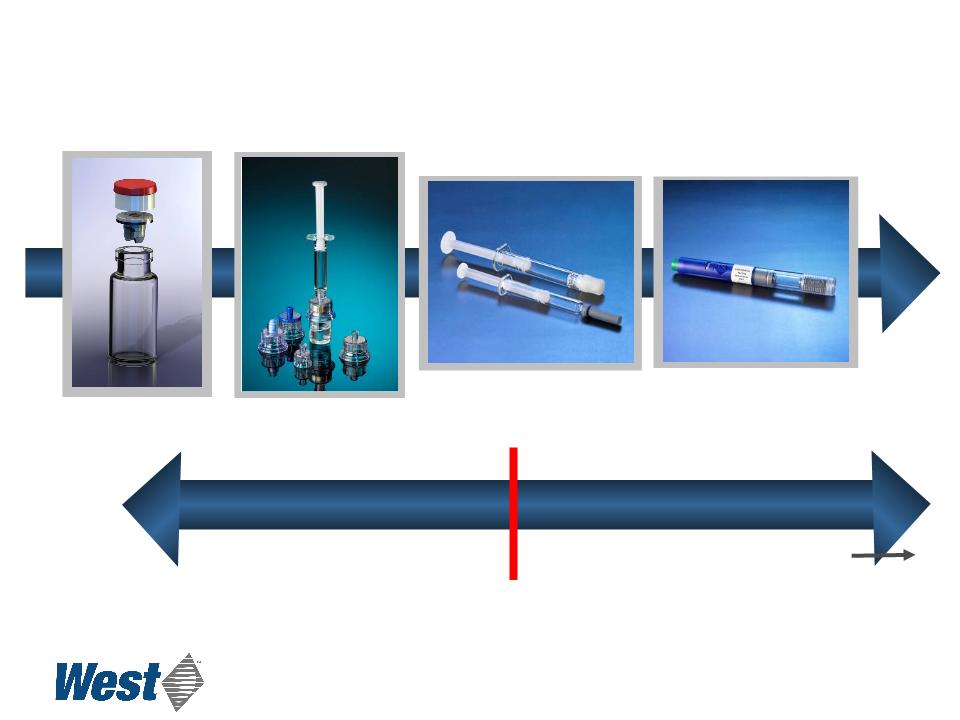
Development
Primary Package
Administration
11
$785M
$324M
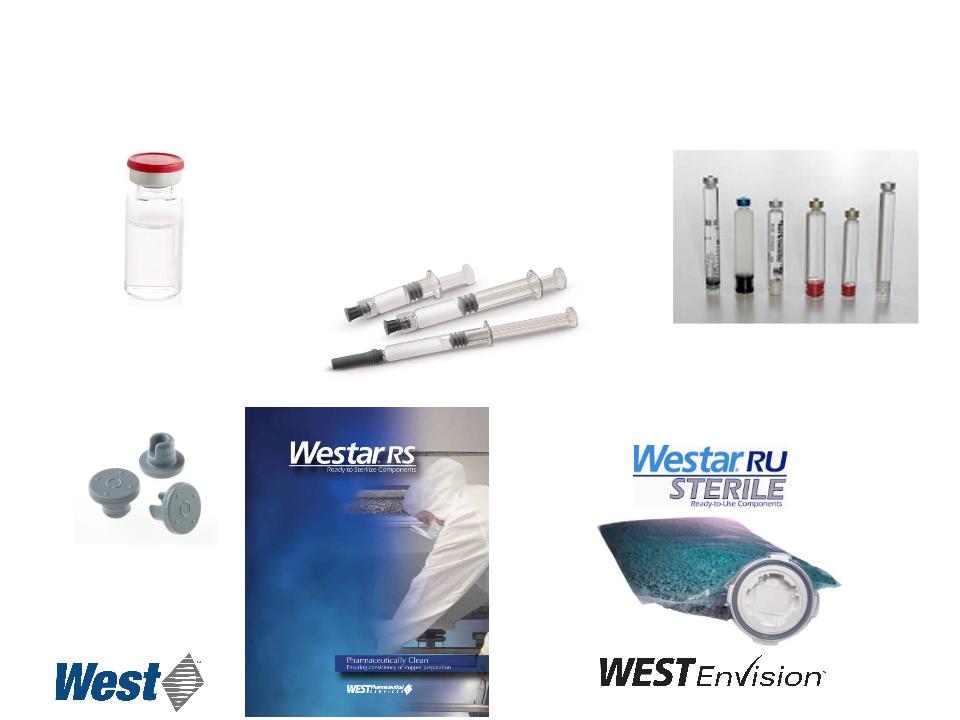
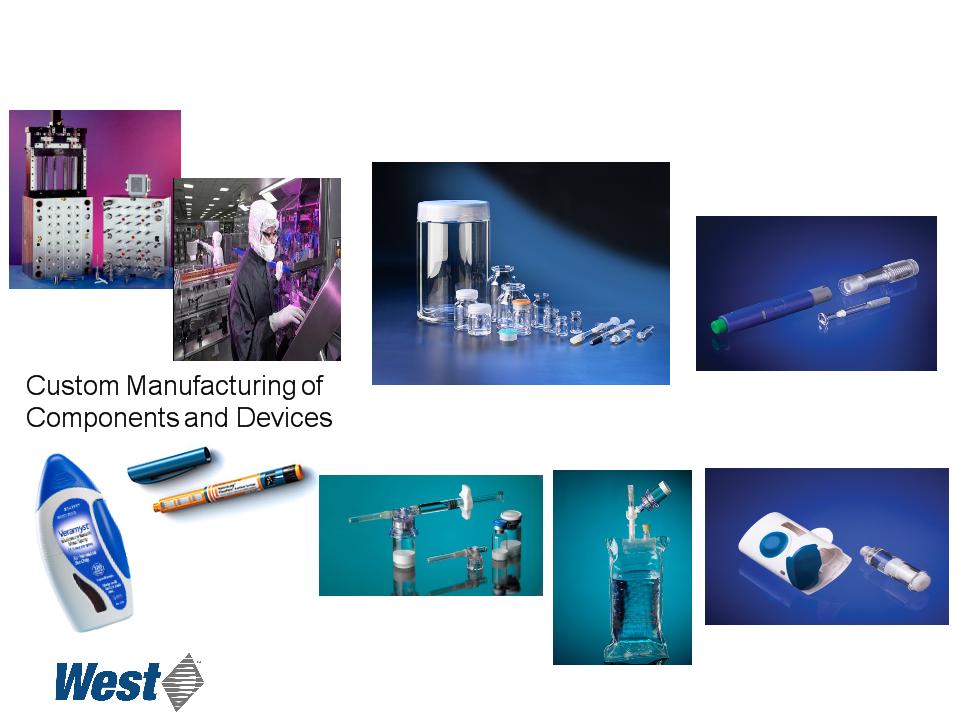
Pharmaceutical Packaging Systems
Packaging Components for Small Volume Parenterals
Packaging Components for Small Volume Parenterals
Plungers, Tip-caps, Needle
shields for Glass Syringes
shields for Glass Syringes
Plungers, lined-seals
for Glass Cartridges for
Pens
for Glass Cartridges for
Pens
Closures for
Glass Vials
Glass Vials
12

• Packaging Systems Segment
– Grow incremental value per unit
– Geographic expansion - capacity investments in Asia
– Improved operating efficiency: lean operations
– Strategic acquisitions and partnerships
Growth Strategy
13
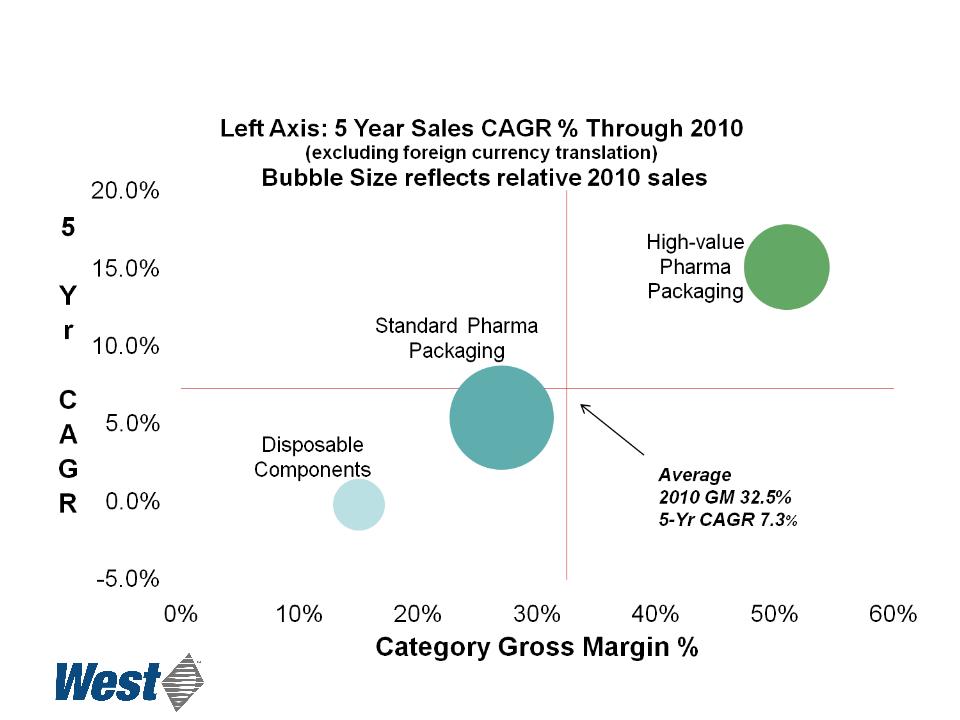
Faster Growth of High-Value Products
Pharmaceutical Packaging Systems
Pharmaceutical Packaging Systems
14
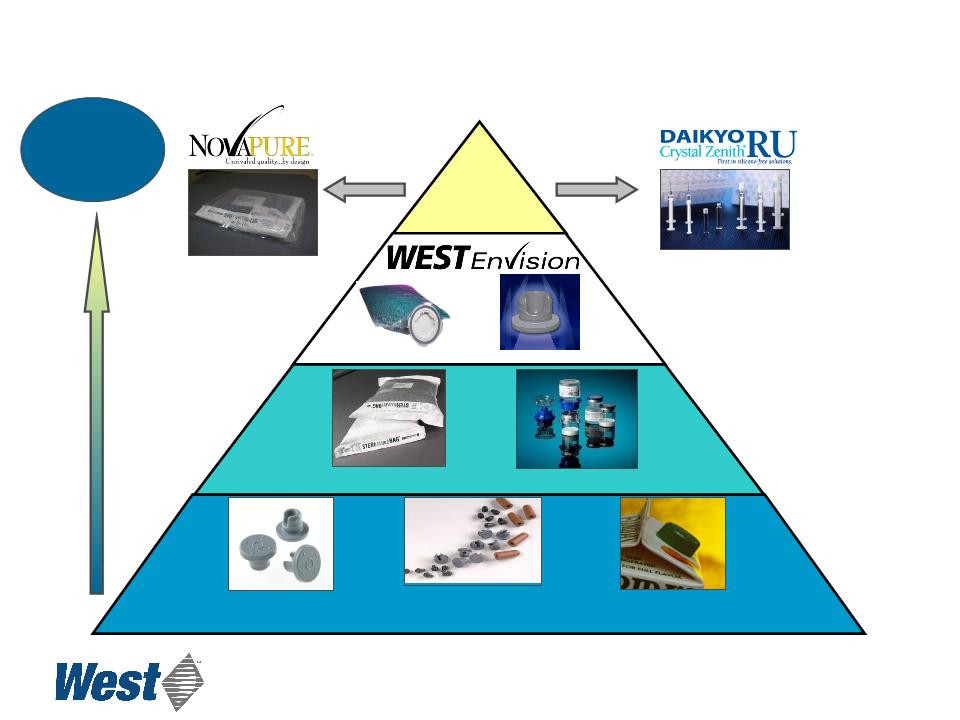
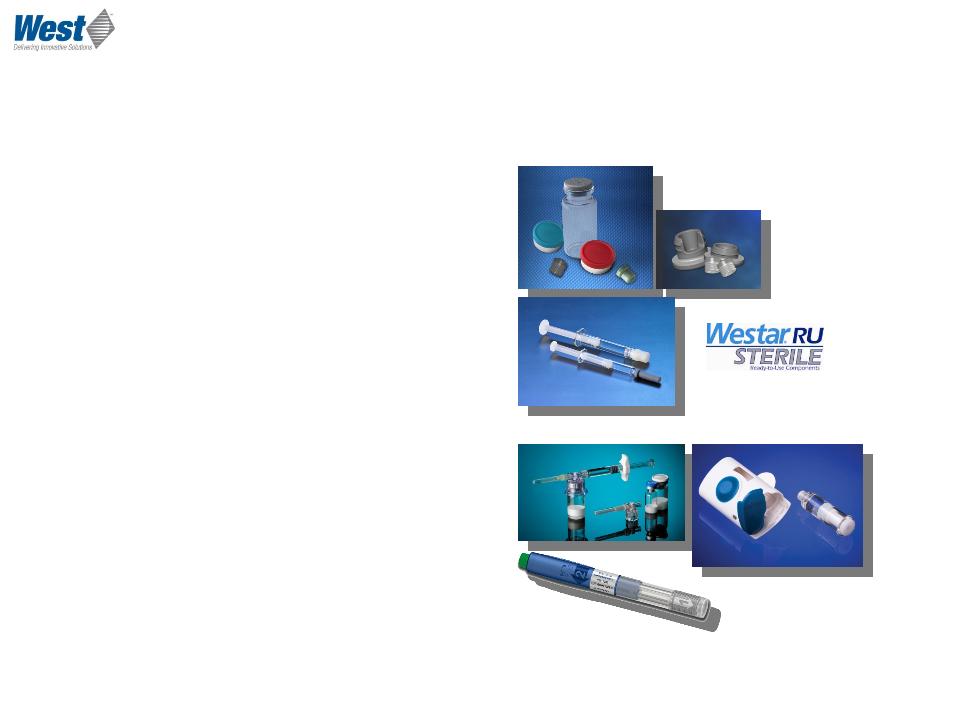
Value Proposition
Proprietary
Products
Products
Revenue and
Margin
Opportunity
Margin
Opportunity
Disposable Device
Components
Components
Westar® RS
Mix2Vial®
Westar® RU
Standard
Components
Components
Consumer
Products
Products
Packaging
Delivery
15
Ready Pack™ System
(Kitted RU Vials, stoppers & seals)
Utilizes West’s proprietary FluroTec®
technology
FluroTec® technology is licensed from Daikyo Seiko, Ltd.
16
CZ® Vials
Daikyo Resin CZ®
Utilizes Daikyo Crystal Zenith®
proprietary technology
proprietary technology
lyophilized vial
Mix2Vial®
Utilizes
Medimop’s
proprietary
technologies
Medimop’s
proprietary
technologies
serum vial
RU Seals
NovaPure™
Utilizes West’s
proprietary
proprietary
FluroTec®
technology
technology
Vial Adapters
Utilizes Medimop’s
proprietary
technologies
proprietary
technologies
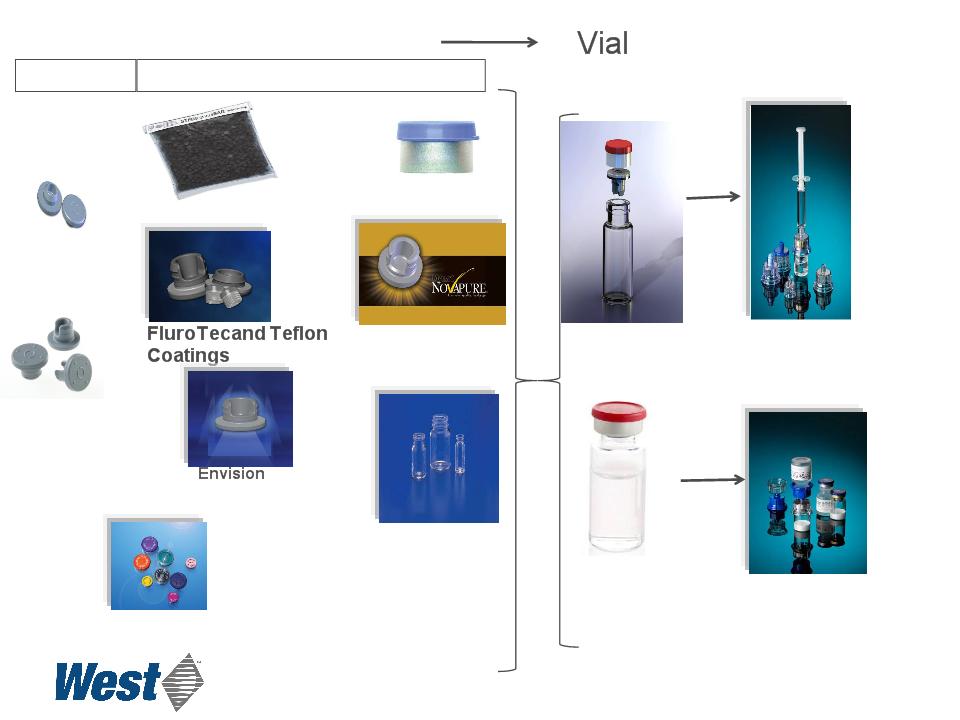
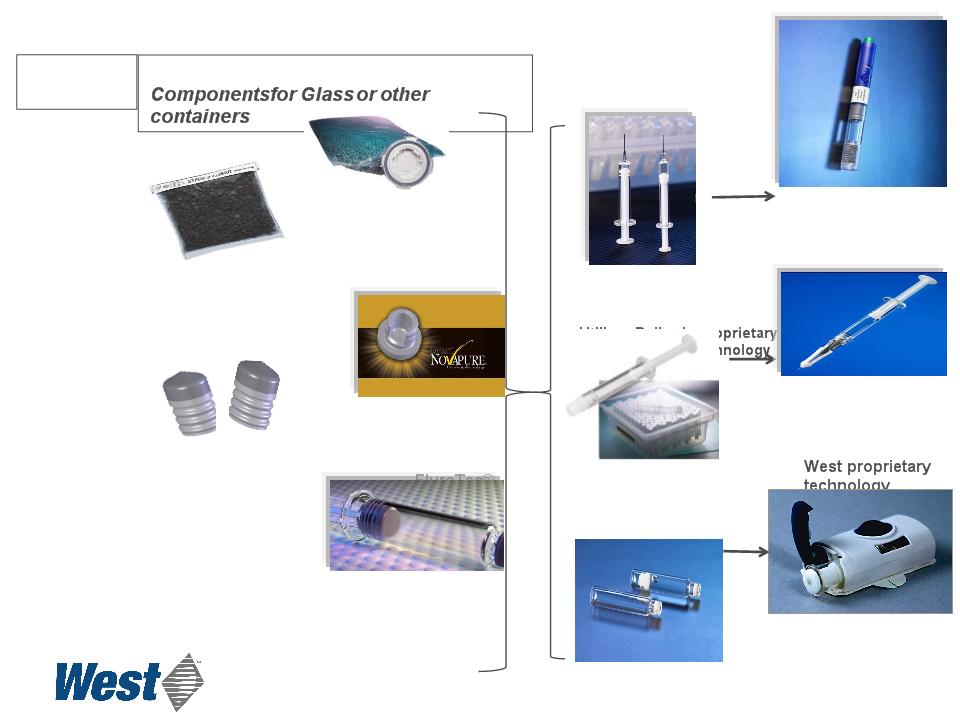
Formats
West Products for Drug Vials
West Reconstitution &
Fluid Transfer
Products
Products
Standard
Value - added features & processing
Spectra Seals
WestarRS®
Technically advanced,
automated vision
inspection system
Delivery Systems
West ConfiDose®
Auto-injector System
Auto-injector System
Daikyo Crystal Zenith®
Life-cycle Containment Solutions
Life-cycle Containment Solutions
West Electronic
Patch-injector
Patch-injector
17
Daikyo Crystal Zenith® is a registered trademark of Daikyo, Seiko, Ltd.
West MixJect® and
Vial2Bag®
Vial2Bag®
Proprietary Components, Devices and Systems

• Delivery Systems Segment
– Leverage life cycle management opportunities
– Realize commercial potential of CZ
– Develop new platform opportunities - combination products
– Custom solution provider
Growth Strategy
18

Drivers for Pharma Industry Life Cycle
Management
Management
• To maximize the value of the drug development program
– Extend the value of the molecule as an asset
• Delivery systems as drug formulation life cycle management
– Generate more revenue per dose
• To expand or retain market share in a competitive
environment
environment
– Reduce preparation and administration time
– Improve patient compliance
– Ease of use for self administration
– Accurate delivery of dosage
19
Pharma Industry Drug Life Cycle Management
Phase I
Phase II
Phase III
Post-Market Life Cycle Management
8 - 10 years
2 - 3 years
2 - 3 years
Regulatory
Approval
Discovery
20
FluroTec® technology is licensed from Daikyo Seiko, Ltd.
21
NovaPure™
Utilizes West’s
proprietary
proprietary
Pre-fillable
Formats
(shown in CZ®)
West Products for Pre-fillable Formats
Standard
Value - added features & processing
WestarRS®
Plungers
Tip Caps
Needle
Shields
Shields
Cartridge
Plungers
Plungers
Cartridge
seals
seals
PFS Plungers
Utilizes West’s
proprietary
proprietary
FluroTec®
technology
technology
RU CZ® Insert Needle
Syringe
Syringe
Westar® RU
Plungers in Port
Bag
Plungers in Port
Bag
Utilizes West’s
proprietary FluroTec®
technology
proprietary FluroTec®
technology
CZ® Luer-
lock syringe
lock syringe
NovaGuard™
Passive Safety
Needle
Passive Safety
Needle
ConfiDose™ Auto
Injector
Injector
West’proprietary
technology
technology
Electronic
Patch
Injector
Patch
Injector
West proprietary
technology
technology
Westar® RU
State of the art ready-to-
use syringe plungers
use syringe plungers
CZ® Cartidges
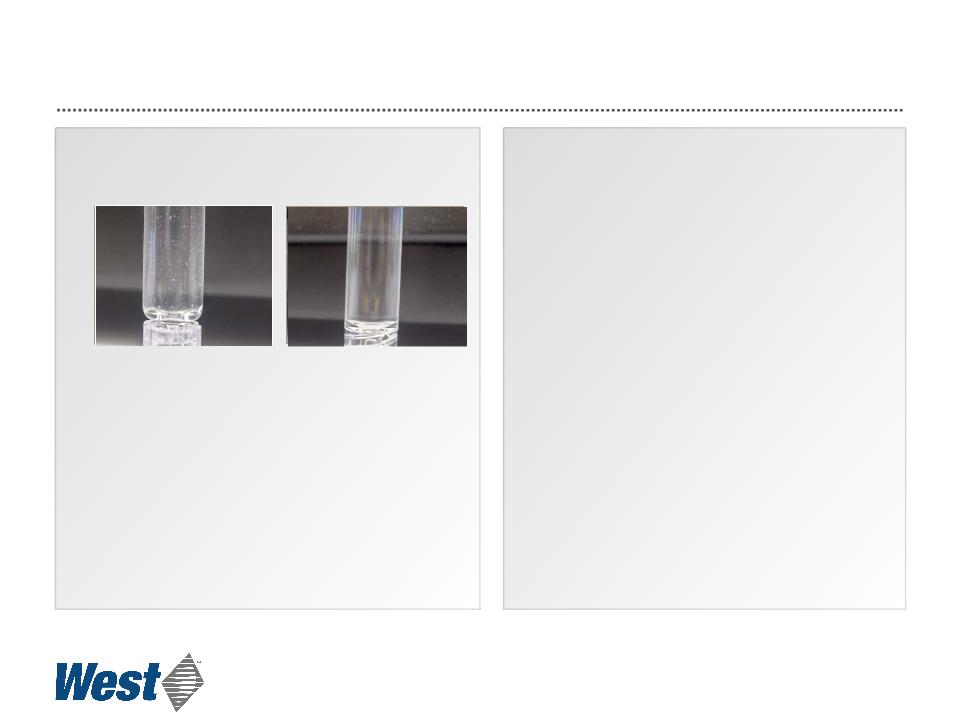
Concerns With Glass Syringes
• Interaction with sensitive biologics
• Protein aggregation (silicone oil)
• Residual chemicals (tungsten, glue)
• Glass flakes
• Breakage
• In process
• Within auto-injector systems
• Recent FDA recalls
• Dimensional variation
• Breakage in auto-injector systems
• Designed for manual injection
• Variable silicone distribution
• Amount of silicone coverage
• Age of barrel
• Inconsistent break force and
sustaining-force
sustaining-force
• Quality
• Cosmetic defects
• High levels of inspection necessary
• High “cost of quality”
Siliconized Glass Syringe
Crystal Zenith Syringe
22
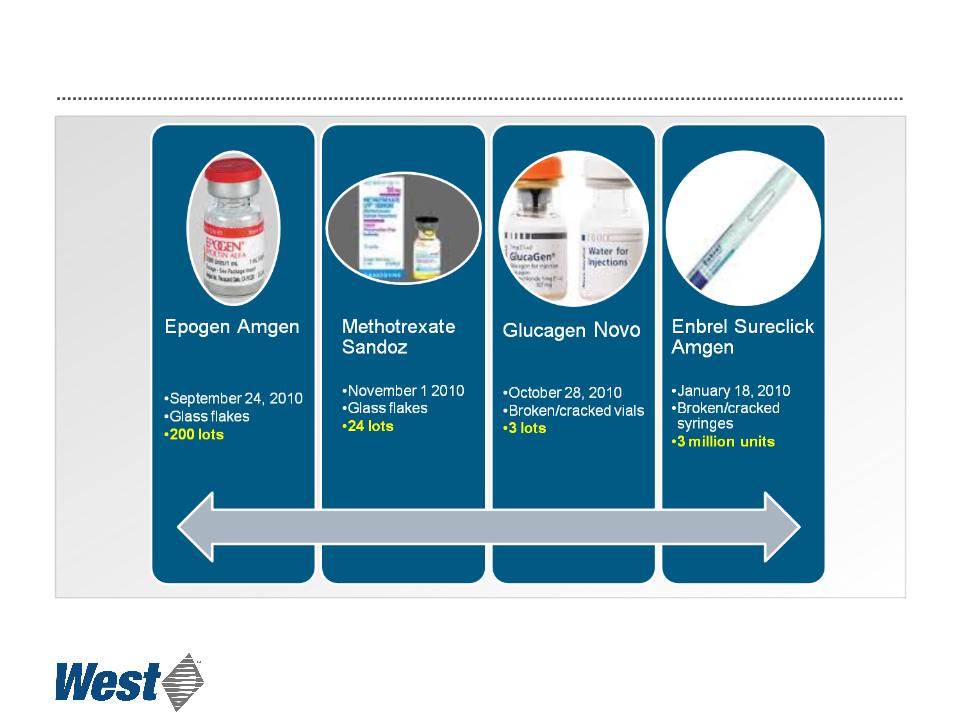
2010 Glass-related Recalls
23
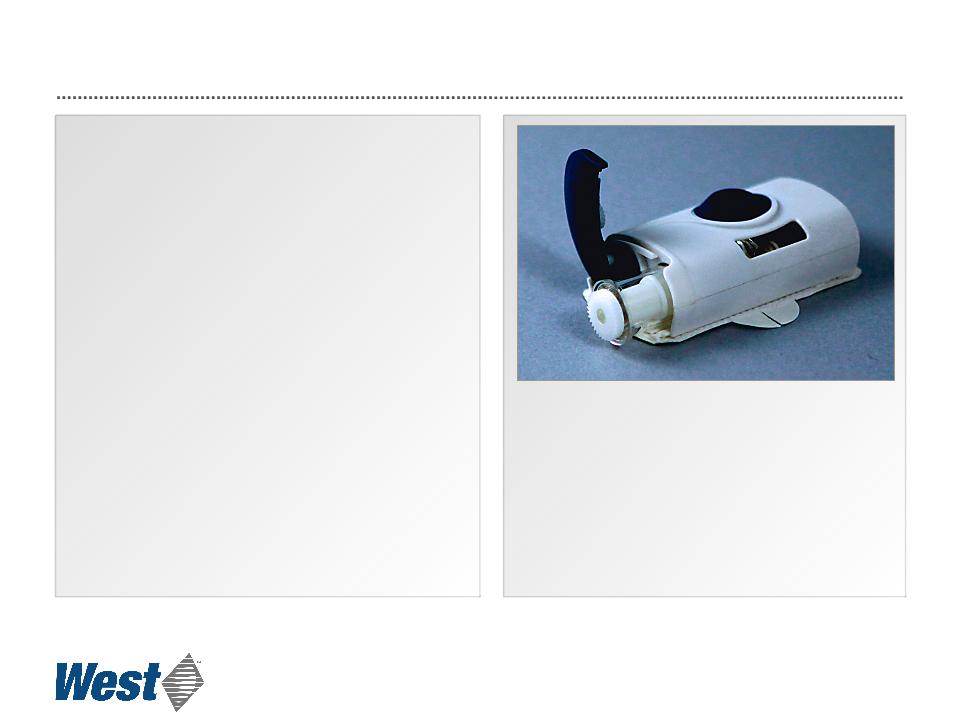
Electronic Patch Injector System
• Controlled, subcutaneous, micro-
infusion delivery of high volumes
and high viscosity drugs
infusion delivery of high volumes
and high viscosity drugs
• Prefilled cartridge, no need for
user filling
user filling
• Based on Daikyo CZ cartridge
• Compact
• Hidden needle for safety
• Single push-button operation
• Fully programmable
24
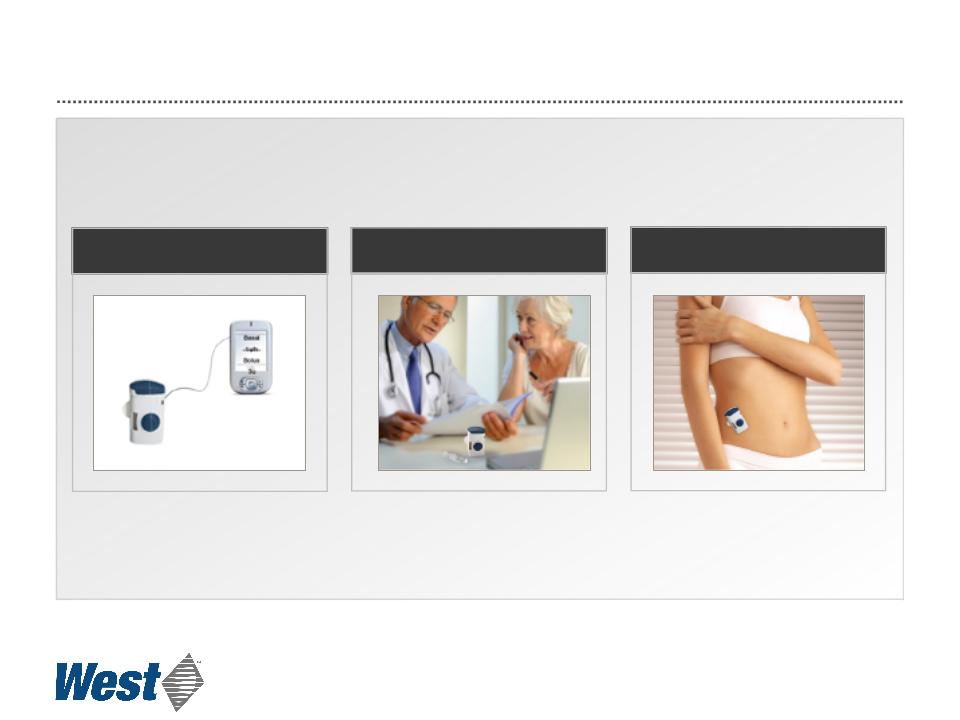
Prototype Electronic Patch Injector Operation
Programmed by PDA or PC
Dose may be customized
Attached and activated by patient
25
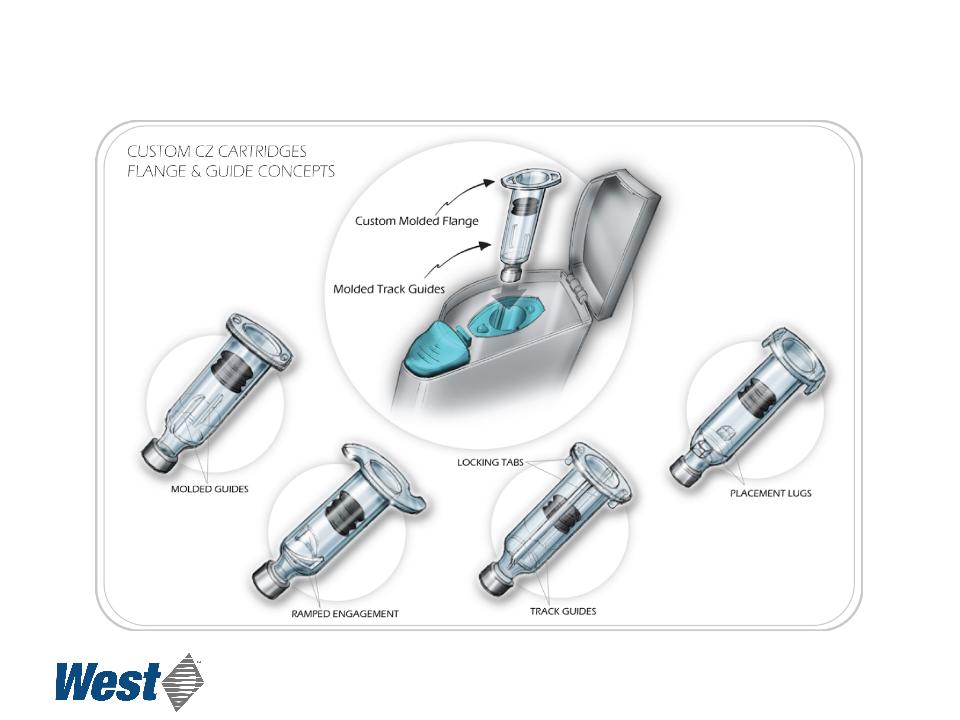
Custom Delivery Device Utilizing Daikyo CZ® Resin
Utilizes Daikyo’s proprietary Crystal Zenith technology
Daikyo Crystal Zenith® is a registered trademark of Daikyo, Seiko, Ltd.
26
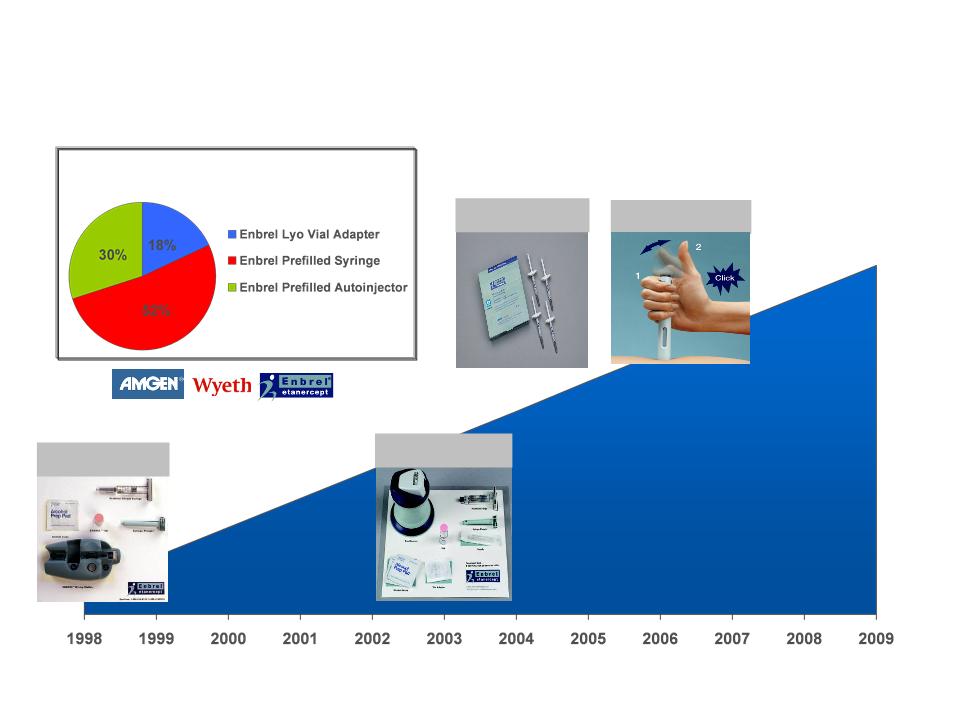
West’s Strategy Drives Revenue
Growth in Excess of Unit Growth
Growth in Excess of Unit Growth
Lyo Mixing Station
Launched 1998
Lyo Vial Adapter
Launched in 2003
Prefilled Syringe
Launched in 2004
General trend for level of device
features and functionality
US Sales by Device for 2007*
(One year after Autoinjector launch)
* Data source IMS Health
Taken from presentation at Management Forum Annual Conference in London (March 22 & 23, 2010), Don Rogers, Genentech
Prefilled Auto Injector
Launched in 2006
27

Our Long-Term Focus
• Pharmaceutical Packaging Systems
– Organic growth (on average) of 3-5% per year
– Margin expansion through operating efficiency, product mix
– Capital investments targeted at enhanced quality and value
• Pharmaceutical Delivery Systems
– Deliver the potential of Daikyo CZ products
– Increase healthcare-consumable contract manufacturing revenue
– Grow proprietary safety and delivery system businesses
• Financial discipline
– Operating cash flow: Discretionary SG&A, R&D and capital spending that
are supported by revenue growth
are supported by revenue growth
– Deliver returns on invested capital (“ROIC”) that regularly exceed weighted
average cost of capital (“WACC”)
average cost of capital (“WACC”)
– Align incentives with financial performance and value creation
28
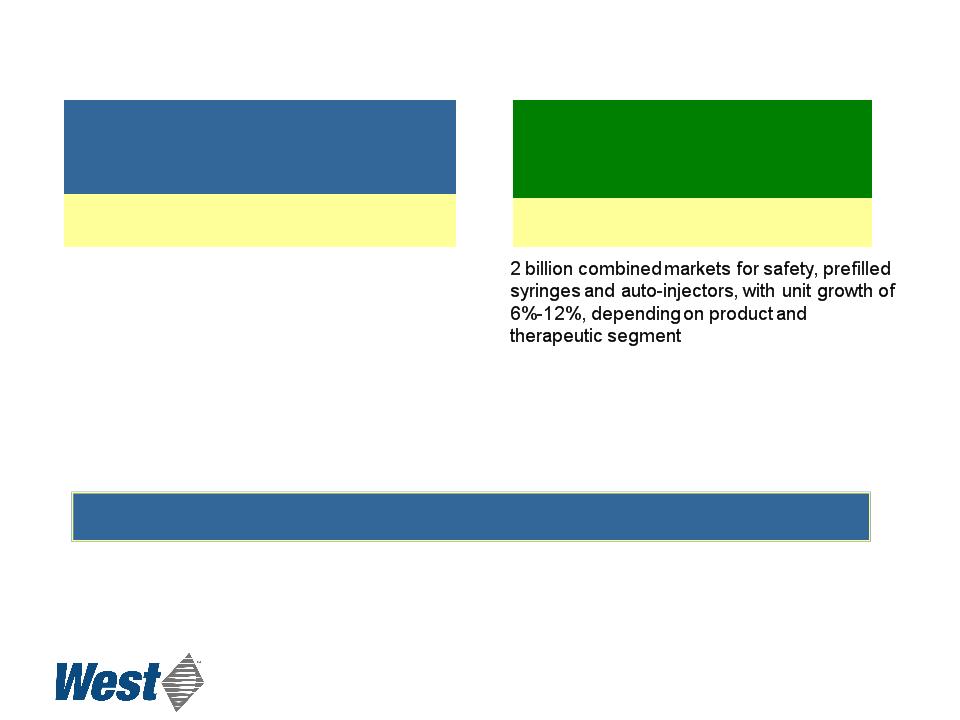
Long-Term Growth Opportunity
Strategic Planning Goals:
• Projected 2014 sales of $0.6 billion
• Projected 2014 Operating margin: > 20%
$1.5 billion market for components with unit
growth 0% to 8% per year, depending on
product and therapeutic segment
growth 0% to 8% per year, depending on
product and therapeutic segment
Strategic Planning Goals:
• Projected 2014 sales of $1.0 billion
• Projected 2014 Operating margin: > 20%
|
Pharmaceutical
Packaging Systems
|
|
Primary Container Solutions
|
|
Pharmaceutical Delivery
Systems |
|
Administration Systems
|
Consolidated 2014 Planning Objectives
• 2014 Sales: $1.6 billion
• 2014 Operating Margin: 19%
29
|
|
|
Raw Material Cost
|
|
Factor
Pricing (modestly higher)
Unit Volume (slow growth)
Mix (continuing shift)
cost increases)
Raw material cost
Labor (~ inflation)
|
||
|
Comprise approximately 1/3rd of COGS
Materials include: Synthetic elastomer and
polymer and film (petroleum based), aluminum, natural rubber 2011 plans based on expected 5% increases
vs. YTD actual material price increases that have been notably higher (oil, natural rubber, aluminum ingot). Mitigation:
• Cost:
Ø Contractual terms for purchases delay pass
-through of oil surcharges Ø Hedging program
• Revenue:
ØContracted sales price escalators
ØMaterial surcharges on other sales
|
||
|
|
30

2011 Full-year Financial Guidance
|
($ millions, except EPS)
|
2011 Revenue(1)
|
Gross Profit %(1)
|
|
Pharmaceutical Packaging
Systems Segment |
$ 810 - $ 830
|
33.4%
|
|
|
|
|
|
Pharmaceutical Delivery
Systems Segment |
$325 - $340
|
20.5%
|
|
|
|
|
|
Consolidated
|
$1,140 - $1,170
|
29.7%
|
|
|
2011 Adjusted Diluted EPS(1)(2)
|
|
|
|
$2.25 - $2.45
|
|
(1) Guidance includes various currency exchange rate assumptions, most significantly the Euro at $1.35 for 2011. Actual
results will vary as a result of variability of exchange rates.
results will vary as a result of variability of exchange rates.
(2) See “Cautionary Statement” (Slide 2), and “Non-GAAP Financial Measures” and “Notes to Non-GAAP Financial Measures”
(Slides 33-36).
(Slides 33-36).
31
32
Pharmaceutical Packaging Systems
Pharmaceutical Delivery Systems
• Well positioned
– Substantial market share
– Proprietary technology
– Diversified customer base
– Global footprint
• Stability with growth potential
– Strength in new product pipeline
– Preferred products for biologics
• The financial strength to invest
– Reliable operating cash flow
– Balance sheet strength
Summary

33
Non-GAAP Financial Measures(1)
Three Months Ended December 31, 2010 and 2009
Three Months Ended December 31, 2010 and 2009
(in millions, except per share data)
|
|
As Reported
December 31,
2010
|
Restructuring
and related charges |
Discrete
tax items |
Non-GAAP(1)
December 31,
2010
|
|
Operating profit
|
$5.9
|
$14.7
|
$-
|
$20.6
|
|
Interest expense, net
|
4.4
|
-
|
-
|
4.4
|
|
Income before income taxes
|
1.5
|
14.7
|
-
|
16.2
|
|
Income tax expense (benefit)
|
(3.6)
|
5.3
|
1.1
|
2.8
|
|
Equity in net income of affiliated companies
|
0.8
|
-
|
-
|
0.8
|
|
Net income
|
$5.9
|
$9.4
|
($1.1)
|
$14.2
|
|
|
|
|
|
|
|
Net income per diluted share
|
$0.18
|
$0.27
|
($0.03)
|
$0.42
|
|
|
As Reported
December 31,
2009
|
Restructuring
and other |
Brazil tax
amnesty |
Discrete tax
items |
Non-GAAP(1)
December 31,
2009
|
|
Operating profit
|
$21.7
|
$8.4
|
$1.9
|
$-
|
$32.0
|
|
Interest expense, net
|
3.9
|
-
|
-
|
-
|
3.9
|
|
Income before income taxes
|
17.8
|
8.4
|
1.9
|
-
|
28.1
|
|
Income tax expense (benefit)
|
(1.1)
|
2.8
|
0.6
|
4.0
|
6.3
|
|
Equity in net income of affiliated companies
|
1.4
|
-
|
-
|
-
|
1.4
|
|
Net income
|
$20.3
|
$5.6
|
$1.3
|
($4.0)
|
$23.2
|
|
|
|
|
|
|
|
|
Net income per diluted share
|
$0.59
|
$0.16
|
$0.03
|
($0.11)
|
$0.67
|
(1) See “Notes to Non-GAAP Financial Measures”(Slides 35 - 36), “Cautionary Statement” (Slide 2)

|
|
As Reported
December 31,
2010
|
Restructuring
and related charges |
Acquisition-
related contingencies |
Discrete
tax items |
Non-GAAP
December 31,
2010
|
|
Operating profit
|
$90.7
|
$15.9
|
($1.8)
|
$-
|
$104.8
|
|
Interest expense, net
|
16.2
|
-
|
-
|
-
|
16.2
|
|
Income before income taxes
|
74.5
|
15.9
|
(1.8)
|
-
|
88.6
|
|
Income tax expense
|
13.6
|
5.7
|
(0.2)
|
1.1
|
20.2
|
|
Equity in net income of affiliated
companies |
4.4
|
-
|
-
|
-
|
4.4
|
|
Net income
|
$65.3
|
$10.2
|
($1.6)
|
($1.1)
|
$72.8
|
|
|
|
|
|
|
|
|
|
|
|
|
|
|
|
Net income per diluted share
|
$1.89
|
$0.28
|
($0.04)
|
($0.03)
|
$2.10
|
34
|
|
As Reported
December 31,
2009
|
Restructuring
and other |
Brazil tax
amnesty |
Discrete tax
items |
Non-GAAP
December 31,
2009
|
|
Operating profit
|
$97.5
|
$9.5
|
($2.0)
|
$-
|
$105.0
|
|
Interest expense, net
|
14.4
|
-
|
-
|
-
|
14.4
|
|
Income before income taxes
|
83.1
|
9.5
|
(2.0)
|
-
|
90.6
|
|
Income tax expense
|
13.5
|
3.2
|
(1.6)
|
6.1
|
21.2
|
|
Equity in net income of affiliated companies
|
3.0
|
-
|
-
|
-
|
3.0
|
|
Net income
|
$72.6
|
$6.3
|
($0.4)
|
($6.1)
|
$72.4
|
|
|
|
|
|
|
|
|
|
|
|
|
|
|
|
Net income per diluted share
|
$2.12
|
$0.17
|
($0.01)
|
($0.17)
|
$2.11
|
Non-GAAP Financial Measures(1)
Year Ended December 31, 2010 and 2009
Year Ended December 31, 2010 and 2009
(1) See “Notes to Non-GAAP Financial Measures”(Slides 35 - 36), “Cautionary Statement” (Slide 2)
(in millions, except per share data)

NOTES TO NON-GAAP FINANCIAL MEASURES
For additional details, please see today’s press release and Safe Harbor Statement.
For additional details, please see today’s press release and Safe Harbor Statement.
These slides use non-GAAP financial measures. West believes that these non-GAAP measures of financial results provide useful
information to management and investors regarding certain business trends relating to West’s financial condition, results of operations and
the Company’s overall performance. Our executive management team uses adjusted operating profit and adjusted diluted EPS to evaluate
the performance of the Company in terms of profitability and to compare operating results to prior periods. Adjusted operating profit is also
used to evaluate changes in the operating results of each segment and to allocate resources to our segments. The Company believes that
the use of these non-GAAP financial measures provides an additional tool for investors to use in evaluating ongoing operating results and
trends in comparing its financial measures with other companies.
Our executive management does not consider such non-GAAP measures in isolation or as an alternative to such measures determined in
accordance with GAAP. The principal limitation of such non-GAAP financial measures is that they exclude significant expenses and income
that are required by GAAP to be recorded. In addition, they are subject to inherent limitations as they reflect the exercise of judgment by
management about which items are excluded from the non-GAAP financial measures. In order to compensate for these limitations, our
executive management presents its non-GAAP financial measures in connection with its GAAP results. We urge investors and potential
investors to review the reconciliation of our non-GAAP financial measures to the comparable GAAP financial measures, and not rely on any
single financial measure to evaluate the Company’s business.
In calculating adjusted operating profit and adjusted diluted EPS, we exclude the impact of items that are not considered representative of
ongoing operations. Such items include restructuring and related costs, certain asset impairments, other specifically identified gains or
losses, and discrete income tax items. A reconciliation of these adjusted non-GAAP measures to the comparable GAAP financial measures
is included below.
ongoing operations. Such items include restructuring and related costs, certain asset impairments, other specifically identified gains or
losses, and discrete income tax items. A reconciliation of these adjusted non-GAAP measures to the comparable GAAP financial measures
is included below.
The following is a description of the items excluded from adjusted operating profit and adjusted diluted EPS:
•Restructuring and related charges: During the three and twelve months ended December 31, 2010, we incurred restructuring,
impairment and related charges of $14.7 million and $15.9 million, respectively. The majority of these costs related to the restructuring plan
announced in December of 2010.
impairment and related charges of $14.7 million and $15.9 million, respectively. The majority of these costs related to the restructuring plan
announced in December of 2010.
• During the three and twelve months ended December 31, 2009, we recognized restructuring and other charges of $8.4 million and $9.5
million, respectively. The majority of these charges related to a restructuring program launched in the fourth quarter of 2009 to exit certain
specialized laboratory service offerings and consolidate contract-manufacturing operations. The 2009 restructuring program was completed
during the fourth quarter of 2010.
(continued on following slide)
35

NOTES TO NON-GAAP FINANCIAL MEASURES
For additional details, please see today’s press release and Safe Harbor Statement.
For additional details, please see today’s press release and Safe Harbor Statement.
Reconciliation of 2011 Adjusted Guidance to 2011 Reported Guidance:
(1) Guidance includes various currency exchange rate assumptions, most significantly the Euro at $1.35 for
2011. Actual results will vary as a result of variability of exchange rates.
2011. Actual results will vary as a result of variability of exchange rates.
|
|
Full Year 2011 Guidance (1)
|
|
|
Diluted Earnings Per Share
|
|
Adjusted guidance
|
$2.25 to $2.45
|
|
Restructuring, net of tax
|
(0.05) - (0.06)
|
|
Reported guidance
|
$2.19 to $2.40
|
(continued from prior slide)
• Acquisition-related contingencies: During the third quarter of 2010, we reduced our liability for contingent consideration
associated with our 2009 Eris™ acquisition by $1.8 million to reflect our revised assessment of fair value, as affected by a
reduction in the probability of attaining certain milestones over the next four years.
associated with our 2009 Eris™ acquisition by $1.8 million to reflect our revised assessment of fair value, as affected by a
reduction in the probability of attaining certain milestones over the next four years.
• Brazil Tax Amnesty: During September 2009, we enrolled in a tax amnesty program in Brazil which entitled us to a reduction in
certain tax-related penalties, interest and other costs in exchange for our irrevocable declaration of all specified tax obligations.
The fourth quarter 2009 pre-tax charge of $1.9 million was the result of an adjustment to the original amnesty benefit to reflect the
impact of a newly-issued ordinance. The full-year impact was a pre-tax gain of $2.0 million, or $0.4 million after tax.
• Discrete tax items: During the fourth quarter of 2010, we recognized $1.1 million in net discrete tax benefits, the majority of
which resulted from the expiration of open tax audit periods in various tax jurisdictions. During the three and twelve months ended
December 31, 2009, we recognized discrete tax benefits of $4.0 million and $6.1 million, respectively. During 2009, we recognized
tax credits of $2.4 million resulting from the identification of additional qualified R&D activities related to prior years, and other tax
provision benefits of $0.9 million primarily from the reversal of valuation allowances on prior-year tax losses carried forward. We
also recognized a $2.8 million net tax provision benefit, principally resulting from the completion of a tax audit and the expiration of
open tax periods in various tax jurisdictions.
36
WEST PHARMACEUTICAL SERVICES OVERVIEW
Solutions for Injectable Drug Delivery NYSE:WST www.westpharma.com
Barclays Capital
2011 Global Healthcare Conference
Miami, FL March 16, 2011