Attached files
| file | filename |
|---|---|
| EX-21 - FutureFuel Corp. | ex21.htm |
| EX-14 - FutureFuel Corp. | ex14.htm |
| EX-32 - FutureFuel Corp. | ex32.htm |
| EX-23 - FutureFuel Corp. | ex23.htm |
| EX-11 - FutureFuel Corp. | ex11.htm |
| EX-31.A - FutureFuel Corp. | ex31pa.htm |
| EX-31.B - FutureFuel Corp. | ex31pb.htm |
| EX-10.12 - FutureFuel Corp. | ex10p12.htm |
| EX-10.15 - FutureFuel Corp. | ex10p15.htm |
UNITED STATES
SECURITIES AND EXCHANGE COMMISSION
Washington, D.C. 20549
FORM 10-K
(Mark One)
|
√
|
ANNUAL REPORT PURSUANT TO SECTION 13 OR 15(d) OF THE SECURITIES EXCHANGE ACT OF 1934
For the fiscal year ended December 31, 2010
|
|
or
|
|
|
|
TRANSITION REPORT PURSUANT TO SECTION 13 OR 15(d) OF THE SECURITIES EXCHANGE ACT OF 1934
For the transition period from _____________ to ______________
|
Commission file number: 0-52577
FUTUREFUEL CORP.
(Exact Name of Registrant as Specified in Its Charter)
|
Delaware
|
20-3340900
|
|
|
(State or Other Jurisdiction of
Incorporation or Organization)
|
(I.R.S. Employer
Identification No.)
|
8235 Forsyth Blvd., Suite 400
Clayton, Missouri 63105
(Address of Principal Executive Offices, including Zip Code)
(805) 565-9800
(Registrant’s telephone number, including area code)
Securities registered pursuant to Section 12(b) of the Act:
|
Title of each class
|
Name of each exchange on which registered
|
|
|
Common stock, par value $0.0001
|
New York Stock Exchange
|
Securities registered pursuant to Section 12(g) of the Act:
None
(Title of class)
Indicate by check mark if the registrant is a well-known seasoned issuer, as defined in Rule 405 of the Securities Act. Yes No √
Indicate by check mark if the registrant is not required to file reports pursuant to Section 13 or Section 15(d) of the Act. Yes No √
Note—Checking the box above will not relieve any registrant required to file reports pursuant to Section 13 or 15(d) of the Exchange Act from their obligations under those Sections.
Indicate by check mark whether the registrant (1) has filed all reports required to be filed by Section 13 or 15(d) of the Securities Exchange Act of 1934 during the preceding 12 months (or for such shorter period that the registrant was required to file such reports), and (2) has been subject to such filing requirements for the past 90 days.
Yes √ No
Indicate by check mark whether the registrant has submitted electronically and posted on its corporate Web site, if any, every Interactive Data File required to be submitted and posted pursuant to Rule 405 of Regulation S-T (§232.405 of this chapter) during the preceding 12 months (or for such shorter period that the registrant was required to submit and post such files). Yes No
Indicate by check mark if disclosure of delinquent filers pursuant to Item 405 of Regulation S-K (§229.405) is not contained herein, and will not be contained, to the best of registrant’s knowledge, in definitive proxy or information statements incorporated by reference in Part III of this Form 10-K or any amendment to this Form 10-K.
Indicate by check mark whether the registrant is a large accelerated filer, an accelerated filer, a non-accelerated filer, or a smaller reporting company. See the definitions of “large accelerated filer,” “accelerated filer” and “smaller reporting company” in Rule 12b-2 of the Exchange Act. (Check one):
|
Large accelerated filer
|
|
Accelerated filer
|
√ | |
|
Non-accelerated filer
|
|
Smaller reporting company
|
|
(Do not check if a smaller reporting company)
Indicate by check mark whether the registrant is a shell company (as defined in Rule 12b-2 of the Act). Yes No √
State the aggregate market value of the voting and non-voting common equity held by non-affiliates computed by reference to the price at which the common equity was last sold, or the average bid and asked price of such common equity, as of the last business day of the registrant’s most recently completed second fiscal quarter. $80,580,688
Indicate the number of shares outstanding of each of the registrant’s classes of common stock, as of the latest practicable date: 39,983,849
Table of Contents
General Development of the Business
The Company
FutureFuel Corp. (including our wholly-owned subsidiaries, the “Company” or “we”, “our” or “us”) is a Delaware corporation incorporated on August 12, 2005 under the name “Viceroy Acquisition Corporation”. We were formed to serve as a vehicle for the acquisition by way of an asset acquisition, merger, capital stock exchange, share purchase, or similar transaction of one or more operating businesses in the oil and gas industry. On July 12, 2006, we completed an offering of 22,500,000 units, each unit consisting of one share of our common stock and one warrant to acquire one share of our common stock. These units were issued at $8.00 per unit. On July 21, 2006, we entered into an acquisition agreement with Eastman Chemical Company to acquire its wholly-owned subsidiary, Eastman SE, Inc., a chemical manufacturer which had just launched a biobased products platform. Our shareholders approved the acquisition of Eastman SE, Inc. on October 27, 2006. On October 31, 2006, the acquisition of Eastman SE, Inc. was consummated (effective after the close of business on that day) and Eastman SE, Inc. became our wholly-owned subsidiary. In connection with such closing, we changed our name to FutureFuel Corp. and Eastman SE, Inc. changed its name to FutureFuel Chemical Company.
Our shares of common stock are quoted on the Over-the-Counter Bulletin Board (“OTC Bulletin Board”). The OTC Bulletin Board is an electronic trading service offered by the National Association of Security Dealers that shows real-time quotes, last sale prices, and volume information for over-the-counter equity securities.
On July 12, 2010, all outstanding unexercised warrants to purchase our common stock expired. Our warrants were not listed or quoted on any established exchange.
We declared a special cash dividend on February 3, 2011 of $0.10 per share on our common stock, with a record date of March 1, 2011 and payable on March 15, 2011.
On February 10, 2011, we filed with the United States Securities and Exchange Commission (“SEC”) a Form S-3 Registration Statement commonly referred to as a “shelf registration” whereby we registered shares of our common stock, preferred stock, warrants, rights, and units which we might issue in the future in an aggregate amount not to exceed $50 million. This registration statement was amended on March 4, 2011 and became effective on March 10, 2011.
On March 8, 2011, the New York Stock Exchange (“NYSE”) approved the listing of our common stock for trading on the exchange, and on March 9, 2011 we filed with the SEC a Form 8-A Registration Statement under the Securities and Exchange Act of 1934, as amended (the “Exchange Act”) with respect to our common stock. We anticipate that trading of our common stock on the NYSE will commence on March 23, 2011 under the symbol “FF”.
FutureFuel Chemical Company
FutureFuel Chemical Company is a Delaware corporation incorporated on September 1, 2005 under the name Eastman SE, Inc. It owns approximately 2,200 acres of land six miles southeast of Batesville in north central Arkansas fronting the White River. Approximately 500 acres of the site are occupied with batch and continuous manufacturing facilities, laboratories, and associated infrastructure, including on-site liquid waste treatment. The plant is staffed by approximately 500 non-union full-time employees. FutureFuel Chemical Company manufacturers diversified chemical products and biobased products comprised of biofuels and biobased specialty chemical products.
In the chemicals segment, the 2010 demand for our core existing product lines remained in line with our expectations. We also completed plant modifications and additions in 2010 to enable the processing of several new product lines. We continue to focus on building and maintaining our reputation as a technology-driven competitive chemical producer. We have retained a strong emphasis on cost control and efficiency improvements that, we
1
believe, will enable us to take advantage of growth opportunities that exist as a result of conditions in the worldwide chemical industry.
With respect to our biofuels segment, in 2009 we completed a project to increase our production capacity to 59 million gallons of biodiesel per year through the addition of a new continuous processing line. We initiated commercial production from this new line in May 2009. By the end of the second quarter of 2009, daily production volumes from the new processing line were demonstrated at approximately 80% of nameplate capacity. This production line was designed to produce biodiesel from feedstock with low fatty acids. We believe we successfully demonstrated our ability to keep this continuous processing line at or near capacity for sustained periods of time as well as our ability to procure and logistically handle large quantities of feedstock with low fatty acids. However, with the expiration of the $1.00 federal blender’s credit at the end of 2009 (see the discussion below), we determined that feedstocks with low fatty acids were too costly to consistently produce biodiesel with positive margins. Accordingly, in 2010, we redesigned our continuous line to produce biodiesel from feedstock with high fatty acids. We are still in the process of debugging this redesigned line.
There currently is uncertainty as to whether we will produce biodiesel in the future. This uncertainty results from: (i) changes in feedstock prices relative to biodiesel prices; (ii) the continuance of the $1.00 per gallon federal blender’s tax credit, which credit terminates on December 31, 2011; and (iii) the permanency of government mandates. See “Risk Factors” beginning at page 16 below.
Financial Information about Segments
Unless otherwise noted, the financial data presented herein represents our consolidated operations for the twelve-month periods ended December 31, 2010, December 31, 2009, and December 31, 2008. The following table sets forth: (i) our consolidated revenues from external customers for the years ended December 31, 2010, 2009, and 2008; (ii) our consolidated net income for the years ended December 31, 2010, 2009, and 2008; and (iii) our total assets at December 31, 2010, 2009, and 2008.
(Dollars in thousands)
|
Period
|
Revenues
from External Customers
|
Net Income
|
Total Assets
|
|||||||||
|
Year ended December 31, 2010
|
$ | 219,183 | $ | 23,094 | $ | 343,156 | ||||||
|
Year ended December 31, 2009
|
$ | 196,711 | $ | 16,992 | $ | 246,007 | ||||||
|
Year ended December 31, 2008
|
$ | 198,330 | $ | 22,675 | $ | 238,126 | ||||||
We have two business reporting “segments” as defined by U.S. generally accepted accounting principles: chemicals and biofuels. We are not able to allocate net income and total assets between these two business segments. However, revenues from external customers and gross margins can be allocated between the two business segments as set forth in the following table.
(Dollars in thousands)
|
Period
|
Revenues
from
Chemical Segment
|
Revenues
from
Biofuels Segment
|
Total Revenues
from
External Customers
|
Gross
Margin
from Chemical Segment
|
Gross
Margin
from
Biofuels Segment
|
Gross
Margin
|
||||||||||||||||||
|
Year ended December 31, 2010
|
$ | 178,280 | $ | 40,903 | $ | 219,183 | $ | 41,433 | $ | (149 | ) | $ | 41,284 | |||||||||||
|
Year ended December 31, 2009
|
$ | 143,759 | $ | 52,952 | $ | 196,711 | $ | 33,007 | $ | 1,430 | $ | 34,437 | ||||||||||||
|
Year ended December 31, 2008
|
$ | 155,553 | $ | 42,777 | $ | 198,330 | $ | 32,738 | $ | 7,679 | $ | 40,417 | ||||||||||||
See note 21 to our consolidated financial statements contained in “Item 8. Financial Statements and Supplementary Data” for adjustments to segment gross margins to arrive at net income.
2
Narrative Description of the Business
Principal Executive Offices
Our principal executive offices are located at 8235 Forsyth Blvd., 4th Floor, Clayton, Missouri 63105. Our telephone number is (805) 565-9800. FutureFuel Chemical Company’s principal executive offices are located at 2800 Gap Road, Highway 394 South, Batesville, Arkansas 72501-9680. Its telephone number at such office is (870) 698-1811.
The Company
We completed the offering described above on July 12, 2006 and acquired FutureFuel Chemical Company at the close of business on October 31, 2006. On July 11, 2008, our common stock began to be quoted on the OTC Bulletin Board under the symbol “FTFL”. All of our warrants outstanding as of December 31, 2009 have either: (i) been exercised by the holder thereof; (ii) been purchased by us and canceled; or (iii) expired effective July 12, 2010; and are no longer outstanding. Our warrants were not listed or quoted on any national exchange or any other price quotation system.
We own approximately 2,200 acres of land six miles southeast of Batesville in north central Arkansas fronting the White River. Approximately 500 acres of the site are occupied with batch and continuous manufacturing facilities, laboratories, and associated infrastructure, including on-site liquid waste treatment. The plant is staffed by approximately 500 non-union full-time employees. Land and support infrastructure are available to support expansion and business growth. In March 2009, we acquired a granary in Marianna, Arkansas.
For the year ended December 31, 2010, approximately 78% of site revenue was derived from manufacturing specialty chemicals for specific customers (“custom manufacturing”) with 4% of revenues being derived from multi-customer specialty chemicals (“performance chemicals”) and 18% from biofuels. Custom manufacturing involves producing unique products for individual customers, generally under long-term contracts. The plant’s custom manufacturing product portfolio includes a bleach activator for a major detergent manufacturer, a proprietary herbicide and intermediates for a major life sciences company, and chlorinated polyolefin adhesion promoters and antioxidant precursors for a major chemical company. The performance chemicals product portfolio includes polymer (nylon) modifiers and several small-volume specialty chemicals for diverse applications.
We are committed to growing our chemical and biofuels businesses. We also intend to pursue commercialization of other products, including building block chemicals. In pursuing this strategy, we will continue to establish a name identity in the biofuels business, leverage our technical capabilities and quality certifications, secure local and regional markets, and expand marketing efforts to fleets and regional/national customers. These items are discussed in greater detail below.
Biofuels Business Segment
Overview of the Segment
Our biofuels segment was established in early 2005 as an initiative of the site management team to leverage technical and operational expertise as well as available manufacturing capacity to pursue business growth opportunities in addition to the legacy specialty chemicals business. The biofuels segment had revenue of $40,903,000 for the year ended December 31, 2010, $52,952,000 for the year ended December 31, 2009, and $42,777,000 for the year ended December 31, 2008.
Biofuel Products
Our biofuels business segment currently targets biodiesel. In addition, we sell petrodiesel in blends with our biodiesel and, from time to time, with no biodiesel added. Our biofuels segment also includes the operation of a granary in central Arkansas that we acquired in March 2009. The infrastructure and location of the granary provide an advantaged position related to several expansion projects we are evaluating within our biofuels segment. We can provide no assurance that any of these expansion projects will come to fruition. Until such time as we elect to pursue one or more of these expansion projects, we intend to continue purchasing grain from farmers in central
3
Arkansas and reselling that grain to buyers at major agricultural centers for export out of our region. Finally, we are a shipper of refined petroleum products on a common carrier pipeline and, from time-to-time, we buy and sell petroleum products to maintain our active shipper status on this pipeline.
Biodiesel is a renewable energy consisting of mono-alkyl esters of fatty acids. The mono-alkyl esters are typically produced from vegetable oil, fat, or grease feedstocks. Biodiesel is used primarily as a blend with petrodiesel (usually 2% (B2) to 20% (B20) by volume). A major advantage of biodiesel is that it can be used in most existing diesel engines and fuel injection equipment in blends up to 20% with no material impact to engine performance. Biodiesel has about 93% of the energy content of petrodiesel on a per gallon basis, and a cetane number between 50 and 60. Biodiesel’s chemical composition translates to better engine performance and lubrication; however, its lower energy content may result in a slight decrease in fuel economy. As an additional benefit, biodiesel is the only alternative fuel to meet all testing requirements of the Clean Air Act and, in 1998, Congress approved the use of biodiesel as an Energy Policy Act compliance strategy (which allows federal, state, and public fleets covered by this Act to meet their alternative fuel vehicle purchase requirements simply by buying biodiesel and burning it in new or existing diesel vehicles in at least a 20% blend). Finally, biodiesel also benefits from favorable properties compared to petrodiesel (e.g., negligible sulfur content and lower particulate matter and greenhouse gas emissions). See Status and Issues for Biodiesel in the United States, National Renewable Energy Laboratory, Robert L. McCormick, Teresa Alleman, Aaron Williams, Yoshio Coy, Andrew Hudgins, and Wendy Dafoe, October 2009 and Pew Center on Global Climate Change, http://www.pewclimate.org/technology/factsheet/biodiesel.
Biodiesel commercialization was achieved at our Batesville plant in October 2005. Technical and operational competency developed as a supplier of specialty chemicals enabled the development of a flexible manufacturing process which can utilize the broadest possible range of feedstock oils, including soy oil, cottonseed oil, palm oil, pork lard, poultry fat, and beef tallow. The Batesville plant produces B100. B20 is currently used in the facility’s diesel fleet and is available for retail sale at the site. In the second quarter of 2009, we began offering B100, biodiesel blended with petrodiesel (B2, B5, B10, and B20 grades), and petrodiesel at our leased storage facility in Little Rock, Arkansas. In addition, we deliver blended product to a small group of customers within our region.
Biodiesel Production
Biodiesel can be made from renewable sources such as: (i) crude and refined virgin vegetable oils; (ii) crude and refined animal fats; and (iii) used cooking oils and trap grease. The choice of feedstock is determined primarily by the price and availability of each feedstock variety, yield loss of lower quality feedstock, and the capabilities of the producer’s biodiesel production facility. In the United States, the majority of biodiesel historically has been made from domestically produced soybean oil. See Pew Center on Global Climate Change, http://www.pewclimate.org/technology/factsheet/biodiesel. However, this reliance on soybean oil has constrained biodiesel production in the United States due to its higher cost and competition with food demands. As such, the biodiesel feedstock market in the United States is in a transition from this increasingly expensive first-generation soy feedstock to alternative second-generation lower-cost, non-food feedstocks such as used vegetable oil, tallow, and algae. See http://www.emerging-markets.com/biodiesel/default.asp.
In 2009, we completed a project to increase our production capacity to 59 million gallons of biodiesel per year through the addition of a new continuous processing line. We initiated commercial production from this new line in May 2009. By the end of the second quarter of 2009, daily production volumes from the new processing line were demonstrated at approximately 80% of nameplate capacity. This production line was designed to produce biodiesel from feedstock with low fatty acids. We believe we successfully demonstrated our ability to keep this continuous processing line at or near capacity for sustained periods of time as well as our ability to procure and logistically handle large quantities of feedstock with low fatty acids. However, with the expiration of the $1.00 federal blender’s credit at the end of 2009 (see the discussion below), we determined that feedstocks with low fatty acids were too costly to consistently produce biodiesel with positive margins. Accordingly, we redesigned our continuous line to produce biodiesel from feedstock with high fatty acids. We are still in the process of debugging this redesigned line.
Legislative Incentives
Historically, the acceptance of biodiesel in the United States has been driven to a great degree by legislative initiatives. For example, agencies of the United States government, including the Department of Energy, the
4
Environmental Protection Agency, the Internal Revenue Service, and the Department of Agriculture, as well as many states, offer biodiesel incentives or have mandates for the use of biodiesel, or both. There are other governmental incentives that do not directly reduce the net cost of producing or blending biodiesel but that drive the demand for biodiesel. For example, tax credits are available under the Internal Revenue Code for investment in qualifying refueling property, the Environmental Protection Agency will pay 50-100% of the cost for schools to upgrade and/or replace their buses, and programs administered by the Department of Energy indirectly require government fleet operators to purchase substantial amounts of biodiesel. The principal federal incentives that we believe have the greatest positive effect on our business are discussed below.
The Energy Policy Act of 1992 requires government fleet operators to use a certain percentage of alternatively fueled vehicles. The Act established a goal of replacing 10% of motor fuels with non-petroleum alternatives by 2000, increasing to 30% by the year 2010. Currently, 75% of all new light-duty federal vehicles purchased are required to have alternative fuel capability to set an example for the private automotive and fuel industries.
Under the Energy Conservation Reauthorization Act of 1998, vehicle fleets that are required to purchase alternatively fueled vehicles can generate credit toward this requirement by purchasing and using biodiesel in a conventional vehicle. Since there are few cost-effective options for purchasing heavy-duty alternatively fueled vehicles, federal and state fleet providers can meet up to 50% of their heavy-duty alternatively fueled vehicle purchase requirements with biodiesel. The biodiesel fuel credit allows fleets to purchase and use 450 gallons of biodiesel in vehicles in excess of 8,500 pounds gross vehicle weight instead of alternatively fueled vehicles. Fleets must purchase and use the equivalent of 450 gallons of pure biodiesel in a minimum of a 20% blend to earn one credit. Covered fleets earn one vehicle credit for every light-duty alternatively fueled vehicle they acquire annually beyond their base vehicle acquisition requirements. Credits can be banked or sold.
Congress passed a biodiesel tax incentive, structured as a federal excise tax credit, as part of the American Jobs Creation Act of 2004. The credit amounted to one cent for each percentage point of vegetable oil or animal fat biodiesel that was blended with petrodiesel (and one-half cent for each percentage point of recycled oils and other non-agricultural biodiesel). For example, blenders that blended B20 made from soy, canola, and other vegetable oils and animal fats received a 20¢ per gallon excise tax credit, while biodiesel made from recycled restaurant oils (yellow grease) received half of this credit. The tax incentive generally was taken by petroleum distributors and was substantially passed on to the consumer. It was designed to lower the cost of biodiesel to consumers in both taxable and tax-exempt markets. The tax credit was scheduled to expire at the end of 2006, but was extended in the Energy Policy Act of 2005 to the end of 2008 and then to December 31, 2009 through the Emergency Economic Stabilization Act of 2008.
Congress enacted the Energy Policy Act of 2005 in August 2005 and included a number of provisions intended to spur the production and use of biodiesel. In particular, the Act’s provisions include biodiesel as part of the minimum volume of renewable fuels (the renewable fuels standard or “RFS”), in the nationwide gasoline and diesel pool, with the Environmental Protection Agency being directed to determine the share to be allocated to biodiesel and other details through its rulemaking process. More specifically, the RFS requires a specific amount of renewable fuel to be used each year in the nationwide gasoline and diesel pool. The volume increases each year, from 4 billion gallons per year in 2006 to 7.5 billion gallons per year in 2012. The Act requires the Environmental Protection Agency, beginning in 2006, to publish by November 30th of each year, “renewable fuel obligations” that will be applicable to refiners, blenders, and importers in the contiguous 48 states. The renewable fuel obligations are required to be expressed in terms of a volume percentage of gasoline sold or introduced into commerce and consist of a single applicable percentage that will apply to all categories of refiners, blenders, and importers. The renewable fuel obligations are to be based on estimates that the Energy Information Association provides to the Environmental Protection Agency on the volumes of gasoline it expects will be sold or introduced into commerce. The Environmental Protection Agency released the final rules to implement the RFS on April 10, 2007. Under those rules, the RFS compliance period did not begin until September 1, 2007. The applicable volume of renewable fuel under this program was 4.7 billion gallons for 2007, 5.4 billion gallons for 2008, 11.1 billion gallons for 2009, and 12.95 billion gallon for 2010, increasing to 36 billion gallons per year by 2022. Beginning in 2010, a certain percentage of renewable fuel blended into transportation fuels must be cellulosic biofuel, biomass-based diesel (biodiesel), and/or advanced biofuel.
The Energy Policy Act of 2005 also created a new tax credit for small agri-biodiesel producers with production capacity not in excess of 60 million gallons, of 10¢ per gallon for the first 15 million gallons of agri-biodiesel sold.
5
Our 2010 biodiesel production capacity did not exceed 60 million gallons and thus we qualified for this credit. We expect that our 2011 biodiesel production capacity will not exceed 60 million gallons and that we will qualify for this credit in 2011.
On December 19, 2007, the Energy Independence and Security Act of 2007 was enacted which, among other things, expanded the RFS (also referred to as “RFS2”). In contrast to the Energy Policy Act of 2005, this bill provided an RFS carve-out applicable specifically to biodiesel; the RFS requirement of the Energy Policy Act of 2005 had mostly been filled by ethanol. Beginning January 1, 2009, the 2007 Act mandates that 500 million gallons of biomass-based diesel (biodiesel) be used per year. On November 21, 2008, the USEPA announced that the 2009 RFS2 for refiners, importers, and blenders was 10.21%. The 2008 RFS was 7.76%. The 2009 RFS2 represents 11.1 billion gallons of renewable fuel and includes 500 million gallons of biodiesel and renewable diesel. The mandate under the 2007 Act increases each year and reaches 1 billion gallons per year in 2012. Beyond 2012, the mandate is to be determined by the Environmental Protection Agency administrator in coordination with the secretaries of energy and agriculture, but with a minimum of that mandated in 2012, thus a 1 billion gallons per year floor. On November 23, 2010, the Environmental Protection Agency finalized the 2011 RFS2 biodiesel volume at 800 million gallons.
The Emergency Economic Stabilization Act of 2008 extended the biodiesel tax credit through December 31, 2009 and qualified all biodiesel for a $1.00 per gallon tax credit, including biodiesel made from non-virgin feedstocks such as yellow grease. As noted above, prior legislation limited the tax credit for biodiesel manufactured from non-virgin feedstocks to $0.50 per gallon.
On February 17, 2009, the American Recovery and Reinvestment Act of 2009 was enacted which, among other things, appropriated monies to support various investments and offered incentives (such as tax credits, grant programs, and other funding) for projects related to alternative fuels, energy independence, and renewable energy technologies. For example, the Department of Energy was provided with $800 million for projects related to biomass, and $2 billion was made available for grants for manufacturing advanced battery systems and electric vehicle components to support domestic manufacturing of advanced lithium ion batteries and hybrid electric systems.
The $1.00 per gallon blender tax credit expired on December 31, 2009. However, in December 2010, the credit was reinstated retroactive to January 1, 2010 by the Tax Relief, Unemployment Insurance Reauthorization, and Job Creation Act of 2010. The tax credit is now scheduled to expire on December 31, 2011. If this tax credit is not renewed, its expiration could have a material adverse effect on our biodiesel business. See “Risk Factors” beginning at page 16 below.
The federal government offers other programs, including those summarized in the table below.
|
Federal Agency that Administers/
Oversees
|
Type of Incentive
|
Who Receives Incentive
|
Commonly Known As
|
Summary
|
|
Internal Revenue Service
|
income tax credit
|
infrastructure providers
|
Alternative Fuel Infrastructure Credit
|
Provides a tax credit in an amount equal to 50% of the cost of any qualified non-residential alternatively fueled vehicle refueling property placed into service in the United States up to $50,000 in 2009 and 2010, subject to certain limits, and up to 30% of the cost, not to exceed $30,000, for equipment placed into service in 2011.
|
|
Environmental Protection Agency
|
grant program
|
school districts
|
Clean School Bus Program
|
Reduces operating costs and children’s exposure to harmful diesel exhaust by limiting bus idling, implementing pollution reduction technology, improving route logistics and switching to biodiesel. The Energy Bill of 2005
|
6
|
Federal Agency that Administers/
Oversees
|
Type of Incentive
|
Who Receives Incentive
|
Commonly Known As
|
Summary
|
|
utilizes this program to grant up to a 50% cost share (depending on the age and emissions of the original bus) to replace school buses with buses that operate on alternative fuel or low-sulfur diesel, or up to 100% for retrofit projects.
|
||||
|
grants/funding
|
cities, ports, and public entities
|
National Clean Diesel Campaign
|
Offers grants and funding to reduce pollution from diesel engines and adoption of clean technologies for agricultural and construction equipment and other projects.
|
|
|
grants/funding
|
state, local, and tribal agencies
|
Air Pollution Control Program
|
Assists project costs to implement plans for developing, improving, and maintaining prevention of air pollution and the national ambient air quality standards with emphasis on alternative fuels.
|
|
|
Department of Agriculture
|
grant program
|
agricultural producers and small businesses
|
Renewable Energy Systems and Energy Efficiency Improvements Grant
|
In 2005, the Department of Agriculture’s Office of Rural Development made available $22.8 million in competitive grant funds and guaranteed loans for the purchase of renewable energy systems and energy improvements for agricultural producers and small rural businesses. Eligible projects include biofuels, hydrogen and energy efficiency improvements, as well as solar, geothermal and wind.
|
|
Department of Agriculture/ Department of Energy
|
grant program
|
biobased fuels researchers
|
Biomass Research and Development Act of 2000
|
Funds research, development and demonstration biomass projects with respect to renewable energy resources from the agricultural and agro-forestry sectors. Biomass is defined as organic matter that is available on a renewable or recurring basis.
|
|
Department of Energy
|
grants/funding
|
municipalities and local agencies
|
Clean Cities
|
Supports local initiatives to reduce the use of petroleum in transportation with volunteer coalitions to promote alternative fuels
|
7
|
Federal Agency that Administers/
Oversees
|
Type of Incentive
|
Who Receives Incentive
|
Commonly Known As
|
Summary
|
|
Department of Transportation
|
grants/funding
|
states, municipalities, state DOTs, and transit agencies
|
Clean Fuels Grant program and Congestion Migration and Air Quality Improvement Program
|
Assists designated non-attainment areas for ozone and carbon monoxide in maintaining the national ambient air quality standards; promotes low-emission buses, equipment, alternative fuel stations and infrastructure, use of biodiesel, and cost-effective congestion mitigation activities to improve air quality.
|
Many states are following the federal government’s lead and are offering similar programs and incentives to spur biodiesel production and use. For example, Arkansas provides an income tax credit of 5% of the cost of the facilities and equipment used directly in the wholesale or retail distribution of biodiesel where the equipment has not been claimed in a previous tax year. In addition, Arkansas offers a tax refund of $0.50 for each gallon of biodiesel used by a supplier to produce a biodiesel/petrodiesel mixture of not more than 2% biodiesel. In April 2007, Arkansas passed legislation that provides for a $0.20 per gallon biodiesel producer credit and up to $50,000 in grants per site for biodiesel producers and distributors to install distribution infrastructure. The $0.20 per gallon Arkansas producer credit is capped at 10 million gallons of production, or $2 million, per defined time intervals. The first interval was January 1, 2007 through June 30, 2008. We submitted an application for the $0.20 per gallon biodiesel producer credit for production during this 18-month interval and received the $2 million credit in March 2008. The next funding interval was July 1, 2008 to June 30, 2009. We applied for funding under this program for biodiesel produced during this interval and received the $2 million credit in July 2009. No funding was available for this program in 2010, nor do we expect funding to be available in 2011. However, we intend to apply for the credit in future years when and as such credit is available.
Our review of state statutes reveals that virtually all states provide either user or producer incentives for biodiesel, several states provide both types of incentives, and approximately 37 states provide incentives to biodiesel producers to build facilities in their states, typically offering tax credits, grants, and other financial incentives. As we expand our business outside of Arkansas, we will evaluate these additional state incentives to determine if we qualify for them.
We will continue to identify and pursue other incentives to support our business. However, no assurances can be given that we will qualify for any such incentives or, if we do qualify, what the amount of such incentives will be.
ASTM D6751 Standard
For quality specification purposes, and to qualify for the blender’s tax credit, biodiesel must meet the requirements of ASTM D6751. This specification ensures that blends up to B20 are compatible with diesel engines and associated fuel system hardware. See Status and Issues for Biodiesel in the United States, National Renewable Energy Laboratory, Robert L. McCormick, Teresa Alleman, Aaron Williams, Yoshio Coy, Andrew Hudgins, and Wendy Dafoe, October 2009. All biodiesel manufactured at our Batesville plant is tested in on-site quality control laboratories and confirmed to meet the ASTM D6751 standard.
Renewable Identification Numbers
As noted above, the RFS mandates levels of various types of renewable fuels that are to be blended with U.S. gasoline and diesel fuel by U.S. refiners, blenders, and importers. Renewable Identification Numbers (“RINs”) are the mechanism for insuring that the prescribed levels of blending are reached. As ethanol and biodiesel is produced or imported, the producer or importer has the responsibility to assign a series of numbers (i.e., a RIN) to their product. Assignment is made according to guidelines established by the Environmental Protection Agency. Once the RIN is assigned to the fuel, it essentially becomes the renewable fuel credit. When biofuels change ownership to the refiners, importers, and blenders of the fuel, the RINs are also transferred. The RINs ultimately are separated from the renewable fuel generally at the time the renewable fuel is blended. The refiners, importers, and blenders
8
generally use the RINs to establish that they have blended their applicable percentage of renewable fuels during the applicable reporting period. However, once the RINs are separated from the underlying biofuels (e.g., by blending the underlying biodiesel with petrodiesel), they can also be sold separate and apart from the underlying biofuel.
We generally create RINs when we produce biodiesel. Those RINs may be separated from the biodiesel at the time, if any, that we blend the biodiesel with petrodiesel. If we sell the biodiesel prior to blending, the RIN goes with the biodiesel. If we blend the biodiesel prior to selling it, we then sell the RINs with our blended biodiesel or we sell them separate from the biodiesel, dependent upon whether there is a market for the separated RINs and the prices at which they can be sold. However, no assurances can be given that a separate market for RINs will be sustained.
Future Strategy
Prior to 2009, the growth of the biodiesel industry had been significant. However, as the price of petrodiesel dropped in 2009, the relative cost of biodiesel increased due to rising prices of feedstocks (among other things), and the $1.00 producer credit terminated at the end of 2009 (with uncertainty about its reinstatement), the production of biodiesel in the United States decreased in 2009 and 2010. This trend may continue given challenging economic conditions and the leveling off of government requirements after 2012, as well as the uncertainty of the federal blender’s credit. See Pew Center on Global Climate Change, http://www.pewclimate.org/technology/factsheet/biodiesel. Researchers believe that the U.S. market will transition to larger plants, alternative feedstocks, and second generation technologies, resulting in a consolidation among smaller, first-generation producers accompanied by a series of mergers and acquisitions in the field. However, we believe that producers who are proactive in responding to these changes can benefit in this emerging market. These responses include: new and improved technologies; alternative feedstocks with higher yields; production scalability and flexibility options; supply chain, distribution, and co-location strategies; the sale of RINs separate from the underlying biodiesel; and innovative risk management strategies. See http://www.emerging-markets.com/biodiesel/default.asp.
Our future strategy for our biofuels segment is geared towards these responses. For example, in 2009, we commercialized two biobased solvents: FUTURESOL FAME and FUTURESOL Glysol, which we intend to market. In addition, we intend to expand our biodiesel capacity utilizing available facilities as market conditions dictate. All future capacity will be operated primarily in continuous processing mode to realize operating economies and optimum throughput. Existing and future processes will accommodate a wide range of feedstock oils, allowing optimization relative to supply and pricing. However, our continued production of biodiesel may be severely limited, or eliminated entirely, in the event Congress does not renew the $1.00 per gallon blenders tax credit past December 31, 2011. See “Risk Factors” beginning at page 16.
Customers and Markets
We currently market our biodiesel products by truck and rail directly to customers in the United States. Through the utilization of liquid bulk storage facilities and barge loading capabilities, we are positioned to market biodiesel throughout the United States for transportation and home heating fuel usage. For the twelve months ended December 31, 2010, 12 of our customers represented 80% of biofuels revenues (15% of total revenues) with the remaining 20% of biofuels revenues (5% of total revenues) spread across a large number of customers. Although the regional market is still being developed, we estimate that the regional direct market available to us at maturity will be at least 30 million gallons per year.
Competition
As of December 2010, there was a reported 2.73 billion gallons per year of biodiesel production capacity in the United States, although only approximately 545 million gallons of biodiesel were estimated to have been produced in 2009 (http://www.biodiesel.org.buyingbiodiesel/plants), and 280 million gallons of biodiesel were estimated to have been produced in 2010 (http://www.thebioenergysite.com/news/7153/international-bioenergy-days-2010-biodiesel-gets-burned). We compete with other producers of biodiesel, both locally, regionally, and nationally. There are four biodiesel plants in the state of Arkansas, but only our plant is currently operating. There are several operating facilities in surrounding states and announced biodiesel production facilities in surrounding states. We estimate that regional competitive producers had approximately 95 million gallons of capacity at the end of 2010. Our production and the national production of biodiesel were significantly reduced in 2010 for a number of reasons,
9
including uncertainty about the loss of the dollar tax credit, which has now been retroactively reinstated to January 1, 2010 (but which expires December 31, 2011). We anticipate that biodiesel production at our plant and nationally will likely increase in 2011 over 2010 with the renewal of the tax credit and the RFS2 mandate, although no assurances can be given that there will be such an increase.
In addition to biodiesel producers, we compete with new technologies that are being developed as alternatives to biodiesel. For example, biotech company LS9 Inc. announced that it is producing renewable diesel fuel from E. coli excrement. See http://www.biofuelsdigest.com/blog2/2010/01/28/jbei-ls9-reengineer-e-coli-to-produce-renewable-diesel-directly-from-biomass-cbp-arrives-in-the-drop-in-sphere/. UOP, a major supplier to the petrochemical refining industry, has also reported the development of technology for the conversion of natural oils and wastes to green diesel. See http://www.uop.com/renewables/10010.html. We cannot give any assurances that renewable diesel fuel, green diesel, or some other product produced by these competing technologies will not supplant biodiesel as an alternative to conventional petrodiesel.
Supply and Distribution
As a result of our feedstock-flexible process, we are able to source feedstock from a broad supplier base which includes pork, chicken, and beef rendering facilities from both national and regional suppliers. Soybean oil has been sourced from several national and regional producers. Cottonseed oil has been sourced from a regional cooperative. All feedstocks are currently supplied by either rail or truck. We believe that an adequate supply of feedstocks can be sourced to support anticipated production.
We intend that biodiesel and other biofuels will be sold from the plant site as well as shipped to liquid bulk storage facilities for further distribution. Sales from the plant site are made by railcar and tank truck. Biodiesel is being delivered to liquid bulk storage facilities by company-owned tank trucks and common carriers for distribution there and for further transportation by barge or tank truck.
Cyclicality and Seasonality
The following charts depict our monthly sales of biodiesel (in gallons) for 2009 and 2010.
 |
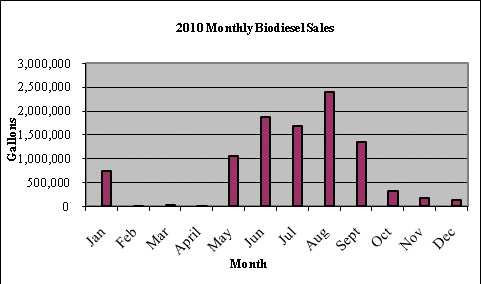 |
Our sales of biodiesel have been limited in winter months. Non-seasonal business (primarily on-road transportation) has not been sufficient regionally to generate biodiesel sales at blends greater than B5 in winter months at the end of farming activity. Also, cold weather usage and storage properties which reduce biodiesel demand during winter months require resolution in order to fully exploit year-round demand opportunities.
Chemicals Business Segment
Overview of the Segment
Our chemicals segment manufactures diversified chemical products that are sold externally to third party customers. This segment comprises two components: “custom manufacturing” (manufacturing chemicals for specific customers); and “performance chemicals” (multi-customer specialty chemicals). The chemicals segment had
10
revenue of $178,280,000, $143,759,000, and $155,553,000 for the years ended December 31, 2010, 2009, and 2008, respectively.
Chemical Products
Custom manufacturing involves producing unique products for individual customers, generally under long-term contracts. Many of these products are produced under confidentiality agreements in order to protect intellectual property. This is a service-based business where customers value technical capabilities, responsiveness, and process improvement to continually improve costs and reliability. Our plant’s custom manufacturing product portfolio includes two large products or product families which are generally produced throughout the year: (i) a bleach activator for a major detergent and consumer products manufacturer; and (ii) a proprietary herbicide (and intermediates) for a major life sciences company. The portfolio also contains a number of smaller products which are produced intermittently in a “batch campaign” mode, for diverse customers and end markets.
Performance chemicals comprise multi-customer products which are sold based upon specification and/or performance in the end-use application. This portfolio includes a family of polymer (nylon) modifiers and several small-volume specialty chemicals for diverse applications. In addition, we have recently been successful in growing our performance chemical business through new product development. New products include a family of acetal based solvents, including diethoxymethane, dimethoxymethane, dibutoxymethane, and glycerol formal, and phenol sulfonic acid, which build on our sulfonations technology.
Future Strategy
To build on and maintain our reputation as a technology-driven competitive chemical producer, we believe that we must continuously focus on cost control, operational efficiency, and capacity utilization to maximize earnings. The ability to utilize large scale batch and continuous production processes and a continuous focus on process improvements allow us to compete effectively in the custom manufacturing market and to remain cost competitive with, and for some products cost-advantaged over, our competitors. We intend to improve margins in this area of our business by careful management of product mix with regard to size of opportunity, timing to market, capital efficiency, and matching of opportunities to assets and capabilities.
We expect to derive significant growth in performance chemicals as a result of the application of new technologies to the conversion of biomass and waste carbon sources in order to produce a range of specialty chemical products. If we are successful in developing these products, they would represent a first generation of renewable chemicals that we believe would displace materials currently produced from fossil fuels. However, no assurances can be made that we will successfully develop such products or, if developed, that they will be accepted commercially.
Customers and Markets
Our chemical products are used in a variety of markets and end uses, including detergent, agrochemical, automotive, photographic imaging, coatings, nutrition, and polymer additives. These products are generally non-cyclical; however, the customers are often the “brand owners” and therefore control factors related to demand, such as market development strategy. In many cases, we may be unable to increase or maintain our level of sales revenue for these products.
All sales of the bleach activator are made to The Procter & Gamble Company pursuant to a multi-year supply agreement that was effective April 1, 2008. Sales of the bleach activator totaled $79,537,000, $73,466,000, and $83,995,000 for the years ended December 31, 2010, 2009, and 2008, respectively. Additionally, all sales of a proprietary herbicide and certain other intermediates used in the production of this herbicide are made to Arysta LifeScience North America Corporation pursuant to contracts which continue year-to-year unless terminated by notice given no later than 270 days prior to the end of the current term for the herbicide and not later than 18 months prior to the current term for the intermediates. No assurances can be given that these contracts will not be terminated. Sales of this herbicide and its intermediates totaled $36,509,000, $31,587,000, and $34,156,000 for the years ended December 31, 2010, 2009, and 2008, respectively. These two customers represented approximately 54%, 53%, and 60% of our revenues in 2010, 2009, and 2008, respectively.
11
Competition
Historically, there have been significant barriers to entry for competitors with respect to chemicals primarily due to the fact that the relevant technology and manufacturing capability has been held by a small number of companies. As technology and investment have increasingly moved outside of North America, competition from multi-national chemical manufacturers has intensified, primarily from India and China. We compete with these and other producers primarily based on price, customer service, technology, quality, and reliability. Our major competitors in this segment include large multi-national companies with specialty chemical business units, and smaller independent producers. The multi-national competitors are often disadvantaged by poor responsiveness and customer service, while the small producers often have limited technology and financial resources. We believe that we should be well positioned for growth due to the combination of our scale of operations, technical capabilities, and financial resources.
Supply and Distribution
Specialty chemicals are generally high unit value products sold in packaged, or low-volume bulk form, for which distribution is a relatively minor component of cost. Most products are sold FOB the Batesville site for distribution globally. Similarly, raw materials for these products are comparatively higher-value components that are sourced globally. An exception will be the biofuels co-products, which will be recovered from local processing and purified or further functionalized into other products at the site.
Cyclicality and Seasonality
Our chemical products typically are not cyclical but they are sensitive to global economic conditions. Supply and demand dynamics determine profitability at different stages of cycles and global economic conditions affect the length of each cycle. Despite some sensitivity to global economic conditions, many of the products in the chemical segment provide a stable foundation of earnings.
Backlog
The majority of our revenues are derived under custom manufacturing agreements with specific customers. These customers generally provide us with forecasts of demand on a monthly or quarterly basis. These forecasts are intended to enable us to optimize the efficiency of our production processes and generally are not firm sales orders. As such, we do not monitor or report backlog.
Intellectual Property
We consider our intellectual property portfolio to be a valuable corporate asset which we intend to expand and protect globally through a combination of trade secrets, confidentiality and non-disclosure agreements, patents, and copyrights. As a producer of a broad and diverse portfolio of chemicals, our intellectual property relates to a wide variety of products and processes acquired through the development and manufacture of over 300 specialty chemicals during the history of the site. Our primary strategy regarding our intellectual property portfolio will be to appropriately protect all innovations and know-how in order to provide our business segments with a technology-based competitive advantage wherever possible. In the chemicals business segment, custom manufacturing projects are primarily conducted within the framework of confidentiality agreements with each customer to ensure that intellectual property rights are defined and protected. In the biofuels business segment, innovations and process know-how will be vigorously protected as appropriate. As may be necessary, we will seek to license technology from third parties that complements our strategic business objectives. Neither our business as a whole nor any particular segment is materially dependent upon any one particular patent, copyright, or trade secret. As the laws of many foreign countries do not protect intellectual property to the same extent as the laws of the United States, we can make no assurance that we will be able to adequately protect all of our intellectual property assets.
12
Research and Development
We devote significant resources to our research and development programs which are primarily targeted towards two objectives:
|
|
·
|
innovating, developing, and improving biofuels processes, in particular biodiesel and other biofuels, including value-up technology and applications for co-products; and
|
|
|
·
|
developing and improving processes for custom manufacturing products and performance chemicals.
|
Our research and development capabilities comprise analytical chemistry competencies to assay and characterize raw materials and products, organic chemistry expertise applied across a breadth of reaction chemistries and materials, and process engineering capabilities for batch and continuous processing of both solid and liquid materials. We believe that these core competencies, established in support of the legacy chemical business, are applicable to building a technology-based position in biofuels and associated biobased specialty products.
Research and development expense incurred by us for the years ended December 31, 2010, 2009, and 2008 were $3,494,000, $4,165,000, and $3,951,000, respectively. Substantially all of such research and development expense related to the development of new products, services, and processes or the improvement of existing products, services, and processes.
Environmental Matters
Various aspects of our operations are subject to regulation by state and federal agencies. Biofuel and chemical operations are subject to numerous, stringent, and complex laws and regulations at the federal, state, and local levels governing the discharge of materials into the environment or otherwise relating to environmental protection. These laws and regulations may:
|
|
·
|
require acquisition of permits regarding discharges into the air and discharge of waste waters;
|
|
|
·
|
place restrictions on the handling and disposal of hazardous and other wastes; and
|
|
|
·
|
require capital expenditures to implement pollution control equipment.
|
Compliance with such laws and regulations can be costly and noncompliance can result in substantial civil and even criminal penalties. Some environmental laws impose strict liability for environmental contamination, rendering a person liable for environmental damages and cleanup costs without regard to negligence or fault. Moreover, public interest in the protection of the environment has increased substantially in recent years. Our operations could be adversely affected to the extent laws are enacted or other governmental action is taken that imposes environmental protection requirements that result in increased costs to the biofuels and/or chemical manufacturing industry in general. The following provides a general discussion of some of the significant environmental laws and regulations that impact our activities.
The federal Comprehensive Environmental Response, Compensation and Liability Act (“CERCLA”), and analogous state laws, impose joint and several liability, without regard to fault or the legality of the original act, on certain classes of persons that contributed to the release of a hazardous substance into the environment. These persons include the owner and operator of the site where the release occurred, past owners and operators of the site, and companies that disposed or arranged for the disposal of hazardous substances found at the site. Responsible parties under CERCLA may be liable for the costs of cleaning up hazardous substances that have been released into the environment and for damages to natural resources. Additionally, it is not uncommon for third parties to assert claims for personal injury and property damage allegedly caused by the release of hazardous substances or other pollutants into the environment.
The federal Solid Waste Disposal Act, as amended by the Resource Conservation and Recovery Act (“RCRA”), is the principal federal statute governing the management of wastes, including the treatment, storage, and disposal of hazardous wastes. RCRA imposes stringent operating requirements, and liability for failure to meet such
13
requirements, on a person who is either a generator or transporter of hazardous waste or an owner or operator of a hazardous waste treatment, storage, or disposal facility. Many of the wastes generated in our manufacturing facility are governed by RCRA.
The federal Oil Pollution Act of 1990 (“OPA”) and regulations thereunder impose liability on responsible parties for damages resulting from oil spills into or upon navigable waters, adjoining shorelines, or in the exclusive economic zone of the United States. A responsible party includes the owner or operator of an onshore facility. OPA limits liability for onshore facilities to $350 million. These liability limits may not apply if a spill is caused by a party’s gross negligence or willful misconduct, the spill resulted from violation of a federal safety, construction, or operating regulation, or if a party fails to report a spill or to cooperate fully in a clean-up. Failure to comply with OPA’s requirements may subject a responsible party to civil, criminal, or administrative enforcement actions.
The federal Water Pollution Control Act (“Clean Water Act”) imposes restrictions and controls on the discharge of pollutants into navigable waters. These controls have become more stringent over the years, and it is possible that additional restrictions may be imposed in the future. Permits must be obtained to discharge pollutants into state and federal waters. The Clean Water Act provides for civil, criminal, and administrative penalties for discharges of oil and other pollutants, and imposes liability on parties responsible for those discharges for the costs of cleaning up any environmental damage caused by the release and for natural resource damages resulting from the release. Comparable state statutes impose liability and authorize penalties in the case of an unauthorized discharge of petroleum or its derivatives, or other pollutants, into state waters.
The federal Clean Air Act (“Clean Air Act”), and associated state laws and regulations, restrict the emission of air pollutants from many sources, including facilities involved in manufacturing chemicals and biofuels. New facilities are generally required to obtain permits before operations can commence, and new or existing facilities may be required to incur certain capital expenditures to install air pollution control equipment in connection with obtaining and maintaining operating permits and approvals. Federal and state regulatory agencies can impose administrative, civil, and criminal penalties for non-compliance with permits or other requirements of the Clean Air Act and associated state laws and regulations.
The federal Endangered Species Act, the federal Marine Mammal Protection Act, and similar federal and state wildlife protection laws prohibit or restrict activities that could adversely impact protected plant and animal species or habitats. Manufacturing activities could be prohibited or delayed in areas where such protected species or habitats may be located, or expensive mitigation may be required to accommodate such activities.
Our policy is to operate our plant and facilities in a manner that protects the environment and the health and safety of our employees and the public. We intend to continue to make expenditures for environmental protection and improvements in a timely manner consistent with our policies and with the technology available. In some cases, applicable environmental regulations such as those adopted under the Clean Air Act and RCRA, and related actions of regulatory agencies, determine the timing and amount of environmental costs incurred by us.
We establish reserves for closure/post-closure costs associated with the environmental and other assets we maintain. Environmental assets include waste management units such as incinerators, landfills, storage tanks, and boilers. When these types of assets are constructed or installed, a reserve is established for the future costs anticipated to be associated with the closure of the site based on the expected life of the environmental assets, the applicable regulatory closure requirements, and our environmental policies and practices. These expenses are charged into earnings over the estimated useful life of the assets. Currently, we estimate the useful life of each individual asset up to 35 years.
In addition to our general environmental policies and policies for asset retirement obligations and environmental reserves, we accrue environmental costs when it is probable that we have incurred a liability and the amount can be reasonably estimated. In some instances, the amount cannot be reasonably estimated due to insufficient data, particularly in the nature and timing of the future performance. In these cases, the liability is monitored until such time that sufficient data exists. With respect to a contaminated site, the amount accrued reflects our assumptions about remedial requirements at the site, the nature of the remedy, the outcome of discussions with regulatory agencies and other potentially responsible parties at multi-party sites, and the number and financial viability of other potentially responsible parties. Changes in the estimates on which the accruals are based, unanticipated government
14
enforcement action, or changes in health, safety, environmental, chemical control regulations, and testing requirements could result in higher or lower costs.
Our cash expenditures related to environmental protection and improvement were approximately $9,376,000, $9,923,000, and $11,507,000 for the years ended December 31, 2010, 2009, and 2008, respectively. These amounts pertain primarily to operating costs associated with environmental protection equipment and facilities, but also include expenditures for construction and development. We do not expect future environmental capital expenditures arising from requirements of environmental laws and regulations to materially increase our planned level of annual capital expenditures for environmental control facilities.
We believe that we have obtained in all material respects the necessary environmental permits and licenses to carry on our operations as presently conducted. We have reviewed environmental investigations of the properties owned by us and believe, on the basis of the results of the investigations carried out to date, that there are no material environmental issues which adversely impact us. In addition, under our acquisition agreement with Eastman Chemical Company, Eastman Chemical Company acquired environmental insurance with respect to environmental conditions at the Batesville plant existing as of the closing date and Eastman Chemical Company has agreed, subject to certain limitations, to indemnify FutureFuel Chemical Company with respect to such environmental conditions through October 31, 2011.
Management Team and Workforce
Our executive management team at the Batesville plant consists of four individuals with a combined 100 plus years of experience in the chemicals industry, comprising technical, operational, and business responsibilities. The members of the executive team also have international experience, including assignments in Europe and Asia. The operational and commercial management group at the Batesville site includes six additional degreed professionals with an average experience of over 20 years in the chemical industry.
The Batesville workforce comprises approximately 490 full-time employees (in addition to the ten senior managers), with a total of 75 degreed professionals, including 19 chemists (10 PhDs) and 40 engineers (including 10 licensed professional engineers and 21 chemical engineers). The site is non-unionized. Operations personnel are highly skilled as all site manufacturing and infrastructure is fully automated and computer-controlled. The workforce is substantially self-sufficient in the range of required operational skills and experience due to the lack of locally-available process industry infrastructure. Voluntary attrition at the site has averaged less than 1.6% annually since 2006.
Financial Information about Geographic Areas
Most of our sales are FOB the Batesville plant, although some FOB points are in other states or at foreign ports. While many of our chemicals are utilized to manufacture products that are shipped, further processed, and/or consumed throughout the world, the chemical products, with limited exceptions, generally leave the United States only after ownership has transferred from us to the customer. Rarely are we the exporter of record, never are we the importer of record into foreign countries, and we are not always aware of the exact quantities of our products that are moved into foreign markets by our customers. We do track the addresses of our customers for invoicing purposes and use this address to determine whether a particular sale is within or outside the United States. Our revenues for the last three fiscal years attributable to the United States and foreign countries (based upon the billing addresses of our customers) were as set forth in the following table.
(Dollars in thousands)
|
Period
|
United States
|
All Foreign
Countries
|
Total
|
|||||||||
|
Year ended December 31, 2010
|
$ | 201,496 | $ | 17,687 | $ | 219,183 | ||||||
|
Year ended December 31, 2009
|
$ | 179,505 | $ | 17,206 | $ | 196,711 | ||||||
|
Year ended December 31, 2008
|
$ | 164,963 | $ | 33,367 | $ | 198,330 | ||||||
For the years ended December 31, 2010, 2009, and 2008, revenues from Mexico accounted for 7%, 8%, and 11%, respectively, of total revenues. During 2008, FutureFuel Chemical Company sold significant quantities of biodiesel
15
to companies from Canada, during which time revenues from Canada became a material component of total revenues. Revenues from Canada accounted for 0%, 0%, and 5% of total revenues for each of the years ended December 31, 2010, 2009, and 2008, respectively. Other than Mexico and Canada, revenues from a single foreign country during 2010, 2009, and 2008 did not exceed 1% of our total revenues.
All of our long-lived assets are located in the United States.
Available Information
We file annual, quarterly, and other reports, proxy statements, and other information with the SEC. You may read and copy any materials that we file with the SEC at the SEC’s Public Reference Room at 100 F Street, NE, Washington, DC 20549. You may obtain information on the operation of the Public Reference Room by calling the SEC at 1-800-SEC-0330. The SEC maintains an Internet site that contains reports, proxy and information statements, and other information regarding issuers such as us that file electronically with the SEC. You may access that site at http://www.sec.gov.
Such documents may also be viewed at our website at http://ir.futurefuelcorporation.com/sec.cfm.
We make available free of charge, through the “Investor Relations - SEC Filings” section of our Internet website (http://ir.futurefuelcorporation.com/sec.cfm), our annual reports on Form 10-K, quarterly reports on Form 10-Q, current reports on Form 8-K, and amendments to those reports, filed or furnished pursuant to Section 13(a) or 15(d) of the Exchange Act, as soon as reasonably practicable after electronically filing such material with, or furnishing it to, the SEC.
We also make available free of charge, through the “Investor Relations - Corporate Governance” section of our website (http://ir.futurefuelcorporation.com/governance.cfm), the corporate governance guidelines of our board of directors, the charters of each of the committees of our board of directors, and the code of business conduct and ethics for our directors, officers, and employees. Such materials will be made available in print upon the written request of any shareholder to FutureFuel Corp., 8235 Forsyth Blvd., 4th Floor, Clayton, Missouri 63105, Attention: Investor Relations.
An investment in us involves a high degree of risk and may result in the loss of all or part of your investment. You should consider carefully all of the information set out in this document and the risks attaching to an investment in us, including, in particular, the risks described below. The information below does not purport to be an exhaustive list and should be considered in conjunction with the contents of the rest of this document.
Risks Associated With Our Business Activities
The federal excise tax credit for biodiesel will expire on December 31, 2011 and Congress has not enacted legislation to extend this credit. If the credit is not renewed, our cost of producing biodiesel will be increased, which could have an adverse effect on our financial position.
In October 2004, Congress passed a biodiesel tax incentive, structured as a federal excise tax credit, as part of the American Jobs Creation Act of 2004. The credit amounted to one cent for each percentage point of vegetable oil or animal fat biodiesel that was blended with petrodiesel (and one-half cent for each percentage point of recycled oils and other non-agricultural biodiesel, subsequently amended and increased to one cent). For example, blenders that blended B20 made from soy, canola, and other vegetable oils and animal fats received a 20¢ per gallon excise tax credit. The tax incentive generally was taken by petroleum distributors and was passed on to the consumer. It was designed to lower the cost of biodiesel to consumers in both taxable and tax-exempt markets. The tax credit was scheduled to expire at the end of 2006, but was extended in the Energy Policy Act of 2005 to December 31, 2008 and most recently it was extended to December 31, 2011.
Congress has not enacted any legislation to extend this tax credit beyond December 31, 2011 and it expires at that time. If biodiesel feedstock costs do not decrease significantly relative to biodiesel prices, we could realize a
16
negative gross margin on biodiesel. As a result, we could cease producing biodiesel, which could have an adverse effect on our financial condition.
The industries in which we compete are highly competitive.
The biodiesel industry, as well as the chemical business, are highly competitive. There is competition within these industries and also with other industries in supplying the energy, fuel, and chemical needs of industry and individual consumers. We compete with other firms in the sale or purchase of various goods or services in many national and international markets. We compete with large national and multi-national companies that have longer operating histories, greater financial, technical, and other resources, and greater name recognition than we do. In addition, we compete with several smaller companies capable of competing effectively on a regional or local basis, and the number of these smaller companies is increasing. Our competitors may be able to respond more quickly to new or emerging technologies and services and changes in customer requirements. As a result of competition, we may lose market share or be unable to maintain or increase prices for our products and/or services or to acquire additional business opportunities, which could have a material adverse effect on our business, financial condition, results of operations, and cash flows. Although we will employ all methods of competition which are lawful and appropriate for such purposes, no assurances can be made that they will be successful. A key component of our competitive position, particularly given the expected commodity-based nature of many of our products, will be our ability to manage expenses successfully, which requires continuous management focus on reducing unit costs and improving efficiency. No assurances can be given that we will be able to successfully manage such expenses.
Our competitive position in the markets in which we participate is, in part, subject to external factors in addition to those that we can impact. Natural disasters, changes in laws or regulations, war or other outbreak of hostilities, or other political factors in any of the countries or regions in which we operate or do business, or in countries or regions that are key suppliers of strategic raw materials, could negatively impact our competitive position and our ability to maintain market share.
Production of biodiesel requires adequate supplies of cost-effective feedstocks. Our inability to acquire adequate volumes of feedstocks may adversely affect our anticipated results of operation and financial condition.
Reaching the federally mandated one billion gallons of biodiesel use by 2012, if met through soybean-based biodiesel alone, would require about 690 million bushels of soybeans, which is about 22% of the U.S. annual soybean crop. Analysts have cautioned that using more than 35% of the soybean crop for biodiesel would cause significant shocks in food and agricultural markets. To increase consumption beyond 1.5 billion gallons of soy-based biodiesel, the U.S. would need to depend on imports, continue increasing soybean yields, or develop other feedstocks and/or conversion processes. Although waste feedstocks are available for biodiesel production, the quantities of such wastes are limited (wastes generated in the U.S. would yield on an annual basis approximately 390 million gallons of biodiesel (150 million gallons from yellow grease and 240 million gallons from animal fats)). See Pew Center on Global Climate Change, http://www.pewclimate.org/technology/factsheet/biodiesel. There are several sources of additional feedstock that could be developed in the near-term (such as algae), but no assurances can be made that they will be developed or, if developed, that they will be available at a cost-effective price. Accordingly, as annual production of biodiesel in the United States increases, the availability of feedstocks could become scarce and/or prices of feedstocks could increase, either of which could adversely affect our results of operations and financial conditions.
Anti-subsidy and anti-dumping complaints have been filed with the European Commission concerning imports of biodiesel originating in the United States. The existence of such complaints, and an adverse decision by the European Commission, could reduce demand for biodiesel produced in the United States.
Anti-subsidy and anti-dumping complaints have been filed with the European Commission concerning imports of biodiesel originating in the United States. The European Commission initiated an investigation into these complaints on August 12, 2010 to determine whether anti-dumping and countervailing measures imposed by the European Commission on imports of biodiesel originating in the United States had been circumvented. This investigation is currently pending. Although we are not a target of such complaints and do not import biodiesel into the European community, the existence of such complaints, and an adverse decision by the European Commission,
17
could reduce demand for biodiesel produced in the United States. Such a reduction in demand could reduce the amount of biodiesel that we sell, which could have an adverse effect on our financial condition.
Fluctuations in commodity prices may cause a reduction in the demand or profitability of the products or services we produce.
Prices for alternative fuels tend to fluctuate widely based on a variety of political and economic factors. These price fluctuations heavily influence the oil and gas industry. Lower energy prices for existing products tend to limit the demand for alternative forms of energy services and related products and infrastructure. Historically, the markets for alternative fuels have been volatile, and they are likely to continue to be volatile. Wide fluctuations in alternative fuel prices may result from relatively minor changes in the supply of and demand for oil and natural gas, market uncertainty, and other factors that are beyond our control, including:
|
|
·
|
worldwide and domestic supplies of oil and gas;
|
|
|
·
|
the price and/or availability of biodiesel feedstocks;
|
|
|
·
|
weather conditions;
|
|
|
·
|
the level of consumer demand;
|
|
|
·
|
the price and availability of alternative fuels;
|
|
|
·
|
the availability of pipeline and refining capacity;
|
|
|
·
|
the price and level of foreign imports;
|
|
|
·
|
domestic and foreign governmental regulations and taxes;
|
|
|
·
|
the ability of the members of the Organization of Petroleum Exporting Countries to agree to and maintain oil price and production controls;
|
|
|
·
|
political instability or armed conflict in oil-producing regions; and
|
|
|
·
|
the overall economic environment.
|
These factors and the volatility of the commodity markets make it extremely difficult to predict future alternative fuel price movements with any certainty. There may be a decrease in the demand for our products or services and our profitability could be adversely affected.
We are reliant on certain strategic raw materials for our operations.
We are reliant on certain strategic raw materials (such as acetic anhydride, pelargonic acid, soybean oil, and methanol) for our operations. We have implemented certain risk management tools, such as multiple suppliers and hedging, as appropriate, to mitigate short-term market fluctuations in raw material supply and costs. There can be no assurance, however, that such measures will result in cost savings or that all market fluctuation exposure will be eliminated. In addition, natural disasters, changes in laws or regulations, war or other outbreak of hostilities, or other political factors in any of the countries or regions in which we operate or do business, or in countries or regions that are key suppliers of strategic raw materials, could affect availability and costs of raw materials.
While temporary shortages of raw materials may occasionally occur, these items have historically been sufficiently available to cover current requirements. However, their continuous availability and price are impacted by natural disasters, plant interruptions occurring during periods of high demand, domestic and world market and political conditions, changes in government regulation, and war or other outbreak of hostilities. In addition, as we increase our biodiesel capacity, we will require larger supplies of raw materials which have not yet been secured and may not be available for the foregoing reasons, or may be available only at prices higher than current levels. Our operations or products may, at times, be adversely affected by these factors.
18
We are reliant upon two customers for a substantial amount of our sales.
All sales of the bleach activator are made to The Procter & Gamble Company and all sales of a proprietary herbicide and certain other intermediates used in the production of this herbicide are made to Arysta LifeScience North America Corporation. These two customers represented approximately 54% of our revenues for the year ended December 31, 2010. The contract with The Procter & Gamble Company is a multi-year contract and no assurances can be given that such contract will be extended or, if extended, upon what terms. The contracts with Arysta LifeScience North America Corporation contain certain termination provisions and no assurances can be given that these contracts will not be terminated. The loss of these two companies as customers would have a material adverse effect on us.
Changes in technology may render our products or services obsolete.
The alternative fuel and chemical industries may be substantially affected by rapid and significant changes in technology. Examples include competitive product technologies, such as green gasoline and renewable diesel produced from catalytic hydroforming of renewable feedstock oils and competitive process technologies such as advanced biodiesel continuous reactor and washing designs that increase throughput. These changes may render obsolete certain existing products, energy sources, services, and technologies currently used by us. We cannot assure you that the technologies used by or relied upon by us will not be subject to such obsolescence. While we may attempt to adapt and apply the services provided by us to newer technologies, we cannot assure you that we will have sufficient resources to fund these changes or that these changes will ultimately prove successful.
Failure to comply with governmental regulations could result in the imposition of penalties, fines, or restrictions on operations and remedial liabilities.
The biofuel and chemical industries are subject to extensive federal, state, local, and foreign laws and regulations related to the general population’s health and safety and those associated with compliance and permitting obligations (including those related to the use, storage, handling, discharge, emission, and disposal of municipal solid waste and other waste, pollutants or hazardous substances or waste, or discharges and air and other emissions) as well as land use and development. Existing laws also impose obligations to clean up contaminated properties or to pay for the cost of such remediation, often upon parties that did not actually cause the contamination. Compliance with these laws, regulations, and obligations could require substantial capital expenditures. Failure to comply could result in the imposition of penalties, fines, or restrictions on operations and remedial liabilities. These costs and liabilities could adversely affect our operations.
Changes in environmental laws and regulations occur frequently, and any changes that result in more stringent or costly waste handling, storage, transport, disposal, or cleanup requirements could require us to make significant expenditures to attain and maintain compliance and may otherwise have a material adverse effect on our business segments in general and on our results of operations, competitive position, or financial condition. We are unable to predict the effect of additional environmental laws and regulations which may be adopted in the future, including whether any such laws or regulations would materially adversely increase our cost of doing business or affect our operations in any area.
Under certain environmental laws and regulations, we could be held strictly liable for the removal or remediation of previously released materials or property contamination regardless of whether we were responsible for the release or contamination, or if current or prior operations were conducted consistent with accepted standards of practice. Such liabilities can be significant and, if imposed, could have a material adverse effect on our financial condition or results of operations.
Our biofuels operations may be harmed if the government were to change current laws and regulations.
Alternative fuels businesses benefit from tax credits and government subsidies. If any of the state or federal laws and regulations relating to the tax credits and government subsidies change, the ability to recover capital expenditures from our alternative fuels business could be harmed. Our biofuels platform is subject to federal, state, and local laws and regulations governing the application and use of alternative energy products, including those related specifically to biodiesel. For instance, biodiesel products benefit from being the only alternative fuel certified by the Environmental Protection Agency that fulfills the requirements of Section 211(B) of the Clean Air
19
Act. If agency determinations, laws, and regulations relating to the application and use of alternative energy are changed, the marketability and sales of biodiesel production could be materially adversely affected.
Market conditions or transportation impediments may hinder access to raw goods and distribution markets.
Market conditions, the unavailability of satisfactory transportation, or the location of our manufacturing complex from more lucrative markets may hinder our access to raw goods and/or distribution markets. The availability of a ready market for biodiesel depends on a number of factors, including the demand for and supply of biodiesel and the proximity of the plant to trucking and terminal facilities. The sale of large quantities of biodiesel necessitates that we transport our biodiesel to other markets since the Batesville, Arkansas regional market is not expected to absorb all of our contemplated production. Currently, common carrier pipelines are not transporting biodiesel or biodiesel/ petrodiesel blends. This leaves trucks, barges, and rail cars as the means of distribution of our product from the plant to these storage terminals for further distribution. However, the current availability of rail cars is limited and at times unavailable because of repairs or improvements, or as a result of priority transportation agreements with other shippers. Additionally, the current availability of barges is limited, particularly heated barges to transport biodiesel during winter months. If transportation is restricted or is unavailable, we may not be able to sell into more lucrative markets and consequently our cash flow from sales of biodiesel could be restricted.
The biodiesel industry also faces several challenges to wide biodiesel acceptance, including cold temperature limitations, storage stability, fuel quality standards, and exhaust emissions. If the industry does not satisfy consumers that these issues have been resolved or are being resolved, biodiesel may not gain widespread acceptance which may have an adverse impact on our cash flow from sales of biodiesel.
Our insurance may not protect us against our business and operating risks.
We maintain insurance for some, but not all, of the potential risks and liabilities associated with our business. For some risks, we may not obtain insurance if we believe the cost of available insurance is excessive relative to the risks presented. As a result of market conditions, premiums and deductibles for certain insurance policies can increase substantially and, in some instances, certain insurance policies may become unavailable or available only for reduced amounts of coverage. As a result, we may not be able to renew our existing insurance policies or procure other desirable insurance on commercially reasonable terms, if at all. Although we will maintain insurance at levels we believe are appropriate for our business and consistent with industry practice, we will not be fully insured against all risks which cannot be sourced on economic terms. In addition, pollution and environmental risks generally are not fully insurable. Losses and liabilities from uninsured and underinsured events and delay in the payment of insurance proceeds could have a material adverse effect on our financial condition and results of operations.
If a significant accident or other event resulting in damage to our operations (including severe weather, terrorist acts, war, civil disturbances, pollution, or environmental damage) occurs and is not fully covered by insurance or a recoverable indemnity from a customer, it could adversely affect our financial condition and results of operations.
We depend on key personnel, the loss of any of whom could materially adversely affect our future operations.
Our success will depend to a significant extent upon the efforts and abilities of our executive officers. The loss of the services of one or more of these key employees could have a material adverse effect on us. Our business will also be dependent upon our ability to attract and retain qualified personnel. Acquiring or retaining these personnel could prove more difficult to hire or cost substantially more than estimated. This could cause us to incur greater costs, or prevent us from pursuing our expansion strategy as quickly as we would otherwise wish to do.
If we are unable to effectively manage the commodity price risk of our raw materials or finished goods, we may have unexpected losses.
We hedge our raw materials and/or finished products for our biofuels segment to some degree to manage the commodity price risk of such items. This requires the purchase or sale of commodity futures contracts and/or options on those contracts or similar financial instruments. We may be forced to make cash deposits available to counterparties as they mark-to-market these financial hedges. This funding requirement may limit the level of commodity price risk management that we are prudently able to complete. If we do not or are not capable of
20
managing the commodity price risk of our raw materials and/or finished products for our biofuels segment, we may incur losses as a result of price fluctuations with respect to these raw materials and/or finished products.
In most cases we are not capable of hedging raw material and/or finished products for our chemicals segment. Certain of our products are produced under manufacturing agreements with our customers which provide us the contractual ability to pass along raw material price increases. However, we do not have this protection for all product lines within the chemicals segment. If we do not or are not capable of managing escalating raw material prices and/or passing these increases along to our customers via prices for our finished products, we may incur losses.
If we are unable to acquire or renew permits and approvals required for our operations, we may be forced to suspend or cease operations altogether.
The operation of our manufacturing plant requires numerous permits and approvals from governmental agencies. We may not be able to obtain all necessary permits (or modifications thereto) and approvals and, as a result, our operations may be adversely affected. In addition, obtaining all necessary renewal permits (or modifications to existing permits) and approvals for future expansions may necessitate substantial expenditures and may create a significant risk of expensive delays or loss of value if a project is unable to function as planned due to changing requirements.
The lack of business diversification may adversely affect our results of operations.
It is possible that we will not consummate more than one business combination with the proceeds from our July 2006 offering and FutureFuel Chemical Company may be the only target business that we acquire. Accordingly, the prospects for our success may be entirely dependent upon FutureFuel Chemical Company. Unlike other entities which may have the resources to complete several business combinations of entities operating in multiple industries or multiple areas of a single industry, it is possible that we will not have the resources to diversify effectively our operations or benefit from the possible spreading of risks or offsetting of losses.
Our indebtedness may limit our ability to borrow additional funds or capitalize on acquisition or other business opportunities.
We have entered into a $50 million revolving credit facility with a commercial bank. The restrictions governing this indebtedness (such as total debt to EBITDA limitations) may reduce our ability to incur additional indebtedness, engage in certain transactions, or capitalize on acquisition or other business opportunities. If we are unable to meet our future debt service obligations and other financial obligations, we could be forced to restructure or refinance such indebtedness and other financial transactions, seek additional equity, or sell assets.
We expect to have capital expenditure requirements, and we may be unable to obtain needed financing on satisfactory terms.
We expect to make capital expenditures for the expansion of our biofuels and chemicals production capacity and complementary infrastructure. We intend to finance these capital expenditures primarily through cash flow from our operations, borrowings under our credit facility, and existing cash. However, if our capital requirements vary materially from those provided for in our current projections, we may require additional financing sooner than anticipated. A decrease in expected revenues or adverse change in market conditions could make obtaining this financing economically unattractive or impossible. As a result, we may lack the capital necessary to complete the projected expansions or capitalize on other business opportunities.
We may be unable to successfully integrate future acquisitions with our operations or realize all of the anticipated benefits of such acquisitions.
Failure to successfully integrate future acquisitions, if any, in a timely manner may have a material adverse effect on our business, financial condition, results of operations, and cash flows. The difficulties of combining acquired operations include, among other things:
|
|
·
|
operating a significantly larger combined organization;
|
21
|
|
·
|
consolidating corporate technological and administrative functions;
|
|
|
·
|
integrating internal controls and other corporate governance matters; and
|
|
|
·
|
diverting management’s attention from other business concerns.
|
In addition, we may not realize all of the anticipated benefits from future acquisitions, such as increased earnings, cost savings, and revenue enhancements, for various reasons, including difficulties integrating operations and personnel, higher and unexpected acquisition and operating costs, unknown liabilities, and fluctuations in markets. If benefits from future acquisitions do not meet the expectations of financial or industry analysts, the market price of our shares of common stock may decline.
Risks Associated With Owning Our Shares
A minimum holding period for our shares received upon exercise of our warrants commenced upon the exercise of such warrants.
The shares of our common stock issued upon the exercise of a warrant generally are considered restricted securities subject to a six-month holding period. In general, a security holder who has not been our affiliate for three months may resell these securities without any restriction after satisfying the six-month holding period, provided that we are current in our SEC filings. The Rule 144 holding period for the shares of our common stock received upon exercise of our warrants started upon the exercise of such warrants. Accordingly, holders of our warrants that exercised their warrants for cash received shares of our common stock subject to trading restrictions which are greater than those imposed on the trading of previously issued shares. Such restrictions may mean the value of the shares received upon exercise of the warrants may be significantly lower, at least until the six-month holding period has expired, than the shares originally issued.
If our founding shareholders and Mr. Novelly or his designees exercise their registration rights, such exercise may have an adverse effect on the market price of our shares of common stock.
Those shareholders holding shares of our common stock prior to our July 2006 offering (the “founding shareholders”; see “Item 12. Security Ownership of Certain Beneficial Owners and Management and Related Stockholder Matters -- Founding Shares Owned by the Founding Shareholders” below for a list of the founding shareholders) and Mr. Paul A. Novelly, our executive chairman of the board, or his designees, are entitled to demand that we register under the Securities Act of 1933, as amended (the “Securities Act”), the resale of their shares of our common stock issued prior to our July 2006 offering (the “founding shares”) and their shares included in the units purchased in our July 2006 offering. The demand may be made at any time after the date on which we have become a reporting company under the Exchange Act, and their founding shares have been released from escrow. This occurred on July 12, 2009. If our founding shareholders exercise their registration rights with respect to all of their shares of our common stock, there will be an additional 16,250,000 shares (which includes the 5,000,000 shares issued on exercise of their warrants) eligible for trading in the public market. The presence of this additional number of shares eligible for trading in the public market may have an adverse effect on the market price of our shares.
We may be suspended or delisted from the New York Stock Exchange if we do not satisfy their continued listing requirements.
Under the investor rights agreement that we entered into on July 12, 2006 with CRT Capital Group LLC and KBC Peel Hunt Ltd, we were obligated to use our commercially reasonable efforts to cause our shares of common stock to be authorized to be quoted and/or listed (to the extent applicable) on the American Stock Exchange, the NYSE, the NASD Automated Quotation System, or the NASDAQ National Market (or, in each case, a successor thereto) or a similarly recognized national trading platform, if our common stock so qualified. Prior to December 2008, we did not satisfy the listing requirements of any such exchange other than the OTC Bulletin Board. Application for listing was made to the OTC Bulletin Board and our shares of common stock are quoted thereon. In December 2008, we met the listing requirements for certain of the NASDAQ markets, and in December 2010 we met the listing requirements for the NYSE. We determined that it was in the best interests of the Company and our shareholders to list on the NYSE. We applied for such listing and we were authorized to list our common stock on the NYSE on
22
March 8, 2011. We expect our common stock to commence trading on the NYSE on March 23, 2011 under the symbol “FF”.
Securities admitted to the NYSE may be suspended from dealing or delisted at any time the listed company fails to satisfy certain continued listing criteria. These criteria could be triggered if, among other things, the number of our publicly-held shares falls below 600,000, the average closing price of our common stock is less than $1.00 per share over a consecutive 30 trading-day period, or we fail to file certain reports with the SEC. As a matter of practice, the NYSE generally gives a listed company notice if any of these criteria are triggered, and generally provides the listed company with certain cure periods. If we suffer such an event but do not cure it, or if such event cannot be cured, trading of our common stock on the NYSE may be suspended from dealing or our stock may be delisted. Any such suspension or delisting may have an adverse effect on the market price of our common stock.
We may issue substantial amounts of additional shares without stockholder approval.
Our certificate of incorporation authorizes the issuance of 75,000,000 shares of common stock and 5,000,000 shares of preferred stock. We have filed with the SEC a Form S-3 Registration Statement commonly known as a “shelf registration”. Pursuant to this registration statement, we may issue common stock or preferred stock, or warrants or rights, or units comprised of any of the foregoing, in an amount not to exceed $50 million, without any action or approval by our stockholders. As of the date of this report, 39,983,849 shares of our common stock currently are outstanding. The issuance of any additional shares of our common stock or preferred stock would dilute the percentage ownership of our company held by existing stockholders.
The market price of our common stock is highly volatile and may increase or decrease dramatically at any time.
The market price of our common stock is highly volatile and our shares are thinly traded. Our stock price may change dramatically as the result of: (i) announcements of new products or innovations by us or our competitors; (ii) uncertainty regarding the viability of any of our product initiatives; (iii) significant customer contracts; (iv) significant litigation; or (v) other factors or events that would be expected to affect our business, financial condition, results of operations, and future prospects.
The market price for our common stock may also be affected by various factors not directly related to our business or future prospects, including the following:
|
|
·
|
intentional manipulation of our stock price by existing or future shareholders;
|
|
|
·
|
a reaction by investors to trends in our stock rather than the fundamentals of our business;
|
|
|
·
|
a single acquisition or disposition, or several related acquisitions or dispositions, of a large number of our shares, including by short sellers covering their position;
|
|
|
·
|
the interest of the market in our business sector, without regard to our financial condition, results of operations, or business prospects;
|
|
|
·
|
positive or negative statements or projections about us or our industry by analysts and other persons;
|
|
|
·
|
the adoption of governmental regulations or government grant programs and similar developments in the United States or abroad that may enhance or detract from our ability to offer our products and services or affect our cost structure; and
|
|
|
·
|
economic and other external market factors, such as a general decline in market price due to poor economic conditions, investor distrust, or a financial crisis.
|
None.
23
Our principal asset is a manufacturing plant situated on approximately 2,200 acres of land six miles southeast of Batesville in north central Arkansas fronting the White River. Approximately 500 acres of the site are occupied with batch and continuous manufacturing facilities, laboratories, and infrastructure, including on-site liquid waste treatment. FutureFuel Chemical Company is the fee owner of this plant and the land upon which it is situated (which plant and land are not subject to any major encumbrances), and manufactures both biofuels and chemicals at the plant. Utilization of these facilities may vary with product mix and economic, seasonal, and other business conditions, but the plant is substantially utilized with the exception of facilities designated for capacity expansion of biodiesel. The plant, including approved expansions, has sufficient capacity for existing needs and expected near-term growth. We believe that the plant is generally well maintained, in good operating condition, and suitable and adequate for its uses.
In February 2009, we formed FFC Grain, L.L.C. to acquire a granary in Marianna, Arkansas. FFC Grain, L.L.C. acquired the granary in March 2009 and owns it in fee simple, and the land and improvements thereon are not subject to any material encumbrances.
We are not a party to, nor is any of our property subject to, any material pending legal proceedings, other than ordinary routine litigation incidental to our business. However, from time to time, we may be parties to, or targets of, lawsuits, claims, investigations, and proceedings, including product liability, personal injury, asbestos, patent and intellectual property, commercial, contract, environmental, antitrust, health and safety, and employment matters, which we expect to be handled and defended in the ordinary course of business. While we are unable to predict the outcome of any matters currently pending, we do not believe that the ultimate resolution of any such pending matters will have a material adverse effect on our overall financial condition, results of operations, or cash flows. However, adverse developments could negatively impact earnings or cash flows in future periods.
24
Market Information
Commencing July 11, 2008, shares of our common stock were quoted on the OTC Bulletin Board under the symbol “FTFL”. The high and low bid quotations on the OTC Bulletin Board for our shares of common stock for 2009 and 2010 are set forth in the following table.
|
Shares
|
||||
|
Period
|
High
|
Low
|
||
|
January 1, 2009 - March 31, 2009
|
$4.98
|
$3.83
|
||
|
April 1, 2009 - June 30, 2009
|
$5.15
|
$4.70
|
||
|
July 1, 2009 - September 30, 2009
|
$7.04
|
$5.03
|
||
|
October 1, 2009 - December 31, 2009
|
$7.10
|
$6.00
|
||
|
January 1, 2010 – March 31, 2010
|
$6.36
|
$4.85
|
||
|
April 1, 2010 – June 30, 2010
|
$6.32
|
$5.66
|
||
|
July 1, 2010 – September 30, 2010
|
$7.45
|
$6.22
|
||
|
October 1, 2010 – December 31, 2010
|
$10.00
|
$7.00
|
||
On March 8, 2011, the NYSE approved our application to list our common stock on the exchange. We expect that our common stock will commence trading on the NYSE on March 23, 2011 under the symbol “FF”. Our common stock will continue to quoted on the OTC Bulletin Board under the symbol “FTFL” until the transfer is completed.
Our warrants were not quoted or listed on any established exchange or quotation system.
There are currently outstanding 39,983,849 shares of our common stock. None of our warrants are currently outstanding. See the discussion below. Under U.S. securities laws at the time of our offering, shares of our common stock and warrants that were sold or acquired on July 12, 2006 could not be re-sold until they had been held for two years, unless registered with the SEC or unless an exemption from registration was available. The relevant U.S. securities laws were revised to reduce the holding period for non-affiliates to six months, effective February 15, 2008. As a result, such shares and warrants (subject, in the case of warrants, to the qualification discussed below) may be sold by non-affiliates of the Company, either within or outside the U.S., without restrictions imposed by U.S. securities laws. Affiliates of the Company, defined generally as any person that directly or indirectly controls, is controlled by, or is under common control with the Company (typically directors, executive officers, and primary shareholders) remain limited in the amount and manner in which they may sell our shares and warrants. Thus, non-affiliates who acquired our shares and warrants which were issued in our initial offering on July 12, 2006 may generally freely trade those shares and warrants in the United States.
Please note, however, that the exercise of the warrants for shares of our common stock were subject to certain conditions designed to ensure compliance with U.S. securities laws. These conditions included the provision to us of a written certification that the exercising shareholder was neither within the U.S. nor a U.S. person and that the warrant was not being exercised on behalf of a U.S. person. In the case of a holder who could not make the foregoing representation, we may have required the holder to provide to us a written opinion of counsel to the effect that the warrants and the shares of our common stock to be delivered upon the exercise of such warrants had been registered under the Securities Act, or were exempt from registration thereunder and such securities were qualified for sale or were exempt from qualification under applicable securities laws of the state or other jurisdiction in which the registered holder resides. The shares of our common stock issued upon the exercise of a warrant were considered restricted securities subject to a six-month holding period. In general, a security holder who had not been an affiliate of the Company for three months may resell these securities without any restriction after satisfying the six-month holding period, provided that we are current in our SEC filings. Because of these restrictions, the certificates for shares of our common stock issued upon the exercise of our warrants must contain an appropriate legend, which means they must be certificated, generally for the twelve months after the warrant was exercised.
25
Holders
The shares of our common stock were held by approximately 384 holders of record on March 11, 2011 as recorded on our transfer agents’ registers.
Dividends
The payment of cash dividends by us is dependent upon our existing cash and cash equivalents, future earnings, capital requirements, and overall financial condition. Based on such criteria, we paid special cash dividends in 2009 and 2010 as follows.
|
Per Share Amount
|
Record Date
|
Payment Date
|
Date of Declaration
|
|
$0.30
|
December 7, 2009
|
December 15, 2009
|
November 30, 2009
|
|
$0.20
|
March 23, 2010
|
April 9, 2010
|
March 12, 2010
|
|
$0.20
|
May 18, 2010
|
June 8, 2010
|
June 30, 2010
|
|
$0.20
|
September 14, 2010
|
September 30, 2010
|
August 17, 2010
|
|
$0.20
|
December 1, 2010
|
December 15, 2010
|
November 12, 2010
|
In addition, we declared a special cash dividend on February 3, 2011 of $0.10 per share on our common stock, with a record date of March 1, 2011 and payable on March 15, 2011. No assurances can be given that we will pay additional dividends in 2011 or thereafter or, if we do pay dividends in the future, no assurances can be given as to the amount of such dividends. There are no material restrictions on our ability to pay dividends except those which are imposed under applicable Delaware corporate law.
Securities Authorized for Issuance Under Equity Compensation Plan
Our board of directors adopted an omnibus incentive plan which was approved by our shareholders at our 2007 annual shareholder meeting on June 26, 2007. We do not have any other equity compensation plan or individual equity compensation arrangement. Under this plan, we are authorized to issue 2,670,000 shares of our common stock. The shares to be issued under the plan were registered with the SEC on a Form S-8 filed on April 29, 2008. Through December 31, 2010, we issued options to purchase 690,500 shares of our common stock and awarded an additional 39,800 shares to participants under the plan. The following additional information regarding this plan is as of December 31, 2010.
|
Plan Category
|
Number of securities to be issued upon exercise of outstanding options, warrants and rights
|
Weighted-average exercise price of outstanding options, warrants and rights
|
Number of securities remaining available for future issuance under equity compensation plans (excluding securities reflected in column (a))
|
||
|
(a)
|
(b)
|
(c)
|
|||
|
Equity compensation plans approved by security holders
|
417,500
|
$6.40
|
1,939,700
|
Performance Graph
The following graph shows changes over the 53-month period beginning July 13, 2006 (the completion of our offering of units) through December 31, 2010 in the value of a $100 investment in: (i) our common stock; (ii) Russell 2000; and (iii) an industry group of other companies that file reports with the SEC using SIC Code 2860. These companies are: AE Biofuels Inc., All Fuels & Energy Company, Altair Nano Technologies, Inc., Alternative Energy Sources Inc., American Jianye Greentech Holdings In., Amyris Inc., Aspa Gold Corp., Aventine Renewable Energy Holdings Inc., Balchem Corp., Biofuel Energy Corp., Biofuels Power Corp., Bluefire Renewables, Inc., Carbonics Capital Corp., Chemtura Corp., China Clean Energy Inc., China Jianye Fuel Inc., China Rutai International Holdings Company, Clean Tech Biofuels Inc., Easylink Solutions Corp., Ecotech Energy Group Inc., Evolution Fuels Inc., Four Rivers Bioenergy Inc., Gevo Inc., Global Nutech Inc., Green Energy Live Inc., Green
26
Energy Resources Inc., Green Plains Renewable Energy Inc., Greenhouse Holdings Inc., Green Energy Inc., Greenshift Corp., Hybrid Fuels Inc., Incoming Inc., International Flavors & Fragrances Inc., Keyuan Petrochemicals Inc., KL Energy Corp., KMG Chemicals Inc., Kreido Biofuels Inc., Luna Technologies International Inc., New Generation Biofuels Holdings Inc., Newmarket Corp., Omnova Solutions, Inc., Originoil Inc., Orion Ethanol Inc., Pacific Ethanol Inc., Panda Ethanol Inc., Petroalgae Inc., Pure Biofuels Corp., Sino Clean Energy Inc., Solutia Inc., Southridge Enterprises Inc., Spartan Gold Limited, Sterling Chemicals Inc., Syntec Biofuel Inc., Verenium Corp., and Westlake Chemical Corp.
Recent Sales of Unregistered Securities
We did not sell any of our securities within the three-year period ended December 31, 2010 in transactions that were not registered under the Securities Act of 1933.
Purchase of Securities by Us
Neither we nor anyone acting on our behalf purchased during 2010 any shares of our common stock, which is the only class of our equity securities that is registered pursuant to section 12 of the Exchange Act.
27
The following sets forth the status of our warrants.
|
Initial issuance of warrants
|
22,500,000 | |||
|
Warrants exercised in 2006
|
- | |||
|
Outstanding warrants at December 31, 2006
|
22,500,000 | |||
|
Warrants exercised in 2007
|
- | |||
|
Outstanding warrants at December 31, 2007
|
22,500,000 | |||
|
Warrants exercised in 2008
|
1,182,500 | |||
|
Outstanding warrants at December 31, 2008
|
21,317,500 |
No warrants were exercised in 2009. During 2009, our board approved the purchase by us of our outstanding warrants, whether in the open market or through privately negotiated transactions, in an aggregate amount not to exceed $3 million. Pursuant to that authorization, during 2009, we purchased and canceled the following warrants.
|
Date
|
# of Warrants
|
Average Price Per Warrant
|
Purchase Price
|
|||
|
August 1-31, 2009
|
1,100,000
|
$0.35
|
$ 385,005
|
|||
|
October 1-31, 2009
|
91,400
|
$0.70
|
63,985
|
|||
|
November 1-30, 2009
|
450,900
|
$0.78
|
350,720
|
|||
|
Total
|
1,642,300
|
$ 799,710
|
As a result of those purchases, there were 19,675,200 of our warrants outstanding as of December 31, 2009.
During 2010, 11,783,549 warrants were exercised. Pursuant to the 2009 board authorization, we purchased and canceled the following warrants in 2010.
|
Date
|
# of Warrants
|
Average Price Per Warrant
|
Purchase Price
|
|||
|
May 1-31, 2010
|
558,000
|
$0.35
|
$ 195,300
|
|||
|
June 1-30, 2010
|
2,216,130
|
$0.31
|
682,111
|
|||
|
July 1-31, 2010
|
2,843,100
|
$0.12
|
332,650
|
|||
|
Total
|
5,617,230
|
$ 1,210,061
|
The remaining 2,274,421 warrants expired on July 12, 2010. As a result, no warrants were issued and outstanding as of December 31, 2010.
Historically, the business and assets included in FutureFuel Chemical Company were accounted for by Eastman Chemical Company in various segments of Eastman Chemical Company’s overall business. Although FutureFuel Chemical Company was incorporated on September 1, 2005, Eastman Chemical Company did not begin transferring assets into FutureFuel Chemical Company until January 1, 2006 and completed the transfer in subsequent periods prior to the closing of our acquisition of FutureFuel Chemical Company. Notwithstanding that FutureFuel Chemical Company was a separately incorporated entity, Eastman Chemical Company did not prepare separate financial statements for FutureFuel Chemical Company nor was it required to do so under local law or accounting rules. Rather, the operations of the Batesville plant were reported within Eastman Chemical Company based upon the underlying products, and the revenues and expenses of the plant were presented in various segments within Eastman Chemical Company’s financial statements. In addition, allocations to the plant of Eastman Chemical Company overhead (such as insurance, employee benefits, legal expenses, and the like) were based upon assumptions made by Eastman Chemical Company and such assumptions historically did not reflect expenses which FutureFuel Chemical Company would have incurred had it been a stand-alone entity. Since we did not acquire or succeed to all of the assets and liabilities of Eastman Chemical Company, “carve-out” financial statements have been prepared for the acquired component business, excluding the continuing operations retained by Eastman Chemical Company, and allocations for overhead components described above have been effected.
28
For purposes of preparing our financial statements, we initially accounted for the acquisition of Eastman SE, Inc. as a reverse acquisition and did not apply purchase accounting to such transaction. On July 27, 2007, we issued a Form 8-K pursuant to Item 4.02(a) of Form 8-K, informing investors that our 2006 Annual Financial Statements should not be relied upon for the reasons set forth therein. A copy of that Form 8-K may be obtained free of charge on our website at http://ir.futurefuelcorporation.com/sec.cfm or by requesting the same from us at FutureFuel Corp., 8235 Forsyth Blvd., 4th Floor, Clayton, Missouri 63105 Attn: Investor Relations. We restated our 2006 financial statements to apply purchase accounting to our acquisition of Eastman SE, Inc., a portion of which 2006 financial statements are included herein. See Note 2 to our consolidated financial statements for the year ended December 31, 2006 included in Amendment No. 3 to our Form 10 filed with the SEC on April 9, 2008 for a detailed discussion of the effects of such restatement.
The following table sets forth our and FutureFuel Chemical Company’s summary historical financial and operating data for the periods indicated below. This summary historic financial and operating data has been derived from FutureFuel Chemical Company’s “carve-out” financial statements as of and for the ten months ended October 31, 2006 (the period between January 1, 2006 and the date we acquired FutureFuel Chemical Company), and our consolidated financial statements for the twelve months ended December 31, 2006, 2007, 2008, 2009, and 2010. The information presented in the table below should be read in conjunction with “Management’s Discussion and Analysis of Financial Condition and Results of Operations” and our financial statements and notes thereto. The selected financial data for FutureFuel Chemical Company prior to our acquisition thereof represent financial information prepared and provided by Eastman Chemical Company to us in conjunction with the carve out and sale of the Batesville plant to us for the ten months ended October 31, 2006.
(Dollars in thousands, except per share amounts)
|
FutureFuel Corp Consolidated
|
FutureFuel Corp. and FutureFuel Chemical Company Combined
|
FutureFuel Corp. Consolidated
|
FutureFuel Chemical Company
|
|||||||||||||||||||||||||
|
Item
|
Twelve Months Ended December 31, 2010
|
Twelve Months Ended December 31, 2009
|
Twelve Months Ended December 31, 2008
|
Twelve Months Ended December 31, 2007
|
Twelve Months Ended December 31, 2006
|
Twelve Months Ended December 31, 2006
|
Ten Months Ended October 31, 2006
|
|||||||||||||||||||||
|
Operating Revenues
|
$ | 219,183 | $ | 196,711 | $ | 198,330 | $ | 169,788 | $ | 150,770 | $ | 23,043 | $ | 127,727 | ||||||||||||||
|
Net income (loss)
|
$ | 23,094 | $ | 16,992 | $ | 22,675 | $ | 8,408 | $ | 2,242 | $ | 2,717 | $ | (475 | ) | |||||||||||||
|
Earnings per common share:
|
||||||||||||||||||||||||||||
|
Basic
|
$ | 0.63 | $ | 0.60 | $ | 0.84 | $ | 0.31 | $ | 0.08 | $ | 0.10 |
NA
|
|||||||||||||||
|
Diluted
|
$ | 0.62 | $ | 0.58 | $ | 0.82 | $ | 0.26 | $ | 0.07 | $ | 0.09 |
NA
|
|||||||||||||||
|
Total Assets
|
$ | 343,156 | $ | 246,007 | $ | 238,126 | $ | 216,113 | $ | 203,059 | $ | 203,516 |
NA
|
|||||||||||||||
|
Long-term obligations
|
$ | 46,674 | $ | 34,842 | $ | 34,377 | $ | 24,353 | $ | 20,740 | $ | 20,740 |
NA
|
|||||||||||||||
|
Cash dividends per common share
|
$ | 0.80 | $ | 0.30 | $ | 0.70 | $ | 0.00 | $ | 0.00 | $ | 0.00 | $ | 0.00 | ||||||||||||||
|
Net cash provided by (used in) operating activities
|
$ | 17,839 | $ | 25,883 | $ | 36,275 | $ | 21,554 | $ | (3,960 | ) | $ | (12,494 | ) | $ | 8,534 | ||||||||||||
|
Net cash provided by (used in) investing activities
|
$ | (30,767 | ) | $ | 21,430 | $ | (52,009 | ) | $ | (29,978 | ) | $ | (91,168 | ) | $ | (82,619 | ) | $ | (8,549 | ) | ||||||||
|
Net cash provided by (used in) financing activities
|
$ | 38,473 | $ | (9,256 | ) | $ | (11,466 | ) | $ | (50 | ) | $ | 158,229 | $ | 158,214 | $ | 15 | |||||||||||
29
For the combined year ended December 31, 2006, operating revenues, net income (loss), and earnings per common share combine our consolidated results for the entire twelve months ended December 31, 2006 and FutureFuel Chemical Company’s results for the ten months ended October 31, 2006. This information is for illustrative purposes only. The consolidated company would likely have performed differently had they always been combined. The information should not be relied on as an indication of future results that the combined company will experience after the acquisition of FutureFuel Chemical Company because of a variety of factors, including access to additional information and changes in value.
Our Amendment No. 3 to Form 10 Registration Statement filed with the SEC on April 9, 2008 contains all the financial statements and selected financial data for FutureFuel Chemical Company that was provided to us by Eastman Chemical Company.
Prior to the initiation of its biofuels program in 2005, the Batesville plant did not report financial results by business “segments” as defined by generally accepted accounting principles. After the initiation of such program and upon divestiture, it defined two segments: chemicals and biofuels.
The following Management’s Discussion and Analysis of Financial Condition and Results of Operations should be read together with our consolidated financial statements, including the notes thereto, set forth herein. This discussion contains forward-looking statements that reflect our current views with respect to future events and financial performance. Actual results may differ materially from those anticipated in these forward-looking statements. See “Forward Looking Information” below for additional discussion regarding risks associated with forward-looking statements.
Liquidity and Capital Resources
Our net cash provided by (used in) operating activities, investing activities, and financing activities for the years ended December 31, 2010, 2009, and 2008 are set forth in the following table.
(Dollars in thousands)
|
2010
|
2009
|
2008
|
||||||||||
|
Net cash provided by operating activities
|
$ | 17,839 | $ | 25,883 | $ | 36,275 | ||||||
|
Net cash provided by (used in) investing activities
|
$ | (30,767 | ) | $ | 21,430 | $ | (52,009 | ) | ||||
|
Net cash provided by (used in) financing activities
|
$ | 38,473 | $ | (9,256 | ) | $ | (11,446 | ) | ||||
Operating Activities
Cash provided by operating activities decreased from $25,883,000 in 2009 to $17,839,000 in 2010. The decrease in cash provided by operating activities was primarily the result of an $11,695,000 decrease in the cash provided by the change in accounts receivables and an $12,070,000 decrease in the cash provided by the change in inventory. Partially offsetting these decreases was an $8,604,000 increase in the cash provided by deferred revenue, a $2,404,000 increase in the cash provided by the provision for deferred income taxes, and a $6,102,000 increase in net income. The decrease in cash provided by the change in accounts receivable was a result of the December 2010 retroactive reinstatement of the $1.00 per gallon biodiesel blender’s tax credit. A key component of the impact of this reinstatement was the booking of a $10,785,000 receivable from the federal government. This receivable remained uncollected until February 2011 when payment was received in full. The decrease in the cash provided by the change in inventory stemmed from an inventory build of feedstocks and raw materials at December 31, 2010 along with end-of-the-year purchases of petrodiesel. The increase in cash provided by deferred revenue was a result of progress made on capital projects we undertook on behalf of our customers. The increase in cash provided by the provision for deferred income taxes was a result of the effects of tax laws such as bonus depreciation which allowed for an early recognition of income tax expenses.
Cash provided by operating activities decreased from $36,275,000 in 2008 to $25,883,000 in 2009. The decrease in cash provided by operating activities was primarily the result of a $4,164,000 decrease in cash provided by the change in fair value of derivative instruments and a $9,069,000 decrease in cash provided by the change in deferred
30
revenue. Partially offsetting these decreases was an increase in cash provided by the change in inventory. The decrease in cash provided by the change in fair value of derivative instruments was primarily a result of a decrease in our short position of regulated options at December 31, 2009 as compared to December 31, 2008. The decrease in cash provided by the change in deferred revenue resulted from the completion of the capital project we undertook on behalf of our customer at the end of 2008 and the resultant termination of spending on this project and reimbursements from our customer in 2009. The increase in cash provided by the change in inventory resulted from an inventory build from 2007 to 2008, as compared to a moderate liquidation of inventory from 2008 to 2009.
Investing Activities
Cash provided by (used in) investing activities decreased from $21,430,000 in 2009 to $(30,767,000) in 2010. This decrease was primarily a result of increased investing activity, as cash held in a restricted account for purposes of securing a short position increased by $21,086,000 and purchases of marketable securities increased $30,152,000. These decreases in cash were partially offset by a decrease of $12,239,000 in capital expenditures.
Cash provided by (used in) investing activities increased from $(52,009,000) in 2008 to $21,430,000 in 2009. The increase in cash provided by investing activities was almost entirely related to the liquidation of investments in marketable securities, auction rate securities, and commercial paper in 2009. Cash used in the purchase of marketable securities decreased from $40,835,000 in 2008 to $19,999,000 in 2009. We reported net purchases of auction rate securities of $14,985,000 in 2008 as compared to net sales of auction rate securities of $12,185,000 in 2009. Cash provided by (used in) the net purchases of commercial paper increased from $(15,384,000) in 2008 to $15,424,000 in 2009. Also contributing to the increase in cash provided by investing activities was an increase in cash provided by (used in) the collateralization of derivative instruments from $(7,037,000) in 2008 to $5,270,000 in 2009. Partially offsetting the increase in cash provided by investing activities was an increase in capital expenditures from $16,436,000 in 2008 to $21,910,000 in 2009 and the purchase of $3,965,000 of preferred stock and trust preferred securities in 2009.
Financing Activities
Cash provided by (used in) financing activities increased from $(9,256,000) in 2009 to $38,473,000 in 2010. This increase was primarily attributable to the exercise of warrants to purchase our common stock and the exercise of stock options. Proceeds from such stock issuances totaled $70,736,000 in 2010. Partially offsetting the positive impact from the stock issuances was the effect of increased dividends paid. The payment of dividends increased from $8,457,000 in 2009 to $31,053,000 in 2010.
Cash used in financing activities decreased from $11,466,000 in 2008 to $9,256,000 in 2009. The decrease in cash used in financing activities resulted from a decrease in cash used in the payment of dividends from $19,705,000 in 2008 to $8,457,000 in 2009, partially offset by a decrease in cash provided by proceeds from the issuance of stock from $8,169,000 in 2008 to $-0- in 2009, which itself resulted from no exercise of warrants or options in 2009.
Capital Expenditure Commitments
We had two capital projects as of December 31, 2010 with material capital expenditure commitments of $6,583,000. The capital projects were the construction of two specialty chemical plants.
Historically, we finance capital requirements for our business with cash flows from operations and have not had the need to incur bank indebtedness to finance any of our operations during the periods discussed herein.
Credit Facility
We entered into a $50 million credit agreement with a commercial bank in March 2007. The loan is a revolving facility the proceeds of which may be used for our working capital, capital expenditures, and general corporate purposes. The facility terminates on June 30, 2013. Advances are made pursuant to a borrowing base. Advances are secured by a perfected first priority security interest in our accounts receivable and inventory. The interest rate floats at certain margins over LIBOR or base rate based upon the leverage ratio from time to time. There is an unused commitment fee. The ratio of total funded debt to EBITDA may not be less than 3:1. We had no borrowings under this credit facility at December 31, 2010, 2009, or 2008.
31
We intend to fund future capital requirements for our businesses from cash flow generated by us as well as from existing cash and cash investments and borrowings under our credit facility. We do not believe there will be a need to issue any securities to fund such capital requirements.
Department of Energy Grant
We entered into a contract with a customer to design, construct, and operate a commercial-scale plant to produce intermediate anode powder as a component of high-performance graphite anode materials for lithium-ion batteries. In connection with this contract, we applied for a financial assistance award under the Electric Drive Vehicle Battery and Component Manufacturing Initiative administered by the Department of Energy National Energy Technology Laboratory on behalf of the Office of Energy Efficiency and Renewable Energy. An award was granted to us in the amount of $12,600,000, which we accepted on July 27, 2010. We will use the funds to modify existing idle assets and to acquire and construct new assets to be used for the production of specialized materials for lithium-ion batteries for electric cars and other applications. We receive grant monies as we incur construction-related expenditures. The amounts received under this arrangement are recorded as deferred revenue and will be amortized into earnings over the anticipated life of the customer relationship. Such amortization will begin once construction is completed and the plant is placed into service.
Special Dividend
In 2010, we declared special cash dividends aggregating $0.80 per share on our common stock, with record dates and payment dates as set forth above. The special cash dividends amounted to $31,053,000.
On November 30, 2009, we declared a special cash dividend of $0.30 per share on our common stock, with a record date of December 1, 2009 and a payment date of December 22, 2009. The special cash dividend amounted to $8,457,000.
On October 1, 2008, we declared a special cash dividend of $0.70 per share on our common stock, with a record date of October 22, 2008 and a payment date of November 11, 2008. The special cash dividend amounted to $19,705,000.
Capital Management
As a result of our initial equity offering, our subsequent positive operating results, and the exercise of warrants, we accumulated excess working capital. Some of this excess working capital was paid out in 2008, 2009, and 2010 as a special cash dividend. We intend to retain the remaining cash to fund infrastructure and capacity expansion at our Batesville plant and to pursue complimentary acquisitions in the energy and chemical industries. Third parties have not placed significant restrictions on our working capital management decisions.
These funds were predominantly held in cash or cash equivalents at multiple financial institutions. In 2010, we also had investments in certain preferred stock, trust preferred securities, and other equity instruments. In 2009, we had investments in certain preferred stock and trust preferred securities. We classify these investments as current assets in the accompanying consolidated balance sheets and designate them as being “available-for-sale”. Accordingly, they are recorded at fair value, with the unrealized gains and losses, net of taxes, reported as a component of stockholders’ equity. The fair value of these preferred stock, trust preferred securities, and other equity instruments, including accrued interest, totaled $28,200,000 and $4,011,000 at December 31, 2010 and 2009, respectively.
We also maintained a position in auction rate securities during 2010 and 2009. We have selectively made investments in certain auction rate securities that we believe offer sufficient yield along with sufficient liquidity. To date, all the auction rate securities in which we invested have maintained a mechanism for liquidity, meaning that the respective auctions have not failed, the issuers have called the instruments, or a secondary market exists for liquidation of the securities. We classified these instruments as current assets in the accompanying consolidated balance sheet and carry them at their estimated fair market value. These securities were repurchased on October 15, 2010 for par value. The fair value of these instruments approximated their par value and, including accrued interest, totaled $0 and $2,800,000 at December 31, 2010 and 2009, respectively. Auction rate securities are typically long term bonds issued by an entity for which there is a series of auctions over the life of the bond that serve to reset the interest rate on the bonds to a market rate. These auctions also serve as a mechanism to provide liquidity to the bond
32
holders; as long as there are sufficient purchasers of the auction rate securities, the then owners of the auction rate securities are able to liquidate their investment through a sale to the new purchasers. In the event of an auction failure, a situation when there are more sellers than buyers of a particular issue, the current owners of an auction rate security issue may not be able to liquidate their investment. As a result of an auction failure, a holder may be forced to hold the particular security either until maturity or until a willing buyer is found. Even if a willing buyer is found, however, there is no guarantee that this willing buyer will purchase the security for its carrying value, which would result in a loss being realized on the sale. The liquidity problems recently experienced in the U.S. auction rate securities markets have generally been focused on closed-end fund and student loan auction rate securities, asset classes that we have avoided.
At December 31, 2010, we had a short position in certain marketable debt securities. Such a position did not exist at December 31, 2009. The purpose of this position was to help mitigate the potential negative impact an increase in interest rates would have on other marketable securities we had purchased. The securities comprising this position are carried at fair value, with unrealized gains and losses reported as a component of net income. We realized gains of $528,000 and $0 on these securities in 2010 and 2009, respectively. The fair value of these securities totaled $(19,295,000) and $0 at December 31, 2010 and 2009, respectively. The margin account maintained with a broker to collateralize these securities carried a balance of $21,086,000 and $0 at December 31, 2010 and 2009, respectively, and is classified as restricted cash and cash equivalents in the consolidated balance sheet.
Lastly, we maintain depository accounts such as checking accounts, money market accounts, and other similar accounts at selected financial institutions.
Results of Operations
In General
We break our chemicals business into two main product groups: custom manufacturing and performance chemicals. Custom manufacturing consists of products made for specific customers based upon specifications provided by such customers. Major products in the custom manufacturing group include: (i) nonanoyloxybenzene-sulfonate, a bleach activator manufactured exclusively for a customer for use in a household detergent; and (ii) a proprietary herbicide (and intermediates) manufactured exclusively for a customer. The custom manufacturing group also includes agrochemicals as well as industrial and consumer products (cosmetics and personal care products, ink colorants, adhesion promoters, polymer additives, polymer and specialty dyes, specialty polymers, photographic and imaging chemicals, and food additives).
Revenues generated from the bleach activator are based on a supply agreement with the customer. The supply agreement stipulates selling price per kilogram based on volume sold, with price moving up as volumes move down, and vice-versa. The current contract expires in March 2013. We pay for raw materials required to produce the bleach activator. The contract with the customer provides that the price received by us for the bleach activator is indexed to changes in certain items, enabling us to pass along most inflationary increases in production costs to the customer.
We have been the primary manufacturer for a customer of a proprietary herbicide and certain intermediates. These products are facing generic competition, and no assurances can be given that we will remain the primary manufacturer for this product line. The contracts automatically renew for successive one-year periods, subject to the right of either party to terminate the contract not later than 270 days prior to the end of the then current term for the herbicide and not later than 18 months prior to the then current term for the intermediates. No assurances can be given that these contracts will not be terminated. The customer supplies most of the key raw materials for production of the proprietary herbicide. There is no pricing mechanism or specific protection against cost changes for raw materials or conversion costs that we are responsible for purchasing and/or providing.
In 2008, we entered into a contract with a new customer for the toll manufacture of an industrial intermediate utilized in the antimicrobial industry. We invested approximately $10 million in capital expenditures to modify and expand our plant to produce this industrial intermediate. The customer reimbursed these expenditures, which reimbursements have been classified as deferred revenue on our balance sheet and will be earned into income over the expected life of the product. The contract stipulates a price curve based on volumes sold and has an inflationary
33
pricing provision whereby we pass along most inflationary changes in production costs to the customer. The contract expires in December 2013.
Pricing for the other custom manufacturing products is negotiated directly with the customer. Some, but not all, of these products have pricing mechanisms and/or protections against raw material or conversion cost changes.
Performance chemicals consist of specialty chemicals that are manufactured to general market-determined specifications and are sold to a broad customer base. The major product line in the performance chemicals group is SSIPA/LiSIPA, a polymer modifier that aids the properties of nylon. This group of products also includes sulfonated monomers and hydrotropes, specialty solvents, polymer additives, and chemical intermediates.
SSIPA/LiSIPA revenues are generated from a diverse customer base of nylon fiber manufacturers and other customers that produce condensation polymers. Contract sales are indexed to key raw materials for inflation; otherwise, there is no pricing mechanism or specific protection against raw material or conversion cost changes.
Pricing for the other performance chemical products is established based upon competitive market conditions. Some, but not all, of these products have pricing mechanisms and/or specific protections against raw material or conversion cost changes.
We procure all of our own feedstock and only sell biodiesel for our own account. In rare instances, we purchase biodiesel from other producers for resale. We have the capability to process multiple types of vegetable oils and animal fats, we can receive feedstock by rail or truck, and we have completed the construction of substantial storage capacity to acquire feedstock at advantaged prices when market conditions permit. In 2009, we completed a project to increase our production capacity to 59 million gallons of biodiesel per year through the addition of a new continuous processing line. We initiated commercial production from this new line in May 2009. By the end of the second quarter of 2009, daily production volumes from the new processing line were demonstrated at approximately 80% of nameplate capacity. This production line was designed to produce biodiesel from feedstock with low fatty acids. We believe we successfully demonstrated our ability to keep this continuous processing line at or near capacity for sustained periods of time as well as our ability to procure and logistically handle large quantities of feedstock with low fatty acids. However, with the expiration of the $1.00 federal blender’s credit at the end of 2009, we determined that feedstock with low fatty acids were too costly to consistently produce biodiesel with positive margins. Accordingly, we redesigned our continuous line to produce biodiesel from feedstock with high fatty acids. We are still in the process of debugging this redesigned line.
There currently is uncertainty as to whether we will produce biodiesel in the future. This uncertainty results from: (i) changes in feedstock prices relative to biodiesel prices; (ii) continuance of the $1.00 per gallon federal blender’s tax credit, which credit terminates on December 31, 2011; and (iii) the permanency of government mandates. See “Risk Factors” above.
While biodiesel is the principal component of the biofuels segment, we also generate revenue from the sale of petrodiesel both in blends with our biodiesel and, from time to time, with no biodiesel added. Petrodiesel and biodiesel blends are available to customers at our leased storage facility in North Little Rock, Arkansas. In addition, we deliver blended product to a small group of customers within our region. We also sell refined petroleum products from time-to-time to maintain our status as a shipper on a common carrier pipeline.
The majority of our expenses are cost of goods sold. Cost of goods sold include raw material costs as well as both fixed and variable conversion costs, conversion costs being those expenses that are directly or indirectly related to the operation of our plant. Significant conversion costs include labor, benefits, energy, supplies, depreciation, and maintenance and repair. In addition to raw material and conversion costs, cost of goods sold includes environmental reserves and costs related to idle capacity. Finally, cost of goods sold includes hedging gains and losses recognized by us related to our biofuels segment. Cost of goods sold is allocated to the chemicals and biofuels business segments based on equipment and resource usage for most conversion costs and based on revenues for most other costs.
Operating costs include selling, general and administrative, and research and development expenses. These expense categories include expenses that were directly incurred by us.
34
The discussion of results of operations that follows is based on revenues and expenses in total and for individual product lines and do not differentiate related party transactions.
Fiscal Year Ended December 31, 2010 Compared to Fiscal Year Ended December 31, 2009
Revenues
Revenues for the year ended December 31, 2010 were $219,183,000 as compared to revenues for the year ended December 31, 2009 of $196,711,000, an increase of 11%. Revenues from biofuels decreased 23% and accounted for 18% of total revenues in 2010 as compared to 27% in 2009. Revenues from chemicals increased 24% and accounted for 82% of total revenues in 2010 as compared to 73% in 2009. Within the chemicals segment, revenues for 2010 changed as follows as compared to 2009: revenues from the bleach activator increased 8%; revenues from the proprietary herbicide and intermediates increased 16%; revenues from CPOs increased 195%; revenues from DIPB increased 10%; and revenues from other products increased 62%.
Revenues from the bleach activator and the proprietary herbicide and intermediates are together the most significant components of our revenue base, accounting for 54% of revenues for the year ended December 31, 2010 as compared to 53% for the year ended December 31, 2009. The increase in revenue from the bleach activator during 2010 as compared to 2009 was attributable to higher volumes sold in 2010. The future volume of and revenues from the bleach activator depend on both consumer demand for the product containing the bleach activator and the manufacturing, sales, and marketing priorities of our customer. We are unable to predict with certainty the revenues we will receive from this product in the future. With respect to the proprietary herbicide, the increase in revenues in 2010 as compared to 2009 was primarily a result of higher volumes.
Revenues from CPOs and DIPB together increased 57% during 2010. The end market for CPOs is the automotive industry and demand for this product has benefited from the improvement in economic conditions. Revenues from DIPB in 2010 were higher in 2010 as compared to 2009; revenues in the second half of 2009 were sufficient to offset reduced revenues in the first half of the year related to a scheduled maintenance shutdown and reduced demand from our customer.
Decreased revenues in 2010 from the biofuels segment resulted from lower volume of biodiesel, a direct result of the expiration of the $1 blender’s credit, and reduced volume of agricultural commodities, primarily soybeans, rice, and corn from the granary we purchased in March 2009. The volume of biodiesel sold in 2010 decreased 47% as compared to 2009. The volume of petrodiesel and biodiesel blends (ranging from less than 5% biodiesel to as much as 99% biodiesel) increased 21% as compared to 2009; this increase was primarily a result of our success with our regional fuel distribution strategy and strategic purchases and sales of fuel.
Cost of Goods Sold and Distribution
Total cost of goods sold and distribution for 2010 were $177,899,000 as compared to total cost of goods sold and distribution for 2009 of $162,274,000, an increase of 10%.
Cost of goods sold and distribution for 2010 for our chemicals segment were $136,847,000 as compared to cost of goods sold and distribution for 2009 of $110,752,000. On a percentage basis, the 24% increase in cost of goods sold and distribution were directly in line with the 24% increase in chemicals segment revenues.
Cost of goods sold and distribution for 2010 for our biofuels segment were $41,052,000 as compared to cost of goods sold and distribution for 2009 of $51,522,000. On a percentage basis, cost of goods sold and distribution decreased 20% versus a decrease in revenues of 23%. This decrease is primarily attributed to reduced sales volume in the absence of the $1 blender’s credit and losses incurred in our biodiesel hedging activities. Additionally, the 2009 results reflect a $2,000,000 award from the Arkansas Alternative Fuels Development Program. Under this program, biodiesel producers in the state of Arkansas were eligible to receive $0.20 per gallon for every gallon of biodiesel produced during defined time periods, up to a maximum of $2,000,000 per period, subject to funding by the State of Arkansas. The grant was not funded in 2010. Based on the characteristics of the Arkansas Alternative Fuels Development Program and the State funding behind this program, we recognized income in the period funding was received.
35
Operating Expenses
Operating expenses decreased 5% from $9,598,000 in 2009 to $9,129,000 in 2010. Compensation expense decreased 3% as a result of reduced administrative staff. Other expense increased 17%, primarily as a result of the addition of our granary and, to a lesser extent, from increased legal fees stemming from issues described under “Other Matters”. Related party expense decreased 14%. Related party expense is described in detail in Note 20 of our consolidated financial statements included elsewhere herein.
Provision for Income Taxes
The effective tax rates for the years ended December 31, 2010 and 2009 reflect our expected tax rate on reported operating earnings before income taxes. We have determined that we do not believe that we have a more likely than not probability of realizing a portion of our deferred tax assets. As such, we have recorded a valuation allowance of $277,000 at December 31, 2010.
Income Taxes
We had no liability for uncertain tax positions at December 31, 2010. See Note 15 to our consolidated financial statements included elsewhere herein.
Fiscal Year Ended December 31, 2009 Compared to Fiscal Year Ended December 31, 2008
Revenues
Revenues for the year ended December 31, 2009 were $196,711,000 as compared to revenues for the year ended December 31, 2008 of $198,330,000, a decrease of 1%. Revenues from biofuels increased 24% and accounted for 27% of total revenues in 2009 as compared to 21% in 2008. Revenues from chemicals decreased 8% and accounted for 73% of total revenues in 2009 as compared to 79% in 2008. Within the chemicals segment, revenues for 2009 changed as follows as compared to 2008: revenues from the bleach activator decreased 13%; revenues from the proprietary herbicide and intermediates decreased 8%; revenues from CPOs decreased 65%; revenues from DIPB increased 2%; and revenues from other products decreased 3%.
Revenues from the bleach activator and the proprietary herbicide and intermediates are together the most significant components of FutureFuel Chemical Company’s revenue base, accounting for 53% of revenues for the year ended December 31, 2009 as compared to 59% for the year ended December 31, 2008. The decrease in revenue from the bleach activator during 2009 as compared to 2008 was attributable to lower volumes sold in 2009. The future volume of and revenues from the bleach activator depend on both consumer demand for the product containing the bleach activator and the manufacturing, sales, and marketing priorities of our customer. We are unable to predict with certainty the revenues we will receive from this product in the future. With respect to the proprietary herbicide, the decrease in revenues in 2009 as compared to 2008 was primarily a result of lower volumes, although we did reduce the price of our product as a result of declines in raw material prices.
Revenues from CPOs and DIPB together decreased 31% during 2009. The end market for CPOs is the automotive industry and demand for this product has been impacted by both economic conditions and an inventory build by our customer at the end of 2008. Revenues from DIPB in 2009 were roughly in line with revenues in 2008; revenues in the second half of 2009 were sufficient to offset reduced revenues in the first half of the year related to a scheduled maintenance shutdown and reduced demand from our customer.
Increased revenues in 2009 from the biofuels segment resulted from higher volumes of biodiesel produced and sold, higher volumes of petrodiesel and biodiesel blends distributed to our regional market, and the addition of revenues from our granary. The volume of biodiesel sold in 2009 increased 59% as compared to 2008; this was a result of new customer relationships both in our region and throughout the United States. The volume of petrodiesel and biodiesel blends (ranging from less than 5% biodiesel to as much as 20% biodiesel) increased more than twenty-fold in 2009 as compared to 2008; this increase was primarily a result of our success with regional fuel distribution strategy. We purchased a granary in March 2009. Because we anticipate future synergies with our biofuels business, we include the granary’s operating results in our biofuels segment. Granary revenues are generated from the sale of agricultural commodities, primarily soybeans, rice, and corn.
36
Cost of Goods Sold and Distribution
Total cost of goods sold and distribution for 2009 were $162,274,000 as compared to total cost of goods sold and distribution for 2008 of $157,913,000, an increase of 3%.
Cost of goods sold and distribution for 2009 for our chemicals segment were $110,752,000 as compared to cost of goods sold and distribution for 2008 of $122,815,000. On a percentage basis, the 10% decrease in cost of goods sold and distribution was slightly greater than the 8% decrease in chemicals segment revenues. Improved margin for the chemicals segment is a result of our continued focus on cost control as well as the growth of our biofuels segment, as some of our cost is allocated to segments based on revenue.
Cost of goods sold and distribution for 2009 for our biofuels segment were $51,522,000 as compared to cost of goods sold and distribution for 2008 of $35,098,000. On a percentage basis, cost of goods sold and distribution increased 47% versus an increase in revenues of 24%. This difference is a result of growth in our fuel distribution business, higher distribution costs, and decreases in gains from hedging activity. In our fuel distribution business, we sell petrodiesel and biodiesel blends of less than 5% to as much as 20%. The margin we earn on the petrodiesel resold as a stand-alone product or as a component of the biodiesel blend is less than we earn on biodiesel. The increase in our distribution costs in 2009 is primarily related to railcar leases and rail transport charges. Finally, our gain on hedging activity in 2009 was substantially less than in 2008. Both the 2008 and 2009 periods include the $2,000,000 award from the Arkansas Alternative Fuels Development Program. Under this program, biodiesel producers in the state of Arkansas are eligible to receive $0.20 per gallon for every gallon of biodiesel produced during defined time periods, up to a maximum of $2,000,000 per period, subject to funding by the State of Arkansas. We applied for and, in the first quarter of 2008, received the maximum $2,000,000 funding under this program for biodiesel produced between January 1, 2007 and June 30, 2008. We applied for and, in the third quarter of 2009, received maximum funding under the program for biodiesel produced between July 1, 2008 and June 30, 2009. Based on the characteristics of the Arkansas Alternative Fuels Development Program and the State funding behind this program, we recognize income in the period funding is received.
Operating Expenses
Operating expenses increased 17% from $8,236,000 in 2008 to $9,598,000 in 2009. Compensation expense increased 24% as a result of additions to our chemical sales department and, to a lesser extent, additions to our administrative team. Other expense increased 28%, primarily as a result of the addition of our granary and, to a lesser extent, from increased legal fees stemming from issues described under “Other Matters”. Related party expense increased 59%, though on a dollar value basis the increase was less significant. Related party expense is described in detail in Note 20 of our consolidated financial statements included elsewhere herein.
Provision for Income Taxes
The effective tax rates for the years ended December 31, 2009 and 2008 reflect our expected tax rate on reported operating earnings before income taxes. We have determined that we do not believe that we have a more likely than not probability of realizing a portion of our deferred tax assets. As such, we have recorded a valuation allowance of $714,000 at December 31, 2009.
Critical Accounting Estimates
Allowance for Doubtful Accounts
We reduce our accounts receivable by amounts that may be uncollectible in the future. This estimated allowance is based upon management’s evaluation of the collectability of individual invoices and is based upon management’s evaluation of the financial condition of our customers and historical bad debt experience. This estimate is subject to change based upon the changing financial condition of our customers. At December 31, 2010, we recorded an allowance for doubtful accounts of $10,000, which pertained to one customer. We recorded no allowance for doubtful accounts at December 31, 2009. We historically have not experienced significant problems in collecting our receivables and we do not expect this to change going forward.
37
Depreciation
Depreciation is provided for using the straight-line method over the associated assets’ estimated useful lives. We primarily base our estimate of an asset’s useful life on our experience with other similar assets. The actual useful life of an asset may differ significantly from our estimate for such reasons as the asset’s build quality, the manner in which the asset is used, or changes in the business climate. When the actual useful life differs from the estimated useful life, impairment charges may result. We monitor the estimated useful lives of our assets and do not currently anticipate impairment charges.
Asset Retirement Obligations
We establish reserves for closure/post-closure costs associated with the environmental and other assets we maintain. Environmental assets include waste management units such as incinerators, landfills, storage tanks, and boilers. When these types of assets are constructed or installed, a reserve is established for the future costs anticipated to be associated with the closure of the site based on an expected life of the environmental assets, the applicable regulatory closure requirements, and our environmental policies and practices. These expenses are charged into earnings over the estimated useful life of the assets. The future costs anticipated to be associated with the closure of the site are based upon estimated current costs for such activities adjusted for anticipated future inflation rates. Unanticipated changes in either of these two variables or changes in the anticipated timing of closure/post-closure activities may significantly affect the established reserves. As of December 31, 2010 and December 31, 2009, we recorded a reserve for closure/post-closure liabilities of $702,000 and $680,000, respectively. We monitor this reserve and the assumptions used in its calculation. As deemed necessary, we have made changes to this reserve balance and anticipate that future changes will occur.
Revenue Recognition
For most product sales, revenue is recognized when product is shipped from our facilities and risk of loss and title have passed to the customer, which is in accordance with our customer contracts and the stated shipping terms. Nearly all custom manufactured products are manufactured under written contracts. Performance chemicals and biodiesel are generally sold pursuant to the terms of written purchase orders. In general, customers do not have any rights of return, except for quality disputes. However, all of our products are tested for quality before shipment, and historically returns have been inconsequential. We do not offer volume discounts, rebates, or warranties.
Revenue from bill and hold transactions in which a performance obligation exists is recognized when the total performance obligation has been met. Bill and hold transactions for four specialty chemical customers in both 2010 and 2009 related to revenue that was recognized in accordance with contractual agreements based on product produced and ready for use. These sales were subject to written monthly purchase orders with agreement that production was reasonable. The inventory was custom manufactured and stored at the customer’s request and could not be sold to another buyer. Credit and payment terms for bill and hold customers are similar to other specialty chemical customers. Sales revenue under bill and hold arrangements were $57,074,000, $42,773,000, and $50,527,000 for the years ended December 31, 2010, 2009, and 2008, respectively.
Income Taxes
We account for income taxes using the asset and liability method. Under this method, income tax assets and liabilities are recognized for temporary differences between financial statement carrying amounts of assets and liabilities and their respective income tax basis. A future income tax asset or liability is estimated for each temporary difference using enacted and substantively enacted income tax rates and laws expected to be in effect when the asset is realized or the liability settled. Changes in the expected tax rates and laws to be in effect when the asset is realized or the liability settled could significantly affect the income tax assets and liabilities booked by us. We monitor changes in applicable tax laws and adjust our income tax assets and liabilities as necessary.
Off-Balance Sheet Arrangements
We engage in two types of hedging transactions. First, we hedge our biofuels sales through the purchase and sale of futures contracts and options on futures contracts of energy commodities. This activity was captured on our balance sheet at December 31, 2010 and December 31, 2009. Second, we hedge our biofuels feedstock through the
38
execution of purchase contracts and supply agreements with certain vendors. These hedging transactions are recognized in earnings and were not recorded on our balance sheet at December 31, 2010 or December 31, 2009 as they do not meet the definition of a derivative instrument as defined under accounting principles generally accepted in the U.S. The purchase of biofuels feedstock generally involves two components: basis and price. Basis covers any refining or processing required as well as transportation. Price covers the purchases of the actual agricultural commodity. Both basis and price fluctuate over time. A supply agreement with a vendor constitutes a hedge when we have committed to a certain volume of feedstock in a future period and have fixed the basis for that volume.
At December 31, 2010, we had a short position in certain marketable debt securities. Such a position did not exist at December 31, 2009. The purpose of this position was to help mitigate the potential negative impact an increase in interest rates would have on other marketable securities we have purchased. We are committed to repurchase these short-sold securities in the future. We are required to maintain a margin account at a broker to collateralize this obligation. It is possible that this margin account balance will not be sufficient to meet our obligations, which would place an addition commitment on our available cash balances.
Contractual Obligations
The following table sets forth as of December 31, 2010 the payments due by period for the following contractual obligations.
(Dollars in thousands)
|
Contractual Obligations
|
Total
|
Less than
1 Year
|
1-3
Years
|
4-5
Years
|
More than
5 Years
|
|||||||||||||||
|
Long-term debt obligations(a)
|
$ | - | $ | - | $ | - | $ | - | $ | - | ||||||||||
|
Capital lease obligations
|
- | - | - | - | - | |||||||||||||||
|
Operating lease obligations
|
2,338 | 759 | 922 | 477 | 180 | |||||||||||||||
|
Purchase obligations(b)
|
6,583 | 6,583 | - | - | - | |||||||||||||||
|
Other long-term liabilities reflected on our balance sheet under GAAP(c)
|
- | - | - | - | - | |||||||||||||||
|
Total
|
$ | 8,921 | $ | 7,342 | $ | 922 | $ | 477 | $ | 180 | ||||||||||
__________
|
(a)
|
As of December 31, 2010, we had no borrowings under the $50 million credit agreement described above.
|
|
(b)
|
Purchase obligations within less than one year include the construction of two specialty chemical plants.
|
|
(c)
|
A component of other noncurrent liabilities is a reserve for asset retirement obligations and environmental contingencies of $702 at December 31, 2010. We are liable for these asset retirement obligations and environmental contingencies only in certain events, primarily the closure of our Batesville, Arkansas facility. As such, we do expect a payment related to these liabilities in the foreseeable future and therefore we have excluded this amount from the table above.
|
Other Matters
We entered into an agreement with a customer to construct at a fixed price a processing plant and produce a certain chemical for the customer. We engaged a third party to act as general contractor on the construction of this plant for a guaranteed price. That general contractor defaulted on its obligations under its contract with us and abandoned the project. As a result, we undertook the general contractor role ourselves. We also filed suit against our former contractor to recoup any damages that we may incur as a result of his default. The former contractor counterclaimed against us for amounts he asserts are due him under our contract with him. At this time, we are unable to determine what effect the general contractor’s default and/or his counterclaim will have on us or on our financial condition.
We entered into an agreement with a biodiesel trade association to pay certain fees and dues to the association in order to obtain access and registration to the association’s compiled biodiesel health effects data (“HED”) required by the Environmental Protection Agency for biodiesel manufacturers. Manufacturers of biodiesel who pay their fair share of costs for the HED can have access to and obtain registration with the Environmental Protection Agency.
39
We brought suit against the trade association for rescission of the agreement for various reasons including, among other things, that we already paid our fair share of costs for the data to the trade association; and that the fees and dues structure of the trade association were overly excessive and against public policy. The trade association filed suit against us for collection of alleged fees and dues owed by us to it. At this time, we are unable to determine what effect the trade association’s suit against us will have on us or on our financial condition.
In recent years, general economic inflation has not had a material adverse impact on our costs and, as described elsewhere herein, we have passed some price increases along to our customers. However, we are subject to certain market risks as described below.
Market risk represents the potential loss arising from adverse changes in market rates and prices. Commodity price risk is inherent in the chemical and biofuels business both with respect to input (electricity, coal, biofuel feedstocks, etc.) and output (manufactured chemicals and biofuels).
We seek to mitigate our market risks associated with the manufacturing and sale of chemicals by entering into term sale contracts that include contractual market price adjustment protections to allow changes in market prices of key raw materials to be passed on to the customer. Such price protections are not always obtained, however, so raw material price risk remains a significant risk.
In order to manage price risk caused by market fluctuations in biofuel prices, we may enter into exchange traded commodity futures and options contracts. We account for these derivative instruments in accordance with ASC 815-20-25, Derivatives and Hedging, Hedging-General, Recognition. Under this standard, the accounting for changes in the fair value of a derivative instrument depends upon whether it has been designated as an accounting hedging relationship and, further, on the type of hedging relationship. To qualify for designation as an accounting hedging relationship, specific criteria must be met and appropriate documentation maintained. We had no derivative instruments that qualified under these rules as designated accounting hedges in 2010 or 2009. Changes in the fair value of our derivative instruments are recognized at the end of each accounting period and recorded in the statement of operations as a component of cost of goods sold.
Our immediate recognition of derivative instrument gains and losses can cause net income to be volatile from quarter to quarter due to the timing of the change in value of the derivative instruments relative to the sale of biofuel being sold. As of December 31, 2010 and 2009, the fair values of our derivative instruments were a net liability in the amount of $1,649,000 and $1,930,000, respectively.
Our gross profit will be impacted by the prices we pay for raw materials and conversion costs (costs incurred in the production of chemicals and biofuels) for which we do not possess contractual market price adjustment protection. These items are principally comprised of animal fat, electricity, and petrodiesel. The availability and price of these items are subject to wide fluctuations due to unpredictable factors such as weather conditions, overall economic conditions, governmental policies, commodity markets, and global supply and demand.
We prepared a sensitivity analysis of our exposure to market risk with respect to key raw materials and conversion costs for which we do not possess contractual market price adjustment protections, based on average prices in 2010. We included only those raw materials and conversion costs for which a hypothetical adverse change in price would result in a 1% or greater decrease in gross profit. Assuming that the prices of the associated finished goods could not be increased and assuming no change in quantities sold, a hypothetical 10% change in the average price of the commodities listed below would result in the following change in annual gross profit.
40
(Volumes and dollars in thousands)
|
Item
|
Volume(a) Requirements
|
Units
|
Hypothetical Adverse Change in Price
|
Decrease in Gross Profit
|
Percentage Decrease in Gross Profit
|
||||||||||||
|
Animal fat
|
58,197,386 |
LB
|
10 | % | $ | 1,688 | 4.1 | % | |||||||||
|
Electricity
|
88,385 |
MWH
|
10 | % | $ | 454 | 1.1 | % | |||||||||
|
Petrodiesel
|
2,217,359 |
GAL
|
10 | % | $ | 451 | 1.1 | % | |||||||||
__________
|
(a)
|
Volume requirements and average price information are based upon volumes used and prices obtained for the twelve months ended December 31, 2010. Volume requirements may differ materially from these quantities in future years as our business evolves.
|
We had no borrowings as of December 31, 2010 or 2009 and, as such, we were not exposed to interest rate risk for those years. Due to the relative insignificance of transactions denominated in a foreign currency, we consider our foreign currency risk to be immaterial.
At December 31, 2010, we had a short position in certain marketable debt securities. The purpose of this position was to help mitigate the potential negative impact an increase in interest rates would have on our other marketable securities. The fair value of the securities totaled $(19,295,000) at December 31, 2010. We maintain a margin account to collateralize these marketable debt securities. This margin account maintained a balance of $21,086,000 at December 31, 2010 and is classified as restricted cash and cash equivalents in our consolidated balance sheet included herein. We will be obligated to purchase these securities at a future date. To the extent that these marketable debt securities appreciate in value, we are exposed to off-balance sheet risks.
41
Financial Statements.
The following sets forth our consolidated balance sheets as at December 31, 2010 and 2009 and our consolidated statements of operations, statements of cash flows, and statements of stockholders’ equity for each of the three years in the period ended December 31, 2010, together with RubinBrown LLP’s report thereon.
REPORT OF INDEPENDENT REGISTERED PUBLIC ACCOUNTING FIRM
To the Board of Directors and Stockholders
FutureFuel Corp.:
We have audited the accompanying consolidated balance sheets of FutureFuel Corp. and subsidiaries (the Company) as of December 31, 2010 and 2009, and the related consolidated statements of operations, comprehensive income, changes in stockholders’ equity, and cash flows for each of the three years in the period ended December 31, 2010. These consolidated financial statements are the responsibility of the Company’s management. Our responsibility is to express an opinion on these consolidated financial statements based on our audits.
We conducted our audits in accordance with the standards of the Public Company Accounting Oversight Board (United States). Those standards require that we plan and perform the audit to obtain reasonable assurance about whether the financial statements are free of material misstatement. An audit includes examining, on a test basis, evidence supporting the amounts and disclosures in the financial statements. An audit also includes assessing the accounting principles used and significant estimates made by management, as well as evaluating the overall financial statement presentation. We believe that our audits provide a reasonable basis for our opinion.
In our opinion, the consolidated financial statements referred to above present fairly, in all material respects, the financial position of the Company as of December 31, 2010 and December 31, 2009, and the results of their operations and their cash flows for each of the three years in the period ended December 31, 2010, in conformity with accounting principles generally accepted in the United States of America.
We also have audited, in accordance with the standards of the Public Company Accounting Oversight Board (United States), FutureFuel Corp. and subsidiaries’ internal control over financial reporting as of December 31, 2010, based on criteria established in Internal Control-Integrated Framework issued by the Committee of Sponsoring Organizations of the Treadway Commission, and our report dated March 16, 2011 expressed an unqualified opinion on the Company’s internal control over financial reporting.
/s/ RubinBrown LLP
St. Louis, Missouri
March 16, 2011
42
FutureFuel Corp.
Consolidated Balance Sheets
As of December 31, 2010 and 2009
(Dollars in thousands)
|
2010
|
2009
|
|||||||
|
Assets
|
||||||||
|
Cash and cash equivalents
|
$ | 91,057 | $ | 65,512 | ||||
|
Accounts receivable, net of allowances of $10 and $0, respectively
|
35,165 | 21,759 | ||||||
|
Inventory
|
37,372 | 26,444 | ||||||
|
Income taxes receivable
|
519 | 912 | ||||||
|
Prepaid expenses
|
1,240 | 1,297 | ||||||
|
Prepaid expenses - related parties
|
- | 23 | ||||||
|
Marketable and auction rate securities
|
28,200 | 6,811 | ||||||
|
Restricted cash and cash equivalents
|
21,086 | - | ||||||
|
Other current assets
|
1,015 | 828 | ||||||
|
Total current assets
|
215,654 | 123,586 | ||||||
|
Property, plant and equipment, net
|
125,007 | 119,248 | ||||||
|
Intangible assets
|
94 | 208 | ||||||
|
Other assets
|
2,401 | 2,965 | ||||||
|
Total noncurrent assets
|
127,502 | 122,421 | ||||||
|
Total Assets
|
$ | 343,156 | $ | 246,007 | ||||
|
Liabilities and Stockholders’ Equity
|
||||||||
|
Accounts payable
|
$ | 14,628 | $ | 14,269 | ||||
|
Accounts payable - related parties
|
468 | 556 | ||||||
|
Current deferred income tax liability
|
4,661 | 3,172 | ||||||
|
Deferred revenue – short-term
|
1,758 | - | ||||||
|
Short position – marketable debt securities
|
19,295 | - | ||||||
|
Accrued expenses and other current liabilities
|
3,341 | 2,832 | ||||||
|
Accrued expenses and other current liabilities - related parties
|
8 | 67 | ||||||
|
Total current liabilities
|
44,159 | 20,896 | ||||||
|
Deferred revenue – long-term
|
17,118 | 9,348 | ||||||
|
Contingent liability – long-term
|
2,289 | - | ||||||
|
Other noncurrent liabilities
|
903 | 1,376 | ||||||
|
Noncurrent deferred income tax liability
|
26,364 | 24,118 | ||||||
|
Total noncurrent liabilities
|
46,674 | 34,842 | ||||||
|
Total Liabilities
|
90,833 | 55,738 | ||||||
|
Commitments and contingencies
|
||||||||
|
Preferred stock, $0.0001 par value, 5,000,000 shares authorized, none issued and outstanding
|
- | - | ||||||
|
Common stock, $0.0001 par value, 75,000,000 shares authorized, 39,978,849 and 28,190,300 issued and outstanding as of December 31, 2010 and 2009, respectively
|
4 | 3 | ||||||
|
Accumulated other comprehensive income
|
525 | 38 | ||||||
|
Additional paid in capital
|
237,123 | 167,598 | ||||||
|
Retained earnings
|
14,671 | 22,630 | ||||||
|
Total stockholders’ equity
|
252,323 | 190,269 | ||||||
|
Total Liabilities and Stockholders’ Equity
|
$ | 343,156 | $ | 246,007 | ||||
The accompanying notes are an integral part of these financial statements.
43
FutureFuel Corp.
Consolidated Statements of Operations
for the Years Ended December 31, 2010, 2009, and 2008
(Dollars in thousands, except per share amounts)
|
2010
|
2009
|
2008
|
||||||||||
|
Revenues
|
$ | 219,090 | $ | 194,217 | $ | 193,466 | ||||||
|
Revenues – related parties
|
93 | 2,494 | 4,864 | |||||||||
|
Cost of goods sold
|
169,776 | 151,359 | 149,122 | |||||||||
|
Cost of goods sold – related parties
|
4,044 | 5,933 | 5,331 | |||||||||
|
Distribution
|
3,553 | 4,894 | 3,460 | |||||||||
|
Distribution - related parties
|
526 | 88 | - | |||||||||
|
Gross profit
|
41,284 | 34,437 | 40,417 | |||||||||
|
Selling, general, and administrative expenses
|
||||||||||||
|
Compensation expense
|
3,500 | 3,605 | 2,907 | |||||||||
|
Other expense
|
1,794 | 1,530 | 1,191 | |||||||||
|
Related party expense
|
341 | 298 | 187 | |||||||||
|
Research and development expenses
|
3,494 | 4,165 | 3,951 | |||||||||
| 9,129 | 9,598 | 8,236 | ||||||||||
|
Income from operations
|
32,155 | 24,839 | 32,181 | |||||||||
|
Interest income
|
1,135 | 403 | 2,965 | |||||||||
|
Interest expense
|
(74 | ) | (27 | ) | (26 | ) | ||||||
|
Gain (loss) on foreign currency
|
- | (3 | ) | 287 | ||||||||
|
Gain (loss) on sale of marketable securities
|
997 | (15 | ) | (377 | ) | |||||||
|
Other income (expense)
|
(35 | ) | 249 | (34 | ) | |||||||
| 2,023 | 607 | 2,815 | ||||||||||
|
Income before income taxes
|
34,178 | 25,446 | 34,996 | |||||||||
|
Provision for income taxes
|
11,084 | 8,454 | 12,321 | |||||||||
|
Net income
|
$ | 23,094 | $ | 16,992 | $ | 22,675 | ||||||
|
Earnings per common share
|
||||||||||||
|
Basic
|
$ | 0.63 | $ | 0.60 | $ | 0.84 | ||||||
|
Diluted
|
$ | 0.62 | $ | 0.58 | $ | 0.82 | ||||||
|
Weighted average shares outstanding
|
||||||||||||
|
Basic
|
36,526,105 | 28,190,300 | 27,029,210 | |||||||||
|
Diluted
|
37,188,328 | 29,254,272 | 27,550,441 | |||||||||
|
Comprehensive income
|
2010
|
2009
|
2008
|
|||||||||
|
Net income
|
$ | 23,094 | $ | 16,992 | $ | 22,675 | ||||||
|
Other comprehensive income (loss), net of tax (benefit) of $306 in 2010, $14 in 2009, and $(26) in 2008
|
487 | 23 | (43 | ) | ||||||||
|
Comprehensive income
|
$ | 23,581 | $ | 17,015 | $ | 22,632 | ||||||
The accompanying notes are an integral part of these financial statements.
44
FutureFuel Corp.
Consolidated Statements of Cash Flows
for the Years Ended December 31, 2010, 2009, and 2008
(Dollars in thousands)
|
2010
|
2009
|
2008
|
||||||||||
|
Cash flows provided by operating activities
|
||||||||||||
|
Net income
|
$ | 23,094 | $ | 16,992 | $ | 22,675 | ||||||
|
Adjustments to reconcile net income to net cash provided by operating activities:
|
||||||||||||
|
Depreciation and amortization
|
7,564 | 7,517 | 5,800 | |||||||||
|
Provision for deferred income taxes
|
3,429 | 1,025 | 3,053 | |||||||||
|
Change in fair value of derivative instruments and marketable securities
|
(93 | ) | (1,236 | ) | 2,928 | |||||||
|
Loss (gain) on the sale of investments
|
(1,184 | ) | 15 | 377 | ||||||||
|
Accretion of the discount of marketable debt securities
|
- | - | (188 | ) | ||||||||
|
Losses on disposals of fixed assets
|
318 | 240 | 24 | |||||||||
|
Stock based compensation
|
- | 873 | 849 | |||||||||
|
Noncash interest expense
|
22 | 22 | 22 | |||||||||
|
Changes in operating assets and liabilities:
|
||||||||||||
|
Accounts receivable
|
(13,406 | ) | (1,711 | ) | (2,534 | ) | ||||||
|
Inventory
|
(10,929 | ) | 1,141 | (4,149 | ) | |||||||
|
Income taxes receivable
|
393 | (120 | ) | (793 | ) | |||||||
|
Prepaid expenses
|
56 | (3 | ) | (94 | ) | |||||||
|
Prepaid expenses - related parties
|
23 | (23 | ) | - | ||||||||
|
Accrued interest on marketable securities
|
32 | 5 | 63 | |||||||||
|
Other assets
|
338 | (19 | ) | 1,042 | ||||||||
|
Accounts payable
|
360 | 937 | 711 | |||||||||
|
Accounts payable - related parties
|
(88 | ) | 134 | 300 | ||||||||
|
Income taxes payable
|
- | - | (1,231 | ) | ||||||||
|
Accrued expenses and other current liabilities
|
509 | 581 | (1,119 | ) | ||||||||
|
Accrued expenses and other current liabilities - related parties
|
(60 | ) | 47 | 20 | ||||||||
|
Deferred revenue
|
7,958 | (646 | ) | 8,423 | ||||||||
|
Other noncurrent liabilities
|
(497 | ) | 112 | 96 | ||||||||
|
Net cash provided by operating activities
|
17,839 | 25,883 | 36,275 | |||||||||
45
| 2010 | 2009 | 2008 | ||||||||||
|
Cash flows from investing activities
|
||||||||||||
|
Restricted cash
|
(21,086 | ) | - | 3,263 | ||||||||
|
Collateralization of derivative instruments
|
326 | 5,270 | (7,037 | ) | ||||||||
|
Purchase of marketable securities
|
(50,151 | ) | (19,999 | ) | (40,835 | ) | ||||||
|
Proceeds from the sale of marketable securities
|
47,012 | 35,972 | 39,557 | |||||||||
|
Net sales (purchases) of auction rate securities
|
2,800 | 12,185 | (14,985 | ) | ||||||||
|
Purchase of commercial paper
|
- | - | (15,384 | ) | ||||||||
|
Proceeds from the sale of commercial paper
|
- | 15,424 | - | |||||||||
|
Purchase of preferred stock and trust preferred securities
|
- | (3,965 | ) | - | ||||||||
|
Proceeds from the sale of fixed assets
|
3 | 17 | 8 | |||||||||
|
Acquisition of a granary
|
- | (1,252 | ) | - | ||||||||
|
Contingent purchase price payment
|
- | (312 | ) | (250 | ) | |||||||
|
Capital expenditures
|
(9,671 | ) | (21,910 | ) | (16,346 | ) | ||||||
|
Net cash provided by (used in) investing activities
|
(30,767 | ) | 21,430 | (52,009 | ) | |||||||
|
Cash flows from financing activities
|
||||||||||||
|
Proceeds from the issuance of stock
|
70,736 | - | 8,169 | |||||||||
|
Purchase of warrants
|
(1,210 | ) | (799 | ) | - | |||||||
|
Payment of dividend
|
(31,053 | ) | (8,457 | ) | (19,705 | ) | ||||||
|
Excess tax benefit associated with stock options
|
- | - | 70 | |||||||||
|
Net cash provided by (used in) financing activities
|
38,473 | (9,256 | ) | (11,466 | ) | |||||||
|
Net change in cash and cash equivalents
|
25,545 | 38,057 | (27,200 | ) | ||||||||
|
Cash and cash equivalents at beginning of period
|
65,512 | 27,455 | 54,655 | |||||||||
|
Cash and cash equivalents at end of period
|
$ | 91,057 | $ | 65,512 | $ | 27,455 | ||||||
|
Cash paid for interest
|
$ | 2 | $ | 8 | $ | 4 | ||||||
|
Cash paid for income taxes
|
$ | 8,081 | $ | 7,677 | $ | 11,117 | ||||||
|
Non-cash capital expenditures
|
$ | 3,859 | $ | - | $ | - |
The accompanying notes are an integral part of these financial statements.
46
FutureFuel Corp.
Consolidated Statements of Changes in Stockholders’ Equity
For the years ended December 31, 2010, 2009, and 2008
(Dollars in thousands)
|
Common Stock
|
Other Comprehensive
|
Additional Paid-In
|
Retained
|
Total Stockholders’
|
||||||||||||||||||||
|
Shares
|
Amount
|
Income
|
Capital
|
Earnings
|
Equity
|
|||||||||||||||||||
|
Balance - December 31, 2007
|
26,700,000 | $ | 3 | $ | 58 | $ | 158,436 | $ | 11,125 | $ | 169,622 | |||||||||||||
|
Special cash dividend
|
- | - | - | - | (19,705 | ) | (19,705 | ) | ||||||||||||||||
|
Stock based compensation
|
39,800 | - | - | 849 | - | 849 | ||||||||||||||||||
|
Proceeds from the issuance of stock
|
1,450,500 | - | - | 8,169 | - | 8,169 | ||||||||||||||||||
|
Excess income tax benefits from exercise of stock options
|
- | - | - | 70 | - | 70 | ||||||||||||||||||
|
Other comprehensive income (loss)
|
- | - | (43 | ) | - | - | (43 | ) | ||||||||||||||||
|
Net income
|
- | - | - | - | 22,675 | 22,675 | ||||||||||||||||||
|
Balance - December 31, 2008
|
28,190,300 | 3 | 15 | 167,524 | 14,095 | 181,637 | ||||||||||||||||||
|
Special cash dividend
|
- | - | - | - | (8,457 | ) | (8,457 | ) | ||||||||||||||||
|
Stock based compensation
|
- | - | - | 873 | - | 873 | ||||||||||||||||||
|
Purchase of warrants
|
- | - | - | (799 | ) | - | (799 | ) | ||||||||||||||||
|
Other comprehensive income
|
- | - | 23 | - | - | 23 | ||||||||||||||||||
|
Net income
|
- | - | - | - | 16,992 | 16,992 | ||||||||||||||||||
|
Balance - December 31, 2009
|
28,190,300 | 3 | 38 | 167,598 | 22,630 | 190,269 | ||||||||||||||||||
|
Special cash dividend
|
- | - | - | - | (31,053 | ) | (31,053 | ) | ||||||||||||||||
|
Proceeds from the issuance of stock
|
11,788,549 | 1 | - | 70,735 | - | 70,736 | ||||||||||||||||||
|
Purchase of warrants
|
- | - | - | (1,210 | ) | - | (1,210 | ) | ||||||||||||||||
|
Other comprehensive income
|
- | - | 487 | - | - | 487 | ||||||||||||||||||
|
Net income
|
- | - | - | - | 23,094 | 23,094 | ||||||||||||||||||
|
Balance – December 31, 2010
|
39,978,849 | $ | 4 | $ | 525 | $ | 237,123 | $ | 14,671 | $ | 252,323 | |||||||||||||
The accompanying notes are an integral part of these financial statements.
47
Notes to Consolidated Financial Statements of FutureFuel Corp.
(Dollars in thousands, except per share amounts)
1) Nature of operations and basis of presentation
Viceroy Acquisition Corporation
Viceroy Acquisition Corporation (“Viceroy”) was incorporated under the laws of the state of Delaware on August 12, 2005 to serve as a vehicle for the acquisition by way of asset acquisition, merger, capital stock exchange, share purchase, or similar transaction (“Business Combination”) of one or more operating businesses in the oil and gas industry. On July 12, 2006 Viceroy completed an equity offering (see Note 17).
On July 21, 2006, Viceroy entered into an acquisition agreement with Eastman Chemical Company (“Eastman Chemical”) to purchase all of the issued and outstanding stock of Eastman SE, Inc. (“Eastman SE”). On October 27, 2006, a special meeting of the shareholders of Viceroy was held and the acquisition of Eastman SE was approved by the shareholders. On October 31, 2006, Viceroy acquired all of the issued and outstanding shares of Eastman SE from Eastman Chemical. Immediately subsequent to the acquisition, Viceroy changed its name to FutureFuel Corp. (“FutureFuel”) and Eastman SE changed its name to FutureFuel Chemical Company (“FutureFuel Chemical”).
Eastman SE, Inc.
Eastman SE was incorporated under the laws of the state of Delaware on September 1, 2005 and subsequent thereto operated as a wholly-owned subsidiary of Eastman Chemical through October 31, 2006. Eastman SE was incorporated for purposes of effecting a sale of Eastman Chemical’s manufacturing facility in Batesville, Arkansas (the “Batesville Plant”). Commencing January 1, 2006, Eastman Chemical began transferring the assets associated with the business of the Batesville Plant to Eastman SE.
The Batesville Plant was constructed to produce proprietary photographic chemicals for Eastman Kodak Company (“Eastman Kodak”). Over the years, Eastman Kodak shifted the plant’s focus away from the photographic imaging business to the custom synthesis of fine chemicals and organic chemical intermediates used in a variety of end markets, including paints and coatings, plastics and polymers, pharmaceuticals, food supplements, household detergents, and agricultural products.
In 2005, the Batesville Plant began the implementation of a biobased products platform. This includes the production of biofuels (biodiesel) and biobased specialty chemical products (biobased solvents, chemicals and intermediates). In addition to biobased products, the Batesville Plant continues to manufacture fine chemicals and other organic chemicals.
Certain prior year balances have been reclassified to conform to the current presentation.
2) Significant accounting policies
Consolidation
The accompanying consolidated financial statements include the accounts of FutureFuel and its wholly-owned subsidiaries, FutureFuel Chemical and FFC Grain, L.L.C., which was formed in February 2009 to acquire a granary in Marianna, Arkansas. All significant intercompany transactions have been eliminated.
Cash and cash equivalents
Cash equivalents consist of highly liquid investments with maturities of three months or less when purchased and are carried at cost, which approximates market. FutureFuel places its temporary cash investments with high credit quality financial institutions. At times, such investments may be in excess of the Federal Deposit Insurance Corporation (FDIC) insurance limit.
Accounts receivable, allowance for doubtful accounts, and credit risk
Accounts receivable are recorded at the invoiced amount and do not bear interest. FutureFuel has established procedures to monitor credit risk and has not experienced significant credit losses in prior years.
48
Notes to Consolidated Financial Statements of FutureFuel Corp.
(Dollars in thousands, except per share amounts)
Accounts receivable have been reduced by an allowance for amounts that may be uncollectible in the future. This estimated allowance is based upon management’s evaluation of the collectibility of individual invoices and is based upon management’s evaluation of the financial condition of its customers and historical bad debt experience. Write-offs are recorded at the time a customer receivable is deemed uncollectible.
Customer concentrations
Significant portions of FutureFuel’s sales are made to a relatively small number of customers. All sales of a bleach activator are made to a leading North American consumer products company pursuant to a supply contract that is set to expire in May 2013. Sales of the bleach activator totaled $79,537 for the year ended December 31, 2010 and $73,466 for the year ended December 31, 2009. Additionally, all sales of a herbicide and certain other intermediates used in the production of this herbicide are made to one customer. Sales of this herbicide and its intermediates totaled $36,509 for the year ended December 31, 2010 and $31,587 for the year ended December 31, 2009. These two customers represented 24% and 41% of FutureFuel’s accounts receivable balance at December 31, 2010 and 2009, respectively.
Inventory
FutureFuel determines the cost of substantially all raw materials and finished goods inventories by the last-in, first-out (“LIFO”) method. FutureFuel writes down its inventories for estimated obsolescence or unmarketable inventory equal to the difference between the carrying value of inventory and the estimated market value based upon current demand and market conditions.
Financial and derivative instruments
The carrying values of cash and cash equivalents, accounts receivable, accounts payable, and accrued expenses and other current liabilities approximate their fair values due to the short-term maturities of these instruments.
FutureFuel maintains inventories of biodiesel and utilizes various derivative instruments such as regulated futures and regulated options as an economic hedge to reduce the effects of fluctuations in the prices of biodiesel. These derivative instruments do not qualify for hedge accounting under the specific guidelines of ASC 815-20-25, Derivatives and Hedging, Hedging-General, Recognition. While management believes each of these instruments are entered into in order to effectively manage various market risks, none of the derivative instruments are designated and accounted for as hedges primarily as a result of the extensive record-keeping requirements.
FutureFuel records all derivative instruments at fair value. Fair value is determined by using the closing prices of the derivative instruments on the New York Mercantile Exchange at the end of an accounting period. Changes in fair value of the derivative instruments are recorded in the statements of operations as a component of cost of goods sold. FutureFuel maintains a margin account with a broker to collateralize these derivative instruments.
Property, plant and equipment
Property, plant and equipment is carried at cost. Maintenance and repairs are charged to earnings; replacements and betterments are capitalized. When FutureFuel retires or otherwise disposes of assets, it removes the cost of such asset and related accumulated depreciation from the accounts. FutureFuel records any profit and loss on retirement or other disposition in earnings. Asset impairments are reflected as increases in accumulated depreciation. Depreciation is provided using the straight-line method over the following estimated useful lives:
|
Buildings and building equipment
|
20 – 39 years
|
|
Machinery and equipment
|
3 – 33 years
|
|
Transportation equipment
|
5 – 33 years
|
|
Other
|
5 – 33 years
|
49
Notes to Consolidated Financial Statements of FutureFuel Corp.
(Dollars in thousands, except per share amounts)
Customer relationships
Customer relationships are recorded at acquisition cost and are amortized on a straight-line basis over their estimated useful lives of five years. FutureFuel reviews and evaluates the recoverability of the carrying amounts of its acquired customer contracts annually, or whenever events or changes in circumstances indicate that the carrying amount may not be recoverable.
Impairment of assets
FutureFuel evaluates the carrying value of long-lived assets when events or changes in circumstances indicate that the carrying value may not be recoverable. Such events and circumstances include, but are not limited to, significant decreases in the market value of the asset, adverse changes in the extent or manner in which the asset is being used, significant changes in business climate, or current or projected cash flow losses associated with the use of the assets. The carrying value of a long-lived asset is considered impaired when the total projected undiscounted cash flows from such assets are separately identifiable and are less than its carrying value. In that event, a loss is recognized based on the amount by which the carrying value exceeds the fair value of the long-lived asset. For long-lived assets to be held for use in future operations and for fixed (tangible) assets, fair value is determined primarily using either the projected cash flows discounted at a rate commensurate with the risk involved or appraisal. For long-lived assets to be disposed of by sale or other than sale, fair value is determined in a similar manner, except that fair values are reduced for disposal costs.
Deferred revenue
FutureFuel has signed contracts with customers to construct plant and related assets on FutureFuel’s property for the manufacture of custom chemicals. The cost of construction has been funded by the customers with title and risk of loss to the equipment residing with FutureFuel. Reimbursements are recognized as deferred revenue and are amortized over the expected life of the customer relationship starting upon the completion of construction and the asset being placed into service.
Additionally, FutureFuel has been awarded grants from governmental agencies related to the construction of production equipment and infrastructural improvements at its plant site. The cost of construction of these projects has been either funded by the governmental agencies directly or funded by FutureFuel who has then been reimbursed by the governmental agencies. Direct payments and reimbursements for construction costs have been recognized as deferred revenue and will be amortized into earnings over the expected life of the applicable customer relationship or the life of the asset if no direct customer relationship is tied to the asset. Such amortization will not begin until the asset has been placed into service and all contingencies associated with the grants are fulfilled.
Asset retirement obligations
FutureFuel establishes reserves for closure/post-closure costs associated with the environmental and other assets it maintains. Environmental assets include but are not limited to waste management units such as destructors, landfills, storage tanks, and boilers. When these types of assets are constructed or installed, a reserve is established for the future costs anticipated to be associated with the closure of the site based on an expected life of the environmental assets, the applicable regulatory closure requirements, and FutureFuel’s environmental policies and practices. These expenses are charged into earnings over the estimated useful life of the assets. Currently, FutureFuel estimates the useful life of each individual asset up to 35 years. Changes made in estimates of the asset retirement obligation costs or the estimate of the useful lives of these assets are reflected in earnings as an increase or decrease in the period such changes are made.
Environmental costs are capitalized if they extend the life of the related property, increase its capacity, and/or mitigate or prevent future contamination. The cost of operating and maintaining environmental control facilities is charged to expense.
50
Notes to Consolidated Financial Statements of FutureFuel Corp.
(Dollars in thousands, except per share amounts)
Income taxes
Income taxes are accounted for using the asset and liability method. Under this method, income tax assets and liabilities are recognized for temporary differences between financial statement carrying amounts of assets and liabilities and their respective income tax basis. A future income tax asset or liability is estimated for each temporary difference using enacted and substantively enacted income tax rates and laws expected to be in effect when the asset is realized or the liability settled. A valuation allowance is established, if necessary, to reduce any future income tax asset to an amount that is more likely than not to be realized.
FASB ASC Topic 740, Income Taxes (“ASC 740”), clarifies the accounting for uncertainty in income taxes recognized in the financial statements. ASC 740 provides that a tax benefit from an uncertain tax position may be recognized when it is more likely than not that the position will be sustained upon examination, including resolution of any related appeals or litigation processes, based on the technical merits of the position. Income tax positions must meet a more-likely-than-not recognition threshold to be recognized. ASC 740 also provides guidance on measurement, derecognition, classification, interest and penalties, accounting in interim periods, disclosure, and transition. These provisions are effective for fiscal years beginning after December 15, 2006. The adoption of these provisions did not have a material impact on the consolidated financial position, liquidity, or results of operations of FutureFuel.
Revenue recognition
For most product sales, revenue is recognized when product is shipped from our facilities and risk of loss and title have passed to the customer, which is in accordance with our customer contracts and the stated shipping terms. All custom manufactured products are manufactured under written contracts. Performance chemicals and biofuels are usually sold pursuant to the terms of written purchase orders. In general, customers do not have any rights of return, except for quality disputes. However, all of our products are tested for quality before shipment, and historically returns have been inconsequential. FutureFuel does not offer volume discounts, rebates, or warranties.
Bill and hold transactions for 2010 related to four specialty chemical customers whereby revenue was recognized in accordance with contractual agreements based on product produced and ready for use. These sales were subject to written monthly purchase orders with agreement that production was reasonable. The inventory was custom manufactured and stored at the customer’s request and could not be sold to another buyer. Credit and payment terms for bill and hold transactions are similar to other specialty chemical customers. Sales revenue under bill and hold arrangements were $57,074, $42,773, and $50,527 for the years ended December 31, 2010, 2009, and 2008, respectively.
Shipping and handling fees
Shipping and handling fees related to sales transactions are billed to customers and recorded as sales revenues.
Cost of goods sold and selling, general and administration expense
Cost of goods sold includes the costs of inventory sold, related purchasing, distribution, and warehousing costs, costs incurred for shipping and handling, and environmental remediation costs. Netted from cost of goods sold is the biodiesel tax incentive for blending biodiesel with petrodiesel. The biodiesel tax credit amounts to one cent for each percentage point of vegetable oil or animal fat biodiesel that is blended with petrodiesel. The credit is recognized as it is earned, i.e., when biodiesel blended with petrodiesel is sold.
Selling, general, and administration expense includes personnel costs associated with sales, marketing and administration, legal and legal-related costs, consulting and professional services fees, advertising expenses, and other similar costs.
51
Notes to Consolidated Financial Statements of FutureFuel Corp.
(Dollars in thousands, except per share amounts)
Research and development
All costs identified as research and development costs are charged to expense when incurred.
Planned major maintenance activities
Expenditures for planned major maintenance activities are recognized as expense as incurred.
Earnings per share
Basic earnings per share is computed by dividing net income (the numerator) by the weighted average number of outstanding shares (the denominator) for the period. Diluted earnings per share are calculated in accordance with the treasury stock method to determine the dilutive effect of warrants and options. The computation of diluted earnings per share includes the same numerator, but the denominator is increased to include the number of additional common shares from the exercise of warrants and options that would have been outstanding if potentially dilutive common shares had been issued.
Comprehensive income
Comprehensive income is comprised of net income and other comprehensive income (“OCI”). Comprehensive income comprises all changes in shareholders’ equity from transactions and other events and circumstances from non-owner sources. FutureFuel’s OCI is comprised of gains resulting from its investment in certain marketable securities classified as available for sale (see Note 7). For the year ended December 31, 2010, FutureFuel recorded an unrealized gain of $487, net of income taxes of $306, on these securities. For the year ended December 31, 2009, FutureFuel recorded an unrealized gain of $23, net of income taxes of $14, on these securities. For the year ended December 31, 2008, FutureFuel recorded an unrealized loss of $43, net of income tax benefit of $26, on these securities.
Commitments and contingent liabilities
In the ordinary course of its business, FutureFuel enters into supply and sales contracts as deemed commercially desirable. Supply contracts are utilized to ensure the availability of raw materials used in the production process. Sales contracts are utilized to ensure the future sale of produced product.
FutureFuel and its operations from time to time may be parties to or targets of lawsuits, claims, investigations, and proceedings including product liability, personal injury, patent and intellectual property, commercial, contract, environmental, health and safety, and environmental matters, which are handled and defended in the ordinary course of business. FutureFuel accrues a liability for such matters when it is probable that a liability has been incurred and the amount can be reasonably estimated. When a single amount cannot be reasonably estimated but the cost can be estimated within a range, FutureFuel accrues the minimum amount.
Use of estimates
The preparation of financial statements in conformity with accounting principals generally accepted in the United States requires management to make estimates and assumptions that affect the reported amounts of assets and liabilities, disclosure of contingent assets and liabilities at the date of the financial statements, and the reported amounts of revenues and expenses during a reporting period. Estimates are used when accounting for allowance for doubtful accounts, depreciation, amortization, asset retirement obligations, and income taxes as well as the evaluation of potential losses due to impairments or future liabilities. Actual results could differ materially from those estimates.
Segment reporting
FutureFuel identifies operating segments when separate financial information is available that is evaluated regularly by its chief operating decision maker in assessing the performance of those segments and in determining how to allocate resources. FutureFuel has determined that it has two reportable segments organized along product lines -- chemicals and biofuels.
52
Notes to Consolidated Financial Statements of FutureFuel Corp.
(Dollars in thousands, except per share amounts)
3) Business combination
FutureFuel was incorporated on August 12, 2005 to serve as a vehicle for a business combination of one or more operating businesses in the oil and gas industry. In 2006, FutureFuel identified such an operating business in Eastman SE. Eastman SE, as owner of the Batesville Plant, began the implementation of a biobased products platform, including the production of biofuels (biodiesel) and biobased specialty products (biobased lubricants, solvents, and intermediates). In addition to the biobased products platform, the Batesville Plant continued the custom synthesis of fine chemicals and other organic chemicals. On October 31, 2006, FutureFuel acquired all of the issued and outstanding shares of Eastman SE from Eastman Chemical for cash consideration and $0.02 per gallon of biodiesel sold by FutureFuel during the three-year period commencing on November 1, 2006 and ending on October 31, 2009. Immediately subsequent to its acquisition, Eastman SE changed its name to FutureFuel Chemical. The results of FutureFuel Chemical have been included in FutureFuel’s results of operations since October 31, 2006. After final purchase price adjustments, a price of $70,970 was paid for the stock of Eastman SE. Cumulative contingent purchase price payments to Eastman Chemical based on volumes of biodiesel sold totaled $11 through December 31, 2006, $183 through December 31, 2007, $433 through December 31, 2008, and $745 through December 31, 2009. The obligation to make this contingent payment terminated on October 31, 2009. The contingent purchase price payments offset a contingent consideration liability that FutureFuel recorded as of the closing date of the acquisition. This contingent consideration liability was established based upon management’s estimates, as of the closing date of the acquisition, of the volume of biodiesel that would be sold during the three-year period beginning November 1, 2006 and ending October 31, 2009. The value of the contingent consideration liability at October 31, 2006 was $2,370. As indicated immediately above, actual contingent purchase price payments during the three-year period totaled $745, leaving a balance of $1,625 at October 31, 2009. As of December 31, 2009, FutureFuel eliminated this remaining liability from its balance sheet as it no longer has any obligation to Eastman Chemical, and FutureFuel simultaneously wrote-down its assets by the same amount; the elimination of the contingent consideration liability had no impact on earnings.
4) Reinstatement of biodiesel blender’s tax credit
In December 2010, the government of the United States passed into law the retroactive reinstatement of the $1.00 per gallon biodiesel blender’s tax credit. This action resulted in FutureFuel’s biodiesel blending activities from January 1, 2010 to December 31, 2010 qualifying for this credit. The credit related to 2010 activity totaled $10,785 and was recorded as a reduction to cost of goods sold in the forth quarter of 2010. The related receivable was recorded as a component of accounts receivable at December 31, 2010. No such receivable existed at December 31, 2009. This receivable was fully collected in February 2011.
5) Inventories
The carrying values of inventory were as follows as of December 31:
|
2010
|
2009
|
|||||||
|
At average cost (approximates current cost)
|
||||||||
|
Finished goods
|
$ | 6,659 | $ | 14,078 | ||||
|
Work in process
|
1,999 | 1,841 | ||||||
|
Raw materials and supplies
|
36,652 | 16,451 | ||||||
| 45,310 | 32,370 | |||||||
|
LIFO reserve
|
(7,938 | ) | (5,926 | ) | ||||
|
Total inventories
|
$ | 37,372 | $ | 26,444 | ||||
Inventory balances at December 31, 2009 include the impact of a $1,710 write-down to market value for biodiesel and a key biodiesel raw material. The write-down was a result of the expired federal blender’s credit which reduced the expected selling price of biodiesel.
53
Notes to Consolidated Financial Statements of FutureFuel Corp.
(Dollars in thousands, except per share amounts)
6) Derivative instruments
FutureFuel is exposed to certain risks relating to its ongoing business operations. The primary risk managed by using derivative instruments is commodity price risk. Regulated fixed price futures and option contracts are utilized to manage the price risk associated with future purchases of feedstock used in FutureFuel’s biodiesel production along with physical feedstock and finished product inventories attributed to this process.
FutureFuel recognizes all derivative instruments as either assets or liabilities at fair value in its consolidated balance sheet. FutureFuel’s derivative instruments do not qualify for hedge accounting under the specific guidelines of ASC 815-20-25, Derivatives and Hedging, Hedging-General, Recognition. While management believes each of these instruments are entered into in order to effectively manage various risks, none of the derivative instruments are designated and accounted for as hedges primarily as a result of the extensive record keeping requirements.
The fair value of FutureFuel’s derivative instruments is determined based on the closing prices of the derivative instruments on relevant commodity exchanges at the end of an accounting period. Changes in fair value of the derivative instruments are recorded in the statement of operations as a component of cost of goods sold, and amounted to a gain (loss) of $(928), $488, and $9,519 for the years ended December 31, 2010, 2009, and 2008, respectively.
The volumes and carrying values of FutureFuel’s derivative instruments were as follows at December 31:
|
Asset/(Liability)
|
||||||||||||||||
|
2010
|
2009
|
|||||||||||||||
|
Quantity (contracts) Long/
(Short)
|
Fair Value
|
Quantity (contracts) Long/
(Short)
|
Fair Value
|
|||||||||||||
|
Regulated options, included in other current assets
|
(225 | ) | $ | (1,620 | ) | (150 | ) | $ | (1,998 | ) | ||||||
|
Regulated fixed price future commitments, included in other current assets
|
(44 | ) | $ | (29 | ) | 10 | $ | 68 | ||||||||
The margin account maintained with a broker to collateralize these derivative instruments carried an account balance of $2,230 and $2,556 at December 31, 2010 and 2009, respectively, and is classified as other current assets in the consolidated balance sheet. The carrying values of the margin account and of the derivative instruments are included, net, in other current assets.
7) Marketable securities
FutureFuel has made investments in certain auction rate securities. As of December 31, 2009, these securities had a maturity of August 2037. FutureFuel classified these instruments as current assets in the accompanying consolidated balance sheets as the issuers of these instruments have either exercised their right to repurchase or a liquid market still exists for these securities, which allows FutureFuel to exit its positions within a short period of time. These securities were repurchased on October 15, 2010 for par value. FutureFuel designated these securities as being available-for-sale. Accordingly, these securities were carried at fair value, with unrealized gains and losses, net of taxes, reported as a component of stockholders’ equity. The amortized cost, unrealized gains, unrealized losses, and fair value of these securities totaled $2,800, $0, $0, and $2,800, respectively, at December 31, 2009. No realized gains or losses have been incurred related to these securities through December 31, 2010.
At December 31, 2010, FutureFuel had investments in certain preferred stock, trust preferred securities, and other equity instruments. At December 31, 2009, FutureFuel had investments in certain preferred stock and trust preferred securities. These investments have been classified as current assets in the accompanying consolidated balance sheets. FutureFuel has designated these securities as being available-for-sale.
54
Notes to Consolidated Financial Statements of FutureFuel Corp.
(Dollars in thousands, except per share amounts)
Accordingly, they are recorded at fair value, with the unrealized gains and losses, net of taxes, reported as a component of stockholders’ equity. The amortized cost, unrealized gains, unrealized losses, and fair value of these securities totaled $27,348, $1,056, $(204), and $28,200, respectively, at December 31, 2010. The amortized cost, unrealized gains, unrealized losses, and fair value of these securities totaled $3,950, $70, $(9), and $4,011, respectively, at December 31, 2009.
At December 31, 2010, FutureFuel had a short position in certain marketable debt securities. Such a position did not exist at December 31, 2009. The purpose of this position is to help mitigate the potential negative impact an increase in interest rates would have on other marketable securities FutureFuel has purchased. The securities comprising this position are carried at fair value, with unrealized gains and losses reported as a component of net income. FutureFuel realized gains of $528 and $0 on these securities in 2010 and 2009, respectively. The amortized cost, unrealized gains, unrealized losses, and fair value, including accrued interest, of these securities totaled $(19,107), $0, $(188), and $(19,295), respectively, at December 31, 2010. The margin account maintained with a broker to collateralize these securities carried a balance of $21,086 and $0 at December 31, 2010 and 2009, respectively, and is classified as restricted cash and cash equivalents in the consolidated balance sheet. FutureFuel will be obligated to purchase these securities at a future date. To the extent that these securities appreciate in value, FutureFuel is exposed to off-balance sheet risk. Realized gains or losses on securities are determined on a trade date based on the specific amortized cost of the investments sold.
8) Property, plant and equipment
Property, plant and equipment consisted of the following at December 31:
|
2010
|
2009
|
|||||||
|
Land and land improvements
|
$ | 5,005 | $ | 4,599 | ||||
|
Buildings and building equipment
|
23,523 | 22,325 | ||||||
|
Machinery and equipment
|
110,441 | 100,215 | ||||||
|
Construction in progress
|
12,857 | 11,564 | ||||||
|
Accumulated depreciation
|
(26,819 | ) | (19,455 | ) | ||||
|
Total
|
$ | 125,007 | $ | 119,248 | ||||
Depreciation expense totaled $7,450, $7,404, and $5,686 for the years ended December 31, 2010, 2009, and 2008, respectively.
9) Intangible assets
In connection with its acquisition of Eastman SE, a certain portion of the purchase price was allocated to the intangible asset customer relationships. Customer relationships consisted of the following at December 31:
|
2010
|
2009
|
|||||||
|
Cost
|
$ | 567 | $ | 567 | ||||
|
Accumulated amortization
|
(473 | ) | (359 | ) | ||||
| $ | 94 | $ | 208 | |||||
Amortization expense totaled $114, $113, and $114 for the years ended December 31, 2010, 2009, and 2008, respectively. FutureFuel estimates that amortization expense for 2011 will be $94.
10) Other assets
Other assets are primarily comprised of supplies and parts that have been held longer than 24 months and are not expected to be used in the twelve-month period subsequent to the balance sheet date. The balance related to these items totaled $2,401 and $2,965 at December 31, 2010 and 2009, respectively.
55
Notes to Consolidated Financial Statements of FutureFuel Corp.
(Dollars in thousands, except per share amounts)
11) Accrued expenses and other current liabilities
Accrued expenses and other current liabilities, including those associated with related parties, consisted of the following at December 31:
|
2010
|
2009
|
|||||||
|
Accrued employee liabilities
|
$ | 1,727 | $ | 1,499 | ||||
|
Accrued property, use and franchise taxes
|
1,174 | 1,064 | ||||||
|
Other
|
448 | 336 | ||||||
|
Total
|
$ | 3,349 | $ | 2,899 | ||||
12) Borrowings
In March 2007, FutureFuel Chemical entered into a $50 million credit agreement with a commercial bank. The loan is a revolving facility the proceeds of which may be used for working capital, capital expenditures, and the general corporate purposes of FutureFuel Chemical. The facility terminates on June 30, 2013. Advances are made pursuant to a borrowing base comprised of 85% of eligible accounts plus 60% of eligible direct inventory plus 50% of eligible indirect inventory. Advances are secured by a perfected first priority security interest in accounts receivable and inventory. The interest rate floats at certain margins over the London Interbank Offered Rate (“LIBOR”) or base rate based upon the leverage ratio from time to time as set forth in the following table.
|
Leverage
Ratio
|
Base Rate
Margin
|
LIBOR
Margin
|
||
|
> 3
|
-0.55%
|
1.70%
|
||
|
≥ 2 < 3
|
-0.70%
|
1.55%
|
||
|
≥ 1 < 2
|
-0.85%
|
1.40%
|
||
|
< 1
|
-1.00%
|
1.25%
|
There is an unused commitment fee of 0.325% per annum. On the last day of each fiscal quarter, the ratio of EBITDA to fixed charges may not be less than 3:1. FutureFuel has guaranteed FutureFuel Chemical’s obligations under this credit agreement.
There were no borrowings at December 31, 2010 or December 31, 2009.
13) Asset retirement obligations and environmental reserves
The Batesville Plant generates hazardous and non-hazardous wastes, the treatment, storage, transportation, and disposal of which are regulated by various governmental agencies. In addition, the Batesville Plant may be required to incur costs for environmental and closure and post-closure costs under the Resource Conservation and Recovery Act. FutureFuel’s reserve for asset retirement obligations and environmental contingencies was $702 and $680 as of December 31, 2010 and 2009, respectively. These amounts are recorded in other noncurrent liabilities in the accompanying balance sheet.
The following table summarizes the activity of accrued obligations for asset retirement obligations:
|
2010
|
2009
|
|||||||
|
Beginning balance
|
$ | 680 | $ | 588 | ||||
|
Accretion expense
|
22 | 22 | ||||||
|
Change in estimate
|
- | 70 | ||||||
|
Balance at December 31
|
$ | 702 | $ | 680 | ||||
14) Stock based compensation
The board of directors of FutureFuel adopted an omnibus incentive plan which was approved by the shareholders of FutureFuel at its 2007 annual shareholder meeting on June 26, 2007. The purpose of the plan is to:
56
Notes to Consolidated Financial Statements of FutureFuel Corp.
(Dollars in thousands, except per share amounts)
|
|
·
|
Encourage ownership in FutureFuel by key personnel whose long-term employment with or engagement by FutureFuel or its subsidiaries is considered essential to its continued progress and, thereby, encourage recipients to act in FutureFuel’s shareholders’ interests and share in its success;
|
|
|
·
|
Encourage such persons to remain in FutureFuel’s employ or in the employ of its subsidiaries; and
|
|
|
·
|
Provide incentives to persons who are not FutureFuel employees to promote FutureFuel’s success.
|
The plan authorizes FutureFuel to issue stock options (including incentive stock options and nonqualified stock options), stock awards, and stock appreciation rights. Eligible participants in the plan include: (i) members of FutureFuel’s board of directors and its executive officers; (ii) regular, active employees of FutureFuel and any of its subsidiaries; and (iii) persons engaged by FutureFuel or any of its subsidiaries to render services to FutureFuel or its subsidiaries as an advisor or consultant.
Awards under the plan are limited to shares of FutureFuel’s common stock, which may be shares acquired by FutureFuel, including shares purchased in the open market, or authorized but un-issued shares. Awards are limited to 10% of the issued and outstanding shares of FutureFuel’s common stock in the aggregate.
The plan became effective upon its approval by FutureFuel’s shareholders on June 26, 2007 and continues in effect for a term of ten years thereafter unless amended and extended by FutureFuel or unless otherwise terminated.
FutureFuel recognizes compensation expense in its financial statements for stock based options based upon the grant-date fair value over the requisite service period.
In April 2008, FutureFuel granted a total of 250,000 stock options to members of its board of directors (“Director Options”). Additionally, the Company granted a total of 55,000 stock options to selected members of its management (“Management Options”). An additional 5,000 Management Options were issued in September 2008 and an additional 100,000 Director Options were granted on December 10, 2008. The options awarded in April 2008 have an exercise price equal to the average of the bid and ask price of FutureFuel’s common stock on the date of grant as established in private sales, which the board of directors determined to be the fair value of such stock on that date. The Management Options awarded in September 2008 and the Director Options awarded in December 2008 have an exercise price equal to the last quoted price of FutureFuel’s common stock on the date of grant as quoted on the Over-the-Counter Bulletin Board. The Director Options vested immediately upon grant. Originally, one-third of the Management Options granted in April 2008 vested on each of the annual anniversary dates of the grant. Those Management Options were amended in September 2008 to provide for immediate vesting. The Management Options issued in September 2008 vested immediately upon grant. Both the Director Options and the Management Options awarded in April 2008 expire on April 7, 2013. The Management Options awarded in September 2008 expire on September 30, 2013. The Director Options awarded in December 2008 expire on December 10, 2013. FutureFuel has utilized the Black Scholes Merton option pricing model, which relies on certain assumptions, to estimate the fair value of the options it granted.
In December 2009, FutureFuel granted a total of 185,000 Director Options to members of its board. Additionally, the Company granted a total of 95,500 Management Options to selected members of its management. The options awarded in December 2009 have an exercise price equal to the last quoted price of FutureFuel’s common stock on the date of grant as quoted on the Over-the-Counter Bulletin Board. The Director Options and Management Options vested immediately upon grant. Both the Director Options and the Management Options expire on December 21, 2014. FutureFuel has utilized the Black Scholes Merton option pricing model, which relies on certain assumptions, to estimate the fair value of the options it granted.
No options were awarded in 2010.
57
Notes to Consolidated Financial Statements of FutureFuel Corp.
(Dollars in thousands, except per share amounts)
The assumptions used in the determination of the fair value of the options granted are provided in the following table:
|
Assumptions
|
April 2008 Director Options
|
April 2008 Management Options
|
September 2008 Management Options
|
December 2008 Director Options
|
December 2009 Options
|
|||||||||||||||
|
Expected volatility rate
|
46.78 | % | 48.74 | % | 50.63 | % | 60.88 | % | 73.10 | % | ||||||||||
|
Expected dividend yield
|
0.00 | % | 0.00 | % | 0.00 | % | 0.00 | % | 0.00 | % | ||||||||||
|
Risk-free interest rate
|
2.03 | % | 2.26 | % | 2.22 | % | 1.04 | % | 1.12 | % | ||||||||||
|
Expected forfeiture rate
|
0.00 | % | 0.00 | % | 0.00 | % | 0.00 | % | 0.00 | % | ||||||||||
|
Expected term in years
|
2.5 | 2.5 | 2.5 | 2.5 | 2.5 | |||||||||||||||
The volatility rate for the options granted is derived from the historical stock price volatility of a peer group of companies over the same time period as the expected term of each stock option award. The volatility rate is derived by a mathematical formula utilizing the daily closing stock price data over the expected term. It is FutureFuel’s expectation that volatility rates for future stock option grants will be based on FutureFuel’s historical stock price volatility as FutureFuel develops a lengthier stock trading history.
The expected dividend yield is calculated using FutureFuel’s expected dividend amount at the date of the option grant over the expected term divided by the fair market value of FutureFuel’s common stock.
The risk-free interest rate is derived from the United States Federal Reserve’s published interest rates of yields for the same time period as the expected term.
FutureFuel only includes share-based awards expected to vest in share-based compensation expense. The estimated forfeiture rates are based upon FutureFuel’s expected rate of forfeiture and are excluded from the quantity of awards included in share-based compensation expense.
FutureFuel granted stock options in 2008 and 2009 only and therefore does not have a substantial historical record of share-based award transactions on which to base an estimate of expected term. FutureFuel has therefore elected to utilize the “simplified” method of estimating expected term as discussed in Staff Accounting Bulletins No. 107 and No. 110.
On December 3, 2008, FutureFuel granted a stock award of 100 shares of its common stock to 398 of FutureFuel Chemical’s employees. FutureFuel recognized compensation expense as a result of this award equal to the number of shares granted multiplied by the fair value of its common stock on the date of the award. Such compensation expense was recorded as a component of cost of goods sold and totaled $225 in the twelve months ended December 31, 2008. No such awards were granted in 2010 or 2009.
For the years ended December 31, 2010, 2009, and 2008, total share-based compensation expense (before tax) totaled $0, $873, and $849, respectively. In the year ended December 31, 2009, $762, $74, and $37 of this balance was recorded as an element of selling, general and administrative expense, cost of goods sold, and research and development expense, respectively. In the year ended December 31, 2008, $225, $610, and $14 of this balance was recorded as an element of selling, general and administrative expense, cost of goods sold, and research and development expense, respectively.
The weighted average fair value of options granted in 2010 was $0 per option, in 2009 was $3.11 per option, and in 2008 was $1.52 per option.
58
Notes to Consolidated Financial Statements of FutureFuel Corp.
(Dollars in thousands, except per share amounts)
A summary of the activity of FutureFuel’s stock option awards for the period beginning January 1, 2008 and ending December 31, 2010 is presented below.
|
Options
|
Weighted Average Exercise Price
|
|||||||
|
Outstanding as January 1, 2008
|
- | $ | - | |||||
|
Granted
|
410,000 | $ | 4.43 | |||||
|
Exercised
|
(268,000 | ) | $ | 4.00 | ||||
|
Canceled, forfeited or expired
|
- | $ | - | |||||
|
Outstanding at December 31, 2008
|
142,000 | $ | 5.25 | |||||
|
Granted
|
280,500 | $ | 7.00 | |||||
|
Exercised
|
- | $ | - | |||||
|
Canceled, forfeited or expired
|
- | $ | - | |||||
|
Outstanding at December 31, 2009
|
422,500 | $ | 6.41 | |||||
|
Granted
|
- | $ | - | |||||
|
Exercised
|
(5,000 | ) | $ | 7.00 | ||||
|
Canceled, forfeited, or expired
|
- | $ | - | |||||
|
Outstanding at December 31, 2010
|
417,500 | $ | 6.40 | |||||
There were 1,939,700 options available for grant at December 31, 2010. The following table provides the remaining contractual term and weighted average exercise prices of stock options outstanding and exercisable at December 31, 2010.
|
Options Outstanding
|
Options Exercisable
|
||||||||
|
Exercise Price
|
Number
Outstanding at December 31, 2010
|
Weighted Average Remaining Contractual Life
|
Weighted Average Exercise Price
|
Number Exercisable at December 31, 2010
|
Weighted Average Exercise Price
|
||||
|
$4.00
|
37,000
|
2.27
|
$4.00
|
37,000
|
$4.00
|
||||
|
$5.65
|
100,000
|
2.95
|
$5.65
|
100,000
|
$5.65
|
||||
|
$6.48
|
5,000
|
2.75
|
$6.48
|
5,000
|
$6.48
|
||||
|
$7.00
|
275,500
|
3.86
|
$7.00
|
275,500
|
$7.00
|
||||
|
417,500
|
3.49
|
$6.40
|
417,500
|
$6.40
|
|||||
The weighted average remaining contractual life of all exercisable options is 3.49 years.
The aggregate intrinsic values of total options outstanding and total options exercisable at December 31, 2010 and 2009 are $1,480 and $122, respectively. Intrinsic value is the amount by which the last trade price of the common stock closest to December 31, 2010 and December 31, 2009, respectively, exceeded the exercise price of the options granted.
The amendment of the Management Options in September 2008 referred to above resulted in the immediate recognition into expense of the estimated fair value of those options not previously recognized, which totaled $74.
No stock options were exercised in 2009, nor was any stock awarded. No stock was awarded in 2010, but 5,000 stock options were exercised that year. In 2010, FutureFuel realized gross proceeds from stock option exercises of $35 and realized a net tax benefit of $5.
59
Notes to Consolidated Financial Statements of FutureFuel Corp.
(Dollars in thousands, except per share amounts)
15) Provision for income taxes
The following table summarizes the provision for income taxes:
|
2010
|
2009
|
2008
|
||||||||||
|
Income before taxes - U.S.
|
$ | 34,178 | $ | 25,446 | $ | 34,996 | ||||||
|
Provision for income taxes:
|
||||||||||||
|
Current
|
$ | 6,840 | $ | 6,811 | $ | 8,176 | ||||||
|
Deferred
|
3,056 | 739 | 2,710 | |||||||||
|
State and other
|
||||||||||||
|
Current
|
815 | 843 | 1,093 | |||||||||
|
Deferred
|
373 | 61 | 342 | |||||||||
|
Total
|
$ | 11,084 | $ | 8,454 | $ | 12,321 | ||||||
Differences between the provision for income taxes computed using the U.S. federal statutory income tax rate were as follows:
|
2010
|
2009
|
2008
|
||||||||||
|
Amount computed using the statutory rate of 35%
|
$ | 11,962 | $ | 8,906 | $ | 12,249 | ||||||
|
Section 199 manufacturing deduction
|
(463 | ) | (237 | ) | (271 | ) | ||||||
|
Agri-biodiesel production credit
|
(640 | ) | (975 | ) | (812 | ) | ||||||
|
Credit for increasing research activities
|
(106 | ) | (144 | ) | (78 | ) | ||||||
|
Alternative fueling equipment credit
|
(79 | ) | (160 | ) | - | |||||||
|
Tax exempt interest income
|
(6 | ) | (74 | ) | (541 | ) | ||||||
|
Change in the valuation allowance
|
(437 | ) | (23 | ) | 265 | |||||||
|
State income taxes, net
|
1,368 | 1,011 | 1,336 | |||||||||
|
Reversal of unrecognized tax benefits
|
(718 | ) | - | - | ||||||||
|
Other
|
203 | 150 | 173 | |||||||||
|
Provision for income taxes
|
$ | 11,084 | $ | 8,454 | $ | 12,321 | ||||||
The significant components of deferred tax assets and liabilities were as follows as of December 31:
|
2010
|
2009
|
|||||||
|
Deferred tax assets
|
||||||||
|
Vacation pay
|
$ | 124 | $ | 122 | ||||
|
Allowance for doubtful accounts
|
4 | - | ||||||
|
Agri-biodiesel production credit
|
- | 190 | ||||||
|
Inventory reserves
|
392 | 1,050 | ||||||
|
Self insurance
|
128 | 104 | ||||||
|
Asset retirement obligation
|
248 | 266 | ||||||
|
Derivative instruments
|
407 | 889 | ||||||
|
Stock based compensation
|
435 | 441 | ||||||
|
Other
|
83 | - | ||||||
|
Total deferred tax assets
|
1,821 | 3,062 | ||||||
|
Deferred tax liabilities
|
||||||||
|
Available for sale securities
|
(327 | ) | (23 | ) | ||||
|
Accrued expenses
|
(19 | ) | (18 | ) | ||||
|
LIFO inventory
|
(4,717 | ) | (4,320 | ) | ||||
|
Intangible assets
|
(37 | ) | (81 | ) | ||||
|
Depreciation
|
(27,357 | ) | (25,196 | ) | ||||
|
Other
|
(112 | ) | - | |||||
|
Total deferred tax liabilities
|
(32,569 | ) | (29,638 | ) | ||||
|
Valuation allowance
|
(277 | ) | (714 | ) | ||||
|
Net deferred tax liabilities
|
$ | (31,025 | ) | $ | (27,290 | ) | ||
60
Notes to Consolidated Financial Statements of FutureFuel Corp.
(Dollars in thousands, except per share amounts)
|
2010
|
2009
|
|||||||
|
As recorded in the consolidated balance sheet
|
||||||||
|
Current deferred tax liability
|
$ | (4,661 | ) | $ | (3,172 | ) | ||
|
Noncurrent deferred tax liability
|
(26,364 | ) | (24,118 | ) | ||||
|
Net deferred tax liabilities
|
$ | (31,025 | ) | $ | (27,290 | ) | ||
The effective tax rates for the years December 31, 2010 and 2009 reflect FutureFuel’s expected tax rate on reported operating earnings before income tax.
FutureFuel’s unrecognized tax benefits, recorded as an element of other noncurrent liabilities, totaled $0 at December 31, 2010 and $559 at December 31, 2009, the total amount of which, if recognized, would reduce FutureFuel’s effective tax rate.
The following table summarizes FutureFuel’s unrecognized tax benefits activity.
|
2010
|
2009
|
|||||||
|
Beginning balance
|
$ | 559 | $ | 559 | ||||
|
Recognition into income, statute of limitations expiration
|
(559 | ) | - | |||||
|
Balance at December 31
|
$ | - | $ | 559 | ||||
FutureFuel does not expect its unrecognized tax benefits to change significantly over the next 12 months.
FutureFuel records interest and penalties net as a component of income tax expense. FutureFuel accrued a balance of $0 and $138 at December 31, 2010 and December 31, 2009, respectively, for interest or tax penalties.
FutureFuel and its subsidiaries file tax returns in the U.S. federal jurisdiction and with various state jurisdictions. FutureFuel is subject to U.S., state, and local examinations by tax authorities from 2007 forward. FutureFuel Chemical is subject to the effects of tax examinations that may impact the carry-over basis of its assets and liabilities.
16) Deferred revenue and contingent liability
FutureFuel has signed contracts with customers to construct plant and other related assets on FutureFuel’s property for the manufacture of custom chemicals. The cost of the construction has been funded by the customers. Additionally, FutureFuel has been awarded grants from governmental agencies related to the construction of production equipment and infrastructural improvements. As these customers and governmental agencies have paid for such projects, FutureFuel has recorded such amounts as deferred revenue. Deferred revenue totaled $18,876 at December 31, 2010, with $1,758 classified as a current liability and $17,118 classified as a noncurrent liability. Deferred revenue totaled $9,348 at December 31, 2009 and was classified as a noncurrent liability.
The following table summarizes FutureFuel’s deferred revenue activity:
|
2010
|
2009
|
|||||||
|
Beginning balance
|
$ | 9,348 | $ | 9,994 | ||||
|
Amortization
|
(1,545 | ) | (1,152 | ) | ||||
|
Additions
|
11,073 | 506 | ||||||
|
Balance at December 31
|
$ | 18,876 | $ | 9,348 | ||||
One of the grants from a governmental agency is contingent upon FutureFuel meeting certain employment goals. If these goals are not reached, FutureFuel may be required to remit a portion of the grant back to the agency. As a result of this provision, FutureFuel has recorded a contingent liability for the monies received under this grant. This balance totaled $2,289 at December 31, 2010. No such balance existed at December 31, 2009.
61
Notes to Consolidated Financial Statements of FutureFuel Corp.
(Dollars in thousands, except per share amounts)
17) Stockholders’ equity
On July 12, 2006, Viceroy and its founding shareholders entered into a registration rights agreement pursuant to which the holders of the majority of founding shares and shares of common stock included in the units purchased in Viceroy’s July 2006 offering by a director or his designees are entitled to make up to two demands that Viceroy register with the SEC their founding shares and the shares included in the units purchased in Viceroy’s July 2006 offering. The holders of the majority of such shares can elect to exercise these registration rights at any time after the date on which Viceroy has become a reporting company under the Securities Exchange Act of 1934 (“Securities Act”), as amended, and such shares have been released from any applicable escrow agreement and lock-in deeds. In addition, those shareholders have certain “piggyback” registration rights on registration statements filed subsequent to the date on which such shares are released from escrow or other lock up arrangements. Viceroy agreed to bear the expenses incurred in connection with the filing of any such registration statements. There are 16,250,000 shares of Viceroy’s common stock subject to this registration rights agreement.
On July 12, 2006, Viceroy entered into an investor rights agreement with each of KBC Peel Hunt Ltd, Viceroy’s Nominated Advisor on the AIM, and CRT Capital Group LLC, Viceroy’s placing agent, for the benefit of the holders of its shares of common stock and warrants in which Viceroy agreed, at its cost, to provide “piggyback” registration rights as to any shares of its common stock that are not, at the time, freely saleable identical to the “piggyback” registration rights of the founding shareholders described above, plus the right to piggyback on any registration statement filed pursuant to the founding shareholders’ demand registration rights described above, provided that in the event such piggyback rights are exercised in an underwritten offering, the number of shares of Viceroy’s common stock registered will be subject to a cutback, pro rata with the founding shareholders, if the underwriter so requires. There are 15,450,000 shares of Viceroy’s common stock subject to this investor rights agreement.
In 2008, 1,182,500 warrants to purchase FutureFuel’s common stock were exercised. Proceeds from the exercise of these warrants totaled $7,095. At December 31, 2008, warrants to purchase 21,317,500 shares of FutureFuel’s common stock were outstanding and unexercised.
None of FutureFuel’s warrants were exercised in 2009. FutureFuel did repurchase and cancel 1,642,300 of its warrants for an aggregate purchase price of $799. At December 31, 2009, warrants to purchase 19,675,200 shares of FutureFuel’s common stock were outstanding and unexercised.
In 2010, 11,783,549 warrants to purchase FutureFuel’s common stock were exercised. Proceeds from the exercise of the warrants totaled $70,701. FutureFuel did repurchase and cancel 5,617,230 of its warrants for an aggregate purchase price of $1,210. On July 12, 2010, the remaining 2,274,421 warrants expired without being exercised. At December 31, 2010, no warrants to purchase FutureFuel’s common stock were outstanding.
18) Earnings per share
The computation of basic and diluted earnings per common share was as follows:
|
2010
|
2009
|
2008
|
||||||||||
|
Net income available to common stockholders
|
$ | 23,094 | $ | 16,992 | $ | 22,675 | ||||||
|
Weighted average number of common shares outstanding
|
36,526,105 | 28,190,300 | 27,029,210 | |||||||||
|
Effect of warrants
|
610,866 | 1,045,203 | 487,180 | |||||||||
|
Effect of stock options
|
51,357 | 18,769 | 34,051 | |||||||||
|
Weighted average diluted number of common shares outstanding
|
37,188,328 | 29,254,272 | 27,550,441 | |||||||||
|
Basic earnings per share
|
$ | 0.63 | $ | 0.60 | $ | 0.84 | ||||||
|
Diluted earnings per share
|
$ | 0.62 | $ | 0.58 | $ | 0.82 | ||||||
62
Notes to Consolidated Financial Statements of FutureFuel Corp.
(Dollars in thousands, except per share amounts)
Certain warrants to purchase shares of FutureFuel’s common stock were not included in the computation of diluted earnings per share for the years ended December 31, 2009 and 2008 as they were anti-dilutive in the period. The weighted average number of warrants excluded on this basis was 10,658,750 and 16,579,375, respectively. Additionally, certain options to purchase shares of FutureFuel’s common stock were not included in the computation of diluted earnings per share for the years ended December 31, 2010, 2009, and 2008 as they were anti-dilutive in the period. The weighted average number of options excluded on this basis was 211,625, 53,750, and 1,250, respectively.
19) Employee benefit plans
Defined contribution savings plan
FutureFuel currently offers its employees a company 401(k) matching savings plan, which covers substantially all employees. Under this plan, FutureFuel matches the amount of eligible employees’ contributions, subject to specified limits, up to 6% of earnings. Company contributions totaled $1,605, $1,663, and $1,763 for the years ended December 31, 2010, 2009, and 2008, respectively.
20) Related party transactions
FutureFuel enters into transactions with companies affiliated with or controlled by a director and significant shareholder. Revenues, expenses, prepaid amounts, and unpaid amounts related to these transactions are captured on our accompanying consolidated financial statements as related party line items. These related party transactions are summarized in the following table and further described below.
Related party balance sheet accounts
|
2010
|
2009
|
|||||||
|
Prepaid expenses
|
||||||||
|
Income tax and consulting services
|
$ | - | $ | 23 | ||||
|
Total prepaid expenses
|
$ | - | $ | 23 | ||||
|
Accounts payable
|
||||||||
|
Distribution and related services
|
$ | - | $ | 82 | ||||
|
Storage and terminalling services
|
- | 2 | ||||||
|
Natural gas purchases
|
468 | 472 | ||||||
|
Total accounts payable
|
$ | 468 | $ | 556 | ||||
|
Accrued liabilities
|
||||||||
|
Travel and administrative services
|
$ | 8 | $ | 67 | ||||
|
Total accrued liabilities
|
$ | 8 | $ | 67 | ||||
63
Notes to Consolidated Financial Statements of FutureFuel Corp.
(Dollars in thousands, except per share amounts)
Related party income statement accounts
|
2010
|
2009
|
2008
|
||||||||||
|
Revenues
|
||||||||||||
|
Biodiesel, petrodiesel and blends
|
$ | 93 | $ | 2,494 | $ | 4,864 | ||||||
|
Total revenues
|
$ | 93 | $ | 2,494 | $ | 4,864 | ||||||
|
Cost of goods sold
|
||||||||||||
|
Biodiesel, petrodiesel and blends
|
$ | - | $ | 2,802 | $ | 2,357 | ||||||
|
Natural gas purchases
|
3,846 | 2,706 | 2,904 | |||||||||
|
Storage and terminalling services
|
105 | 334 | - | |||||||||
|
Income tax and consulting services
|
93 | 91 | 70 | |||||||||
|
Total cost of goods sold
|
$ | 4,044 | $ | 5,933 | $ | 5,331 | ||||||
|
Distribution
|
||||||||||||
|
Distribution and related services
|
$ | 526 | $ | 88 | $ | - | ||||||
|
Total distribution
|
$ | 526 | $ | 88 | $ | - | ||||||
|
Selling, general and administrative expense
|
||||||||||||
|
Commodity trading advisory fees
|
$ | 151 | $ | 132 | $ | 132 | ||||||
|
Travel and administrative services
|
190 | 166 | 55 | |||||||||
|
Total selling, general and administrative expense
|
$ | 341 | $ | 298 | $ | 187 | ||||||
Biodiesel, petrodiesel and blends
FutureFuel enters into agreements to sell biofuels (biodiesel, petrodiesel, or biodiesel/petrodiesel blends) to an affiliate from time to time. Such agreements are priced at the then current market price of biodiesel as determined from bids from other customers and/or market pricing services. Cost of goods sold related to these sales includes variable costs and allocated fixed costs. In addition, cost of goods sold includes allocated hedging gains (losses) for the respective period, as applicable.
Natural gas purchases
FutureFuel utilizes natural gas to generate steam for its manufacturing process and to support certain of its air and waste treatment utilities. This natural gas is purchased through an affiliate provider of natural gas marketing services. Expenses related to these purchases include the cost of the natural gas only; transportation charges are paid to an independent third party.
Income tax and consulting services
An affiliate provides professional services to FutureFuel, primarily in the area of income tax preparation and consulting. FutureFuel also receives certain finance and accounting expertise from this affiliate as requested. Expenses related to these services are comprised of an agreed quarterly fee plus reimbursement of expense, at cost.
Distribution and related services
Distribution and related services are comprised of barge transportation and related unloading charges for petrodiesel that were arranged and paid by an affiliate and subsequently rebilled to FutureFuel.
Storage and terminalling services
FutureFuel leases oil storage capacity from an affiliate under a storage and thruput agreement. This agreement provides for the storage of biodiesel, diesel or biodiesel/petrodiesel blends, methanol, and biodiesel feedstocks in above-ground storage tankage at designated facilities of the affiliate. Expenses related to this agreement include monthly lease charges, generally on a per barrel basis, and associated heating, thruput, and other customary terminalling charges.
64
Notes to Consolidated Financial Statements of FutureFuel Corp.
(Dollars in thousands, except per share amounts)
Commodity trading advisory fees
FutureFuel entered into a commodity trading advisory agreement with an affiliate. Pursuant to the terms of this agreement, the affiliate provides advice to FutureFuel concerning the purchase, sale, exchange, conversion, and/or hedging of commodities as FutureFuel may request from time to time.
Travel and administrative services
FutureFuel reimburses an affiliate for travel and other administrative services incurred on its behalf. Such reimbursement is performed at cost with the affiliate realizing no profit on the transaction.
Railcar sublease agreement
FutureFuel entered into a railcar sublease agreement with an affiliate. Pursuant to the terms of this sublease, FutureFuel leases from the affiliate railcars upon the same terms, conditions, and price the affiliate leases the railcars. Lease terms for individual railcars begin upon delivery of the railcars. Forty railcars were received through December 31, 2009. From the onset of this lease, FutureFuel has been paying lease charges directly to the entity leasing the railcars to the affiliate, as opposed to paying the affiliate itself. Hence, no related party expense is reflected in the above table, although the affiliate has essentially been guaranteeing FutureFuel’s obligations to the lessor. In September 2009, the master lease was modified such that the affiliate was removed and FutureFuel leases the railcars directly, with no guarantee remaining on the part of the affiliate. Expenses related to this lease were $331 for each of the years ended December 31, 2010, 2009, and 2008.
21) Segment information
FutureFuel has determined that is has two reportable segments organized along product lines – chemicals and biofuels. The accounting policies of the segments are the same as those described in the summary of significant accounting policies in Note 2.
Chemicals
FutureFuel’s chemicals segment manufactures diversified chemical products that are sold externally to third party customers. This segment comprises two components: “custom manufacturing” (manufacturing chemicals for specific customers); and “performance chemicals” (multi-customer specialty chemicals).
Biofuels
FutureFuel’s biofuels business segment manufactures and markets biodiesel. Biodiesel revenues are generated through the sale of biodiesel to customers through FutureFuel’s distribution network at the Batesville Plant and through distribution facilities available at a leased oil storage facility near Little Rock, Arkansas at negotiated prices.
Summary of long-lived assets and revenues by geographic area
All of FutureFuel’s long-lived assets are located in the U.S.
Most of FutureFuel’s sales are transacted with title passing at the time of shipment from the Batesville Plant, although some sales are transacted based on title passing at the delivery point. While many of FutureFuel’s chemicals are utilized to manufacture products that are shipped, further processed, and/or consumed throughout the world, the chemical products, with limited exceptions, generally leave the United States only after ownership has transferred from FutureFuel to the customer. Rarely is FutureFuel the exporter of record, never is FutureFuel the importer of record into foreign countries, and FutureFuel is not always aware of the exact quantities of its products that are moved into foreign markets by its customers. FutureFuel does track the addresses of its customers for invoicing purposes and uses this address to determine whether a particular sale is within or without the United States. FutureFuel’s revenues for the year ended December 31, 2010, 2009, and 2008 attributable to the United States and foreign countries (based upon the billing addresses of its customers) were as follows.
65
Notes to Consolidated Financial Statements of FutureFuel Corp.
(Dollars in thousands, except per share amounts)
|
Fiscal Year
|
United States
|
All Foreign Countries
|
Total
|
|||||||||
|
December 31, 2010
|
$ | 201,496 | $ | 17,687 | $ | 219,183 | ||||||
|
December 31, 2009
|
$ | 179,505 | $ | 17,206 | $ | 196,711 | ||||||
|
December 31, 2008
|
$ | 164,963 | $ | 33,367 | $ | 198,330 | ||||||
For the years ended December 31, 2010, 2009, and 2008, revenues from Mexico accounted for 7%, 8%, and 11%, respectively, of total revenues. During 2008, FutureFuel Chemical Company sold significant quantities of biodiesel to companies from Canada, during which time revenues from Canada became a material component of total revenues. Revenues from Canada accounted for 0%, 0%, and 5% of total revenues for the years ended December 31, 2010, 2009, and 2008, respectively. Other than Mexico and Canada, revenues from a single foreign country during 2010, 2009, or 2008 did not exceed 1% of total revenues.
Summary of business by segment
|
2010
|
2009
|
2008
|
||||||||||
|
Revenues
|
||||||||||||
|
Chemicals
|
$ | 178,280 | $ | 143,759 | $ | 155,553 | ||||||
|
Biofuels
|
40,903 | 52,952 | 42,777 | |||||||||
|
Revenues
|
$ | 219,183 | $ | 196,711 | $ | 198,330 | ||||||
|
Segment gross margins
|
||||||||||||
|
Chemicals
|
$ | 41,433 | $ | 33,007 | $ | 32,738 | ||||||
|
Biofuels
|
(149 | ) | 1,430 | 7,679 | ||||||||
|
Segment gross margins
|
41,284 | 34,437 | 40,417 | |||||||||
|
Corporate expenses
|
9,129 | (9,598 | ) | (8,236 | ) | |||||||
|
Income before interest and taxes
|
32,155 | 24,839 | 32,181 | |||||||||
|
Interest income
|
1,135 | 403 | 2,965 | |||||||||
|
Interest and other income (expense)
|
888 | 204 | (150 | ) | ||||||||
|
Provision for income taxes
|
(11,084 | ) | (8,454 | ) | (12,321 | ) | ||||||
|
Net income
|
$ | 23,094 | $ | 16,992 | $ | 22,675 | ||||||
Depreciation is allocated to segment costs of goods sold based on plant usage. The total assets and capital expenditures of FutureFuel have not been allocated to individual segments as large portions of these assets are shared to varying degrees by each segment, causing such an allocation to be of little value.
Gross margins for the biodiesel segment for the years ended December 31, 2009 and 2008 were favorably impacted by the receipt of $2,000 from the State of Arkansas in each year resulting from our biodiesel operating cost grant application under the Arkansas Alternative Fuels Development Program. The $0.20 per gallon Arkansas producer credit is capped at 10 million gallons of production, or $2 million, per defined time intervals. The first interval was January 1, 2007 through June 30, 2008. FutureFuel submitted an application for the $0.20 per gallon biodiesel producer credit for production during this 18-month interval and received the $2 million credit in March 2008. The next funding interval was July 1, 2008 to June 30, 2009. FutureFuel applied for funding under this program for biodiesel produced during this interval and received the $2 million credit in July 2009. No funding was available for this program in 2010, nor does FutureFuel expect funding to be available in 2011. Based on the characteristics of the Arkansas Alternative Fuels Development Program and the State funding behind this program, FutureFuel recognizes income in the period funding is received.
22) Fair value measurements
Fair value is defined as the exit price, or the amount that would be received to sell an asset or paid to transfer a liability in an orderly transaction between market participants as of the measurement date. Fair value accounting pronouncements also include a hierarchy for inputs used in measuring fair value that maximizes the use of observable inputs and minimizes the use of unobservable inputs by requiring that the most observable inputs be used when available. Observable inputs are inputs market participants would
66
Notes to Consolidated Financial Statements of FutureFuel Corp.
(Dollars in thousands, except per share amounts)
use in valuing the asset or liability developed based on market data obtained from sources independent of FutureFuel. Unobservable inputs are inputs that reflect FutureFuel’s assumptions about the factors market participants would use in valuing the asset or liability developed based upon the best information available in the circumstances. The hierarchy is broken down into three levels. Level 1 inputs are quoted prices (unadjusted) in active markets for identical assets or liabilities. Level 2 inputs include quoted prices for similar assets or liabilities in active markets, quoted prices for identical or similar assets or liabilities in markets that are not active, and inputs (other than quoted prices) that are observable for the asset or liability, either directly or indirectly. Level 3 inputs are unobservable inputs for the asset or liability. Categorization within the valuation hierarchy is based upon the lowest level of input that is significant to the fair value measurement.
FutureFuel’s short position on marketable debt securities has been classified within level 2 as the valuation inputs are indirectly observable for the liability.
The following table provides information by level for assets and liabilities that are measured at fair value, on a recurring basis.
|
Asset/(Liability)
|
||||||||||||||||
|
Fair Value at December 31,
|
Fair Value Measurements Using
Inputs Considered as
|
|||||||||||||||
|
Description
|
2010
|
Level 1
|
Level 2
|
Level 3
|
||||||||||||
|
Derivative instruments
|
$ | (1,649 | ) | $ | (1,649 | ) | $ | - | $ | - | ||||||
|
Preferred stock, trust preferred securities, and other equity instruments
|
$ | 28,200 | $ | 28,200 | $ | - | $ | - | ||||||||
|
Short position on marketable debt securities
|
$ | (19,295 | ) | $ | - | $ | (19,295 | ) | $ | - | ||||||
|
Asset/(Liability)
|
||||||||||||||||
|
Fair Value at December 31,
|
Fair Value Measurements Using
Inputs Considered as
|
|||||||||||||||
|
Description
|
2009
|
Level 1
|
Level 2
|
Level 3
|
||||||||||||
|
Available for sale:
|
||||||||||||||||
|
Auction rate securities
|
$ | 2,800 | - | $ | 2,800 | - | ||||||||||
|
Derivative instruments
|
$ | (1,930 | ) | $ | (1,930 | ) | - | - | ||||||||
|
Preferred stock and trust preferred securities
|
$ | 4,011 | $ | 4,011 | - | - | ||||||||||
23) Commitments
Lease agreements
FutureFuel has entered into lease agreements for oil storage capacity, railcars, isotainers, gas cylinders, argon tanks, and office machines. Minimum rental commitments under existing noncancellable operating leases as of December 31, 2010 were as follows:
|
2011
|
$ | 759 | ||
|
2012
|
336 | |||
|
2013
|
315 | |||
|
2014
|
271 | |||
|
2015
|
239 | |||
|
Thereafter
|
418 | |||
|
Total
|
$ | 2,338 |
67
Notes to Consolidated Financial Statements of FutureFuel Corp.
(Dollars in thousands, except per share amounts)
Lease expenses totaled $934, $1,446, and $885 for the years ended December 31, 2010, 2009, and 2008, respectively.
Purchase obligations
FutureFuel has entered into contracts for the purchase of goods and services including contracts for the expansion of FutureFuel’s specialty chemicals segment and related infrastructure.
Deferred payments to Eastman Chemical
In connection with the purchase of shares of Eastman SE, FutureFuel agreed to pay Eastman Chemical $0.02 per gallon of biodiesel sold by FutureFuel during the three-year period commencing on October 31, 2006 and ending on October 31, 2009. Payments to Eastman Chemical in 2010, 2009, and 2008 for this agreement totaled $0, $312, and $250, respectively.
24) Quarterly financial information (unaudited)
|
Quarter
|
||||||||||||||||
|
1st
|
2nd
|
3rd
|
4th
|
|||||||||||||
|
2010
|
||||||||||||||||
|
Revenues
|
$ | 47,763 | $ | 51,714 | $ | 66,093 | $ | 53,613 | ||||||||
|
Gross profit
|
$ | 7,941 | $ | 6,302 | $ | 11,876 | $ | 15,165 | ||||||||
|
Net income
|
$ | 3,659 | $ | 2,763 | $ | 6,551 | $ | 10,121 | ||||||||
|
Net income per common share:
|
||||||||||||||||
|
Basic
|
$ | 0.13 | $ | 0.08 | $ | 0.16 | $ | 0.25 | ||||||||
|
Diluted
|
$ | 0.12 | $ | 0.07 | $ | 0.16 | $ | 0.25 | ||||||||
|
2009
|
||||||||||||||||
|
Revenues
|
$ | 39,737 | $ | 41,831 | $ | 52,263 | $ | 62,880 | ||||||||
|
Gross profit
|
$ | 6,355 | $ | 5,873 | $ | 13,650 | $ | 8,559 | ||||||||
|
Net income
|
$ | 2,821 | $ | 2,850 | $ | 7,384 | $ | 3,937 | ||||||||
|
Net income per common share:
|
||||||||||||||||
|
Basic
|
$ | 0.10 | $ | 0.10 | $ | 0.26 | $ | 0.14 | ||||||||
|
Diluted
|
$ | 0.10 | $ | 0.10 | $ | 0.25 | $ | 0.13 | ||||||||
Earnings per share is computed independently for each of the quarters presented. Therefore, the sum of the quarterly amounts will not necessarily equal the total for the year.
25) Recently issued accounting standards
In October 2009, the FASB issued ASU 2009−13, “Revenue Recognition (Topic 605): Multiple−Deliverable Revenue Arrangements – a consensus of the FASB Emerging Issues Task Force,” which amends the criteria for when to evaluate individual delivered items in a multiple deliverable arrangement and how to allocate consideration received. This ASU is effective for fiscal years beginning on or after June 15, 2010. The adoption of the guidance on January 1, 2011 is not expected to have a material impact on FutureFuel’s consolidated financial statements.
68
Notes to Consolidated Financial Statements of FutureFuel Corp.
(Dollars in thousands, except per share amounts)
26) Reserve roll forwards - valuation and qualifying accounts
|
Additions
|
||||||||||||||||||||
|
Balance at January 1, 2010
|
Charged to Cost and Expense
|
Charged to Other Accounts
|
Deductions
|
Balance at December 31, 2010
|
||||||||||||||||
|
Reserve for:
|
||||||||||||||||||||
|
Doubtful accounts and returns
|
$ | - | $ | 10 | $ | - | $ | - | $ | 10 | ||||||||||
|
LIFO inventory
|
5,926 | 2,012 | - | - | 7,938 | |||||||||||||||
|
Aged and obsolete inventory
|
257 | 22 | - | - | 279 | |||||||||||||||
|
Deferred tax valuation allowance
|
714 | - | - | 437 | 277 | |||||||||||||||
|
Aged and obsolete supplies and parts
|
710 | 9 | - | - | 719 | |||||||||||||||
| $ | 7,607 | $ | 2,053 | $ | - | $ | 437 | $ | 9,223 | |||||||||||
|
Additions
|
||||||||||||||||||||
|
Balance at January 1, 2009
|
Charged to Cost and Expense
|
Charged to Other Accounts
|
Deductions
|
Balance at December 31, 2009
|
||||||||||||||||
|
Reserve for:
|
||||||||||||||||||||
|
Doubtful accounts and returns
|
$ | 4 | $ | 1 | $ | - | $ | 5 | $ | - | ||||||||||
|
LIFO inventory
|
4,682 | 1,244 | - | - | 5,926 | |||||||||||||||
|
Aged and obsolete inventory
|
253 | 4 | - | - | 257 | |||||||||||||||
|
Deferred tax valuation allowance
|
737 | - | - | 23 | 714 | |||||||||||||||
|
Aged and obsolete supplies and parts
|
666 | 44 | - | - | 710 | |||||||||||||||
| $ | 6,342 | $ | 1,293 | $ | - | $ | 28 | $ | 7,607 | |||||||||||
| Additions | ||||||||||||||||||||
|
Balance at January 1, 2008
|
Charged to Cost and Expense
|
Charged to Other Accounts
|
Deductions
|
Balance at December 31, 2008
|
||||||||||||||||
|
Reserve for:
|
||||||||||||||||||||
|
Doubtful accounts and returns
|
$ | 42 | $ | 4 | $ | - | $ | 42 | $ | 4 | ||||||||||
|
LIFO inventory
|
1,562 | 3,120 | - | - | 4,682 | |||||||||||||||
|
Aged and obsolete inventory
|
124 | 129 | - | - | 253 | |||||||||||||||
|
Deferred tax valuation allowance
|
472 | 265 | - | - | 737 | |||||||||||||||
|
Aged and obsolete supplies and parts
|
436 | 230 | 666 | |||||||||||||||||
| $ | 2,636 | $ | 3,748 | $ | - | $ | 42 | $ | 6,342 | |||||||||||
69
Supplementary Financial Information.
The following is selected quarterly financial data for each full quarter within our two most recent fiscal years.
|
Quarter
|
||||||||||||||||
|
1st
|
2nd
|
3rd
|
4th
|
|||||||||||||
|
2010
|
||||||||||||||||
|
Revenues
|
$ | 47,763 | $ | 51,714 | $ | 66,093 | $ | 53,613 | ||||||||
|
Gross profit
|
$ | 7,941 | $ | 6,302 | $ | 11,876 | $ | 15,165 | ||||||||
|
Net income
|
$ | 3,659 | $ | 2,763 | $ | 6,551 | $ | 10,121 | ||||||||
|
Net income per common share:
|
||||||||||||||||
|
Basic
|
$ | 0.13 | $ | 0.08 | $ | 0.16 | $ | 0.25 | ||||||||
|
Diluted
|
$ | 0.12 | $ | 0.07 | $ | 0.16 | $ | 0.25 | ||||||||
|
2009
|
||||||||||||||||
|
Revenues
|
$ | 39,737 | $ | 41,831 | $ | 52,263 | $ | 62,880 | ||||||||
|
Gross profit
|
$ | 6,355 | $ | 5,873 | $ | 13,650 | $ | 8,559 | ||||||||
|
Net income
|
$ | 2,821 | $ | 2,850 | $ | 7,384 | $ | 3,937 | ||||||||
|
Net income per common share:
|
||||||||||||||||
|
Basic
|
$ | 0.10 | $ | 0.10 | $ | 0.26 | $ | 0.14 | ||||||||
|
Diluted
|
$ | 0.10 | $ | 0.10 | $ | 0.25 | $ | 0.13 | ||||||||
Earnings per share is computed independently for each of the quarters presented. Therefore, the sum of the quarterly amounts will not necessarily equal the total for the year.
RubinBrown LLP was engaged as the principal accountant to audit our financial statements for 2008, 2009, and 2010, and no other independent accountant was so engaged. There were no disagreements with RubinBrown LLP on any matter of accounting principles or practices, financial statement disclosure, or auditing scope or procedure.
Evaluation of Disclosure Controls and Procedures
Under the supervision and with the participation of our chief executive officer and our principal financial officer and other senior management personnel, we evaluated the effectiveness of the design and operation of our disclosure controls and procedures (as defined in Rules 13a-15(e) and 15(d)-15(e) under the Exchange Act) as of the end of the period covered by this report. Based on that evaluation, our chief executive officer and our principal financial officer have concluded that these disclosure controls and procedures as of December 31, 2010 were effective to ensure that information required to be disclosed in the reports that we file or submit under the Exchange Act is recorded, processed, summarized, and reported within the time periods specified in the SEC’s rules and forms.
Management’s Annual Report on Internal Control Over Financial Reporting
Our management is responsible for establishing and maintaining adequate internal control over financial reporting. Our internal control over financial reporting is a process designed to provide reasonable assurance regarding the reliability of financial reporting and the preparation of financial statements for external purposes in accordance with generally accepted accounting principles.
Because of its inherent limitations, internal control over financial reporting may not prevent or detect misstatements. Also, projections of any evaluation of effectiveness to future periods are subject to the risk that controls may become inadequate because of changes in conditions, or that the degree of compliance with the policies or procedures may deteriorate.
Management assessed the effectiveness of our internal control over financial reporting as of December 31, 2010. In making this assessment, management used the criteria set forth by the Committee of Sponsoring Organizations of
70
the Treadway Commission (COSO) in Internal Control-Integrated Framework. Based on this assessment, management has concluded that, as of December 31, 2010, our internal control over financial reporting is effective based on those criteria.
The effectiveness of our internal control over financial reporting as of December 31, 2010 has been audited by our auditor, RubinBrown LLP, an independent registered public accounting firm, which expressed an unqualified opinion as stated in their report, a copy of which is included below.
Report of Independent Registered Public Accounting Firm
To the Board of Directors and Stockholders
FutureFuel Corp.:
We have audited the internal control over financial reporting of FutureFuel Corp. and subsidiaries (the Company) as of December 31, 2010, based on criteria established in Internal Control-Integrated Framework issued by the Committee of Sponsoring Organizations of the Treadway Commission (COSO). The Company’s management is responsible for maintaining effective internal control over financial reporting and for its assessment of the effectiveness of internal control over financial reporting included in the accompanying Management’s Annual Report on Internal Control Over Financial Reporting. Our responsibility is to express an opinion on the Company’s internal control over financial reporting based on our audit.
We conducted our audit in accordance with the standards of the Public Company Accounting Oversight Board (United States). Those standards require that we plan and perform the audit to obtain reasonable assurance about whether effective internal control over financial reporting was maintained in all material respects. Our audit of internal control over financial reporting included obtaining an understanding of internal control over financial reporting, assessing the risk that a material weakness exists, and testing and evaluating the design and operating effectiveness of internal control based on the assessed risk. Our audit also included performing such other procedures as we considered necessary in the circumstances. We believe that our audit provides a reasonable basis for our opinion.
A company’s internal control over financial reporting is a process designed by, or under the supervision of, the company’s principal executive and principal financial officers, or persons performing similar functions, and effected by the company’s board of directors, management, and other personnel to provide reasonable assurance regarding the reliability of financial reporting and the preparation of financial statements for external purposes in accordance with generally accepted accounting principles. A company’s internal control over financial reporting includes those policies and procedures that (1) pertain to the maintenance of records that, in reasonable details, accurately and fairly reflect the transactions and dispositions of the assets of the company; (2) provide reasonable assurance that transactions are recorded as necessary to permit preparation of financial statements in accordance with generally accepted accounting principles, and that receipts and expenditures of the company are being made only in accordance with authorizations of management and directors of the company; and (3) provide reasonable assurance regarding prevention or timely detection of unauthorized acquisition, use, or disposition of the company’s assets that could have a material effect on the financial statements.
Because of the inherent limitations of internal control over financial reporting, including the possibility of collusion or improper management override of controls, material misstatements due to error or fraud may not be prevented or detected on a timely basis. Also projections of any evaluation of the effectiveness of the internal control over financial reporting to future periods are subject to the risk that the controls may become inadequate because of changes in conditions, or that the degree of compliance with the policies or procedures may deteriorate.
In our opinion, the Company maintained, in all material respects, effective internal control over financial reporting as of December 31, 2010, based on criteria established in Internal Control-Integrated Framework issued by the Committee of Sponsoring Organizations of the Treadway Commission (COSO).
71
We have also audited, in accordance with the standards of the Public Company Accounting Oversight Board (United States), the balance sheets and related statements of operations, comprehensive income, changes in stockholders’ equity, and cash flows of the Company, and our report dated March 16, 2011 expressed an unqualified opinion on those financial statements.
/s/ RubinBrown LLP
St. Louis, Missouri
March 16, 2011
Changes in Internal Control Over Financial Reporting
We did not make any changes in our internal control over financial reporting as a result of our evaluation that occurred during the fiscal quarter ended December 31, 2010.
Item 9B. Other Information.
We did not fail to disclose any information required to be disclosed in a report on Form 8-K during the fourth quarter of 2010.
72
Identification of Directors
Our directors are as follows.
|
Name
|
Age
|
Director
Since
|
Term
Expires
|
|||
|
Paul A. Novelly, executive chairman of the board
|
67
|
2005
|
2012
|
|||
|
Lee E. Mikles, chief executive officer and president
|
55
|
2005
|
2011
|
|||
|
Edwin A. Levy
|
73
|
2005
|
2013
|
|||
|
Thomas R. Evans
|
56
|
2006
|
2011
|
|||
|
Richard L. Knowlton
|
78
|
2007
|
2012
|
|||
|
Paul G. Lorenzini, chief operating officer
|
71
|
2007
|
2012
|
|||
|
Donald C. Bedell
|
69
|
2008
|
2013
|
There is no arrangement or understanding between any of the above directors and any other person pursuant to which such person was or is to be selected as a director.
Identification of Executive Officers
Our executive officers are as follows.
|
Name
|
Position
|
Age
|
Officer
Since
|
|||
|
Paul A. Novelly
|
Executive chairman of the board
|
67
|
2005
|
|||
|
Lee E. Mikles
|
Chief executive officer and president
|
55
|
2005
|
|||
|
Paul G. Lorenzini
|
Chief operating officer
|
71
|
2008
|
|||
|
Douglas D. Hommert
|
Principal financial officer, executive vice president, secretary and treasurer
|
55
|
2005
|
There is no arrangement or understanding between any of the above officers and any other person pursuant to which such person was or is to be selected as an officer.
Identification of Certain Significant Employees
The following individuals are executive officers of FutureFuel Chemical Company who are expected to make significant contributions to our business.
|
Name
|
Position
|
Age
|
Officer
Since
|
|||
|
Samuel Dortch
|
Executive vice president and general manager
|
62
|
2007
|
|||
|
David Baker
|
Senior vice president - operations support
|
64
|
2006
|
|||
|
Gary Hess
|
Senior vice president - commercial operations
|
59
|
2006
|
|||
|
Christopher Schmitt
|
Chief financial officer
|
32
|
2011
|
There is no arrangement or understanding between any of the above officers and any other person pursuant to which such person was or is to be selected as an officer.
Family Relationships
There is no family relationship between any of our executive officers and directors.
73
Business Experience
Paul A. Novelly has been our chairman of the board since inception. For at least the past five years, Mr. Novelly has been chairman and chief executive officer of Apex Oil Company, Inc., a privately-held company based in St. Louis, Missouri engaged in the trading, storage, marketing, and transportation of petroleum products, including liquid terminal facilities in the Midwest and Eastern United States, and towboat and barge operations on the inland waterway system. Mr. Novelly is president and a director of AIC Limited, a Bermuda-based oil trading company, chairman and a director of World Point Holdings Inc., a Delaware company based in Missouri which owns and operates petroleum storage facilities in the United States, and chief executive officer of St. Albans Global Management, Limited Partnership, LLLP, which provides corporate management services. He currently serves on the board of directors at Boss Holdings, Inc., a distributor of work gloves, boots and rainwear, and other consumer products, and Bond Street Holdings, Inc., a holding company whose material subsidiary is Premier American Bank, N.A. Within the past five years, Mr. Novelly also served on the board of directors of Intrawest Corporation, a company in the destination resorts and adventure travel industry, The Bear Stearns Companies, Inc., a broker-dealer and global securities and investment firm, and World Point Terminals Inc., a Canadian and Toronto Stock Exchange predecessor to World Point Holdings Inc.
Lee E. Mikles has been our chief executive officer and a member of our board since inception. In addition, he served as our principal financial officer before our acquisition of FutureFuel Chemical Company and thereafter through January 31, 2008. Mr. Mikles was chairman of Mikles/Miller Management, Inc., a registered investment adviser and home to the Kodiak family of funds, between 1992 and 2005. He was also chairman of Mikles/Miller Securities, LLC, a registered broker-dealer, between 1999 and 2005. Additionally, Mr. Mikles has served on the board of directors of Pacific Capital Bankcorp., Official Payments Corporation, Coastcast Corporation, Nelnet, Inc., Imperial Bank and Imperial Bancorp. He currently serves on the board of directors of Boss Holdings, Inc. and is the chair of the audit committee for Boss Holdings, Inc.
Paul G. Lorenzini has been a member of our board since January 2007 and our chief operating officer since April 21, 2008. In January 1970, Mr. Lorenzini co-founded Packaging Consultants, Inc., a distribution business supplying packaging materials to the food industry. In 1983, Bunzl PLC, a supplier of supermarket and food service packaging, acquired Packaging Consultants, Inc. Mr. Lorenzini continued to work for Bunzl PLC and in 1986 became president of Bunzl USA. He subsequently became the chief executive officer of Bunzl USA and retired in July 2004 with the title of chairman emeritus. Mr. Lorenzini served as a director of Bunzl PLC between 1988 and 1991 and between 1999 and 2004.
Douglas D. Hommert has been our executive vice president, secretary, and treasurer since inception. He was a member of our board from inception through January 14, 2008. He became our principal financial officer on February 1, 2008. Mr. Hommert has been executive vice president and general counsel of Apex Oil Company, Inc. since September 2002. Between October 1988 and September 2002, he was a partner in the St. Louis law firm of Lewis, Rice & Fingersh, L.C. With that firm, he practiced in the areas of business law, taxation, mergers and acquisitions, financing, and partnerships. He was licensed as a Certified Public Accountant in 1982.
Edwin A. Levy has been a member of our board since November 2005. In 1979, Mr. Levy co-founded Levy, Harkins & Co., Inc., an investment advisory firm, where he now serves as chairman of the board and individual advisor. Mr. Levy was a director of Traffix, Inc. between November 1995 and 2006, and served as a member of its audit committee and stock options committee. He is a director of World Point Holdings Inc., a Delaware company based in Missouri which owns and operates petroleum storage facilities in the United States. In the past five years Mr. Levy was a director of Forward Industries, Inc., a publicly-held company in the business of designing, manufacturing and distributing custom carrying case solutions, and World Point Terminals Inc., a Canadian and Toronto Stock Exchange predecessor to World Point Holdings Inc.
Thomas R. Evans has been a member of our board since May 2006. Since June 2004, he has served as president and chief executive officer of Bankrate, Inc., an Internet based aggregator of financial rate information. Mr. Evans was elected to Bankrate, Inc.’s board of directors in May 2004. From 1999 to 2002, Mr. Evans was chairman and chief executive officer of Official Payments Corporation, an Internet processor of payment to government entities.
Richard L. Knowlton has been a member of our board since January 2007. Between 1956 and 1995, Mr. Knowlton worked for Hormel Foods Corporation, a multinational manufacturer and marketer of consumer-branded meat and
74
food products. He started as a merchandising manager and became the president and chief operating officer in 1979. He became the chief executive officer and chairman of the board in 1981. Mr. Knowlton was elected chairman of The Hormel Foundation in 1995, which votes 47.7% of the stock of Hormel Foods Corporation. Mr. Knowlton is chairman emeritus of the Horatio Alger Association, a member of the Business Advisory Council for the University of Colorado Leeds School of Business, a business advisor to Mayo Clinic, and a member of the Eisenhower Medical Center Board. Mr. Knowlton served as a director of ING America Insurance Holdings, Inc. between 2000 and 2005.
Donald C. Bedell has been a member of our board since March 17, 2008. Mr. Bedell is chairman of the board of privately held Castle Partners and its affiliates, based in Sikeston, Missouri, which operate over 35 skilled nursing, health care, pharmaceutical, hospice, and therapy facilities throughout Missouri and other states. Mr. Bedell is a director of First Community Bank of Batesville, Arkansas and is a member of the executive committee of such bank and its holding company. He is also a director of World Point Holdings Inc., serving as chairman of World Point’s Corporate Governance and Human Resources Committees. FutureFuel Corp.’s chairman, Paul A. Novelly, is the chairman of the board of World Point Holdings Inc. In the past five years, Mr. Bedell has served on the board of directors of World Point Terminals Inc., a Canadian and Toronto Stock Exchange predecessor to World Point Holdings Inc.
Samuel Dortch was the vice president - operations services of FutureFuel Chemical Company between July 30, 2007 and October 14, 2007 and senior vice president - operations between October 15, 2007 and August 30, 2010. On August 30, 2010, Mr. Dortch became FutureFuel Chemical Company’s executive vice president and general manager. In 1972, Mr. Dortch joined Eastman Chemical Company’s technical services division in Kingsport, Tennessee as a development chemical engineer. He has served in numerous management positions in Kingsport, Batesville and at Eastman Kodak’s Kirby, England facility. In 2004, Mr. Dortch became manager of research and development at the Batesville plant and director of research and development in December 2006.
David Baker was the vice president - manufacturing operations of FutureFuel Chemical Company between October 31, 2006 and October 14, 2007 and has been senior vice president - operations support since October 15, 2007. In 1967, he joined Eastman Chemical Company’s filter products division in Kingsport, Tennessee as a development engineer. In 2001, Mr. Baker was named managing director of Eastman Chemical Company’s Peboc division, relocating to the United Kingdom. The Peboc division manufactures specialty chemicals including active pharmaceutical ingredients. In August 2005, Mr. Baker relocated to Kingsport as a business development manager in performance chemicals exclusive manufacturing. Mr. Baker is a registered professional engineer and past president of the East Tennessee Society of Professional Engineers.
Gary Hess was the vice president - commercial operations of FutureFuel Chemical Company between October 31, 2006 and October 14, 2007, senior vice president - sales and marketing between October 15, 2007 and March 12, 2008 and senior vice president - commercial operations since March 13, 2008. Mr. Hess was the vice president for commercial operations for Bayer Corporation, where he had responsibility for sales, marketing, customer service, purchasing, research and development and quality control, prior to joining Eastman Chemical Company in December 2002 as the market development executive for agrochemicals. During his tenure with Bayer Corporation, Mr. Hess resided two years in Germany where he directed the market development efforts in pharmaceutical intermediates and photographic chemicals. In 2004, he was appointed to the position of global business leader for exclusive manufacturing with responsibility for sales, marketing and business development. Mr. Hess graduated from Rose-Hulman Institute of Technology with a bachelor of science in chemistry and has a masters in business administration from Northwestern University.
Christopher Schmitt has been the interim chief financial officer of FutureFuel Chemical Company since February 3, 2011. Mr. Schmitt was a middle distillates operator for A.I.C. Limited from September 2009 to February 2011. A.I.C. Limited is an affiliate of the Company’s chairman, Paul A. Novelly. In this position, Mr. Schmitt assisted with the management and logistics of middle distillate product movements in Northwest Europe. From 2003 to September 2009, Mr. Schmitt served as vice president of Pinnacle Consulting, Inc., an accounting and financial consulting firm based in St. Louis, Missouri. Pinnacle Consulting, Inc. performs services for the Company’s chairman and affiliates of the Company’s chairman. Prior to that, Mr. Schmitt served as an auditor for the accounting firms Arthur Andersen & Co. and KPMG LLP. Mr. Schmitt is a licensed certified public accountant and a CFA charter holder.
75
Involvement in Legal Proceedings
None of our directors or executive officers were involved within the past ten years in any matter described in Item 401(f) of Regulation S-K.
Compliance with Section 16(a) of the Exchange Act
Based solely upon a review of Forms 3 and Forms 4 and amendments thereto furnished to us under the rules of the SEC promulgated under Section 16 of the Exchange Act during the fiscal year ended December 31, 2010, and Forms 5 and amendments thereto furnished to us with respect to the fiscal year ended December 31, 2010, as well as any written representation from a reporting person that no Form 5 is required, we are aware that the following members of our board of directors and/or beneficial owners of more than 10% of our common stock failed to file on a timely basis, as disclosed in the aforementioned forms, reports required by Section 16 of the Exchange Act during the year ended December 31, 2010:
|
|
·
|
Osmium Special Situations Fund Ltd. (now known as Revelation Capital Management Ltd.) failed to timely file ten reports covering fourteen transactions.
|
|
|
·
|
Mr. Bedell failed to timely file one report covering one transaction.
|
|
|
·
|
Mr. Lorenzini failed to timely file one report covering one transaction.
|
Code of Business Conduct and Ethics
We adopted a revised code of business conduct and ethics that applies to all of our employees and the employees of our subsidiaries, including our principal executive officer, principal financial officer, principal accounting officer or controller, or persons performing similar functions. A copy of this revised code of business conduct and ethics has been posted on our Internet website and may be accessed at http://ir.futurefuelcorporation.com/governance.cfm. We will provide any person, without charge, a copy of such code of business conduct and ethics upon request to FutureFuel Corp., 8235 Forsyth Blvd., 4th Floor, Clayton, Missouri 63105, attention: Investor Relations.
Nominating Committee
Our board established a nominating/corporate governance committee and adopted a revised charter for such committee. A copy of this revised nominating/corporate governance committee charter is posted on our Internet website and may be accessed at http://ir.futurefuelcorporation.com/governance.cfm. The nominating/corporate governance committee charter contains procedures for Company shareholders to submit recommendations for nomination to our board. There have not been any changes to those procedures since the original nominating committee charter was attached as an exhibit to our Form 10 Registration Statement filed with the SEC on April 24, 2007.
Audit Committee
We have a separately-designated standing audit committee established in accordance with Section 3(a)(58)(A) of the Exchange Act, and have adopted a revised audit committee charter. A copy of this revised audit committee charter has been posted on our Internet website and may be accessed at http://ir.futurefuelcorporation.com/governance.cfm. The current members of the audit committee are as follows:
Thomas R. Evans
Edwin A. Levy
Donald C. Bedell
Audit Committee Expert
Our board of directors determined that each member of our audit committee is an audit committee financial expert. Each such member of our audit committee is independent, as independence for audit committee members is defined in the listing standards applicable to us.
76
General
Our board of directors has established a compensation committee. The compensation committee’s responsibilities include, among other things, determining our policy on remuneration to our (that is, FutureFuel Corp.’s) officers and directors and the executive officers and directors of FutureFuel Chemical Company. We paid each of our directors $25,000 for 2010. We determined for 2010 not to pay salaries, bonuses, or other forms of cash compensation to any of our executive officers (in their capacities as such) (other than our chief operating officer Paul Lorenzini and certain executive officers of FutureFuel Chemical Company as described below). The compensation committee also did not approve the awarding of stock options or stock awards to any of our directors and executive officers in 2010. No compensation for our directors or executive officers (other than certain executive officers of FutureFuel Chemical Company) has been set at this time for the calendar year 2011. Rather, our board believes it is more appropriate to set such compensation later in the year when 2011 results are capable of reasonable estimation.
In 2010, we paid salaries, bonuses, and other forms of compensation to our chief operating officer and to the officers of FutureFuel Chemical Company as described below. For purposes of the following discussion of executive compensation, the term “executive officers” includes executive officers of both FutureFuel Corp. and FutureFuel Chemical Company. Only Paul A. Novelly, Lee E. Mikles, Paul G. Lorenzini, and Douglas D. Hommert have been elected officers of FutureFuel Corp. by our board of directors.
Compensation Discussion and Analysis
The elements of our compensation program include base salary, bonuses, and certain retirement, insurance, and other benefits generally available to all employees. In addition, our board adopted an Omnibus Incentive Plan (the “Incentive Plan”) which was approved by our shareholders at our 2007 annual meeting on June 26, 2007. The Incentive Plan provides equity-based compensation to our executive officers and our directors.
Cash Salaries and Bonuses
We determined not to pay cash salaries or bonuses to Messrs. Novelly, Mikles, or Hommert for 2010. Our executive chairman, Mr. Novelly, receives compensation from our affiliate, St. Albans Global Management, Limited Partnership, LLLP. Our chief executive officer, Mr. Mikles, receives compensation from existing business enterprises and investments, none of which are affiliated with us. Our executive vice president, secretary and treasurer, Mr. Hommert, receives compensation from our affiliate, Apex Oil Company, Inc. None of Messrs. Novelly, Mikles, or Hommert received any increase in their salary, bonus, or other income to compensate them for their services to us. We decided to pay a bonus of $100,000 to our chief operating officer, Paul Lorenzini, in December 2010, which we believe was fair compensation for the services rendered. In addition, we reimbursed affiliates of Mr. Novelly and Mr. Mikles $100,000 each for expenses incurred by such affiliates in Mr. Novelly and Mr. Mikles performing services for us. As to our other executive officers, we continued their base salaries paid for 2009 with a modest percentage increase for 2010, which approximated a cost-of-living increase.
For the year 2010, we established a bonus pool for the employees of our subsidiary, FutureFuel Chemical Company. The total bonus target amount was determined at 10% of the estimated (as of the end of November 2010) after-tax earnings of FutureFuel Chemical Company for the year ended December 31, 2010, subject to certain adjustments. We believe the 10% amount was reasonable and provides an incentive for such employees to continue implementing the business plan that we have installed at FutureFuel Chemical Company. Eligible FutureFuel Chemical Company employees hired after January 1, 2010 received $250. Eligible employees hired prior to January 1, 2010 received 100 hours of pay at their normal hourly rate. Salaried employees of FutureFuel Chemical Company received an additional bonus amount ranging from $0 to $40,000, with the larger bonuses going to FutureFuel Chemical Company’s executive officers as determined by FutureFuel Chemical Company’s board of directors. The bonuses were paid in cash on December 17, 2010.
We expect to establish an annual cash bonus program for fiscal years commencing after 2010 in an amount equal to 10% of after-tax earnings of FutureFuel Chemical Company, subject to certain adjustments, but solely on a discretionary basis. In determining actual bonus payouts for such years, we expect that the compensation committee will consider performance against performance goals to be established by us, as well as individual performance
77
goals. We expect that this annual cash bonus program will apply to certain key employees of FutureFuel Chemical Company in addition to the executives whose compensation is described herein. The actual amount of bonuses, if any, will be determined near the end of our fiscal year.
Omnibus Incentive Plan
Our board of directors adopted the Incentive Plan, which was approved by our shareholders at our 2007 annual shareholder meeting on June 26, 2007. The purpose of the Incentive Plan is to:
|
|
·
|
encourage ownership in us by key personnel whose long-term employment with or engagement by us or our subsidiaries (including FutureFuel Chemical Company) is considered essential to our continued progress and, thereby, encourage recipients to act in our shareholders’ interests and share in our success;
|
|
|
·
|
encourage such persons to remain in our employ or in the employ of our subsidiaries; and
|
|
|
·
|
provide incentives to persons who are not our employees to promote our success.
|
The Incentive Plan authorizes us to issue stock options (including incentive stock options and nonqualified stock options), stock awards, and stock appreciation rights. To date, options for 690,500 shares of stock and awards of 39,800 shares of stock have been made. We did not issue any stock options, stock awards, or stock appreciation rights in 2010. We will consider issuing additional stock options, stock awards, and/or stock appreciation rights pursuant to the criteria set forth below. However, no determinations have been made for 2011.
Eligible participants in the Incentive Plan include: (i) members of our board of directors and our executive officers; (ii) regular, active employees of us or of any of our subsidiaries; and (iii) persons engaged by us or by any of our subsidiaries to render services to us or our subsidiaries as an advisor or consultant.
Awards under the Incentive Plan are limited to shares of our common stock, which may be shares reacquired by us, including shares purchased in the open market, or authorized but un-issued shares. Awards will be limited to 10% of the issued and outstanding shares of our common stock in the aggregate, or 2,670,000 shares as of the date of adoption of the Incentive Plan. Taking into account the prior grants of stock options and stock awards, there are 1,939,700 shares remaining to be issued under the Incentive Plan.
The Incentive Plan is administered by our board’s compensation committee (the “Administrator”). The Administrator may appoint agents to assist it in administering the Incentive Plan. The Administrator may delegate to one or more individuals the day-to-day administration of the Incentive Plan and any of the functions assigned to the Administrator in the Incentive Plan. Such delegation may be revoked at any time. All decisions, determinations, and interpretations by the Administrator regarding the Incentive Plan and the terms and conditions of any award granted thereunder will be final and binding on all participants.
The Administrator may grant a stock option or provide for the grant of a stock option either from time to time in the discretion of the Administrator or automatically upon the occurrence of events specified by the Administrator, including the achievement of performance goals or the satisfaction of an event or condition within the control of the participant or within the control of others. Each option agreement must contain provisions regarding: (i) the number of shares of common stock that may be issued upon exercise of the option; (ii) the type of option; (iii) the exercise price of the shares and the means of payment for the shares; (iv) the term of the option; (v) such terms and conditions on the vesting or exercisability of the option as may be determined from time to time by the Administrator; (vi) restrictions on the transfer of the option and forfeiture provisions; and (vii) such further terms and conditions not inconsistent with the plan as may be determined from time to time by the Administrator. Unless otherwise specifically determined by the Administrator or otherwise set forth in the Incentive Plan, the vesting of an option will occur only while the participant is employed or rendering services to us or one of our subsidiaries, and all vesting will cease upon a participant’s termination of employment for any reason.
The Administrator may grant annual performance vested options. Performance will be tied to annual cash flow targets (our consolidated income plus depreciation plus amortization) in amounts to be determined. Annual
78
performance vested options will vest 25% for each year that the annual cash flow target is achieved (with provisions for subsequent year catch-ups).
The Administrator may grant cumulative performance vested options. Performance will be tied to cumulative cash flow in amounts to be determined for periods to be determined.
The Administrator may issue other options based upon the following performance criteria either individually, alternatively, or in any combination, applied to either us as a whole or to a business unit, subsidiary, or business segment, either individually, alternatively, or in any combination, and measured either annually or cumulatively over a period of years, on an absolute basis or relative to a pre-established target, to previous years’ results or to a designated comparison group, in each case as specified by the Administrator: (i) cash flow; (ii) earnings (including gross margin, earnings before interest and taxes, earnings before taxes, and net earnings); (iii) earnings per share; (iv) growth in earnings or earnings per share; (v) stock price; (vi) return on equity or average shareholders’ equity; (vii) total shareholder return; (viii) return on capital; (ix) return on assets or net assets; (x) return on investment; (xi) revenue; (xii) income or net income; (xiii) operating income or net operating income; (xiv) operating profit or net operating profit; (xv) operating margin; (xvi) return on operating revenue; (xvii) market share; (xviii) overhead or other expense reduction; (xix) growth in shareholder value relative to the moving average of the S&P 500 Index or a peer group index; (xx) strategic plan development and implementation; and (xxi) any other similar criteria.
Such options will vest and expire (including on a pro rata basis) on such terms as may be determined by the Administrator from time to time consistent with the terms of the Incentive Plan.
The Administrator may award our common stock to participants. The grant, issuance, retention, or vesting of each stock award may be subject to such performance criteria and level of achievement versus these criteria as the Administrator determines, which criteria may be based on financial performance, personal performance evaluations, or completion of service by the participant. Unless otherwise provided for by the Administrator, upon the participant’s termination of employment other than due to death or retirement, the unvested portions of the stock award and the shares of our common stock subject thereto will generally be forfeited. Unless otherwise provided for by the Administrator, if a participant’s termination of employment is due to death or retirement, all outstanding stock awards will continue to vest provided certain conditions to be determined are met. Unless otherwise provided for by the Administrator, if a participant’s termination of employment is due to his death, a portion of each outstanding stock award granted to such participant will immediately vest and all forfeiture provisions and repurchase rights will lapse as to a prorated number of shares of common stock determined by dividing the number of whole months since the grant date by the number of whole months between the grant date and the date that the stock award would have fully vested.
The Administrator may grant stock appreciation rights either alone or in conjunction with other awards. The Administrator will determine the number of shares of common stock to be subject to each award of stock appreciation rights. The award of stock appreciation rights will not be exercisable for at least six months after the date of grant except as the Administrator may otherwise determine in the event of death, disability, retirement, or voluntary termination of employment of the participant. Except as otherwise provided by the Administrator, the award of stock appreciation rights will not be exercisable unless the person exercising the award of stock appreciation rights has been at all times during the period beginning with the date of the grant thereof and ending on the date of such exercise, employed by or otherwise performing services for us or one of our subsidiaries.
In the event there is a change in control of the Company, as determined by our board, our board may, in its discretion: (i) provide for the assumption or substitution of, or adjustment to, each outstanding award; (ii) accelerate the vesting of awards and terminate any restrictions on cash awards or stock awards; and (iii) provide for the cancellation of awards for a cash payment to the participant.
Retirement Benefits
We adopted a 401(k) plan for FutureFuel Chemical Company which is generally available to all of its employees.
79
Founder’s Grant
Certain of our executive officers were granted founders shares as described herein. Please refer to the discussion under “Item 12. - Security Ownership of Certain Beneficial Owners and Management and Related Stockholder Matters - Founding Shares Owned by the Founding Shareholders” below.
Our executive officers who are not officers of FutureFuel Corp. participate in employee welfare plans (life insurance, medical insurance, disability insurance, vacation pay, and the like) maintained by FutureFuel Chemical Company for all of its employees. We do not provide life insurance or other employee benefits for our executive officers who have been elected to officer positions with both FutureFuel Corp. and FutureFuel Chemical Company.
The Compensation Committee
Our compensation committee currently consists of Donald C. Bedell, Richard L. Knowlton, and Edwin A. Levy. Each of these individuals is an “independent director” under the rules of the NYSE, a “Non-Employee Director” within the meaning of Section 16 of the Exchange Act, and an “outside director” within the meaning of §162(m) of the Internal Revenue Code of 1986, as amended.
Recommendations from Management
Our chairman and chief executive officer make recommendations to the compensation committee as to salaries and bonuses for executive officers, as well as awards under the Incentive Plan. The compensation committee takes these recommendations into consideration in approving all such salaries, bonuses, and awards.
80
Summary Compensation Table
Our executive officers were paid the following compensation for the three-year period ended December 31, 2010.
Summary Compensation Table
|
Person
|
Year
|
Salary
|
Bonus
|
Stock
Awards(d)
|
Option Awards(e)
|
All Other
Compensa-tion(b)
|
Total
|
|||||||||||||||||||||
|
Paul A. Novelly(c)
Executive chairman
FutureFuel Corp.
|
2010
2009
2008
|
$
$
$
|
0
0
0
|
$
$
$
|
0
0
0
|
$
$
$
|
0
0
0
|
$
$
$
|
0
171,050
341,450
|
$
$
$
|
25,000
25,000
25,000
|
$
$
$
|
25,000
196,050
366,450
|
|||||||||||||||
|
Lee E. Mikles(c)
Chief executive officer
FutureFuel Corp.
|
2010
2009
2008
|
$
$
$
|
0
0
0
|
$
$
$
|
0
0
0
|
$
$ $
|
0
0
0
|
$
$
$
|
0
171,050 12,797
|
$
$
$
|
25,000
25,000
25,000
|
$
$
$
|
25,000
196,050
37,797
|
|||||||||||||||
|
Paul G. Lorenzini(c)
Chief operating officer
FutureFuel Corp.
|
2010
2009
2008
|
$
$
$
|
0
0
0
|
$
$
$
|
100,000
0
100,000
|
$
$
$
|
0
0
0
|
$
$
$
|
0
171,050 127,967
|
$
$
$
|
25,000
25,000
25,000
|
$
$
$
|
125,000
196,050
152,967
|
|||||||||||||||
|
Douglas D. Hommert(c)
Executive vice president, secretary and treasurer, FutureFuel Corp.
|
2010
2009
2008
|
$
$
$
|
0
0
0
|
$
$
$
|
0
0
0
|
$
$
$
|
0
0
0
|
$
$
$
|
0
0
0 |
$
$
$
|
0
0
0
|
$
$
$
|
0
0
0
|
|||||||||||||||
|
Samuel Dortch(a)
Executive vice president and general manager, FutureFuel Chemical Company
|
2010
2009
2008
|
$
$
$
|
178,593
69,998
176,298
|
$
$
$
|
48,995
46,865
74,692
|
$
$
$
|
0
0
0
|
$
$
$
|
0
33,000
14,584
|
$
$
$
|
15,882
14,955
20,381
|
$
$
$
|
243,470
264,818
286,480
|
|||||||||||||||
|
David Baker(a)
Senior vice president - operations support, FutureFuel Chemical Company
|
2010
2009
2008
|
$
$
$
|
174,902
169,998
170,957
|
$
$
$
|
48,418
46,865
75,173
|
$
$
$
|
0
0
525
|
$
$
$
|
0
33,000
14,584
|
$
$
$
|
15,590
14,045
14,266
|
$
$
$
|
238,910
263,908
275,505
|
|||||||||||||||
|
Gary Hess(a)
Senior vice president - commercial operations, FutureFuel Chemical Company
|
2010
2009
2008
|
$
$
$
|
174,902
169,999
170,623
|
$
$
$
|
48,418
46,865
75,173
|
$
$
$
|
0
0
525
|
$
$
$
|
0
33,000
14,584
|
$
$
$
|
15,245
15,443
14,633
|
$
$
$
|
238,566
265,307
275,538
|
|||||||||||||||
|
Benjamin Ladd(a)(f)
Former chief financial officer and treasurer, FutureFuel Chemical Company
|
2010
2009
2008
|
$
$
$
|
174,902 169,999
163,943
|
$
$
$
|
0
46,865
74,788
|
$
$
$
|
0
0
525
|
$
$
$
|
0
33,003
14,584
|
$
$
$
|
27,592
10,719
11,586
|
$
$
$
|
202,495
260,586
265,426
|
|||||||||||||||
__________
|
(a)
|
Executive officers of FutureFuel Chemical Company for the years indicated.
|
|
(b)
|
For Messrs. Novelly, Mikles, and Lorenzini, includes $25,000 in directors fees for 2010, 2009, and 2008 as described below. For executive officers of FutureFuel Chemical Company, includes our contributions (including accrued contributions) to vested and unvested defined contribution plans, and the dollar value of any insurance premiums paid by, or on behalf of, us during or for the covered fiscal year with respect to life and disability insurance for the benefit of the named person. 2008 includes $6,003 of moving expenses for Mr. Dortch, exclusive of $14,686 in deductible moving expenses paid directly to movers. 2010 includes $17,824.88 paid to Mr. Ladd to reimburse him for lost vesting in his 401(k) plan account. The above amounts do not include travel expenses reimbursed pursuant to Company policy.
|
|
(c)
|
Our executive officers for the years indicated. We reimbursed an affiliate of Mr. Mikles $100,000 in 2008 and 2010 for expenses incurred by such affiliate in 2008 and 2010 in connection with Mr. Mikles performing services for us and FutureFuel Chemical Company in 2008 and 2010. We reimbursed an affiliate of Mr. Novelly $100,000 in 2008 and 2010 for expenses incurred by such affiliate in 2008 and 2010 in connection with Mr. Novelly performing services for us and FutureFuel Chemical Company in 2008 and 2010.
|
81
|
(d)
|
Calculated at the number of shares awarded multiplied by the average between the high and low trade prices of shares of our common stock on the OTCBB on the date of the award.
|
|
(e)
|
Represents the grant date valuation of the awards under FASB ASC Topic 718. Assumptions used for determining the value of option awards reported here are set forth in Note 14 to our consolidated financial statements included elsewhere herein.
|
|
(f)
|
Mr. Ladd resigned as FutureFuel Chemical Company’s chief financial officer effective September 30, 2010. Martin A. Rector was appointed the interim chief financial officer and was paid a bonus of $26,500 for the year 2010 by FutureFuel Chemical Company.
|
None of the above-named persons is a party to an employment agreement or employment arrangement with us or with FutureFuel Chemical Company.
Grants of Plan-Based Awards
We adopted the Incentive Plan but did not make any awards thereunder until 2008. In April 2008, we granted a total of 55,000 stock options to selected members of our management. An additional 5,000 management options were issued in September 2008. The options awarded in April 2008 had an exercise price equal to the average of the bid and ask price of our common stock on the date of grant as established in private sales, which our board of directors determined to be the fair market value of such stock on that date. The management options awarded in September 2008 had an exercise price equal to the closing price of our common stock on the date of grant as quoted on the OTC Bulletin Board. Originally, one-third of the management options granted in April 2008 vested on each of the annual anniversary dates of the grant. Our compensation committee determined that it was in our best interests if those options were to vest immediately. Accordingly, those management options were amended in September 2008 to provide for immediate vesting. The management options issued in September 2008 vested immediately upon grant. The management options awarded in April 2008 expire on April 7, 2013. The management options awarded in September 2008 expire on September 30, 2013. On December 3, 2008, we awarded an aggregate of 39,800 shares of our common stock to employees of FutureFuel Chemical Company. These shares vested upon grant.
In 2009, we awarded 280,500 stock options to our directors, executive officers, and certain other members of our management. These options vested upon grant, had an exercise price equal to the closing price of our common stock on the date of grant as quoted on the OTC Bulletin Board, and expire on December 21, 2014 if not exercised by that date.
The following tables set forth certain information regarding the awards to our executive officers and certain officers of FutureFuel Chemical Company of options and shares of our common stock under the Incentive Plan.
82
Grants of Plan-Based Awards
|
Estimated Future Payout Under Equity Incentive Plan Awards
|
||||||||||
|
Name
|
Grant
Date
|
Threshold (#)
|
Target
(#)
|
Maximum
(#)
|
All Other Option Awards: Number of Shares of Stock or Units (#)
|
All Other Option
Awards: Number of Securities Underlying Options(#)
|
Exercise
or Base Price of Option Awards ($/Sh)
|
Grant Date Fair Value of Stock and Option Awards
|
||
|
Paul A. Novelly
Executive chairman
FutureFuel Corp.
|
04/07/08
12/10/08
12/21/09
|
100,000
100,000
55,000
|
100,000
100,000
55,000
|
100,000
100,000
55,000
|
0
|
0
|
$4.00
$5.65
$7.00
|
$4.00
$5.65
$7.00
|
||
|
Lee E. Mikles
Chief executive officer
FutureFuel Corp.
|
04/07/08
12/21/09
|
10,000
55,000
|
10,000
55,000
|
10,000
55,000
|
0
|
0
|
$4.00
$7.00
|
$4.00
$7.00
|
||
|
Paul G. Lorenzini
Chief operating officer
FutureFuel Corp.
|
04/07/08
12/21/09
|
100,000
55,000
|
100,000
55,000
|
100,000
55,000
|
0
|
0
|
$4.00
$7.00
|
$4.00
$7.00
|
||
|
Douglas D. Hommert
Executive vice president, secretary and treasurer, and principal financial officer, FutureFuel Corp.
|
n/a
|
n/a
|
n/a
|
n/a
|
0
|
0
|
n/a
|
n/a
|
||
|
Benjamin Ladd(a)
Former chief financial officer and treasurer, FutureFuel Chemical Company
|
04/07/08
12/03/08
12/21/09
|
10,000
100
10,612
|
10,000
100
10,612
|
10,000
100
10,612
|
0
|
0
|
$4.00
n/a
$7.00
|
$4.00
$5.65
$7.00
|
||
|
David Baker
Senior vice president - operations support, FutureFuel Chemical Company
|
04/0708
12/03/08
12/21/09
|
10,000
100
10,611
|
10,000
100
10,611
|
10,000
100
10,611
|
0
|
0
|
$4.00
n/a
$7.00
|
$4.00
$5.65
$7.00
|
||
|
Gary Hess
Senior vice president - sales and marketing, FutureFuel Chemical Company
|
04/07/08
12/03/08
12/21/09
|
10,000
100
10,611
|
10,000
100
10,611
|
10,000
100
10,611
|
0
|
0
|
$4.00
n/a
$7.00
|
$4.00
$5.65
$7.00
|
||
|
Samuel Dortch
Executive vice president and general manager, FutureFuel Chemical Company
|
04/07/08
12/03/08
12/21/09
|
10,000
100
10,611
|
10,000
100
10,611
|
10,000
100
10,611
|
0
|
0
|
$4.00
n/a
$7.00
|
$4.00
$5.65
$7.00
|
||
__________
|
(a)
|
Effective September 30, 2010, Mr. Ladd resigned as the chief financial officer of FutureFuel Chemical. As of that date, 10,612 options had been issued to him but were unexercised. We agreed that Mr. Ladd had until December 31, 2011 in which to exercise those unexercised options. If not exercised by that date, those options will lapse.
|
83
Outstanding Equity Awards at Fiscal Year End
The following table sets forth information concerning unexecuted options, stock that has not vested, and equity incentive plan awards as of December 31, 2010 with respect to our executive officers.
|
Option Awards
|
Stock Awards
|
||||||||
|
Name
|
Number of Securities Underlying Unexercised Options (#) Exercisable
|
Number of Securities Underlying Unexercised Options (3) Unexercisable
|
Equity Incentive Plan Awards: Number of Securities Unexercised Unearned
Options (#)
|
Option
Exercise
Price ($)
|
Option
Expiration
Date
|
Number of
Shares or
Units of Stock
That Have Not Vested
(#)
|
Market Value
of Shares or
Units of Stock
That Have Not Vested
($)
|
Equity
Incentive Plan Awards: Number
of Unearned Shares, Units or Other Rights
That Have Not Vested
(#)
|
Equity Incentive Plan Awards: Market or
Payout Value of Unearned Shares, Units or Other Rights That
Have Not Vested
($)
|
|
Paul A. Novelly
|
55,000
|
0
|
0
|
$7.00
|
12/21/14
|
n/a
|
n/a
|
n/a
|
n/a
|
|
Lee E. Mikles
|
55,000
|
0
|
0
|
$7.00
|
12/21/14
|
n/a
|
n/a
|
n/a
|
n/a
|
|
Paul G. Lorenzini
|
55,000
|
0
|
0
|
$7.00
|
12/21/14
|
n/a
|
n/a
|
n/a
|
n/a
|
|
Douglas D. Hommert
|
n/a
|
n/a
|
n/a
|
n/a
|
n/a
|
n/a
|
n/a
|
n/a
|
n/a
|
|
Benjamin Ladd(a)
|
10,612
|
0
|
0
|
$7.00
|
12/31/11
|
0
|
0
|
0
|
0
|
|
David Baker
|
10,000
10,611
|
0
|
0
|
$4.00
$7.00
|
04/07/13
12/21/14
|
0
|
0
|
0
|
0
|
|
Gary Hess
|
10,611
|
0
|
0
|
$7.00
|
12/21/14
|
0
|
0
|
0
|
0
|
|
Sam Dortch
|
10,000
10,611
|
0
|
0
|
$4.00
$7.00
|
04/07/13
12/21/14
|
0
|
0
|
0
|
0
|
__________
|
(a)
|
Effective September 30, 2010, Mr. Ladd resigned as the chief financial officer of FutureFuel Chemical. As of that date, 10,612 options had been issued to him but were unexercised. We agreed that Mr. Ladd had until December 31, 2011 in which to exercise those unexercised options. If not exercised by that date, those options will lapse.
|
Option Exercises and Stock Vested
None of our executive officers exercised options in 2010 or were the recipient of stock awards which vested in 2010.
Compensation of Directors
Consistent with prior years, we paid each of our directors $25,000 for the year 2010 as we believed this was fair for services provided. However, we did not grant to any of our directors stock options or stock awards.
The following is the compensation our directors earned for 2010.
|
Director
|
Fees
Earned or
Paid in
Cash
|
Stock
Awards
|
Option
Awards
|
Non-Equity Incentive Plan Compensa-
tion
|
Change in Pension
Value and
Non-Qualified Deferred Compensa-
tion Earnings
|
All Other
Compensa-
tion
|
Total
|
|
Paul A. Novelly(b)
|
$ 25,000
|
$ 0
|
$ 0
|
$ 0
|
$ 0
|
$ 0
|
$ 25,000
|
|
Lee E. Mikles(b)
|
$ 25,000
|
$ 0
|
$ 0
|
$ 0
|
$ 0
|
$ 0
|
$ 25,000
|
|
Edwin A. Levy
|
$ 25,000
|
$ 0
|
$ 0
|
$ 0
|
$ 0
|
$ 0
|
$ 25,000
|
|
Thomas R. Evans
|
$ 25,000
|
$ 0
|
$ 0
|
$ 0
|
$ 0
|
$ 0
|
$ 25,000
|
|
Richard L. Knowlton
|
$ 25,000
|
$ 0
|
$ 0
|
$ 0
|
$ 0
|
$ 0
|
$ 25,000
|
|
Paul G. Lorenzini(a)
|
$ 25,000
|
$ 0
|
$ 0
|
$ 0
|
$ 0
|
$ 0
|
$ 25,000
|
|
Donald C. Bedell
|
$ 25,000
|
$ 0
|
$ 0
|
$ 0
|
$ 0
|
$ 0
|
$ 25,000
|
__________
|
(a)
|
Mr. Lorenzini also received compensation as an executive officer, which compensation is included in the discussion above regarding our executive officers.
|
|
(b)
|
Affiliates of Messrs. Novelly and Mikles were reimbursed $100,000 each for expenses incurred by them in Messrs. Novelly and Mikles providing services to us. See the discussion above.
|
84
Compensation Committee Interlocks and Insider Participation
The members of our compensation committee during 2010 were Donald C. Bedell, Richard L. Knowlton, and Edwin A. Levy and the committee was chaired by Mr. Bedell. None of such individuals are or have been an officer or employee of the Company.
Mr. Novelly, our executive chairman of the board, and Mr. Mikles, our chief executive officer and one of our directors, are both directors of Boss Holdings, Inc. Mr. Novelly is a member of Boss Holdings, Inc.’s compensation committee and Mr. Mikles is a member of its audit committee. Mr. Novelly, Mr. Levy (one of our directors and a member of our compensation committee), and Mr. Bedell (one of our directors and a member of our compensation committee) are directors of World Point Holdings Inc., a successor to World Point Terminals Inc.; neither World Point Holdings Inc. nor World Point Terminals Inc. has a separate compensation committee.
Compensation Committee Report
The compensation committee of our board has reviewed and discussed the Compensation Discussion and Analysis set forth above with our management. Based on this review and discussions, the compensation committee recommended to our board of directors that the Compensation Discussion and Analysis be included in this annual report on Form 10-K.
Donald C. Bedell, Richard L. Knowlton, and Edwin A. Levy
Securities Authorized for Issuance Under Equity Compensation Plans
Our board of directors adopted an omnibus incentive plan which was approved by our shareholders at our 2007 annual shareholder meeting on June 26, 2007. We do not have any other equity compensation plan or individual equity compensation arrangement. Under this plan, we are authorized to issue 2,670,000 shares of our common stock. The shares to be issued under the plan were registered with the SEC on a Form S-8 filed on April 29, 2008. Through December 31, 2010, we issued options to purchase 690,500 shares of our common stock and awarded an additional 39,800 shares to participants under the plan. The following additional information regarding this plan is as of December 31, 2010.
|
Plan Category
|
Number of securities
to be issued upon
exercise of
outstanding options,
warrants and rights
|
Weighted-average
exercise price of
outstanding options,
warrants and rights
|
Number of securities
remaining available
for future issuance
under equity
compensation plans
(excluding securities
reflected in column (a))
|
|
(a)
|
(b)
|
(c)
|
|
|
Equity compensation plans approved by security holders
|
417,500
|
$6.40
|
1,939,700
|
Security Ownership of Certain Beneficial Owners
As of the date of this report, 39,983,849 shares of our common stock are issued and outstanding, and we have no other securities issued and outstanding. The shares of common stock are our only voting securities issued and outstanding. The following table sets forth the number and percentage of shares of common stock owned by all persons known by us to be the beneficial owners of more than 5% of our shares of common stock as of March 11, 2011.
85
|
Name and Address of Beneficial Owner
|
Amount of
Beneficial
Ownership
|
Percent of
Common
Stock
|
||||||
|
Paul A. Novelly, 8235 Forsyth Blvd., 4th Floor, Clayton, MO 63105(a)
|
17,560,100 | 43.9 | % | |||||
|
Lee E. Mikles, 1486 E. Valley Road, Santa Barbara, CA 93108(b)
|
2,311,350 | 5.8 | % | |||||
|
SOF Investments, L.P., 645 5th Avenue, 21st Floor, New York, NY 10022(c)
|
3,600,000 | 9.0 | % | |||||
|
Revelation Capital Management Ltd., Canon’s Court, 22 Victoria Street, Hamilton, Bermuda DO HM 11(d)
|
6,248,879 | 15.6 | % | |||||
|
David M. Knott, 485 Underhill Blvd., Suite 205, Syosset, New York 11791-3419(e)
|
2,204,380 | 5.5 | % | |||||
__________
|
(a)
|
Includes 16,835,100 shares of common stock held by St. Albans Global Management, Limited Partnership, LLLP, 625,000 shares of common stock held by Apex Holding Co., and 100,000 shares of common stock held by Mr. Novelly. Mr. Novelly is the chief executive officer of both of these entities and thereby has voting and investment power over such shares, but he disclaims beneficial ownership except to the extent of a minor pecuniary interest.
|
|
(b)
|
Includes 2,042,000 shares of common stock held by the Lee E. Mikles Revocable Trust dated March 26, 1996, 5,000 shares held by Mr. Mikles’ IRA account, and 25,000 shares held by an SEP. Also includes 120,000 shares of common stock held by the Lee E. Mikles Gift Trust dated October 6, 1999, as to which Mr. Mikles is the settlor of the trust, but is not a trustee or a beneficiary. Mr. Mikles disclaims beneficial ownership of the shares owned by the Gift Trust. Also includes 27,500 shares held by the Alison L. Mikles Irrevocable Trust. Miss Mikles is the minor child of Mr. Mikles and lives in Mr. Mikles’ household. However, Mr. Mikles is not the trustee or beneficiary of such trust and disclaims beneficial ownership. Also includes 88,750 shares of common stock held by Lori Mikles, the spouse of Mr. Mikles. Mr. Mikles disclaims beneficial ownership thereof.
|
|
(c)
|
Based solely upon review of a Schedule 13G filed on February 14, 2008, we understand that SOF Investments, L.P. is the record and direct beneficial owner of 1,800,000 shares of common stock listed above, MSD Capital, L.P. is the general partner of SOF Investments, L.P. and may be deemed to indirectly beneficially own securities owned by SOF Investments, L.P., and MSD Capital Management LLC is the general partner of MSD Capital, L.P. Except as set forth in this footnote, we have no knowledge as to the beneficial owners of these entities. In addition, we are aware that, on or around June 7, 2010, SOF Investments, L.P. exercised warrants and acquired an additional 1,800,000 shares of our common stock.
|
|
(d)
|
Formerly known as Osmium Special Situations Fund Ltd. Based solely on Amendment No. 4 to Schedule 13D filed with the SEC on February 7, 2011 and a Form 4 filed thereafter. Mr. Chris Kuchanny, as chairman and chief executive officer of Revelation Capital Management Ltd., may, by virtue of such position, be deemed to have beneficial ownership of such shares and warrants. Mr. Kuchanny disclaims beneficial ownership other than the portion of such shares which relates to his individual economic interest in Revelation Capital Management Ltd. Except as set fort in this footnote, we have no knowledge as to the beneficial owners of Revelation Capital Management Ltd.
|
|
(e)
|
Based solely on Form 3 and Form 4s filed with the SEC. Knott Partners, L.P. beneficially owns 895,900 shares of common stock. Shoshone Partners, L.P. beneficially owns 236,630 shares of common stock. Mulsanne Partners, L.P. beneficially owns 178,400 shares of common stock. Knott Partners Offshore Master Fund, L.P. beneficially owns 824,150 shares of common stock. 69,300 shares of common stock are held in accounts managed by Dorset Management Corporation. David M. Knott is the managing member of Knott Partners Management, LLC, a general partner of Knott Partners, L.P. and the sole director of Dorset Management Corporation. Knott Partners Management, LLC is: (i) the sole general partner of Shoshone Partners, L.P., Knott Partners Offshore Master Fund, L.P. and Mulsanne Partners, L.P.; and (ii) the managing general partner of Knott Partners, L.P. As a result of Mr. Knott’s interests in Knott Partners Management, LLC and in Dorset Management Corporation, Mr. Knott has investment discretion and control of the securities described above. Mr. Knott may be deemed to beneficially own an indirect pecuniary interest in the securities described above as a result of its performance-related fee. Except with respect to Knott Partners, L.P., Knott Partners Offshore Master Fund, L.P. and Shoshone Partners, L.P., in which Mr. Knott owns a beneficial interest, Mr. Knott disclaims beneficial ownership therein except to the extent ultimately realized. Each of Knott Partners, L.P., Knott Partners Offshore Master Fund, L.P., Shoshone Partners, L.P., Mulsanne Partners, L.P. and each of the managed accounts disclaims beneficial ownership of securities reported as owned by any other party. Except as set forth in this footnote, we have no knowledge as to the beneficial owners of these entities. On February 9, 2011, Mr. Knott filed a Form 13G/A wherein he did not disclose the ownership of Mulsanne Partners, L.P.
|
86
Security Ownership of Management
The following table sets forth information regarding the beneficial ownership of our common stock as of the date of this report by each of our directors and executive officers and the executive officers of FutureFuel Chemical Company. Unless otherwise indicated, we believe that all persons named in the table below have sole voting and investment power with respect to all shares of common stock beneficially owned by them and none of such shares have been pledged as security.
|
Name of Beneficial Owner
|
Amount of
Beneficial
Ownership
|
Percent of
Common
Stock
|
||||||
|
Paul A. Novelly(a)
|
17,560,100 | 43.9 | % | |||||
|
Lee E. Mikles(b)
|
2,311,350 | 5.8 | % | |||||
|
Paul G. Lorenzini(c)
|
656,000 | 1.6 | % | |||||
|
Edwin A. Levy(d)
|
272,250 | 0.7 | % | |||||
|
Douglas D. Hommert(e)
|
260,000 | 0.7 | % | |||||
|
Richard L. Knowlton
|
160,000 | 0.4 | % | |||||
|
Thomas R. Evans
|
30,000 | 0.1 | % | |||||
|
Donald C. Bedell(f)
|
22,900 | 0.1 | % | |||||
|
Sam Dortch(g)
|
23,116 | 0.1 | % | |||||
|
David Baker
|
6,650 | 0.0 | % | |||||
|
Gary Hess
|
10,100 | 0.0 | % | |||||
|
Christopher Schmitt
|
500 | 0.0 | % | |||||
|
All directors and executive officers
|
21,312,966 | 53.3 | % | |||||
__________
|
(a)
|
Includes 16,835,100 shares of common stock held by St. Albans Global Management, Limited Partnership, LLLP, 625,000 shares of common stock held by Apex Holding Co., and 100,000 shares of common stock held by Mr. Novelly. Mr. Novelly is the chief executive officer of both of these entities and thereby has voting and investment power over such shares, but he disclaims beneficial ownership except to the extent of a minor pecuniary interest.
|
|
(b)
|
Includes 2,042,000 shares of common stock held by the Lee E. Mikles Revocable Trust dated March 26, 1996, 5,000 shares held by Mr. Mikles’ IRA account, and 25,000 shares held by an SEP. Also includes 120,000 shares of common stock held by the Lee E. Mikles Gift Trust dated October 6, 1999, as to which Mr. Mikles is the settlor of the trust, but is not a trustee or a beneficiary. Mr. Mikles disclaims beneficial ownership of the shares owned by the Gift Trust. Also includes 27,500 shares held by the Alison L. Mikles Irrevocable Trust. Miss Mikles is the minor child of Mr. Mikles and lives in Mr. Mikles’ household. However, Mr. Mikles is not the trustee or beneficiary of such trust and disclaims beneficial ownership. Also includes 88,750 shares of common stock held by Lori Mikles, the spouse of Mr. Mikles. Mr. Mikles disclaims beneficial ownership thereof.
|
|
(c)
|
Includes 55,000 shares of common stock owned by Mr. Lorenzini’s spouse; Mr. Lorenzini disclaims beneficial ownership thereof. Includes 5,000 shares owned by the Lorenzini Friends and Family Gift Trust, a trust established by Mr. Lorenzini and his spouse, as to which Mr. Lorenzini and his spouse are the trustees but not the beneficiaries; Mr. Lorenzini disclaims any beneficial interest in the shares of our common stock held by this trust.
|
|
(d)
|
Does not included 525 shares of our common stock owned by The Edwin A. Levy Charitable Foundation, Inc., a New York not-for-profit corporation as to which Mr. Levy is a founder and director but not a beneficiary. Mr. Levy disclaims beneficial ownership of shares owned by the Foundation.
|
|
(e)
|
Includes 260,000 shares of common stock held by the Douglas D. Hommert Revocable Trust, which is a trust established by Mr. Hommert for the benefit of his descendants, of which Mr. Hommert is the trustee.
|
|
(f)
|
Includes 2,300 shares of common stock owned by the Alexandra Nicole Bedell Trust, a trust established by Mr. Bedell for his granddaughter as to which Mr. Bedell serves as trustee but holds no pecuniary interest; Mr. Bedell disclaims beneficial ownership of all shares of our common stock held by this trust. Includes 2,300 shares of common stock owned by the Ashlyn Tate Bedell Trust, a trust established by Mr. Bedell for his granddaughter as to which Mr. Bedell serves as trustee but holds no pecuniary interest; Mr. Bedell disclaims beneficial ownership of all shares of our common stock held by this trust. Includes 2,300 shares of common stock owned by the Hailey Bedell Trust, a trust established by Mr. Bedell for his granddaughter as to which Mr. Bedell serves as trustee but holds no pecuniary
|
87
|
|
interest; Mr. Bedell disclaims beneficial ownership of all shares of our common stock held by this trust. Also includes 16,000 shares of our common stock held by the Africa Exempt Trust, of which Mr. Bedell is a beneficiary.
|
|
(g)
|
Includes 23,016 shares of common stock held in Mr. Dortch’s 401(k) plan account.
|
Founding Shares Owned by the Founding Shareholders
Prior to our July 2006 offering, there were 5,625,000 shares of our common stock issued as follows (“founding shares”).
|
Founding Shareholder
|
Shares
|
Relationship to the Company
|
||
|
St. Albans Global Management, Limited
Partnership, LLLP
|
2,250,000
|
Shareholder (affiliate of Mr. Novelly)
|
||
|
Lee E. Mikles Revocable Trust
|
2,000,000
|
Shareholder (affiliate of Mr. Mikles)
|
||
|
Douglas D. Hommert Revocable Trust
|
250,000
|
Shareholder (affiliate of Mr. Hommert)
|
||
|
Edwin A. Levy
|
250,000
|
Director and Shareholder
|
||
|
Joe C. Leach
|
250,000
|
Shareholder
|
||
|
Edwin Wahl
|
150,000
|
Shareholder
|
||
|
Jeffery Call
|
150,000
|
Shareholder
|
||
|
Mark R. Miller
|
100,000
|
Shareholder
|
||
|
Lee E. Mikles Gift Trust
|
100,000
|
Shareholder (affiliate of Mr. Mikles)
|
||
|
Ken Fenton
|
75,000
|
Shareholder
|
||
|
RAS1, LLC
|
50,000
|
Shareholder
|
Change in Control
We are not aware of any arrangement the operation of which may at a date subsequent to the date of this report result in a change in control of us.
Transactions with Related Persons
Sales of Products
From time to time, we may sell to Apex Oil Company, Inc. and/or its affiliates biofuels (including biodiesel) produced by us, and Apex Oil Company, Inc. and/or its affiliates may sell to us, or we may sell to them, diesel fuel, gasoline, and other petroleum products in our biofuels business. Such sales will be at then posted prices for comparable products plus or minus applicable geographical differentials. The dollar amounts of such transactions are detailed in Note 20 to our consolidated financial statements included elsewhere herein.
Other related party transactions are detailed in Note 20 to our consolidated financial statements included elsewhere herein.
Review, Approval, or Ratification of Transactions with Related Persons
Any transaction in which we (or one of our subsidiaries) are a participant, the amount involved exceeds the lesser of $120,000 or 1% of our net income, total assets, or total capital, and in which any party related to us has or will have a direct or indirect material interest must be approved by a majority of the disinterested members of our board of directors as fair to us and our shareholders. This policy was adopted by our board on January 8, 2007 and amended on February 2, 2011, and can be found through the “Investor Relations - Corporate Governance” section of our internet website (http://www.FutureFuelCorporation.com). All of the agreements described above in this Item 13 have been approved by a majority of the disinterested members of our board of directors.
In addition, we adopted a Code of Business Conduct and Ethics which sets forth legal and ethical standards of conduct for our directors, officers, and employees and the directors, officers, and employees of our subsidiaries. This Code is designed to deter wrongdoing and to promote: (i) honest and ethical conduct, including the ethical handling of actual or apparent conflicts of interest between personal and professional relationships; (ii) full, fair, accurate, timely, and understandable disclosure in reports and documents that we file with, or submit to, the SEC
88
and in other public communications made by us; (iii) compliance with applicable governmental laws, rules, and regulations; (iv) the prompt internal reporting of violations of this Code to appropriate persons identified in this Code; and (v) accountability for adherence to this Code. This Code was adopted by our board on November 30, 2005 and was amended on February 3, 2011, is in writing, and can be found through the “Investor Relations - Corporate Governance” section of our internet website (http://www.FutureFuelCorporation.com). Each of the transactions described above (under the caption “Transactions with Related Persons”) was undertaken in compliance with our Code of Business Conduct and Ethics and approved by a majority of the disinterested members of our board of directors.
Director Independence
The SEC has promulgated Rule 10A-3, which sets forth the independence requirements for members of an audit committee. The following members of our board of directors are independent under the SEC’s definitions of independence:
Edwin A. Levy
Thomas R. Evans
Richard L. Knowlton
Donald C. Bedell
In addition, each member of our board of directors’ compensation, audit, and nominating/corporate governance committees are comprised of directors who are independent under such definitions.
Audit Fees
During fiscal 2010 and 2009, we incurred $288,000 and $292,000, respectively, for audit and financial statement review services from RubinBrown LLP.
Audit-Related Fees
During fiscal 2010 and 2009, we incurred $14,150 and $13,130, respectively, for employee benefit plan audits from RubinBrown LLP.
Tax Fees
During fiscal 2010 and 2009, we incurred fees of $19,500 and $15,500, respectively, for tax compliance, tax advice, and tax planning services from RubinBrown LLP.
All Other Fees
No other fees were incurred by us from RubinBrown LLP in fiscal 2010 or 2009.
Pre-Approval Policies
Our audit committee approves the engagement of our independent auditors prior to their rendering audit or non-audit services and sets their compensation. Pursuant to SEC regulations, our audit committee approves all fees payable to the independent auditors for all routine and non-routine services provided. Our audit committee considers and approves the budget for the annual audit and financial statement review services prior to the initiation of the work. Non-routine services in the ordinary course of business which are not prohibited under SEC regulation, such as tax planning, tax compliance, and other services generally, are pre-approved on a case-by-case basis.
Percentage of Hours Expended
None of the hours expended on RubinBrown LLP’s engagement to audit our financial statements for 2010 were attributed to work performed by persons who were not RubinBrown LLP’s full-time, permanent employees.
89
This report, and the documents incorporated by reference into this report, contain forward-looking statements. Forward-looking statements deal with our current plans, intentions, beliefs, and expectations, and statements of future economic performance. Statements containing such terms as “believe,” “do not believe,” “plan,” “expect,” “intend,” “estimate,” “anticipate,” and other phrases of similar meaning are considered to contain uncertainty and are forward-looking statements. In addition, from time to time we or our representatives have made or will make forward-looking statements orally or in writing. Furthermore, such forward-looking statements may be included in various filings that we make with the SEC, or in press releases, or in oral statements made by or with the approval of one of our authorized executive officers.
These forward-looking statements are subject to certain known and unknown risks and uncertainties, as well as assumptions that could cause actual results to differ materially from those reflected in these forward-looking statements. Factors that might cause actual results to differ include, but are not limited to, those set forth under the headings “Risk Factors” beginning at page 16 and “Management’s Discussion and Analysis of Financial Condition and Results of Operations” beginning at page 30 and in our future filings made with the SEC. You should not place undue reliance on any forward-looking statements contained in this report which reflect our management’s opinions only as of their respective dates. Except as required by law, we undertake no obligation to revise or publicly release the results of any revisions to forward-looking statements. The risks and uncertainties described in this report and in subsequent filings with the SEC are not the only ones we face. New factors emerge from time to time, and it is not possible for us to predict which will arise. There may be additional risks not presently known to us or that we currently believe are immaterial to our business. In addition, we cannot assess the impact of each factor on our business or the extent to which any factor, or combination of factors, may cause actual results to differ materially from those contained in any forward-looking statements. If any such risks occur, our business, operating results, liquidity, and financial condition could be materially affected in an adverse manner. You should consult any additional disclosures we have made or will make in our reports to the SEC on Forms 10-K, 10-Q, and 8-K, and any amendments thereto. All subsequent written and oral forward-looking statements attributable to us or persons acting on our behalf are expressly qualified in their entirety by the cautionary statements contained in this report.
90
(a) List separately all financial statements filed as part of this report.
|
|
1.
|
FutureFuel Corp.’s audited consolidated Balance Sheets as at December 31, 2010 and 2009 and the related consolidated Statements of Operations, Statements of Changes in Stockholders’ Equity, and Statements of Cash Flows for the years ended December 31, 2010, 2009, and 2008.
|
(b) Exhibits required by Item 601 of Regulation S-K.
|
|
3.1.
|
Fourth Amended and Restated Certificate of Incorporation (incorporated by reference to Exhibit No. 3.3.f to Amendment No. 2 to Form 10 filed February 29, 2008)
|
|
|
3.2.
|
FutureFuel Corp.’s Bylaws (incorporated by reference to Exhibit No. 3.2.a to Form 10 filed April 24, 2007)
|
|
|
4.1.
|
Investor Rights Agreement dated July 12, 2006 among FutureFuel Corp., CRT Capital Group LLC and KBC Peel Hunt Ltd (incorporated by reference to Exhibit No. 4.4 to Form 10 filed April 24, 2007)
|
|
|
4.2.
|
Registration Rights Agreement dated July 12, 2006 among FutureFuel Corp., St. Albans Global Management, Limited Partnership, LLLP, Lee E. Mikles as Trustee of the Lee E. Mikles Gift Trust dated October 6, 1999, Lee E. Mikles as Trustee of the Lee E. Mikles Revocable Trust dated March 26, 1996, Douglas D. Hommert as Trustee of the Douglas D. Hommert Revocable Trust, Edwin A. Levy, Joe C. Leach, Mark R. Miller, RAS LLC, Edwin L. Wahl, Jeffery H. Call and Ken Fenton (incorporated by reference to Exhibit No. 4.5 to Form 10 filed April 24, 2007)
|
|
|
10.1.
|
Registrar Agreement dated June 27, 2008 between FutureFuel Corp. and Computershare Investor Services (Channel Islands) Limited (incorporated by reference to Exhibit No. 10.2 to Form 10-K filed March 16, 2009)
|
|
|
10.2.
|
Storage and Thruput Agreement dated November 1, 2006 between FutureFuel Chemical Company and Center Point Terminal Company (incorporated by reference to Exhibit No. 10. to Form 10 filed April 24, 2007)
|
|
|
10.3.
|
Commodity Trading Advisor Agreement dated November 1, 2006 between FutureFuel Chemical Company and Apex Oil Company, Inc. (incorporated by reference to Exhibit No. 10.5 to Form 10 filed April 24, 2007)
|
|
|
10.4.
|
Service Agreement dated November 1, 2006 between FutureFuel Corp. and Pinnacle Consulting, Inc. (incorporated by reference to Exhibit No. 10.6 to Form 10 filed April 24, 2007)
|
|
|
10.5.
|
Purchase Agreement made and entered into as of April 1, 2008 between The Procter & Gamble Manufacturing Company, The Procter & Gamble Distributing LLC and Procter & Gamble International Operations SA, as buyer, and FutureFuel Chemical Company, as seller (portions of the exhibit have been omitted pursuant to a request for confidential treatment) (incorporated by reference to Exhibit 10.7 to Form 10-Q filed August 14, 2008.)
|
|
|
10.6.
|
Custom Manufacturing Agreement dated September 1, 1992 between Tomen Corporation and Eastman Kodak Company, as amended October 2, 1992, February 1, 1993, March 19, 1993, September 28, 1995, October 30, 1998, May 24, 1999, November 10, 1999, December 12, 2000 and July 25, 2006 (portions of the exhibit have been omitted pursuant to a request for confidential treatment) (incorporated by reference to Exhibit No. 10.8 to Form 10 filed April 24, 2007)
|
91
|
|
10.7.
|
Conversion Agreement dated October 1, 1993 between Tomen Corporation and Eastman Chemical Company, as amended March 7, 1994, May 13, 1994, May 17, 1994, June 14, 1994, July 19, 1994, August 17, 1994, February 10, 1995, May 25, 1995, October 15, 1997, March 27, 1998, June 23, 1998, September 29, 1998, October 30, 1998, November 10, 1999 and July 25, 2006 (portions of the exhibit have been omitted pursuant to a request for confidential treatment) (incorporated by reference to Exhibit No. 10.9 to Form 10 filed April 24, 2007)
|
|
|
10.8.
|
Credit Agreement dated March 14, 2007 between FutureFuel Chemical Company and Regions Bank (portions of the exhibit have been omitted pursuant to a request for confidential treatment) (incorporated by reference to Exhibit No. 10.10 to Form 10 filed April 24, 2007)
|
|
|
10.9.
|
Revolving Credit Promissory Note dated March 14, 2007 executed by FutureFuel Chemical Company and payable to the order of Regions Bank (incorporated by reference to Exhibit No. 10.11 to Form 10 filed April 24, 2007)
|
|
|
10.10.
|
Security Agreement -Accounts and Inventory dated March 14, 2007 executed by FutureFuel Chemical Company in favor of Regions Bank (incorporated by reference to Exhibit No. 10.12 to Form 10 filed April 24, 2007) |
|
|
10.11.
|
Continuing Unlimited Guaranty Agreement dated March 14, 2007 executed by FutureFuel Corp. in favor of Regions Bank (incorporated by reference to Exhibit No. 10.13 to Form 10 filed April 24, 2007) |
|
|
10.12.
|
Second Modification Agreement dated March 14, 2010 between FutureFuel Chemical Company and Regions Bank
|
|
|
10.13.
|
Time Sharing Agreement dated April 18, 2007 between Apex Oil Company, Inc. and FutureFuel Corp. (incorporated by reference to Exhibit No. 10.15 to Form 10 filed April 24, 2007)
|
|
|
10.14.
|
Omnibus Incentive Plan (incorporated by reference to Exhibit No. 10.16 to Amendment No. 1 to Form 10 filed June 26, 2007)
|
|
|
10.15.
|
Assistance Agreement effective June 16, 2010 between FutureFuel Chemical Company and the U.S. Department of Energy/National Energy Technology Laboratory (portions of exhibit omitted pursuant to a request for confidential treatment)
|
|
|
11.
|
Statement re Computation of per Share Earnings
|
|
|
14.
|
Code of Business Conduct and Ethics
|
|
|
21.
|
Subsidiaries of FutureFuel Corp.
|
|
|
23.
|
Consent of RubinBrown LLP
|
31(a). Rule 13a-15(e)/15d-15(e) Certification of chief executive officer
31(b). Rule 13a-15(e)/15d-15(e) Certification of principal financial officer
32. Section 1350 Certification of chief executive officer and principal financial officer
92
SIGNATURES
Pursuant to the requirements of Section 13 or 15(d) of the Securities Exchange Act of 1934, the registrant has duly caused this report to be signed on its behalf by the undersigned, thereunto duly authorized.
FUTUREFUEL CORP.
By: /s/ Douglas D. Hommert
Douglas D. Hommert, Executive Vice President, Secretary,
Treasurer and Principal Financial Officer
/s/ Paul A. Novelly
Paul A. Novelly, Director
/s/ Lee E. Mikles
Lee. E. Mikles, Director and Chief Executive Officer
/s/Edwin A. Levy
Edwin A. Levy, Director
/s/ Thomas R. Evans
Thomas R. Evans, Director
/s/ Richard L. Knowlton
Richard L. Knowlton, Director
/s/ Paul G. Lorenzini
Paul G. Lorenzini, Director and Chief Operating Officer
/s/ Donald C. Bedell
Donald C. Bedell, Director
Date: March 16, 2011
93