Attached files
| file | filename |
|---|---|
| 8-K - 1st United Bancorp, Inc. | i00111_1stunited-8k.htm |
| EX-12.1 - 1st United Bancorp, Inc. | i00111_ex12-1.htm |
| EX-99.1 - 1st United Bancorp, Inc. | i00111_ex99-1.htm |

Follow-On Common Stock Offering
NASDAQ: FUBC
March 2011

Forward-Looking Statements
2
This presentation includes forward-looking statements, including statements about future results. These statements are
subject to uncertainties and risks, including but not limited to
our ability to integrate the business and operations of
companies and banks that we have acquired, and those that we may acquire in the future; the failure to achieve
expected gains, revenue growth, and/or expense savings from future acquisitions; our
need and our ability to incur
additional debt or equity financing; the strength of the United States economy in general and the strength of the local
economies in which we conduct operations; the accuracy of our financial statement estimates and assumptions,
including the estimate of our loan loss provision; the effects of harsh weather conditions, including hurricanes, and
man-made disasters; inflation, interest rate, market, and monetary fluctuations; the effects of our lack of a diversified
loan
portfolio, including the risks of geographic and industry concentrations; the frequency and magnitude of
foreclosure of our loans; legislative and regulatory changes, including the Dodd-Frank Act; our ability to comply with
the extensive laws and regulations
to which we are subject; the willingness of clients to accept third-party products and
services rather than our products and services and vice versa; changes in securities and real estate markets; increased
competition and its effect on pricing; technological
changes; changes in monetary and fiscal policies of the U.S.
Government; the effects of security breaches and computer viruses that may affect our computer systems; changes in
consumer spending and saving habits; growth and profitability of our noninterest
income; changes in accounting
principles, policies, practices or guidelines; anti-takeover provisions under federal and state law as well as our Articles
of Incorporation and our Bylaws; and our ability to manage the risks involved in the foregoing.
These factors, as well as additional factors, can be found in our periodic and other filings with the SEC, which are
available at the SEC’s internet site (http://www.sec.gov). Actual
results may differ materially from projections and
could be affected by a variety of factors, including factors beyond our control. Forward-looking statements in this
presentation speak only as of the date of these materials, and we assume
no obligation to update forward-looking
statements or the reasons why actual results could differ.

Rule 433 Legend
3
This presentation is for informational purposes only and does not constitute an offer to sell securities. The Company
has filed a preliminary prospectus supplement and a registration statement
(including a base prospectus) with the
Securities and Exchange Commission (“SEC”) for the offering to which this communication relates. Before you invest,
you should read the preliminary prospectus supplement and the base prospectus, and other
documents the Company
has filed with the SEC for more complete information about the Company and this offering. You may get these
documents for free by visiting EDGAR on the SEC website at www.sec.gov. Alternatively, copies of the preliminary
prospectus
supplement and the base prospectus may also be obtained from the Company or any underwriter
participating in the offering if you request it by calling (866) 699-6332.

Offering Terms
4
Issuer:
1st United Bancorp, Inc.
Trading Symbol:
FUBC (NASDAQ Global Market)
Security Offered:
Common Stock
Offering Size:
Approximately 5 million shares
Over-Allotment Option:
15%
Use of Proceeds:
Funding of our future growth strategy
Book-Running Manager:
Stifel Nicolaus Weisel
Co-Manager:
Raymond James

5
Investment Merits
Largest healthy publicly held community banking franchise in
Southeast Florida
Strong and conservative balance sheet
41% of loan portfolio covered by FDIC loss share protection
Exceptional core deposit base (26% non-interest bearing)
Low cost of deposits (0.86% in 4Q 2010)
Good organic and strategic in-market growth opportunities
Experienced with FDIC-assisted transactions and open bank
acquisitions
Proven Florida management team with extensive experience and
track record of creating shareholder value

Business Overview
6
15th
largest Florida headquartered financial institution by assets
$1.27 billion in assets
$1.06 billion in deposits
26% non-interest bearing deposits
Serving South Florida banking markets since 2003
15 hub banking centers in Florida
12 hub offices in the attractive Miami-Fort Lauderdale-Pompano Beach-Homestead MSA
Business Banking Focus with Strong Asset Quality
A focus on the commercial banking segment
NPAs/Assets of 2.21% versus Florida peer average of 6.26% (excluding TDRs) (1)
Construction and development loans comprise only 3.9% of total loans
Robust capital position:
(1)
Florida peers consist of Florida-chartered commercial banks with assets between $500 million and $2 billion.
(2)
See appendix for non-GAAP reconciliation of tangible common equity / tangible assets.
Regulatory Capital Ratios
2010
2009
Tier 1 Ratio
21.62%
23.23%
Risk Based Capital Ratio
23.71
25.45
Leverage Ratio
11.78
12.54
Tang Common Equity/ Tang Assets
(2)
10.31
12.69

Branch Footprint
7
1st United Branches
Headquarters & Main Office
One North Federal Highway
Boca Raton, FL 33432
MSA: Miami-Fort Lauderdale-Pompano Beach-Homestead, FL
Address
City
Zip
1
One N Federal Hwy
Boca Raton
33432
2
5854 S Flamingo Rd
Cooper City
33330
3
2855 N University Dr
Coral Springs
33065
4
8484 NW 36th St
Doral
33166
5
633 S Federal Hwy
Fort Lauderdale
33301
6
2800 E Oakland Park Blvd
Fort Lauderdale
33306
7
1001 Brickell Bay Dr
Miami
33131
8
3400 Coral Way
Miami
33145
9
15801 Biscayne Blvd
North Miami Beach
33160
10
741 US Hwy 1
North Palm Beach
33408
11
335 S County Rd
Palm Beach
33480
12
307 Evernia St
West Palm Beach
33401
MSA: Palm Bay-Melbourne-Titusville, FL
Address
City
Zip
13
1020 Buttonwood St
Barefoot Bay
32976
MSA: Sebastian-Vero Beach, FL
Address
City
Zip
14
1020 US Hwy 1
Sebastian
32958
15
1717 Indian River Blvd
Vero Beach
32960

Attractive Market Demographics
8
Operates 15 banking offices in Florida, 12 of which are in the demographically
attractive Miami-Fort Lauderdale-Pompano Beach-Homestead MSA
Core markets are expected to exhibit strong growth in the coming years
Source: SNL Financial, the Office of Economic and Demographic Research of the Florida Legislature and the US Census Bureau
* Figures are weighted by deposits in each county shown, except total population which is the summation of each county.
County
Total
Population
2010
Population
Change 2000 -
2010 (%)
Projected
Change 2010 -
2015 (%)
Median HH
Income 2010
HH Income
Change 2000 -
2010 (%)
Projected HH
Income
Change 2010 -
2015 (%)
Miami-Dade, FL
2,463,726
9.34
2.34
46,323
$
28.69
14.67
Palm Beach, FL
1,294,546
14.44
1.88
58,922
30.76
14.44
Broward, FL
1,754,788
8.12
(0.36)
54,548
30.21
14.00
Indian River, FL
143,385
26.95
9.74
50,479
27.37
11.32
Brevard, FL
558,359
17.25
3.34
51,144
27.53
12.08
Weighted Average Franchise *
6,214,804
11.41
2.26
50,658
$
29.28
14.32
Florida
18,917,612
18.37
4.25
49,910
$
28.49
12.27
National
311,212,863
10.59
3.85
54,442
$
29.12
12.39

Evolution of the Company
9
Current Management
team raised $10 million
in capital and formed
1st
United in order to buy
Advantage Bankshares,
a troubled institution
with approximately $49
million in assets and a
branch in North Palm
Beach.
Acquired First Western
Bank with $31 million in
assets and one branch
located in Cooper City
(western Broward
County). Served
as a
strategic entry point into
Broward County with an
enviable deposit mix
comprised of 50% DDA.
Announced the merger
with Equitable Financial
Group, which had
approximately $180
million in assets and 5
branches in Broward
and Miami-Dade
Counties. Filled
out
base franchise in
Broward and provided
an entry point into
Miami-Dade.
Acquired the banking
center network (6
branches, 3 retained),
substantially all the
deposits ($88 million),
and much of the loan
portfolio ($38 million)
of Citrus Bank,
N.A. in
a P&A transaction.
Sold $6.6 million of
preferred stock in a
private offering. Also
raised $10.4 million
through a Rights
Offering of common
stock.
On March 13, 2009,
issued and sold $10
million of preferred
stock to Treasury as part
of the TARP program.
Raised $21 million of
common equity in
February.
Assets and deposits at
year end of $246.6
million and $186.0
million, respectively.
Raised $26.6 million
of common equity in
January. Assets and
deposits at year end of
$332.2 million and
$240.2 million,
respectively.
On 12/11/09, acquired
Republic Federal
Bank, N.A. through a
FDIC-assisted
transaction ($297
million in assets, $350
million in deposits).
On 12/17/10,
acquired The Bank
of Miami, N.A.
through a FDIC-
assisted transaction
($378 million in
assets, $255
million in
deposits).
Raised $80.5
million through an
initial public
offering of
common stock.
2003
2004
2005
2006
2007
2008
2009
2010

Experienced Management Team
10
Rudy E. Schupp
Chief Executive Officer
37 Years Experience
CEO Since July 2003
President and CEO of 1st
United Bank
Warren S. Orlando
Chairman
37 Years Experience
Chairman Since July
2003
John Marino
President
27 Years Experience
President Since July 2003
COO and CFO of 1st
United Bank
Chief Lending Officer
23Years Experience
EVP/Chief Lending
Officer since 2007; prior
served as SVP, Team
Leader Business Banking
Wade A. Jacobson

Experienced Acquirer and Integrator
11
Transaction History
Source: Company filings.
At Acquisition
Acquisition
Date
($ Millions)
Acquired Bank
Headquarters
Type
Announced
Integrated
Assets
Deposits
First Western Bank
Cooper City, FL
Whole Bank
4/04
7/04
$35.7
$26.7
Equitable Bank
Fort Lauderdale, FL
Whole Bank
2/08
5/08
222.2
136.0
Citrus Bank, N.A.
Vero Beach, FL
Divestiture
8/08
8/08
92.5
87.5
Republic Federal Bank, N.A.
Miami, FL
FDIC
12/09
5/10
296.7
350.0
The Bank of Miami, N.A.
Miami, FL
FDIC
12/10
4/11
378.3
254.5

12
Growth Through FDIC-Assisted Transactions
On December 11, 2009, Republic
Federal Bank, National Association,
Miami, Florida, was closed by the OCC,
which appointed the FDIC as receiver.
1st United’s winning bid was comprised
of an
asset discount of ($37.7mm). All
of the deposits of Republic Federal
Bank, N.A. were assumed at a premium
of 1.2%.
The FDIC will reimburse FUBC for
80% of charge-offs up to $36
million and 95% thereafter on loans
and other real estate acquired.
Transaction Overview
Key Transaction Metrics
Republic Federal Bank, NA Transaction
At Announcement
($000’s)
Net earning loans acquired
184,729
Net investments acquired
33,637
Net deposits acquired
349,647
Excess of assets acquired over liabilities assumed
(137,465)
Cash received from the FDIC
158,000
Total Gain Recorded
20,535

13
Growth Through FDIC-Assisted Transactions
The Bank of Miami Transaction
On December 17, 2010, The Bank of
Miami, National Association, Coral
Gables, Florida, was closed by the OCC,
which appointed the FDIC as receiver.
1st United’s winning bid was comprised
of an
asset discount of ($38mm) and a
0% deposit premium.
The FDIC will reimburse FUBC for
80% of charge-offs on loans and
other real estate acquired.
Transaction Overview
Key Transaction Metrics
At Announcement
($000’s)
Net earning loans acquired
203,185
Net investments acquired
29,060
Net deposits acquired
254,538
Excess of assets acquired over liabilities assumed
50,841
Cash paid to FDIC
39,800
Total gain recorded
11,041
Total branches
None - All
closed effective
4/30/11
Conversion/Integration
4/30/2011

1st United Ranks 15th Among Florida Headquartered Institutions
14
Source: SNL Financial. Top tier regulatory data as of 12/31/10.
* Excludes TDRs.
Florida-Based Institutions Ranked by Assets ($000)
Rank
Institution
Assets
($000)
NPAs/
Assets (%)*
1
EverBank
$12,008,751
2.84%
2
BankUnited
10,884,701
2.13
3
BankAtlantic
4,469,172
7.87
4
Ocean Bankshares, Inc.
3,648,590
11.98
5
Capital City Bank Group, Inc.
2,602,464
4.75
6
Bond Street Holdings, Inc.
2,460,843
1.10
7
CenterState Banks, Inc.
2,063,319
4.19
8
Seacoast Banking Corporation of Florida
2,016,381
4.73
9
USAmeriBancorp Inc.
1,869,422
2.40
10
Lydian Private Bank
1,764,703
4.98
11
U.S. Century Bank
1,681,051
12.88
12
Gibraltar Private Bank & Trust Co.
1,649,657
3.90
13
Great Florida Bank
1,556,082
11.18
14
CNLBancshares, Inc.
1,452,910
5.75
15
1st United Bancorp, Inc.
1,267,751
2.21
16
Villages Bancorporation, Inc.
1,225,465
3.17
17
BAC Florida Bank
1,121,363
3.26
18
Crews Banking Corporation
1,112,684
3.31
19
Florida Capital Group, Inc.
979,768
9.24
20
Tampa Banking Company
971,896
4.17

15
(1) 1st United branch count includes three The Bank of Miami branches that the Company has announced will be closed.
Source: SNL Financial. Deposit data as of 6/30/10.
Significant Market Share Opportunity
Miami-Fort Lauderdale-Pompano Beach-Homestead, FL
Rank
Institution
Branches
Deposits
($000)
Market
Share
1
Wells Fargo & Co. (CA)
211
$27,355,250
17.44%
2
Bank of America Corp. (NC)
205
23,077,582
14.71
3
SunTrust Banks Inc. (GA)
104
11,244,059
7.17
4
Citigroup Inc. (NY)
51
10,099,406
6.44
5
JPMorgan Chase & Co. (NY)
131
7,633,564
4.87
6
BankUnited Inc. (FL)
56
5,713,880
3.64
7
Regions Financial Corp. (AL)
81
4,795,124
3.06
8
HSBC
17
4,468,988
2.85
9
Mercantil Servicios
16
4,156,338
2.65
10
BB&T Corp. (NC)
64
3,904,899
2.49
24
1st United Bancorp Inc. (FL)
(1)
15
1,176,984
0.75
Total For Institutions In Market
1,619
$156,882,263
Florida
Rank
Institution
Branches
Deposits
($000)
Market
Share
1
Bank of America Corp. (NC)
650
$74,790,144
18.56%
2
Wells Fargo & Co. (CA)
677
66,147,778
16.41
3
SunTrust Banks Inc. (GA)
553
41,542,894
10.31
4
Regions Financial Corp. (AL)
399
19,153,073
4.75
5
BB&T Corp. (NC)
273
14,690,037
3.65
6
JPMorgan Chase & Co. (NY)
254
10,488,619
2.60
7
Citigroup Inc. (NY)
52
10,108,589
2.51
8
EverBank Financial (FL)
15
9,040,029
2.24
9
Fifth Third Bancorp (OH)
166
8,080,779
2.01
10
Toronto-Dominion Bank
163
7,602,035
1.89
39
1st United Bancorp Inc. (FL)
(1)
18
1,264,448
0.31
Total For Institutions In Market
5,630
$403,009,539
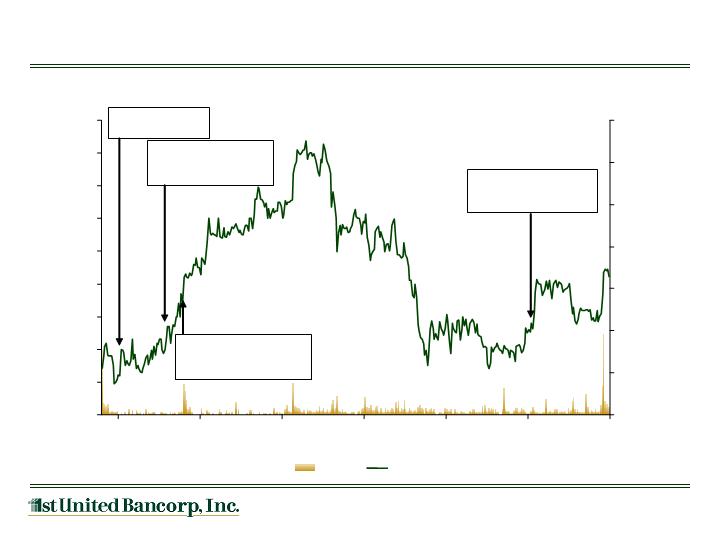
The 18 Months Since Our IPO Have Been Transformational
16
Volume
(000s)
Price
0
500
1,000
1,500
2,000
2,500
3,000
3,500
3/10/2011
12/13/2010
9/17/2010
6/23/2010
3/29/2010
12/30/2009
10/5/2009
$5.00
$5.50
$6.00
$6.50
$7.00
$7.50
$8.00
$8.50
$9.00
$9.50
Volume
Price
Redeemed all TARP
preferred stock and
warrants for $10.5 million
Raised $80.5 million
in equity capital.
Acquired $378 million
assets of the Bank of
Miami, N.A. from the FDIC
Acquired $297 million
assets of Republic Federal
Bank, N.A. from the FDIC

17
In less than 18 months, 1st United has amassed:
$360 million of net new earning assets, $355 million of which enjoy a benign credit profile
as they are under FDIC loss share protection
$30 million of bargain purchase gain
$517 million of new deposits, with an overall non-interest bearing segment of 26.4% with
the addition of only three banking centers
A banking network in Miami-Dade County, Florida’s largest banking market, and assembled
an enviable International deposit division
Significant risk defenses with an expansive Credit and Risk Management division, a stout
BSA division with a newly formed International division and a full loss share management
department
Elevated earning engines through this dramatic increase in earning assets
Significant franchise value
Made possible by the Fall 2009 IPO, which raised $80.5 million
1st United has growth and franchise development momentum
shared by just a few
institutions in the State of Florida
Capital is necessary to sustain this momentum
Why Are We Considering Raising Capital?

18
Opportunity: Troubled Florida Institutions are in Abundance
(1) Excludes merger targets.
Source: SNL Financial. Regulatory financial data as of 12/31/10. FDIC enforcement actions are for this cycle as of 3/4/11.
Asset Stratification of FL Institutions with Texas Ratios > 100%
Total Assets: $17.4B
Among Florida Institutions with Assets < $2B
(1)
:
Statewide
Texas Ratios
> 100%
NPAs/ Assets
> 7.0%
Tier 1
Leverage
Ratio < 6.0%
FDIC
Enforcement
Actions
52
92
34
47
8
17
11
6
10
0
2
4
6
8
10
12
14
16
18
< $100MM
$100 - $200MM
$200 - $300MM
$300 - $400MM
> $400MM

Quality Growth
Total Assets ($000)
Total Deposits ($000)
Equitable
Citrus
First
Western
Republic
Federal
19
Advantage
The Bank
of Miami
$0
$200,000
$400,000
$600,000
$800,000
$1,000,000
$1,200,000
$1,400,000
2004
2005
2006
2007
2008
2009
2010
$0
$100,000
$200,000
$300,000
$400,000
$500,000
$600,000
$700,000
$800,000
$900,000
$1,000,000
$1,100,000
$1,200,000
2004
2005
2006
2007
2008
2009
2010
Interest Bearing
Non-Interest Bearing
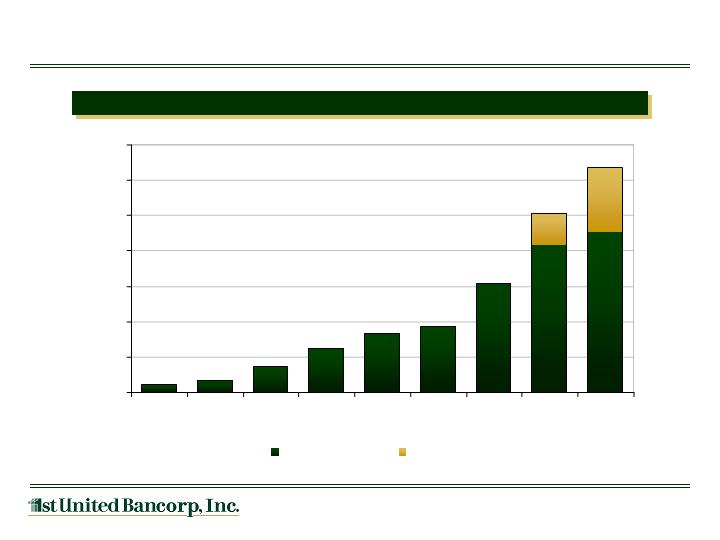
Strong Track Record of Growth
Total Assets ($MM)
20
Source: SNL Financial.
$833
$906
$180
$362
$47
$67
$143
$247
$332
$376
$618
$1,013
$1,268
$0
$200
$400
$600
$800
$1,000
$1,200
$1,400
2002
2003
2004
2005
2006
2007
2008
2009
2010
Non-covered Assets
Covered Assets
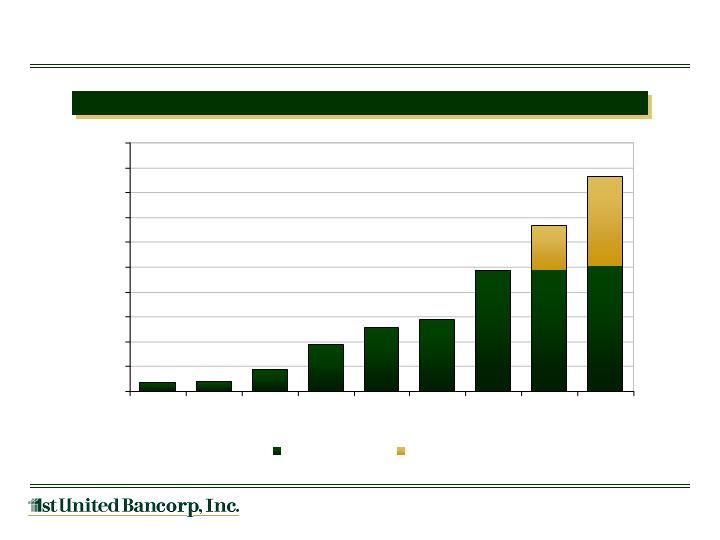
Gross Loans ($MM)
21
Strong Track Record of Growth
Source: SNL Financial. Gross loans include loans held for sale.
$487
$506
$180
$355
$38
$40
$90
$191
$257
$287
$487
$667
$861
$0
$100
$200
$300
$400
$500
$600
$700
$800
$900
$1,000
2002
2003
2004
2005
2006
2007
2008
2009
2010
Non-covered Loans
Covered Loans

Total Deposits ($MM)
22
Strong Track Record of Growth
Source: SNL Financial.
$78
$128
$157
$213
$335
$609
$783
$84
$101
$194
$281
$60
$58
$42
$55
$112
$186
$240
$272
$436
$803
$1,065
$0
$200
$400
$600
$800
$1,000
$1,200
2002
2003
2004
2005
2006
2007
2008
2009
2010
Interest Bearing
Noninterest Bearing

Net Interest Margin (%)
23
Steady Net Interest Margin
Source: SNL Financial, Company disclosure.
3.78%
3.70%
3.71%
3.49%
4.23%
4.12%
3.94%
4.06%
3.0%
3.2%
3.4%
3.6%
3.8%
4.0%
4.2%
4.4%
1Q 2009
2Q 2009
3Q 2009
4Q 2009
1Q 2010
2Q 2010
3Q 2010
4Q 2010
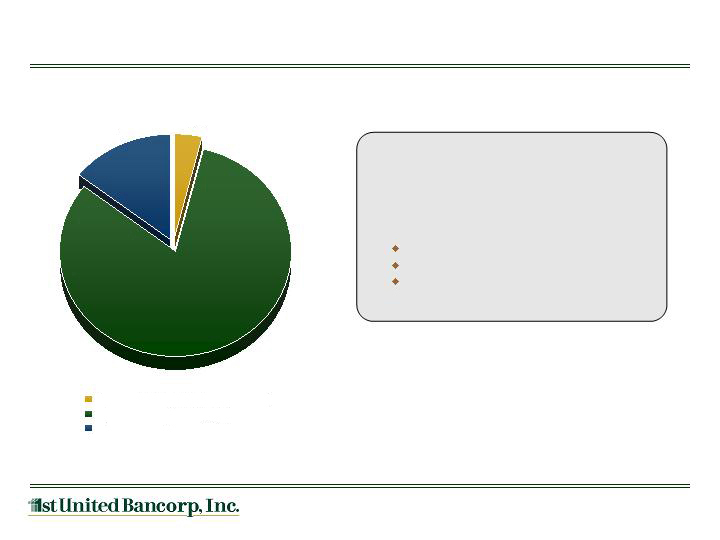
24
Investment Portfolio (12/31/10)
Investment portfolio managed to:
1. Minimize interest rate risk
2. Maintain sufficient liquidity
3. Maximize return
As of December 31, 2010:
No municipal bond exposure
Primarily longer-dated MBS securities
Substantially all of the portfolio is backed
by the U.S. Treasury or federal agencies
(1) Substantially all mortgage-backed securities in the portfolio are FNMA and FHLMC backed.
Source: SNL Financial. Data as of December 31, 2010.
3.9%
81.7%
14.4%
U.S. Treasury & Federal Agencies
Mortgage-Backed Securities (1)
Agency CMO’s

25
41% of Total Loans Covered by Loss Share
Agreements
Substantially all loans originated in primary
market area
Well-Diversified Loan Portfolio (12/31/10)
Loans by Category ($ in thousands)
Source: Company filings. Data as of December 31, 2010.
Residential
26.4%
Commercial
19.4%
Commercial RE
48.7%
Construction &
Development
3.9%
Consumer &
Other
1.6%
Loan Type
Total
Loans
Total
Percent of
Portfolio
Residential
859
227,500
$
26.4%
Commercial
631
166,686
19.4
Commercial RE
447
419,602
48.7
Construction & Development
45
33,444
3.9
Consumer & Other
200
13,645
1.6
Total (12/31/10)
2,182
860,877
$
100.0%

26
Comments
45% of total CRE portfolio is owner-occupied.
0% of the CRE portfolio is construction
Diversified Commercial Real Estate Composition
December 31, 2010
24%
16%
15%
12%
5%
5%
7%
9%
1%
4%
2%
Office
Warehouse/Industrial
Other
Retail
Gas Stations
Land
Mixed Use
Multi-Family
Restaurant
Hotel/Motel
Church

27
Funding Mix 12/31/10
Deposit Mix 12/31/10
92% Core Deposits
(1) At December 31, 2010, time deposits of approximately $70 million were
wholesale
deposits acquired from The Bank of Miami which we anticipate
not renewing
Funding Composition
Well-Positioned for Higher Short-Term Rates
Interest Bearing
Deposits
72%
Fed Funds &
Repos
1%
Other
1%
Noninterest
Bearing Deposits
26%
Demand Deposits
26%
NOW Accounts
11%
Time Deposits (1)
36%
Savings Deposits
4%
Money Market
Deposits
23%

28
Allowance for Loan Losses / Loans (%)
Net Charge-Offs / Avg. Loans (%)
NPAs/Assets at December 31, 2010 of 2.21%
Strong Credit Quality
1.51%
1.99%
1.19%
0.72%
0.84%
0.99%
1.48%
2.56%
2.73%
0.00%
0.50%
1.00%
1.50%
2.00%
2.50%
3.00%
3.50%
2004
2005
2006
2007
2008
2009
2010
Reserves/Loans
Reserves/Non-Covered Loans
2.01
1.14
0.21
0.08
-0.03
-0.10
-0.27
-0.50
0.00
0.50
1.00
1.50
2.00
2.50
2004
2005
2006
2007
2008
2009
2010

29
Classified and Nonperforming Assets
(dollars in thousands)
(1) All non-performing loans are included in the substandard classification.
12/31/09
3/31/10
6/30/10
9/30/10
12/31/10
Uncovered Non-Performing Assets
$15,699
$20,103
$28,762
$24,385
$20,819
Substandard Loans
(1)
57,241
66,507
65,385
56,947
53,944
Special Mention Loans
24,371
14,300
17,300
28,700
22,567
Total
$81,612
$80,807
$82,685
$85,647
$76,511

Non-Performing Loans
30
(1) Excludes loans covered under loss share agreements with the FDIC. Also excludes TDR’s which are all
performing in accordance with
the restructured terms and for which the average yield is 4.8%.
As of December 31, 2010
Dollars in Thousands
%
Number of
Nonaccrual
NAL % of
60-89
Outstanding
Covered
Nonaccrual
Loan
Outstanding
Days Past
Loan Type
Loan Balance
Loans
Loans
Balance
1
Balance
1
Due Balance
Residential
$227,500
52%
11
$7,700
3.4%
$116
Commercial Real Estate
456,615
42%
10
8,381
1.8%
2,635
Construction & Land Development
33,444
20%
3
1,759
5.3%
0
Commercial & Industrial
129,673
27%
6
241
0.2%
185
Other
13,645
34%
1
289
2.1%
0
Total
$860,877
41%
31
$18,370
2.1%
$2,936
12/31/2009
$667,003
27%
27
$15,010
2.3%
8,882

31
Other Real Estate (12/31/10)
(dollars in thousands)
Assets Not Subject to
Loss Share
Agreements
Assets Subject to
Loss Share
Agreements
Total
Commercial Real Estate
$
2,147
$
5,461
$
7,608
Residential
302
1,175
1,477
Total
$
2,449
$
6,636
$
9,085

Robust Capital Position with Growth Capacity
32
(As of December 31, 2010)
With the proposed offering, assuming a minimum TCE ratio of 8.00%, 1st
United
would have the capacity to add approximately $675 million of incremental assets.
(1) See appendix for non-GAAP reconciliation of tangible equity and tangible assets.
* Assumes a $30mm offering, a 5.00% underwriting discount and estimated fixed expenses of $250,000.
($ in 000’s)
Well-Capitalized
12/31/2010
Pro Forma
Capital Ratios
Requirement
As Reported
Offering
Leverage
5.00%
11.80%
14.27%
*
Tier 1 Risk-Based
6.00%
21.62%
26.24%
*
Total Risk-Based
10.00%
23.71%
28.31%
*
TCE / Assets
10.31%
12.34%
Current Tangible Equity
(1)
$125,753
Net Offering Proceeds
28,250
*
Pro Forma Tangible Equity
$154,003
Current Tangible Assets
(1)
$1,219,455
Net Offering Proceeds
28,250
8.00%
8.50%
9.00%
Pro Forma Tangible Assets
$1,247,705
$677,333
$564,095
$463,439
Note: Does not contemplate any goodwill or bargain
purchase gain which may result from a transaction.
Assuming Minimum TCE Threshold:
Capacity for Incremental Assets

33
Net income of $2.160 million
Loan loss reserve stable at $13.1 million with 41% of loans and OREO as
covered assets with loss share protection
Loan loss reserve / non-performing loans ratio of 69.1%
Net interest margin increased to 4.06%
Increased loans to $860.7 million (acquisition of The Bank of Miami
accounted for $203 million of net new loans)
Organic loan growth in 2010 equated to $91 million ($67 million of fundings)
Increased total deposits to $1.064 billion with non-interest bearing deposits
representing 26.4% of deposits
Organic deposit growth of over $30 million in 2010
2010 Results & Developments

34
Earnings potential has significantly increased with the growth of the Bank,
including the acquisition of The Bank of Miami
2010 net income of over $2.1 million (pre-provision, pre-acquisition earnings of
over $8.2 million for 2010)
Q4 margin of 4.06% before additional operating leverage
from The Bank of
Miami transaction
Accretion of discount on loans acquired in FDIC-assisted transactions will enhance the
net interest margin over the next several quarters
On December 17, 2010, The Bank of Miami transaction added $203 million in
performing loans and approximately $29 million in investments with no new
branches and the addition of less than 40
employees
1st United has made significant investments in infrastructure
and technology,
including extensive asset resolution and loss share capabilities
Created a scalable platform with the ability to support significant growth
Earnings Growth at 1st United

Business Drivers
35
Maintain our top quartile net interest margin
Grow the best core deposit mix in Florida banking (non-
interest bearing deposits 26% at December 31, 2010)
A relentless focus on asset quality through inclusive, system-
wide orchestrated credit regime
Successful, opportunistic bank acquisition program
Attraction of talented bankers
Maintain focus on safety and soundness

1st United Opportunity
36
1.
Management team with extensive in-market experience and a track record of
performance and shareholder returns
2.
Company has experienced considerable growth recently through FDIC-assisted
acquisitions and is well-positioned to leverage its existing infrastructure to capitalize
on future opportunities
5.
Unique position as one of the few institutions in Florida with the financial profile
necessary to go on the offensive with regard to organic growth, traditional or FDIC-
assisted transactions
3.
Strong capital and liquidity position with favorable asset quality and a meaningful
percentage of the loan portfolio covered by FDIC loss share
4.
Despite near-term weakness in Florida, the long-term attractive demographic profile
has remained intact
7.
Attractive valuation to reflect franchise potential and earnings growth story:
- Trades at a stated Price/BV of 100% and Price/2011 Earnings of 50.2x *
* Based on a 10-day VWAP of $7.03 as of March 10, 2011 and median consensus equity research analyst estimate for 2011.
6.
Recent growth in core earnings expected to continue

Appendix
This presentation contains certain financial information determined by methods other than U.S.
GAAP. Management believes that these non-GAAP financial measures provide useful
supplemental
information. Non-GAAP financial measures are not standardized, and therefore it
may not be possible to compare these financial measures with other companies’ non-GAAP
financial measures that may have the same name or similar names.
Reconciliation tables relating to the non-GAAP financial measures used in this presentation are
displayed on the following page.

38
Non-GAAP Financial Reconciliation
(Dollar amounts in thousands, except per share amounts)
Reconciliation of Non-GAAP Financial Measures
As of and for the Years Ended December 31,
2010
2009
Total assets
1,267,752
$
1,013,441
$
Goodwill
(45,008)
(45,008)
Intangible assets, net
(3,289)
(3,045)
Tangible Assets
1,219,455
$
965,388
$
Shareholders’ equity
174,050
$
170,594
$
Goodwill
(45,008)
(45,008)
Intangible assets, net
(3,289)
(3,045)
Tangible shareholders’ equity
125,753
$
122,541
$
Book value per common share
7.02
$
6.88
$
Effect of intangible assets
(1.95)
(1.94)
Tangible book value per common share
5.07
$
4.94
$
Equity to total assets
13.73%
16.83%
Effect of intangible assets
(3.42)
(4.14)
Tangible equity/tangible assets
10.31%
12.69%

Common Stock Offering
March 2011