Attached files
| file | filename |
|---|---|
| EX-21 - EXHIBIT 21 - TOWER FINANCIAL CORP | ex21.htm |
| EX-23 - EXHIBIT 23 - TOWER FINANCIAL CORP | ex23.htm |
| EX-32.1 - EXHIBIT 32.1 - TOWER FINANCIAL CORP | ex32_1.htm |
| EX-32.2 - EXHIBIT 32.2 - TOWER FINANCIAL CORP | ex32_2.htm |
| EX-31.1 - EXHIBIT 31.1 - TOWER FINANCIAL CORP | ex31_1.htm |
| EX-31.2 - EXHIBIT 31.2 - TOWER FINANCIAL CORP | ex31_2.htm |
UNITED STATES
SECURITIES AND EXCHANGE COMMISSION
Washington, D.C. 20549
FORM 10-K
(Mark One)
|
x
|
ANNUAL REPORT PURSUANT TO SECTION 13 OR 15(d) OF THE SECURITIES EXCHANGE ACT OF 1934
|
For the fiscal year ended December 31, 2010
OR
|
o
|
TRANSITION REPORT PURSUANT TO SECTION 13 OR 15(d) OF THE SECURITIES EXCHANGE ACT OF 1934
|
For the transition period from to
Commission file number 000-25287
TOWER FINANCIAL CORPORATION
(Exact name of registrant as specified in its charter)
|
Indiana
|
35-2051170
|
|
|
(State or other jurisdiction of incorporation or organization)
|
(I.R.S. Employer Identification No.)
|
|
|
116 East Berry Street, Fort Wayne, Indiana
|
46802
|
|
|
(Address of principal executive offices)
|
(Zip Code)
|
Registrant’s telephone number, including area code: (260) 427-7000
|
Title of Each Class
|
Name of Each Exchange on which registered
|
||
|
Securities registered pursuant to Section 12(b) of the Act:
|
Common stock, no par value
|
NASDAQ / G
|
Securities registered pursuant to Section 12(g) of the Act: NONE
Indicate by check mark if the registrant is a well-known seasoned issuer, as defined in Rule 405 of the Securities Act.
Yes o No x
Indicate by check mark if the registrant is not required to file reports pursuant to Section 13 or 15(d) of the Act.
Yes o No x
Indicate by check mark whether the registrant (1) has filed all reports required to be filed by Section 13 or 15(d) of the Securities Exchange Act of 1934 during the preceding 12 months (or for such shorter period that the registrant was required to file such reports), and (2) has been subject to such filing requirements for the past 90 days.
Yes x No o
Indicate by check mark whether the registrant has submitted electronically and posted on its corporate Web site, if any, every Interactive Data File required to be submitted and posted pursuant to Rule 405 of Regulation S-T during the preceding 12 months (or for such shorter period that the registrant was required to submit and post such files).
Yes o No o
Indicate by check mark if disclosure of delinquent filers pursuant to Item 405 of Regulation S-K is not contained herein, and will not be contained, to the best of registrant’s knowledge, in definitive proxy or information statements incorporated by reference in Part III of this Form 10-K or any amendment to this Form 10-K. x
Indicate by check mark whether the registrant is a large accelerated filer, an accelerated filer a non-accelerated filer, or a smaller reporting company. See the definition of "large accelerated filer," "accelerated filer" and "smaller reporting company" in Rule 12b-2 of the Exchange Act. (Check one):
Large accelerated filer o Accelerated filer o Non-accelerated filer o Smaller reporting company x
(Do not check if a smaller reporting company.)
Indicate by check mark whether the registrant is a shell company (as defined in Rule 12b-2 of the Act).
Yeso No x
Aggregate market value of the voting and non-voting common stock held by nonaffiliates of the registrant based on the last sale price for such stock at June 30, 2010 (assuming solely for the purposes of this calculation that all directors and executive officers of the registrant are “affiliates”): $21,601,783
Number of shares of Common Stock outstanding at March 15, 2011: 4,811,232
The exhibit index required by Item 601(a) of Regulation S-K is included in Item 15 of Part IV of this Report
Document Incorporated by Reference
Certain portions of the Registrant’s definitive Proxy Statement for the 2011 Annual Meeting of Stockholders, which we will file with the Securities and Exchange Commission within 120 days after December 31, 2010, are incorporated by reference in Part III of this Report
TOWER FINANCIAL CORPORATION
Fort Wayne, Indiana
Annual Report to Securities and Exchange Commission
December 31, 2010
PART I
|
ITEM 1
|
BUSINESS.
|
Company
Tower Financial Corporation, collectively with its subsidiaries, the “Company,” was incorporated as an Indiana corporation on July 8, 1998. We are a bank holding company with one bank subsidiary, Tower Bank & Trust (the “Bank” or “Tower Bank”) and two unconsolidated subsidiary guarantor trusts, Tower Capital Trust 2, and Tower Capital Trust 3.
The Bank is an Indiana chartered bank with depository accounts insured by the Federal Deposit Insurance Corporation (“FDIC”) and is a member of the Federal Reserve System. Tower Capital Trust 2 and Tower Capital Trust 3 are unconsolidated, wholly owned Delaware statutory business trusts formed in December 2005 and December 2006, respectively, for the exclusive purpose of raising Federal Reserve approved capital through the issuance and sale of securities known as trust preferred securities. The Bank has a direct wholly owned trust company subsidiary, Tower Trust Company (the “Trust Company”), that is an Indiana Corporation formed on January 1, 2006 and was previously owned by the bank holding company until December 1, 2009. The Bank also has a direct wholly owned Nevada investment subsidiary, Tower Capital Investments, Inc., that was formed on July 1, 2006 for the purpose of holding long term investments, and an indirect wholly-owned subsidiary, Tower Funding Corporation. Tower Funding Corporation is a Maryland real estate investment trust, or “REIT,” formed as well on July 1, 2006. The REIT purchases mortgage-backed real estate loans from the Bank.
The Bank opened on February 19, 1999 and provides a range of commercial and consumer banking services from six locations in the metropolitan area of Fort Wayne, Allen County, Indiana, and one location in Warsaw, Indiana. The Bank’s lending strategy is focused on commercial and commercial mortgage loans and, to a lesser extent, on consumer and residential mortgage loans. The Bank offers a broad array of deposit products, including checking, savings, and money market accounts, certificates of deposit and direct deposit services. Trust investment and management services are offered by the Trust Company.
The Bank’s and the Trust company’s main offices are located at 116 East Berry Street in downtown Fort Wayne, Indiana, which also serves as our corporate headquarters.
Forward-Looking Statements
This report includes "forward-looking statements." All statements regarding our anticipated results or expectations for earnings, revenues, expenses, capital levels, asset quality or other future financial business plans and strategies, or the impact of legal, regulatory or supervisory matters on our business operations, are intended to be forward-looking statements within the meaning of the safe harbor provisions for forward-looking statements contained in the Private Securities Litigation Reform Act of 1995. Typically, forward-looking statements are predictive and are not statements of historical fact, and such words as "anticipates," "believes," "estimates," "seeks," "expects," "plans," "intends," and similar expressions, as they relate to us, the Bank, the Trust Company, or our management, are intended to identify forward-looking statements. Although we believe that the expectations reflected in these forward-looking statements are reasonable and have based these expectations upon reasonable beliefs and assumptions, these expectations may prove to be incorrect. Important factors that could cause actual results to differ materially from our expectations include, without limitation, the following:
|
|
·
|
The impact of a prolonged recession on our asset quality, the adequacy of our allowance for loan losses and the sufficiency of our capital;
|
|
|
·
|
the continued weakness of the local economy in our primary service area;
|
|
|
·
|
the effect of general economic and monetary conditions and the regulatory environment on the Bank’s ability to attract deposits, make loans and achieve satisfactory interest spreads;
|
1
|
|
·
|
the risk of further loan delinquencies and losses due to loan defaults by both commercial loan customers or a significant number of other borrowers;
|
|
|
·
|
general changes in real estate, business and general property valuations underlying secured loans;
|
|
|
·
|
the level of our non-performing substandard or doubtful assets;
|
|
|
·
|
restrictions or additional capital requirements imposed on us by our regulators; and
|
|
|
·
|
dependence on our key banking and management personnel.
|
Please also refer to the “Risk Factors” section of this report for a discussion of some of the principal risks and uncertainties inherent in our businesses.
Tower Bank & Trust Company
Lending
We generally make loans to individuals and businesses located in Allen, Kosciusko and the surrounding counties in Northeast Indiana. Our loan portfolio at December 31, 2010 consisted of commercial and commercial real estate loans (72.4%), residential mortgage loans (16.4%) and personal loans (11.2%). The Bank’s legal lending limit under applicable federal banking regulations is approximately $11 million, based on the legal lending limit of 15% of the Bank’s total risk-based capital. We continue to pursue opportunities to originate new loans in order to grow earning assets to existing customers as well as new customers.
Loan Segments:
Commercial Loan:. Our lending activities focus primarily on providing small- and medium-sized businesses in our market area with commercial loans. These loans are both secured and unsecured and are made available for general operating purposes, including acquisition of fixed assets such as real estate, equipment and machinery, and lines of credit collateralized by inventory and accounts receivable. Typically, our customers' financing requirements range from $250,000 to $4.0 million. Commercial and industrial loans comprised 47.7% of total loans at December 31, 2010 and 2009. The majority of these are secured by a lien on equipment, inventory and/or other assets, but can also be secured by owner-occupied or investment real estate. Commercial and industrial loans also include revolving notes for working capital that range in maturity from on demand to no longer than one year. Commercial real estate loans comprised 24.7% of total loans at December 31, 2010, down from 25.1% at December 31, 2009. Some commercial and industrial loans and some commercial real estate loans have fixed interest rates, while other have floating interest rates. These loans typically have maturities of 1 to 5 years.
Commercial real estate lending involves more risk than residential lending because loan balances are typically greater and repayment is dependent not only upon general economic conditions and the continuing merits of the particular real estate project securing the loan, but also, and importantly, upon the underlying value of the collateral and the borrower’s financial health and liquidity. For example, during 2009, we took additional provisions for loan losses and reduced the value of the assets to the fair value on a group of real estate loans to a number of different borrowers involving nearby residential developments. We believed it was necessary to take additional provisions due to the slower than anticipated sell-off of those projects, the deterioration in the local market for the affected lots reflected in the collateral value of those lots, and the uncertainty of collection from the borrowers and/or guarantors. The original underwriting decisions regarding these loans were made a number of years ago, and although we believed we had adequate underwriting standards and lending approvals in place at the time, our recent experience revealed various shortcomings in those standards and procedures.
Accordingly, we have reduced the risk associated with these transactions by establishing limits for concentration in certain types of loans, projects, and borrowers, developed additional checks and balances in the approval process, increased underwriting standards and employed a higher degree of oversight. We refer you to a further discussion of this subject in the next section under “Lending Policies.”
In 2009 and 2010, we continued to focus on improving asset quality and increasing long-term profitability. To accomplish these goals, we undertook an action plan to decrease the amount of nonperforming loans from our portfolio through liquidation of collateral, encouraging and cooperating in refinancing certain loans through other financial institutions, or taking additional charges against certain loans. Additionally, we have marshaled additional resources to increase the speed in reacting to and dealing with potential deterioration of borrowers’ assets.
Mortgage Banking: We provide fixed rate, long-term residential mortgage loans and construction loans to our customers. Our general policy, which is subject to periodic review by management, is to sell the majority of loans originated on the secondary market. We retain only those loans where we have ongoing, multi-faceted customer relationships or keep our portfolio at benchmark levels and support our commitment to our customers and community. All other loans are immediately sold, or are originated on a brokered basis for another investor. We utilize both correspondent and wholesale delivery methods for sold loans where we may also have delegated underwriting and closing responsibility. We typically charge an average of 1.5% of the loan amount between the service release premium and fees on sold and brokered loans. We do not retain servicing rights with respect to residential mortgage loans that we broker or sell. During 2010, we originated $14.0 million in construction loans and $67.4 million of residential mortgage loans, of which we retained $37.4 million, sold $37.9 million in the secondary market, and brokered $6.1 million. These loans were a combination of jumbo whole loans, government loan programs (FHA/VA), and traditional conventional loan products. We neither originated nor purchased any subprime loans in 2010, nor have we done so historically.
2
|
For the years ended December 31,
|
||||||||||||
|
($ in thousands)
|
2010
|
2009
|
2008
|
|||||||||
|
Real estate mortgage loans originated and retained
|
$ | 37,403 | $ | 45,370 | $ | 44,297 | ||||||
|
Real estate mortgage loans originated and sold
|
37,885 | 35,135 | 9,789 | |||||||||
|
Real estate mortgages brokered
|
6,111 | 5,277 | 5,377 | |||||||||
Personal Loans and Lines of Credit: We make personal loans and lines of credit available to consumers for various purposes, such as the purchase of automobiles, boats and other recreational vehicles, and to make home improvements and personal investments. The majority of our personal loans are home equity loans secured by a second lien on real estate. We retain all of such loans in our loan portfolio.
Consumer loans generally have shorter terms and higher interest rates than residential mortgage loans and usually involve more credit risk than mortgage loans because of the type and nature of the collateral. Consumer lending collections are dependent on a borrower’s continuing financial stability and are thus likely to be adversely affected by job loss, illness and personal bankruptcy. In many cases, repossessed collateral for a defaulted consumer loan will not provide an adequate source of repayment of the outstanding loan balance because of depreciation of the underlying collateral.
In order to maximize our consumer loan approval efficiencies and ensure we met our customer’s service expectations, we utilize centralized underwriting. We continue to pursue a policy of conservative loan underwriting, with an emphasis on our borrower’s amount of the down payment, credit quality, employment stability, and monthly income. Consumer loans are generally repaid on a monthly repayment schedule with the payment amount tied to the borrower’s periodic income. We believe that the generally higher yields earned on consumer loans help to compensate for the increased credit risk associated with such loans, and we believe that consumer loans are important to our efforts to serve the credit needs of our customer base. Historically, our delinquency rates and losses on consumer loans have been lower than that of the national average, which held true in 2010.
Lending Policies:
Loan Policies: Although we maintain a competitive approach to lending, we strive to underwrite high quality loans. We employ written loan policies that contain general lending guidelines and are subject to periodic review and revision by our Board Loan and Investment Committee and our Board of Directors. These policies relate to loan administration, documentation, approval and reporting requirements for various types of loans.
Our loan policies include procedures for oversight and monitoring of our lending practices and loan portfolio. We seek to make sound loans, while recognizing that lending money involves a degree of business risk. Our loan policies are designed to assist in managing the business risk involved in making loans. These policies provide a general framework for our lending operations, while recognizing that not all loan outcomes and results can be anticipated. Our loan policies instruct lending personnel to use care and prudent decision-making and to seek the guidance of our Chief Executive Officer, Chief Lending Officer or the Senior Vice President of Risk Management where appropriate.
Since 2004, we have maintained a separate credit department that is generally responsible for the integrity of data used by lending personnel for underwriting decisions. Additionally, our credit department is responsible for providing independent financial analysis and credit assessments for loan aggregations above $500,000. Our credit department also assists in the application of loan policy and the identification of unresolved or potential credit issues. Since 2008, we have outsourced our loan review function to an independent accounting firm.
3
Our loan policies provide limits for loan-to-value ratios that limit the size of certain types of loans to a maximum percentage of the value of the real estate collateral securing the loans. The loan-to-value percentage varies by the type of collateral. The Federal Deposit Insurance Corporation Improvement Act of 1991 established regulatory and supervisory loan-to-value limits. Our internal loan-to-value limitations follow those limits and, in certain cases, are more restrictive than those required by regulators. However, exceptions may be made to these limits and are allowable under the regulatory rules as long as the aggregate balance of these exceptions does not exceed certain capital thresholds. Exception balances are below the capital thresholds established by regulatory rules
Our loan policies also establish an “in-house” guideline limit on the aggregate amount of loans to any one borrower. In 2010, we reduced our in-house limit from $7 million to $5 million. Our loan committee approves all loan relationships above $1 million. Additionally, the Bank board’s loan and investment committee reviews all lending relationships over $5.0 million on a quarterly basis. This internal limit is subject to review and revision by our Board of Directors from time to time. In addition, our loan policies provide guidelines for (i) personal guarantees, (ii) loans to employees, executive officers and directors, (iii) problem loan identification, (iv) maintenance of an allowance for loan losses (v) interest reserves, and (vi) other matters relating to our lending practices.
Underwriting policies:
Commercial and Industrial Loans: Commercial and Industrial loans are underwritten using an analysis of the businesses’ current and historical financial statements. The form of statement required (audit, review, compilation, tax return, or internally prepared) varies depending on the credit size, complexity, and risk. Financial projections may be required for loans with a term greater than one year. For all aggregated borrowing relationships in excess of $100,000, a cash flow analysis is completed for each corporate borrower, and a debt-to-income ratio is calculated for each personal guarantor. For those relationships where reliance is placed on a borrower or guarantor that is involved in several loans, business ventures or real estate projects, both a separate cash flow analysis and a consolidated global cash flow analysis is required. This is mandatory for all requests that are in excess of five percent of the Bank’s capital. In addition, we review the quality and value of collateral provided to determine the appropriate advance rates and analyze the risks inherent in the business enterprise to determine the appropriate financial covenant package.
Commercial Real Estate Loans: The Company will consider commercial real estate financing for any feasible project including land loans, acquisition and development loans, construction loans and long-term mortgages for income producing and investment properties. Loans are not to be extended to developers or builders who have been subject to a foreclosure action or have given a creditor a deed in-lieu of foreclosure. Commercial Real Estate loans are generally made with full recourse or limited recourse to all principals and owners.
All real estate credit extensions are to meet high standards of quality and are to be in compliance with the Bank’s policies. Relationship managers are to comply with each underwriting guideline and explain and document any exceptions.
Residential Mortgage Loans: Residential mortgage loans are defined as loans for primary or secondary residences. No rental property loans will be considered under the guidelines for residential mortgage underwriting. Secondary residences are limited to one unit. Loans for rental properties are to be considered as business loan requests subject to the Commercial Real Estate guidelines.
Loans to be sold into the secondary market are not subject to these guidelines. Portfolio loans must adhere to all requirements below (they follow the requirements of the purchaser in the secondary market) and to all requirements for consumer credits (except the requirement as to maximum debt-to-income ratio) described herein.
It is the stated goal of the Bank to offer mortgage loans on owner-occupied real estate at competitive rates and terms to customers in our defined lending areas. Mortgage loan terms should be related to the nature and market value of the security property, as well as income, future earning ability and credit history of the borrower. Mortgages should be made in anticipation of regular amortization, not foreclosure.
Rates for residential mortgage loans are fixed for the term of the loan. The company does not underwrite any hybrid loans, or sub-prime loans within its residential portfolio. Adjustable rate loans are limited to Commercial, Commercial Real Estate, and Home Equity products. The rates for these loans are primarily tied to the Prime Rate as stated in the Wall Street Journal.
4
Home Equity Loans: Home Equity loans and Home Equity lines of credit are underwritten using the same guidelines and procedures outlined above for residential mortgage loans. The loan to value maximum for a Home Equity loan or line of credit is capped at 90% of the appraised value.
Consumer Loans: All consumer loans are to be supported by a signed, completed credit application or a credit file memo disclosing loan purpose, applicant’s income and obligations, and repayment terms. Related documents should include a current or recent credit bureau report. Unsecured consumer loans of $5,000 and larger must also have a current financial statement on file on a form acceptable to the Company.
Typically, the rates for variable rate loans in all categories are underwritten using the Prime Rate index as stated in the Wall Street Journal. In 2009, the Bank began utilizing interest rate floors on variable rate loan products. Typical loan terms on these types of products range from one to five years and the interest rate floors ranged between 0.75% to 1.75% over the Prime Rate.
Source of Funds
In 2010, no inter-company contributions were made, but we did receive net proceeds of $2.8 million from a private placement of 458,342 shares of our common stock. In 2009, we made capital contributions to the Bank of $8.1 million from the Company, of which $1.8 million came from the private placement of 18,300 shares of Series A Convertible Preferred Stock on September 25, 2009 and $5.5 million came from our sale of the Trust Company to the Bank. Also in 2009 and prior to the sale to the Bank, the Trust Company contributed $800,000 of capital to the Company, which was immediately contributed to the Bank. The 2009 capital contributions were made due to the net loss incurred during the year and because of added pressure in the financial institution industry to continually grow capital due to the prolonged economic decline.
On an ongoing basis, the Bank funds its operations and loan growth primarily with local deposits. Secondarily, the Bank uses alternative funding sources as needed, including advances from the Federal Home Loan Bank, out-of-market deposits (including national market CDs and brokered CDs) and other forms of wholesale financing. A component of our strategic plan includes a change in the deposit mix to assist us in increasing profitability and improving liquidity, which we have been successful in accomplishing over the last two years. Two events occurred in 2008 and have carried over in to 2009 and 2010 to assist us with the change in our deposit mix. First, the 400 basis point drop in 2008 in the Federal Funds Rate caused our variable rate certificate of deposit products to be a less attractive option for our customers, as it is directly tied to the federal funds rate. With the drop in rates, customers chose to select other avenues for investing their money as these deposits matured. The second event in 2008 was the increase in the FDIC insurance to $250,000 for all interest-bearing accounts and an unlimited amount for non-interest bearing accounts. The deposit mix started to change due to these events as customers chose to move money into an account that was fully insured or to one that offered better rates depending on their intentions for the deposits. In 2009 and 2010, the short- term interest rates remained unchanged from the final decrease in December 2008 and the FDIC insurance increase was extended through December 31, 2012 for the unlimited insurance on non-interest bearing accounts and the limit on all other accounts has been increased to $250,000 permanently. As of December 31, 2010 and December 31, 2009, we had $50.3 million and $70.1 million, respectively, of deposits protected by unlimited FDIC insurance. By the end of 2010, the core deposits comprised 74.9% of total deposits compared to 76.0% and 69.4% at December 31, 2009 and December 31, 2008, respectively.
Deposit Generation: We generate deposits primarily through offering a broad array of deposit products to individuals, businesses, associations, financial institutions, and government entities in our primary market areas. We generally seek a comprehensive banking relationship from our lending customers, which has contributed to our internal deposit growth. This often includes encouraging new customers to consider both business and personal checking accounts and other deposit services. Our deposit services include checking, savings, health savings accounts, money market accounts, certificates of deposit, direct deposit services, and telephone and Internet banking. Health savings accounts continue to be a primary leader in core deposit growth in 2010, which showed an increase of $14.4 million to a balance of $50.0 million and approximately 35,000 accounts at December 31, 2010. We also offer a courier service for the deposit convenience of our business customers as well as wholesale lockbox and other business deposit and cash management services. We also generate certificates of deposit through national, so-called out-of-market sources. These deposits include brokered deposits, which we began accepting during 2003. Currently, the out-of-market deposits are generated through negotiated transactions with brokers. As the out-of-market deposits typically come in the form of certificates of deposits or money market accounts, the interest expense associated with these deposits is normally higher than interest paid on in-market deposits. In 2010, the average cost of funds on out-of-market deposits was 2.99%, while the average cost of funds on in-market deposits was 1.16%. Throughout 2009 and 2010, it was less costly to take short-term advances from the Federal Home Loan Bank than to bring in new monies from within the local market. We were able to borrow from the Federal Home Loan Bank at a rate around 0.50% through short-term variable rate advances. During 2010, we strategically purchased brokered certificates of deposit and brokered money markets in excess of the balance in 2009 by $36.8 million. The growth in brokered deposits was purposeful as we took advantage of the favorable rate environment to lock in low rates for an extended period of time. Terms for our $35.2 million of new brokered CD purchases ranged from two years to ten years, with an average life of just more than six years. The average rate on our brokered CD purchases was 3.0%. At December 31, 2010, approximately 81.7% of our deposits were generated in-market, while 18.3% were out-of-market deposits, compared to 87.9% of in-market deposits in 2009 and 12.1% out-of-market. Deposits at December 31, 2010, 2009, and 2008 are summarized as follows:
5
|
2010
|
2009
|
2008
|
||||||||||||||||||||||
|
($ in thousands)
|
Balance
|
%
|
Balance
|
%
|
Balance
|
%
|
||||||||||||||||||
|
Core Deposits:
|
||||||||||||||||||||||||
|
Noninterest-bearing demand
|
$ | 92,873 | 16.1 | % | $ | 95,027 | 16.7 | % | $ | 82,107 | 14.0 | % | ||||||||||||
|
Interest-bearing checking
|
101,158 | 17.6 | % | 89,735 | 15.8 | % | 73,452 | 12.5 | % | |||||||||||||||
|
Money market
|
159,336 | 27.7 | % | 152,092 | 26.7 | % | 140,385 | 24.0 | % | |||||||||||||||
|
Savings
|
22,673 | 3.9 | % | 18,264 | 3.2 | % | 17,050 | 2.9 | % | |||||||||||||||
|
Time, under $100,000
|
55,450 | 9.6 | % | 77,202 | 13.6 | % | 93,765 | 16.0 | % | |||||||||||||||
|
Total Core Deposits
|
431,490 | 74.9 | % | 432,320 | 76.0 | % | 406,759 | 69.4 | % | |||||||||||||||
|
Non-core Deposits:
|
||||||||||||||||||||||||
|
In-market non-core deposits:
|
||||||||||||||||||||||||
|
Time, $100,000 and over
|
39,357 | 6.8 | % | 67,390 | 11.9 | % | 94,927 | 16.2 | % | |||||||||||||||
|
Out-of-market non-core deposits:
|
||||||||||||||||||||||||
|
Brokered money market
|
12,016 | 2.1 | % | - | 0.0 | % | - | 0.0 | % | |||||||||||||||
|
Brokered certificate of deposits
|
93,493 | 16.2 | % | 68,670 | 12.1 | % | 84,551 | 14.4 | % | |||||||||||||||
|
Total out-of-market non-core deposits
|
105,509 | 18.3 | % | 68,670 | 12.1 | % | 84,551 | 14.4 | % | |||||||||||||||
|
Total Non-core Deposits
|
144,866 | 25.1 | % | 136,060 | 24.0 | % | 179,478 | 30.6 | % | |||||||||||||||
|
Total deposits
|
$ | 576,356 | 100.0 | % | $ | 568,380 | 100.0 | % | $ | 586,237 | 100.0 | % | ||||||||||||
Investments
We invest funds that we retain from time to time in various debt instruments, including but not limited to obligations guaranteed by the United States, general obligations of a state or political subdivision thereof, bankers’ acceptance of deposit of United States commercial banks, commercial paper of United States issuers rated in the highest category by a nationally recognized statistical rating organization, or trust preferred securities. We are permitted to make limited portfolio investments in equity securities. We currently have only two of these investments, a $20,000 investment in an economic development venture capital limited partnership focusing on businesses located in Northeast Indiana and an equity investment with an initial investment of $1 million in a limited partnership focused on financial holding companies, primarily bank holding companies. As of December 31, 2010, these investments carried a value of $83,534 and were recorded in other assets. Due to the volatility of the equity investment in the limited partnership as well as the accounting treatment for the investment, the Board of Directors approved the gradual liquidation of this investment. In 2009, requests were made to liquidate the investment. Disbursements received in 2010 and 2009 were $23,022 and $740,437, respectively, leaving a value of $63,534 as of December 31, 2010. The remaining balance is invested in side-pocket investments, which are primarily made up of small equity investments in local start-up businesses, and is projected to be fully liquidated in 2011.
We may invest our funds in a wide variety of debt instruments and may participate in the federal funds market with other depository institutions. Real estate, which we may acquire in satisfaction of or as a result of foreclosure upon loans and which at December 31, 2010 amounted to $4.3 million, may be held for no longer than ten years after the date of acquisition without the written consent of the Indiana Department of Financial Institutions (“IDFI”). We are also permitted to invest an aggregate amount not to exceed 50% of our “sound capital” in various other real estate and buildings as are necessary for the convenient transaction of our business, such as but not limited the ownership of branch banking facilities. Our Board of Directors may alter our investment policy without stockholders’ approval.
6
Tower Trust Company
General
Prior to January 1, 2006, we provided our trust and investment management services through a division of Tower Bank & Trust Company. On January 1, 2006, the Bank transferred the business, employees, assets, liabilities, and customers to the Holding Company as a new wholly-owned subsidiary, Tower Trust Company. This transfer occurred to allow Tower Trust Company to expand the service areas to which it could provide trust and investment services to locations outside of the Bank’s service area, such as Indianapolis. Due to a change in the strategic plan, management decided to bring the trust company’s focus within the Bank’s service area as new opportunities in the local market have presented themselves. On December 1, 2009, the Bank purchased Tower Trust Company to be held as a wholly-owned subsidiary of the Bank to be able to focus on these initiatives with the added benefit of increasing capital and earnings at the Bank.
Investment Management and Trust Services.
Our investment management and trust services provide a wide range of traditional personal trust services to customers in our market area. Our trust services include estate planning and money management, as well as traditional revocable trusts, irrevocable trusts, charitable trusts, estate administration, guardianship administration, IRA administration, personal and institutional investment management, and custodial services. We believe that by offering trust services through personalized client service, an experienced professional staff, and a tailored approach to investments that we can enhance and leverage client relationships. In the 4th quarter of 2010, we lost two large non-discretionary client relationships (e.g. directed trustee and custody) that led to a decline in our overall assets under management to $473.1 million at December 31, 2010. These two accounts were non-managed, non-discretionary accounts yielding 0.18% annually, which results in a loss of income of approximately $240,000. However, we believe that our personalized approach to investment management and trust services should allow for continued growth in assets under management and resulting trust services revenue in the future.
The following table reflects assets under management and revenue derived from trust services for the periods indicated.
|
For the years ended December 31,
|
||||||||||||
|
($ in thousands)
|
2010
|
2009
|
2008
|
|||||||||
|
Assets under management
|
$ | 473,058 | $ | 619,510 | $ | 538,270 | ||||||
|
Number of accounts
|
626 | 635 | 656 | |||||||||
|
Average account size
|
$ | 756 | $ | 976 | $ | 820 | ||||||
|
Trust revenue
|
$ | 3,040 | $ | 2,860 | $ | 2,948 | ||||||
Tower Investment Services
In July of 2004, we began offering securities and insurance brokerage services under the private label name of Tower Investment Services. The services are provided through PrimeVest Financial Services, Inc. PrimeVest is a self-clearing broker dealer that works exclusively with banks and financial institutions. Tower Investment Services had $159.3 million in assets under management at December 31, 2010, compared to $142.7 million at December 31, 2009.
The following table reflects assets under management and revenues of our investment services department for the periods indicated.
|
For the years ended December 31,
|
||||||||||||
|
($ in thousands)
|
2010
|
2009
|
2008
|
|||||||||
|
Assets under management
|
$ | 159,284 | $ | 142,672 | $ | 97,010 | ||||||
|
Number of accounts
|
1,376 | 1,242 | 913 | |||||||||
|
Average account size
|
$ | 116 | $ | 115 | $ | 106 | ||||||
|
Investment services revenue
|
$ | 565 | $ | 513 | $ | 572 | ||||||
7
Effect of Government Monetary Policies
Our performance and our results are affected by domestic economic conditions and the monetary and fiscal policies of the United States government, its agencies and the Federal Reserve Board (“Federal Reserve”). The Federal Reserve’s monetary policies have had, and will continue to have, an important impact on the operating results of commercial banks through its power to implement national monetary policy in order, among other things to, curb inflation or, conversely, to stimulate the economy. The instruments of monetary policy employed by the Federal Reserve include open market operations in United States government securities, changes in the discount rate on member bank borrowing and changes in reserve requirements against deposits held by all federally insured banks. During 2008, the Federal Reserve lowered the federal funds discount rate to 0.25% where it remained for the all of 2009 and 2010. The drop in interest rates has had a direct impact on the Company. It directly impacted our interest margin; therefore, resulting in a decrease in net interest income from 2007 to 2008. In 2009 and 2010, we implemented an interest rate floor on our loan portfolio and aggressively lowered the interest rates paid on deposits to combat the prolonged period of low short-term interest rates and to improve our net interest margin. In view of changing conditions in the national economy and in the money markets, as well as the effect of actions by monetary fiscal authorities including the Federal Reserve, we can make no prediction as to possible future changes in interest rates, deposit levels, loan demand or the affect thereof on our business.
Regulation and Supervision
General
Financial institutions and their holding companies are extensively regulated under federal and state law. Consequently, our growth and earnings performance can be affected not only by management decisions and general economic conditions, but also by the statutes administered by, and the regulations and policies of, various governmental regulatory authorities. Those authorities include but are not limited to the Federal Reserve, the FDIC, the IDFI, the Internal Revenue Service and the state taxing authorities. The effect of such statutes, regulations and policies can be significant and cannot be predicted with any high degree of certainty.
Federal and state laws and regulations generally applicable to our business regulate among other things:
|
|
·
|
the scope of permitted businesses,
|
|
|
·
|
investments,
|
|
|
·
|
reserves against deposits,
|
|
|
·
|
capital levels relative to operations,
|
|
|
·
|
lending activities and practices,
|
|
|
·
|
the nature and amount of collateral for loans,
|
|
|
·
|
the establishment of branches,
|
|
|
·
|
mergers and consolidations, and
|
|
|
·
|
dividends.
|
The foregoing system of supervision and regulation establishes a comprehensive framework, and is intended primarily for the protection of the FDIC’s deposit insurance funds, the depositors of the Bank and the public, rather than our stockholders, and any change in government regulation may have a material adverse effect on our business.
Bank Holding Company Regulation
As a bank holding company, we are subject to regulation by the Federal Reserve under the Federal Bank Holding Company Act of 1956, as amended, or the Act. Under the Act, we are subject to examination by the Federal Reserve and are required to file reports of the Company’s operations and such additional information as the Federal Reserve may require. Under Federal Reserve policy, we are expected to act as a source of financial strength to the Bank and to commit resources to support the Bank in circumstances where we might not do so absent such policy.
Any loans by a bank holding company to a subsidiary bank are subordinate in right of payment to deposits and to certain other indebtedness of such subsidiary bank. In the event of a bank holding company’s bankruptcy, any commitment by the bank holding company to a federal bank regulatory agency to maintain the capital of a subsidiary bank will be assumed by the bankruptcy trustee and entitled to a priority of payment.
With certain limited exceptions, the Act prohibits bank holding companies from acquiring direct or indirect ownership or control of voting shares or assets of any company other than a bank, unless the company involved is engaged in one or more activities which the Federal Reserve has determined to be so closely related to banking or managing or controlling banks as to be incidental to these operations. Under current Federal Reserve regulations, including rules under which we qualify as a bank holding company as described in the following paragraph, such permissible non-bank activities include such things as mortgage banking, equipment leasing, securities brokerage, and consumer and commercial finance company operations. As a result of recent amendments to the Act, many of these acquisitions may be affected by bank holding companies that satisfy certain statutory criteria concerning management, capitalization, and regulatory compliance, if written notice is given to the Federal Reserve within ten business days after the transaction. In certain cases, prior written notice to the Federal Reserve will be required. Notwithstanding the scope of these permissible activities, we have not organized nor have we sought to establish any of these types of businesses.
8
The Federal Reserve uses capital adequacy guidelines in its examination and regulation of bank holding companies. If capital falls below minimum guidelines, a bank holding company may, among other things, be denied approval to acquire or establish banks or non-bank businesses. See "Management's Discussion and Analysis of Financial Condition and Results of Operations - Capital Sources."
Bank Regulation
The Bank is an Indiana banking corporation and a member of the Federal Reserve System. As a state-chartered member bank, we are subject to the examination, supervision, reporting and enforcement jurisdiction of the IDFI, as the chartering authority for Indiana banks, and the Federal Reserve as the primary federal bank regulatory agency for state-chartered member banks. Our deposit accounts are insured by the Bank Insurance Fund of the FDIC, which also has jurisdiction over Bank Insurance Fund insured banks.
These agencies, and federal and state law, extensively regulate various aspects of the banking business including, among other things:
|
|
·
|
permissible types and amounts of loans,
|
|
|
·
|
investments and other activities,
|
|
|
·
|
capital adequacy,
|
|
|
·
|
branching,
|
|
|
·
|
interest rates on loans and on deposits,
|
|
|
·
|
the maintenance of noninterest bearing reserves on deposit, and
|
|
|
·
|
the safety and soundness of banking practices.
|
Federal law and regulations, including provisions added by the Federal Deposit Insurance Corporation Improvement Act of 1991 and regulations promulgated thereunder, establish supervisory standards applicable to the lending activities of the Bank, including internal controls, credit underwriting, loan documentation, and loan-to-value ratios for loans secured by real property.
The Bank is subject to certain federal and state statutory and regulatory restrictions on any extension of credit to Tower Financial Corporation or any of our subsidiaries, on investments in our stock or other securities of our subsidiaries, and on the acceptance of our stock or other securities of our subsidiaries as collateral for loans to any person. Limitations and reporting requirements are also placed on extensions of credit by the Bank to its directors and officers, to our directors and officers and to the directors and officers of our subsidiaries, to our principal stockholders, and to “related interests” of such persons. In addition, such legislation and regulations may affect the terms upon which any person becoming a director or officer of Tower Financial Corporation or one of our subsidiaries or a principal stockholder of Tower Financial Corporation may obtain credit from banks with which we maintains a correspondent relationship. Also, in certain circumstances, an Indiana banking corporation may be required by order of the Department to increase our capital or reduce the amount of our deposits.
The federal banking agencies have published guidelines implementing the FDIC’s requirement that the federal banking agencies establish operational and managerial standards to promote the safety and soundness of federally insured depository institutions. The guidelines establish standards for internal controls, information systems, internal audit systems, loan documentation, credit underwriting, interest rate exposure, asset growth, and compensation, fees and benefits. In general, the guidelines prescribe the goals to be achieved in each area, and each institution is responsible for establishing its own procedures to achieve those goals. If an institution fails to comply with any of the standards set forth in the guidelines, the institution’s primary federal bank regulator may require the institution to submit a plan for achieving and maintaining compliance. The preamble to the guidelines states that the agencies expect to require a compliance plan from an institution whose failure to meet one or more of the standards is of such severity that it could threaten the safe and sound operation of the institution. Failure to submit an acceptable compliance plan, or failure to adhere to a compliance plan that has been accepted by the appropriate regulator, would constitute grounds for further enforcement action.
9
Insurance of Deposit Account: As an FDIC-insured institution, the Bank is required to pay deposit insurance premiums based on the risk it poses to the Bank Insurance Fund. The FDIC also has authority to raise or lower assessment rates on insured deposits to achieve the statutorily required reserve ratios in insurance funds and to impose special additional assessments. The FDIC has utilized a risk based assessment system beginning in 2008. Under this system, the banks are evaluated based on three primary sources of information: supervisory ratings, financial ratios, and long-term debt issuer ratings (for large institutions only). Due to a large number of bank failures throughout the United States in 2008 and 2009, the FDIC deposit insurance fund has been depleted and requires additional assessments to replenish the fund to an acceptable level. Premiums have not only increased to replenish the fund, but because of additional operating expenses the FDIC will incur due to increased resolution activities expected in the future.
Also, in 2008, the FDIC increased the limit of insured funds to $250,000 on interest bearing deposits and an unlimited amount on non-interest bearing deposits compared to the previous limit of $100,000 on all deposits. In 2010, these new limits were extended through December 31, 2010 for unlimited insurance on non-interest bearing accounts and were permanently implemented on all deposit accounts up to $250,000 to ease the fears of banking customers after the recent bank failures over the past two years. Based on these additional costs, the FDIC raised the assessment rates in 2009, assessed a one-time special assessment due September 30, 2009 equal to five basis points of total assets less Tier 1 Capital, and issued an assessment to prepay the quarterly assessments for the fourth quarter 2009, and for all 2010, 2011 and 2012 along with the quarterly risk-based assessment for the third quarter of 2009 on December 30, 2009. The prepayment was calculated by using the rate in effect at September 30, 2009 with an increase in the annual assessments of three basis points beginning in 2011. The FDIC also assumed that the institution’s assessment base at September 30, 2009 will increase quarterly by an annual growth rate of five percent through the end of 2012. The FDIC began drawing down prepaid assessments on March 30, 2010, representing payment for the regular quarterly risk-based assessment for the fourth quarter of 2009. Each institution will continue to receive quarterly assessment statements from the FDIC and will continue to expense the assessment as they have in the past, but the institution’s quarterly risk-based deposit insurance assessments thereafter would be paid from the amount the institution had prepaid until that amount was exhausted or until December 30, 2014, when any amount remaining would be returned to the institution. The remaining balance in the prepaid FDIC assessment account was $2.9 million as of December 31, 2010.
Consumer and Other Laws: The Bank’s business includes making a variety of types of loans to individuals. In making these loans, the Bank is subject to state usury and regulatory laws and to various federal statutes, such as the Equal Credit Opportunity Act, the Fair Credit Reporting Act, the Truth in Lending Act, the Real Estate Settlement Procedures Act and the Home Mortgage Disclosure Act, as well as the regulations promulgated thereunder, which prohibit discrimination, specify disclosures to be made to borrowers regarding credit and settlement costs and regulate the mortgage loan servicing activities of the Bank, including the maintenance and operation of escrow accounts and the transfer of mortgage loan servicing. The Riegle Act imposed new escrow requirements on depository and non-depository mortgage lenders and services under the National Flood Insurance Program. In receiving deposits, the Bank is subject to extensive regulation under state and federal law and regulations, including the Truth in Savings Act, the Expedited Funds Availability Act, the Bank Secrecy Act, the Electronic Funds Transfer Act, and the Federal Deposit Insurance Act. Violation of these laws could result in the imposition of significant damages and fines upon the Bank, its directors and officers.
The Gramm-Leach-Bliley Act (or "Gramm-Leach") which was signed into law on November 12, 1999 and contains provisions intended to safeguard consumer financial information in the hands of financial service providers by, among other things, requiring these entities to disclose their privacy policies to their customers and allowing customers to "opt out" of having their financial service providers disclose their confidential financial information to non-affiliated third parties, subject to certain exceptions. Final regulations implementing the new financial privacy regulations became effective during 2001. Similar to most other consumer-oriented laws, the regulations contain some specific prohibitions and require timely disclosure of certain information.
Under the Community Reinvestment Act (or “CRA”) and the implementing regulations, the Bank has a continuing and affirmative obligation to help meet the credit needs of its local community, including low- and moderate-income neighborhoods, consistent with the safe and sound operation of the institution. The CRA requires the Board of Directors of financial institutions, such as the Bank, to adopt a CRA statement for each assessment area that, among other things, describes its efforts to help meet community credit needs and the specific types of credit that the institution is willing to extend. The Bank’s service area is designated as all of Allen County and Warsaw, Indiana. The Bank’s Board of Directors is required to review the appropriateness of this delineation at least annually. The CRA also requires that all financial institutions publicly disclose their CRA ratings. The Bank received a "satisfactory" rating on its most recent CRA performance evaluation.
10
USA Patriot Act of 2001: On October 6, 2001, the "Uniting and Strengthening America by Providing Appropriate Tools Required to Intercept and Obstruct Terrorism (USA Patriot) Act of 2001" was enacted. The statute increased the power of the United States Government to obtain access to information and to investigate a full array of criminal activities. In the area of money laundering activities, the statute added terrorism, terrorism support, and foreign corruption to the definition of money laundering offenses and increased the civil and criminal penalties for money laundering; applied certain anti-money laundering measures to United States bank accounts used by foreign persons; prohibited financial institutions from establishing, maintaining, administering or managing a correspondent account with a foreign shell bank; provided for certain forfeitures of funds deposited in United States interbank accounts by foreign banks; provided the Secretary of the Treasury with regulatory authority to ensure that certain types of bank accounts are not used to hide the identity of customers transferring funds and to impose additional reporting requirements with respect to money laundering activities; and included other measures. On October 28, 2002, the Department of Treasury issued a final rule concerning compliance by covered United States financial institutions with the new statutory anti-money laundering requirement regarding correspondent accounts established or maintained for foreign banking institutions, including the requirement that financial institutions take reasonable steps to ensure that correspondent accounts provided to foreign banks are not being used to indirectly provide banking services to foreign shell banks. The Company believes that compliance with the new requirements has not had a material adverse impact on its operations or financial condition.
Written Agreement: On May 5, 2010, Tower Financial Corporation and its wholly owned subsidiary, Tower Bank & Trust Company, entered into a written agreement with the Federal Reserve and the IDFI, effective April 23, 2010 (the “Written Agreement”). A Written Agreement is a process employed by the Federal Reserve and the IDFI to memorialize certain understandings with the Company and the Bank, in this case flowing from a fall 2009 joint Federal Reserve and IDFI examination, based upon June 30, 2009 financial position and operating results. A Written Agreement typically addresses all of the major aspects of a financial institution’s financial and operating metrics, including capital requirements, asset quality, management, earnings and liquidity, whether or not identified as requiring improvement.
The following description is only a summary of the Written Agreement and does not purport to be a complete description of all of its terms, and the summary is, therefore, qualified in its entirety by reference to the Written Agreement that is filed as an exhibit to our Current Report on Form 8-K filed on May 5, 2010.
Among other things, the Written Agreement requires the Company and the Bank:
|
·
|
to review and revise its loan policies with regard establishing interest rate reserves; time frame for new appraisals, and its internal loan grading system.
|
|
·
|
to develop enhanced approval processes for the renewal of credit to any borrower who has a loan or other extension of credit on its internal watch list.
|
|
·
|
to expand the level of detail for all asset improvement plans and the process of reporting such plans to its Board of Directors.
|
|
·
|
to enhance the level of Board of Director oversight and review of pertinent operating and financial metrics.
|
|
·
|
to refine and improve its capital contingency plan, so as to continue to remain in excess of those levels required to remain “well capitalized”.
|
|
·
|
to outline and refine its liquidity policy and liquidity funding plan.
|
|
·
|
to not pay dividends on or redeem any of its common or preferred stock or other capital stock, or make any payments of interest on its Trust Preferred Debt, without written approval from the Federal Reserve.
|
In response to the Written Agreement, our Board of Directors, as well as our management teams, adopted various measures that we believe will allow us to continue to preserve capital and mitigate further capital risk in light of our 2009 net loss and our level of non-performing assets, which continues to be elevated compared to historical levels. We have adopted many of these measures in conjunction with extensive discussion with our banking regulators.
11
These measures include:
* We have reviewed and revised our loan policies with regard to how we establish interest rate reserves; we have modified the appropriate time frame for new appraisals for collateral dependent loans; and we have enhanced our internal loan grading system to help ensure timely adjustment of loan risk ratings.
* We have developed enhanced processes for the renewal of credit to any borrower who has a loan or other extension of credit on our internal “watch list”. Our enhanced processes include increased use of expanded cash flow analysis for the entire borrowing relationship, as well as an increased number of loans that require approval by the Board of Directors and/or a committee of the Board.
* We have expanded the level of detail for all asset improvement plans and we have increased the regularity of reporting such plans to the Board in order to improve our ability to reduce both non-performing loans and reduce the number of foreclosed assets on our balance sheet.
* As part of our efforts to ensure complete understanding by the Board and the continued adherence to regulatory guidelines regarding our process for determining our Allowance for Loan and Lease Losses (ALLL), we have further enhanced our level of Board review, education, and approval of our ongoing methodology.
* We have further refined our Capital Contingency Plan and we have established new internal minimum capital levels that are in excess of those required by the regulators to remain “well capitalized”. The plan provides that our Total Risk-Based Capital Ratio should be equal to or greater than 10.5% and our Leverage Ratio should be equal to or greater than 7.0% for the Company. As of December 31, 2010, the Company’s Total Risk-Based Capital Ratio and Leverage Capital Ratio were 14.30% and 10.55%, respectively compared to 12.45% and 9.05%, respectively, at December 31, 2009. (See Note 15 to the Financial Statements for further discussion of our ratios).
* We have further refined and outlined the Company’s Liquidity Policy and Liquidity Funding Plan, and, given the uncertainty in the marketplace and exposure to increasing interest rates in the future, we have enhanced the monitoring, analysis, and reporting of our cash flow and interest rate forecast.
* The Company will not pay dividends on our common stock, the Series A Convertible Preferred Stock or other capital stock, or make any payments of interest on our Trust Preferred Debt without written approval from the Federal Reserve. As of the date of this Form 10-K, we are not planning to pay dividends on our common stock or our Series A Convertible Preferred Stock in the near future and we have elected to defer payment of interest on the Trust Preferred Debt indefinitely, as allowed by the Trust Preferred debenture agreements per the requirements discussed in the Written Agreement. Furthermore, the Company will not incur additional indebtedness without the prior approval of the Federal Reserve.
The measures above have been implemented by the Bank and our being monitored internally, as well as externally by our regulators. As discussed in greater detail in Item 7, “Management’s Discussion and Analysis of Financial Condition and Results of Operation,” we have seen an improvement in our overall financial condition as of December 31, 2010 compared to December 31, 2009, which can be partially attributed to the implementation of these measures.
Competition
All phases of the business of the Bank are highly competitive. The Bank competes with numerous financial institutions, including other commercial banks in the greater Fort Wayne, Warsaw, Allen County and Kosciusko County market areas in Northeast Indiana. In 2008 five new banks entered the market, while one left during 2009, bringing the total banking institutions, excluding credit unions, to twenty-two. The new banks include regional banks: Huntington National Bank and Old National Bank, along with community banks: First Federal of the Midwest, State Bank & Trust, and Woodforest National. Additionally, during the latter portion of 2008, National City Bank, a large regional bank that currently ranks third in our marketplace in total deposit share, was purchased by PNC Financial Services Group. Locally, the formal name change to PNC Bank took place during the second quarter of 2010. The Bank, along with other commercial banks, competes with respect to its lending activities and competes in attracting demand deposits. The Bank also faces competition from thrift institutions, credit unions and other banks as well as finance companies, insurance companies, mortgage companies, securities brokerage firms, money market funds, trust companies and other providers of financial services. Many of the Bank’s competitors have been in business for many years longer than the Bank, have established customer bases, and are larger and have larger lending limits than the Bank. The Bank competes for loans principally through its ability to communicate effectively with its customers and understand and meet their needs. The Bank offers personal attention, professional service, off-site ATM capability and competitive interest rates. Management believes that its personal service philosophy enhances the Bank’s ability to compete favorably in attracting individuals and small- to medium-sized businesses. Since 2002, the Bank has ranked fourth in our Allen County market-place in total deposit share and currently comprises 10.78% of the total marketshare. The top three, JP Morgan Chase & Co., Wells Fargo & Company, and PNC Financial Services Group, comprise 55.56% of the total marketshare.
12
Employees
As of December 31, 2010, we had 156 employees, including approximately 150.75 full-time equivalents. None of our employees are covered by a collective bargaining agreement. Management believes that its relationship with our employees is good.
Statistical Disclosure
The statistical disclosure concerning the Company and the Bank, on a consolidated basis, is included in Item 7 of this report.
Available Information
Our annual reports on Form 10-K, quarterly reports on Form 10-Q, current reports on Form 8-K and amendments to those reports filed or furnished pursuant to Section 13(a) or 15(d) of the Exchange Act are available or may be accessed free of charge on the Securities and Exchange Commissions website under the symbol “TOFC,” at www.sec.gov, as well as through the Tower Financial Corporation Investor Relations section of the Company's Internet website at www.tofc.net.
The following corporate governance documents are also available through the TOFC Investor Relations section of our Internet website, or may be obtained in print form by written request addressed to Secretary, Tower Financial Corporation, 116 East Berry Street, Fort Wayne, Indiana 46802: Code of Business Conduct and Ethics, Audit Committee Charter, Compensation Committee Charter, and Nominating and Corporate Governance Committee Charter. The Company intends to post any amendments to the foregoing documents on its website and will report any waivers of the Code for directors and executive officers on a Current Report on Form 8-K.
|
ITEM 1a.
|
RISK FACTORS.
|
An investment in shares of our common stock involves various risks. Before deciding to invest in our common stock, you should carefully consider the risks described below in conjunction with the other information in this annual report on Form 10-K and information incorporated by reference into this annual report on Form 10-K, including our consolidated financial statements and related notes. Our business, financial condition and results of operations could be harmed by any of the following risks or by other risks that have not been identified or that we may believe are immaterial or unlikely. The value or market price of our common stock could decline due to any of these risks, and you may lose all or part of your investment. The risks discussed below also include forward-looking statements, and our actual results may differ substantially from those discussed in these forward-looking statements.
A prolonged economic downturn in the financial industry and the domestic and international credit markets may adversely affect our operations and our stock price.
A prolonged general economic downturn in the financial services industry resulted in uncertainty in financial markets throughout 2009 and 2010. In addition, as a consequence of the recession that the United States is now working its way out of, business activity across a wide range of industries face serious difficulties due to the lack of consumer spending and the extreme lack of liquidity in the global credit markets. Unemployment has also increased significantly.
The general economic downturn caused uncertainty in the financial markets over the past couple of years. Commercial, as well as consumer loan portfolio performances, deteriorated at many institutions and the competition for deposits and quality loans increased significantly. In addition, the values of real estate collateral supporting many commercial loans and home mortgages declined. Bank and bank holding company stock prices have been negatively affected, as has the ability of banks and bank holding companies to raise capital or borrow in the debt markets compared to recent years. As a result, there is a potential for new federal or state laws and regulations regarding lending and funding practices and liquidity standards, and bank regulatory agencies are expected to be very aggressive in responding to concerns and trends identified in examinations, including the expected issuance of many formal enforcement orders. Negative developments in the financial industry and the domestic and international credit markets, and the impact of new legislation in response to those developments, may negatively impact our operations by restricting our business operations, including our ability to originate or sell loans, and adversely impact our financial performance or our stock price.
13
We operate in a highly regulated banking environment and we may be adversely affected by changes in laws and regulations or by the actions of our regulators.
Tower Bank is subject to extensive regulation, supervision and examination by the IDFI, the Federal Reserve and the FDIC, as insurer of its deposits. Such regulation and supervision govern the activities in which a financial institution and its holding company may engage, and are intended primarily for the protection of the depositors and borrowers of Tower Bank and for the protection of the FDIC insurance fund. The regulation and supervision by the Federal Reserve, the IDFI and the FDIC are not intended to protect the interests of investors in our common stock. Regulatory authorities have extensive discretion in their supervisory and enforcement activities, including the imposition of restrictions on our operations, the adverse classification of our assets and determination of the level of our allowance for loan losses. Any change in such regulation and oversight, whether in the form of regulatory policy, regulations, legislation or supervisory action, including enforcement actions, may have a material impact on our operations. In addition, the Sarbanes-Oxley Act of 2002, and the related rules and regulations promulgated by the Securities and Exchange Commission and Nasdaq that are applicable to us, have, in recent years, increased the scope, complexity and cost of corporate governance, reporting and disclosure practices, including the costs of completing our audit and maintaining our internal controls.
Additionally, congress and federal regulatory agencies continually review banking laws, regulations and policies for possible changes. Statutes and regulations affecting our business may be changed at any time and the interpretation of these statutes and regulations by examining authorities may also change. There can be no assurance that such changes to the statutes and regulations or to their interpretation will not adversely affect our business. Such changes could subject us to additional costs, limit the types of financial services and products we may offer and/or increase the ability of non-banks to offer competing financial services and products, among other things. In addition to governmental supervision and regulation, we are subject to changes in other federal and state laws, including changes in tax laws, which could materially affect the banking industry.
We have relatively high amounts of commercial, commercial real estate and development loans, and these loans have more credit risk than residential mortgage loans.
We generally invest a greater proportion of our assets in loans secured by business assets and commercial real estate than financial institutions that invest a greater proportion of their assets in loans secured by single-family residences. Commercial real estate, commercial business and development loans generally involve a higher degree of credit risk than residential mortgage lending, due primarily to the relatively larger amounts loaned to individual borrowers. While we did not engage in the business of sub-prime lending, our construction, land development and land loan portfolio, along with our commercial loan portfolio and certain of our other loans, has been adversely affected by the recent downturn in the residential and commercial real estate market. Moreover, many of our borrowers also have more than one commercial real estate, commercial business or development loan outstanding with us or with other institutions, and the turmoil in the credit markets has made it more difficult for them to continue and sustain their prior business levels, thereby reducing their available cash flows. Consequently, an adverse development with respect to one loan or one credit relationship could expose us to a significantly greater risk of loss and could have a material adverse impact on our business and results.
We have an elevated amount of non-performing assets, which has affected and could continue to adversely affect our net interest margin and our results.
A loan is considered non-performing when full collection of principal and interest in accordance with the loan contract is not probable. Although the level of non-performing assets increased from $21.1 million at December 31, 2009 to $27.8 million at December 31, 2010, the primary reason for the increase is due to new proposed guidance on trouble debt restructured loans, which increased by $5.6 million. While we believe our loan portfolio is improving, there is still an elevated level of non-performing assets on our books. These and other non-performing loans, even if they are eventually collected, in whole or in part, take longer periods of time to work out, which result in loss of income and/or principal during the workout period, and also require additional resources.
14
We may be required to make further increases in our provision for loan losses and to charge-off additional loans in the future, especially due to our level of non-performing assets.
For the year ended December 31, 2010, we recorded $4.7 million in provision for loan losses compared to $10.7 million in 2009. Net charge-offs were $3.9 million in 2010 compared to $9.8 million in 2009. Our non-performing assets remain at elevated levels, which was indicative of the recessionary period in the economy and/or our local real estate market, which we are working are way out of. As such, some of our currently performing assets may not continue to perform according to their terms, and the value of the collateral may become insufficient to pay the remaining loan balances. If this occurs, we may experience additional loan losses, which could have a negative effect on our results of operations. Like all financial institutions, we maintain an allowance for loan losses to provide for loans in our portfolio that may not be repaid in their entirety. We believe that our allowance for loan losses is maintained at a level adequate to absorb probable losses inherent in our loan portfolio as of the corresponding balance sheet date. However, our allowance for loan losses may not be sufficient to cover actual loan losses, and future provisions for loan losses could materially adversely affect our operating results.
In evaluating the adequacy of our allowance for loan losses, we consider numerous quantitative factors, including our historical charge-off experience, status of our loan portfolio, changes in the composition of our loan portfolio and the volume of delinquent and classified loans. In addition, we use information about specific borrower situations, including their financial position and estimated collateral values, to estimate the risk and amount of loss for those borrowers. Finally, we also consider many qualitative factors, including general and economic business conditions, anticipated duration of the current business downturn, current general market collateral valuations, trends apparent in any of the factors we take into account and other matters, which are, by nature, more subjective and fluid. Our estimates of the risk of loss and amount of loss on any loan are complicated by the significant uncertainties surrounding our borrowers’ abilities to successfully execute their business models through changing economic environments, competitive challenges and other factors. Because of the degree of uncertainty and susceptibility of these factors to change, our actual losses may vary from our current estimates.
Federal regulators, as an integral part of their examination process, periodically review our allowance for loan losses and may require us to increase our allowance for loan losses by recognizing additional provisions for loan losses charged to expense, or to decrease our allowance for loan losses by recognizing loan charge-offs. Any such additional provisions for loan losses or charge-offs, as required by these regulatory agencies, could have a material adverse effect on our financial condition and results of operations.
We may be required to raise additional capital in the future, but that capital may not be available when it is needed.
We are required by federal regulatory authorities to maintain adequate levels of capital to support our operations. We anticipate that we have sufficient capital resources to satisfy our capital requirements for the foreseeable future. We may at some point, however, need to raise additional capital to support our continued growth. If we raise capital through the issuance of additional shares of our common stock or other securities, it would dilute the ownership interests of existing stockholders and may dilute the per share book value of our common stock. New investors may also have rights, preferences and privileges senior to our current stockholders which may adversely impact our current stockholders.
Our ability to raise additional capital, if needed, will depend on conditions in the capital markets at that time, which are outside of our control, and on our financial performance. Accordingly, we may not be able to raise additional capital, if needed, on terms acceptable to us. If we cannot raise additional capital when needed, our ability to maintain further or expand our operations through internal growth could be materially impaired.
Liquidity Risk Could Impair Our Ability to Fund Operations and Jeopardize Our Financial Condition.
Liquidity is essential to our business. An inability to raise funds through traditional deposits, brokered deposits, borrowings, the sale of securities or loans and other sources could have a substantial negative effect on our liquidity. Our access to funding sources in amounts adequate to finance our activities or the terms of which are acceptable to us could be impaired by factors that affect us specifically or the financial services industry or economy in general. Factors that could detrimentally impact our access to liquidity sources include a decrease in the level of our business activity as a result of a further downturn in the markets in which our loans are concentrated or adverse regulatory action against us. Our ability to borrow could also be impaired by factors that are not specific to us, such as a disruption in the financial markets or negative views and expectations about the prospects for the financial services industry in light of the recent turmoil faced by banking organizations and the continued deterioration in credit markets.
15
We rely on commercial and retail deposits, brokered deposits, advances from the Federal Home Loan Bank and other borrowings to fund our operations. Although we have historically been able to replace maturing deposits and advances as necessary, we might not be able to replace such funds in the future if, among other things, our results of operations or financial condition or market conditions were to change. In addition, if we fall below the FDIC's thresholds to be considered "well capitalized," we will be unable to continue with uninterrupted access to the brokered funds markets.
Although we consider these sources of funds adequate for our liquidity needs, there can be no assurance in this regard, and we may be compelled to seek additional sources of financing in the future. There can be no assurance additional borrowings, if sought, would be available to us or, if available, would be on favorable terms. Bank and holding company stock prices have been negatively affected by the recent adverse economic trend, as has the ability of banks and holding companies to raise capital or borrow in the debt markets compared to recent years. If additional financing sources are unavailable or not available on reasonable terms, our financial condition, results of operations and future prospects could be materially adversely affected.
We actively monitor the depository institutions that hold our federal funds sold and due from banks cash balances. We are currently not able to provide assurances that access to our cash equivalents and federal funds sold will not be impacted by adverse conditions in the financial markets. Our emphasis is primarily on safety of principal and we diversify our due from banks and federal funds sold among counterparties to minimize exposure to any one of these entities. The financials of the counterparties are routinely reviewed as part of our asset/liability management process. Balances in our accounts with financial institutions in the U.S. may exceed the FDIC insurance limits. While we monitor and adjust the balances in our accounts as appropriate, these balances could be impacted if the financial institutions fail and could be subject to other adverse conditions in the financial markets.
Changes in market interest rates have adversely affected and could continue to adversely affect our financial condition and results of operations.
Our financial condition and results of operations are significantly affected by changes in market interest rates. Our results of operations depend substantially on our net interest income, which is the difference between the interest income that we earn on our interest-earning assets and the interest expense that we may pay on our interest-bearing liabilities. Our interest-bearing assets generally reprice or mature more quickly than our interest-earning liabilities. In 2008, the federal funds rate decreased 400 basis points to a low of 0.25% at December 31, 2008. The rate remained unchanged from December 31, 2008 through December 31, 2010.
In a rising interest rate environment, our net interest margin can be adversely impacted to the extent that our fixed rate loans do not reprice (approximately 54.8% of our loans as of December 31, 2010). We also have interest rate floors on loans, ranging from 0.75% to 1.75% over the Prime Rate, which will hinder net interest margin growth in a rising interest rate environment until the Prime Rate breaks through the floor rates. Also in this situation, rates paid on non-term deposit accounts will rise, thus also decreasing our margin. Additionally, deposit customers may move funds from savings accounts to higher rate certificate of deposit accounts.
In a falling interest rate environment, however, our net interest margin could likewise be negatively affected, as competitive pressures might require us to decrease our lending interest rates, while these same competitive pressures could keep us from further reducing interest payment rates on our deposits. Such movements, therefore, could cause a decrease in our interest rate spread and net interest margin.
We are also subject to reinvestment risk associated with changes in interest rates. Changes in interest rates may affect the average life of loans and mortgage-related securities. Decreases in interest rates often result in increased prepayments of loans and mortgage-related securities, as borrowers refinance their loans to reduce borrowing costs. Under these circumstances, we are subject to reinvestment risk to the extent that we are unable to reinvest the cash received from such prepayments in loans or other investments that have interest rates that are comparable to the interest on our existing loans and securities. Moreover, increases in interest rates may decrease loan demand, in which event our results of operations may be adversely affected by the amount of non-interest expenses associated with mortgage banking activities, such as salaries and employee benefits, occupancy expense, equipment and data processing costs and other operating costs.
16
Changes in interest rates also affect the value of our interest earning assets and, in particular, our securities portfolio held for investment. Generally, the value of securities fluctuates inversely with changes in interest rates. Decreases in the fair value of securities available for sale, therefore, could have an adverse effect on stockholders’ equity.
Our loan growth, although currently slowed, has historically outpaced our ability to generate lower cost in-market deposits, and this has required us to find alternative funding sources, some of which may either not be available to us or available at greater cost, and which, to the extent thereof, adversely affects our net interest margin.
We must maintain sufficient funds to respond to the needs of our depositors and borrowers. Our loan growth, although currently by design at a maintenance level, has historically outpaced our ability to fund that loan growth with in-market deposits. Accordingly, as part of our liquidity management, we have utilized a number of alternative funding sources. In addition to deposit growth and repayments and maturities of loans and investments, we have utilized various alternative funding sources, such as out-of-market deposits purchased from brokers (typically money market and certificates of deposit), borrowings from the Federal Home Loan Bank, and/or from the issuance of Trust Preferred Securities. If we were to become less than “well capitalized,” as defined by applicable banking regulations, or if a written enforcement order were to be imposed on us by our regulators, it could materially delay, make more costly or restrict our ability to borrow from the FHLB and the Federal Reserve Bank or to acquire and retain brokered certificates of deposit.
Our financial flexibility will be severely constrained if we are unable to maintain our access to funding or if adequate financing is not available to accommodate future growth at acceptable interest rates. Finally, if we are required to rely more heavily on more expensive funding sources to support future growth, our revenues may not increase proportionately to cover our costs. In this case, our operating margins and profitability would be adversely affected.
In 2010, we purposely allowed our loan portfolio to decrease in order to focus on improving asset quality, increasing liquidity, and improving profitability. This decrease in the loan portfolio allowed us to restructure the balance sheet to become more liquid by purchasing investments. During 2010, we strategically purchased brokered certificates of deposit and brokered money markets to lock in low rates for an extended period of time. While this lowered our current net interest margin, it is helping to hedge increases in interest rates on the deposit side, as the terms for new brokered certificate of deposit purchases ranged from two years to ten years, with an average life of just more than six years. The average rate on our brokered certificates of deposit purchases was 3.0%. To offset the increase in interest expense from brokered certificates of deposit, we aggressively reduced our rates on all deposit products to levels still acceptable within the local market and purchased variable rate brokered money market accounts with an average rate of approximately 0.60%. As long-term interest rates begin to increase, the opportunity to hedge interest rate risk is limited.
Increased and/or special FDIC assessments will hurt our earnings.
The FDIC insures deposits at FDIC insured financial institutions, such as the Bank. The FDIC charges the insured financial institutions premiums to maintain the Deposit Insurance Fund at a certain level. Beginning in 2008, the economic environment led to increased levels of bank failures and expectations for further failures, which, in turn, increased the FDIC’s resolution costs and led to a reduction in the Deposit Insurance Fund.
As a result, on October 16, 2008, the FDIC published a restoration plan designed to replenish the Deposit Insurance Fund over a period of five years and to increase the deposit insurance reserve ratio, which had decreased to 1.01% of insured deposits as of June 30, 2008, to the statutory minimum of 1.15% of insured deposits by December 31, 2013. In order to implement the restoration plan, the FDIC significantly increased both its risk-based assessment system and its base assessment rates charted to financial institutions for deposit insurance. Commencing with the first quarter of 2009, our FDIC deposit assessment rates increased to an annualized level of $2,059,524 in 2010 and $1,681,862 in 2009, compared to $697,063 for 2008, and this has and will continue to negatively impact our earnings. Moreover, the FDIC required all institutions to prepay their assessments for the fourth quarter of 2009 and all of 2010, 2011 and 2012. As a result, we were required to make a payment of $5.5 million on December 30, 2009, which we recorded as a prepaid expense and started to amortize the expense over the three year assessment period. As of December 31, 2010 the remaining prepaid expense was $2.9 million.
17
Payment of dividends will depend on our future financial condition and performance and may be restricted.
Dividends on our capital stock, including our common stock and our Series A Convertible Preferred Stock, is strictly prohibited by the Written Agreement with the Federal Reserve and the IDFI. For details regarding the Written Agreement, refer to the “Bank Regulation — Written Agreement” section of Item 1, “Business”. Once our Written Agreement restrictions are lifted, any future dividends will depend upon the Board’s assessment of our operating and financial condition, projected cash needs, contractual restrictions and any further restrictions imposed on us by our banking regulators.
From time to time, we may also become a party to financing agreements or other contractual arrangements that may have the effect of limiting or prohibiting the Company from declaring or paying dividends. We have issued Trust Preferred Securities that prevent us from paying dividends on our capital stock in the event that we defer our interest payment obligations on the Trust Preferred Debt. In February 2010, we notified the trustees of the Trust Preferred Securities that we elected to defer interest payments on the securities indefinitely since the first quarter of 2010. Therefore, we did not pay dividends in 2010 and will not be able to pay dividends on our capital stock until, at a minimum, we pay the interest due on the Trust Preferred Securities.
Technological advances may adversely impact Tower Financial Corporation’s business.
The banking industry is undergoing technological changes with frequent introductions of new technology-driven products and services. In addition to improving customer services, the effective use of technology increases efficiency and enables financial institutions to reduce costs. Our future success will depend, in part, on our ability to address the needs of our customers by using technology to provide products and services that will satisfy customer demands for convenience as well as to create additional efficiencies in our operations. Many of our competitors have substantially greater resources than we do to does to invest in technological improvements. We may not be able to effectively implement new technology-driven products and services or successfully market such products and services to our customers.
A breach of information security or a breakdown in our data storage and distribution systems could adversely affect our earnings.
Increasingly, we depend upon data processing, communication and information exchange on a variety of computing platforms and networks, and over the Internet. We cannot be certain that all of our systems are entirely free from vulnerability to attack or that they may not from time to time malfunction, due either to human error or mechanical failure, despite safeguards we have instituted. In addition, we rely on the services of a variety of vendors to meet our data processing and communication needs. If information security is breached, information can be lost or misappropriated, resulting in financial loss or costs to us or damages to others. These costs or losses could materially exceed the amount of insurance coverage, if any, which could adversely affect our earnings.
Strong competition within the Bank’s market area has hurt and could continue to hurt our profits and slow our growth.
Competition in our banking and financial services competitive market area, both in making loans and in attracting deposits, is intense, and our profitability depends upon our continued ability to successfully compete in both arenas. We compete in the greater Fort Wayne, Warsaw, Allen County and Kosciusko County market areas of Northeast Indiana, with numerous commercial banks, savings and loan associations, credit unions, finance companies, insurance companies, and brokerage and investment banking firms. Many of these competitors have substantially greater resources and lending limits than we do and may offer certain services that we do not or cannot provide. The financial services industry could become even more competitive as a result of legislative, regulatory and technological changes and continued consolidation.
Our ability to compete successfully depends on a number of factors, including, among other things:
|
|
·
|
Our ability to develop, maintain and build upon long-term customer relationships based on quality service, high ethical standards and safe, sound assets.
|
|
|
·
|
Our ability to maintain and expand our market position.
|
|
|
·
|
The scope, relevance and pricing of our products and services offered to meet customer needs and demands.
|
18
|
|
·
|
The rate at which we introduce new products and services relative to our competitors.
|
|
|
·
|
Customer satisfaction with our level of service.
|
|
|
·
|
Industry and general economic trends.
|
Failure to perform in any of these areas could significantly weaken our competitive position, which could adversely affect our growth and profitability, which, in turn, could have a material adverse effect on our financial condition, results of operations and cash flows.
Price competition for loans and deposits might result in the Bank earning less on loans and paying more for deposits, which would reduce net interest income and adversely affect our results. Competition also may make it more difficult to attract deposits and, consequently, to grow loans.
The continuing concentration of loans in our primary market areas, and the decreased value of real estate and business assets in our market area, may result in further under collateralization of some of our loans, which could have a material adverse effect on us.
Our success depends primarily on the general economic condition within the metropolitan Fort Wayne, Warsaw, Allen County, and Kosciusko County market areas in Northeast Indiana in which we conduct our business. Unlike large banks that are more geographically diversified, we provide banking and financial services to customers primarily in our market area. Local economic conditions in our market areas, therefore, have a significant impact on our loans, the ability of the borrowers to repay these loans, and the value of the collateral securing these loans. A continuation of the decline or a further deteriorization in general economic conditions in our market area caused by the loss of manufacturing and other jobs, decline in real estate market values, unemployment and other factors beyond our control, could further adversely affect the ability of our customers to repay their loans and, therefore, our financial condition and results of operations. Additionally, because we have a significant amount of commercial real estate development and construction loans, decreases in housing demand brought about by a loss of jobs, an increase in homes in foreclosure or otherwise available for sale on the market and a reduction in demand for new housing may also have a negative affect on the ability of some of our borrowers to make timely repayment of their loans, which could have an adverse impact on our earnings. Moreover, further decrease in asset quality could require additions to our allowance for loan losses through increased provisions for loan losses, which would reduce our profits.
We face risks entering new markets or establishing new branches.
There are substantial costs associated with maintaining a banking facility, including the cost of construction, land purchases (if owned) or lease commitments (if leased), equipping the facility, staffing commitments and marketing costs. If we are not successful in establishing a customer base and conditions that enable us to profitably operate that facility, we may be forced to either sustain continuing losses or to close the facility.
In May 2010, we opened a branch on the North side of Fort Wayne. While there are several banks that have already established themselves in that market, we have improved our position by replacing a leased branch located in a strip mall with a free standing branch that is more visible to passing traffic at the same intersection.
In general, we believe our ability to compete in the market and realize an appropriate return to stockholders depends on the local economy and how the consumers react to our brand. Competition for loans and deposits may have adverse affects on our net interest income as well.
We operate in a highly regulated environment and we may be adversely affected by changes in laws and regulations.
We are subject to extensive regulation, supervision and examination by the IDFI, the FDIC, as insurer of our deposits, by the Board of Governors of the Federal Reserve System, as regulator of our Bank and holding company and by the U.S. Congress and the Indiana General Assembly. Such regulation and supervision governs the activities in which a banking institution and its holding company may engage, and are intended primarily for the protection of the insurance fund and depositors. Regulatory authorities have extensive discretion in their supervisory and enforcement activities, including the imposition of restrictions on our operations, the classification of our assets and determination of the level of our allowance for loan losses. Any change in such regulation and oversight, whether in the form of regulatory policy, regulations, legislation or supervisory action, may have a material impact on our operations.
19
We are subject to heightened regulatory scrutiny with respect to Bank Secrecy and Anti-Money Laundering statutes and regulations.
In recent years, regulators have intensified their focus on the USA Patriot Act’s Anti-Money Laundering and Bank Secrecy Act compliance requirements. There is also increased scrutiny of our compliance with the rules enforced by the Office of Foreign Assets Control. In order to comply with regulations, guidelines and examination procedures in this area, we are required to adopt new policies and procedures and to install new systems. We cannot be certain that the policies, procedures and systems we have in place or may in the future put in place are or will be flawless. Therefore, there is no assurance that in every instance we are and will be in full compliance with these requirements.
We Rely on Dividends from Our Subsidiary for Most of Our Revenue
Because we are a holding company with no significant assets other than the Bank and its subsidiary, the Trust Company, we typically depend upon dividends from one or both of these entities for a substantial portion of our revenues. Our ability to pay dividends, internally or to stockholders, is currently prohibited by the Written Agreement. For details regarding the Written Agreement, refer to the “Bank Regulation — Written Agreement” section of Item 1, “Business”. Once this is lifted, our ability to pay dividends to our stockholders will therefore continue to depend in large part upon our receipt of dividends or other capital distributions from the Bank.
From time to time, we may also become a party to financing agreements or other contractual arrangements that may have the effect of limiting or prohibiting us or our bank subsidiary from declaring or paying dividends. Our holding company expenses and interest obligations on our trust preferred securities and corresponding subordinated debt securities issued by us may limit or impair our ability to declare or pay dividends.
We depend heavily on our key banking and management personnel.
Our success depends in part on its ability to attract and retain key executives and to attract and retain qualified and productive banking officers, who have experience both in sophisticated banking matters and in operating small to mid-size banks. These qualities are essential both for effective executive management and also for the growth and expansion of the Bank’s customer base for loans and deposits. Competition for such personnel is strong in the local banking industry, and we compete with many other banks and financial institutions, some of them with financial resources and benefits greater than ours, for such individuals. In this market environment, we may not be successful in attracting or retaining the personnel we require for future growth. We expect to effectively compete in this area by offering financial packages that include incentive-based compensation and the opportunity to join in the rewarding work of building a growing bank.
Our Controls and Procedures May Fail or Be Circumvented
Management regularly reviews and updates our internal controls, disclosure controls and procedures, and corporate governance policies and procedures. Any system of controls, however well designed and operated, is based in part on certain assumptions and can provide only reasonable, not absolute, assurances that the objectives of the system are met. Any failure or circumvention of our controls and procedures or failure to comply with regulations related to controls and procedures could have a material adverse effect on our business, results of operations, cash flows and financial condition.
Recently enacted financial reform legislation will, among other things, create a new Consumer Financial Protection Bureau, tighten capital standards and result in new laws and regulations that are expected to increase our costs of operations.
On July 21, 2010, President Obama signed the Dodd-Frank Wall Street Reform and Consumer Protection Act (the “Dodd-Frank Act”). This new law will significantly change the current bank regulatory structure and affect the lending, deposit, investment, trading and operating activities of financial institutions and their holding companies. The Dodd-Frank Act requires various federal agencies to adopt a broad range of new implementing rules and regulations, and to prepare numerous studies and reports for Congress. The federal agencies are given significant discretion in drafting the implementing rules and regulations, and consequently, many of the details and much of the impact of the Dodd-Frank Act may not be known for many months or years.
Effective one year after the date of enactment is a provision for the Dodd-Frank Act that eliminates the federal prohibitions on paying interest on demand deposits, thus allowing businesses to have interest bearing checking accounts. Depending on competitive responses, this significant change to existing law could have an adverse impact on our interest expense.
20
The Dodd-Frank Act also broadens the base for FDIC deposit insurance assessments. Assessments will now be based on the average consolidated total assets less tangible equity capital of a financial institution, rather than deposits. The Dodd-Frank Act also permanently increases the maximum amount of deposit insurance for banks, savings institutions and credit unions to $250,000 per account, retroactive to January 1, 2008, and non-interest bearing transaction accounts have unlimited deposit insurance through December 31, 2013. The legislation also increases the required minimum reserve ratio for the Deposit Insurance Fund, from 1.15% to 1.35% of insured deposits, and directs the FDIC to offset the effects of increased assessments on depository institutions with less than $10 billion in assets.
The Dodd-Frank Act will require publicly traded companies to give stockholders a non-binding vote on executive compensation and so-called “golden parachute” payments, and authorizes the Securities and Exchange Commission to promulgate rules that would allow stockholders to nominate their own candidates using a company’s proxy materials. It also provides that the listing standards of the national securities exchanges shall require listed companies to implement and disclose “clawback” policies mandating the recovery of incentive compensation paid to executive officers in connection with accounting restatements. The legislation also directs the Federal Reserve to promulgate rules prohibiting excessive compensation paid to bank holding company executives, regardless of whether the company is publicly traded or not. Because we are a smaller reporting company, the requirement for a non-binding vote on executive compensation does not apply to our Company this year.
The Dodd-Frank Act requires minimum leverage (Tier 1) and risk based capital requirements for bank and savings and loan holding companies that are no less than those applicable to banks, which will exclude certain instruments that previously have been eligible for inclusion by bank holding companies as Tier 1 capital, such as trust preferred securities. Because our Bank has assets of more than $500 million and less than $15 billion, trust preferred securities issued before May 19, 2010 will still be considered Tier 1 capital.
It is difficult to predict at this time what specific impact the Dodd-Frank Act and the yet to be written implementing rules and regulations will have on community banks. However, it is expected that at a minimum they will increase our operating and compliance costs and could increase our interest expense.
Our Written Agreement with the Federal Reserve may further impair our operations or restrict our growth.
Pursuant to our Written Agreement with the Federal Reserve, we are subject to significant governmental supervision and regulation as described in the “Bank Regulation — Written Agreement” section of Item 1, “Business” of this Form 10-K. These regulations are intended primarily for the protection of depositors’ funds, federal deposit insurance funds and the banking system as a whole, and not necessarily the stockholders.
21
|
ITEM 1b.
|
UNRESOLVED STAFF COMMENTS.
|
NONE.
|
ITEM 2.
|
PROPERTIES.
|
|
Description
|
Location
|
Own or Lease
|
|
Corporate Headquarters
|
Fort Wayne, Indiana (Downtown)
|
Lease
|
|
Dupont Branch
|
Fort Wayne, Indiana (North)
|
Own
|
|
Scott/Illinois Branch
|
Fort Wayne, Indiana (Southwest)
|
Lease
|
|
Stellhorn/Lahmeyer Branch
|
Fort Wayne, Indiana (Northeast)
|
Own
|
|
Waynedale Branch
|
Fort Wayne, Indiana (South)
|
Own
|
|
Covington Branch
|
Fort Wayne, Indiana (Southwest)
|
Own
|
|
Warsaw Branch
|
Warsaw, Indiana (Downtown)
|
Own
|
|
Vacant land for new branch*
|
Fort Wayne, Indiana (Southwest)
|
Own
|
*The new branch will replace the leased Scott/Illinois Branch. Construction is expected to commence in the summer of 2011.
The Bank conducts business through the Corporate Headquarters and the branches. None of the properties we own are subject to any major encumbrances. Our net investment in real estate and equipment at December 31, 2010 was $8.3 million.
|
ITEM 3.
|
LEGAL PROCEEDINGS.
|
We may be involved from time to time in various routine legal proceedings incidental to its business. We are not currently engaged in any material legal proceeding, nor are we currently aware any of threatened claim or legal proceeding that we would expect to have a material adverse effect on our results of operations or financial position.
22
PART II
|
ITEM 4.
|
(Removed and Reserved)
|
|
ITEM 5.
|
MARKET FOR REGISTRANT’S COMMON EQUITY, RELATED STOCKHOLDER MATTERS, AND ISSUER PURCHASES OF EQUITY SECURITIES.
|
Market Information
Our common stock is traded on the Nasdaq Global Market System under the symbol “TOFC.” As of March 10, 2011, there were 513 stockholders of record and approximately 1,538 beneficial owners of the common stock.
The following table also presents the high and low sales prices for our common stock on the Nasdaq Global Market System, by quarter for 2010 and 2009.
High/Low Stock Price
|
|
2010
|
2009
|
||||||||||||||
|
|
High
|
Low
|
High
|
Low
|
||||||||||||
|
|
||||||||||||||||
|
1st Quarter
|
$ | 8.250 | $ | 6.340 | $ | 6.590 | $ | 4.500 | ||||||||
|
|
||||||||||||||||
|
2nd Quarter
|
$ | 8.150 | $ | 6.090 | $ | 6.360 | $ | 4.650 | ||||||||
|
|
||||||||||||||||
|
3rd Quarter
|
$ | 7.700 | $ | 6.100 | $ | 6.000 | $ | 4.150 | ||||||||
|
|
||||||||||||||||
|
4th Quarter
|
$ | 7.890 | $ | 6.350 | $ | 7.000 | $ | 3.940 | ||||||||
Dividends
Because we are a holding company and substantially all of our assets are held by the Bank, our primary source for dividends has been the Bank. Payments from the Bank to the Company are subject to legal and regulatory limitations, generally based on capital levels and profits, imposed by law and regulatory agencies with authority over the Bank. The ability of the Bank to pay dividends is also subject to its profitability, financial condition, capital expenditures and other cash flow requirements. In addition, under the terms of the debentures issued in connection with certain trust preferred securities due in 2035 and 2037, we would be precluded from paying dividends on our common stock (other than dividends in the form of additional shares of common stock) if we are in default under these debentures, if we have exercised our right to defer payments of interest on these debentures, or if certain related defaults occurred. Prior to the sale of the Trust Company to the Bank on December 1, 2009, the Trust Company was able to make small dividend payments to the holding company, such as the $800,000 dividends paid in both 2009 and 2008. There were no dividend payments made in 2010. Our ability to pay dividends to our stockholders continues to depend primarily on the Bank's ability to pay dividends to the Company.
We did not pay cash dividends on our common stock from our inception through calendar 2005. In December 2005, our Board of Directors approved the payment of dividends commencing in calendar 2006. This was based on an analysis of our liquidity needs, regulatory and capital requirements, and results of operations. In 2006, we made four quarterly dividend payments of $0.04 each for a total annual dividend of $0.16 per share. In January 2007, our Board of Directors voted to increase the quarterly dividend by 10% to $0.044 per share. We subsequently made four quarterly dividend payments of $0.044 each for a total annual dividend of $0.176 per share. In the first quarter of 2008, our Board of Directors approved a dividend payment of $0.044. No more dividend payments were made following the first quarter of 2008 through December 31, 2010.
Although, both Tower Financial and Tower Bank are and have been qualified as ‘well capitalized’ under Federal Reserve Standards, our Board of Directors passed a resolution in January 2008 requiring that written approval be received from the Federal Reserve before declaring or paying any corporate dividends. Permission was granted in January 2008 by the Federal Reserve and a quarterly dividend of $0.044 was declared and paid for the first quarter of 2008. In the second quarter of 2008, however, our Board of Directors elected to forego the declaration of dividends indefinitely. The decision was based on the desire to retain capital and hedge against uncertain and challenging economic and banking industry conditions, as well as to maintain Tower Bank’s current “well capitalized” status within the Federal Reserve System.
23
On May 5, 2010, we entered into a written agreement with the Federal Reserve and the IDFI, effective April 23, 2010 (the “Written Agreement”). For details regarding the Written Agreement, refer to the “Bank Regulation — Written Agreement” section of Item 1, “Business”. One of the requirements in the Written Agreement was that we are not to pay dividends on or redeem any common or preferred stock or other capital stock, or make any payments of interest on its Trust Preferred Debt, without written approval from the Federal Reserve. In response to these requirements, no preferred stock dividends, common stock dividends or Trust Preferred Debt interest payments were made in 2010.
Stockholder Return Performance Graph
Set forth below is a line graph comparing the yearly percentage change in the cumulative total stockholder return on the Company’s Common Stock (based on the last reported sales price of the respective year) with the cumulative total return of the Nasdaq Stock Market Index (United States stocks only) and the Nasdaq Bank Stocks Index for the past five years ending December 31, 2006 – 2010. The following information is based on an investment of $100 on January 29, 1999 in the Company’s Common Stock at the market close on that day, the Nasdaq Stock Market Index and the Nasdaq Bank Stocks Index, with dividends reinvested where applicable.
The comparisons shown in the graph below are based on historical data and the Company cautions that the stock price performance shown in the graph below is not indicative of, and is not intended to forecast, the potential future performance of the Company’s Common Stock.
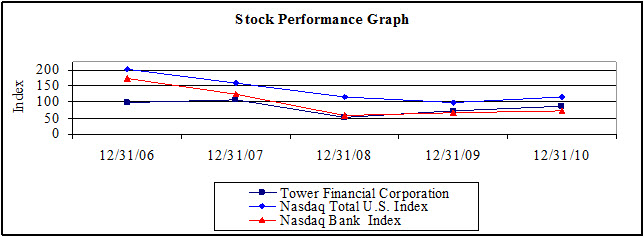
|
For the years ended December 31,
|
||||||||||||||||||||
|
Index
|
12/31/06
|
12/31/07
|
12/31/08
|
12/31/09
|
12/31/10
|
|||||||||||||||
|
Tower Financial Corporation
|
$ | 171.676 | $ | 125.241 | $ | 58.285 | $ | 66.218 | $ | 72.736 | ||||||||||
|
Nasdaq Total US Index
|
97.717 | 105.993 | 51.078 | 73.418 | 87.137 | |||||||||||||||
|
Nasdaq Bank Index
|
201.496 | 159.709 | 116.450 | 97.572 | 115.419 | |||||||||||||||
The foregoing Performance Graph shall not be deemed to be incorporated by reference in any previous or future documents filed by the Company with the Securities and Exchange Commission under the Securities Act of 1933 or the Securities Exchange Act of 1934, except to the extent that the Company specifically incorporates the graph by reference in any such document.
24
|
ITEM 6.
|
SELECTED FINANCIAL DATA.
|
|
Consolidated Summary of Operations and Selected Statistical Data
|
||||||||||||||||||||
|
|
||||||||||||||||||||
|
|
Years ended December 31,
|
|||||||||||||||||||
|
($ in thousands, except per share data)
|
2010
|
2009
|
2008
|
2007
|
2006
|
|||||||||||||||
|
Results of Operations:
|
||||||||||||||||||||
|
Interest income
|
$ | 30,452 | $ | 32,067 | $ | 37,758 | $ | 46,902 | $ | 41,057 | ||||||||||
|
Interest expense
|
8,191 | 12,247 | 16,785 | 25,356 | 20,787 | |||||||||||||||
|
Net interest income
|
22,261 | 19,820 | 20,973 | 21,546 | 20,270 | |||||||||||||||
|
Provision for loan losses
|
4,745 | 10,735 | 4,399 | 10,996 | 2,195 | |||||||||||||||
|
Noninterest income
|
7,814 | 6,088 | 6,303 | 5,805 | 5,126 | |||||||||||||||
|
Noninterest expense
|
21,243 | 22,998 | 20,988 | 20,731 | 18,089 | |||||||||||||||
|
Income (loss) before income taxes
|
4,087 | (7,824 | ) | 1,889 | (4,376 | ) | 5,112 | |||||||||||||
|
Income taxes expense (benefit)
|
923 | (2,217 | ) | 23 | (1,778 | ) | 1,424 | |||||||||||||
|
Net income (loss)
|
3,164 | (5,607 | ) | 1,866 | (2,598 | ) | 3,688 | |||||||||||||
|
|
||||||||||||||||||||
|
Per Share Data:
|
||||||||||||||||||||
|
Net income (loss): basic
|
$ | 0.73 | $ | (1.37 | ) | $ | 0.46 | $ | (0.64 | ) | $ | 0.92 | ||||||||
|
Net income (loss): diluted
|
0.69 | (1.37 | ) | 0.46 | (0.64 | ) | 0.89 | |||||||||||||
|
Book value per common share at end of period
|
11.09 | 11.04 | 12.15 | 11.87 | 12.60 | |||||||||||||||
|
Dividends declared
|
n/a | n/a | 0.044 | 0.176 | 0.16 | |||||||||||||||
|
|
||||||||||||||||||||
|
Balance Sheet Data:
|
||||||||||||||||||||
|
Total assets
|
$ | 659,928 | $ | 680,159 | $ | 696,584 | $ | 706,493 | $ | 671,155 | ||||||||||
|
Total securities held to maturity
|
- | 4,496 | - | - | - | |||||||||||||||
|
Total securities available for sale
|
110,109 | 85,179 | 77,792 | 65,228 | 69,492 | |||||||||||||||
|
Loans held for sale
|
2,141 | 3,842 | 152 | 3,190 | - | |||||||||||||||
|
Total loans
|
486,914 | 527,333 | 561,012 | 575,744 | 550,450 | |||||||||||||||
|
Allowance for loan losses
|
12,489 | 11,598 | 10,655 | 8,208 | 6,870 | |||||||||||||||
|
Total deposits
|
576,356 | 568,380 | 586,237 | 600,689 | 586,770 | |||||||||||||||
|
FHLB advances
|
7,500 | 43,200 | 39,200 | 35,100 | 11,200 | |||||||||||||||
|
Junior subordinated debt
|
17,527 | 17,527 | 17,527 | 17,527 | 17,527 | |||||||||||||||
|
Stockholders' equity
|
53,129 | 46,936 | 49,618 | 48,208 | 50,958 | |||||||||||||||
|
|
||||||||||||||||||||
|
Performance Ratios:
|
||||||||||||||||||||
|
Return on average assets
|
0.48 | % | -0.81 | % | 0.27 | % | -0.38 | % | 0.61 | % | ||||||||||
|
Return on average stockholders' equity
|
6.32 | % | -11.48 | % | 3.81 | % | -5.16 | % | 7.57 | % | ||||||||||
|
Net interest margin (tax equivalent)
|
3.70 | % | 3.14 | % | 3.30 | % | 3.34 | % | 3.58 | % | ||||||||||
|
Efficiency ratio
|
70.63 | % | 88.76 | % | 76.94 | % | 75.80 | % | 71.23 | % | ||||||||||
|
Asset Quality Ratios:
|
||||||||||||||||||||
|
Nonperforming loans to total loans
|
4.75 | % | 3.02 | % | 3.03 | % | 3.23 | % | 0.70 | % | ||||||||||
|
Nonperforming assets to total assets
|
4.22 | % | 3.03 | % | 2.83 | % | 2.84 | % | 0.70 | % | ||||||||||
|
Net charge-offs to average loans
|
0.76 | % | 1.78 | % | 0.35 | % | 1.68 | % | 0.19 | % | ||||||||||
|
Allowance for loan losses to total loans
|
2.56 | % | 2.20 | % | 1.90 | % | 1.43 | % | 1.25 | % | ||||||||||
|
Liquidity and Capital Ratios:
|
||||||||||||||||||||
|
Loan to deposit ratio
|
84.48 | % | 92.78 | % | 95.70 | % | 95.85 | % | 93.81 | % | ||||||||||
|
Total stockholders' equity to total assets
|
8.05 | % | 6.90 | % | 7.12 | % | 6.82 | % | 7.59 | % | ||||||||||
|
Total risk-based capital
|
14.30 | % | 12.45 | % | 12.99 | % | 12.08 | % | 13.06 | % | ||||||||||
|
Tier 1 leverage risk-based capital
|
13.10 | % | 10.90 | % | 11.66 | % | 10.92 | % | 11.94 | % | ||||||||||
|
Tier 1 leverage capital
|
10.55 | % | 9.05 | % | 9.69 | % | 9.31 | % | 10.46 | % | ||||||||||
n/a - not applicable
25
|
ITEM 7.
|
MANAGEMENT’S DISCUSSION AND ANALYSIS OF FINANCIAL CONDITION AND RESULTS OF OPERATION.
|
Introduction
The following discussion presents management’s discussion and analysis of the consolidated financial condition and results of operations of the Company as of December 31, 2010 and 2009 and for the years ended December 31, 2010, 2009 and 2008. This discussion should be read in conjunction with our audited consolidated financial statements and the related notes appearing elsewhere in this report.
Forward-Looking Statements
This report includes "forward-looking statements." All statements regarding our anticipated results or expectations for earnings, revenues, expenses, capital levels, asset quality or other future financial business plans and strategies, or the impact of legal, regulatory or supervisory matters on our business operations, are intended to be forward-looking statements within the meaning of the safe harbor provisions for forward-looking statements contained in the Private Securities Litigation Reform Act of 1995. Typically, forward-looking statements are predictive and are not statements of historical fact, and such words as "anticipates," "believes," "estimates," "seeks," "expects," "plans," "intends," and similar expressions, as they relate to us, the Bank, the Trust Company, or our management, are intended to identify forward-looking statements. Although we believe that the expectations reflected in these forward-looking statements are reasonable and have based these expectations upon reasonable beliefs and assumptions, these expectations may prove to be incorrect. Important factors that could cause actual results to differ materially from our expectations include, without limitation, the following:
|
|
·
|
the impact of a prolonged recession on our asset quality, the adequacy of our allowance for loan losses and the sufficiency of our capital;
|
|
|
·
|
the continued weakness of the local economy in our primary service area;
|
|
|
·
|
the effect of general economic and monetary conditions and the regulatory environment on the Bank’s ability to attract deposits, make loans and achieve satisfactory interest spreads;
|
|
|
·
|
the risk of further loan delinquencies and losses due to loan defaults by both commercial loan customers or a significant number of other borrowers;
|
|
|
·
|
general changes in real estate, business and general property valuations underlying secured loans;
|
|
|
·
|
the level of our non-performing substandard or doubtful assets;
|
|
|
·
|
restrictions or additional capital requirements imposed on us by our regulators; and
|
|
|
·
|
dependence on our key banking and management personnel.
|
Please also refer to the “Risk Factors” section of this report for a discussion of some of the principal risks and uncertainties inherent in our businesses.
Overview
Net income of $3.2 million was reported in 2010 compared to a net loss of $5.6 million in 2009. The $8.8 million increase in earnings from 2009 to 2010 was primarily due to a decrease in provision expense of $6.0 million, an increase in net interest income of $2.4 million, and an increase in the sale of securities coupled with a decrease in the amount of impairment on available for sale securities, which led to the increase in non-interest income by $1.7 million from 2009. Noninterest expenses decreased by $1.8 million, which was primarily due to savings reported in most expense categories totaling $2.2 million, offset by an increase of $377,662 in FDIC premiums. Offsetting these increases was a $3.1 million change from a tax benefit in 2009 to tax expense in 2010.
Net interest income increased 12.3% from 2009 to 2010, due primarily to an increase in net interest margin from 3.14% to 3.70%. In 2009, we implemented interest rate floors on loans, which helped to maintain our net interest margin in 2009 and 2010. The increase in net interest margin in 2010 was due to aggressively reducing deposit rates, while keeping them consistent with local market rates. These actions were in response to short-term interest rates taking a 400 basis point plunge from a fed funds rate of 4.25% to a low of 0.25% in December 2008 where they remained for the entire year of both 2009 and 2010.
Non-interest income increased by $1.7 million from 2009 to 2010 primarily due to a decrease of $592,467 in an other-than-temporary impairment (OTTI) charge on two securities and an increase of $845,631 in the gain on sale of securities. We also experienced increases in trust and brokerage fee income and brokered loan fees of $231,272 and $34,983, respectively.
26
Operating expenses decreased by $1.8 million, or 7.6%, from 2009 to 2010. The decrease was due to a reduction in total employment expense by $1.4 million, a decrease in occupancy and equipment by $372,241, and a decrease in postage and data processing totaling $146,821. Processing decreased in 2010 due to the migration of our core system, which offered more options and created efficiencies in the support functions of the Company. We also outsourced the mailing of monthly account statements to the new core processor, which saved on postage and labor. Offsetting these saving was an increase in FDIC premiums of $377,662. The increase in premiums was twofold. First, premiums increased by approximately $600,000 annually as a result of us being downgraded after entering into a Written Agreement with the Federal Reserve and the IDFI effective in June 2010 per the FDIC. Once the Written Agreement is lifted and we prove we can sustain profitability, we expect to see an approximate savings of $600,000 based on our current deposit base. The second reason for an increase in FDIC premiums was an increase in the use of brokered deposits for funding and electing to participate in the Transaction Account Guaranty (TAG) Program which charges the Company an additional premium to have the entire balance of all noninterest-bearing transaction accounts fully insured by the FDIC. Loan and professional expenses showed a slight decrease of $19,929 in 2010 compared to 2009, but these two years are above what we have reported in past years. In 2010, we incurred additional legal expenses as a result of our Written Agreement with the Federal Reserve and the IDFI. In 2009, we entered into a consulting engagement to have our lending staffing and processes analyzed. The engagement included analyzing current staffing levels and our internal approval processes for commercial and consumer loans. Loan and professional expenses in both 2010 and 2009 also increased from prior years due to additional costs associated with the workout of non-performing assets.
Total assets decreased by $20.2 million, or 3.0%, from the prior year. The purposeful decrease in net loans of $41.3 million partially offset by an increase in total securities by $20.4 million was the primary reason for the decrease in total assets. Asset quality and liquidity continues to be a major focus of the Bank, as we worked to turn our non-performing assets into income producing assets. While non-performing assets increased by $6.8 million from 2009 to 2010, nonaccrual loans have decreased by $526,834 and other real estate owned decreased by $349,826. The primary reason for the increase in nonperforming assets was due to an increase of $5.6 million in troubled debt restructured loans and an increase of $2.1 million on loans greater than 90 days past due and still accruing.
Currently, there are three loan relationships in the troubled debt restructuring category, two commercial real estate loans and one commercial loan. Due to recent proposed guidance on troubled debt restructured loans, we have started reporting two loan relationships, one commercial and one commercial real estate loan, as troubled debt restructured loans. Included in delinquencies greater than 90 days is an accruing $1.8 million loan that has matured. The Bank has elected not to renew the loan and is seeking collection via legal process. For specific details regarding these relationships, refer to the “Results of Operations – Provision for Loan Losses” section of Item 7, “Management’s Discussion and Analysis of Financial Condition and Results of Operation”. The allowance for loan losses increased to 2.56% from 2.20% at December 31, 2009.
During 2010, we strategically purchased brokered certificates of deposit and brokered money markets in excess of the balance in 2009 by $36.8 million. The growth in brokered deposits was purposeful as we took advantage of the favorable rate environment to lock in low rates for an extended period of time. Terms for new brokered certificates of deposit purchases ranged from two years to ten years, with an average life of just more than six years. The average rate on our brokered certificates of deposit purchases was 3.0%. To offset the increase in interest expense from brokered certificates of deposit, we aggressively reduced our rates on all deposit products to levels still acceptable within the local market and purchased variable rate brokered money market accounts with an average rate of approximately 0.60%. These strategic decisions allowed us to grow our net interest margin year-to-date at December 31, 2010 to 3.70% from 3.14% at December 31, 2009, but we lost $830,854 of core deposits from 2009. Core deposits now comprise 74.9% of total deposits, compared to 76.0% in the prior year.
Critical Accounting Policies
The discussion and analysis of our financial condition and results of operations are based upon our consolidated financial statements, which have been prepared in accordance with accounting principles generally accepted in the United States of America. The preparation of these financial statements requires that we make estimates and judgments that affect the reported amount of assets and liabilities, revenues and expenses, and related disclosure of contingent assets and liabilities at the date of our financial statements. Actual results may differ from these estimates under different assumptions or conditions. Certain policies inherently have a greater reliance on the use of estimates, and as such have a greater possibility of producing results that could be materially different than originally reported. Critical accounting policies are defined as those that are reflective of significant judgments and uncertainties, and potentially result in materially different results under different assumptions and conditions. Our critical accounting policies are limited to those described below. For a detailed discussion on the application of these and other accounting policies, see Note 1—Summary of Significant Accounting Policies to the audited consolidated financial statements included in this report.
27
Allowance for Loan Losses.
Our allowance for loan losses represents management’s estimate of probable incurred losses inherent in the loan portfolio at the balance sheet date. Additions to the allowance may result from recording provision for loan losses and recoveries, while charge offs are deducted from the allowance. Allocation of the allowance is made for analytical purposes only, and the entire allowance is available to absorb any loan charged off.
We have an established process for determining the adequacy of the allowance for loan losses that relies on various procedures and pieces of information to arrive at a range of probable outcomes. No single statistic or measurement, in itself, determines the adequacy of the allowance. The allowance has two components: identified specific allocations and a percentage allocation based on loss history for different loan groups.
To determine the allocated component of the allowance, we combine estimated allowances required for specifically identified loans that are analyzed individually and loans that are analyzed on a group basis. First, management allocates specific portions of the allowance for loan losses based on identifiable problem loans. Problem loans are identified through a loan risk rating system and monitored through watchlist reporting. Specific allocations of allowance for loan losses are determined for each identified credit based on delinquency rates, collateral and other risk factors identified for that credit. Second, management’s evaluation of the allowance for different loan groups is based on consideration of actual loss experience, the present and prospective financial condition of our borrowers, industry concentrations within the loan portfolio and general economic conditions. Absent the availability of some of these factors, we base our estimates upon peer industry data of comparable banks. Lastly, the unallocated component of the allowance is maintained to supplement the allocated component and to recognize the imprecision of estimating and measuring loss when evaluating loss allocations for individual loans or pools of loans. The allocated and the unallocated components represent the total allowance for loan losses that under normal circumstances should adequately cover probable incurred losses inherent in the loan portfolio.
Actual loan losses are charged against the allowance when management believes that a loan or a portion thereof is uncollectible. A loan is impaired when full payment under the loan terms is not expected. Impairment is evaluated in the aggregate for smaller-balance loans of a similar nature such as residential mortgage and consumer loans, and on an individual loan basis for other loans. Commercial loans and mortgage loans secured by other properties are evaluated individually for impairment. When analysis of a borrower's operating results and financial condition indicates that underlying cash flows of the borrower's business are not adequate to meet its debt service requirements, the loan is evaluated for impairment. If a loan is impaired, a portion of the allowance is allocated so that the loan is reported, net, at the present value of estimated future cash flows using the loan's existing interest rate or at the fair value of collateral if repayment is expected solely from the collateral.
There are many factors affecting judgment calls relating to allowances for loan losses. Some are quantitative while others require qualitative judgment. Although we believe our process for determining the allowance adequately considers all of the factors that could potentially result in credit losses, the process includes subjective elements and may be susceptible to significant change. To the extent actual outcomes differ from management estimates, additional provision for loan losses could be required that could adversely affect earnings or financial position in future periods.
Results of Operations
Summary
We reported net income of $3.2 million, or $0.69 per diluted share, for the year ended December 31, 2010. This reflects an increase of $8.8 million from a net loss of $5.6 million in 2009 and a $1.3 million increase from net income of $1.9 million posted in 2008. Net income per diluted share of $0.69 reflects an increase of $2.06 from a ($1.37) net loss reported in 2009 and an increase of $0.23 from net income of $0.46 reported in 2008.
Net interest income increased 12.3% from 2009 to 2010, due primarily to an increase in net interest margin from 3.14% to 3.70%. Noninterest income increased by $1.7 million due to an increase of $845,631 in gain on sale of securities and a decrease in the other-than-temporary-impairment charge on two securities of $592,467 compared to 2009. We also experienced an increase in Trust and Brokerage fees of $231,272 and brokered loan fees, consisting primarily of loan brokerage fees, of $34,983. Provision expense decreased in 2010 by $6.0 million compared to 2009, which was directly impacted by a reduction in charge-offs from 2009 to 2010 of $5.9 million. Noninterest expense decreased by $1.8 million due to reductions in salaries and benefits, occupancy and equipment, and office supplies and postage of $1.4 million, $372,241, and $102,292, respectively. These decreases were offset by an increase of $377,662 in FDIC premiums from 2009 to 2010. Loan and professional costs decreased slightly by $19,929, but remain higher than normal due to consulting legal counsel regarding the Written Agreement with the Federal Reserve and the IDFI and collection expenses associated with cleaning up our nonperforming assets. The costs and valuation expenses on other real estate owned showed little change as we had elevated levels of write-downs in both 2010 and 2009 associated with reporting the properties at fair value.
28
Net Interest Income
Net interest income, the difference between revenue generated from earning assets and the interest cost of funding those assets, is our primary source of earnings. Interest income and interest expense for the year ended December 31, 2010 were $30.5 million and $8.2 million, respectively, netting $22.3 million in net interest income. Interest income and interest expense for the year ended December 31, 2009 were $32.0 million and $12.2 million, respectively, netting $19.8 million in net interest income. Interest income and interest expense for the year ended December 31, 2008 were $37.8 million and $16.8 million, respectively, resulting in $21.0 million in net interest income. The increase of $2.4 million in net interest income in 2010 from 2009 was due to an increase in net interest margin, which was offset by elevated levels of non-performing assets and a purposeful decrease in total loans. Through the implementation of interest rate floors on loans in 2009 and 2010, we were able to maintain our net interest margin. The increase in net interest margin in 2010 was due to aggressively reducing deposit rates, while keeping them consistent with local market rates. These actions were in response to short-term interest rates taking a 400 basis point plunge from a fed funds rate of 4.25% to a low of 0.25% in December 2008 where they remained for the entire year of both 2009 and 2010.
The net yield on average earning assets during 2010 was 3.70% compared to 3.14% for 2009 and 3.30% for 2008. The increase in net yield during 2010 was due to continuing to implement the interest rate floor on loans and reducing the deposit rates. These increases to the yield were offset by unchanged short-term interest rates after a 400 basis point drop from January 1, 2008 to December 31, 2008, specifically the fed funds rate, which remained at 0.25% through 2009 and 2010.
Deposit costs also decreased as a result of a shift of certificates of deposit greater than $100,000 to lower-cost core deposits, such as interest bearing checking accounts, savings, and money market accounts which increased by $11.4 million, $4.4 million, and $7.2 million, respectively, since December 31, 2009. Health savings accounts were the primary increase in interest bearing checking as they increased by $14.4 million throughout the year. We also increased our out-of-market funds by adding a new product, brokered money market accounts. During the second half of 2010, we purchased approximately $12.0 million of brokered money market deposits at a variable rate that ranged from 0.55% to 0.60%, which also helped keep our deposit costs down.
The level of net interest income is primarily a function of asset size, as the weighted-average interest rate received on earning assets is greater than the weighted average interest cost of funding sources; however, factors such as types of assets and liabilities, interest rate risk, liquidity, asset quality, and customer behavior also impact net interest income as well as the net yield.
29
The following table reflects the average balance, interest earned or paid, and yields or costs of our assets, liabilities and stockholders’ equity during 2010, 2009, and 2008.
|
Average Balance,
Interest and Yield/
|
2010
|
2009
|
2008
|
|||||||||||||||||||||||||||||||||
|
Cost Analysis
($ in thousands)
|
Average Balance
|
Interest Earned or Paid
|
Yield or Cost
|
Average Balance
|
Interest Earned or Paid
|
Yield or Cost
|
Average Balance
|
Interest Earned or Paid
|
Yield or Cost
|
|||||||||||||||||||||||||||
|
Assets
|
||||||||||||||||||||||||||||||||||||
|
Short-term investments and interest-earning deposits
|
$ | 2,693 | $ | 26 | 0.97 | % | $ | 2,060 | $ | 1 | 0.05 | % | $ | 7,169 | $ | 184 | 2.57 | % | ||||||||||||||||||
|
Federal funds sold
|
2,421 | 5 | 0.21 | % | 7,825 | 12 | 0.15 | % | 6,243 | 154 | 2.47 | % | ||||||||||||||||||||||||
|
Securities - taxable
|
74,285 | 2,502 | 3.37 | % | 63,138 | 3,066 | 4.86 | % | 55,533 | 2,729 | 4.91 | % | ||||||||||||||||||||||||
|
Securities - tax exempt (1)
|
27,614 | 1,624 | 5.88 | % | 23,157 | 1,442 | 6.23 | % | 21,067 | 1,339 | 6.36 | % | ||||||||||||||||||||||||
|
Loans held for sale
|
2,138 | - | 0.00 | % | 2,241 | - | 0.00 | % | 506 | - | 0.00 | % | ||||||||||||||||||||||||
|
Loans
|
508,182 | 26,847 | 5.28 | % | 549,242 | 28,036 | 5.10 | % | 559,794 | 33,808 | 6.04 | % | ||||||||||||||||||||||||
|
Total interest-earning assets
|
617,333 | 31,004 | 5.02 | % | 647,663 | 32,557 | 5.03 | % | 650,312 | 38,214 | 5.88 | % | ||||||||||||||||||||||||
|
Allowance for loan losses
|
(12,663 | ) | (12,655 | ) | (9,118 | ) | ||||||||||||||||||||||||||||||
|
Cash and due from banks
|
17,074 | 21,705 | 14,255 | |||||||||||||||||||||||||||||||||
|
Other assets
|
42,873 | 35,765 | 33,199 | |||||||||||||||||||||||||||||||||
|
Total assets
|
$ | 664,617 | $ | 692,478 | $ | 688,648 | ||||||||||||||||||||||||||||||
|
Liabilities and Stockholders' Equity
|
||||||||||||||||||||||||||||||||||||
|
Interest-bearing checking
|
$ | 103,263 | $ | 323 | 0.31 | % | $ | 83,558 | $ | 560 | 0.67 | % | $ | 66,085 | $ | 791 | 1.20 | % | ||||||||||||||||||
|
Savings
|
20,543 | 79 | 0.38 | % | 17,436 | 73 | 0.42 | % | 16,555 | 168 | 1.01 | % | ||||||||||||||||||||||||
|
Money market
|
154,914 | 1,184 | 0.76 | % | 161,802 | 1,699 | 1.05 | % | 137,747 | 3,203 | 2.33 | % | ||||||||||||||||||||||||
|
Certificates of deposit
|
203,066 | 4,980 | 2.45 | % | 246,623 | 7,982 | 3.24 | % | 291,320 | 10,328 | 3.55 | % | ||||||||||||||||||||||||
|
Short-term borrowings
|
19 | - | 0.00 | % | 236 | 2 | 0.85 | % | 254 | 4 | 1.57 | % | ||||||||||||||||||||||||
|
FHLB advances
|
25,306 | 466 | 1.84 | % | 24,024 | 802 | 3.34 | % | 33,207 | 1,162 | 3.50 | % | ||||||||||||||||||||||||
|
Junior subordinated debt
|
17,527 | 1,159 | 6.61 | % | 17,527 | 1,128 | 6.44 | % | 17,527 | 1,129 | 6.44 | % | ||||||||||||||||||||||||
|
Total interest-bearing liabilities
|
524,638 | 8,191 | 1.56 | % | 551,206 | 12,246 | 2.22 | % | 562,695 | 16,785 | 2.98 | % | ||||||||||||||||||||||||
| - | - | - | ||||||||||||||||||||||||||||||||||
|
Noninterest-bearing checking
|
85,599 | 88,147 | 71,978 | |||||||||||||||||||||||||||||||||
|
Other liabilities
|
4,355 | 4,267 | 5,047 | |||||||||||||||||||||||||||||||||
|
Stockholders' equity
|
50,025 | 48,858 | 48,928 | |||||||||||||||||||||||||||||||||
|
Total liabilities and stockholders' equity
|
$ | 664,617 | $ | 692,478 | $ | 688,648 | ||||||||||||||||||||||||||||||
|
Net interest income
|
$ | 22,813 | $ | 20,311 | $ | 21,429 | ||||||||||||||||||||||||||||||
|
Rate spread
|
3.46 | % | 2.81 | % | 2.90 | % | ||||||||||||||||||||||||||||||
|
Net interest income as a percent of average earning assets
|
3.70 | % | 3.14 | % | 3.30 | % | ||||||||||||||||||||||||||||||
(1) Computed on a tax equivalent basis for tax equivalent securities using a 34% statutory tax rate.
30
The following table shows the changes in interest income, interest expense, and net interest income due to variances in rate and volume of average earning assets and interest-bearing liabilities. The change in interest not solely due to changes in rate or volume has been allocated in proportion to the absolute dollar amounts of the change in each.
Changes in Net Interest Income Due
To Rate and Volume
|
2010 over 2009
|
||||||||||||
|
($ in thousands)
|
Rate
|
Volume
|
Total
|
|||||||||
|
Increase (decrease) in interest income:
|
||||||||||||
|
Short-term investments and interest-earning deposits
|
$ | 25 | $ | - | $ | 25 | ||||||
|
Federal funds sold
|
3 | (10 | ) | (7 | ) | |||||||
|
Securities - taxable
|
(1,045 | ) | 481 | (564 | ) | |||||||
|
Securities - tax exempt
|
(84 | ) | 266 | 182 | ||||||||
|
Loans
|
957 | (2,146 | ) | (1,189 | ) | |||||||
|
Net change in interest income
|
(144 | ) | (1,409 | ) | (1,553 | ) | ||||||
|
Increase (decrease) in interest expense:
|
||||||||||||
|
Interest-bearing checking
|
(348 | ) | 111 | (237 | ) | |||||||
|
Savings
|
(6 | ) | 12 | 6 | ||||||||
|
Money market
|
(445 | ) | (70 | ) | (515 | ) | ||||||
|
Certificates of deposit
|
(1,736 | ) | (1,266 | ) | (3,002 | ) | ||||||
|
Short-term borrowings
|
- | (2 | ) | (2 | ) | |||||||
|
FHLB advances
|
(377 | ) | 41 | (336 | ) | |||||||
|
Trust preferred securities
|
31 | - | 31 | |||||||||
|
Net change in interest expense
|
(2,881 | ) | (1,174 | ) | (4,055 | ) | ||||||
|
Net change in interest income and interest expense
|
$ | 2,737 | $ | (235 | ) | $ | 2,502 | |||||
|
2009 over 2008
|
||||||||||||
|
($ in thousands)
|
Rate
|
Volume
|
Total
|
|||||||||
|
Increase (decrease) in interest income:
|
||||||||||||
|
Short-term investments and interest-earning deposits
|
$ | (106 | ) | $ | (77 | ) | $ | (183 | ) | |||
|
Federal funds sold
|
(173 | ) | 31 | (142 | ) | |||||||
|
Securities - taxable
|
(33 | ) | 370 | 337 | ||||||||
|
Securities - tax exempt
|
(28 | ) | 131 | 103 | ||||||||
|
Loans
|
(5,145 | ) | (627 | ) | (5,772 | ) | ||||||
|
Net change in interest income
|
(5,485 | ) | (172 | ) | (5,657 | ) | ||||||
|
Increase (decrease) in interest expense:
|
||||||||||||
|
Interest-bearing checking
|
(406 | ) | 175 | (231 | ) | |||||||
|
Savings
|
(104 | ) | 9 | (95 | ) | |||||||
|
Money market
|
(1,990 | ) | 485 | (1,505 | ) | |||||||
|
Certificates of deposit
|
(848 | ) | (1,497 | ) | (2,345 | ) | ||||||
|
Short-term borrowings
|
(2 | ) | - | (2 | ) | |||||||
|
FHLB advances
|
(51 | ) | (309 | ) | (360 | ) | ||||||
|
Trust preferred securities
|
(1 | ) | - | (1 | ) | |||||||
|
Net change in interest expense
|
(3,402 | ) | (1,137 | ) | (4,539 | ) | ||||||
|
Net change in interest income and interest expense
|
$ | (2,083 | ) | $ | 965 | $ | (1,118 | ) | ||||
Interest income is primarily generated from the loan portfolio. Average loans comprised 82%, 85%, and 86% of average earning assets during 2010, 2009, and 2008, respectively. During 2010, the loan portfolio had an average yield of 5.28%, and earned $26.8 million, or 88.2% of total interest income, a decrease of $1.2 million from 2009. The increase of $2.4 million in net interest income in 2010 from 2009 was due to an increase in net interest margin, which was offset by elevated levels of non-performing assets and a purposeful decrease in total loans. Through the implementation of interest rate floors on loans in 2009 and 2010, we were able to maintain our net interest margin. The increase in net interest margin in 2010 was due to aggressively reducing deposit rates, while keeping them consistent with local market rates. Short-term interest rates remained unchanged throughout 2009 and 2010 from the steep decline in 2008 by 400 basis points, which negatively impacted net interest margin. During 2009, the loan portfolio had an average yield of 5.10% and earned $28.0 million, or 87.4% of total interest income. During 2008, the loan portfolio had an average yield of 6.04% and earned $33.8 million, or 89.5% of total interest income.
31
The total securities portfolio and total short-term investments equaled 16.5% and 0.8%, respectively, of average earning assets. With an average tax-equivalent yield of 4.05%, total securities contributed $3.6 million, or 11.7% of total interest income, in 2010, while total short-term investments had a combined average yield of 0.61% and earned $31,334, or 0.1% of total interest income, in 2010. During 2009, the total securities portfolio and total short-term investments equaled 13.3% and 1.5%, respectively, of average earning assets. With an average tax-equivalent yield of 5.22%, total securities contributed $4.0 million, or 12.5% of total interest income, in 2009, while total short-term investments had a combined average yield of 0.13% and earned $13,363, or 0.1% of total interest income, in 2009. During 2008, the total securities portfolio and total short-term investments equaled 12.0% and 1.1%, respectively, of average earning assets. With an average tax-equivalent yield of 5.31%, total securities contributed $3.6 million, or 9.6% of total interest income, in 2008, while total short-term investments had a combined average yield of 2.52% and earned $337,828, or 0.9% of total interest income, in 2008.
Interest expense is primarily generated from money market deposits and certificates of deposit, which equaled 29.5% and 38.7%, respectively, of average interest bearing-liabilities during 2010; 29.4% and 44.7%, respectively, of average interest-bearing liabilities during 2009; and 24.5% and 51.8%, respectively, of average interest-bearing liabilities during 2008. Total average borrowings were 8.2%, 7.6%, and 9.1% of average interest-bearing liabilities during 2010, 2009 and 2008, respectively.
Money market balances had an average rate of 0.76% and cost $1.2 million, or 14.5% of total interest expense, in 2010, compared to an average rate of 1.05% and cost $1.7 million, or 13.9% of total interest expense, in 2009. Certificates of deposit had an average rate of 2.45% and cost $5.0 million, or 60.8% of total interest expense, in 2010, compared to an average rate of 3.24% and cost $8.0 million, or 65.2% of total interest expense, in 2009. Interest expense on savings and interest-bearing checking totaled 4.9% of total interest expense at an average rate of 0.33% during 2010 and 5.2% of total interest expense at average rate of 0.63% during 2009. The Company paid $1.6 million of interest expense on borrowings, or 19.8% of total interest expense, during 2010 and paid $1.9 million of interest expense on borrowings, or 15.8% of total interest expense, during 2009.
During 2008, money market accounts had an average rate of 2.33% and cost $3.2 million, or 19.1% of total interest expense, while certificates of deposit had an average rate of 3.55% and cost $10.3 million, or 61.5% of total interest expense. Savings deposits and interest-bearing checking accounts totaled 14.7% of average interest-bearing liabilities during 2008 with an average rate of 1.16%, or 5.7% of total interest expense, in 2008. Total borrowings had an average rate of 4.52% and cost $2.3 million of interest expense during 2008.
Provision for Loan Losses
The provision for loan losses was $4.7 million for 2010, $10.7 million for 2009, and $4.4 million for 2008. In 2010, the economic downturn continued, which led to further deterioration in market values of commercial real estate, primarily consisting of acquisition and development of residential real estate projects. A portion of the 2010 provision expense was recorded to replenish the reserve as it is used to charge-off or charge-down loans. Another portion of the expense was used to increase reserves on three commercial real estate relationships and one commercial relationship that were deemed impaired in 2009 or 2010 and required additional reserves of approximately $1.7 million in 2010 due to a decrease in collateral values. The provision expense recorded in 2010 reflected a $6.0 million decrease from 2009. The provision expense recorded in 2009 was primarily due to significant charge-offs related to a group of pre-2006 residential real estate development loans made up of different parties within the same development. The economic downturn also had an effect on a few commercial loan relationships requiring specific reserves and charge-offs due to liquidation of those businesses in 2009. The 2009 provision expense reflects a $6.3 million increase from 2008. The allowance for loan losses as a percentage of total loans outstanding was 2.56%, 2.20%, and 1.90% at December 31, 2010, 2009, and 2008, respectively.
In 2008, as the economy started to deteriorate and the residential development and home building sectors were severely weakened, we continued to increase our overall loan reserve in anticipation of stress on certain portions of our loan portfolio. In 2009, we continued this trend of increasing reserves, but we also used the allowance through charging off $6.3 million in commercial lending relationships and $3.8 million in commercial real estate lending relationships. Of these charge-offs, several of these relationships were originated prior to tightening our lending policy, which would not have allowed the loans to be approved either because of the loan structure or the size of the investment in the loan. In 2010, the provision expense of $4.7 million recorded was primarily related to the $3.9 million in net charge-offs taken during the year, of which $1.3 million was previously reserved for, and to increase specific reserves on three impaired commercial real estate relationships and one impaired commercial relationship requiring additional reserves of approximately $1.7 million in 2010. These increases in the allowance were offset by decreases in specific reserves on four relationships totaling approximately $840,000. Of the four relationships, one loan paid off and the other three have shown decreased risk through financial situation improvements and/or improvements in collateral value.
32
We maintain the allowance for loan losses at a level management feels is adequate to absorb probable losses incurred in the loan portfolio. The evaluation is based upon our historical loan loss experience, along with the banking industry’s historical loan loss experience, as well as known and inherent risks contained in the loan portfolio, composition and growth of the loan portfolio, current and projected economic conditions and other factors.
We had $23.1 million of nonperforming loans at December 31, 2010, an increase of $7.2 million from $15.9 million in nonperforming loans at December 31, 2009. While nonperforming loans increased, the nonaccrual loans decreased by $526,834. The primary reasons for the increase in nonperforming loans are the increase in troubled debt restructurings of $5.6 million and the increase in loans greater than 90 days past due but still accruing of $2.1 million.
Currently, there are three loan relationships in the troubled debt restructuring category, two commercial real estate loans and one commercial loan. Due to recent proposed guidance on troubled debt restructured loans, we decided to start reporting two loan relationships, one commercial and one commercial real estate loan, as troubled debt restructured loans. While these two loans may not have been considered troubled debt restructurings under current regulations, we believed it would be appropriate to take a conservative approach and follow the new proposed guidance. Since these two were restructured in 2010, both have been making payments according to their modified contractual terms and have not been past due more than 30 days since the modification. If this performance continues through the first quarter of 2011, we will consider moving them to a performing status. The third loan making up the remainder of the balance of $1.8 million in the troubled debt restructured loan total was modified to allow for the sale of the mortgaged property to occur. The sale is currently being negotiated between the borrower and the lessee of the facility and we expect resolution to occur sometime in 2011.
Included in delinquencies greater than 90 days is an accruing $1.8 million loan that has matured. The Bank has elected not to renew the loan and is seeking collection via legal process. The loan remains in accruing status because it is further supported by the unlimited guaranty of a third party whose guaranty is fully secured by a mortgage on a performing commercial real estate property that is unrelated to the borrower’s enterprise. This loan is expected to remain technically nonperforming during the pendency of our legal collection efforts but ultimate collection is not currently in doubt.
We reported $3.9 million of net charge-offs, or 0.76% of average loans, during 2009 compared to $9.8 million in net charge offs, or 1.78% of average loans, during 2009 and $2.0 million in net charge-offs during 2008. Net loans decreased during 2010 by $41.3 million, or approximately 8.0%, due to the Company’s focus on improving asset quality, profitability, and liquidity, along with a recognition of declining economic trends. We had $15.9 million of nonperforming loans at December 31, 2009, a decrease of $1.1 million from the $17.0 million of nonperforming loans at December 31, 2008.
Classified assets are comprised of accruing substandard and non-accrual loans, along with impaired investments and other real estate owned. Classified assets reached their peak at the end of the second quarter of 2009 at $58.9 million. We have made steady progress over the past eighteen months to reduce these assets by $9.0 million, or 15.3%. The Classified Assets Ratio is a key indicator used by our regulators to determine the health of financial institutions. It is calculated by dividing classified assets by the sum of Tier 1 Capital and the Allowance for Loan Losses (“ALLL”). At December 31, 2010, our classified assets were 63.3%, which shows improvement from 73.7% on December 31, 2009. We would like this ratio to be at or below 50% by the end of 2011. The following table presents the classified assets semi-annually from June 30, 2009 to December 31, 2010:
|
December 31
2010
|
June 30
2010
|
December 31
2009
|
June 30
2009
|
|||||||||||||
|
Classified Loans:
|
||||||||||||||||
|
Substandard Accruing
|
$ | 32,178 | $ | 37,930 | $ | 35,995 | $ | 41,332 | ||||||||
|
Nonaccrual
|
12,939 | 10,414 | 13,466 | 13,466 | ||||||||||||
|
Total Classified Loans
|
45,117 | 48,344 | 49,461 | 54,798 | ||||||||||||
|
Impaired Securities
|
422 | 489 | 479 | - | ||||||||||||
|
Other Real Estate Owned
|
4,284 | 6,477 | 4,634 | 4,060 | ||||||||||||
|
Total Classified Assets
|
$ | 49,823 | $ | 55,310 | $ | 54,574 | $ | 58,858 | ||||||||
|
Tier 1 Capital and ALLL
|
$ | 78,726 | $ | 77,009 | $ | 74,086 | $ | 72,617 | ||||||||
|
Classifed Asset Ratio
|
63.29 | % | 71.82 | % | 73.66 | % | 81.05 | % | ||||||||
33
Noninterest Income
Total noninterest income was $7.8 million for the year ended December 31, 2010 compared to $6.1 million and $6.3 million for the years ended December 31, 2009 and 2008, respectively. The $1.7 million increase from 2009 was primarily due to an $845,631 increase in gain on sale of securities, a $592,467 decrease in other-than-temporary-impairment on securities, and a $231,272 increase in Trust and Brokerage fees. Noninterest income was negatively impacted by an other-than-temporary-impairment on two securities of $158,303 in 2010, which is a decrease of $592,467 from the amount recorded in 2009 of $750,770. There were no charges for other-than-temporary impairment in 2008. Trust and Brokerage fees are directly impacted by the change in assets under management. There was a $129.8 million decline in assets under management during 2010, primarily during the fourth quarter. Up until that point, assets under management grew, which explains the increase in Trust and Brokerage fees during the year. Loan broker fees were $720,615, an increase of $34,983, or 5.1%, from fees of $685,632 and $251,014 recorded in 2009 and 2008, respectively. Deposit service charges remained flat in 2010 compared to 2009. Both 2010 and 2009 reported services charges of $1.1 million, compared to $1.2 million in 2008.
Noninterest Expense
Noninterest expense totaled $21.2 million for the year ended December 31, 2010 compared to $23.0 million and $21.0 million for the years ended December 31, 2009 and 2008, respectively, a decrease of $1.8 million, or 7.6%, during 2010 over 2009. The decrease in expenses is attributable to a decrease of $1.4 million in salaries and benefits and a decrease of $372, 241 in occupancy and equipment, offset by an increase in FDIC insurance premiums of $377,662.
Salary and benefits costs led the way in 2010 in cost savings with a decrease of $1.4 million, or 12.5%, from December 31, 2009. These costs totaled $9.6 million in 2010 and were 45.1% of noninterest expenses. The main reason for the decrease in 2010 was primarily due to receiving a full year’s benefit from the early retirement of the Chairman of our Board of Directors in December 2009 and the reduction in workforce by 25 full-time employees in 2009.
Due to renegotiating our lease at our headquarters and a reduction in depreciation expenses due to fixed assets being fully depreciated, we were able to show savings of $372,241 in 2010. These expenses totaled $2.5 million in 2010 and were 11.9% of noninterest expenses. Office supplies expense decreased by $102,292 primarily due to conservative purchasing and reductions in postage by outsourcing our statement processing to our core system processor. Offsetting the savings in noninterest expenses was a $377,662 increase in FDIC insurance premiums primarily due to increased assessment rates based on our written agreement with the Federal Reserve. Premiums also increased due to increasing deposits, specifically brokered deposits, and by continuing to participate in the Transaction Account Guarantee (TAG) Program, which charges the Company an additional premium to have the entire balance of all noninterest-bearing transaction accounts fully insured by the FDIC. While most noninterest expenses decreased in 2010, most of them decreased less than $100,000, including business development, data processing, and marketing.
Salary and benefit costs were $10.9 million in 2009 and were 47.6% of total noninterest expenses. Loan and professional costs increased during 2009 from prior year levels by $336,555, or 25.6%. Loan and professional expenses in 2009 increased from 2008 due to entering into a consulting engagement to have our lending staffing and processes analyzed. The engagement included analyzing current staffing levels and our internal approval processes for commercial and consumer loans. The engagement resulted in the creation of a centralized underwriting function for consumer loans and making necessary staffing adjustments in the areas of credit and lending. These expenses also increased due to additional costs associated with the workout of non-performing assets. Premiums for deposit insurance from the FDIC increased in 2009 and an industry-wide one-time special assessment of $315,000 in the second quarter was made causing a total increase of $984,799 from 2008 to 2009. Real estate market values remained low in 2009 causing write-downs and professional expenses of $1.7 million on properties that have moved to other real estate owned.
During 2008, salaries and benefits costs were $11.5 million, while occupancy and equipment expenses totaled $3.0 million. Additional large overhead expenses in 2008 included costs for professional fees and services, which amounted to $1.3 million and data processing expenses of $1.0 million.
Monitoring and controlling overhead expenses while providing high quality service to customers is of the utmost importance to us. The efficiency ratio, computed by dividing noninterest expense by net interest income plus noninterest income, was 70.6% in 2010 compared to 88.8% in 2009 and 76.9% in 2008. The efficiency ratio decreased in 2010 primarily due to the $1.7 million increase in noninterest income and the $1.8 million decrease in noninterest expenses. While we did have a one-time extraordinary gain on sale of securities of $888,058 in the third quarter of 2010, our efficiency would have been 72.8% without this unexpected income. The efficiency ratio was slightly higher in 2009 and 2008, but reflects a decrease in net interest income caused by steep interest rate cuts taken in 2008 that remained unchanged in 2009 and 2010, along with elevated expenses due to valuation adjustment to foreclosed assets and increased FDIC premiums. During 2009 we made significant strides in improving our net interest margin, which translated into improved net interest income in 2010. Improvement in the efficiency ratio will be obtained through an increase in revenue, both net interest income and fee income.
34
Income Taxes Expense
During 2010, we recorded tax expense of $923,727 compared to $2.2 million of tax benefit and $23,004 of tax expense in 2009 and 2008, respectively. The effective tax rate recorded for 2010 was 22.6% as compared to (28.3%) for 2009 and 1.2% for 2008. The low effective tax rate in 2010 and 2008 was primarily due to modest levels of income offset by tax-exempt investment income derived from investing in municipal bonds and bank owned life insurance, which typically totals approximately $1.5 million each year. The income tax benefit recorded in 2009 was the result of a net loss posted and was offset by writing off our state deferred tax asset due to determining that our state deferred tax asset created from the state net operating loss from our Real Estate Investment Trust (REIT) was more likely than not unrealizable.
Capital Sources
Stockholders’ equity is a noninterest-bearing source of funds, which provides support for asset growth. Stockholders’ equity was $53.1 million and $46.9 million at December 31, 2010 and 2009, respectively. Affecting the increase in stockholders’ equity during 2010 was $3.2 million in net income, $2.8 million in net proceeds from a private placement of 458,342 shares of common stock, and $155,152 in unrealized gains, net of tax, on available for sale securities. Additionally, we recorded $46,910 of restricted stock compensation expense.
The Company and the Bank are subject to regulatory capital requirements administered by federal banking agencies. Failure to meet the various capital requirements can initiate regulatory action that could have a direct material effect on the financial statements. Currently, both the Company and the Bank have been categorized as “Well Capitalized,” the highest classification contained within the banking regulations. The capital ratios of the Company and the Bank as of December 31, 2010 and 2009 are disclosed in Note 15 of the Notes to Consolidated Financial Statements. In 2010 we refined our Capital Contingency Plan and we have established new internal minimum capital levels that are in excess of those required by the regulators to remain “well capitalized”. The plan provides that our Total Risk-Based Capital Ratio should be equal to or greater than 11.0% and our Leverage Ratio should be equal to or greater than 8.0%.
Our ability to pay cash and stock dividends is subject to limitations under various laws and regulations and to prudent and sound banking practices. Prior to 2006 no cash or stock dividends were paid. In December 2005, our Board of Directors formally approved the payment of dividends commencing in calendar 2006. This was based on an analysis of our liquidity needs, regulatory and capital requirements, and results of operations. During 2006, we paid dividends at annual rate of $0.16 per share payable in four quarterly installments. This was increased in 2007 by 10%, which resulted in dividends paid totaling $0.176 per share. In January 2008, our Board of Directors voted to pay a dividend of $0.044 per share for the first quarter dividend payment. In the second quarter of 2008, however, we elected to forego the declaration of dividends on our common stock indefinitely. The decision was based on the desire to retain capital and hedge against challenging economic and banking industry conditions as well as to maintain Tower Bank’s current “well capitalized” status within the Federal Reserve System.
On May 5, 2010, we entered into a written agreement with the Federal Reserve and the IDFI, effective April 23, 2010 (the “Written Agreement”). For more detail regarding the Written Agreement, refer to “Bank Regulation — Written Agreement” section of Item 1, “Business”. One of the requirements in the Written Agreement was that we not pay dividends on or redeem any of our common or preferred stock or other capital stock, or make any payments of interest on its Trust Preferred Debt, without written approval from the Federal Reserve. In response to these requirements, no preferred stock dividends, common stock dividends or Trust Preferred Debt interest payments were made in 2010.
|
Liquidity and Capital Ratios
|
December 31,
|
|||||||
|
2010
|
2009
|
|||||||
|
Loan to deposit ratio
|
84.48 | % | 92.78 | % | ||||
|
Loan to funding ratio
|
80.97 | % | 83.82 | % | ||||
|
Total risk-based capital
|
14.30 | % | 12.45 | % | ||||
|
Tier 1 risk-based capital
|
13.10 | % | 10.90 | % | ||||
|
Tier 1 leverage capital
|
10.55 | % | 9.05 | % | ||||
35
Liquidity
Liquidity is measured by our ability to raise funds through deposits, borrowed funds, capital or cash flow from the repayment of loans and investment securities. These funds are used to meet depositor withdrawals, maintain reserve requirements, to fund loans and to fund operational expenses. Liquidity is primarily achieved through the growth of deposits and liquid assets such as securities available for sale, cash flow from securities, matured securities, and federal funds sold. Asset and liability management is the process of managing the balance sheet to achieve a mix of earning assets and liabilities that maximize profitability while providing adequate liquidity.
Our liquidity strategy is to fund growth with deposits (from both in-market and out-of-market sources), Federal Home Loan Bank borrowings and to maintain an adequate level of short-term and medium-term investments to meet typical daily loan and deposit activity needs. We were able to utilize the $41.3 million decline in net loans in 2010 to pay down FHLB advances and increase liquidity through the purchase of securities, which reported an increase of $20.4 million. Overall deposits increased by $8.0 million compared to a decline in deposits from 2008 to 2009 of $17.9 million. We mainly generate deposits from in-market sources; however, we also include national, non-brokered certificates of deposit, borrowings from the FHLB and trust preferred securities in our funding base. At December 31, 2010, the balances in brokered deposits, which included both money market accounts and certificates of deposit, and FHLB borrowings were $105.5 million and $7.5 million respectively. This was an increase of $36.8 million in brokered deposits and a decrease of $35.7 million in FHLB borrowing from 2009. At December 31, 2009, the balance in brokered CDs and FHLB borrowings were $68.7 million and $43.2 million respectively. We expect the loan portfolio to grow moderately through 2011. Funding for the loan portfolio will continue to come from in-market sources through the marketing of products and the development of branch locations. We will also continue to develop wholesale and out-of-market deposits and borrowing capacities and use them to augment interest rate sensitivity strategies and liquidity capabilities and to diversify the funding base of the Bank.
We have the ability to borrow money on a daily basis through correspondent banks (federal funds purchased) along with borrowings from the Federal Reserve discount window, and had no borrowings at December 31, 2010 and 2009. Additional capacity to borrow overnight in the form of unused lines of commitment from correspondent banks totaled $15.0 million at December 31, 2010 and $6.5 million at December 31, 2009. The unused line at the discount window totaled $4.0 million at December 31, 2010 and December 31, 2009. We view this type of funding as a secondary and temporary source of funds.
Contractual Obligations, Commitments and Off-Balance Sheet Risk
In addition to normal loan funding and deposit flow, we also need to maintain liquidity to meet the demands of certain unfunded loan commitments and standby and commercial letters of credit. The Bank maintains off-balance-sheet financial instruments in the normal course of business to meet the financing needs of its customers. These financial instruments include commitments to extend credit and standby letters of credit. Loan commitments to extend credit are agreements to lend to a customer at any time, as the customer’s needs vary, as long as there is no violation of any condition established in the contract. Standby letters of credit are conditional commitments issued by the Bank to guarantee the performance of a customer to a third party. Commitments generally have fixed expiration dates or other termination clauses and may require payment of a fee. Since many of the commitments are expected to expire without being drawn upon, the total commitment amounts do not necessarily represent future cash requirements. We monitor fluctuations in loan balances and commitment levels and include such data in our overall liquidity management.
These instruments involve, to varying degrees, elements of credit risk in excess of the amount recognized, if any, in the balance sheet. The Bank’s maximum exposure to loan loss in the event of nonperformance by the other party to the financial instruments for commitments to extend credit and standby letters of credit is represented by the face amount of these instruments. Commitments to extend credit are recorded when they are funded and standby letters of credit are recorded at fair value.
The Bank uses the same credit policies in making commitments and conditional obligations as it does for on-balance-sheet instruments. Collateral, such as accounts receivable, securities, inventory, property and equipment, is generally required based on management’s credit assessment of the borrower.
Tower Financial Corporation, the Bank, and the Trust Company occupy their respective headquarters, offices and other facilities under long-term operating leases and, in addition, are parties to long-term contracts for data processing and operating systems. We refer you to the discussion at Item 2 (“Properties”) and to the section herein on “Related Person Transactions” for additional information regarding our long-term leases.
36
The following tables represent our contractual obligations and commitments at December 31, 2010.
Contractual Obligations
at December 31, 2010
|
Payments Due by Period
|
||||||||||||||||||||
|
($ in thousands)
|
Less than
1 Year
|
1-3
Years
|
4-5
Years
|
After 5
Years
|
Total
|
|||||||||||||||
|
Federal Home Loan Bank advances
|
$ | 3,500 | $ | 4,000 | $ | - | $ | - | $ | 7,500 | ||||||||||
|
Junior subordinated debt
|
- | - | - | 17,527 | 17,527 | |||||||||||||||
|
Operating leases
|
740 | 1,406 | 1,201 | 1,802 | 5,149 | |||||||||||||||
|
Certificates of Deposit
|
93,095 | 59,141 | 11,488 | 24,576 | 188,300 | |||||||||||||||
|
Total contractual cash obligations
|
$ | 97,335 | $ | 64,547 | $ | 12,689 | $ | 43,905 | $ | 218,476 | ||||||||||
Commitments
at December 31, 2010
|
Amount of Commitment Expirations Per Period
|
||||||||||||||||||||
|
($ in thousands)
|
Less than
1 Year
|
1-3
Years
|
4-5
Years
|
After 5
Years
|
Total
|
|||||||||||||||
|
Lines of credit / loan commitments
|
$ | 62,129 | $ | 14,848 | $ | 9,397 | $ | 18,561 | $ | 104,935 | ||||||||||
|
Standby letters of credit
|
2,289 | 500 | 13 | - | 2,802 | |||||||||||||||
|
Total commitments
|
$ | 64,418 | $ | 15,348 | $ | 9,410 | $ | 18,561 | $ | 107,737 | ||||||||||
Related Persons Transactions
Certain directors and executive officers of the Company, including their immediate families and companies in which they are principal owners, are loan customers of the Bank. At December 31, 2010 and 2009, the Bank had $20.9 million and $22.8 million, respectively, in loan commitments to directors and executive officers, of which $15.3 million and $18.8 million were funded at the respective period-ends. All such loan transactions are reviewed and evaluated in the same manner, and under the same lending standards and policies, as every other loan to a non-related person, as all such loans must be approved by the Bank’s Loan and Investment Committee and by our Board of Directors, with the related person neither in attendance nor voting.
The Bank leases its headquarters facility from Tippmann Properties, Inc., agent for John V. Tippmann, Sr., a director and currently our largest stockholder. The original lease was entered into in 1998 and was amended in 2001, 2004, 2006 and again in 2009 to reduce the amount of space rented. Each transaction was considered and approved by our Audit Committee and by a majority of the members of our Board of Directors (with Mr. Tippmann abstaining), as fair and reasonable to the Company. Our composite rental rate and terms are market competitive. The total amount paid to Tippmann Properties for rent and maintenance was $707,840, $767,290, and $782,804 during 2010, 2009, and 2008, respectively. The lease is accounted for as an operating lease. Refer to the Contractual Obligations table above for a summary of future lease payment commitments under this and other leases.
The law firm of Barrett & McNagny LLP, of which Robert S. Walters is a partner, performs legal services for the Company. Mr. Walters is the spouse of Irene A. Walters, one of our directors. We paid $133,839, $111,068, and $65,829 in legal fees and related expenses to this law firm in 2010, 2009, and 2008, respectively.
In 2008, the Bank engaged Ruffolo Benson, LLC for management consulting services. Joseph Ruffolo is a principal owner of Ruffolo Benson, LLC and is one of our directors. The engagement concluded in 2008 and we paid $31,760 that year to Ruffolo Benson, LLC for these services in that year.
Under our Statement of Policy for the Review, Approval, or Ratification of Transactions with Related Persons, our Audit Committee has reviewed and ratified all terms of the lease with Tippmann Properties, Inc., as amended, the professional relationships with Mr. Walters and the law firm of Barrett & McNagny LLP, and with Mr. Ruffalo and the firm of Ruffolo Benson LLC, and have found that the terms are fair and reasonable and in the best interest of our Company and stockholders.
Related Persons transactions are subject to our Statement of Policy For the Review, Approval or Ratification of Transactions With Related Persons. A copy of this policy is available on our website at www.towerbank.net.
The policy applies to any “Transaction With a Related Person.” Under our policy, a “Related Person” is a person who is, or at any time since the beginning of our last fiscal year was a director or executive officer, a nominee to become a director, a stockholder who beneficially owns 5% or more of our common stock, an “Immediate Family Member” (that is, a spouse, child, parent, sibling, or an in-law) of any of the foregoing persons, as well as any entity which is owned or controlled by any of such persons (or of which such person is a general partner or a 5% or greater beneficial owner) or any other person identified by our Audit Committee or our Board of Directors as a “Related Person” for purposes of this policy. Once a person has been identified as “Related Person” and if Tower Financial Corporation or any subsidiary is a participant, then if the aggregate amount involved in the transaction exceeds $60,000 and the “Related Person” has a direct or indirect interest (other than simply as a result of being a director or less than a 10% beneficial owner of the entity involved) the transaction must be considered, approved or ratified by the Audit Committee.
37
We have established the threshold transactional amount at $60,000, which triggers the review, even though applicable SEC regulations set the threshold at $120,000. We have done this so that even smaller transactions with Related Persons will be reviewed for fairness and appropriateness. Employment of a Related Person in the ordinary course of business consistent with our policies and practices with respect to the employment of non-Related Persons in similar positions (so long as the Related Person is not an executive officer required to be reported in our annual proxy statement) is not subject to the policy. Transactions involving competitive bids or transactions involving services as a bank depository, transfer agent, registrar, or trustee are considered pre-approved for purposes of our policy.
All other transactions subject to our policy must be approved in advance by the Audit Committee, unless our Chief Executive Officer or Chief Financial Officer determines that it is impractical to wait until an Audit Committee meeting. In such event, the Chair of the Audit Committee may review and approve the proposed Related Person transaction but shall then promptly report any such approval to the full Audit Committee. All material facts respecting the Related Person transaction must be disclosed to the Audit Committee. In the event that we become aware of a Related Person transaction that has not been approved prior to its consummation, the matter must then still be reviewed by the Audit Committee, which will then review all relevant facts and circumstances, shall evaluate all available options (including ratification, revision or termination of the transaction), and shall take such course of action as it deems appropriate.
In reviewing any Related Person transaction, the Audit Committee must consider the proposed benefits to the Company, the availability of other sources of comparable products or services, an assessment of whether the proposed transaction is at least on terms comparable to the terms available to an unrelated third party or to employees generally, and must then determine that the transaction is fair and reasonable to the Company.
Financial Condition
During 2010, we continued to focus on improving profitability, both short-term and long-term, by improving asset quality, restructuring the balance sheet, increasing the net interest margin, and controlling expenses. While nonperforming asset levels remain high, we are seeing improvement in several lending relationships, where they have been rehabilitated and could move to a performing status sometime in the near future. To be able to move to performing status once a loan is considered nonperforming, certain performance levels are expected and must be sustained for a period of time. In 2010, several loans were moved off the nonperforming list through improvements, charge-downs or fair value adjustments, and refinancing through another institution. Total loans decreased by $40.4 million and were offset by an increase in long-term investments, resulting in a decrease in total assets of $20.2 million in 2010 from December 31, 2009. With this decrease in assets, we were able to reduce our FHLB borrowings by $35.7 million. An increase in total deposits of $8.0 million offset the decrease in borrowings and primarily consisted of an increase in brokered deposits. While asset size has decreased over the past couple of years, management anticipates that assets will begin to grow slowly in the near future as we look to increase our earning assets, through the origination and purchasing of quality loans and investments while maintaining our current asset allocation.
Earning Assets
The Bank’s net loans declined $41.3 million, or 8.0%, during 2010. Total loans were $486.9 million at December 31, 2010 compared to $527.3 million at December 31, 2009. The loan portfolio, which equaled 79.9% and 83.7% of earning assets at December 31, 2010 and 2009, respectively, was primarily comprised of commercial and commercial real estate loans at both dates and were made to business interests generally located within the Bank’s market area. Approximately 47.7% of the loan portfolio at December 31, 2010 consisted of general commercial and industrial loans primarily secured by inventory, receivables, and equipment, while 24.7% of the loan portfolio consisted of commercial loans primarily secured by real estate. The largest concentrations of credit within the commercial and commercial real estate categories are represented by owner-occupied and investment real estate at $156.0 million, or 32.0% of total loans, and building, development and general contracting at $49.8 million, or 10.2% of total loans. While the general portfolio mix has remained about the same, the main direction the Bank has taken was to put more resources into the commercial versus the commercial real estate product. The concentration and growth in commercial credits is in keeping with the Bank’s strategy of focusing a substantial amount of efforts on commercial banking. Business banking is an area of expertise for the Bank’s management and lending team. Management believes that loan portfolio will remain stagnant during 2010. The following table presents loans outstanding as of December 31, 2010, 2009, 2008, 2007, and 2006.
38
Loans Outstanding
|
December 31,
|
||||||||||||||||||||
|
($ in thousands)
|
2010
|
2009
|
2008
|
2007
|
2006
|
|||||||||||||||
|
Commercial
|
$ | 232,077 | $ | 251,773 | $ | 255,027 | $ | 252,257 | $ | 236,808 | ||||||||||
|
Commercial real estate
|
120,413 | 132,355 | 152,417 | 170,292 | 178,611 | |||||||||||||||
|
Residential real estate
|
80,107 | 86,680 | 98,432 | 102,162 | 83,601 | |||||||||||||||
|
Home equity
|
38,389 | 40,043 | 34,957 | 29,508 | 32,097 | |||||||||||||||
|
Consumer
|
15,986 | 16,649 | 20,330 | 21,750 | 19,376 | |||||||||||||||
|
Total loans
|
486,972 | 527,500 | 561,163 | 575,969 | 550,493 | |||||||||||||||
|
Net deferred loan (fees) / costs
|
(58 | ) | (167 | ) | (151 | ) | (225 | ) | (43 | ) | ||||||||||
|
Allowance for loan losses
|
(12,489 | ) | (11,598 | ) | (10,655 | ) | (8,208 | ) | (6,870 | ) | ||||||||||
|
Net loans
|
$ | 474,425 | $ | 515,735 | $ | 550,357 | $ | 567,536 | $ | 543,580 | ||||||||||
The following table presents the maturity of total loans outstanding as of December 31, 2010, according to scheduled repayments of principal and also based upon repricing opportunities.
Maturities of Loans Outstanding
|
($ in thousands)
|
Within
1 Year
|
1 - 5
Years
|
Over
5 Years
|
Totals
|
||||||||||||
|
Loans - Contractual Maturity Dates:
|
||||||||||||||||
|
Commercial
|
$ | 76,583 | $ | 95,655 | $ | 59,839 | $ | 232,077 | ||||||||
|
Commercial real estate
|
27,043 | 70,062 | 23,308 | 120,413 | ||||||||||||
|
Residential real estate
|
8,275 | 11,146 | 60,686 | 80,107 | ||||||||||||
|
Home equity
|
6,084 | 19,575 | 12,730 | 38,389 | ||||||||||||
|
Consumer
|
5,372 | 10,313 | 301 | 15,986 | ||||||||||||
|
Total loans
|
$ | 123,357 | $ | 206,751 | $ | 156,864 | $ | 486,972 | ||||||||
|
Loan Repricing Opportunities:
|
||||||||||||||||
|
Fixed rate
|
$ | 50,577 | $ | 119,339 | $ | 106,215 | $ | 276,131 | ||||||||
|
Variable rate
|
72,780 | 87,412 | 50,649 | 210,841 | ||||||||||||
|
Total loans
|
$ | 123,357 | $ | 206,751 | $ | 156,864 | $ | 486,972 | ||||||||
The Bank’s credit policies establish, monitor for effectiveness and adjust guidelines to manage credit risk and asset quality. These guidelines include procedures for loan review and to elicit the identification of problem loans as early as practical in order to provide effective loan portfolio administration. We strive, through application of our credit policies and procedures, to minimize the risks and uncertainties inherent in lending. In following these policies and procedures, we must rely on estimates, appraisals and evaluation of loans and the possibility that changes could occur because of changing general economic conditions and changes in consumer preferences, government monetary policies, changes in a borrower’s financial condition, and other factors that can affect a loan’s collectability. Identified problem loans, which exhibit characteristics (financial or otherwise) that could cause the loans to become nonperforming or require restructuring in the future, are included on an internal “watchlist.” Senior management reviews this list regularly and adjusts for changing conditions. At December 31, 2010, there were $72.3 million, a decrease of $9.8 million or 11.9% from 2009, of potential problem loans outstanding on the watchlist. At December 31, 2009, there were $82.1 million of potential problem loans outstanding on the watchlist. This decrease in loans on the watchlist is a reflection of management’s focus on improving asset quality. Over the past few years, we have been prudent in recognizing and reporting loans in trouble and helping them return to a performing status. This practice is reflected through an increase in our troubled debt restructurings. We modified two loans in 2010, one was modified to secure more collateral in the amount of $900,000 and the other was modified to extend the amortization period from 15 to 17 years. Both loans were modified within our normal lending guidelines, but are required to be labeled as troubled debt restructuring based on the new proposed guidance on troubled debt restructurings.
Nonperforming loans at December 31, 2010 were $23.1 million, of which $12.9 million were loans placed on nonaccrual status, $2.7 million of loans still accruing at 90 days or more past due, and $7.5 million of troubled debt restructured loans. While nonperforming loans increased, the nonaccrual loans decreased by $526,834. The primary reasons for the increase in nonperforming loans are the increase in troubled debt restructurings of $5.6 million and the increase in loans greater than 90 days past due but still accruing of $2.1 million. Currently, there are three loan relationships in the troubled debt restructuring category, two commercial real estate loans and one commercial loan. Due to recent proposed guidance on troubled debt restructured loans, we have started reporting two loan relationships as troubled debt restructured loans, as mentioned in the previous paragraph. Included in delinquencies greater than 90 days is an accruing $1.8 million loan that has matured. The Bank has elected not to renew the loan and is seeking collection via legal process. For specific details regarding these relationships, refer to the “Results of Operations – Provision for Loan Losses” section of Item 7, “Management’s Discussion and Analysis of Financial Condition and Results of Operation”. Total impaired loans were $31.6 million, which included most of the nonperforming loans plus loans deemed impaired and still accruing of $9.5 million.
39
Nonperforming loans at December 31, 2009 were $15.9 million, of which $13.5 million were loans placed on nonaccrual status, $561,136 of loans still accruing at 90 days or more past due, and $1.9 million of troubled debt restructured loans. Total impaired loans were $23.5 million, which included most of the nonperforming loans plus loans deemed impaired and still accruing of $8.9 million. Nonperforming loans at December 31, 2008 were $17.0 million, of which $15.7 million were loans placed on nonaccrual status, $1.0 million of loans still accruing at 90 days or more past due, and $327,967 of troubled debt restructured loans. Total impaired loans were $23.4 million, which included most of the nonperforming loans plus loans deemed impaired and still accruing of $6.3 million.
Nonperforming assets
|
at December 31,
|
||||||||||||||||||||
|
2010
|
2009
|
2008
|
2007
|
2006
|
||||||||||||||||
|
Loans past due over 90 days still accruing
|
$ | 2,688,135 | $ | 561,136 | $ | 1,019,857 | $ | - | $ | 354,096 | ||||||||||
|
Troubled debt restructured loans
|
7,501,958 | 1,915,127 | 327,967 | 639,332 | 488,717 | |||||||||||||||
|
Nonaccrual loans
|
12,939,331 | 13,466,165 | 15,675,334 | 17,954,861 | 3,488,417 | |||||||||||||||
|
Total nonperforming loans
|
23,129,424 | 15,942,428 | 17,023,158 | 18,594,193 | 4,331,230 | |||||||||||||||
|
Other real estate owned
|
4,284,263 | 4,634,089 | 2,660,310 | 1,451,573 | 370,000 | |||||||||||||||
|
Impaired securities
|
421,529 | 478,665 | 230,900 | - | - | |||||||||||||||
|
Total nonperforming assets
|
$ | 27,835,216 | $ | 21,055,182 | $ | 19,914,368 | $ | 20,045,766 | $ | 4,701,230 | ||||||||||
During 2010, the Bank recorded $3.9 million in net charged-off loans compared to $9.8 million in 2009 and $2.0 million in 2008. The net charge-offs to total average loans was 0.76%, 1.78%, and 0.35% in 2010, 2009, and 2008, respectively. Of the loans charged-off in 2010, $2.7 million came from 5 commercial loans and one commercial real estate loan that had been either partially or fully reserved previously. There was one residential real estate loan from a pool of loans purchased in 2007 from Countrywide, now serviced by Bank of America, that had a $283,351 charge-off, but only had a small reserve based on ASC 450-2 guidelines. The remaining net charge-offs were less than $500,000 each. Offsetting the charge-offs were $634,993 of recoveries, which included a recovery of $200,000 on one commercial loan relationship that was charged off earlier in the year. Of the loans charged off in 2009, $8.9 million in charge-offs were for three commercial real estate loan relationships and five commercial loan relationships. There were other smaller charge-offs but none in excess of $500,000, while all others were less than that. The charge-offs were offset by $530,227 of recoveries from two commercial loan relationships, one of which was related to the charge-offs reported earlier in 2009. Of the loans charged off in 2008, $2.0 million in charge-offs were for two commercial real estate loans and one commercial loan. There were other smaller charge-offs but none in excess of $500,000, while all others were less than that. The charge-offs were offset by $942,327 of recoveries from two commercial real estate loans and one commercial loan.
40
Activity in the allowance for loan losses during 2010, 2009, 2008, 2007, and 2006 was as follows:
|
2010
|
2009
|
2008
|
2007
|
2006
|
||||||||||||||||
|
Beginning balance, January 1
|
$ | 11,598,389 | $ | 10,654,879 | $ | 8,208,162 | $ | 6,870,442 | $ | 5,645,301 | ||||||||||
|
Provision charged to operating expense
|
4,745,000 | 10,735,000 | 4,399,000 | 10,996,000 | 2,195,000 | |||||||||||||||
|
Charge-offs:
|
||||||||||||||||||||
|
Commercial
|
(3,457,564 | ) | (6,279,849 | ) | (1,148,617 | ) | (2,471,770 | ) | (905,054 | ) | ||||||||||
|
Commercial real estate
|
(547,808 | ) | (3,814,068 | ) | (1,920,176 | ) | (7,289,044 | ) | (171,492 | ) | ||||||||||
|
Residential real estate
|
(293,785 | ) | (133,850 | ) | (55,219 | ) | (37,669 | ) | (34,490 | ) | ||||||||||
|
Home equity
|
(138,471 | ) | (75,823 | ) | (82,536 | ) | (178,522 | ) | (231,991 | ) | ||||||||||
|
Consumer
|
(51,354 | ) | (18,127 | ) | (289,664 | ) | (146,086 | ) | (8,011 | ) | ||||||||||
|
Total Charge-offs
|
(4,488,982 | ) | (10,321,717 | ) | (3,496,212 | ) | (10,123,091 | ) | (1,351,038 | ) | ||||||||||
|
Recoveries:
|
||||||||||||||||||||
|
Commercial
|
538,158 | 449,904 | 567,420 | 302,881 | 93,009 | |||||||||||||||
|
Commercial real estate
|
74,867 | 36,015 | 846,700 | - | - | |||||||||||||||
|
Residential real estate
|
- | 2,231 | 112,961 | 36,007 | - | |||||||||||||||
|
Home equity
|
21,348 | 31,965 | 8,940 | 122,098 | 287,486 | |||||||||||||||
|
Consumer
|
620 | 10,112 | 7,908 | 3,825 | 684 | |||||||||||||||
|
Total Recoveries
|
634,993 | 530,227 | 1,543,929 | 464,811 | 381,179 | |||||||||||||||
|
Total Net Charge-offs
|
(3,853,989 | ) | (9,791,490 | ) | (1,952,283 | ) | (9,658,280 | ) | (969,859 | ) | ||||||||||
|
Ending balance, December 31
|
$ | 12,489,400 | $ | 11,598,389 | $ | 10,654,879 | $ | 8,208,162 | $ | 6,870,442 | ||||||||||
In each quarter, we adjust the allowance for loan losses to the amount we believe is necessary to maintain the allowance at adequate levels. We allocate specific portions of the allowance for loan losses to specifically identified problem loans. Our evaluation of the allowance is further based on consideration of actual loss experience, the present and prospective financial condition of borrowers, industry concentrations within the portfolio and general economic conditions. We believe that the present allowance is adequate, based on the foregoing broad range of considerations.
The following table illustrates the breakdown of the allowance for loan losses by loan type.
Allocation of the Allowance for Loan Losses
($ in thousands)
|
Loan Type
|
Dec 31,
2010
Alloc.
|
Loan
Type
As a %
of Total
Loans
|
Dec 31,
2009
Alloc.
|
Loan
Type
As a %
of Total
Loans
|
Dec 31,
2008
Alloc.
|
Loan
Type
As a %
of Total
Loans
|
Dec 31,
2007
Alloc.
|
Loan
Type
As a %
of Total
Loans
|
Dec 31,
2006
Alloc.
|
Loan
Type
As a %
of Total
Loans
|
||||||||||||||||||||||||||||||
|
Commercial
|
$ | 5,791 | 46.4 | % | $ | 6,733 | 58.1 | % | $ | 4,942 | 46.4 | % | $ | 4,175 | 43.8 | % | $ | 4,693 | 43.1 | % | ||||||||||||||||||||
|
Commercial real estate
|
6,183 | 49.5 | % | 4,336 | 37.4 | % | 5,276 | 49.5 | % | 3,798 | 29.6 | % | 1,986 | 32.4 | % | |||||||||||||||||||||||||
|
Residential real estate
|
387 | 3.1 | % | 168 | 1.4 | % | 136 | 1.3 | % | 21 | 17.7 | % | 88 | 15.2 | % | |||||||||||||||||||||||||
|
Home equity
|
77 | 0.6 | % | 205 | 1.8 | % | 110 | 1.0 | % | 30 | 5.1 | % | 17 | 5.8 | % | |||||||||||||||||||||||||
|
Consumer
|
29 | 0.2 | % | 104 | 0.9 | % | 134 | 1.3 | % | 140 | 3.8 | % | 82 | 3.5 | % | |||||||||||||||||||||||||
|
Unallocated
|
22 | 0.2 | % | 52 | 0.4 | % | 57 | 0.5 | % | 44 | n/a | 4 | n/a | |||||||||||||||||||||||||||
|
Total allowance for loan losses
|
$ | 12,489 | 100.0 | % | $ | 11,598 | 100.0 | % | $ | 10,655 | 100.0 | % | $ | 8,208 | 100.0 | % | $ | 6,870 | 100.0 | % | ||||||||||||||||||||
See Note 3 to the Consolidated Financial Statements for detail of activity in allowance for loan losses
Although, at the time each evaluation is made, we consider the aggregate allowance for loan losses to be adequate to absorb losses that we expect to be incurred, we can provide no assurance that charge-offs in future periods will not exceed the allowance, as has occurred in recent years. Additionally, banking regulators can require an increase to the allowance for loan losses if they deem necessary to satisfy regulatory safety and soundness concerns. We experienced $4.5 million of charge-offs and $634,993 of recoveries in 2010. We experienced $10.3 million of charge-offs and $530,227 of recoveries during 2009 and $3.5 million of charge-offs and $1.5 million of recoveries during 2008.
41
|
Total Securities Portfolio
|
December 31,
|
|||||||||||
|
($ in thousands)
|
2010
Fair
Value
|
2009
Fair
Value
|
2008
Fair
Value
|
|||||||||
|
Available for sale securities:
|
||||||||||||
|
U.S. Government agency debt obligations
|
$ | 4,173 | $ | 8,287 | $ | 8,269 | ||||||
|
Obligations of states and political subdivisions
|
45,759 | 27,203 | 21,258 | |||||||||
|
Mortgage-backed securites (residential)
|
55,489 | 44,657 | 44,553 | |||||||||
|
Mortgage-backed securites (commercial)
|
4,683 | 5,022 | 3,481 | |||||||||
|
Collateralized debt obligations
|
5 | 10 | 231 | |||||||||
|
Total available for sale securities
|
110,109 | 85,179 | 77,792 | |||||||||
|
Held to maturity securities:
|
||||||||||||
|
Mortgage-backed securites (residential)
|
- | 4,636 | - | |||||||||
|
Total held to maturity securities
|
$ | - | $ | 4,636 | $ | - | ||||||
|
Total securities
|
$ | 110,109 | $ | 89,815 | $ | 77,792 | ||||||
Securities at fair value increased during 2010, and totaled $110.1 million at December 31, 2010 compared to $89.8 million at December 31, 2009 and $77.8 million at December 31, 2008. We maintain a modest securities portfolio to provide for secondary liquidity and for interest rate risk management. During 2010 and 2009, the size of the portfolio increased by approximately 22.6% and 15.5%, respectively, to focus on improving liquidity and flexibility. The portfolio will continue to include some short-term liquid holdings from time to time based on liquidity needs. Since the inception of the Company, all securities have been designated as “available for sale” and “held to maturity” as defined by accounting standards. Securities designated as available for sale are stated at fair value, with the unrealized gains and losses, net of income tax, reported as a separate component of stockholders’ equity. Securities designated as held to maturity are stated at cost. A net unrealized gain on this portfolio was recorded at December 31, 2010 in the amount of $1.6 million compared to a net unrealized gain on this portfolio in the amount of $1.4 million recorded at December 31, 2009 and a net unrealized loss in the amount of ($551,986) at December 2008. The table above presents the total securities portfolio as of December 31, 2010, 2009, and 2008. During 2010, we sold $9.2 million of available for sale and held to maturity securities and recorded $1.1 million gain from sales. During 2009, we sold $9.5 million of available for sale agency and municipal securities and recorded a $264,112 gain from the sales. During 2008, we sold $5.2 million of available for sale agency and municipal securities and recorded a $65,841 gain from the sales.
The Company, through the bank’s investment subsidiary, owns a $1 million original investment in PreTSL XXV, a pooled trust preferred investment with a book value of $877.4 million at the time of purchase. This is the Company’s only pooled trust preferred security and is classified as a collateralized debt obligation. At December 31, 2010, the market value of the investment was $4,600 and the book value was $110,000. The investment was rated Ca by Moody’s and C by Fitch.
42
The investment is divided into seven tranches. Tower’s investment is in the fifth tranche (C-1), meaning the cashflows on the investment are subordinated to the higher placed tranches. There are sixty-eight (68) issuing participants in PreTSL XXV. Fifty-eight (58) of the issuers are banks or bank holding companies, with the remaining issuers being insurance companies. As of December 31, 2010, the amount of deferrals and defaults was $314.6 million, or 36.0% of the total pool. Of the total $877.4 million of original collateral, $562.8 million is currently paying interest. The defaults and deferrals occurred as follows:
|
Deferral
|
Default
|
|||||||
|
March 31, 2008
|
$ | - | $ | 25,000,000 | ||||
|
September 30, 2008
|
20,000,000 | - | ||||||
|
December 31, 2008
|
15,000,000 | 35,000,000 | ||||||
|
March 31, 2009
|
22,500,000 | - | ||||||
|
June 30, 2009
|
35,600,000 | 25,000,000 | ||||||
|
September 30, 2009
|
86,000,000 | - | ||||||
|
December 31, 2009*
|
7,500,000 | 25,000,000 | ||||||
|
March 31, 2010
|
- | - | ||||||
|
June 30, 2010
|
- | - | ||||||
|
September 30, 2010
|
14,000,000 | - | ||||||
|
December 31, 2010
|
29,000,000 | - | ||||||
* $25.0 million of defaults at December 31, 2009 were reported as deferrals in September 30, 2009
The Company uses an other-than-temporary-impairment (OTTI) evaluation model to compare the present value of expected cash flows to the previous estimate to determine whether an adverse change in cash flows has occurred during the quarter. The OTTI model considers the structure and term of the collateralized debt obligation (“CDO”) and the financial condition of the underlying issuers. Specifically, the model details interest rates, principal balances of note classes and underlying issuers, the timing and amount of interest and principal payments of the underlying issuers, and the allocation of the payments to the note classes. The current estimate of expected cash flows is based on the most recent trustee reports and any other relevant market information including announcements of interest payment deferrals or defaults of underlying trust preferred securities. Assumptions used in the model include expected future default rates and prepayments. We assume that all interest payment deferrals will become defaults prior to their next payment dates and that there will be no recoveries on defaults. In addition we use the model to “stress” each CDO, or make assumptions more severe than expected activity, to determine the degree to which assumptions could deteriorate before the CDO could no longer fully support repayment of Tower’s note class. We evaluate the credit quality of each underlying issuer in the pool and apply a risk rating for each issuer and then put this risk rating into a relevant risk model to identify immediate default risk. Upon completion of the December 31, 2010 analysis, our model indicated that the security was other-than-temporarily impaired. Based on this conclusion at December 31, 2010, the investment had OTTI of approximately 89.0%, or $851,342.
The Company owns a Private Label Collateralized Mortgage Obligation (CMO) with an original investment of $1.0 million. At December 31, 2010, the market value of the investment was $416,929 and the book value was $586,125. The investment was rated Caa2 by Moody’s and CCC by S&P.
This bond is classified as a “super senior” tranche because its cash flow is not subordinated to any other tranche in the deal and is classified as a mortgage-backed security (residential). We used the Intex database to evaluate and model each individual loan in the underlying collateral of this security. In 2009, we noticed that the credit quality of the underlying collateral was marginally deteriorating causing us to more aggressively monitor and analyze for other-than-temporary-impairment. In 2010, we continued to monitor and analyze this investment and took additional charges for other than temporary impairment when deemed necessary. To monitor this investment, management has evaluated loan delinquencies, foreclosures, other real estate owned (OREO) and bankruptcies as shown in the table below prior to making assumptions on the performing loans.
|
December 31
2010
|
September 30
2010
|
June 30
2010
|
March 31
2010
|
|||||||||||||
|
Delinquency 60+
|
22.58 | % | 20.76 | % | 22.48 | % | 24.37 | % | ||||||||
|
Delinquency 90+
|
19.79 | % | 18.42 | % | 20.73 | % | 22.07 | % | ||||||||
|
Other Real Estate Owned
|
1.73 | % | 0.20 | % | 0.17 | % | 1.27 | % | ||||||||
|
Foreclosure
|
9.42 | % | 9.11 | % | 10.79 | % | 11.43 | % | ||||||||
|
Bankruptcy
|
4.08 | % | 4.09 | % | 3.35 | % | 3.87 | % | ||||||||
43
|
December 31
2009
|
September 30
2009
|
June 30
2009
|
March 31
2009
|
|||||||||||||
|
Delinquency 60+
|
23.66 | % | 20.63 | % | 17.07 | % | 14.69 | % | ||||||||
|
Delinquency 90+
|
21.01 | % | 17.42 | % | 13.99 | % | 11.70 | % | ||||||||
|
Other Real Estate Owned
|
1.32 | % | 0.84 | % | 1.51 | % | 0.32 | % | ||||||||
|
Foreclosure
|
11.38 | % | 10.64 | % | 7.77 | % | 6.85 | % | ||||||||
|
Bankruptcy
|
3.36 | % | 2.60 | % | 0.31 | % | 0.31 | % | ||||||||
We utilized Intex data to determine the default assumptions for all loans that are classified as “past due,” OREO or in foreclosure. A 50% severity rate was assumed on all defaults. This number was derived from the pool average over the last 12 months. The default rate differs for each State based on the severity of that State’s home price depreciation and the number of days the loan is past due. Any foreclosure or loan classified as OREO is immediately liquidated at a 50% severity. The current loan category is stratified by FICO scores and the level of asset documentation (full documentation, low documentation, or no documentation). The Loan Performance Database driven by Intex data is mined for historical probabilities of loans meeting these characteristics moving into default. This was done for 2006, 2007, and 2008 periods. The average default rate is then calculated, as well as its standard deviation. Two standard deviations are then added to this mean to derive the current loan CDR assumptions; representing what management feels is a “stressed” scenario. We used the yield at the time of purchase as the discount rate for the cash flow analysis. At the time of purchase the bond was yielding 6%. Therefore, all cash flows in the OTTI analysis were discounted by 6% to get a present value. To determine the fair value, we surveyed two bond desks to see what yield it would take to sell the bond in the open market. Both desks said it would take a yield of 12%-15% to get someone to buy this bond. Management decided to use the conservative figure and discounted the cash flows by 15%. The two bonds desks that were surveyed are Sterne Agee and Performance Trust.
Upon completion of the December 31, 2010 analysis based on the assumptions above, our model indicated that the Private Label CMO was other-than-temporarily impaired. Based on this conclusion at December 31, 2010, the investment had OTTI of approximately 10%, or $57,731.
Short-term Investments and Fed Funds Sold
Federal funds sold, consisting of excess funds sold overnight to correspondent banks, and short-term investments and interest-bearing deposits, consisting of certificates of deposit with maturities less than 90 days and interest-bearing accounts at correspondent banks, are used to manage daily liquidity needs and interest rate sensitivity. Together, these short-term assets, which recorded an increase of $1.2 million during 2010, were $6.0 million and $4.8 million at December 31, 2010 and 2009, respectively. At December 31, 2010 and 2009, these short-term assets were approximately 1.0% and 0.8% of earning assets, respectively.
Source of Funds
Our major source of funds is from core deposits of local businesses, governmental and municipal public fund entities, and consumers within our market area. We also generate certificates of deposit through national out-of-market sources (outside Allen and surrounding counties). We generate these out-of-market deposits through negotiated transactions with brokers. Total deposits were $576.4 million at December 31, 2010 and $568.4 million at December 31, 2009, an increase of $8.0 million, or 1.4%. At December 31, 2008 total deposits were $586.2 million.
Noninterest-bearing deposits totaled $92.9 million at December 31, 2010, a 2.3% decrease from $95.0 million at December 31, 2009. At December 31, 2010, noninterest-bearing deposits were approximately 16.1% of total deposits, a decrease from the 2009 level of 16.7%. Noninterest-bearing deposits at December 31, 2010 were comprised of $83.1 million in business checking accounts, $1.7 million in public funds, and $8.1 million in consumer accounts.
Interest-bearing deposits increased by $10.1 million, or 2.1%, during 2010 and ended at $483.5 million compared to $473.4 million at December 31, 2009. Interest-bearing deposits at December 31, 2010 were comprised of approximately 35.4% in money market accounts, 25.6% in interest-bearing checking and savings accounts, and 39.0% in certificates of deposit. The December 31, 2010 percentages reflect a modest change in the deposit mix from 2009, when the percentages were 32.1%, 22.8%, and 45.1%, respectively.
Interest-bearing checking, money markets, savings, and brokered deposits all increased from 2009 to 2010. The largest increase was in brokered deposits with increases totaling $36.8 million, which were comprised of increases in brokered certificates of deposit of $24.8 million and brokered money market accounts of $12.0 million. The growth in brokered CD’s was purposeful as we took advantage of the favorable rate environment to lock in low rates for an extended period of time. During the first half of 2010, we purchased $35.2 million of brokered certificates of deposit with terms ranging from two years to ten years, with an average life of just more than six years. The average rate on our brokered CD purchases was 3.0%. The second largest increase was in the interest-bearing checking category, as they increased by $11.4 million, or 12.7%. The large increase came from our consumer and health-savings accounts. Health savings accounts continue to be a high growth, low cost product for us which is reflected by increases in balances of $11.2 million from 2008 to 2009 and $14.4 million from 2009 to 2010. As of December 31, 2010, we had over 35,000 active health savings accounts. Money market accounts increased by $7.2 million, or 4.8%, as customers searched for a higher interest product without locking in to a long term product, such as a certificate of deposit. CDs under $100,000 and CDs over $100,000 decreased by $21.8 million and $28.0 million, respectively, in 2010. Several of the CD rates we offered are tied to a key rate, such as prime or the fed funds rate. When the fed funds rate went down to 0.25% in December 2008, many customers decided to move their money from this product.
44
We had no short-term borrowings at December 31, 2010 or December 31, 2009. We did have borrowings in the amount of $7.5 million in FHLB bullet advances at December 31, 2010 compared to $16.2 million in FHLB bullet advances and $27.0 million in variable rate advances at December 31, 2009. The decrease in FHLB borrowings during 2010 was primarily due to an increase in total deposits.
We had $17.5 million of aggregate principal amount in junior subordinated debenture outstanding at December 31, 2010 and 2009. We currently have two statutory trust subsidiaries. TCT2 effected a private placement of $8.0 million in Trust Preferred Securities on December 5, 2005. TCT3 effected a private placement of $9.0 million on December 29, 2006. The proceeds were loaned to us in exchange for junior subordinated debentures with similar terms to the Trust Preferred Securities. These securities are considered Tier I capital (with certain limitations applicable) under current regulatory guidelines.
The junior subordinated debentures are subject to mandatory redemption, in whole or in part, upon repayment of the Trust Preferred Securities at maturity or their earlier redemption at the par amount. The maturity date of the Trust Preferred Securities issued by TCT2 is December 4, 2035. Subject to our having received prior approval of the Federal Reserve Bank, if then required, the Trust Preferred Securities became redeemable prior to the maturity date as of December 5, 2010 and each year thereafter at our option. At December 4, 2010, the interest rate on TCT2 moved to a floating rate of three month LIBOR plus 134 basis points, or 1.64% as of December 31, 2010, as we chose not redeem it at that point. The maturity date of the Trust Preferred Securities issued by TCT3 is December 29, 2037. Subject to our having received prior approval of the Federal Reserve Bank, if then required, the Trust Preferred Securities are redeemable prior to the maturity date beginning December 29, 2011 and each year thereafter at our option. At December 29, 2011, the interest rate on TCT3 will move to a floating rate of three month LIBOR plus 169 basis points, unless we choose to redeem it at that point.
In January 2008, at the request of our regulators, our Board of Directors adopted a resolution requiring that we seek written approval from the Federal Reserve prior to incurring any additional parent company debt, including the addition of Trust Preferred Securities and advances on any existing lines of credit. In January 2010, our Board of Directors adopted a resolution that supersedes the one from January 2008 that states the Company will refrain from making interest payments of interest on existing Trust Preferred Securities without first obtaining written approval from the Federal Reserve Bank. Per the debenture agreements, we have the ability to defer payment of the interest for twenty consecutive quarters. During 2010, we sent the written notice each quarter beginning with the first quarter of 2010 to the Trustees of the Trust Preferred Securities stating that we elected to defer payment of the interest. While no payments of interest were made in 2010, we continued to accrue the payments for each quarter. This is the primary reason for the increase in the accrued interest payable of $934,828 from 2009 to 2010.
In May 2007, our Board of Directors authorized the repurchase of up to 65,000 shares of outstanding common stock. By December 31, 2008, all 65,000 approved shares were repurchased at an average price of $13.61. Our Board also adopted a resolution requiring that we seek approval from the Federal Reserve prior to repurchasing any further shares in an amount exceeding $50,000, other than those shares covered by the May 2007 repurchase plan. This resolution was also at the request of our regulators.
On September 25, 2009, we sold 18,300 shares of Series A Convertible Preferred Stock in the net amount of $1.8 million. Each share was sold for $100 each and is convertible into Tower Financial Corporation common stock at a price per share of $6.02, which is a 30% premium on the common stock market price on the purchase date, September 25, 2009. The Series A Convertible Preferred Stock has no expiration date; however, Tower Financial Corporation has the right to call the shares on or after September 25, 2012 until September 24, 2013 at 110% of par, after September 25, 2013 until September 24, 2014 at 105% of par, and at par after September 25, 2014. The Series A Convertible Preferred Stock qualifies as Tier 1 capital and pays quarterly dividends at a rate of Prime plus 2%, with a ceiling of 9.25%, per annum upon the approval of the Board of Directors. During 2010, 10,550 preferred stock shares converted to 175,249 shares of common stock at a price of $6.02 per common stock share. No dividends were paid on preferred stock in 2010 and $1,579 in dividends were paid in 2009.
45
On May 5, 2010, we entered into a written agreement with the Federal Reserve and the IDFI, effective April 23, 2010 (the “Written Agreement”). The Written Agreement does not contain any requirements to increase capital over and above the bank’s current “well-capitalized” status and does not impose any other capital ratio requirements. Among other things, the Written Agreement requires that the Company will not pay dividends or redeem any preferred or common stock or other capital stock, or make interest payments on its Trust Preferred Debt, without written approval from the Federal Reserve. In 2010, we complied with the Written Agreement and made no dividends on common or preferred stock and we elected to defer our interest payments on our Trust Preferred Debt.
Stockholders’ equity was $53.1 million at December 31, 2010 and $46.9 million at December 31, 2009. The increase of $6.2 million was mainly attributable to net income of $3.2 million posted in 2010 and a private placement of common stock with net proceeds of $2.8 million. Other items affecting stockholders’ equity was a $155,152 increase in net unrealized appreciation on securities available for sale and derivative instruments, net of tax and stock compensation expense of $46,910. At December 31, 2010, we had a balance of $8.5 million in retained earnings while at December 31, 2009 the balance was $5.3 million, an increase of $3.2 million from 2009 due to net income posted in 2010. See “Results of Operations.”
46
|
ITEM 7A.
|
QUANTITATIVE AND QUALITATIVE DISCLOSURES ABOUT MARKET RISK.
|
Market Risk Analysis
Our primary market risk exposure is interest rate risk and, to a lesser extent, liquidity risk. All of the Company’s transactions are denominated in U.S. dollars with no specific foreign exchange exposure. The Company has no agricultural-related loan assets and therefore has no significant exposure to changes in commodity prices. Any impact that changes in foreign exchange rates and commodity prices would have on interest rates is assumed to be insignificant.
Interest rate risk is the exposure of our financial condition to adverse movements in interest rates. We derive our income primarily from the excess of interest collected on our interest-earning assets over the interest paid on our interest-bearing liabilities. The rates of interest we earn on our assets and owe on our liabilities generally are established contractually for a period of time. Since market interest rates change over time, we are exposed to lower profitability if we cannot adapt to interest rate changes. Accepting interest rate risk can be an important source of profitability and stockholder value; however, excessive levels of interest rate risk could pose a significant threat to our earnings and capital base. Accordingly, effective risk management that maintains interest rate risk at prudent levels is essential to our safety and soundness.
Evaluating the exposure to changes in interest rates includes assessing both the adequacy of the process used to control interest rate risk and the quantitative level of exposure. Our interest rate risk management process seeks to ensure that appropriate policies, procedures, management information and internal controls are in place to maintain interest rate risk at prudent levels with consistency and continuity. In evaluating the quantitative level of interest rate risk, we assess the existing and potential future effects of changes in interest rates on our financial condition, including capital adequacy, earnings, liquidity and overall asset quality.
There are two interest rate risk measurement techniques that we may use. The first, which is commonly referred to as GAP analysis, measures the difference between the dollar amount of interest-sensitive assets and liabilities that will be refinanced or repriced during a given time period. A significant repricing gap could result in a negative impact to our net interest margin during periods of changing market interest rates.
47
The following table describes our position as of December 31, 2010:
Rate Sensitivity Analysis
|
($ in thousands)
|
Within
Three
Months
|
Three to
Twelve
Months
|
One to
Five
Years
|
After
Five
Years
|
Total
|
|||||||||||||||
|
Assets
|
||||||||||||||||||||
|
Federal funds sold, short-term investments and interest-earning deposits
|
$ | 5,957 | $ | 5,957 | ||||||||||||||||
|
Securities available for sale
|
9,086 | 19,687 | 43,197 | 38,139 | 110,109 | |||||||||||||||
|
FHLBI and FRB stock
|
- | - | - | 4,075 | 4,075 | |||||||||||||||
|
Loans held for sale
|
2,141 | - | - | - | 2,141 | |||||||||||||||
|
Fixed rate loans
|
29,630 | 51,213 | 137,147 | 48,659 | 266,649 | |||||||||||||||
|
Variable rate loans
|
55,755 | 86,720 | 75,088 | 2,702 | 220,265 | |||||||||||||||
|
Allowance for loan losses
|
- | - | - | - | (12,489 | ) | ||||||||||||||
|
Other assets
|
- | - | - | - | 63,221 | |||||||||||||||
|
Total assets
|
$ | 102,569 | $ | 157,620 | $ | 255,432 | $ | 93,575 | $ | 659,928 | ||||||||||
|
Liabilities
|
||||||||||||||||||||
|
Interest-bearing checking
|
$ | 101,158 | $ | - | $ | - | $ | - | $ | 101,158 | ||||||||||
|
Savings accounts
|
22,673 | - | - | - | 22,673 | |||||||||||||||
|
Money market accounts
|
159,336 | - | - | - | 159,336 | |||||||||||||||
|
Time deposits < $100,000
|
8,236 | 27,202 | 20,008 | 4 | 55,450 | |||||||||||||||
|
Time deposits $100,000 and over
|
8,308 | 17,282 | 13,767 | - | 39,357 | |||||||||||||||
|
Brokered deposit - money market
|
12,016 | - | - | - | 12,016 | |||||||||||||||
|
Brokered deposit - certificate of deposit
|
7,133 | 24,933 | 36,855 | 24,572 | 93,493 | |||||||||||||||
|
Short-term borrowings
|
- | - | - | - | - | |||||||||||||||
|
FHLB advances
|
3,500 | - | 4,000 | - | 7,500 | |||||||||||||||
|
Junior subordinated debt
|
8,000 | 9,527 | - | - | 17,527 | |||||||||||||||
|
Noninterest-bearing checking
|
92,873 | - | - | - | 92,873 | |||||||||||||||
|
Other liabilities
|
- | - | - | - | 5,416 | |||||||||||||||
|
Total liabilities
|
423,233 | 78,944 | 74,630 | 24,576 | 606,799 | |||||||||||||||
|
Stockholders' Equity
|
- | - | - | - | 53,129 | |||||||||||||||
|
Total sources of funds
|
$ | 423,233 | $ | 78,944 | $ | 74,630 | $ | 24,576 | $ | 659,928 | ||||||||||
|
Net asset (liability) GAP
|
$ | (320,664 | ) | $ | 78,676 | $ | 180,802 | $ | 68,999 | |||||||||||
|
Cumulative GAP
|
$ | (320,664 | ) | $ | (241,988 | ) | $ | (61,186 | ) | $ | 7,813 | |||||||||
|
Percent of cumulative GAP to total assets
|
-48.6 | % | -36.7 | % | -9.3 | % | 1.2 | % | ||||||||||||
A second interest rate risk measurement used is commonly referred to as net interest income simulation analysis. A simulation model assesses the direction and magnitude of variations in net interest income resulting from potential changes in market interest rates. Key assumptions in the model include prepayment speeds on various loan and investment assets; cash flows and maturities of interest-sensitive assets and liabilities; and changes in market conditions impacting loan and deposit volume and pricing. These assumptions are inherently uncertain, subject to fluctuation and revision in a dynamic environment; therefore, a model cannot precisely estimate net interest income or exactly predict the impact of higher or lower interest rates on net interest income. Actual results will differ from simulated results due to timing, magnitude, and frequency of interest rate changes and changes in market conditions and our strategies, among other factors. As growth has dictated, we began utilizing simulation analysis as a tool for measuring the effects of interest rate risk on the income statement at the end of 2003.
In addition to changes in interest rates, the level of future net interest income is also dependent on a number of other variables, including the growth, composition and absolute levels of loans, deposits, and other earning assets and interest-bearing liabilities; economic and competitive conditions; potential changes in lending, investing, and deposit gathering strategies; client preferences; and other factors.
The following table provides information about our financial instruments used for purposes other than trading that are rate sensitive to changes in interest rates as of December 31, 2010. It does not provide when these items may actually reprice. For loans receivable, securities, and liabilities with contractual maturities, the table presents principal cash flows and related weighted-average interest rates by contractual maturities as well as our historical experience of the impact of interest rate fluctuations on the prepayment of loans and mortgage backed securities. For core deposits (demand deposits, interest-bearing checking, savings, and money market deposits) that have no contractual maturity, the table presents principal cash flows and, as applicable related weighted-average interest rates based upon our historical experience, and management’s judgment as applicable, concerning their most likely withdrawal behaviors. The current historical interest rates for core deposits have been assumed to apply for future periods in this table as the actual interest rates that will need to be paid to maintain these deposits are not currently known. Weighted average variable rates are based upon contractual rates existing at the report date.
48
|
($ in thousands)
|
Fair Value
|
|||||||||||||||||||||||||||||||
|
2011
|
2012
|
2013
|
2014
|
2015
|
Thereafter
|
Total
|
12/31/2010
|
|||||||||||||||||||||||||
|
Rate sensitive assets:
|
||||||||||||||||||||||||||||||||
|
Fixed interest rate loans
|
$ | 80,843 | $ | 57,318 | $ | 34,482 | $ | 22,782 | $ | 22,565 | $ | 48,659 | $ | 266,649 | $ | 270,439 | ||||||||||||||||
|
Average interest rate
|
5.60 | % | 5.85 | % | 5.66 | % | 5.76 | % | 5.98 | % | 5.18 | % | 5.63 | % | ||||||||||||||||||
|
Variable interest rate loans
|
142,475 | 41,029 | 18,601 | 2,447 | 3,011 | 2,702 | 210,265 | 220,265 | ||||||||||||||||||||||||
|
Average interest rate
|
4.56 | % | 4.19 | % | 4.10 | % | 4.39 | % | 4.62 | % | 3.61 | % | 4.43 | % | ||||||||||||||||||
|
Fixed interest rate securities
|
28,773 | 17,841 | 12,276 | 8,610 | 4,470 | 36,124 | 108,094 | 108,094 | ||||||||||||||||||||||||
|
Average interest rate
|
3.56 | % | 3.89 | % | 4.48 | % | 4.22 | % | 4.73 | % | 3.90 | % | 3.93 | % | ||||||||||||||||||
|
Variable interest rate securities
|
- | - | - | - | - | 2,014 | 2,014 | 2,014 | ||||||||||||||||||||||||
|
Average interest rate
|
0.00 | % | 0.00 | % | 0.00 | % | 0.00 | % | 0.00 | % | 4.58 | % | 4.58 | % | ||||||||||||||||||
|
Other interest bearing assets
|
5,957 | - | - | - | - | - | 5,957 | 5,957 | ||||||||||||||||||||||||
|
Average interest rate
|
1.28 | % | 0.00 | % | 0.00 | % | 0.00 | % | 0.00 | % | 0.00 | % | 1.28 | % | ||||||||||||||||||
|
Rate sensitive liabilities:
|
||||||||||||||||||||||||||||||||
|
Interest bearing checking
|
28,096 | 20,286 | 14,648 | 10,576 | 7,637 | 19,915 | 101,158 | 101,158 | ||||||||||||||||||||||||
|
Average interest rate
|
0.23 | % | 0.23 | % | 0.23 | % | 0.23 | % | 0.23 | % | 0.23 | % | 0.23 | % | ||||||||||||||||||
|
Savings accounts
|
6,690 | 4,715 | 3,324 | 2,343 | 1,652 | 3,948 | 22,672 | 22,672 | ||||||||||||||||||||||||
|
Average interest rate
|
0.36 | % | 0.36 | % | 0.36 | % | 0.36 | % | 0.36 | % | 0.36 | % | 0.36 | % | ||||||||||||||||||
|
Money market accounts
|
68,808 | 39,248 | 22,232 | 12,593 | 7,134 | 9,321 | 159,336 | 159,336 | ||||||||||||||||||||||||
|
Average interest rate
|
0.60 | % | 0.60 | % | 0.60 | % | 0.60 | % | 0.60 | % | 0.60 | % | 0.60 | % | ||||||||||||||||||
|
Time deposits
|
61,028 | 30,556 | 1,838 | 486 | 895 | 4 | 94,807 | 95,818 | ||||||||||||||||||||||||
|
Average interest rate
|
1.69 | % | 2.05 | % | 2.75 | % | 2.67 | % | 2.16 | % | 5.16 | % | 1.83 | % | ||||||||||||||||||
|
Brokered Deposits - Money Markets
|
5,209 | 2,951 | 1,672 | 947 | 536 | 701 | 12,016 | 12,016 | ||||||||||||||||||||||||
|
Average interest rate
|
0.59 | % | 0.59 | % | 0.59 | % | 0.59 | % | 0.59 | % | 0.59 | % | 0.59 | % | ||||||||||||||||||
|
Brokered Deposits - Certificate of Deposits
|
32,066 | 19,530 | 7,218 | 3,021 | 7,086 | 24,572 | 93,493 | 95,259 | ||||||||||||||||||||||||
|
Average interest rate
|
1.73 | % | 3.04 | % | 2.41 | % | 2.25 | % | 2.75 | % | 3.48 | % | 2.61 | % | ||||||||||||||||||
|
Fixed interest rate borrowings
|
3,500 | 2,000 | 2,000 | - | - | 17,527 | 25,027 | 25,669 | ||||||||||||||||||||||||
|
Average interest rate
|
3.57 | % | 3.55 | % | 3.81 | % | 0.00 | % | 0.00 | % | 6.40 | % | 5.54 | % | ||||||||||||||||||
|
Variable interest rate borrowings
|
- | - | - | - | - | - | - | - | ||||||||||||||||||||||||
|
Average interest rate
|
0.00 | % | 0.00 | % | 0.00 | % | 0.00 | % | 0.00 | % | 0.00 | % | 0.00 | % | ||||||||||||||||||
49
|
ITEM 8.
|
FINANCIAL STATEMENTS AND SUPPLEMENTARY DATA.
|
Tower Financial Corporation
Consolidated Balance Sheets
At December 31, 2010 and 2009
|
2010
|
2009
|
|||||||
|
ASSETS
|
||||||||
|
Cash and due from banks
|
$ | 24,717,935 | $ | 19,861,434 | ||||
|
Short-term investments and interest-earning deposits
|
3,313,006 | 1,259,197 | ||||||
|
Federal funds sold
|
1,648,441 | 3,543,678 | ||||||
|
Total cash and cash equivalents
|
29,679,382 | 24,664,309 | ||||||
|
Long-term interest-earning deposits
|
996,000 | - | ||||||
|
Securities held to maturity, at cost (fair value of $4,635,616 in 2009)
|
- | 4,495,977 | ||||||
|
Securities available for sale, at fair value
|
110,108,656 | 85,179,160 | ||||||
|
FHLB and FRB stock
|
4,075,100 | 4,250,800 | ||||||
|
Loans held for sale
|
2,140,872 | 3,842,089 | ||||||
|
Loans
|
486,914,115 | 527,333,461 | ||||||
|
Allowance for loan losses
|
(12,489,400 | ) | (11,598,389 | ) | ||||
|
Net loans
|
474,424,715 | 515,735,072 | ||||||
| - | - | |||||||
|
Premises and equipment, net
|
8,329,718 | 8,011,574 | ||||||
|
Accrued interest receivable
|
2,391,953 | 2,439,859 | ||||||
|
Bank owned life insurance
|
13,516,789 | 13,046,573 | ||||||
|
Other Real Estate Owned
|
4,284,263 | 4,634,089 | ||||||
|
Prepaid FDIC Insurance
|
2,864,527 | 4,777,797 | ||||||
|
Other assets
|
7,116,280 | 9,081,759 | ||||||
|
Total assets
|
$ | 659,928,255 | $ | 680,159,058 | ||||
|
LIABILITIES AND STOCKHOLDERS' EQUITY
|
||||||||
|
LIABILITIES
|
||||||||
|
Deposits:
|
||||||||
|
Noninterest-bearing
|
$ | 92,872,957 | $ | 95,027,233 | ||||
|
Interest-bearing
|
483,483,179 | 473,353,118 | ||||||
|
Total deposits
|
576,356,136 | 568,380,351 | ||||||
| - | - | |||||||
|
Federal Home Loan Bank (FHLB) advances
|
7,500,000 | 43,200,000 | ||||||
|
Junior subordinated debt
|
17,527,000 | 17,527,000 | ||||||
|
Accrued interest payable
|
1,415,713 | 480,885 | ||||||
|
Other liabilities
|
4,000,654 | 3,634,713 | ||||||
|
Total liabilities
|
606,799,503 | 633,222,949 | ||||||
|
STOCKHOLDERS' EQUITY
|
||||||||
|
Preferred stock, no par value, 4,000,000 shares authorized; 7,750and 18,300 shares issued and outstanding at December 31, 2010and December 31, 2009, respectively
|
757,213 | 1,788,000 | ||||||
|
Common stock and paid-in-capital, no par value, 6,000,000 shares authorized; 4,789,023 and 4,155,432 issued; and 4,724,023and 4,090,432 shares outstanding at December 31, 2010and December 31, 2009, respectively
|
43,740,155 | 39,835,648 | ||||||
|
Treasury stock, at cost, 65,000 shares at December 31, 2010and December 31, 2009
|
(884,376 | ) | (884,376 | ) | ||||
|
Retained earnings
|
8,450,579 | 5,286,808 | ||||||
|
Accumulated other comprehensive income, net of tax of $548,730 in 2010 and $468,803 in 2009
|
1,065,181 | 910,029 | ||||||
|
Total stockholders' equity
|
53,128,752 | 46,936,109 | ||||||
|
Total liabilities and stockholders' equity
|
$ | 659,928,255 | $ | 680,159,058 | ||||
The following notes are an integral part of the financial statements.
50
Tower Financial Corporation
Consolidated Statements of Operations
For the years ended December 31, 2010, 2009, and 2008
|
2010
|
2009
|
2008
|
||||||||||
|
Interest income:
|
||||||||||||
|
Loans, including fees
|
$ | 26,847,111 | $ | 28,035,871 | $ | 33,808,068 | ||||||
|
Securities - taxable
|
2,502,200 | 3,066,247 | 2,728,861 | |||||||||
|
Securities - tax exempt
|
1,071,876 | 951,942 | 883,645 | |||||||||
|
Other interest income
|
31,334 | 13,363 | 337,828 | |||||||||
|
Total interest income
|
30,452,521 | 32,067,423 | 37,758,402 | |||||||||
|
Interest expense:
|
||||||||||||
|
Deposits
|
6,566,581 | 10,315,149 | 14,489,483 | |||||||||
|
Short-term borrowings
|
138 | 1,656 | 4,208 | |||||||||
|
FHLB advances
|
465,756 | 801,803 | 1,161,902 | |||||||||
|
Junior subordinated debt
|
1,158,956 | 1,128,017 | 1,129,440 | |||||||||
|
Total interest expense
|
8,191,431 | 12,246,625 | 16,785,033 | |||||||||
|
Net interest income
|
22,261,090 | 19,820,798 | 20,973,369 | |||||||||
|
Provision for loan losses
|
4,745,000 | 10,735,000 | 4,399,000 | |||||||||
|
Net interest income after provision for loan losses
|
17,516,090 | 9,085,798 | 16,574,369 | |||||||||
|
Noninterest income:
|
||||||||||||
|
Trust and brokerage fees
|
3,604,907 | 3,373,635 | 3,519,425 | |||||||||
|
Service charges
|
1,125,707 | 1,121,446 | 1,204,019 | |||||||||
|
Loan broker fees
|
720,615 | 685,632 | 251,014 | |||||||||
|
Net gain on sale of securities
|
1,109,743 | 264,112 | 65,841 | |||||||||
|
Other-than-temporary loss:
|
||||||||||||
|
Total impairment loss
|
(158,303 | ) | (274,503 | ) | - | |||||||
|
Loss recognized in other comprehensive income
|
- | 476,267 | - | |||||||||
|
Net impairment loss recognized in earnings
|
(158,303 | ) | (750,770 | ) | - | |||||||
|
Earnings from Bank Owned Life Insurance
|
470,216 | 456,874 | 438,241 | |||||||||
|
Other income
|
941,219 | 936,903 | 824,305 | |||||||||
|
Total noninterest income
|
7,814,104 | 6,087,832 | 6,302,845 | |||||||||
|
Noninterest expense:
|
||||||||||||
|
Salaries and benefits
|
9,578,932 | 10,947,014 | 11,460,652 | |||||||||
|
Occupancy and equipment
|
2,533,688 | 2,905,929 | 2,974,697 | |||||||||
|
Marketing
|
423,443 | 451,862 | 651,423 | |||||||||
|
Data processing
|
1,128,096 | 1,172,625 | 1,050,275 | |||||||||
|
Loan and professional costs
|
1,629,582 | 1,649,511 | 1,312,956 | |||||||||
|
Office supplies and postage
|
245,938 | 348,230 | 402,485 | |||||||||
|
Courier services
|
221,756 | 236,928 | 297,106 | |||||||||
|
Business development
|
406,775 | 456,483 | 639,707 | |||||||||
|
Communications Expense
|
186,164 | 181,393 | 351,137 | |||||||||
|
FDIC Insurance Premiums
|
2,059,524 | 1,681,862 | 697,063 | |||||||||
|
Other Real Estate Owned, net
|
1,703,791 | 1,724,626 | (82,945 | ) | ||||||||
|
Other expense
|
1,125,007 | 1,241,141 | 1,233,545 | |||||||||
|
Total noninterest expense
|
21,242,696 | 22,997,604 | 20,988,101 | |||||||||
|
Income/(loss) before income taxes
|
4,087,498 | (7,823,974 | ) | 1,889,113 | ||||||||
|
Income tax expense/(benefit)
|
923,727 | (2,216,637 | ) | 23,004 | ||||||||
|
Net income/(loss)
|
$ | 3,163,771 | $ | (5,607,337 | ) | $ | 1,866,109 | |||||
|
Less: Preferred Stock Dividends
|
- | 1,579 | - | |||||||||
|
Net income/(loss) available to common shareholders
|
$ | 3,163,771 | $ | (5,608,916 | ) | $ | 1,866,109 | |||||
The following notes are an integral part of the financial statements.
51
Tower Financial Corporation
Consolidated Statements of Operations (Continued)
For the years ended December 31, 2010, 2009, and 2008
|
2010
|
2009
|
2008
|
||||||||||
|
Net income (loss):
|
$ | 3,163,771 | $ | (5,607,337 | ) | $ | 1,866,109 | |||||
|
Other comprehensive income (loss) net of tax:
|
||||||||||||
|
Unrealized appreciation (depreciation) on available for sale securities
|
(46,227 | ) | 760,342 | (879,712 | ) | |||||||
|
Unrealized gain (loss) on held to maturity securities transferred to available for sale
|
201,379 | - | - | |||||||||
|
Unrealized gain (loss) on cash flow hedge
|
- | 309,637 | 444,769 | |||||||||
|
Total comprehensive income (loss)
|
$ | 3,318,923 | $ | (4,537,358 | ) | $ | 1,431,166 | |||||
|
Basic earnings (loss) per common share
|
0.73 | (1.37 | ) | 0.46 | ||||||||
|
Diluted earnings (loss) per common share
|
0.69 | (1.37 | ) | 0.46 | ||||||||
|
Average common shares outstanding
|
4,334,084 | 4,090,416 | 4,070,311 | |||||||||
|
Average common shares and dilutive potential common shares outstanding
|
4,558,918 | 4,090,416 | 4,074,053 | |||||||||
|
Dividends declared per share
|
$ | - | $ | - | $ | 0.044 | ||||||
The following notes are an integral part of the financial statements.
52
Tower Financial Corporation
Consolidated Statements of Changes in Stockholders' Equity
For the years ended December 31, 2010, 2009, and 2008
|
Preferred
Stock
|
Common
Stock and
Paid-in
Capital
|
Retained
Earnings
|
Accumulated
Other
Comprehensive
Income (Loss)
|
Treasury
Stock
|
Total
|
|||||||||||||||||||
|
Balance, January 1, 2008
|
$ | - | $ | 39,482,669 | $ | 9,208,719 | $ | 274,993 | $ | (758,827 | ) | $ | 48,207,554 | |||||||||||
|
Net income (loss) for 2008
|
1,866,109 | 1,866,109 | ||||||||||||||||||||||
|
Other Comprehensive Income (Loss) (See Note 19)
|
(434,943 | ) | (434,943 | ) | ||||||||||||||||||||
|
Total Comprehensive Income (Loss)
|
1,431,166 | |||||||||||||||||||||||
|
Cash dividends paid ($0.044 per share)
|
(179,104 | ) | (179,104 | ) | ||||||||||||||||||||
|
Stock based compensation expense
|
63,434 | 63,434 | ||||||||||||||||||||||
|
Issuance of 22,127 shares of common stock for stock options exercised, and related tax benefit
|
220,639 | 220,639 | ||||||||||||||||||||||
|
Issuance of 13,500 shares of restricted stock
|
||||||||||||||||||||||||
|
Repurchase of 11,964 shares of common stock
|
(125,549 | ) | (125,549 | ) | ||||||||||||||||||||
|
Balance, December 31, 2008
|
$ | - | $ | 39,766,742 | $ | 10,895,724 | $ | (159,950 | ) | $ | (884,376 | ) | $ | 49,618,140 | ||||||||||
|
Net income (loss) for 2009
|
(5,607,337 | ) | (5,607,337 | ) | ||||||||||||||||||||
|
Other Comprehensive Income (Loss) (See Note 19)
|
1,069,979 | 1,069,979 | ||||||||||||||||||||||
|
Total Comprehensive Income (Loss)
|
(4,537,358 | ) | ||||||||||||||||||||||
|
Stock based compensation expense
|
68,906 | 68,906 | ||||||||||||||||||||||
|
Issuance of 18,300 shares of Series A Convertible Preferred Stock (Net)
|
1,788,000 | 1,788,000 | ||||||||||||||||||||||
|
Issuance of 6,000 shares of restricted stock
|
- | - | ||||||||||||||||||||||
|
Preferred stock dividends
|
(1,579 | ) | (1,579 | ) | ||||||||||||||||||||
|
Balance, December 31, 2009
|
$ | 1,788,000 | $ | 39,835,648 | $ | 5,286,808 | $ | 910,029 | $ | (884,376 | ) | $ | 46,936,109 | |||||||||||
|
Net income for 2010
|
3,163,771 | 3,163,771 | ||||||||||||||||||||||
|
Other Comprehensive Income (Loss) (See Note 19)
|
155,152 | 155,152 | ||||||||||||||||||||||
|
Total Comprehensive Income (Loss)
|
3,318,923 | |||||||||||||||||||||||
|
Issuance of 458,342 common shares, net of offering expenses of $78,912
|
2,826,810 | 2,826,810 | ||||||||||||||||||||||
|
Conversion of 10,550 preferred shares into 175,249 common shares
|
(1,030,787 | ) | 1,030,787 | - | ||||||||||||||||||||
|
Stock based compensation expense
|
46,910 | 46,910 | ||||||||||||||||||||||
|
Balance, December 31, 2010
|
$ | 757,213 | $ | 43,740,155 | $ | 8,450,579 | $ | 1,065,181 | $ | (884,376 | ) | $ | 53,128,752 | |||||||||||
The following notes are an integral part of the financial statements.
53
Tower Financial Corporation
Consolidated Statements of Cash Flows
For the years ended December 31, 2010, 2009, and 2008
|
2010
|
2009
|
2008
|
||||||||||
|
Cash flows from operating activities:
|
||||||||||||
|
Net income/(loss)
|
$ | 3,163,771 | $ | (5,607,337 | ) | $ | 1,866,109 | |||||
|
Adjustments to reconcile net income/(loss) to net cash from operating activities:
|
||||||||||||
|
Depreciation and amortization
|
1,655,025 | 1,287,785 | 1,350,732 | |||||||||
|
Provision for loan losses
|
4,745,000 | 10,735,000 | 4,399,000 | |||||||||
|
Stock based compensation expense
|
46,910 | 68,906 | 63,434 | |||||||||
|
Earnings on life insurance
|
(470,216 | ) | (456,874 | ) | (431,182 | ) | ||||||
|
(Gain)Loss on sale of available for sale (HTM) securities
|
(888,059 | ) | - | - | ||||||||
|
(Gain)Loss on sale of available for sale (AFS) securities
|
(221,684 | ) | (264,112 | ) | (65,841 | ) | ||||||
|
(Gain)Loss on sale of premises and equipment
|
678 | 2,605 | (36,697 | ) | ||||||||
|
Loans originated for sale
|
(37,884,773 | ) | (35,134,953 | ) | (9,789,251 | ) | ||||||
|
Impairment on available for sale securities
|
158,303 | 750,770 | - | |||||||||
|
Gain on settlement of interest rate floor
|
- | (364,766 | ) | (413,133 | ) | |||||||
|
(Gain)Loss on Sale of Other Real Estate Owned
|
54,790 | 287,622 | (221,580 | ) | ||||||||
|
Write-downs of Other Real Estate Owned
|
1,362,441 | 1,131,067 | 83,000 | |||||||||
|
Proceeds from the sale of loan held for sale
|
39,585,990 | 31,444,478 | 9,637,637 | |||||||||
|
Change in accrued interest receivable
|
47,906 | 175,401 | 631,195 | |||||||||
|
Change in other assets
|
3,798,823 | (7,603,432 | ) | 541,421 | ||||||||
|
Change in accrued interest payable
|
934,828 | (178,071 | ) | (1,063,016 | ) | |||||||
|
Change in other liabilities
|
365,941 | 291,800 | 95,768 | |||||||||
|
Net cash from operating activities
|
16,455,674 | (3,434,111 | ) | 6,647,596 | ||||||||
|
Cash flows from investing activities:
|
||||||||||||
|
Net change in long-term interest bearing deposits
|
(996,000 | ) | - | - | ||||||||
|
Net change in loans
|
31,547,695 | 19,323,776 | 10,229,588 | |||||||||
|
Proceeds from sales of loans
|
- | - | 3,189,545 | |||||||||
|
Purchase of securities AFS
|
(53,141,782 | ) | (32,296,763 | ) | (30,182,197 | ) | ||||||
|
Purchase of securities HTM
|
(1,721,320 | ) | (4,899,228 | ) | - | |||||||
|
Purchase of FHLB and FRB stock
|
(75,000 | ) | (218,354 | ) | (442,746 | ) | ||||||
|
Repurchase of FHLB and FRB stock
|
250,700 | - | - | |||||||||
|
Proceeds from settlement of interest rate floor
|
- | - | 833,750 | |||||||||
|
Purchase of life insurance
|
- | - | (900,000 | ) | ||||||||
|
Proceeds from maturities of securities AFS
|
24,724,045 | 16,745,343 | 11,661,108 | |||||||||
|
Proceeds from maturities of securities HTM
|
802,365 | 403,251 | - | |||||||||
|
Proceeds from sale of securities AFS
|
8,327,894 | 9,483,978 | 5,187,454 | |||||||||
|
Proceeds from sale of securities HTM
|
900,784 | |||||||||||
|
Purchase of premises, equipment, and leasehold improvements
|
(1,112,834 | ) | (1,111,542 | ) | (564,993 | ) | ||||||
|
Proceeds on Sale of Other Real Estate Owned
|
3,950,257 | 1,161,928 | 1,563,504 | |||||||||
|
Proceeds from sale of premises and equipment
|
- | - | 946,978 | |||||||||
|
Net cash used in investing activities
|
13,456,804 | 8,592,389 | 1,521,991 | |||||||||
|
Cash flows from financing activities:
|
||||||||||||
|
Net change in deposits
|
7,975,785 | (17,856,763 | ) | (14,452,357 | ) | |||||||
|
Gross proceeds from issuance of common stock
|
||||||||||||
|
from exercise of stock options
|
- | - | 220,639 | |||||||||
|
Proceeds from issuance of preferred stock
|
- | 1,788,000 | - | |||||||||
|
Gross proceeds from issuance of common stock
|
2,826,810 | - | - | |||||||||
|
Cash dividends paid on preferred stock
|
- | (1,579 | ) | - | ||||||||
|
Cash dividends paid on common stock
|
- | - | (179,104 | ) | ||||||||
|
Repayment of long-term FHLB advances
|
(8,700,000 | ) | (9,000,000 | ) | 550,000 | |||||||
|
Repayment of short-term FHLB advances
|
(27,000,000 | ) | 13,000,000 | 3,550,000 | ||||||||
|
Repurchase of common stock
|
- | - | (125,549 | ) | ||||||||
|
Net cash from financing activities
|
(24,897,405 | ) | (12,070,342 | ) | (10,436,371 | ) | ||||||
|
Net change in cash and cash equivalents
|
5,015,073 | (6,912,064 | ) | (2,266,784 | ) | |||||||
|
Cash and cash equivalents, beginning of period
|
$ | 24,664,309 | $ | 31,576,373 | $ | 33,830,389 | ||||||
|
Cash and cash equivalents, end of period
|
$ | 29,679,382 | $ | 24,664,309 | $ | 31,563,605 | ||||||
|
Supplemental disclosures of cash flow information
|
||||||||||||
|
Cash paid (refunded) during the year for:
|
||||||||||||
|
Interest
|
$ | 7,256,603 | $ | 12,424,696 | $ | 17,848,049 | ||||||
|
Income taxes
|
(1,140,502 | ) | 1,265,000 | 570,000 | ||||||||
|
Non-cash Items:
|
||||||||||||
|
Transfer of loans to Other Real Estate Owned
|
5,017,662 | 4,562,948 | 2,550,661 | |||||||||
|
Transfer of securities from held-to-maturity to available-for-sale
|
5,470,254 | - | - | |||||||||
The following notes are an integral part of the financial statements.
54
Tower Financial Corporation
Notes to Consolidated Financial Statements
Note 1 - Summary of Significant Accounting Policies
Nature of Operations, Industry Segments, and Concentrations of Credit Risk: Tower Financial Corporation was incorporated on July 8, 1998. Our wholly-owned banking subsidiary, Tower Bank & Trust Company (the "Bank" or “Tower Bank”), commenced operations on February 19, 1999. The Bank has a wholly-owned investment subsidiary, Tower Capital Investments, that began operations on July 1, 2006. Tower Capital Investments owns a real estate investment trust (REIT), Tower Funding Corporation, that also began operations on July 1, 2006. Tower Capital Investments and the REIT were formed to provide additional flexibility for capital generation and tax effectiveness. The Bank contributed mortgage-backed real estate loans to the REIT upon formation. The Bank has a direct wholly owned trust company subsidiary, Tower Trust Company (the “Trust Company”), that is an Indiana Corporation formed on January 1, 2006 and was previously owned by the bank holding company until December 1, 2009. The Trust provides wealth management services and was a wholly-owned subsidiary of the Company until December 1, 2009 when it was sold to the Bank. The reason for the Bank purchasing the Trust Company from the Holding Company was two-fold. First, we changed our strategic plan which enabled us to turn the Trust Company’s focus to be within the Bank’s service area as new opportunities in the local market have presented themselves over the last year. Second, the sale injected approximately $2.9 million of additional capital into the Bank in response to the market’s industry-wide demand for increasing capital. Our wholly-owned, statutory trust subsidiaries, Tower Capital Trust 2 (“TCT2”) and Tower Capital Trust 3 (“TCT3”) were formed on December 5, 2005 and December 29, 2006, respectively, for the single purpose of raising Federal Reserve approved capital through the issuance of securities known as trust preferred securities.
While our management monitors the revenue streams of all of our various products and services and financial performance is evaluated on a company-wide basis, we aggregate our operations into three reportable segments (see Note 20). We accept deposits and grant commercial, real estate, and installment loans to customers primarily in northeastern Indiana. Substantially all loans are secured by specific items of collateral including business assets, consumer assets, and real estate. Commercial loans are expected to be repaid from cash flow from operations of businesses. Real estate loans are secured by both residential and commercial real estate. At December 31, 2010, commercial and commercial real estate loans totaled approximately 72.4% of total loans, residential real estate loans totaled approximately 16.4% and home equity and consumer loans totaled approximately 11.2%. Categories by industry of commercial and commercial real estate loans at December 31, 2010 exceeding 30% of quarter-end stockholders’ equity are as follows: building, development and general contracting - $49.8 million, or 10.2%, of total loans; wholesale and retail trade - $53.9 million, or 11.1%, of total loans; real estate (including owner-occupied and investment) - $70.4 million, or 14.5%, of total loans; health care and social assistance - $44.8 million, or 9.2%, of total loans; manufacturing - $39.8 million, or 8.2%, of total loans; and accommodation and food services - $26.2 million, or 5.4%, of total loans. Other financial instruments that potentially represent concentrations of credit risk include deposit accounts in other financial institutions and federal funds sold.
Principles of Consolidation: The accompanying consolidated financial statements include the accounts of Tower Financial Corporation, Tower Bank, and Tower Trust (which effective December 1, 2009 became a subsidiary of Tower Bank).
Concentration of Credit Risk: Most of the Company’s business activity is with customers located within Allen County, Indiana. Therefore, the Company’s exposure to credit risk is significantly affected by changes in the economy in the Allen County area. Approximately 47.7% of the loan portfolio at December 31, 2010 consisted of general commercial and industrial loans primarily secured by inventory, receivables, and equipment, while 24.7% of the loan portfolio consisted of commercial loans primarily secured by real estate. The largest concentrations of credit within the commercial and commercial real estate category are represented by owner-occupied and investment real estate at $156.0 million, or 32.0%, of total loans, and building, development and general contracting at $49.8 million, or 10.2%, of total loans. While the general portfolio mix has remained about the same, the main direction the Bank has taken was to put more resources into the commercial versus the commercial real estate product.
Use of Estimates: To prepare financial statements in conformity with accounting principles generally accepted in the United States of America, management makes estimates and assumptions based on available information. These estimates and assumptions affect the amounts reported in the financial statements and the disclosures provided; future results could differ. The allowance for loan losses, impaired loan disclosures, and the fair values of securities and other financial instruments are particularly subject to change.
55
Cash Flow Reporting: Cash and cash equivalents include cash on hand, demand deposits with other financial institutions, short-term investments and federal funds sold. Cash flows are reported net for customer loan and deposit transactions and interest-earning deposits.
Securities: Securities are classified as held to maturity and carried at amortized cost when management has the positive intent and ability to hold them to maturity. Securities available for sale consist of those securities which might be sold prior to maturity due to changes in interest rates, prepayment risks, yield, availability of alternative investments, liquidity needs and other factors. Securities classified as available for sale are reported at their fair value and the related unrealized holding gain or loss is reported as other comprehensive income (loss) in stockholders’ equity, net of tax, until realized. Other securities, such as Federal Reserve Bank stock and Federal Home Loan Bank stock, are carried at cost. Premiums and discounts on securities are recognized as interest income using the interest method over the estimated life of the security. Gains and losses on the sale of securities available for sale are determined based upon amortized cost of the specific security sold. Declines in fair value of securities below their cost that are other than temporary are reflected as realized losses. In estimating other-than-temporary losses, management considers: (1) the length of time and extent that fair value has been less than cost, (2) the financial condition and near term prospects of the issuer, and (3) whether the Company has the intent to sell or more likely than not will be required to sell before its anticipated recovery. If either of the criteria regarding intent or requirement to sell is met, the entire difference between amortized cost and fair value is recognized as impairment through earnings. For debt securities that do not meet the aforementioned criteria, the amount of impairment is split into two components as follows: 1) OTTI related to credit loss, which must be recognized in the income statement and 2) other-than-temporary impairment (OTTI) related to other factors, which is recognized in other comprehensive income. The credit loss is defined as the difference between the present value of the cash flows expected to be collected and the amortized cost basis.
Loans: Loans that management has the intent and ability to hold for the foreseeable future or until maturity or payoff are reported at the principal balance outstanding, net of deferred loan fees and costs and an allowance for loan losses. Loans held for sale are reported at the lower of cost or fair value, on an aggregate basis. Loans held for sale are sold with servicing released. Interest income is reported on the interest method and includes amortization of net deferred loan fees and costs over the loan term. Interest income is not reported when full loan repayment is in doubt, typically when the loan is impaired or payments are past due over 90 days (180 days for residential mortgages). In all cases, loans are placed on nonaccrual or charged-off at an earlier date if collection of principal or interest is considered doubtful. The recorded investment in loans includes unpaid principal plus accrued interest and deferred fees, less nonaccrual interest paid, and deferred costs. Unpaid principal includes the remaining principal balance, net of any charge-offs and recoveries.
All interest accrued but not received for loans placed on nonaccrual is reversed against income. Interest received on such loans is accounted for on the cash-basis or cost recovery method, until qualifying for return to accrual. Loans are returned to accrual status when all the principal and interest amounts contractually due are brought current and future payments are reasonably assured.
Allowance for Loan Losses: Our allowance for loan losses represents management’s estimate of probable incurred losses in the loan portfolio at the balance sheet date. Additions to the allowance may result from recording provision for loan losses and recoveries, while charge-offs are deducted from the allowance. Allocation of the allowance is made for analytical purposes only, and the entire allowance is available to absorb probable and estimated credit losses inherent in the loan portfolio.
We have an established process for determining the adequacy of the allowance for loan losses that relies on various procedures and pieces of information to arrive at a range of probable outcomes. First, management allocates specific portions of the allowance for loan losses to identified problem loans. Problem loans, including commercial, commercial real estate and jumbo mortgage loans, are identified through a loan risk rating system and monitored through watchlist reporting. Specific reserves are determined for each identified credit based on delinquency rates, collateral and other risk factors identified for that credit. Second, management’s evaluation of the allowance for different loan groups is based on consideration of actual loss experience, the present and prospective financial condition of borrowers, industry concentrations within the loan portfolio and general economic conditions, and absent the ability of some of those factors, as well as peer industry data of comparable banks. The commercial and commercial real estate portfolio segments have been identified as loans with elevated risk as they typically have higher dollar amounts outstanding compared to smaller, homogenous loans. Homogenous loans, such as residential mortgages, home equities, and consumer loans have lower risk in our portfolio based on our historical losses, loan size, and concentration of funds in those loan segments.
56
The determination of the level of allowance and, correspondingly, the provision for loan losses, rests upon estimates and assumptions, including past loan loss experience, the nature and volume of the portfolio, information about specific borrower situations and estimated collateral values, economic conditions and other factors. Loan losses are charged against the allowance when management believes the uncollectability of a loan is confirmed.
A loan is impaired when, based on current information and events, it is probable that the Company will be unable to collect all amounts due according to the contractual terms of the loan agreement. Loans, for which the terms have been modified, and for which the borrower is experiencing financial difficulties, are considered troubled debt restructurings and classified as impaired. Large groups of smaller balance homogeneous loans, such as consumer and residential real estate loans, are collectively evaluated for impairment, and accordingly, they are not identified for impairment disclosures. Troubled debt restructurings are measured at the present value of estimated future cash flows using the loan’s effective rate at inception or at the fair value of the underlying collateral. Commercial loans and mortgage loans secured by other properties are evaluated individually for impairment. When analysis of a borrower's operating results and financial condition indicates that underlying cash flows of the borrower's business are not adequate to meet its debt service requirements, the loan is evaluated for impairment. If a loan is impaired, a portion of the allowance is allocated so that the loan is reported, net, at the present value of estimated future cash flows using the loan's existing interest rate or at the fair value of collateral if repayment is expected solely from the collateral.
In the second quarter of 2010, we changed our methodology on calculating the appropriate level of allowance for loan losses. The change had very little to no impact on the amount of reserve required on our current loan portfolio. Previously, we set our reserves for non-impaired classified loans based on individually analyzing loans. Our current process bases the reserve on calculated historical loss rates based on estimated pool losses. The change came about as a continued effort to refine our allowance methodology process to appropriately reserve for the probable losses in our loan portfolio.
Foreclosed Assets: Assets acquired through or instead of loan foreclosure are initially recorded at fair value, less cost to sell, establishing a new cost basis. If fair value declines, a valuation reduction is recorded through expense. Costs after acquisition are expensed. Foreclosed assets totaled $4.3 million and $4.6 million, at December 31, 2010 and 2009.
Premises and Equipment: Land is carried at cost. Premises and equipment are stated at cost less accumulated depreciation. Depreciation is computed using both the straight-line method and accelerated methods over the estimated useful lives of the buildings, 39 years; site improvements, 15 years; furniture and equipment, 5 to 8 years; and software and computer equipment, 3 years. Leasehold improvements are amortized over the shorter of the useful life or the lease term. Maintenance, repairs, and minor alterations are charged to current operations as expenditures occur and major improvements are capitalized. These assets are reviewed for impairment when events indicate the carrying amount may not be recoverable.
Bank Owned Life Insurance: The Bank has purchased life insurance policies on certain officers. Bank-owned life insurance is recorded at the amount that can be realized under the insurance contract at the balance sheet date, which is the cash surrender value adjusted for other charges or other amounts due that are probable at settlement. Bank owned life insurance totaled $13.5 million and $13.0 million, at December 31, 2010 and 2009.
Benefit Plans: Bonus and 401(k) plan expense is the amount contributed determined by formula. Deferred compensation plan expense and supplemental employee retirement plan expense is allocated over years of service and any related vesting periods.
Stock Based Compensation: Compensation cost is recognized for stock options and restricted stock awards issued to employees, based on the fair value of these awards at the date of grant. A Black-Scholes model is utilized to estimate the fair value of stock options, while the market price of the Corporation’s common stock at the date of grant is used for restricted stock awards. Compensation cost is recognized over the required service period, generally defined as the vesting period. For awards with graded vesting, compensation cost is recognized on a straight-line basis over the requisite service period for the entire award.
Income Taxes: Income tax expense is the sum of the current year income tax due or refundable and the change in deferred tax assets and liabilities. Deferred tax assets and liabilities are the expected future tax consequences of the temporary differences between carrying amounts and tax bases of assets and liabilities, computed using enacted tax rates. A valuation allowance, if needed, reduces deferred tax assets to the amount expected to be realized. A tax position is recognized as a benefit only if it is "more likely than not" that the tax position would be sustained in a tax examination, with a tax examination being presumed to occur. The amount recognized is the largest amount of tax benefit that is greater than 50% likely of being realized on examination. For tax positions not meeting the "more likely than not" test, no tax benefit is recorded. If required, we would recognize interest and/or penalties related to income tax matters in income tax expense.
57
We are subject to U.S. federal income tax as well as income tax of the state of Indiana. We are no longer subject to examination by taxing authorities for years before 2006. We do not expect the total amount of unrecognized tax benefits to significantly increase in the next 12 months.
Derivatives: Accounting guidance requires companies to record derivatives on the balance sheet as assets and liabilities measured at their fair value. The accounting for increases and decreases in the value of derivatives depends upon the use of derivatives and whether the derivatives qualify for hedge accounting.
In March of 2008, we settled the interest rate floor agreement with our counterparty. The unrealized gain at the time of settlement remained in accumulated other comprehensive income, net of tax, as our hedged risk exposure to changes in cash flows from the designated prime-rate based loans with a spread of zero payment remained. The unaccreted gain was reclassified out of accumulated other comprehensive income into earnings using the straight line method over the term of the original floor agreement, which expired on August 1, 2009.
Prior to March of 2008, the Bank’s interest rate floor was measured at fair value and reported as an asset on the consolidated balance sheet in accordance with accounting standards. The portion of the change in fair value of the interest rate floor that was deemed effective in hedging the cash flows of the designated assets was recorded in accumulated other comprehensive income (loss), net of tax effects, and reclassified into interest income when such cash flows occur in the future. Any ineffectiveness resulting from the interest rate floor would have been recorded as a gain or loss in the consolidated statements of operations as a part of non-interest income.
Off-Balance-Sheet Financial Instruments: Financial instruments include off-balance-sheet credit instruments, such as commitments to make loans and standby letters of credit, issued to meet customer financial needs. The face amount for these items represents the exposure to loss, before considering customer collateral or ability to repay. Such financial instruments are recorded when they are funded.
Fair Values of Financial Instruments: Fair values of financial instruments are estimated using relevant market information and other assumptions. Fair value estimates involve uncertainties and matters of significant judgment regarding interest rates, credit risk, prepayments and other factors, especially in the absence of broad markets for particular items. Changes in assumptions or in market conditions could significantly affect the estimates. The fair value estimates of existing on- and off-balance-sheet financial instruments do not include the value of anticipated future business or the value of assets and liabilities not considered financial instruments.
Dividend Restriction: Banking regulations require maintaining certain capital levels and may limit the dividends paid by the Bank to Tower Financial Corporation or by us to our stockholders. While both Tower Financial and Tower Bank currently have adequate capital to qualify as ‘well-capitalized,’ the Board of Directors passed a resolution in January of 2008, at the request of our regulators, requiring written approval be received from the Federal Reserve Board (“Federal Reserve”) before declaring or paying any corporate dividends. The resolution was passed in recognition of the losses recorded in 2007 by Tower Bank, which reduced the overall capital levels of Tower Financial. We obtained permission in January of 2008 from the Federal Reserve Bank and we declared and paid a quarterly dividend of $0.044 in the first quarter of 2008. In the second quarter of 2008, we elected to forego the declaration of dividends on our common stock indefinitely. The decision was based on the desire to retain capital and hedge against challenging economic and banking industry conditions as well as to maintain Tower Bank’s current “well capitalized” status within the Federal Reserve System. In September of 2009, we sold 18,300 shares of Series A Convertible Preferred Stock in the amount of $1.8 million. The preferred stock pays quarterly dividends upon board approval at a rate of 5.25%. Preferred stock dividends of $1,579 were paid in 2009 and no common stock dividends were paid in 2009. No common or preferred stock dividends were paid in 2010. Per the Written Agreement with the Federal Reserve and Indiana Department of Financial Institutions (“IDFI”) filed publicly in our Current Report on Form 8-K on May 5, 2010 and discussed in more detail in Note 15 Capital Requirements and Restrictions on Retained Earnings, we are not to pay dividends on or redeem any of common or preferred stock or other capital stock, or make any payments of interest on its Trust Preferred Debt, without written approval from the Federal Reserve. In response to these requirements, no preferred stock dividends, common stock dividends or Trust Preferred Debt interest payments were made in 2010.
Earnings Per Common Share: Basic earnings per common share is net income divided by the weighted average number of common shares outstanding during the period. Restricted stock awards are considered participating securities for this calculation as those awards contain rights to nonforfeitable dividends. Diluted earnings per common share includes the dilutive impact of any additional potential common shares issuable under stock options, as well as dilutive effects of stock awards and convertible preferred shares.
58
Comprehensive Income (Loss): Comprehensive income (loss) consists of net income (loss) and other comprehensive income (loss). Other comprehensive income (loss) includes the net change in net unrealized appreciation (depreciation) on securities available for sale and derivatives which qualify for hedge accounting, net of reclassification adjustments and tax, which is also recognized as a separate component of stockholders’ equity.
Loss Contingencies: Loss contingencies, including claims and legal actions arising in the ordinary course of business, are recorded as liabilities when the likelihood of loss is probable and an amount or range of loss can be reasonably estimated. Management does not believe there now are such matters that will have a material effect on the consolidated financial statements.
Restrictions on Cash: Cash on hand or on deposit with the Federal Reserve Bank of $949,000 and $884,000 was sufficient to meet the regulatory reserve and clearing requirements at December 31, 2010 and 2009, respectively. These balances do not earn interest.
Adoption of New Accounting Standards - FASB ASU 2010-20, “Receivable (Topic 310), Disclosures about the Credit Quality of Financing Receivables and the Allowance for Credit Losses” — ASU 2010-20 requires new and enhanced disclosures about the credit quality of an entity’s financing receivables and its allowance for credit losses. The new and amended disclosure requirements focus on such areas as nonaccrual and past due financing receivables, allowance for credit losses related to financing receivables, impaired loans, credit quality information and modifications. The ASU requires an entity to disaggregate new and existing disclosures based on how it develops its allowance for credit losses and how it manages credit exposures. For public entities, the disclosures as of the end of a reporting period are effective for interim and annual reporting periods ending on or after December 15, 2010. The disclosures about activity that are occurs during a reporting period are effective for interim and annual reporting periods beginning on or after December 15, 2010. Disclosures required by ASU 2010-20 have been included in our consolidated financial statements.
Newly Issued But Not Yet Effective Accounting Pronouncements- FASB ASU 2011-01, “Receivables (Topic 310), Deferral of the Effective Date of Disclosures about Troubled Debt Restructurings in Update No. 2010-20” — Under the existing effective date in FASB ASU 2010-20, public-entity creditors would have provided disclosures about troubled debt restructuring for periods beginning on or after December 15, 2010. ASU 2011-01 temporarily defers that effective date, enabling public-entity creditors to provide those disclosures (paragraphs 310-10-50-31 through 50-34) after the Financial Accounting Standards Board clarifies the guidance for determining what constitutes a troubled debt restructuring. In the proposed Accounting Standards Update, Receivables (Topic 310), Clarifications to Accounting for Troubled Debt Restructurings by Creditors, the Board proposed that the clarifications would be effective for interim and annual periods ending after June 15, 2011. For the new disclosures about troubled debt restructurings in FASB ASU 2011-01, those clarifications would be applied retrospectively to the beginning of the fiscal year in which the proposal is adopted. We do not expect any significant impact on our disclosures in the consolidated financial statements upon the adoption.
Reclassifications: Certain items from the prior period financial statements were reclassified to conform to the current presentation.
59
Note 2 - Securities
The fair value and amortized cost of securities at December 31, 2010 and 2009 were as follows:
|
2010
|
||||||||||||||||
|
Amortized
Cost
|
Gross Unrealized
Gains
|
Gross Unrealized
Losses
|
Fair
Value
|
|||||||||||||
|
Available for sale securities:
|
||||||||||||||||
|
U.S. Government agency debt obligations
|
$ | 4,112,957 | $ | 59,710 | $ | - | $ | 4,172,667 | ||||||||
|
Obligations of states and political subdivisions
|
45,852,349 | 546,212 | (639,159 | ) | 45,759,402 | |||||||||||
|
Mortgage-backed securities (residential)
|
53,960,788 | 1,854,148 | (325,966 | ) | 55,488,970 | |||||||||||
|
Mortgage-backed securities (commercial)
|
4,458,652 | 224,365 | - | 4,683,017 | ||||||||||||
|
Collateralized debt obligations
|
110,000 | - | (105,400 | ) | 4,600 | |||||||||||
|
Total Securities
|
$ | 108,494,746 | $ | 2,684,435 | $ | (1,070,525 | ) | $ | 110,108,656 | |||||||
|
2009
|
||||||||||||||||
|
Amortized
Cost
|
Gross Unrealized
Gains
|
Gross Unrealized
Losses
|
Fair
Value
|
|||||||||||||
|
Available for sale securities:
|
||||||||||||||||
|
U.S. Government agency debt obligations
|
$ | 8,241,408 | $ | 114,962 | $ | (68,987 | ) | $ | 8,287,383 | |||||||
|
Obligations of states and political subdivisions
|
26,707,619 | 644,961 | (150,035 | ) | 27,202,545 | |||||||||||
|
Mortgage-backed securities (residential)
|
43,664,429 | 1,288,946 | (296,377 | ) | 44,656,998 | |||||||||||
|
Mortgage-backed securities (commercial)
|
4,955,530 | 71,629 | (4,925 | ) | 5,022,234 | |||||||||||
|
Collateralized debt obligations
|
231,342 | - | (221,342 | ) | 10,000 | |||||||||||
|
Total available for sale securities
|
$ | 83,800,328 | $ | 2,120,498 | $ | (741,666 | ) | $ | 85,179,160 | |||||||
|
Held to maturity securities:
|
||||||||||||||||
|
Mortgage-backed securities (residential)
|
4,495,977 | 139,639 | - | 4,635,616 | ||||||||||||
|
Total held to maturity securities
|
4,495,977 | 139,639 | - | 4,635,616 | ||||||||||||
|
Total Securities
|
$ | 88,296,305 | $ | 2,260,137 | $ | (741,666 | ) | $ | 89,814,776 | |||||||
The other-than-temporary-impairment recognized in accumulated comprehensive income was $274,865 and $452,851 for securities available for sale for December 31, 2010 and December 31, 2009, respectively.
The proceeds from sales of securities and the associated gains and losses are listed below:
|
2010
|
2009
|
2008
|
||||||||||
|
Proceeds from available for sale securities
|
$ | 8,327,894 | $ | 9,483,978 | $ | 5,187,454 | ||||||
|
Proceeds from held to maturity securities
|
900,784 | - | - | |||||||||
|
Gross Gains
|
1,122,669 | 264,112 | 65,905 | |||||||||
|
Gross Losses
|
(12,926 | ) | - | (64 | ) | |||||||
The tax benefit (provision) related to these net gains and losses was $377,313, $89,798, and $22,386 for December 31, 2010, 2009, and 2008, respectively.
During 2010, we did some due diligence on the value of certain held to maturity securities owned by the Holding Company as alternative investments with a cost basis of approximately $25,000 and a par value of $4.9 million. We received a quote of $900,784 for the fair value, which would create a gain on sale of $888,059. While we had no intention of selling these investments prior to their scheduled maturity, we decided that it was to the Company’s benefit to liquidate these investments. Per our written agreement with the regulators, the Holding Company is to provide additional financial resources to the banking subsidiary when needed. By selling these securities, approximately $900,000 of liquidity and $890,000 of capital was generated at the Holding Company. After the sale, we transferred the remaining portfolio of all held to maturity securities with an amortized cost of $5.5 million categorized as held to maturity to available for sale at the Holding Company and all of its subsidiaries. As of the date of transfer, these securities had a fair value of $5.7 million, unrealized gains of $305,119, and had increased other comprehensive income by $201,379.
60
The fair values and amortized costs of debt securities available for sale at December 31, 2010, by contractual maturity, are shown below. Securities not due at a single date, primarily mortgage-backed securities, are shown separately. Expected maturities may differ from contractual maturities because borrowers may have the right to call or prepay obligations with or without penalties.
|
12/31/2010
|
||||||||||||
|
Weighted
Average
Yield
|
Amortized
Cost
|
Fair
Value
|
||||||||||
|
Available for sale securities:
|
||||||||||||
|
Agencies:
|
||||||||||||
|
Due in one year or less
|
3.25 | % | $ | 700,000 | $ | 703,997 | ||||||
|
Due after one to five years
|
2.16 | % | 799,138 | 822,336 | ||||||||
|
Due after five to ten years
|
2.58 | % | 2,613,819 | 2,646,334 | ||||||||
|
Total Agencies
|
2.61 | % | $ | 4,112,957 | $ | 4,172,667 | ||||||
|
Mortgage-backed securities:
|
||||||||||||
|
Mortgage-backed securities (residential)
|
3.86 | % | $ | 53,960,788 | $ | 55,488,970 | ||||||
|
Mortgage-backed securities (commercial)
|
4.22 | % | 4,458,652 | 4,683,017 | ||||||||
| 3.89 | % | $ | 58,419,440 | $ | 60,171,987 | |||||||
|
Obligations of state and political subdivisions:
|
||||||||||||
|
Due in one year or less
|
4.99 | % | $ | 260,457 | $ | 262,621 | ||||||
|
Due after one to five years
|
5.24 | % | 3,168,388 | 3,270,587 | ||||||||
|
Due after five to ten years
|
5.28 | % | 13,676,918 | 13,820,407 | ||||||||
|
Due after ten years
|
5.77 | % | 28,746,586 | 28,405,787 | ||||||||
|
Total Obligations of state and political subdivisions
|
5.58 | % | $ | 45,852,349 | $ | 45,759,402 | ||||||
|
Collateralized debt obligations
|
||||||||||||
|
Due after ten years
|
1.15 | % | $ | 110,000 | $ | 4,600 | ||||||
Securities with a carrying value of $1.1 million and $2.4 million were pledged to secure borrowings from the FHLB at December 31, 2010 and December 31, 2009, respectively. Securities with a carrying value of $4.2 million were pledged to the Federal Reserve to secure potential borrowings at the Discount Window at December 31, 2010 and December 31, 2009. Securities with a carrying value of $17.8 million and $9.4 million were pledged at correspondent banks, including Wells Fargo, First Tennessee, First Merchants and Pacific Coast Bankers Bank, to secure federal funds lines of credit at December 31, 2010 and December 31, 2009, respectively. At December 31, 2010, there were no holdings of any one issuer, other than the U.S. Government and its agencies, in an amount greater than 10% of stockholders' equity.
Securities with unrealized losses at year end 2010 not recognized in income are as follows:
|
Continuing Unrealized
Losses for
Less than 12 months
|
Continuing Unrealized
Losses for
More than 12 months
|
Total
|
||||||||||||||||||||||
|
Fair Value
|
Gross Unrealized
Losses
|
Fair Value
|
Gross Unrealized
Losses
|
Fair Value
|
Gross Unrealized
Losses
|
|||||||||||||||||||
|
Available for sale securities:
|
||||||||||||||||||||||||
|
U.S. Government agency debt obligations
|
$ | - | $ | - | $ | - | $ | - | $ | - | $ | - | ||||||||||||
|
Obligations of states and political subdivisions
|
16,033,664 | (588,556 | ) | 1,427,946 | (50,603 | ) | 17,461,610 | (639,159 | ) | |||||||||||||||
|
Mortgage-backed securities (residential)
|
5,772,263 | (156,769 | ) | 416,929 | (169,197 | ) | 6,189,192 | (325,966 | ) | |||||||||||||||
|
Mortgage-backed securities (commercial)
|
- | - | - | - | - | - | ||||||||||||||||||
|
Collateralized debt obligations
|
- | - | 4,600 | (105,400 | ) | 4,600 | (105,400 | ) | ||||||||||||||||
|
Total available for sale securities
|
$ | 21,805,927 | $ | (745,325 | ) | $ | 1,849,475 | $ | (325,200 | ) | $ | 23,655,402 | $ | (1,070,525 | ) | |||||||||
61
Securities with unrealized losses at year end 2009 not recognized in income are as follows:
|
Continuing Unrealized
Losses for
Less than 12 months
|
Continuing Unrealized
Losses for
More than 12 months
|
Total
|
||||||||||||||||||||||
|
Fair Value
|
Gross Unrealized
Losses
|
Fair Value
|
Gross Unrealized
Losses
|
Fair Value
|
Gross Unrealized
Losses
|
|||||||||||||||||||
|
Available for sale securities:
|
||||||||||||||||||||||||
|
U.S. Government agency debt obligations
|
$ | 2,656,626 | $ | (68,987 | ) | $ | - | $ | - | $ | 2,656,626 | $ | (68,987 | ) | ||||||||||
|
Obligations of states and political subdivisions
|
2,450,819 | (25,413 | ) | 2,899,366 | (124,622 | ) | 5,350,185 | (150,035 | ) | |||||||||||||||
|
Mortgage-backed securities (residential)
|
7,225,027 | (64,868 | ) | 468,665 | (231,509 | ) | 7,693,692 | (296,377 | ) | |||||||||||||||
|
Mortgage-backed securities (commercial)
|
1,497,108 | (4,925 | ) | - | - | 1,497,108 | (4,925 | ) | ||||||||||||||||
|
Collateralized debt obligations
|
- | - | 10,000 | (221,342 | ) | 10,000 | (221,342 | ) | ||||||||||||||||
|
Total available for sale securities
|
$ | 13,829,580 | $ | (164,193 | ) | $ | 3,378,031 | $ | (577,473 | ) | $ | 17,207,611 | $ | (741,666 | ) | |||||||||
|
Held to maturity securities:
|
||||||||||||||||||||||||
|
Mortgage-backed securities (residential)
|
- | - | - | - | - | - | ||||||||||||||||||
|
Total held to maturity securities
|
$ | - | $ | - | $ | - | $ | - | $ | - | $ | - | ||||||||||||
|
Total temporarily impaired
|
$ | 13,829,580 | $ | (164,193 | ) | $ | 3,378,031 | $ | (577,473 | ) | $ | 17,207,611 | $ | (741,666 | ) | |||||||||
Unrealized losses on most mortgage-backed securities and state and municipality bonds have not been recognized into income because most of the issuers’ bonds are of high credit quality and management does not intend to sell and it is likely that management will not be required to sell the securities prior to their anticipated recovery; however, see discussion on mortgage-backed securities that are not of investment grade in the mortgage-backed securities section. Of the bonds that are deemed to not be other-than-temporarily-impaired, the fair value is expected to recover as the bonds approach their maturity.
We evaluate securities for other-than-temporary impairment (OTTI) at least on a quarterly basis, and more frequently when economic or market concerns warrant such evaluation. The investment securities portfolio is evaluated for OTTI by segregating the portfolio into two general segments and applying the appropriate OTTI forecast assumptions. Investment securities classified as available for sale are generally evaluated for OTTI in accordance with accounting standards on how to account for certain investments in debt and equity securities. However, certain purchased beneficial interests, including asset-backed securities and collateralized debt obligations, that had credit ratings at the time of purchase of below AA are evaluated using the model outlined in FASB ASC 325-40-55, Recognition of Interest Income and Impairment on Purchased Beneficial Interests and Beneficial Interests that Continue to be Held by a Transfer in Securitized Financial Assets.
In determining OTTI, management considers many factors, including: (1) the length of time and the extent to which the fair value has been less than cost, (2) the financial condition and near-term prospects of the issuer, (3) whether the market decline was affected by macroeconomic conditions, and (4) whether the entity has the intent to sell the debt security or more likely than not will be required to sell the debt security before its anticipated recovery. The assessment of whether an other-than-temporary decline exists involves a high degree of subjectivity and judgment and is based on the information available to management at a point in time.
The second segment of the portfolio uses the OTTI guidance that is specific to purchased beneficial interests that, on the purchase date, were rated below AA. The Company compares the present value of the remaining cash flows as estimated at the preceding evaluation date to the current expected remaining cash flows. OTTI is deemed to have occurred if there has been an adverse change in the remaining expected future cash flows.
When other-than-temporary impairment occurs under either model, the amount of the other-than-temporary-impairment recognized in earnings depends on whether an entity intends to sell the security or more likely than not will be required to sell the security before recovery of its amortized cost basis less any current-period credit loss. If an entity intends to sell or more likely than not will be required to sell the security before recovery of its amortized cost basis less any current-period credit loss, the other-than-temporary impairment shall be recognized in earnings equal to the entire difference between the investment’s amortized cost basis and its fair value at the balance sheet date. If an entity does not intend to sell the security and it is not more likely than not that the entity will not be required to sell the security before recovery of its amortized cost basis less any current-period loss, the other-than-temporary impairment shall be separated into the amount representing the credit loss and the amount related to all other factors. The amount of the total other-than-temporary impairment related to the credit loss is determined based on the present value of cash flows expected to be collected and is recognized in earnings. The amount of the total other-than-temporary impairment related to other factors shall be recognized in other comprehensive income, net of applicable taxes. The previous amortized cost basis less the other-than-temporary impairment recognized in earnings shall become the new amortized cost basis of the investment.
62
As of December 31, 2010, Tower Financial Corporation’s security portfolio consisted of 214 securities, 44 of which were in an unrealized loss position. The majority of unrealized losses are related to the Company’s mortgage-backed securities and collateralized debt obligations, as discussed below:
Mortgage-backed Securities
At December 31, 2010, approximately 85% of the mortgage-backed securities we held were issued by U.S. government-sponsored entities and agencies, primarily Fannie Mae and Freddie Mac, institutions which the government has affirmed its commitment to support. Because the decline in market value is attributable to changes in interest rates and illiquidity, and not credit quality, and because the Company does not have the intent to sell these mortgage-backed securities and it is likely that it will not be required to sell the securities before their anticipated recovery, the Company does not consider these securities to be other-than-temporarily impaired at December 31, 2010.
As of December 31, 2010, we held $8.2 million of non-agency backed CMO investments. These investments were purchased as loan alternatives. The eight securities purchased all had AAA rating from Standard & Poors. These bonds make up less than 10% of capital. The Company continues to monitor these securities and obtain current market prices at least on a quarterly basis. Based on this review, the Company does not consider these securities to be other-than-temporarily impaired at December 31, 2010.
Private Label Collateralized Mortgage Obligation
The Company owns a Private Label Collateralized Mortgage Obligation (CMO) with an original investment of $1.0 million. At December 31, 2010, the fair value of the investment was $416,929 and the amortized cost was $586,125. The investment was rated Caa2 by Moody’s and CCC by S&P at December 31, 2010.
This bond is classified as a “super senior” tranche because its cash flow is not subordinated to any other tranche in the deal and is classified as a mortgage-backed security (residential). We used the Intex database to evaluate and model each individual loan in the underlying collateral of this security. We noticed that the credit quality of the underlying collateral marginally deteri orated during 2009 causing us to more aggressively monitor and analyze for other-than-temporary-impairment. To monitor this investment, management has evaluated loan delinquencies, foreclosures, other real estate owned (OREO) and bankruptcies as shown in the table below prior to making assumptions on the performing loans for 2010 and 2009.
|
December 31
2010
|
September 30
2010
|
June 30
2010
|
March 31
2010
|
|||||||||||||
|
Delinquency 60+
|
22.58 | % | 20.76 | % | 22.48 | % | 24.37 | % | ||||||||
|
Delinquency 90+
|
19.79 | % | 18.42 | % | 20.73 | % | 22.07 | % | ||||||||
|
Other Real Estate Owned
|
1.73 | % | 0.20 | % | 0.17 | % | 1.27 | % | ||||||||
|
Foreclosure
|
9.42 | % | 9.11 | % | 10.79 | % | 11.43 | % | ||||||||
|
Bankruptcy
|
4.08 | % | 4.09 | % | 3.35 | % | 3.87 | % | ||||||||
|
December 31
2009
|
September 30
2009
|
June 30
2009
|
March 31
2009
|
|||||||||||||
|
Delinquency 60+
|
23.66 | % | 20.63 | % | 17.07 | % | 14.69 | % | ||||||||
|
Delinquency 90+
|
21.01 | % | 17.42 | % | 13.99 | % | 11.70 | % | ||||||||
|
Other Real Estate Owned
|
1.32 | % | 0.84 | % | 1.51 | % | 0.32 | % | ||||||||
|
Foreclosure
|
11.38 | % | 10.64 | % | 7.77 | % | 6.85 | % | ||||||||
|
Bankruptcy
|
3.36 | % | 2.60 | % | 0.31 | % | 0.31 | % | ||||||||
We utilized Intex data to determine the default assumptions for all loans that are classified as “past due,” OREO or in foreclosure. A 50% severity rate was assumed on all defaults. This number was derived from the pool average over the last 12 months. The default rate differs for each State based on the severity of that State’s home price depreciation and the number of days the loan is past due. Any foreclosure or loan classified as REO is immediately liquidated at a 50% severity. The current loan category is stratified by FICO scores and the level of asset documentation (full documentation, low documentation, or no documentation). The Loan Performance Database driven by Intex data is mined for historical probabilities of loans meeting these characteristics moving into default. This was done for 2006, 2007, and 2008 periods. These periods were chosen for evaluation because that is when the underlying loans were originated. The average default rate is then calculated, as well as its standard deviation. Two standard deviations are then added to this mean to derive the current loan CDR assumptions; representing what management feels is a “stressed” scenario. We used the yield at the time of purchase as the discount rate for the cash flow analysis. At the time of purchase the bond was yielding 6%. Therefore, all cash flows in the OTTI analysis were discounted by 6% to get a present value. To determine the fair value, we surveyed two bond desks to see what yield it would take to sell the bond in the open market. Both desks said it would take a yield of 12%-15% to get someone to buy this bond. Management decided to use the conservative figure and discounted the cash flows by 15%. The two bond desks that were surveyed are Sterne Agee and Performance Trust.
63
Based on the analysis performed using the assumptions above, we have determined that this Private Label CMO is other-than-temporarily-impaired requiring us to record a credit impairment of $6,827 during the fourth quarter of 2010 bringing the total impairment to $57,731 through December 31, 2010. We had previously recorded impairment of $20,770 through December 31, 2009; therefore, an OTTI charge of $36,961 was recorded for the year ending December 31, 2010.
Trust Preferred Securities
The Company, through the Bank’s investment subsidiary, owns a $1 million original investment in PreTSL XXV, a pooled $877.4 million amortized cost at the time of purchase. This is the Company’s only pooled trust preferred security and it is classified as a collateralized debt obligation. At December 31, 2010, the fair value of the investment was $4,600 and the amortized cost was $110,000. The investment was rated Ca by Moody’s and C by Fitch.
The investment is divided into seven tranches. Tower’s investment is in the fifth tranche (C-1), meaning the cashflows on the investment are subordinated to the higher placed tranches. There are sixty-eight (68) issuing participants in PreTSL XXV. Fifty-eight (58) of the issuers are banks or bank holding companies, with the remaining issuers being insurance companies. As of December 31, 2010, the amount of deferrals and defaults was $314.6 million, or 36.0% of the total pool. Of the total $877.4 million of original collateral, $562.8 million is currently paying interest. The defaults and deferrals occurred as follows:
|
Deferral
|
Default
|
|||||||
|
March 31, 2008
|
$ | - | $ | 25,000,000 | ||||
|
September 30, 2008
|
20,000,000 | - | ||||||
|
December 31, 2008
|
15,000,000 | 35,000,000 | ||||||
|
March 31, 2009
|
22,500,000 | - | ||||||
|
June 30, 2009
|
35,600,000 | 25,000,000 | ||||||
|
September 30, 2009
|
86,000,000 | - | ||||||
|
December 31, 2009*
|
7,500,000 | 25,000,000 | ||||||
|
March 31, 2010
|
- | - | ||||||
|
June 30, 2010
|
- | - | ||||||
|
September 30, 2010
|
14,000,000 | - | ||||||
|
December 31, 2010
|
29,000,000 | - | ||||||
*$25.0 million of defaults at December 31, 2009 were reported as deferrals in September 30, 2009
The Company uses the OTTI evaluation model to compare the present value of expected cash flows to the previous estimate to determine whether an adverse change in cash flows has occurred during the period. The OTTI model considers the structure and term of the collateralized debt obligation (“CDO”) and the financial condition of the underlying issuers. Specifically, the model details interest rates, principal balances of note classes and underlying issuers, the timing and amount of interest and principal payments of the underlying issuers, and the allocation of the payments to the note classes. The current estimates of expected cash flows are based on the most recent trustee reports and any other relevant market information including announcements of interest payment deferrals or defaults of underlying loans or trust preferred securities. Assumptions used in the model include expected future default rates and prepayments. We assume that all interest payment deferrals will become defaults prior to their next payment dates and that there will be no recoveries on defaults. In addition we use the model to “stress” each CDO, or make assumptions more severe than expected activity, to determine the degree to which assumptions could deteriorate before the CDO could no longer fully support repayment of Tower’s note class. We evaluate the credit quality of each underlying issuer in the pool and apply a risk rating for each issuer and then put this risk rating into a relevant risk model to identify immediate default risk. Upon completion of the December 31, 2010 analysis, our model indicated that the security was other-than-temporarily impaired. Based on this conclusion at December 31, 2010, the investment had OTTI of approximately 89.0%, or $851,342. We had previously recorded impairment of $730,000 through December 31, 2009; therefore, an OTTI charge of $121,342 was recorded for the year ending December 31, 2010.
64
The table below presents a roll-forward of the credit losses relating to debt securities recognized in earnings for the year ending December 31:
|
2010
|
2009
|
|||||||
|
Beginning Balance, January 1
|
$ | 750,770 | $ | - | ||||
|
Additions for amounts related to credit loss for which an OTTI was not previously recognized
|
- | - | ||||||
|
Increases to the amount related to the credit loss for whichother-than-temporary was previously recognized
|
158,303 | 750,770 | ||||||
|
Ending Balance, December 31
|
$ | 909,073 | $ | 750,770 | ||||
Note 3 - Loans and Allowance for Loan Losses
Loans at December 31, 2010 and 2009 were as follows:
|
2010
|
2009
|
|||||||||||||||
|
Balance
|
%
|
Balance
|
%
|
|||||||||||||
|
Commercial
|
$ | 233,870,030 | 48.0 | % | $ | 251,773,047 | 47.7 | % | ||||||||
|
Commercial real estate
|
118,658,180 | 24.4 | % | 132,355,208 | 25.1 | % | ||||||||||
|
Residential real estate
|
80,070,209 | 16.4 | % | 86,679,947 | 16.4 | % | ||||||||||
|
Home equity
|
38,393,779 | 7.9 | % | 40,042,804 | 7.6 | % | ||||||||||
|
Consumer
|
15,979,973 | 3.3 | % | 16,648,679 | 3.2 | % | ||||||||||
|
Total loans
|
486,972,171 | 100.0 | % | 527,499,685 | 100.0 | % | ||||||||||
|
Net deferred loan costs (fees)
|
(58,056 | ) | (166,224 | ) | ||||||||||||
|
Allowance for loan losses
|
(12,489,400 | ) | (11,598,389 | ) | ||||||||||||
|
Net loans
|
$ | 474,424,715 | $ | 515,735,072 | ||||||||||||
Activity in the allowance for loan losses during 2010, 2009, and 2008 was as follows:
|
2010
|
2009
|
2008
|
||||||||||
|
Beginning balance, January 1
|
$ | 11,598,389 | $ | 10,654,879 | $ | 8,208,162 | ||||||
|
Provision charged to operating expense
|
4,745,000 | 10,735,000 | 4,399,000 | |||||||||
|
Charge-offs:
|
||||||||||||
|
Commercial
|
(3,457,564 | ) | (6,279,849 | ) | (1,148,617 | ) | ||||||
|
Commercial real estate
|
(547,808 | ) | (3,814,068 | ) | (1,920,176 | ) | ||||||
|
Residential real estate
|
(293,785 | ) | (133,850 | ) | (55,219 | ) | ||||||
|
Home equity
|
(138,471 | ) | (75,823 | ) | (82,536 | ) | ||||||
|
Consumer
|
(51,354 | ) | (18,127 | ) | (289,664 | ) | ||||||
|
Total Charge-offs
|
(4,488,982 | ) | (10,321,717 | ) | (3,496,212 | ) | ||||||
|
Recoveries:
|
||||||||||||
|
Commercial
|
538,158 | 449,904 | 567,420 | |||||||||
|
Commercial real estate
|
74,867 | 36,015 | 846,700 | |||||||||
|
Residential real estate
|
- | 2,231 | 112,961 | |||||||||
|
Home equity
|
21,348 | 31,965 | 8,940 | |||||||||
|
Consumer
|
620 | 10,112 | 7,908 | |||||||||
|
Total Recoveries
|
634,993 | 530,227 | 1,543,929 | |||||||||
|
Total Net Charge-offs
|
(3,853,989 | ) | (9,791,490 | ) | (1,952,283 | ) | ||||||
|
Ending balance, December 31
|
$ | 12,489,400 | $ | 11,598,389 | $ | 10,654,879 | ||||||
65
The following table presents the balance in the allowance for loan losses and the recorded investment in loans by portfolio segment based on impairment method as of December 31, 2010:
|
Individually evaluated for impairment
|
Collectively evaluated for impairment
|
Total
|
||||||||||
|
Allowance for loan losses:
|
||||||||||||
|
Ending allowance balance attributable to loans:
|
||||||||||||
|
Commercial
|
$ | 794,796 | $ | 4,996,353 | $ | 5,791,149 | ||||||
|
Commercial Real Estate
|
||||||||||||
|
Construction
|
2,547,000 | 749,168 | 3,296,168 | |||||||||
|
Other
|
445,000 | 2,442,197 | 2,887,197 | |||||||||
|
Residential Real Estate
|
||||||||||||
|
Traditional
|
- | 241,324 | 241,324 | |||||||||
|
Jumbo
|
- | 145,669 | 145,669 | |||||||||
|
Home Equity
|
- | 77,051 | 77,051 | |||||||||
|
Consumer
|
- | 28,711 | 28,711 | |||||||||
|
Unallocated
|
- | 22,131 | 22,131 | |||||||||
|
Total
|
$ | 3,786,796 | $ | 8,702,604 | $ | 12,489,400 | ||||||
|
Loans:
|
||||||||||||
|
Commercial
|
$ | 17,749,052 | $ | 216,796,858 | $ | 234,545,910 | ||||||
|
Commercial Real Estate
|
||||||||||||
|
Construction
|
8,018,364 | 24,714,657 | 32,733,021 | |||||||||
|
Other
|
5,852,757 | 80,566,785 | 86,419,542 | |||||||||
|
Residential Real Estate
|
||||||||||||
|
Traditional
|
- | 50,180,356 | 50,180,356 | |||||||||
|
Jumbo
|
- | 30,290,198 | 30,290,198 | |||||||||
|
Home Equity
|
- | 38,467,832 | 38,467,832 | |||||||||
|
Consumer
|
- | 15,935,501 | 15,935,501 | |||||||||
|
Unallocated
|
- | - | - | |||||||||
|
Total
|
$ | 31,620,173 | $ | 456,952,187 | $ | 488,572,360 | ||||||
66
The following table presents loans individually evaluated for impairment by class of loans as of December 31, 2010:
|
Unpaid
Principal Balance
|
Recorded Investment
|
Allowance for Loan Losses Allocated
|
||||||||||
|
With no related allowance recorded:
|
||||||||||||
|
Commercial
|
$ | 12,803,552 | $ | 12,826,746 | $ | - | ||||||
|
Commercial Real Estate
|
||||||||||||
|
Construction
|
1,850,416 | 1,861,062 | - | |||||||||
|
Other
|
2,208,130 | 2,208,055 | - | |||||||||
|
Residential Real Estate
|
||||||||||||
|
Traditional
|
- | - | - | |||||||||
|
Jumbo
|
- | - | - | |||||||||
|
Home Equity
|
- | - | - | |||||||||
|
Consumer
|
- | - | - | |||||||||
| 16,862,098 | 16,895,863 | - | ||||||||||
|
With related allowance recorded:
|
||||||||||||
|
Commercial
|
4,910,918 | 4,922,306 | 794,796 | |||||||||
|
Commercial Real Estate
|
||||||||||||
|
Construction
|
6,156,859 | 6,157,302 | 2,547,000 | |||||||||
|
Other
|
3,640,193 | 3,644,702 | 445,000 | |||||||||
|
Residential Real Estate
|
||||||||||||
|
Traditional
|
- | - | - | |||||||||
|
Jumbo
|
- | - | - | |||||||||
|
Home Equity
|
- | - | - | |||||||||
|
Consumer
|
- | - | - | |||||||||
| 14,707,970 | 14,724,310 | 3,786,796 | ||||||||||
| $ | 31,570,068 | $ | 31,620,173 | $ | 3,786,796 | |||||||
Impaired loans as of December 31, 2009 and 2008 were as follows:
|
2009
|
2008
|
|||||||
|
Year-end loans with no allocated allowance for loan losses
|
$ | 9,776,211 | $ | 6,462,113 | ||||
|
Year-end loans with allocated allowance for loan losses
|
13,674,754 | 16,898,392 | ||||||
|
Total impaired loans
|
$ | 23,450,965 | $ | 23,360,505 | ||||
|
Amount of the allowance for loan losses allocated
|
$ | 3,825,000 | $ | 3,101,000 | ||||
|
December 31,
|
||||||||||||
|
2010
|
2009
|
2008
|
||||||||||
|
Average of impaired loans during the year
|
$ | 26,380,890 | $ | 25,424,530 | $ | 22,414,645 | ||||||
|
Interest recognized on impaired loans
|
$ | 1,245,195 | $ | 938,621 | $ | 244,703 | ||||||
|
Cash-basis interest income recognized
|
$ | 1,197,225 | $ | 938,621 | $ | 244,703 | ||||||
67
The following table presents the recorded investment in nonaccrual and loans past due over 90 days still on accrual by class of loans as of December 31, 2010:
|
Nonaccrual
|
Loans Past Due Over 90 Days Still Accruing
|
|||||||
|
Commercial
|
$ | 6,401,292 | $ | 1,961,597 | ||||
|
Commercial Real Estate
|
||||||||
|
Construction
|
3,483,111 | 482,512 | ||||||
|
Other
|
2,208,055 | - | ||||||
|
Residential Real Estate
|
||||||||
|
Traditional
|
825,432 | 229,213 | ||||||
|
Jumbo
|
- | - | ||||||
|
Home Equity
|
17,179 | 179 | ||||||
|
Consumer
|
- | 27,089 | ||||||
|
Total
|
$ | 12,935,069 | $ | 2,700,590 | ||||
The following table presents the aging of the recorded investment in past due loans as of December 31, 2010:
|
30 - 59 Days Past Due
|
60 - 89 Days Past Due
|
Greater than 90 Days Past Due
|
Total Past Due
|
Total Loans Not Past Due
|
||||||||||||||||
|
Commercial
|
$ | 3,372,749 | $ | 442,622 | $ | 5,567,902 | 9,383,273 | $ | 225,162,637 | |||||||||||
|
Commercial Real Estate
|
||||||||||||||||||||
|
Construction
|
3,486,426 | - | 1,869,263 | 5,355,689 | 27,377,332 | |||||||||||||||
|
Other
|
- | 239,342 | 2,208,055 | 2,447,397 | 83,972,145 | |||||||||||||||
|
Residential Real Estate
|
||||||||||||||||||||
|
Traditional
|
738,767 | 121,025 | 1,054,644 | 1,914,436 | 48,265,920 | |||||||||||||||
|
Jumbo
|
1,183,388 | - | - | 1,183,388 | 29,106,810 | |||||||||||||||
|
Home Equity
|
48,154 | - | 17,358 | 65,512 | 38,402,320 | |||||||||||||||
|
Consumer
|
243,442 | 93,030 | 27,089 | 363,561 | 15,571,940 | |||||||||||||||
|
Total
|
$ | 9,072,926 | $ | 896,019 | $ | 10,744,311 | $ | 20,713,256 | $ | 467,859,104 | ||||||||||
Troubled Debt Restructurings:
The Company has allocated $485,000 and $70,000 of specific reserves to customers whose loan terms have been modified in troubled debt restructurings as of December 31, 2010 and 2009. The Company has committed to lend additional amounts totaling up to $8,962 and $0 as of December 31, 2010 and 2009 to customers with outstanding loans that are classified as troubled debt restructurings.
Credit Quality Indicators:
The Company categorizes loans into risk categories based on relevant information about the ability of borrowers to service their debt such as: current financial information, historical payment experience, credit documentation, public information, and current economic trends, among other factors. The Company analyzes loans individually by classifying the loans as to credit risk. This analysis includes non-homogeneous loans, such as commercial and commercial real estate loans. This analysis is performed on a quarterly basis. The Company uses the following definitions for risk ratings:
Special Mention: Loans classified as special mention have a potential weakness that deserves management's close attention. If left uncorrected, these potential weaknesses may result in deterioration of the repayment prospects for the loan or of the institution's credit position at some future date.
Substandard: Loans classified as substandard are inadequately protected by the current net worth and paying capacity of the obligor or of the collateral pledged, if any. Loans so classified have a well-defined weakness or weaknesses that jeopardize the liquidation of the debt. They are characterized by the distinct possibility that the institution will sustain some loss if the deficiencies are not corrected.
68
Doubtful: Loans classified as doubtful have all the weaknesses inherent in those classified as substandard, with the added characteristic that the weaknesses make collection or liquidation in full, on the basis of currently existing facts, conditions, and values, highly questionable and improbable.
Loans not meeting the criteria above that are analyzed individually as part of the above described process are considered to be pass rated loans. Loans listed as not rated are included in groups of homogeneous loans. As of December 31, 2010, and based on the most recent analysis performed, the risk category of the recorded investment of loans by class of loans is as follows:
|
Not Rated
|
Pass
|
Special Mention
|
Substandard
|
Doubtful
|
||||||||||||||||
|
Commercial
|
$ | - | $ | 196,992,869 | $ | 15,515,792 | 15,463,676 | $ | 6,573,573 | |||||||||||
|
Commercial Real Estate
|
||||||||||||||||||||
|
Construction
|
- | 29,256,779 | 153,616 | 3,322,626 | - | |||||||||||||||
|
Other
|
- | 56,269,505 | 11,460,828 | 13,382,929 | 5,306,280 | |||||||||||||||
|
Residential Real Estate
|
||||||||||||||||||||
|
Traditional
|
49,286,593 | - | 893,763 | - | - | |||||||||||||||
|
Jumbo
|
30,290,198 | - | - | - | - | |||||||||||||||
|
Home Equity
|
38,467,832 | - | - | - | - | |||||||||||||||
|
Consumer
|
15,935,501 | - | - | - | - | |||||||||||||||
|
Total
|
$ | 133,980,124 | $ | 282,519,153 | $ | 28,023,999 | $ | 32,169,231 | $ | 11,879,853 | ||||||||||
The Company considers the performance of the loan portfolio and its impact on the allowance for loan losses. For residential, home equity, and consumer classes, the Company also evaluates the credit quality based on the aging status of the loan, which was previously presented, and by activity. The following table presents the recorded investment in residential, home equity, and consumer loans based on aging status as of December 31, 2010:
|
Not Past Due
|
30 - 89 Days Past
Due
|
Greater than 90
Days Past Due
Still Accruing
|
Nonaccrual
|
|||||||||||||
|
Residential Real Estate
|
||||||||||||||||
|
Traditional
|
$ | 48,265,920 | $ | 859,792 | $ | 229,212 | $ | 825,432 | ||||||||
|
Jumbo
|
29,106,810 | 1,183,388 | - | - | ||||||||||||
|
Home Equity
|
38,402,320 | 48,154 | 179 | 17,179 | ||||||||||||
|
Consumer
|
15,571,940 | 336,472 | 27,089 | - | ||||||||||||
|
Total
|
$ | 131,346,990 | $ | 2,427,806 | $ | 256,480 | $ | 842,611 | ||||||||
Nonperforming assets were as follows:
|
December 31,
|
||||||||||||
|
2010
|
2009
|
2008
|
||||||||||
|
Loans past due over 90 days still accruing
|
$ | 2,688,135 | $ | 561,136 | $ | 1,019,857 | ||||||
|
Troubled debt restructured loans
|
7,501,958 | 1,915,127 | 327,967 | |||||||||
|
Nonaccrual loans
|
12,939,331 | 13,466,165 | 15,675,334 | |||||||||
|
Total nonperforming loans
|
$ | 23,129,424 | $ | 15,942,428 | $ | 17,023,158 | ||||||
|
Other real estate owned
|
4,284,263 | 4,634,089 | 2,660,310 | |||||||||
|
Impaired securities
|
421,529 | 478,665 | 230,900 | |||||||||
|
Total nonperforming assets
|
$ | 27,835,216 | $ | 21,055,182 | $ | 19,914,368 | ||||||
Nonperforming loans and impaired loans are defined differently. Some loans may be included in both categories, whereas other loans may only be included in one category. There were three troubled debt restructuring at December 31, 2010 in the amount of $7.5 million, two troubled debt restructuring loans at December 31, 2009 totaling $1.9 million, and two troubled debt restructurings in 2008 for $327,967 included in impaired loans. There were fifteen real estate owned properties at December 31, 2010 totaling $4.3 million. There were nine real estate properties owned at December 31, 2009 totaling $4.6 million and nine real estate owned properties at December 31, 2008 totaling $2.7 million.
69
Note 4 – Fair Value
The fair value hierarchy requires an entity to maximize the use of observable inputs and minimize the use of unobservable inputs when measuring fair value. The standard describes three levels of inputs that may be used to measure fair value:
Level 1: Quoted prices (unadjusted) for identical assets or liabilities in active markets that the entity has the ability to access as of the measurement date.
Level 2: Significant other observable inputs other than Level 1 prices such as quoted prices for similar assets or liabilities; quoted prices in markets that are not active; or other inputs that are observable or can be corroborated by observable market data.
Level 3: Significant unobservable inputs that reflect a reporting entity’s own assumptions about the assumptions that market participants would use in pricing an asset or liability.
The Company used the following methods and significant assumptions to estimate fair value:
Investment Securities: The fair values for investment securities are determined by quoted market prices, if available (Level 1). For securities where quoted prices are not available, fair values are calculated based on market prices of similar securities (Level 2), which include our agencies, municipal bonds, and the majority of our mortgage-backed securities. In certain cases where market data is not readily available because of lack of market activity or little public disclosure, values may be based on unobservable inputs and classified in Level 3 of the fair value hierarchy, which include our collateralized debt obligations and some mortgage-backed securities. Collateralized debt obligations, such as Trust Preferred Securities, which are issued by financial institutions and insurance companies have seen a decline in the level of observable inputs and market activity in this class of investments has been significant and resulted in unreliable external pricing. Broker pricing and bid/ask spreads, when available, vary widely. The once active market has become comparatively inactive. The same is true for the mortgage-backed securities that are categorized as Level 3. As such, these investments are priced at December 31, 2010 and 2009 using Level 3 inputs. Due to current market conditions as well as the limited trading activity of these securities, the fair value is highly sensitive to assumption changes and market volatility.
Impaired Loans: The fair value of impaired loans with specific allocations of the allowance for loan losses is generally based on recent collateral appraisals. These appraisals may utilize a single valuation approach or a combination of approaches including comparable sales and the income approach. Adjustments are routinely made in the appraisal process by the independent appraisers to adjust for differences between the comparable sales and income data available. Such adjustments are usually significant and typically result in a Level 3 classification of the inputs for determining fair value.
Other Real Estate Owned: Nonrecurring adjustments to certain commercial and residential real estate properties classified as other real estate owned (OREO) are measured at fair value, less costs to sell. Fair values are based on recent real estate appraisals. These appraisals may use a single valuation approach or a combination of approaches including comparable sales and the income approach. Adjustments are routinely made in the appraisal process by the independent appraisers to adjust for differences between the comparable sales and income data available. Such adjustments are usually significant and typically result in a Level 3 classification of the inputs for determining fair value.
70
The following table presents for each of the fair-value hierarchy levels our assets that are measured at fair value on a recurring basis at December 31, 2010 and December 31, 2009.
| December 31, 2010 | ||||||||||||||||
|
Level 1
|
Level 2
|
Level 3
|
Total
|
|||||||||||||
|
Available for sale securities:
|
||||||||||||||||
|
U.S. Government agency debt obligations
|
$ | - | $ | 4,172,667 | $ | - | $ | 4,172,667 | ||||||||
|
Obligations of states and political subdivisions
|
- | 45,759,402 | - | 45,759,402 | ||||||||||||
|
Mortgage-backed securities (residential)
|
- | 49,721,357 | 5,767,613 | 55,488,970 | ||||||||||||
|
Mortgage-backed securities (commercial)
|
- | 4,683,017 | - | 4,683,017 | ||||||||||||
|
Collateralized debt obligations
|
- | - | 4,600 | 4,600 | ||||||||||||
|
Total
|
$ | - | $ | 104,336,443 | $ | 5,772,213 | $ | 110,108,656 | ||||||||
| December 31, 2009 | ||||||||||||||||
|
Level 1
|
Level 2
|
Level 3
|
Total
|
|||||||||||||
|
Available for sale securities:
|
||||||||||||||||
|
U.S. Government agency debt obligations
|
$ | - | $ | 8,287,383 | $ | - | $ | 8,287,383 | ||||||||
|
Obligations of states and political subdivisions
|
- | 27,202,545 | - | 27,202,545 | ||||||||||||
|
Mortgage-backed securities (residential)
|
- | 39,565,442 | 5,091,556 | 44,656,998 | ||||||||||||
|
Mortgage-backed securities (commercial)
|
- | 5,022,234 | - | 5,022,234 | ||||||||||||
|
Collateralized debt obligations
|
- | - | 10,000 | 10,000 | ||||||||||||
|
Total
|
$ | - | $ | 80,077,604 | $ | 5,101,556 | $ | 85,179,160 | ||||||||
The following table represents the changes in the Level 3 fair-value category for the period ended December 31, 2010 and December 31, 2009. We classify financial instruments in Level 3 of the fair-value hierarchy when there is reliance on at least one significant unobservable input in the valuation model. In addition to these unobservable inputs, the valuation models for Level 3 financial instruments typically also rely on a number of inputs that are readily observable either directly or indirectly. Thus, the gains and losses presented below include changes in the fair value related to both observable and unobservable inputs years ended December 31, 2010 and December 31, 2009.
|
December 31
|
||||||||
|
Collateralized Debt Obligation
|
2010
|
2009
|
||||||
|
Beginning Balance, January 1
|
$ | 10,000 | $ | 230,900 | ||||
|
Net realized/unrealized gains (losses)
|
||||||||
|
Included in earnings:
|
||||||||
|
Interest income on securities
|
- | 13,052 | ||||||
|
Credit loss recognized in earnings
|
(121,342 | ) | (730,000 | ) | ||||
|
Included in other comprehensive income
|
115,942 | 496,048 | ||||||
|
Transfers in (out) of Level 3
|
- | - | ||||||
|
Ending Balance, December 31
|
$ | 4,600 | $ | 10,000 | ||||
71
|
December 31
|
||||||||
|
Mortgage backed securities (residential)
|
2010
|
2009
|
||||||
|
Beginning Balance, January 1
|
$ | 5,091,556 | $ | - | ||||
|
Principal paydowns
|
(1,108,673 | ) | (822,736 | ) | ||||
|
Net realized/unrealized gains (losses)
|
||||||||
|
Included in earnings:
|
||||||||
|
Interest income on securities
|
92,357 | 340,310 | ||||||
|
Credit loss recognized in earnings
|
(36,961 | ) | (20,770 | ) | ||||
|
Included in other comprehensive income
|
174,328 | 202,995 | ||||||
|
Purchases of Level 3 securities
|
1,555,006 | 4,886,503 | ||||||
|
Transfers in (out) of Level 3
|
- | 505,254 | ||||||
|
Ending Balance, December 31
|
$ | 5,767,613 | $ | 5,091,556 | ||||
The table below summarizes changes in unrealized gains and losses recorded in earnings for the year ended December 31 for Level 3 assets that are still held at December 31.
|
Changes in Unrealized Gains (Losses)
Relating to Assets Held at Reporting Date
for the Year Ended December 31
|
||||||||
|
Collateralized Debt Obligation
|
2010
|
2009
|
||||||
|
Interest income on securities
|
$ | - | $ | 13,052 | ||||
|
Impairment recognized in earnings
|
121,342 | 730,000 | ||||||
|
Other
|
(5,400 | ) | (247,004 | ) | ||||
|
Total
|
$ | 115,942 | $ | 496,048 | ||||
|
Changes in Unrealized Gains (Losses)
Relating to Assets Held at Reporting Date
for the Year Ended December 31
|
||||||||
|
Mortgage backed securities (residential)
|
2010
|
2009
|
||||||
|
Impairment recognized in earnings
|
36,961 | 20,770 | ||||||
|
Other
|
137,367 | 182,225 | ||||||
|
Total
|
$ | 174,328 | $ | 202,995 | ||||
Assets Measured at Fair Value on a Non-recurring Basis
Other certain assets and liabilities are measured at fair value on a non-recurring basis and are therefore not included in the tables above. These include impaired loans, which are measured at fair value based on the fair value of the underlying collateral. Fair value is determined, where possible, using market prices derived from an appraisal or evaluation. However, certain assumptions and unobservable inputs are used many times by the appraiser, therefore, qualifying the assets as Level 3 in the fair-value hierarchy.
72
The following table presents for each of the fair-value hierarchy levels our assets that are measured at fair value on a non-recurring basis at December 31, 2010 and December 31, 2009.
| December 31, 2010 | ||||||||||||||||
|
Level 1
|
Level 2
|
Level 3
|
Total
|
|||||||||||||
|
Impaired loans:
|
||||||||||||||||
|
Commercial
|
$ | 5,491,859 | $ | 5,491,859 | ||||||||||||
|
Commercial Real Estate
|
||||||||||||||||
|
Construction
|
763,986 | 763,986 | ||||||||||||||
|
Other
|
4,617,865 | 4,617,865 | ||||||||||||||
|
Other real estate owned:
|
||||||||||||||||
|
Commercial Real Estate
|
||||||||||||||||
|
Construction
|
$ | 1,878,255 | $ | 1,878,255 | ||||||||||||
|
Other
|
917,000 | 917,000 | ||||||||||||||
|
Residential Real Estate
|
||||||||||||||||
|
Traditional
|
279,000 | 279,000 | ||||||||||||||
|
Jumbo
|
- | - | ||||||||||||||
| December 31, 2009 | ||||||||||||||||
|
Level 1
|
Level 2
|
Level 3
|
Total
|
|||||||||||||
|
Impaired loans
|
9,849,754 | 9,849,754 | ||||||||||||||
|
Other real estate owned
|
1,932,200 | 1,932,200 | ||||||||||||||
Impaired loans, with specific loss allocations, which are measured for impairment using the fair value of the collateral for collateral dependent loans, had a carrying value of $12.5 million, with a valuation allowance of $1.6 million, resulting in an additional provision for loan losses of $1.6 million for the period ending December 31, 2010. This compares to a carrying value of $13.7 million and a valuation allowance of $3.8 million, resulting in an additional provision for loan losses of $3.7 million for the period ending December 31, 2009. The decrease in the valuation allowance from 2009 to 2010 was primarily due to the fact that most of the loans that are impaired have sufficient collateral to support the remaining balance of the loans. If they do not have sufficient collateral, the loans are reduced to or reserved to the fair value. Impaired loans with a carrying amount totaling $5.4 million at December 31, 2010 and $5.7 million at December 31, 2009 were excluded from the chart above as these were measured using the present value of expected future cashflows, which is not considered fair value.
Nonrecurring adjustments to certain commercial and residential real estate properties classified as other real estate owned (OREO) are measured at the lower of carrying amount or fair value, less costs to sell. Fair values are generally based on third party appraisals of the property that include certain assumptions and unobservable inputs used many times by appraisers, resulting in a Level 3 classification. In cases where the carrying amount exceeds the fair value, less costs to sell, an impairment loss is recognized. Whenever a new fair value is determined, which is typically done on an annual basis in the other real estate owned category, we report the property at that new value. At December 31, 2010 the carrying value was $3.5 million, with a valuation allowance of $446,043, resulting in additional OREO expense of approximately $446,000 in 2010. This compares to a carrying value of $1.9 million, with no valuation allowance, at December 31, 2009. The remaining properties in the other real estate owned have either been recently added, at fair value, to the category or were valued more than 12 months ago.
Note 5 - Premises and Equipment, net
In 2010, net premises and equipment increased primarily due to the completion of construction on a new branch building located in the northwest corner of Fort Wayne, Indiana that replaced our previously leased branch near the same location. Depreciation expense for 2010, 2009, and 2008 was $794,012, $1.1 million, and $1.2 million, respectively. Information regarding lease commitments is provided in Note 12.
73
Premises and equipment at December 31, 2010 and 2009 are summarized as follows:
|
December 31,
|
||||||||
|
2010
|
2009
|
|||||||
|
Land
|
$ | 3,098,640 | $ | 3,098,640 | ||||
|
Buildings
|
4,166,024 | 3,154,723 | ||||||
|
Leashold improvements
|
1,169,418 | 1,234,154 | ||||||
|
Furniture and equipment
|
6,680,919 | 6,447,658 | ||||||
|
Construction in process
|
- | 318,465 | ||||||
|
Subtotal
|
15,115,001 | 14,253,640 | ||||||
|
Accumulated depreciation
|
(6,785,283 | ) | (6,242,066 | ) | ||||
|
Premises and equipment, net
|
$ | 8,329,718 | $ | 8,011,574 | ||||
Note 6 – Deposits
Deposits at December 31, 2010 and 2009 are summarized as follows:
|
2010
|
2009
|
|||||||||||||||
|
Balance
|
%
|
Balance
|
%
|
|||||||||||||
|
Core Deposits:
|
||||||||||||||||
|
Noninterest-bearing demand
|
$ | 92,872,957 | 16.1 | % | $ | 95,027,233 | 16.7 | % | ||||||||
|
Interest-bearing checking
|
101,158,162 | 17.6 | % | 89,734,976 | 15.8 | % | ||||||||||
|
Money market
|
159,336,066 | 27.7 | % | 152,091,793 | 26.7 | % | ||||||||||
|
Savings
|
22,672,555 | 3.9 | % | 18,264,036 | 3.2 | % | ||||||||||
|
Time, under $100,000
|
55,450,402 | 9.6 | % | 77,202,688 | 13.6 | % | ||||||||||
|
Total core deposits
|
431,490,142 | 74.9 | % | 432,320,726 | 76.0 | % | ||||||||||
|
Non-core deposits:
|
||||||||||||||||
|
In-market non-core deposits:
|
||||||||||||||||
|
Time, $100,000 and over
|
39,356,777 | 6.8 | % | 67,389,262 | 11.9 | % | ||||||||||
|
Out-of-market non-core deposits:
|
||||||||||||||||
|
Brokered money market deposits
|
12,015,936 | 2.1 | % | - | 0.0 | % | ||||||||||
|
Brokered certificate of deposits
|
93,493,281 | 16.2 | % | 68,670,363 | 12.1 | % | ||||||||||
|
Total out-of-market deposits
|
105,509,217 | 18.3 | % | 68,670,363 | 12.1 | % | ||||||||||
|
Total non-core deposits
|
144,865,994 | 25.1 | % | 136,059,625 | 24.0 | % | ||||||||||
|
Total deposits
|
$ | 576,356,136 | 100.0 | % | $ | 568,380,351 | 100.0 | % | ||||||||
The following table shows the maturity distribution for certificates of deposit at December 31,2010.
|
under
$100,000
|
$100,000
and over
|
Total
|
||||||||||
|
2011
|
67,504,451 | 25,590,053 | 93,094,504 | |||||||||
|
2012
|
37,749,070 | 12,336,827 | 50,085,897 | |||||||||
|
2013
|
8,381,459 | 674,402 | 9,055,861 | |||||||||
|
2014
|
3,292,913 | 114,800 | 3,407,713 | |||||||||
|
2015
|
7,439,716 | 640,695 | 8,080,411 | |||||||||
|
Thereafter
|
24,576,074 | - | 24,576,074 | |||||||||
|
Total
|
$ | 148,943,683 | $ | 39,356,777 | $ | 188,300,460 | ||||||
74
Note 7 - Federal Home Loan Bank Advances
At December 31, 2010 and 2009, advances from the Federal Home Loan Bank ("FHLB") were:
|
2010
|
2009
|
|||||||
|
2.29% bullet advance, principal due at maturity March 22, 2010
|
- | 2,000,000 | ||||||
|
3.26% bullet advance, principal due at maturity April 28, 2010
|
- | 1,500,000 | ||||||
|
0.47% variable rate advance, principal due at maturity May 24, 2010
|
- | 15,000,000 | ||||||
|
0.47% variable rate advance, principal due at maturity June 16, 2010
|
- | 12,000,000 | ||||||
|
3.63% bullet advance, principal due at maturity June 28, 2010
|
- | 4,000,000 | ||||||
|
4.23% bullet advance, principal due at maturity June 29, 2010
|
- | 1,200,000 | ||||||
|
3.19% bullet advance, principal due at maturity March 28, 2011
|
2,000,000 | 2,000,000 | ||||||
|
3.60% bullet advance, principal due at maturity April 28, 2011
|
1,500,000 | 1,500,000 | ||||||
|
3.55% bullet advance, principal due at maturity March 26, 2012
|
2,000,000 | 2,000,000 | ||||||
|
3.81% bullet advance, principal due at maturity March 26, 2013
|
2,000,000 | 2,000,000 | ||||||
|
Total Federal Home Loan Bank advances
|
$ | 7,500,000 | $ | 43,200,000 | ||||
Of the total FHLB borrowings at December 31, 2010 and 2009, no advances had callable options.
At December 31, 2010 scheduled principal reductions on these FHLB advances were as follows:
|
Year
|
Advances
|
|||
|
2011
|
3,500,000 | |||
|
2012
|
2,000,000 | |||
|
2013
|
2,000,000 | |||
|
2014
|
- | |||
|
2015
|
- | |||
|
|
$ | 7,500,000 | ||
At December 31, 2010, in addition to FHLB stock, we pledged securities held by the FHLB totaling $1.1 million and have pledged loans totaling approximately $40.8 million that are being safe kept at US Bank as "specific" collateral to secure advances outstanding at FHLB of Indianapolis. Also, we had unpledged interest-bearing deposits with the FHLB at December 31, 2010 totaling $3.3 million. At December 31, 2009, in addition to FHLB stock, we pledged securities held by the FHLB totaling $2.4 million and have pledged loans totaling approximately $116.2 million under a blanket collateral agreement to secure advances outstanding. Also, we had unpledged interest-bearing deposits with the FHLB of Indianapolis at December 31, 2009 totaling $524,996.
75
Note 8 - Junior Subordinated Debentures and Trust Preferred Securities
On December 5, 2005, TCT2 sold 8,000 Trust Preferred Securities with a par value of $1,000 at a rate equal to the three-month Libor rate plus 1.34%. The initial rate was fixed at 6.21% for the first five years, after which the rate went floating based on the three-month Libor plus 1.34% beginning December 5, 2010. The proceeds of the sale and the initial equity investment were loaned to us in exchange for junior subordinated debentures of $8,248,000 with similar terms to the Trust Preferred Securities. The sole assets of TCT2 are the junior subordinated debentures to us and payments thereunder as well as certain unamortized issuance costs. The junior subordinated debentures are subject to mandatory redemption, in whole or in part, upon repayment of the Trust Preferred Securities at maturity or their earlier redemption at the par amount. The maturity date of the Trust Preferred Securities is December 4, 2035. While subject to receiving approval of the Federal Reserve Bank, the Trust Preferred Securities are redeemable prior to the maturity date as of December 5, 2010 and each year thereafter at our option. As of December 5, 2010, we have chosen not to redeem the debt due to the low rate of interest we are receiving on this debt of LIBOR plus 134 basis points. As of December 31, 2010, the rate moved to 1.64%. We have the option to defer interest payments on the Trust Preferred Securities from time to time for a period not to exceed 20 consecutive quarterly periods. The Company is not considered the primary beneficiary of this Trust (variable interest entity), therefore the trust is not consolidated in the Company’s financial statements, but rather the subordinated debentures are shown as a liability.
On December 29, 2006, TCT3 sold 9,000 Trust Preferred Securities with a par value of $1,000 at a rate equal to the three-month Libor rate plus 1.69%. The initial rate was fixed at 6.56% for the first five years, after which the rate will float based on the three-month Libor plus 1.69% beginning December 29, 2011. The proceeds of the sale and the initial equity investment were loaned to us in exchange for junior subordinated debentures of $9,279,000 with similar terms to the Trust Preferred Securities. The sole assets of TCT3 are the junior subordinated debentures to us and payments thereunder as well as certain unamortized issuance costs. The junior subordinated debentures are subject to mandatory redemption, in whole or in part, upon repayment of the Trust Preferred Securities at maturity or their earlier redemption at the par amount. The maturity date of the Trust Preferred Securities is March 1, 2037. Subject to our having received prior approval of the Federal Reserve Bank, if then required, the Trust Preferred Securities are redeemable prior to the maturity date beginning March 1, 2012 and each year thereafter at our option. We have the option to defer interest payments on the Trust Preferred Securities from time to time for a period not to exceed 20 consecutive quarterly periods. The Company is not considered the primary beneficiary of this Trust (variable interest entity), therefore the trust is not consolidated in the Company’s financial statements, but rather the subordinated debentures are shown as a liability.
On May 5, 2010, we entered into a written agreement with the Federal Reserve and the IDFI, effective April 23, 2010 (the “Written Agreement”). The Written Agreement was filed publicly in our Current Report on Form 8-K on May 5, 2010. For details regarding the Written Agreement, refer to Note 15. One of the requirements in the Written Agreement was that we are not to make any payments of interest on the Company’s Trust Preferred Debt, without written approval from the Federal Reserve. In response to these requirements, no Trust Preferred Debt interest payments were made in 2010.
Note 9 - Income Taxes
The consolidated provision for income taxes for the following years ended December 31
are as follows:
|
2010
|
2009
|
2008
|
||||||||||
|
Federal - current
|
$ | 1,672,751 | $ | (1,979,673 | ) | $ | 1,600,391 | |||||
|
- deferred
|
(790,280 | ) | (779,509 | ) | (1,356,087 | ) | ||||||
|
State - current
|
- | - | - | |||||||||
|
- deferred
|
(103,927 | ) | (1,264,943 | ) | (527,796 | ) | ||||||
|
Change in valuation allowance related to realization of net state deferred tax assets
|
103,927 | 1,559,288 | 306,496 | |||||||||
|
Change in valuation allowance related to realization of security impairments
|
41,256 | 248,200 | - | |||||||||
|
Total income taxes expense
|
$ | 923,727 | $ | (2,216,637 | ) | $ | 23,004 | |||||
76
The effective tax rate differs from the statutory tax rate applicable to corporations as a result of permanent and other differences between accounting and taxable income as shown below:
|
2010
|
2009
|
2008
|
||||||||||
|
Statutory tax rate
|
(34.0 | )% | (34.0 | )% | 34.0 | % | ||||||
|
State tax, net of federal income tax effect
|
0.0 | % | 8.2 | % | (7.7 | )% | ||||||
|
Tax exempt interest
|
(9.0 | )% | (3.9 | )% | (14.4 | )% | ||||||
|
Earnings on life insurance
|
(3.9 | )% | (2.0 | )% | (7.9 | )% | ||||||
|
Other
|
1.5 | % | 3.4 | % | (2.8 | )% | ||||||
|
Effective tax rate
|
22.6 | % | (28.3 | )% | 1.2 | % | ||||||
The net deferred tax asset included the following amounts of deferred tax assets and liabilities at December 31, 2010 and 2009:
|
2010
|
2009
|
|||||||
|
Deferred tax assets:
|
||||||||
|
Provision for loan losses
|
$ | 4,876,915 | $ | 4,555,992 | ||||
|
State net operating loss and credit carryforward
|
1,744,148 | 1,703,271 | ||||||
|
Deferred compensation
|
667,058 | 688,675 | ||||||
|
Accrued Director's Fees
|
279,681 | 313,909 | ||||||
|
Net deferred loan costs
|
22,670 | 65,295 | ||||||
|
Depreciation
|
80,100 | 29,480 | ||||||
|
Other real estate owned
|
845,423 | 444,297 | ||||||
|
Net unrealized depreciation on securities available for sale
|
- | - | ||||||
|
Security impairments
|
311,999 | 256,360 | ||||||
|
Other
|
106,893 | 105,418 | ||||||
|
Total deferred tax assets
|
8,934,887 | 8,162,697 | ||||||
|
Deferred tax liabilities:
|
||||||||
|
Prepaid expenses
|
(147,111 | ) | (123,949 | ) | ||||
|
Net unrealized appreciation on securities available for sale
|
(548,730 | ) | (468,803 | ) | ||||
|
Real estate investment trust
|
- | (134,194 | ) | |||||
|
Other
|
(34,911 | ) | (45,897 | ) | ||||
|
Total deferred tax liabilities
|
(730,752 | ) | (772,843 | ) | ||||
|
Net deferred tax asset before asset valuation
|
8,204,135 | 7,389,854 | ||||||
|
Valuation allowance for deferred tax assets
|
(2,909,322 | ) | (2,764,139 | ) | ||||
|
Net deferred tax asset
|
$ | 5,294,813 | $ | 4,625,715 | ||||
Realization of deferred tax assets associated with the net operating loss carryforwards is dependent upon generating sufficient taxable income prior to their expiration. A valuation allowance to reflect management’s estimate of the temporary deductible differences that may expire prior to their utilization was recorded at year end 2010 for state purposes.
In 2009, we determined that the state deferred tax asset was more likely than not unrealizable and recorded a valuation allowance against it. This decision was made primarily due to owning a REIT which has generated a substantial state net operating loss and we think it is more likely than not that we would not be able to realize the benefit of the state net operating loss before it expires. Based on this conclusion, we created a valuation allowance on the state deferred tax asset in 2009, which amounted to $2.5 million. That allowance increased in 2010 to $2.6 million. We have an Indiana net operating loss carryforward of approximately $27.7 million which will start to expire in 2022 if not used. We also have an Indiana credit carryforward of $292,000 which will begin to expire in 2016.
In evaluating the federal deferred tax asset, we have come to the conclusion that it is more likely than not going to be realized. The most important test when evaluating impairment is based on whether or not there is a cumulative net loss over the last three years. While we still have a cumulative net loss position over the last three years of $1.8 million, this has improved significantly from 2009 when our cumulative net loss position was $10.3 million. The losses reported in 2009 were primarily due to significant loan loss provision recorded due to the asset quality items. These loans were originated pre-2006 when the current, more restrictive policies and procedures were not in place to prevent the booking of several problem loans that would no longer pass the system we have now. In 2009, we had a net operating loss, which we were able to carry the entire tax loss created in 2009 to prior years (primarily 2004 - 2006) with no net operating loss to carry forward. To be conservative, we have recorded a valuation allowance of $289,456 on a capital loss from an other-than-temporary impairment charge on the trust preferred security held at our investment subsidiary, Tower Capital Investments, Inc, at December 31, 2010. The primary reason for this valuation allowance is that capital losses can only be offset by capital gains and the carry forward periods are much shorter at only five years compared to those on ordinary losses at 20 years. Due to the lack of sales activity at the investment subsidiary, it is more likely than not that the capital loss will be unrealizable. Although we have been conservative in creating a valuation allowance against this loss, there is a possibility that we could realize the loss through proper tax planning in the next couple of years. This valuation allowance was $248,200 at December 31, 2009.
77
The Company and its subsidiaries are subject to U.S. Federal income taxes as well as income tax of the state of Indiana. The company is no longer subject to examination by taxing authorities before 2006. We had no unrecognized tax positions at December 31, 2010 and December 31, 2009. Management does not expect unrecognized tax benefits to significantly increase in the next twelve months.
Note 10 – Equity Incentive Plans
Options to buy stock were previously granted to directors, officers and employees under the 1998 and 2001 Stock Option and Incentive Plans (the “Plans”), which together provided for issuance of up to 435,000 shares of common stock of Tower Financial Corporation. Options for all 435,000 shares were issued under the Plans, of which 76,154 remain outstanding as of December 31, 2010. Option awards were granted with an exercise price equal to the market price of our stock at the date of each grant, vesting over a four-year period, and issued with a ten-year contractual term. The compensation cost that has been charged against income for options granted under the Plans was $0, $21,996, and $43,746 for 2010, 2009, and 2008, respectively. No tax benefit was recognized related to this expense.
The fair value of each option award was estimated on the date of grant using the Black-Scholes valuation model using grant date assumptions. Expected volatilities are based on implied volatilities from historical volatility of our stock and other factors. We used historical data to estimate option exercise and forfeiture rates within the valuation model for valuation purposes. The expected term of options granted was derived from the output of the option valuation model and represented the period of time that options granted were expected to be outstanding; the range given below resulted from certain groups of employees exhibiting different behavior. The risk-free rates for periods within the contractual life of the options are based on the U.S. Treasury yield curve in effect at the time of grant. No options have been granted since 2005.
78
A summary of the option activity under the Plans as of December 31, 2010 and changes during the twelve-month period then ended are presented below:
|
Options
|
Shares
|
Weighted-
Average
Aggregate
Exercise
Price
|
Weighted-
Average
Remaining
Contractual
Term
|
Instrinsic
Value
|
||||||||||||
|
Outstanding at 1/1/10
|
91,404 | $ | 13.31 | 3.49 | $ | - | ||||||||||
|
Granted
|
- | - | - | - | ||||||||||||
|
Exercised
|
- | - | - | - | ||||||||||||
|
Forfeited or expired
|
(15,250 | ) | 13.02 | - | - | |||||||||||
|
Outstanding at 12/31/10
|
76,154 | 13.37 | 2.72 | - | ||||||||||||
|
Vested or expected to vest at 12/31/10
|
76,154 | 13.37 | 2.72 | - | ||||||||||||
|
Exercisable at 12/31/10
|
76,154 | 13.37 | 2.72 | - | ||||||||||||
The total intrinsic value of options exercised in 2008 was $1,298. There were no options exercised in 2010 or 2009.
No further options will be granted under either of these Plans, but the plans will remain in effect for purposes of administering already existing options previously granted and still outstanding under the Plans. As of December 31, 2010, there is no unrecognized compensation expense for the 1998 and 2001 Stock Options plan.
On April 19, 2006, at our annual meeting of stockholders, stockholders approved Tower Financial Corporation’s 2006 Equity Incentive Plan, under which 150,000 shares have been reserved for issuance as incentive stock options, nonstatutory stock options, restricted stock awards, unrestricted stock awards, performance awards, or stock appreciation rights. The compensation cost that has been charged against income for restricted shares awarded under the Plan was $46,910 and $46,910 for the years ended December 31, 2010 and 2009, respectively. Future expense related to this award will be $46,910 in 2011 and $14,062 in 2012.
A summary of the restricted stock activity as of December 31, 2010 and changes during the twelve-month period then ended are presented below:
|
Restricted Stock
|
Shares
|
Weighted-
Average
Grant-Date
Fair Value
|
||||||
|
Outstanding at 1/1/10
|
15,125 | $ | 8.87 | |||||
|
Granted
|
- | - | ||||||
|
Vested
|
(5,375 | ) | 8.73 | |||||
|
Forfeited
|
- | - | ||||||
|
Outstanding at 12/31/10
|
9,750 | 8.95 | ||||||
79
Note 11 - Related Persons Transactions
Certain directors and executive officers, including their immediate families and companies in which they are principal owners, are loan customers of the Bank. At December 31, 2010 and 2009, the Bank had $20.9 million and $22.8 million, respectively in loan commitments to directors and executive officers, of which $15.3 million and $18.8 million, respectively, were funded at the respective year-ends, as reflected in the following table.
Loans to Directors and Executive Officers
|
2010
|
2009
|
|||||||
|
Beginning balance, January 1
|
$ | 18,848,873 | $ | 20,273,155 | ||||
|
New loans
|
15,073,464 | 10,677,632 | ||||||
|
Repayments
|
(18,662,620 | ) | (7,120,911 | ) | ||||
|
Other Changes
|
- | (4,981,003 | ) | |||||
|
Ending balance, December 31
|
$ | 15,259,717 | $ | 18,848,873 | ||||
Other changes include adjustments for loans applicable to one reporting period that are excludable from the other reporting period, due to changes in related parties.
Deposits from principal officers, directors, and their affiliates at year-end 2010 and 2009 were $23.6 million and $35.2 million.
During 2010, 2009, and 2008, we engaged in transactions with entities controlled by certain directors or their affiliates. All transactions with “related persons” are reviewed and approved pursuant to Tower Financial Corporation’s February 2007 Statement of Policy for the Review, Approval or Ratification of Transactions with Related Persons.
The Bank leases its headquarters facility from Tippmann Properties, Inc., agent for John V. Tippmann, Sr. The original lease was a 10-year lease commencing on January 1, 1999. The headquarters facility consists of drive-up banking windows and approximately 49,257 square feet of usable office space. The lease was renegotiated in 2009 effective January 1, 2010 to reduce the rent on the fifth floor and portions of the second floor, to vacate the third floor, and to extend the lease term on the first and second floors to December 2018. The lease term for the fifth floor has not changed and expires in December 2013. These new terms caused a reduction of approximately $60,000 a year in rent compared to the rent expenses recorded in 2009. There is also an option to renew for an additional ten years. We also have a right of first refusal to buy the entire building in the event the landlord wishes to sell the property. The total amount paid to Tippmann Properties by the Company and the Bank for rent and maintenance was $707,840, $767,290, and $782,804 during 2010, 2009, and 2008, respectively. The lease is accounted for as an operating lease. Refer to Note 12 for a summary of future lease payment commitments under this and other leases.
The law firm of Barrett & McNagny LLP, of which Robert S. Walters is a partner, performs legal services for the Company. Mr. Walters is the spouse of Irene A. Walters, one of our directors. We paid $133,839, $111,068, and $65,829 in legal fees and related expenses to this law firm in 2010, 2009, and 2008, respectively.
In 2008, the Bank engaged Ruffolo Benson, LLC for management consulting services. Joseph Ruffolo is a principal owner of Ruffolo Benson, LLC and is one of our directors. The engagement was completed in 2008 and we paid $31,760 to Ruffolo Benson, LLC for these services in that year.
The relationships with Tippmann Properties, Inc. and Barrett & McNagny LLP were all approved in advance by our Audit Committee and our full Board of Directors pursuant to our Statement of Policy for the Review, Approval or Ratification of Transactions With Related Persons. Ruffolo Benson, LLC was below the dollar amount stated in the policy mentioned above and was not required to be approved by the full Board of Directors.
Note 12 - Commitments and Off-Balance-Sheet Risk
Commitments to Extend Credit and Standby Letters of Credit: The Bank maintains off-balance-sheet investments in the normal course of business to meet the financing needs of its customers. These financial instruments include commitments to extend credit and standby letters of credit. Loan commitments to extend credit are agreements to lend to a customer as long as there is no violation of any condition established in the contract. Standby letters of credit are conditional commitments issued by the Bank to guarantee the performance of a customer to a third party. Commitments generally have fixed expiration dates or other termination clauses and may require payment of a fee. Since many of the commitments are expected to expire without being drawn upon, the total commitment amounts do not necessarily represent future cash requirements.
80
The instruments involve, to varying degrees, elements of credit risk in excess of the amount recognized, if any, in the balance sheet. The Bank’s maximum exposure to loan loss in the event of nonperformance by the other party to the financial instruments for commitments to extend credit and standby letters of credit is represented by the face amount of these instruments. Commitments to extend credit are recorded when they are funded and standby letters of credit are carried at fair value.
The Bank uses the same credit policies in making commitments and conditional obligations as it does for on-balance-sheet instruments. Collateral, such as accounts receivable, securities, inventory, property and equipment, is generally obtained based on management’s credit assessment of the borrower.
Fair value of the Bank’s off-balance-sheet instruments (commitments to extend credit and standby letters of credit) is based on rates currently charged to enter into similar agreements, taking into account the remaining terms of the agreements and the counterparties’ credit standing. At December 31, 2010 and 2009, the rates on existing off-balance-sheet instruments were equivalent to current market rates, considering the underlying credit standing of the counterparties.
The Bank’s maximum exposure to credit losses for loan commitments and standby letters of credit outstanding at December 31, 2010 and 2009 was as follows:
|
2010
|
2009
|
|||||||
|
Commitments to extend credit - Variable Rate
|
$ | 91,118,545 | $ | 109,013,729 | ||||
|
Commitments to extend credit - Fixed Rate
|
13,816,321 | 18,358,776 | ||||||
|
Standby letters of credit
|
2,801,698 | 2,474,642 | ||||||
|
Total
|
$ | 107,736,564 | $ | 129,847,147 | ||||
Management does not anticipate any significant losses as a result of these commitments. Commitments to make loans are generally made for periods of one year or less.
Lease and Other Contracted Commitments: We occupy our headquarters, offices and other facilities under long-term operating leases and, in addition, are party to long-term contracts for data processing and operating systems. The future minimum annual commitments under all operating leases as of December 31, 2010 are as follows:
|
Year
|
Lease Commitments
|
|||
|
2011
|
739,808 | |||
|
2012
|
704,608 | |||
|
2013
|
701,408 | |||
|
2014
|
600,617 | |||
|
2015
|
600,617 | |||
|
2016 and beyond
|
1,801,852 | |||
| $ | 5,148,910 | |||
The lease expense paid for operating leases for the facilities leased was $775,238, $846,165, and $847,724 for 2010, 2009 and 2008, respectively.
Employment Contracts: Under the terms of certain employment contracts, upon the occurrence of certain events resulting in the severance of certain senior officers’ employment, payments may be required to be made in excess of amounts that have been accrued.
Note 13 - Benefit Plans
Profit Sharing Plan: We maintain a profit sharing plan covering substantially all employees. Payments to be made under the plan, if at all, are determined by our Compensation Committee. Awards may be based on a formula approved by our Board of Directors, our results of operations, individual performance measures and/or may be discretionary. As of December 31, 2010 and 2009, management had accrued a liability for this plan of approximately $594,352 and $95,000, respectively, which is included in other liabilities in the consolidated balance sheets. The expense incurred during 2010, 2009, and 2008 was $594,352, $95,000, and $0, respectively.
81
401(k) Plan: We established a 401(k) plan effective March 1, 1999 covering substantially all of our employees. The plan allows employees to contribute up to 15% of their compensation. We may match a portion of the employees’ contributions and provide investment choices for employees, including investment in our common stock. Matching contributions are vested equally over a six-year period. Matching contributions to the 401(k) plan are determined annually by management and approved by our Compensation Committee. Our Compensation Committee approved annually an employer contribution for the 2008 plan year matching 50% of the first 6% of the compensation contributed. In 2009, the Compensation Committee approved a contribution matching 25% of the first 4% through September 2009 and made no matching contribution in the fourth quarter of 2009. The match of 25% on the first 4% was reinstated by the Compensation Committee as of July 1, 2010. The total contribution made during 2010, 2009, and 2008 was $26,553, $32,921, and $196,626, respectively.
Deferred Compensation Plan: Effective January 1, 2002, a deferred compensation plan covers certain officers. Under the plan, we pay each participant, or their beneficiary, the amount of compensation deferred by the employee or contributed by the employer on a discretionary basis, plus interest, beginning with the individual’s termination of service. Employer discretionary contributions vest over four years. Payments are to be made either immediately or over a five-year period, depending upon the amount to be paid. A liability is accrued for the obligation under this plan and is reported in other liabilities in the consolidated balance sheets. The expense (income) incurred for the deferred compensation plan in 2010, 2009, and 2008 was ($329), $15,718, and $17,202, respectively, resulting in a deferred compensation liability of $121,531 and $121,860 as of December 31, 2010 and 2009.
Deferred Directors' Fees Plan: Effective January 1, 2002, the deferred directors' fee plan covers all non-employee directors for a period of 10 years. Under the plan, we pay each participant, or their beneficiary, the amount of directors' fees deferred plus interest, beginning with the director’s termination of service or the expiration of the plan, whichever comes first. Payments upon termination of service are paid on March 31st of the year following termination. Payments are to be made either in a lump sum or over a four-year period. A liability is accrued for the obligation under this plan and is reported in other liabilities in the consolidated balance sheets. The expense incurred for the deferred directors' fee plan for 2010, 2009, and 2008 was $46,646, $132,171, and $170,261 resulting in a deferred compensation liability of $716,242 and $799,133 as of December 31, 2010 and 2009, respectively.
Supplemental Employment Retirement Plan: Effective January 1, 2002, we adopted a supplemental employee retirement plan that covers one officer. In January 2005 the plan was amended to set the benefit at 65% of the officer’s highest annual salary. On January 1, 2006, the retirement benefit plan was further amended to set a fixed amount of up to a maximum $185,250 annually, depending on the officer’s age at retirement. On December 31, 2009, the officer retired, which was eighteen months earlier than originally planned. Based on the employee’s age at his early retirement, the new annual retirement benefit to be paid until the officer’s death will be $156,750 and was effective January 1, 2010. As a result of this early retirement, it was necessary to record the present value of the full amount of the obligation as of December 31, 2009. The plan started disbursing funds to the former employee in July of 2010 as stated in the plan. The obligation under the plan was approximately $1.6 million at December 31, 2010 and 2009 and is included in other liabilities in the consolidated balance sheet. The expense attributable to the plan is included in salaries and other employee benefits and was $112,171 in 2010, $490,690 in 2009, and $276,864 in 2008.
82
Note 14 - Fair Values of Financial Instruments
The following schedule reflects the carrying values and estimated fair values of our financial instruments at December 31, 2010 and 2009. Only financial instruments are shown.
|
2010
|
2009
|
|||||||||||||||
|
Carrying
Value
|
Fair
Value
|
Carrying
Value
|
Fair
Value
|
|||||||||||||
|
Financial assets:
|
||||||||||||||||
|
Cash and cash equivalents
|
$ | 30,675,382 | $ | 30,675,382 | $ | 24,664,309 | $ | 24,664,309 | ||||||||
|
Securities held to maturity
|
- | - | 4,495,977 | 4,635,616 | ||||||||||||
|
Securities available for sale
|
110,108,656 | 110,108,656 | 85,179,160 | 85,179,160 | ||||||||||||
|
FHLBI and FRB stock
|
4,075,100 | N/A | 4,250,800 | N/A | ||||||||||||
|
Loans held for sale
|
2,140,872 | 2,140,872 | 3,842,089 | 3,842,089 | ||||||||||||
|
Loans, net
|
474,424,715 | 477,931,195 | 515,735,072 | 518,357,191 | ||||||||||||
|
Accrued interest receivable
|
2,391,953 | 2,391,953 | 2,439,859 | 2,439,859 | ||||||||||||
|
Financial liabilities:
|
||||||||||||||||
|
Deposits
|
(576,356,136 | ) | (579,132,112 | ) | (568,380,351 | ) | (571,401,464 | ) | ||||||||
|
FHLB advances
|
(7,500,000 | ) | (7,716,450 | ) | (43,200,000 | ) | (43,578,410 | ) | ||||||||
|
Junior subordinated debt
|
(17,527,000 | ) | (16,537,065 | ) | (17,527,000 | ) | (17,147,380 | ) | ||||||||
|
Accrued interest payable
|
(1,415,713 | ) | (1,415,713 | ) | (480,885 | ) | (480,885 | ) | ||||||||
Estimated fair value for securities available for sale is consistent with the fair value hierarchy as described in Note 4. Estimated fair value for securities held to maturity is based on quoted market prices, if available. For securities where quoted market prices are not available, fair values are estimated based on the fair value of similar securities. Estimated fair value of FHLBI and FRB stock cannot be determined due to restrictions placed on its transferability. Estimated fair value for loans is based on the rates charged at year-end for new loans with similar maturities, applied until the loan is assumed to reprice or be paid and the allowance for loan losses is considered to be a reasonable estimate of discount for credit quality concerns. Estimated fair value for IRAs, CDs, short-term borrowings, fixed rate advances from the FHLB and the junior subordinated debt are based on the rates at year-end for new deposits or borrowings, applied until maturity. Estimated fair value for other financial instruments and off-balance-sheet loan commitments is considered to approximate carrying value.
Note 15 - Capital Requirements and Restrictions on Retained Earnings
Banks and bank holding companies are subject to regulatory capital requirements administered by federal banking agencies. Capital adequacy guidelines and, additionally for banks, prompt corrective action regulations involve quantitative measures of assets, liabilities and certain off-balance-sheet items calculated under regulatory accounting practices. Capital amounts and classifications are also subject to qualitative judgments by regulators. Failure to meet various capital requirements can initiate regulatory action that could have a direct material effect on the financial statements.
Prompt corrective action regulations provide five classifications: well capitalized, adequately capitalized, undercapitalized, significantly undercapitalized, and critically undercapitalized, although these terms are not used to represent overall financial condition. If only adequately capitalized, regulatory approval is required to accept brokered deposits. If undercapitalized, capital distributions are limited, as is asset growth and expansion, and capital restoration plans are required.
In January of 2007, our Board of Directors passed a resolution, at the request of our regulators, requiring Tower Bank to maintain a minimum tier one leverage ratio of 8.0%. This is 3.0% above the well-capitalized and 4.0% above the minimum capital adequacy ratios set by the Federal Reserve Bank. The resolution was passed due to the rapid growth of the Bank at that time, as the elevated minimum ratio would provide additional capital for the bank to deploy as deemed fit. In January of 2010, our Board of Directors passed a resolution requiring the Bank to maintain a Tier 1 leverage capital ratio of 8.0% and a total risk-based capital ratio of 11.0% and the Company to maintain a Tier 1 leverage capital ratio of 7.0% and a total risk-based capital ratio of 10.5% each to be measured at the end of each quarter. Both of these ratios are well above the minimum capital adequacy ratios set by the Federal Reserve Bank to be considered “well-capitalized” at 5.0% and 10.0% for the Tier 1 leverage capital ratio and the total risk-based capital ratio, respectively. At December 31, 2010 the Bank’s Tier 1 leverage ratio was 10.08% and the total risk-based capital ratio was 13.72%.
83
As of December 31, 2010, the most recent notification from the Federal Reserve and the IDFI categorized the Bank as well capitalized under the regulatory framework for prompt corrective action. To be categorized as well capitalized, the Bank must maintain minimum total risk-based, Tier 1 risk-based, and Tier 1 leverage ratios as set forth in the following table.
Actual and required capital amounts and ratios are presented in the schedule below as of December 31, 2010 and 2009:
|
2010
|
Total
Risk-Based
Capital
|
Tier 1
Risk-Based
Capital
|
Tier 1
Leverage
Capital
|
|||||||||
|
Minimum capital adequacy ratio
|
8.00 | % | 4.00 | % | 4.00 | % | ||||||
|
Percent to be well capitalized
|
10.00 | % | 6.00 | % | 5.00 | % | ||||||
|
Actual % - December 31, 2010
|
||||||||||||
|
Company
|
14.30 | % | 13.10 | % | 10.55 | % | ||||||
|
Bank
|
13.72 | % | 12.46 | % | 10.08 | % | ||||||
|
At December 31, 2010:
|
||||||||||||
|
Required capital for minimum capital adequacy
|
||||||||||||
|
Company
|
$ | 42,389,331 | $ | 21,194,666 | $ | 26,311,132 | ||||||
|
Bank
|
42,526,231 | 21,263,116 | 26,294,523 | |||||||||
|
Required capital to be well capitalized
|
||||||||||||
|
Company
|
52,986,664 | 31,791,999 | 32,888,915 | |||||||||
|
Bank
|
53,157,789 | 31,894,674 | 32,868,153 | |||||||||
|
Actual capital
|
||||||||||||
|
Company
|
75,759,323 | 69,418,093 | 69,418,093 | |||||||||
|
Bank
|
72,953,185 | 66,236,305 | 66,236,305 | |||||||||
|
2009
|
Total
Risk-Based
Capital
|
Tier 1
Risk-Based
Capital
|
Tier 1
Leverage
Capital
|
|||||||||
|
Minimum capital adequacy ratio
|
8.00 | % | 4.00 | % | 4.00 | % | ||||||
|
Percent to be well capitalized
|
10.00 | % | 6.00 | % | 5.00 | % | ||||||
|
Actual % - December 31, 2009
|
||||||||||||
|
Company
|
12.45 | % | 10.90 | % | 9.05 | % | ||||||
|
Bank
|
12.32 | % | 11.06 | % | 9.30 | % | ||||||
|
At December 31, 2009:
|
||||||||||||
|
Required capital for minimum capital adequacy
|
||||||||||||
|
Company
|
$ | 45,055,048 | $ | 22,527,524 | $ | 27,137,767 | ||||||
|
Bank
|
45,204,557 | 22,602,278 | 26,874,439 | |||||||||
|
Required capital to be well capitalized
|
||||||||||||
|
Company
|
56,318,810 | 33,791,286 | 33,922,208 | |||||||||
|
Bank
|
56,505,696 | 33,903,418 | 33,593,048 | |||||||||
|
Actual capital
|
||||||||||||
|
Company
|
70,122,209 | 61,368,106 | 61,368,106 | |||||||||
|
Bank
|
69,607,488 | 62,488,286 | 62,488,286 | |||||||||
On May 5, 2010, Tower Financial Corporation and its wholly owned subsidiary, Tower Bank& Trust Company, entered into a written agreement with the Federal Reserve and the IDFI, effective April 23, 2010 (the “Written Agreement”). A Written Agreement is a process employed by the Federal Reserve and the IDFI to memorialize certain understandings with the Company and the Bank, in this case flowing from a fall 2009 joint Federal Reserve and IDFI examination, based upon June 30, 2009 financial position and operating results. A Written Agreement typically addresses all of the major aspects of a financial institution’s financial and operating metrics, including capital requirements, asset quality, management, earnings and liquidity, whether or not identified as requiring improvement.
84
The following description is only a summary of the Written Agreement and does not purport to be a complete description of all of its terms, and the summary is, therefore, qualified in its entirety by reference to the Written Agreement that is filed as an exhibit to our Current Report on Form 8-K filed on May 5, 2010.
Among other things, the Written Agreement requires the Company and the Bank:
|
|
·
|
to review and revise its loan policies with regard establishing interest rate reserves; time frame for new appraisals, and its internal loan grading system.
|
|
|
·
|
to develop enhanced approval processes for the renewal of credit to any borrower who has a loan or other extension of credit on its internal watch list.
|
|
|
·
|
to expand the level of detail for all asset improvement plans and the process of reporting such plans to its Board of Directors.
|
|
|
·
|
to enhance the level of Board of Director oversight and review of pertinent operating and financial metrics.
|
|
|
·
|
to refine and improve its capital contingency plan, so as to continue to remain in excess of those levels required to remain “well capitalized”.
|
|
|
·
|
to outline and refine its liquidity policy and liquidity funding plan.
|
|
|
·
|
to not pay dividends on or redeem any of its common or preferred stock or other capital stock, or make any payments of interest on its Trust Preferred Debt, without written approval from the Federal Reserve.
|
Note 16 – Interest Rate Floor
We utilized an interest rate floor as part of our asset liability management strategy to help manage our interest rate risk position from 2006 to March of 2008. The notional amount of the interest rate floor did not represent amounts exchanged by the parties. The amount exchanged was determined by reference to the notional amount and the other terms of the agreement.
We purchased the interest rate floor for $147,000 in 2006. The notional amount of the floor was $30 million, with a term of three years and a strike price of 7.5%. The purchase price was amortized to earnings in the same period the hedged item affected earnings.
The interest rate floor was measured at fair value and reported as an asset on the consolidated balance sheet prior to the settlement in March 2008. The portion of the change in fair value of the interest rate floor that was deemed effective in hedging the cashflows of the designated assets was recorded in accumulated other comprehensive income (loss), net of tax effects, and reclassified into interest income when such cashflows occurred in the future. Any ineffectiveness resulting from the interest rate floor was recorded as a gain or loss in the consolidated statements of operations as a part of non-interest income.
This instrument was designated as a cash flow hedge. The objective of the floor was to protect the overall change in cashflows of the designated Prime-rate based loans with a spread of zero percent from extreme market interest rate changes. Changes in the cash flows of the floor were expected to be highly effective in offsetting the variability in the expected future cashflows of the hedged loans attributed to fluctuations in Prime rates below 7.5% (strike price of floor as stated above).
In March of 2008, we settled the interest rate floor agreement with our counterparty and received a payment of $833,750. There was an unrealized gain of $722,769 at the time of settlement and was reclassified out of accumulated other comprehensive income on a monthly basis until the expiration of the original floor agreement on August 1, 2009 as our hedged risk, exposure to changes in cash flows from the designated prime-rate based loans with a spread of zero payment, remained. The unrealized gain has been reclassified out of accumulated other comprehensive income into earnings using the straightline method over the term of the original floor agreement.
85
Note 17 – Earnings (Loss) Per Share
The following table reflects the calculation of basic and diluted earnings (loss) per common share for the years ended December 31, 2010, 2009 and 2008. Options for 76,154, 91,404, and 156,045 shares of common stock were not included in the computation of diluted earnings per share for the years 2010, 2009, and 2008, respectively, because they were not dilutive. The Company also has preferred stock which can be converted at the option of the holders into 128,738 and 303,987 shares of common stock at December 31, 2010 and December 31, 2009, respectively. These shares are not included in the computation of diluted earnings per share for 2009 because they were not dilutive. As the Company reported a net loss in 2009, stock options, by definition, are anti-dilutive and are not considered.
|
2010
|
2009
|
2008
|
||||||||||
|
Basic
|
||||||||||||
|
Net income (loss) available to common shareholders
|
$ | 3,163,771 | $ | (5,608,916 | ) | $ | 1,866,109 | |||||
|
Weighted average common shares outstanding
|
4,334,084 | 4,090,416 | 4,070,311 | |||||||||
|
Basic earnings (loss) per common share
|
$ | 0.73 | $ | (1.37 | ) | $ | 0.46 | |||||
|
Diluted
|
||||||||||||
|
Net income (loss) available to common shareholders
|
$ | 3,163,771 | $ | (5,608,916 | ) | $ | 1,866,109 | |||||
|
Weighted average common shares outstanding
|
4,334,084 | 4,090,416 | 4,070,311 | |||||||||
|
Add: dilutive effect of stock option exercises
|
- | - | 3,742 | |||||||||
|
Add: dilutive effect of assumed preferred stock conversion
|
224,834 | - | - | |||||||||
|
Weighted average common shares and dilutive potential common shares outstanding and preferred stock conversion
|
4,558,918 | 4,090,416 | 4,074,053 | |||||||||
|
Diluted earnings (loss) per common share
|
$ | 0.69 | $ | (1.37 | ) | $ | 0.46 | |||||
86
Note 18 - Parent Company-Only Condensed Financial Statements
Following are condensed parent company financial statements as of December 31, 2010 and 2009 and for the years ended December 31, 2010, 2009, and 2008:
|
Condensed Balance Sheets
|
||||||||
|
2010
|
2009
|
|||||||
|
Assets
|
||||||||
|
Cash and cash equivalents
|
$ | 4,662,525 | $ | 1,499,933 | ||||
|
Securities held to maturity
|
- | 16,041 | ||||||
|
Securities available for sale
|
100,773 | - | ||||||
|
Accrued interest receivable
|
86 | - | ||||||
|
Investment in Tower Bank
|
67,237,164 | 63,398,315 | ||||||
|
Investment in the Tower Capital Trust 2
|
248,000 | 248,000 | ||||||
|
Investment in the Tower Capital Trust 3
|
279,000 | 279,000 | ||||||
|
Other assets
|
1,157,234 | 988,930 | ||||||
|
Total assets
|
$ | 73,684,782 | $ | 66,430,219 | ||||
|
Liabilities and Stockholders' Equity
|
||||||||
|
Accued interest payable
|
$ | 1,209,680 | $ | 50,725 | ||||
|
Other liabilities
|
232,597 | 285,054 | ||||||
|
Supplemental Executive Retirement Plan (SERP)
|
1,586,753 | 1,631,331 | ||||||
|
Junior subordinated debt
|
17,527,000 | 17,527,000 | ||||||
|
Stockholders' equity
|
53,128,752 | 46,936,109 | ||||||
|
Total liabilities and stockholders' equity
|
$ | 73,684,782 | $ | 66,430,219 | ||||
|
Condensed Statements of Operations
|
||||||||||||
|
2010
|
2009
|
2008
|
||||||||||
|
Income
|
||||||||||||
|
Interest Income
|
$ | - | $ | 5,033 | $ | - | ||||||
|
Investment Income (loss)
|
33,742 | (26,452 | ) | (59,042 | ) | |||||||
|
Dividends from subsidiaries
|
- | 800,000 | 800,000 | |||||||||
|
Gain on sale of held-to-maturity securities
|
888,059 | - | - | |||||||||
|
Gain (Loss) on sale of Trust Company
|
- | (127,697 | ) | - | ||||||||
|
Total income
|
921,801 | 650,884 | 740,958 | |||||||||
|
Expense
|
||||||||||||
|
Interest expense
|
1,158,956 | 1,128,017 | 1,129,440 | |||||||||
|
Employment expenses
|
323,898 | 1,206,747 | - | |||||||||
|
Professional fees
|
207,220 | 245,247 | 231,210 | |||||||||
|
Other expense
|
115,890 | 112,990 | 404,922 | |||||||||
|
Total expense
|
1,805,964 | 2,693,001 | 1,765,572 | |||||||||
|
Loss before income taxes benefit and equity in undistributed net income (loss) of subsidiaries
|
(884,163 | ) | (2,042,117 | ) | (1,024,614 | ) | ||||||
|
Income tax benefit
|
(299,915 | ) | (865,623 | ) | (680,382 | ) | ||||||
|
Equity (Deficit) in undistributed net income/(loss) of Tower Bank and Tower Trust
|
3,748,019 | (4,558,540 | ) | 2,210,341 | ||||||||
|
Net income/(loss)
|
$ | 3,163,771 | $ | (5,735,034 | ) | $ | 1,866,109 | |||||
|
Less: Preferred stock dividends
|
- | (1,579 | ) | - | ||||||||
|
Net income/(loss) available to common shareholders
|
$ | 3,163,771 | $ | (5,736,613 | ) | $ | 1,866,109 | |||||
|
Comprehensive income/(loss)
|
$ | 3,318,923 | $ | (4,537,358 | ) | $ | 1,431,166 | |||||
87
|
Condensed Statements of Cash Flows
|
||||||||||||
|
2010
|
2009
|
2008
|
||||||||||
|
Cash flows from operating activities
|
||||||||||||
|
Net income (loss)
|
$ | 3,163,771 | $ | (5,735,034 | ) | $ | 1,866,109 | |||||
|
Adjustments to reconcile net income to net cash from operating activities:
|
||||||||||||
|
(Equity) deficit in undistributed income (loss)
|
(3,748,019 | ) | 4,558,540 | (2,210,341 | ) | |||||||
|
of subsidiaries
|
||||||||||||
|
(Gain) Loss on sale of held to maturity securities
|
(888,059 | ) | - | - | ||||||||
|
Loss on sale of Trust Company
|
- | 127,697 | - | |||||||||
|
Change in accrued interest receivable
|
(86 | ) | - | - | ||||||||
|
Change in accrued interest payable
|
1,158,955 | - | - | |||||||||
|
Change in other assets
|
(201,439 | ) | 423,878 | 200,158 | ||||||||
|
Change in other liabilities
|
(50,125 | ) | 1,983,666 | 63,135 | ||||||||
|
Net cash from (used in) operating activities
|
(565,002 | ) | 1,358,747 | (80,939 | ) | |||||||
|
Cash flows from investing activities
|
||||||||||||
|
Capital investment - Tower Bank
|
- | (6,582,800 | ) | (3,550,000 | ) | |||||||
|
Purchase of other investments
|
- | (1,536,082 | ) | - | ||||||||
|
Proceeds from sale of held to maturity securities
|
900,784 | - | - | |||||||||
|
Proceeds from maturity of investments
|
- | 11,841 | - | |||||||||
|
Proceeds from sale of Trust Company
|
- | 5,510,170 | - | |||||||||
|
Net cash from (used in) investing activities
|
900,784 | (2,596,871 | ) | (3,550,000 | ) | |||||||
|
Cash flows from financing activities
|
||||||||||||
|
Proceeds from exercise of stock options and tax benefit
|
- | - | 220,639 | |||||||||
|
Purchase of common stock
|
- | - | (125,549 | ) | ||||||||
|
Cash dividends paid on preferred stock
|
- | (1,579 | ) | - | ||||||||
|
Cash dividends paid on common stock
|
- | - | (179,104 | ) | ||||||||
|
Proceeds from issuance of commons stock
|
2,826,810 | - | - | |||||||||
|
Proceeds from issuance of preferred stock
|
- | 1,788,000 | - | |||||||||
|
Net cash from (used in) financing activities
|
2,826,810 | 1,786,421 | (84,014 | ) | ||||||||
|
Net change in cash and cash equivalents
|
3,162,592 | 548,297 | (3,714,953 | ) | ||||||||
|
Cash and cash equivalents, beginning of period
|
1,499,933 | 951,636 | 4,666,589 | |||||||||
|
Cash and cash equivalents, end of period
|
$ | 4,662,525 | $ | 1,499,933 | $ | 951,636 | ||||||
|
Supplemental disclosures of cash flow information
|
||||||||||||
|
Non-cash Items:
|
||||||||||||
|
Transfer of securities from held-to-maturity to available-for-sale
|
$ | 3,316 | $ | - | $ | - | ||||||
88
Note 19 - Other Comprehensive Income (Loss)
Comprehensive income consists of net income and other comprehensive income (“OCI”). Other comprehensive income includes unrealized gains and losses on securities available-for-sale. Following is a summary of other comprehensive income for years ending December 31, 2010, 2009 and 2008:
|
For the years ended December 31
|
||||||||||||
|
2010
|
2009
|
2008
|
||||||||||
|
Net Income (Loss)
|
$ | 3,163,771 | $ | (5,607,337 | ) | $ | 1,866,109 | |||||
|
Change in securities available-for-sale:
|
||||||||||||
|
Unrealized holding gains(losses) on securities for which other-than-temporary-impairment has been recorded
|
19,952 | (274,503 | ) | - | ||||||||
|
Other-than-temporary impairment on available-for-sale securities associated with credit losses realized in income
|
158,303 | 750,770 | - | |||||||||
|
Other-than-temporary impairment on available-for-sale securities, recorded in OCI
|
178,255 | 476,267 | - | |||||||||
|
Unrealized gains (losses) on interest rate floor
|
- | 309,637 | 444,769 | |||||||||
|
Unrealized appreciation (depreciation) on transfers from held-to-maturity to available-for-sale securities
|
305,119 | - | - | |||||||||
|
Unrealized holding gains (losses) on available-for-sale securities arising during the period
|
861,447 | 1,409,025 | (624,800 | ) | ||||||||
|
Reclassification adjustment for (gains) losses realized in income on interest rate floor
|
- | (309,637 | ) | (413,133 | ) | |||||||
|
Reclassification adjustment for (gains) losses realized in income on held-to-maturity securities
|
(888,059 | ) | - | - | ||||||||
|
Reclassification adjustment for (gains) losses realized in income on available-for-sale securities
|
(221,684 | ) | (264,112 | ) | (65,841 | ) | ||||||
|
Net unrealized gains (losses)
|
56,823 | 1,144,913 | (659,005 | ) | ||||||||
|
Income tax expense (benefit)
|
79,926 | 551,201 | (224,062 | ) | ||||||||
|
Total other comprehensive income (loss)
|
155,152 | 1,069,979 | (434,943 | ) | ||||||||
|
Comprehensive Income (Loss)
|
$ | 3,318,923 | $ | (4,537,358 | ) | $ | 1,431,166 | |||||
Note 20 – Business Segments
Management separates Tower Financial Corporation into three distinct businesses for reporting purposes. The three segments are Banking, Wealth Management, and Corporate and Intercompany. The segments are evaluated separately on their individual performance, as well as their contribution as a whole.
The majority of assets and income result from the Banking segment. The Bank is a full-service commercial bank with six Allen County locations and one Warsaw location. The Wealth Management segment is made up of Tower Trust Company, which is a wholly owned subsidiary of the Bank. The Trust Company provides estate planning, investment management, and retirement planning, as well as investment brokerage services. The Corporate and Intercompany segment includes the holding company and subordinated debentures. We incur general corporate expenses, as well as interest expense on the subordinated debentures.
89
|
As of and for the year ended December 31, 2010
|
||||||||||||||||||||
|
Bank
|
Wealth
Management
|
Corporate &
Intercompany
|
Eliminations
|
Total
|
||||||||||||||||
|
Income Statement Information
|
||||||||||||||||||||
|
Net interest income
|
$ | 23,355,584 | $ | 64,462 | $ | (1,158,956 | ) | $ | - | $ | 22,261,090 | |||||||||
|
Non-interest income
|
3,272,788 | 3,619,515 | 4,669,820 | (3,748,019 | ) | 7,814,104 | ||||||||||||||
|
Non-interest expense
|
18,048,022 | 2,547,666 | 647,008 | - | 21,242,696 | |||||||||||||||
|
Noncash items
|
||||||||||||||||||||
|
Provision for loan losses
|
4,745,000 | - | - | - | 4,745,000 | |||||||||||||||
|
Depreciation/Amortization
|
1,619,564 | 35,461 | - | - | 1,655,025 | |||||||||||||||
|
Income tax expense (benefit)
|
825,167 | 398,475 | (299,915 | ) | - | 923,727 | ||||||||||||||
|
Segment Profit/(Loss)
|
3,010,183 | 737,836 | 3,163,771 | (3,748,019 | ) | 3,163,771 | ||||||||||||||
|
Balance Sheet Information
|
||||||||||||||||||||
|
Segment Assets
|
654,443,027 | 6,550,795 | 76,535,542 | (77,601,109 | ) | 659,928,255 | ||||||||||||||
|
As of and for the year ended December 31, 2009
|
||||||||||||||||||||
|
Bank
|
Wealth
Management
|
Corporate &
Intercompany
|
Eliminations
|
Total
|
||||||||||||||||
|
Income Statement Information
|
||||||||||||||||||||
|
Net interest income
|
$ | 20,856,785 | $ | 86,997 | $ | (1,122,984 | ) | $ | - | $ | 19,820,798 | |||||||||
|
Non-interest income
|
2,723,117 | 3,391,168 | (3,912,690 | ) | 3,886,237 | 6,087,832 | ||||||||||||||
|
Non-interest expense
|
19,046,617 | 2,386,004 | 1,564,983 | - | 22,997,604 | |||||||||||||||
|
Noncash items
|
||||||||||||||||||||
|
Provision for loan losses
|
10,735,000 | - | - | - | 10,735,000 | |||||||||||||||
|
Depreciation/Amortization
|
1,247,965 | 39,820 | - | - | 1,287,785 | |||||||||||||||
|
Income tax expense (benefit)
|
(1,741,282 | ) | 390,268 | (865,623 | ) | - | (2,216,637 | ) | ||||||||||||
|
Segment Profit/(Loss)
|
(4,460,433 | ) | 701,893 | (5,735,034 | ) | 3,886,237 | (5,607,337 | ) | ||||||||||||
|
Balance Sheet Information
|
||||||||||||||||||||
|
Segment Assets
|
675,779,747 | 5,744,866 | 69,280,979 | (70,646,534 | ) | 680,159,058 | ||||||||||||||
90
Note 21 - Quarterly Financial Data (Unaudited)
| Interest | Net Interest | Net |
Earnings (Loss) per share
|
|||||||||||||||||
|
2010
|
Income
|
Income
|
Income/(Loss)
|
Basic
|
Diluted
|
|||||||||||||||
|
First quarter
|
$ | 0.18 | $ | 0.16 | ||||||||||||||||
|
Second quarter
|
7,751,070 | 5,597,262 | 514,090 | 0.13 | 0.12 | |||||||||||||||
|
Third quarter
|
7,540,884 | 5,580,298 | 1,045,066 | 0.24 | 0.23 | |||||||||||||||
|
Fourth quarter
|
7,387,675 | 5,520,220 | 883,579 | 0.19 | 0.18 | |||||||||||||||
|
Total
|
$ | 30,452,521 | $ | 22,261,090 | $ | 3,163,771 | ||||||||||||||
|
2009
|
||||||||||||||||||||
|
First quarter
|
$ | 7,914,799 | $ | 4,541,427 | $ | 410,225 | $ | 0.10 | $ | 0.10 | ||||||||||
|
Second quarter
|
8,126,544 | 4,822,017 | (4,095,480 | ) | (1.00 | ) | (1.00 | ) | ||||||||||||
|
Third quarter
|
8,028,969 | 5,076,852 | (720,575 | ) | (0.18 | ) | (0.18 | ) | ||||||||||||
|
Fourth quarter
|
7,997,111 | 5,380,502 | (1,201,507 | ) | (0.29 | ) | (0.29 | ) | ||||||||||||
|
Total
|
$ | 32,067,423 | $ | 19,820,798 | $ | (5,607,337 | ) | |||||||||||||
Note: Earnings per share data may not agree to annual amounts due to rounding.
Net income for each of the four quarters in 2010 was higher than the same quarters in 2009 primarily due to a decrease in provision expenses in 2010 over 2009. Interest income decreased in 2010 from 2009 due to a prolonged period of low interest rates that have not changed since December 2008.
Note 22 – Preferred Stock
On September 25, 2009, we sold 18,300 shares of Series A Convertible Preferred Stock in the net amount of $1.8 million. Each share was sold for $100 each and is convertible into Tower Financial Corporation common stock at a price per share of $6.02, which is a 30% premium on the common stock market price on the purchase date, September 25, 2009. The Series A Convertible Preferred Stock has no expiration date; however, Tower Financial Corporation has the right to call the shares on or after September 25, 2012 until September 24, 2013 at 110% of par, after September 25, 2013 until September 24, 2014 at 105% of par, and at par after September 25, 2014. The Series A Convertible Preferred Stock qualifies as Tier 1 capital and pays quarterly dividends at a rate of Prime plus 2%, with a ceiling of 9.25%, per annum upon the approval of the Board of Directors. During 2010, 10,550 preferred stock shares converted to 175,249 shares of common stock at a price of $6.02 per common stock share. No dividends were paid on preferred stock in 2010 and $1,579 in dividends were paid in 2009.
91
Report of Independent Registered Public Accounting Firm
Board of Directors and Stockholders
Tower Financial Corporation
Fort Wayne, Indiana
We have audited the accompanying consolidated balance sheets of Tower Financial Corporation as of December 31, 2010 and 2009 and the related consolidated statements of operations, changes in stockholders’ equity, and cash flows for each of the three years in the period ended December 31, 2010. These financial statements are the responsibility of the Company’s management. Our responsibility is to express an opinion on these financial statements based on our audits.
We conducted our audits in accordance with the standards of the Public Company Accounting Oversight Board (United States). Those standards require that we plan and perform the audit to obtain reasonable assurance about whether the financial statements are free of material misstatement. The Company is not required to have, nor were we engaged to perform, an audit of its internal control over financial reporting. Our audit included consideration of internal control over financial reporting as a basis for designing audit procedures that are appropriate in the circumstances, but not for the purpose of expressing an opinion on the effectiveness of the Company’s internal control over financial reporting. Accordingly, we express no such opinion. An audit includes examining, on a test basis, evidence supporting the amounts and disclosures in the financial statements. An audit also includes assessing the accounting principles used and significant estimates made by management, as well as evaluating the overall financial statement presentation. We believe that our audits provide a reasonable basis for our opinion.
In our opinion, the consolidated financial statements referred to above present fairly, in all material respects, the financial position of Tower Financial Corporation as of December 31, 2010 and 2009 and the results of its operations and its cash flows for each of the three years in the period ended December 31, 2010, in conformity with U.S. generally accepted accounting principles.
/s/ Crowe Horwath LLP
South Bend, Indiana
March 15, 2011
92
|
ITEM 9.
|
CHANGES IN AND DISAGREEMENTS WITH ACCOUNTANTS ON ACCOUNTING AND FINANCIAL DISCLOSURE.
|
NONE.
|
ITEM 9A.
|
CONTROLS AND PROCEDURES.
|
|
|
(a)
|
Evaluation of Disclosure Controls and Procedures
|
Our management, with the participation of our principal executive officer and principal financial officer, evaluated the effectiveness of our disclosure controls and procedures as of December 31, 2010. The term “disclosure controls and procedures,” as defined in Rules 13a-15(e) and 15d-15(e) under the Securities and Exchange Act of 1934, means controls and other procedures of a company that are designed to ensure that information required to be disclosed by a company in the reports that it files or submits under the Exchange Act is recorded, processed, summarized, and reported, within the time periods specified in the SEC’s rules and forms. Disclosure controls and procedures include, without limitation, controls and procedures designed to ensure that information required to be disclosed by a company in the reports that it files and submits under the Exchange Act is accumulated and communicated to the company’s management, including its principal executive and principal financial officers, as appropriate to allow timely decisions regarding required disclosure. Based on the evaluation of our disclosure controls and procedures as of December 31, 2010, our principal executive officer and principal financial officer concluded that, as of such date, our disclosure controls and procedures were effective.
The Audit Committee of the Board of Directors, which is composed solely of independent directors, meets regularly with our independent registered public accounting firm, Crowe Horwath LLP, and representatives of management to review accounting, financial reporting, internal control and audit matters, as well as the nature and extent of the audit effort. The Audit Committee is responsible for the engagement of the independent auditors. The independent auditors have free access to the Audit Committee.
93
(b) Internal Control Over Financial Reporting
March 15, 2011
Board of Directors
Tower Financial Corporation
116 East Berry Street
Fort Wayne, IN 46802
MANAGEMENT’S ANNUAL REPORT ON
INTERNAL CONTROL OVER FINANCIAL REPORTING
Management of Tower Financial Corporation (the “Company”) is responsible for the preparation, integrity, and fair presentation of the consolidated financial statements included in this annual report. The Company’s consolidated financial statements have been prepared in accordance with accounting principles generally accepted in the United States of America and, as such, include some amounts that are based on the best estimates and judgments of management.
The Company’s management is responsible for establishing and maintaining adequate internal control over financial reporting. This internal control system is designed to provide reasonable assurance to management and the Board of Directors regarding the reliability of the Company’s financial reporting and the preparation and presentation of financial statements for external reporting purposes in conformity with accounting principles generally accepted in the United States of America, as well as to safeguard assets from unauthorized use or disposition. The system of internal control over financial reporting is evaluated for effectiveness by management and tested for reliability through a program of internal audit with actions taken to correct potential deficiencies as they are identified. Because of inherent limitations in any internal control system, no matter how well designed, misstatements due to error or fraud may occur and not be detected, including the possibility of the circumvention or overriding of controls. Accordingly, even an effective internal control system can provide only reasonable assurance with respect to financial statement preparation. Further because of changes in conditions, internal control effectiveness may vary over time.
Management assessed the effectiveness of the company’s internal control over financial reporting as of December 31, 2010 based upon criteria set forth in Internal Control—Integrated Framework issued by the Committee of Sponsoring Organizations of the Treadway Commission (COSO).
Based on this assessment and on the forgoing criteria, management has concluded that, as of December 31, 2010, the Company’s internal control over financial reporting is effective.
|
/s/ Michael D. Cahill
|
/s/ Richard R. Sawyer
|
|
|
Michael D. Cahill
|
Richard R. Sawyer
|
|
|
President and Principal Executive Officer
|
Vice President and Principal Financial Officer
|
(c) Changes to Internal Control Over Financial Reporting
There were no changes in the Company’s internal control over financial reporting during the three months ended December 31, 2010 that have materially affected, or are reasonably likely to materially affect, the Company’s internal control over financial reporting.
94
|
ITEM 9B.
|
OTHER INFORMATION.
|
NONE.
PART III
|
ITEM 10.
|
DIRECTORS AND EXECUTIVE OFFICERS OF THE REGISTRANT.
|
The information required to be furnished pursuant to Item 10 with respect to directors and corporate governance is incorporated herein by reference from the sections entitled “Governance of the Company” and “Information About Directors, Nominees and Executive Officers” in our Proxy Statement for the 2011 Annual Meeting of Stockholders which we will file with the Securities and Exchange Commission no later than 120 days after the end of our fiscal year.
|
ITEM 11.
|
EXECUTIVE COMPENSATION.
|
The information required to be furnished pursuant to Item 11 is incorporated herein by reference from the sections entitled “Executive Compensation and Related Information” and “Compensation Discussion and Analysis” in our proxy Statement for the 2011 Annual Meeting of Stockholders which we will file with the Securities and Exchange Commission no later than 120 days after the end of our fiscal year.
|
ITEM 12.
|
SECURITY OWNERSHIP OF CERTAIN BENEFICIAL OWNERS AND MANAGEMENT AND RELATED STOCKHOLDER MATTERS.
|
The information required to be furnished pursuant to Item 12 is incorporated herein by reference from the sections entitled “Security Ownership of Management, Directors and Certain Beneficial Owners” in our Proxy Statement for the 2011 Annual Meeting of Stockholders which we will file with the Securities and Exchange Commission no later than 120 days after the end of our year.
|
ITEM 13.
|
CERTAIN RELATIONSHIPS AND RELATED TRANSACTIONS.
|
The information required to be furnished pursuant to Item 13 is incorporated herein by reference from the sections entitled “Governance of the Company” and “Related Persons Transactions” in our Proxy Statement for the 2011 Annual Meeting of Stockholders which we will file with the Securities and Exchange Commission no later than 120 days after the end of our fiscal year.
|
ITEM 14.
|
PRINCIPAL ACCOUNTANT FEES AND SERVICES.
|
The information required to be furnished pursuant to Item 14 is incorporated herein by reference from the section entitled “Auditors’ Services and Fees” in our Proxy Statement for the 2011 Annual Meeting of Stockholders which we file with the Securities and Exchange Commission no later than 120 days after the end of our last fiscal year.
95
PART IV
|
ITEM 15.
|
EXHIBITS AND FINANCIAL STATEMENT SCHEDULES.
|
|
(a)
|
1.
|
Financial Statements. The following consolidated financial statements of Registrant are included herein under Item 8 of Part II:
|
|
Consolidated Balance Sheets at December 31, 2010 and 2009
|
50
|
|
|
Consolidated Statements of Operations - for the years ended December 31, 2010, 2009 and 2008
|
51
|
|
|
Consolidated Statements of Changes in Stockholders' Equity - for the years ended December 31, 2010, 2009 and 2008
|
53
|
|
|
Consolidated Statements of Cash Flows - for the years ended December 31, 2010, 2009 and 2008
|
54
|
|
|
Notes to Consolidated Financial Statements
|
55
|
|
|
Report of Independent Registered Public Accounting Firm
|
92
|
|
|
2.
|
Financial Statements Schedules.
|
All financial statement schedules are omitted because they are not applicable or the required information is included in the consolidated financial statements or notes thereto.
|
(b)
|
Exhibits:
|
A list of exhibits required to be filed as part of this Annual Report is set forth in the Index to Exhibits, which immediately precedes such exhibits and is incorporated herein by reference.
96
SIGNATURES
Pursuant to the requirements of Section 13 or 15(d) of the Securities Exchange Act of 1934, the registrant has duly caused this report to be signed on its behalf by the undersigned, thereunto duly authorized.
|
TOWER FINANCIAL CORPORATION
|
|||
|
By:
|
/s/ Michael D. Cahill
|
||
|
Date: March 15, 2011
|
Michael D. Cahill
|
||
|
President, Chief Executive Officer and Director
|
|||
Pursuant to the requirements of Securities Exchange Act of 1934, this report has been signed below by the following persons on behalf of the registrant and in the capacities and on the dates indicated.
|
Signature
|
Title
|
Date
|
||
|
/s/ Michael D. Cahill
|
President, Chief Executive
|
March 15, 2011
|
||
|
Michael D. Cahill
|
Officer and Director (Principal Executive Officer)
|
|||
|
/s/ Richard R. Sawyer
|
Executive Vice President, Chief Financial Officer and Secretary
|
March 15, 2011
|
||
|
Richard R. Sawyer
|
(Principal Financial Officer and Principal Accounting Officer)
|
|||
|
/s/ Keith E. Busse
|
Chairman of the Board & Director
|
March 15, 2011
|
||
|
Keith E. Busse
|
||||
|
/s/ Kathryn D. Callen
|
Director
|
March 15, 2011
|
||
|
Kathryn D. Callen
|
||||
|
/s/ Raymond E. Dusman Jr.
|
Director
|
March 15, 2011
|
||
|
Raymond E. Dusman Jr.
|
||||
|
/s/ Scott A. Glaze
|
Director
|
March 15, 2011
|
||
|
Scott A. Glaze
|
||||
|
/s/ Jerome F. Henry, Jr.
|
Director
|
March 15, 2011
|
||
|
Jerome F. Henry, Jr.
|
||||
|
/s/ Debra A. Niezer
|
Director
|
March 15, 2011
|
||
|
Debra A. Niezer
|
||||
|
/s/ William G. Niezer
|
Director
|
March 15, 2011
|
||
|
William G. Niezer
|
||||
|
/s/ Joseph D. Ruffolo
|
Director
|
March 15, 2011
|
||
|
Joseph D. Ruffolo
|
||||
|
/s/ Donald F. Schenkel
|
Director
|
March 15, 2011
|
||
|
Donald F. Schenkel
|
||||
|
s/ Robert N. Taylor
|
Director
|
March 15, 2011
|
||
|
Robert N. Taylor
|
||||
|
/s/ John V. Tippmann, Sr.
|
Director
|
March 15, 2011
|
||
|
John V. Tippmann, Sr.
|
||||
|
/s/ Irene A. Walters
|
Director
|
March 15, 2011
|
||
|
Irene A. Walters
|
97
Exhibit A
INDEX TO EXHIBITS
|
Exhibit No.
|
Description
|
|
|
3.1
|
Restated Articles of Incorporation of Tower Financial Corporation, incorporated herein by reference from Exhibit 3.1 to the Company’s Registration Statement on Form SB-2, filed November 13, 1998 (Registration No. 333-67235).
|
|
|
3.1(a)
|
Restated Articles of Amendment, dated September 24, 2009, to the Restated Articles of Incorporation of Tower Financial Corporation, adding new Section 5.6 regarding Series A Convertible Preferred Stock, incorporated herein by reference from Exhibit 3.1 to the Company’s Current Report on Form 8-K, filed September 28, 2009.
|
|
|
3.2
|
Amended Bylaws of Tower Financial Corporation, incorporated herein from Exhibit 3.2 to the Company’s Annual Report on Form 10-K for the year ended December 31, 2006, filed March 21, 2007.
|
|
|
4.1
|
Amended and Restated Trust Agreement, dated December 5, 2005, for Tower Capital Trust 2 between Tower Financial Corporation (Depositor) and Wilmington Trust Company (Trustee)
|
|
|
4.2
|
Amended and Restated Trust Agreement, dated December 29, 2006, for Tower Capital Trust 3 between Tower Financial Corporation (Depositor) and Wilmington Trust Company (Trustee)
|
|
|
10.1
|
Lease Agreement dated October 6, 1998, between Tower Financial Corporation and Tippmann Properties, Inc., incorporated herein by reference from Exhibit 10.1 to the Company’s Registration Statement on Form SB-2, filed November 13, 1998.
|
|
|
10.1(a - h)
|
Amendments to Lease Agreement between Tower Financial Corporation and Tippmann Properties, Inc.
|
|
|
10.3
|
Lease Agreement dated August 8, 2000, between Tower Financial Corporation and Rogers Markets, Inc., incorporated herein by reference from Exhibit 10.10 to the Company’s Quarter Report on Form 10-QSB for the period September 30, 2000, filed November 13, 2000.
|
|
|
10.4
|
1998 Stock Option and Incentive Plan, incorporated herein by reference from Exhibit 10.3 to the Company’s Registration Statement on Form SB-2/A, filed December 30, 1998 (Registration No. 333-67235).
|
|
|
10.5
|
2001 Stock Option and Incentive Plan, incorporated herein from Exhibit 4.3 to the Company’s Registration Statement on Form S-8, filed June 29, 2001 Registration Number 333-64194.
|
|
|
10.6†
|
Employment Agreement dated April 25, 2002 between the Registrant and Gary D. Shearer, incorporated by reference herein from Exhibit 10.4 to the Company’s Quarterly Report on Form QSB for the period ended March 31, 2002, filed May 14, 2002.
|
|
|
10.7†
|
Employment Agreement dated April 25, 2002, between Tower Financial Corporation and James E. Underwood
|
|
|
10.8†
|
Employment Agreement dated November 1, 2005, between Tower Financial Corporation and Donald F. Schenkel, incorporated herein from Exhibit 10.14(a) to the Company’s Annual Report on Form 10-K, filed March 13, 2008, for the year ended December 31, 2007.
|
|
|
10.8(a)†
|
Amendment to Employment Agreement of Donald F. Schenkel dated July 22, 2008, incorporated herein from Exhibit 99.1 to the Company’s Current Report on Form 8-K filed July 28, 2008.
|
|
|
10.8(b)†
|
Agreement and Mutual Release dated December 17, 2009, terminating Employment Agreement of Donald F. Schenkel.
|
98
|
10.9†
|
Employment Agreement dated November 23, 2009, between Tower Financial Corporation and Michael D. Cahill, incorporated herein from Exhibit 99.1 to the Company’s Current Report on Form 8-K filed November 25, 2009.
|
|
|
10.10†
|
Employment Agreement dated September 18, 2009, between Tower Financial Corporation and Richard R. Sawyer, incorporated herein from Exhibit 99.1 to the Company’s Current Report on Form 8-K filed September 21, 2009.
|
|
|
10.11†
|
Revised and Restated Tower Financial Corporation Supplemental Executive Retirement Plan, dated July 22, 2008 (Donald F. Schenkel), incorporated herein by reference from Exhibit 99.2 to the Company’s Current Report on Form 8-K filed July 28, 2008. (See, also, Exhibit 10.8(b).)
|
|
|
10.13
|
Code of Business Conduct and Ethics, incorporated herein by reference from Exhibit 10.8 of the Company’s Annual Report on Form 10-K for the year ended December 31, 2006, filed March 21, 2007.
|
|
|
10.19†
|
Deferred Compensation Plan dated January 1, 2002, incorporated herein from Exhibit 10.19 to the Company’s Annual Report on Form 10-KSB for the year ended December 31, 2001, filed March 8, 2002.
|
|
|
10.20†
|
Deferred Compensation Plan for Non-Employee Directors, dated January 1, 2002, incorporated herein from Exhibit 10.20 to the Company’s Annual Report on Form 10-KSB for the year ended December 31, 2001, filed March 8, 2002.
|
|
|
10.21†
|
Tower Financial Corporation Section 401(k) Plan, incorporated by reference from Exhibit 4.3 to the Company’s Registration Statement on Form S-8, filed July 2, 2001 (Registration Number 333-64318).
|
|
|
10.22†
|
Tower Financial Corporation 2006 Equity Incentive Plan, incorporated herein by reference from Exhibit 10.22 to the Company’s Report on Form 10-K, filed March 21, 2007.
|
|
|
10.23
|
Written Agreement executed May 5, 2010, by and among Tower Financial Corporation, Tower Bank and Trust Company, the Federal Reserve Bank of Chicago, and the Indiana Department of Financial Institutions, incorporated herein by reference from Exhibit 10.23 to the Company’s Current Report on Form 8-K May 5, 2010
|
|
|
10.24
|
Private Placement of Common Stock Subscription Agreement, dated July 19, 2010, incorporated herein by reference from Exhibit 10.24 to the Company’s Current Report on Form 8-K July 23, 2010
|
|
|
Subsidiaries of the Registrant
|
||
|
Consent of Independent Registered Public Accounting Firm
|
||
|
Certification of Chief Executive Officer pursuant to Rule 13a-14(a)/15d-14(a).
|
||
|
Certification of Chief Financial Officer pursuant to Rule 13a-14(a)/15d-14(a).
|
||
|
Certification of Chief Executive Officer pursuant to 18 USC Section 1350.
|
||
|
Certification of Chief Financial Officer pursuant to 18 USC Section 1350.
|
|
*
|
filed herewith
|
|
†
|
Indicates a management contract, compensation plan or arrangement as contemplated by Item 6.01 of Regulation S-K
|
99