Attached files
Table of Contents
United States
Securities and Exchange Commission
Washington, D.C. 20549
Form 10-K
| x | Annual Report Pursuant to Section 13 or 15(d) of the Securities Exchange Act of 1934 |
For the fiscal year ended January 1, 2011
| ¨ | Transition Report Pursuant to Section 13 or 15(d) of the Securities Exchange Act of 1934 |
For the transition period from to
Commission file number 001-31410
COTT CORPORATION
(Exact name of registrant as specified in its charter)
| CANADA | 98-0154711 | |
| (State or Other Jurisdiction of Incorporation or Organization) |
(IRS Employer Identification No.) | |
| 6525 VISCOUNT ROAD MISSISSAUGA, ONTARIO |
L4V 1H6 | |
| 5519 WEST IDLEWILD AVENUE TAMPA, FLORIDA, UNITED STATES |
33634 | |
| (Address of principal executive offices) | (Zip Code) | |
Registrant’s telephone number, including area code: (905) 672-1900 and (813) 313-1800
Securities registered pursuant to Section 12(b) of the Act:
| Title of each class |
Name of each exchange on which registered | |
| COMMON SHARES WITHOUT NOMINAL OR PAR VALUE |
NEW YORK STOCK EXCHANGE TORONTO STOCK EXCHANGE |
Securities registered pursuant to Section 12(g) of the Act: NONE
Indicate by check mark if the registrant is a well-known seasoned issuer, as defined in Rule 405 of the Securities Act. Yes ¨ No x
Indicate by check mark if the registrant is not required to file reports pursuant to Section 13 or Section 15(d) of the Act. Yes ¨ No x
Indicate by check mark whether the registrant: (1) has filed all reports required to be filed by Section 13 or 15(d) of the Securities Exchange Act of 1934 during the preceding 12 months (or for such shorter period that the registrant was required to file such reports), and (2) has been subject to such filing requirements for the past 90 days. Yes x No ¨
Indicate by check mark whether the registrant has submitted electronically and posted on its corporate Web site, if any, every Interactive Data File required to be submitted and posted pursuant to Rule 405 of Regulation S-T (§ 232.405 of this chapter) during the preceding 12 months (or for such shorter period that the registrant was required to submit and post such files). Yes ¨ No ¨
Indicate by check mark if disclosure of delinquent filers pursuant to Item 405 of Regulation S-K is not contained herein, and will not be contained, to the best of the registrant’s knowledge, in definitive proxy or information statements incorporated by reference in Part III of this form 10-K or any amendment to this form 10-K. ¨
Indicate by check mark whether the registrant is a large accelerated filer, an accelerated filer, or a non-accelerated filer, or a smaller reporting company. See the definitions of “large accelerated filer,” “accelerated filer” and “smaller reporting company” in Rule 12b-2 of the Exchange Act. (Check one):
| Large accelerated filer ¨ |
Accelerated filer x | Non-accelerated filer ¨ (Do not check if a smaller reporting company) |
Smaller reporting company ¨ |
Indicate by check mark if the registrant is a shell company (as defined in Rule 12b-12 of the Act). Yes ¨ No x
The aggregate market value of the common equity held by non-affiliates of the registrant as of July 3, 2010 (based on the closing sale price of $5.67 for the registrant’s common stock as reported on the New York Stock Exchange on July 3, 2010) was $461.6 million.
(Reference is made to the last paragraph of Part II, Item 5 for a statement of assumptions upon which the calculation is made).
The number of shares outstanding of the registrant’s common stock as of March 8, 2011 was 94,750,120.
Documents incorporated by reference
Portions of our definitive proxy circular for the 2011 Annual Meeting of Shareowners, to be filed within 120 days of January 1, 2011, are incorporated by reference in Part III. Such proxy circular, except for the parts therein which have been specifically incorporated by reference, shall not be deemed “filed” for the purposes of this Annual Report on Form 10-K.
Table of Contents
| 2 | ||||||
| ITEM 1. |
2 | |||||
| ITEM 1A. |
10 | |||||
| ITEM 1B. |
22 | |||||
| ITEM 2. |
22 | |||||
| ITEM 3. |
22 | |||||
| ITEM 4. |
22 | |||||
| SUPPLEMENTAL ITEM PART I. EXECUTIVE OFFICERS OF THE REGISTRANT |
23 | |||||
| 25 | ||||||
| ITEM 5. |
MARKET FOR THE REGISTRANT’S COMMON EQUITY AND RELATED SHAREOWNER MATTERS |
25 | ||||
| ITEM 6. |
27 | |||||
| ITEM 7. |
MANAGEMENT’S DISCUSSION AND ANALYSIS OF FINANCIAL CONDITION AND RESULTS OF OPERATIONS |
29 | ||||
| ITEM 7A. |
50 | |||||
| ITEM 8. |
51 | |||||
| ITEM 9. |
CHANGES IN AND DISAGREEMENTS WITH ACCOUNTANTS ON ACCOUNTING AND FINANCIAL DISCLOSURE |
51 | ||||
| ITEM 9A. |
51 | |||||
| ITEM 9B. |
53 | |||||
| 54 | ||||||
| ITEM 10. |
54 | |||||
| ITEM 11. |
54 | |||||
| ITEM 12. |
SECURITY OWNERSHIP OF CERTAIN BENEFICIAL OWNERS AND MANAGEMENT AND RELATED SHAREOWNER MATTERS |
54 | ||||
| ITEM 13. |
54 | |||||
| ITEM 14. |
54 | |||||
| 55 | ||||||
| ITEM 15. |
55 | |||||
| F-1 | ||||||
| F-54 | ||||||
Table of Contents
Our consolidated financial statements are prepared in accordance with United States (“U.S.”) generally accepted accounting principles (“GAAP”) in U.S. dollars. Unless otherwise indicated, all amounts in this report are in U.S. dollars and U.S. GAAP.
Any reference to 2010, 2009 and 2008 corresponds to our fiscal years ended January 1, 2011, January 2, 2010, and December 27, 2008, respectively.
Forward-looking statements
In addition to historical information, this report and the reports and documents incorporated by reference in this report may contain statements relating to future events and future results. These statements are “forward-looking” within the meaning of the Private Securities Litigation Reform Act of 1995 and applicable Canadian securities legislation and involve known and unknown risks, uncertainties, future expectations and other factors that may cause actual results, performance or achievements of Cott Corporation to be materially different from any future results, performance or achievements expressed or implied by such forward-looking statements. Such statements include, but are not limited to, statements that relate to projections of sales, earnings, earnings per share, cash flows, capital expenditures or other financial items, discussions of estimated future revenue enhancements and cost savings. These statements also relate to our business strategy, goals and expectations concerning our market position, future operations, margins, profitability, liquidity and capital resources. Generally, words such as “anticipate,” “believe,” “continue,” “could,” “endeavor,” “estimate,” “expect,” “intend,” “may,” “will,” “plan,” “predict,” “project,” “should” and similar terms and phrases are used to identify forward-looking statements in this report and in the documents incorporated in this report by reference. These forward-looking statements reflect current expectations regarding future events and operating performance and are made only as of the date of this report.
The forward-looking statements are not guarantees of future performance or events and, by their nature, are based on certain estimates and assumptions regarding interest and foreign exchange rates, expected growth, results of operations, performance, business prospects and opportunities and effective income tax rates, which are subject to inherent risks and uncertainties. Material factors or assumptions that were applied in drawing a conclusion or making an estimate set out in forward-looking statements may include, but are not limited to assumptions regarding management’s current plans and estimates, our ability to remain a low cost supplier, and effective management of commodity costs. Although we believe the assumptions underlying these forward-looking statements are reasonable, any of these assumptions could prove to be inaccurate and, as a result, the forward-looking statements based on those assumptions could prove to be incorrect. Our operations involve risks and uncertainties, many of which are outside of our control, and any one or any combination of these risks and uncertainties could also affect whether the forward-looking statements ultimately prove to be correct. These risks and uncertainties include, but are not limited to, those described in Part I, Item 1A. “Risk Factors” and elsewhere in this report and those described from time to time in our future reports filed with the Securities and Exchange Commission (“SEC”) and Canadian securities regulatory authorities.
We undertake no obligation to update any information contained in this report or to publicly release the results of any revisions to forward-looking statements to reflect events or circumstances of which we may become aware of after the date of this report. Undue reliance should not be placed on forward-looking statements.
All future written and oral forward-looking statements attributable to us or persons acting on our behalf are expressly qualified in their entirety by the foregoing.
1
Table of Contents
| ITEM 1. | BUSINESS |
Our Company
Cott Corporation, together with its consolidated subsidiaries (“Cott,” “the Company,” “our Company,” “Cott Corporation,” “we,” “us,” or “our”), is the world’s largest retailer brand beverage company. Our product lines include carbonated soft drinks (“CSDs”), clear, still and sparkling flavored waters, energy-related drinks, juice, juice-based products, bottled water and ready-to-drink teas.
We operate in five operating segments—North America (which includes our U.S. reporting unit and Canada reporting unit), United Kingdom (“U.K.”) (which includes our United Kingdom reporting unit and our Continental European reporting unit), Mexico, Royal Crown International (“RCI”) and All Other (which includes our international corporate expenses and our Asia reporting unit, which ceased operations at the end of fiscal 2008).
On August 17, 2010, we completed the acquisition (the “Cliffstar Acquisition”) of substantially all of the assets and liabilities of Cliffstar Corporation (“Cliffstar”) and its affiliated companies pursuant to an Asset Purchase Agreement dated July 7, 2010 for approximately $500.0 million payable in cash, $14.0 million in deferred consideration to be paid over three years and contingent consideration of up to $55.0 million.
We incorporated in 1955 and are governed by the Canada Business Corporations Act. Our registered Canadian office is located at 333 Avro Avenue, Pointe-Claire, Quebec, Canada H9R 5W3 and our principal executive offices are located at 5519 W. Idlewild Avenue, Tampa, Florida, United States 33634 and 6525 Viscount Road, Mississauga, Ontario, Canada L4V 1H6.
Competitive Strengths
We believe that our competitive strengths will enable us to maintain our position as one of the world’s leading retailer brand beverage providers and capitalize on future opportunities to drive sustainable and profitable growth in the long-run.
Leading Producer of Retailer Brand Beverages with Diverse Product Portfolio
We currently have the number one private label market share in each of the United States, Canada, the United Kingdom and Mexico by annual volume of cases produced. Our product lines include CSDs, clear, still and sparkling flavored waters, energy-related drinks, juice, juice-based products, bottled water and ready-to-drink teas. We believe our proven ability to innovate and develop our product portfolio to meet changing consumer demand will position us well to continue to serve our retailer customers and their consumers. During 2010, we launched more than 100 new product stock keeping units (“SKUs”), including new flavor profiles based on successful new product launches by the national brands, new package types and new product category introductions for our retailer partners.
We market or supply over 500 retailer, licensed and Company-owned brands in our four core geographic segments. We sell CSD concentrates and non-carbonated concentrates in over 40 countries. We believe that our leadership position, our broad portfolio offering and our existing infrastructure will enable us to continue to further penetrate the private-label market, whether it is winning new customers, launching new product SKUs with existing customers, or supplying retailers who currently self-manufacture.
Following completion of the Cliffstar Acquisition, we broadened our product portfolio to include shelf-stable juices such as apple juice, grape juice, cranberry juice and juice-blends, as well as functional and new age beverages, which will allow us to further penetrate the private-label market.
Extensive, Flexible Manufacturing Capabilities
Our leading position in the private-label market is supported by our extensive manufacturing network and flexible production capabilities. Our manufacturing footprint encompasses 33 strategically located beverage
2
Table of Contents
manufacturing and fruit processing facilities, including 21 in the United States, five in Canada, four in the United Kingdom and two in Mexico, as well as a vertically-integrated global concentrate manufacturing facility in Columbus, Georgia.
We are the only dedicated private-label beverage producer with a manufacturing footprint across North America. Manufacturing flexibility is one of our core competencies and is critical to private-label industry leadership, as our products will typically feature customized packaging, design and graphics for our key retailer customers. Our ability to produce multiple SKUs and packages on our production lines and manage complexities through quick-line changeover processes differentiates us from our competition.
High Customer Service Level and Strong Customer Integration
Private-label industry leadership requires a high level of coordination with our retailer partners in areas such as supply chain, product development and customer service. In addition to efficiently managing increased product manufacturing complexity, we have a proven track record of maintaining high service levels across our customer base. We also partner closely with customers on supply chain planning and execution to minimize freight costs, reduce working capital requirements and increase in-store product availability. We work as partners with our retailer customers on new product development and packaging designs. Our role includes providing market expertise as well as knowledge of category trends that may present opportunities for our retailer customers. A high level of customer integration and partnership coupled with a nationwide manufacturing footprint is critical for the development of successful private-label programs.
Strategic Importance to Blue-Chip Retailers
We have longstanding partnerships with many of the world’s leading retailers in the grocery, mass-merchandise and drug store channels, enabling retailers to build their private-label programs with high-quality, affordable beverages. We are the sole supplier for a majority of our clients due to our competitive advantages, including:
| • | private-label expertise; |
| • | vertically integrated, low cost production platform; |
| • | one-stop sourcing; |
| • | category insights and marketing expertise; |
| • | supply chain and high quality consistency in products; and |
| • | product innovation and differentiation. |
For 2010, our top 10 customers accounted for 55.4% of total revenue. Wal-Mart was the only customer that accounted for more than 10% of our total revenue for the period. We have established long-standing relationships with most of our top 10 customers. As a result of our high product quality and commitment to service, coupled with a national manufacturing footprint, we believe we will continue to play a meaningful role in helping our customers develop retailer brand strategies to build loyalty with consumers.
Business Strategy
Our primary goal is to maintain long-term profitability and enhance our position as the market leader and preferred supplier of retailer brand beverages in the markets where we operate. Continued leadership in our core markets will enable us to sustain and grow profitability as we drive for increased private-label penetration and share growth within our core product categories. We believe that the following strategies will help us to achieve our goal.
Maintain Customer Focus
Customer relationships are important for any business, but at Cott, where our products bear our customers’ brand names, we must maintain particularly close partnerships with our customers. We will continue to provide
3
Table of Contents
our retailer partners with high quality products and great service at an attractive value that will help them provide quality, value-oriented products to their consumers.
We will continue to focus on our high customer service levels as well as core private-label innovations through the introduction of new packages, flavors and varieties of beverages. We believe our focus on our customers will enable us to leverage our existing relationships and to develop new ones in existing and new markets. As a fast follower of innovative products, our goal is to identify new products that are succeeding in the marketplace and develop similar products of high quality for our retailer partners to offer their customers at a better value.
Control Operating Costs
As a retailer brand producer, we understand that our long-term success will be closely tied to our ability to remain a low-cost supplier. Effective management of commodity costs is critical to our success, including entering into contract commitments with suppliers of key raw materials such as aluminum sheet metal and high fructose corn syrup (“HFCS”). On an ongoing basis we review our fixed overhead and manufacturing costs for opportunities for further reductions. In 2009, we significantly reduced overhead costs, and in 2010, we implemented more modest cost reductions.
Control Capital Expenditures and Rigorously Manage Working Capital
Consistent with our status as a low-cost supplier, we will leverage our existing manufacturing capacity and maintain an efficient supply chain. We are committed to carefully prioritizing our capital investments that provide the best financial returns for Cott and for our retailer partners, while maintaining safety, efficiency and superior product quality. Our manufacturing facilities operate according to the highest standards of safety and product quality. We perform regular third-party audits of our facilities and are subject to quality audits on behalf of our customers. We will continue to evaluate growth and other opportunities, while remaining mindful of our total capital expenditure targets.
In 2010, our capital expenditures have been devoted to maintenance of existing beverage production facilities, equipment upgrades in the U.S. and Canada, and expanded can and energy-related drink production capability in the United Kingdom.
Cash Flow Management
We believe that a strong financial position will enable us to capitalize on opportunities in the marketplace. As a result, we continuously review and improve the effectiveness of our cash management processes. We strive to achieve the most optimal working capital level, rationalize our capital expenditures and continuously drive operating cost improvements to enhance cash flow.
Pursue Select Acquisitions
We believe that opportunities exist for us to enhance our scale, reduce fixed manufacturing costs and broaden our product portfolio. On August 17, 2010, we completed the Cliffstar Acquisition, which provides us with a foothold in the North America private label juice market. We intend to continue to evaluate and pursue strategic opportunities if we believe they would enhance our industry position, strengthen our business and build value for our shareholders.
Principal Markets and Products
We estimate that as of the end of 2010, on a pro-forma basis, we produced (either directly or through third party manufacturers with whom we have co-packing agreements) 60.0% and 52.1% of all retailer brand CSDs and juice, respectively, sold in the U.S., and 55.6% of all retailer brand CSDs sold in the U.K.
4
Table of Contents
We have a diversified product portfolio across major beverage categories, including beverages that are on-trend with consumer demand. In 2010, CSDs, concentrate, juice, and all other products represented 49.7%, 2.1%, 13.1% and 35.1%, as a percentage of revenue respectively. We began reporting “Juice” as a separate product category in 2010 following the Cliffstar Acquisition. In 2009, CSDs, concentrate, and all other products represented 60.0%, 1.9%, and 38.1%, as a percentage of revenue, respectively. In 2008, CSDs, concentrate, and all other products represented 59.0%, 2.1%, and 38.9%, as a percentage of revenue, respectively.
We believe that opportunities exist to increase sales of beverages in our core markets by leveraging existing customer relationships, capitalizing on cross-selling and up-selling opportunities across our CSD and juice customers, obtaining new customers, exploring new channels of distribution and introducing new products.
Restructuring Initiatives
From 2006 through 2007, we implemented our North American Realignment and Cost Reduction Plan (the “North American Plan”) to consolidate the management of our Canadian and U.S. businesses to a North American basis, rationalize product offerings, eliminate underperforming assets and focus on high potential accounts. We paid the remaining lease termination costs under the North American Plan in 2010. We also implemented plans in 2008 (the “Refocus Plan”) and 2009 (the “2009 Restructuring Plan”) that resulted in a partial reduction of our workforce in those years.
We do not anticipate incurring any additional charges related to the North American Plan, the Refocus Plan or the 2009 Restructuring Plan.
Financial Information about Segments
For financial information about operating segments and geographic areas, see Note 9 to the consolidated financial statements contained in this Annual Report on Form 10-K.
Manufacturing and Distribution Network
Substantially all of our beverages are manufactured in facilities that we, or third-party manufacturers with whom we have long-term co-packing agreements, either own or lease. We rely on third parties to produce and distribute products in areas or markets where we do not have our own production facilities, such as in Continental Europe, or when additional production capacity is required.
Our products are either picked up by our customers at our facilities or delivered by us, a common carrier, or third-party distributors to our customers’ distribution centers or to retail locations.
Ingredient and Packaging Supplies
In addition to water, the principal raw materials required to produce our products are polyethylene terephthalate (“PET”) bottles, PET caps and preforms, aluminum cans and ends, labels, cartons and trays, concentrates, sweeteners, fruit concentrates and fruit. The cost of these raw materials can fluctuate substantially.
Under many of our supply arrangements for these raw materials, the price we pay fluctuates along with certain changes in underlying commodity costs, such as aluminum in the case of cans, resin in the case of PET bottles and caps, and corn in the case of HFCS. We believe that we will be able to either renegotiate contracts with these suppliers when they expire or find alternative sources for supply. We also believe there is adequate supply of the ingredient and packaging materials used to produce and package our products.
Generally, we bear the risk of increases in the costs of the ingredient and packaging materials used to produce our products, including the underlying costs of the commodities used to manufacture them and, to some extent, the costs of converting those commodities into the materials we purchase.
5
Table of Contents
Aluminum for cans, resin for PET bottles, preforms and caps, and corn for HFCS are examples of underlying commodities for which we bear the risk of increases in costs. In addition, the contracts for certain of our ingredient and packaging materials permit our suppliers to increase the costs they charge us based on increases in their cost of converting the underlying commodities into the materials we purchase. In certain cases those increases are subject to negotiated limits. Changes in the prices we pay for ingredient and packaging materials occur at times that vary by product and supplier, but take place principally on a monthly or annual basis.
Crown Cork & Seal USA, Inc. (“CCS”) supplies us with aluminum cans and ends under a contract entered into in 2010 with a multi-year term. The contract provides that CCS will supply our aluminum cans and ends requirements worldwide, subject to certain exceptions. The contract contains a pricing mechanism for certain materials and representations, warranties, indemnities and termination events (including termination events related to bankruptcy or insolvency of either party) that we believe to be customary. In 2010, we entered into fixed price commitments for a majority of our forecasted aluminum requirements for 2010 as well as more than half of our requirements for 2011.
PET resin prices have fluctuated significantly in recent years as the price of oil has fluctuated and demand for synthetic fibers has increased. Because PET resin is not a traded commodity, we have limited ability to obtain price protection.
Corn has a history of volatile price changes. We expect that corn market prices will continue to fluctuate as a result of an increase in the demand for corn-related products such as HFCS. In 2010, we entered into fixed price commitments for a majority of our HFCS requirements for 2010 and 2011.
Fruit prices have been, and we expect them to continue to be, subject to significant volatility. While fruit is available from numerous independent suppliers, these raw materials are subject to fluctuations in price attributable to, among other things, changes in crop size and federal and state agricultural programs.
Trade Secrets, Copyrights, Trademarks and Licenses
We sell the majority of our beverages under retailer brands to customers who own the trademarks associated with those products. We also own registrations, or applications to register, various trademarks that are important to our worldwide business, including Cott®, Red Rain® and Orient Emporium Tea Co.™ in the U.S., Canada and the U.K., Stars & Stripes®, Vess®, Vintage®, So Clear® , Shanstar®, Harvest Classic®, Chadwick Bay® and Golden Crown® in the U.S., Red Rave™ in Canada, Emerge®, Red Rooster®, Carters®, Ben Shaws® and the H2 family of brands in the U.K., Stars & Stripes® in Mexico, and RC® in more than 100 countries and territories outside of North America. Moreover, we are licensed to use certain trademarks such as Jarritos® in Mexico. The licenses to which we are a party are of varying terms, including some that are perpetual. Trademark ownership is generally of indefinite duration when marks are properly maintained in commercial use.
Our success depends in part on our intellectual property, which includes trade secrets in the form of concentrate formulas for our beverages and trademarks for the names of the beverages we sell. To protect this intellectual property, we rely principally on registration of trademarks, contractual responsibilities and restrictions in agreements (such as indemnification, nondisclosure and confidentiality agreements) with employees, consultants and customers, and on the common law and statutory protections afforded to trademarks, copyrights, trade secrets and proprietary “know-how.” We also closely monitor the use of our trademarks and vigorously pursue any party that infringes on our trademarks, using all available legal remedies.
Seasonality of Sales
The beverage market is subject to some seasonal variations. Our beverage sales are generally higher during the warmer months and also can be influenced by the timing of holidays and weather fluctuations. This seasonality also causes our working capital needs to fluctuate with inventory being higher in the first half of the year to meet the peak summer demand and accounts receivable declining in the fall as customers pay their higher-than-average outstanding balances from the summer deliveries.
6
Table of Contents
Customers
A significant portion of our revenue is concentrated in a small number of customers. Our customers include many large national and regional grocery, mass-merchandise, drugstore, wholesale and convenience store chains. For 2010, sales to Wal-Mart accounted for 31.0% (2009—33.5%, 2008—35.8%) of our total revenue, 35.3% of our North America operating segment revenue (2009—39.4%, 2008—42.1%), 16.6% of our U.K. operating segment revenue (2009—17.7%, 2008—21.1%) and 38.9% of our Mexico operating segment revenue (2009—18.4%, 2008—22.2%). Wal-Mart was the only customer that accounted for more than 10% of our total revenue in that period. Sales to our top ten customers in 2010, 2009 and 2008 accounted for 55.4%, 60.0% and 62.0%, respectively, of our total revenue. We expect that sales of our products to a limited number of customers will continue to account for a high percentage of revenue for the foreseeable future. The loss of any customers that individually or in the aggregate represent a significant portion of our revenue, or a decline in sales to these customers, would have a material adverse effect on our operating results and cash flow.
On January 27, 2009, we received written notice from Wal-Mart stating that Wal-Mart was exercising its right to terminate, without cause, our exclusive supply contract dated December 21, 1998, between our wholly owned subsidiary Cott Beverages Inc. and Wal Mart Stores Inc. (“the Exclusive U.S. Supply Contract”). The termination is effective on January 28, 2012. This has the effect of returning our relationship to more typical market terms over time, and allows Wal-Mart to introduce other suppliers in the future, if it so desires. The termination provision of the Exclusive U.S. Supply Contract provides for our exclusive right to supply CSDs to Wal-Mart in the U.S. to be phased out over a period of three years following notice of termination (the “Notice Period”). Accordingly, we had the exclusive right to supply at least two-thirds of Wal-Mart’s total CSD volumes in the U.S., during the first 12 months of the Notice Period, and we had the exclusive right to supply at least one-third of Wal-Mart’s total CSD volumes in the U.S. during the second 12 months of the Notice Period. During the final 12 months of the Notice Period, there is no minimum supply requirement. Notwithstanding the notice of termination of the Exclusive U.S. Supply Contract, we continue to supply Wal-Mart with all of its private label CSDs in the U.S. However, should Wal-Mart choose to introduce an additional supplier to fulfill a portion of its requirements for its private label CSDs, our operating results could be materially adversely affected.
Research and Development
We engage in a variety of research and development activities. These activities principally involve the development of new products, improvement in the quality of existing products, improvement and modernization of production processes, and the development and implementation of new technologies to enhance the quality and value of both current and proposed product lines. Consumer research is excluded from research and development costs and included in other marketing costs. Research and development costs were $3.1 million in 2010, $3.0 million in 2009 and $2.2 million in 2008 and are reported as selling, general and administrative expenses.
Competition
We compete against a wide range of companies that produce and sell private-label beverages, including CSDs, clear, still and sparkling flavored waters, energy-related drinks, juice, juice-based products, bottled water and ready-to-drink teas. While CSDs and CSD concentrate accounted for 71.7% of our 2010 case volume, they accounted for 51.8% of our 2010 revenue. The non-CSD products generated 28.3% of our 2010 case volume and 48.2% of our 2010 revenue.
The non-alcoholic beverage category is highly competitive in each region in which we operate, and competition for incremental volume is intense. The brands owned by the four major national soft drink companies, Coca-Cola, Pepsi, Nestle Waters North America and Dr. Pepper Snapple (formerly Cadbury Schweppes), control 84% of the aggregate take-home volume of the liquid refreshment beverage category. These companies have significant financial resources and spend heavily on promotional programs. They also have direct store delivery systems in North America, which enable their personnel to visit retailers frequently to promote new items, stock shelves and build displays. We also face competition in the juice category from juice brands such as Welch’s, Ocean Spray and Mott’s.
7
Table of Contents
In addition, we face competition in North America, the United Kingdom and Mexico from regional beverage manufacturers who sell aggressively-priced brands and, in many cases, also supply retailer brand products. A few larger U.S. retailers also self-manufacture products for their own needs and consistently approach other retailers seeking additional business.
We seek to differentiate ourselves from our competitors by offering our customers efficient distribution methods, high-quality products, category management strategies, packaging and marketing strategies, and superior service.
Government Regulation and Environmental Matters
The production, distribution and sale in the U.S. of many of our products are subject to the Federal Food, Drug, and Cosmetic Act, the Federal Trade Commission Act, the Lanham Act, state consumer protection laws, federal, state and local workplace health and safety laws, various federal, state and local environmental protection laws and various other federal, state and local statutes and regulations applicable to the production, transportation, sale, safety, advertising, labeling and ingredients of such products. Outside the U.S., the production, distribution and sale of our many products and related operations are also subject to numerous similar and other statutes and regulations.
A number of states have passed laws setting forth warning or labeling requirements relating to products made for human consumption. For example, the California law known as “Proposition 65” requires that a specific warning appear on any product sold in California containing a substance listed by that state as having been found to cause cancer or reproductive toxicity. This law, and others like it, expose all food and beverage producers to the possibility of having to provide warnings on their products. The detection of even a trace amount of a listed substance can subject an affected product to the requirement of a warning label, although products containing listed substances that occur naturally or that are contributed to such products solely by a municipal water supply are generally exempt from the warning requirement. From time to time over the past several years, certain of our customers have received notices alleging that the labeling requirements of the relevant state regulation would apply to products manufactured by us and sold by them. There can be no assurance that we will not be adversely affected by actions against our retailer partners or us relating to Proposition 65 or similar “failure to warn” laws.
We currently offer and use non-refillable recyclable containers in the U.S. and other countries around the world. We also offer and use refillable containers, which are also recyclable. Legal requirements apply in various jurisdictions in the U.S. and other countries requiring that deposits or certain ecotaxes or fees be charged for the sale, marketing and use of certain non-refillable beverage containers. The precise requirements imposed by these measures vary. Other types of beverage container-related deposit, recycling, ecotax and/or product stewardship statutes and regulations also apply in various jurisdictions in the U.S. and overseas. We anticipate that additional, similar legal requirements may be proposed or enacted in the future at local, state and federal levels, both in the U.S. and elsewhere.
All of our beverage production facilities and other operations are subject to various environmental protection statutes and regulations, including those of the U.S. Environmental Protection Agency, which pertain to the use of water resources and the discharge of waste water. Failure to comply with these regulations can have serious consequences, including civil and administrative penalties. Compliance with these provisions has not had, and we do not expect such compliance to have, any material adverse effect on our Company’s capital expenditures, net income or competitive position. However, as discussed below, changes in how the Ontario Ministry of the Environment enforces the Ontario Environmental Protection Act could result in us having to make material expenditures for environmental compliance.
Subject to the terms and conditions of the applicable policies, we are insured against product liability claims and product recalls that could result from the injury, illness or death of consumers using our products, contamination of our products, or damage to or mislabeling of our products. We believe that our insurance coverage is adequate.
8
Table of Contents
The Ontario Environmental Protection Act (“OEPA”)
OEPA regulations provide that a minimum percentage of a bottler’s soft drink sales within specified areas in Ontario must be made in refillable containers. The penalty for non-compliance is a fine of $50,000 per day beginning upon when the first offense occurs and continues until the first conviction, and then increasing to $100,000 per day for each subsequent conviction. These fines may be increased to equal the amount of monetary benefit acquired by the offender as a result of the commission of the offense.
We, and we believe other industry participants, are currently not in compliance with the requirements of the OEPA. To comply with these requirements we, and we believe many other industry participants, would have to significantly increase sales in refillable containers to a minimum refillable sales ratio of 30%. We do not expect to be in compliance with these regulations in the foreseeable future. Ontario is not enforcing the OEPA at this time, despite the fact that it is still in effect and not amended, but if it chooses to enforce it in the future, we could incur fines for non-compliance and the possible prohibition of sales of soft drinks in non-refillable containers in Ontario. We estimate that approximately 3% of our sales would be affected by the possible limitation of sales of soft drinks in non-refillable containers in Ontario if the Ontario Ministry of the Environment initiated an action to enforce the provisions of the OEPA against us. Moreover, the Ontario Ministry of the Environment released a report in 1997 stating that these OEPA regulations are “outdated and unworkable.” However, despite the “unworkable” nature of the OEPA regulations, they have not yet been revoked.
We believe that the magnitude of the potential fines that we could incur if the Ontario Ministry of the Environment chose to enforce these regulations is such that the costs to us of non-compliance could be, although are not contemplated to be, material. However, our management believes that such enforcement is very remote.
Employees
As of January 1, 2011, we had 3,957 employees, of whom 2,894 were in the North America operating segment, 716 were in the U.K. operating segment, 334 were in the Mexico operating segment and 13 were in the combined RCI/All Other operating segments. We have entered into numerous collective bargaining agreements covering 820 employees in the United States, Canada and Mexico that we believe contain terms that are typical in the beverage industry. As these agreements expire, we believe they can be renegotiated on terms satisfactory to us. We consider our relations with employees to be generally good.
Availability of Information and Other Matters
We are required to file annual, quarterly and current reports, proxy statements and other information with the SEC and Canadian securities regulatory authorities. The public may read and copy any materials that we file with the SEC at the SEC’s Public Reference Room at 100 F Street, NE, Washington, D.C. 20549. Information in the Public Reference Room may be obtained by calling the SEC at 1-800-551-8090. In addition, the SEC maintains an Internet site that contains reports, proxy and information statements, and other information regarding issuers that file with the SEC at www.sec.gov. Information filed with the Canadian securities regulatory authorities is available at www.sedar.com.
Our Annual Report on Form 10-K, quarterly reports on Form 10-Q, current reports on Form 8-K and amendments to reports filed or furnished pursuant to Sections 13(a) and 15(d) of the Securities Exchange Act of 1934, as amended, are also available free of charge on our website at www.cott.com, as soon as reasonably practicable after such material is electronically filed with, or furnished to, the SEC. The information found on our website is not part of this or any other report that we file with, or furnish to, the SEC or to Canadian securities regulatory authorities.
We are responsible for establishing and maintaining adequate internal control over financial reporting as required by the SEC. See “Management’s Report on Internal Control over Financial Reporting” on page 52.
9
Table of Contents
| ITEM 1A. | RISK FACTORS |
In addition to the other information set forth in this report, you should carefully consider the following factors, which could materially affect our business, financial condition or future results. The risks described below are not the only risks that we face. Additional risks and uncertainties not currently known to us or that we currently deem to be immaterial also may materially adversely affect our business, financial condition or results of operations.
We may not realize the expected benefits of the Cliffstar Acquisition because of integration difficulties and other challenges.
The ultimate success of the Cliffstar Acquisition will depend, in part, on our ability to realize all or some of the anticipated benefits from integrating Cliffstar’s business with our existing businesses. The integration process may be complex, costly and time-consuming. The difficulties of integrating the operations of Cliffstar’s business include, among others:
| • | failure to implement our business plan for the combined business; |
| • | unanticipated issues in integrating manufacturing, logistics, information, communications and other systems; |
| • | resolving inconsistencies in standards, controls, procedures and policies, and compensation structures between Cliffstar’s structure and our structure; |
| • | failure to retain key customers and suppliers; |
| • | unanticipated changes in applicable laws and regulations; |
| • | failure to retain key employees; |
| • | operating risks inherent in Cliffstar’s business and our business; and |
| • | unanticipated issues, expenses and liabilities. |
We may not be able to maintain the levels of revenue, earnings or operating efficiency that each of Cott and Cliffstar had achieved or might achieve separately. In addition, we may not accomplish the integration of Cliffstar’s business smoothly, successfully or within the anticipated costs or timeframe. If we experience difficulties with the integration process, the anticipated benefits of the Cliffstar Acquisition may not be realized fully, or at all, or may take longer to realize than expected.
We face risks associated with our Asset Purchase Agreement in connection with the Cliffstar Acquisition.
As a result of the Cliffstar Acquisition, we assumed substantially all of the liabilities of Cliffstar and its affiliated companies that were not satisfied on or prior to the closing date. There may be liabilities that we underestimated or did not discover in the course of performing our due diligence investigation of Cliffstar that may arise in the future. Under the Asset Purchase Agreement, the seller provided us with a limited set of representations and warranties. Our sole remedy from the seller for any breach of those representations and warranties is an action for indemnification, which may only be brought in certain circumstances and within certain time periods. Indemnification payments may not exceed $50.0 million. Damages resulting from a breach of a representation or warranty could have a material and adverse effect on our financial condition and results of operations.
We are still in the process of assessing the system of internal control over financial reporting maintained by Cliffstar as a part of our integration efforts, and we may need to make changes indentified as a result of that assessment once completed.
Pursuant to the Asset Purchase Agreement, we acquired substantially all of the assets and liabilities of Cliffstar and its affiliated companies. None of these companies have previously been subject to periodic reporting as a public company and thus have not been required to maintain a system of internal control over financial
10
Table of Contents
reporting mandated by the Sarbanes-Oxley Act of 2002. Establishing, testing and maintaining an effective system of internal control over financial reporting requires significant resources and time commitments on the part of our management and our finance and accounting staff, may require additional staffing and infrastructure investments, and may increase our costs of doing business. If our ongoing evaluation of Cliffstar’s internal controls identifies deficiencies or areas for improvement, we will need to devote further resources to remedying them. We cannot be certain that our remedial measures will be effective. Any failure to implement required new or improved controls, or difficulties encountered in their implementation, could harm our operating results or increase our risk of material weaknesses in internal controls.
We incurred substantial indebtedness in order to finance the Cliffstar Acquisition, which could adversely affect our business and limit our ability to plan for or respond to changes in our business.
In connection with the Cliffstar Acquisition, we issued $375.0 million of senior notes that are due on September 1, 2018 (the “2018 Notes”). Additionally, we refinanced our existing asset based lending facility and drew down a substantial amount of indebtedness under that facility in order to fund the Cliffstar Acquisition. As a result, we have substantially more indebtedness than has been the case for us historically.
Our ability to make payments on and to refinance our debt obligations and to fund planned capital expenditures depends on our ability to generate cash from our future operations. This, to a certain extent, is subject to financial, competitive, legislative, regulatory and other factors that are beyond our control. In addition, if we cannot service our indebtedness, we may have to take actions such as selling assets, seeking additional equity or reducing or delaying capital expenditures, strategic acquisitions, investments and alliances, any of which could impede the implementation of our business strategy, prevent us from entering into transactions that would otherwise benefit our business and/or have a material adverse effect on our financial condition and results of operations. We may not be able to refinance our indebtedness or take such other actions, if necessary, on commercially reasonable terms, or at all.
We may be unable to compete successfully in the highly competitive beverage category.
The markets for our products are extremely competitive. In comparison to the major national brand beverage manufacturers, we are a relatively small participant in the industry. We face competition from the national brand beverage manufacturers in all of our markets and from other retailer brand beverage manufacturers. If our competitors reduce their selling prices, increase the frequency of their promotional activities in our core market or enter into the production of private-label products, or if our customers do not allocate adequate shelf space for the beverages we supply, we could experience a decline in our volumes, be forced to reduce pricing, forgo price increases required to offset increased costs of raw materials and fuel, increase capital and other expenditures, or lose market share, any of which could adversely affect our profitability.
We may not be able to respond successfully to consumer trends related to carbonated and non-carbonated beverages.
Consumer trends with respect to the products we sell are subject to change. Consumers are seeking increased variety in their beverages, and there is a growing interest among consumers, public health officials and government officials regarding the ingredients in our products, the attributes of those ingredients and health and wellness issues generally. In addition, some researchers, health advocates and dietary guidelines are encouraging consumers to reduce consumption of sugar-sweetened beverages, including those sweetened with HFCS or other nutritive sweeteners. As a result, consumer demand has declined for full-calorie CSDs and consumer demand has increased for products associated with health and wellness, such as reduced-calorie CSDs, water, enhanced water, teas and certain other non-carbonated beverages, including juices. Consumer preferences may change due to a variety of other factors, including the aging of the general population, changes in social trends, the real or perceived impact that the manufacturing of our products has on the environment, changes in consumer demographics, changes in travel, vacation or leisure activity patterns, negative publicity resulting from regulatory
11
Table of Contents
action or litigation against companies in the industry, or a downturn in economic conditions. Any of these changes may reduce consumers’ demand for our products. There can be no assurance that we can develop or be a “fast follower” of innovative products that respond to consumer trends. Our failure to develop innovative products could put us at a competitive disadvantage in the marketplace and our business and financial results could be adversely affected.
Because a small number of customers account for a significant percentage of our sales, the loss of or reduction in sales to any significant customer could have a material adverse effect on our results of operations and financial condition.
A significant portion of our revenue is concentrated in a small number of customers. Our customers include many large national and regional grocery, mass-merchandise, drugstore, wholesale and convenience store chains in our core markets of North America, U.K. and Mexico. Sales to Wal-Mart, our top customer in 2010, 2009 and 2008 accounted for 31.0%, 33.5% and 35.8%, respectively, of our total revenue. Sales to our top ten customers in 2010, 2009 and 2008 accounted for 55.0%, 60.0% and 62.0%, respectively, of our total revenue. We expect that sales of our products to a limited number of customers will continue to account for a high percentage of our revenue for the foreseeable future.
On January 27, 2009, we received written notice from Wal-Mart stating that Wal-Mart was exercising its right to terminate, without cause, our Exclusive U.S. Supply Contract, effective on January 28, 2012. Pursuant to the terms of the Exclusive U.S. Supply Contract, we are the exclusive supplier to Wal-Mart of retailer brand CSDs in the United States. The termination provision of the Exclusive U.S. Supply Contract provides for exclusivity to be phased out over a period of three years following notice of termination. Accordingly, we had the exclusive right to supply at least two-thirds of Wal-Mart’s total CSD volume in the United States during the first 12 months of the Notice Period, and we had the exclusive right to supply at least one-third of Wal-Mart’s total CSD volume in the U.S. during the second 12 months of the Notice Period. Notwithstanding the termination of the Exclusive U.S. Supply Contract, we continue to supply Wal-Mart and its affiliated companies, under annual non-exclusive supply agreements, with a variety of products in the United States, Canada, U.K. and Mexico, including CSDs, clear, still and sparkling flavored waters, juice, juice-based products, bottled water, energy drinks and ready-to-drink teas.
The loss of Wal-Mart or any significant customer, or customers that in the aggregate represent a significant portion of our revenue, or a material reduction in the amount of business we undertake with any such customer or customers, could have a material adverse effect on our operating results and cash flows. Furthermore, we could be adversely affected if Wal-Mart or any significant customer reacts unfavorably to any pricing of our products or decides to de-emphasize or reduce their product offerings in the categories with which we supply them. At January 1, 2011, we had $274.5 million of customer relationships recorded as an intangible asset. The permanent loss of any customer included in the intangible asset would result in impairment in the value of the intangible asset or accelerated amortization and could lead to an impairment of fixed assets that were used to service that client.
Our ingredients, packaging supplies and other costs are subject to price increases and we may be unable to effectively pass rising costs on to our customers.
We bear the risk of changes in prices on the ingredient and packaging in our products. The majority of our ingredient and packaging supply contracts allow our suppliers to alter the prices they charge us based on changes in the costs of the underlying commodities that are used to produce them. Aluminum for cans and ends, resin for PET bottles, preforms and caps, and corn for HFCS are examples of these underlying commodities. In addition, the contracts for certain of our ingredient and packaging materials permit our suppliers to increase the costs they charge us based on increases in their cost of converting those underlying commodities into the materials that we purchase. In certain cases those increases are subject to negotiated limits and, in other cases, they are not. These changes in the prices that we pay for ingredient and packaging materials occur at times that vary by product and supplier, but are principally on a monthly or annual basis.
12
Table of Contents
We are at risk with respect to fluctuating aluminum prices. In 2010, we entered into fixed price commitments for a majority of our forecasted aluminum requirements for 2010, as well as more than half of our requirements for 2011. Because PET resin is not a traded commodity, no fixed price mechanism has been implemented, and we are accordingly also at risk with respect to changes in PET prices. Fruit prices have been, and we expect them to continue to be, subject to significant volatility. While fruit is available from numerous independent suppliers, these raw materials are subject to fluctuations in price attributable to, among other things, changes in crop size and federal and state agricultural programs. Corn, and thus HFCS, also has a history of volatile price changes. We typically purchase HFCS requirements for North America under 12 month contracts. If the cost of commodities for which we have entered into fixed price commitments decreases, we will not be able to take advantage of such decreased costs.
Accordingly, we bear the risk of fluctuations in the costs of these ingredient and packaging materials, including the underlying costs of the commodities used to manufacture them and, to some extent, the costs of converting those commodities into the materials we purchase. We currently do not use derivatives to manage this risk. If the cost of these ingredients or packaging materials increases, we may be unable to pass these costs along to our customers through adjustments to the prices we charge. If we cannot pass on these increases to our customers on a timely basis, they could have a material adverse effect on our results of operations. If we are able to pass these costs on to our customers through price increases, the impact those increased prices could have on our volumes is uncertain.
Our beverage and concentrate production facilities use a significant amount of electricity, natural gas and other energy sources to operate. Fluctuations in the price of fuel and other energy sources for which we have not locked in long-term pricing commitments or arrangements would affect our operating costs, which could impact our profitability.
If we fail to manage our operations successfully, our business and financial results may be materially and adversely affected.
In recent years, we have grown our business and beverage offerings primarily through the acquisition of other companies, development of new product lines and growth with key customers. We believe that opportunities exist to increase sales of beverages in our markets by leveraging existing customer relationships, obtaining new customers, exploring new channels of distribution, introducing new products or identifying appropriate acquisition or strategic alliance candidates. The success of this strategy with respect to acquisitions depends on our ability to manage and integrate acquisitions and alliances, including Cliffstar, into our existing business. Furthermore, the businesses or product lines that we acquire or align with may not be integrated successfully into our business or prove profitable. In addition to the foregoing factors, our ability to expand our business in foreign countries is also dependent on, and may be limited by, our ability to comply with the laws of the various jurisdictions in which we may operate, as well as changes in local government regulations and policies in such jurisdictions. If we fail to manage the geographic allocation of production capacity surrounding customer demand in North America, we may lose certain customer product volume or have to utilize co-packers to fulfill our customer capacity obligations, either of which could negatively impact our financial results.
Our geographic diversity subjects us to the risk of currency fluctuations.
We are exposed to changes in foreign currency exchange rates, including those between the U.S. dollar and the pound sterling, the Euro, the Canadian dollar, the Mexican peso and other currencies. Our operations outside of the United States accounted for 34.2% of our 2010 sales. Accordingly, currency fluctuations in respect of our outstanding non-U.S. dollar denominated net asset balances may affect our reported results and competitive position.
Furthermore, our foreign operations purchase key ingredients and packaging supplies in U.S. dollars. This exposes them to additional foreign currency risk that can adversely affect our reported results.
13
Table of Contents
Our hedging activities, which are designed to minimize and delay, but not to completely eliminate, the effects of foreign currency fluctuations may not sufficiently mitigate the impact of foreign currencies on our financial results. Factors that could affect the effectiveness of our hedging activities include accuracy of sales forecasts, volatility of currency markets, and the availability of hedging instruments. Our future financial results could be significantly affected by the value of the U.S. dollar in relation to the foreign currencies in which we conduct business. The degree to which our financial results are affected for any given time period will depend in part upon our hedging activities.
If we are unable to maintain relationships with our raw material suppliers, we may incur higher supply costs or be unable to deliver products to our customers.
In addition to water, the principal raw materials required to produce our products are PET bottles, caps and preforms, aluminum cans and ends, labels, cartons and trays, fruit, concentrates and sweeteners. We rely upon our ongoing relationships with our key suppliers to support our operations.
We typically enter into annual or multi-year supply arrangements with our key suppliers, meaning that our suppliers are obligated to continue to supply us with materials for one-year or multi-year periods, at the end of which we must either renegotiate the contracts with those suppliers or find alternative sources for supply. There can be no assurance that we will be able to either renegotiate contracts (with similar or more favorable terms) with these suppliers when they expire or, alternatively, if we are unable to renegotiate contracts with our key suppliers, there can be no assurance that we could replace them. We could also incur higher ingredient and packaging supply costs in renegotiating contracts with existing suppliers or replacing those suppliers, or we could experience temporary disruptions in our ability to deliver products to our customers, either of which could have a material adverse effect on our results of operations.
With respect to some of our key packaging supplies, such as aluminum cans and ends, and some of our key ingredients, such as sweeteners, we have entered into long-term supply agreements, the remaining terms of which range from 12 to 72 months, and therefore we are assured of a supply of those key packaging supplies and ingredients during such terms. CCS supplies aluminum cans and ends under a contract with a multi-year term. The contract provides that CCS will supply our aluminum can and end requirements worldwide, subject to certain exceptions. In addition, the supply of specific ingredient and packaging materials could be adversely affected by many factors, including industry consolidation, energy shortages, governmental controls, labor disputes, natural disasters, transportation interruption, political instability, acts of war or terrorism and other factors.
We identified material weaknesses in our internal controls over financial reporting; failure to remediate the material weaknesses could negatively impact our business.
We concluded that material weaknesses existed in our internal controls over financial reporting as of January 1, 2011. More specifically, we concluded that we did not maintain effective controls over the communication and evaluation of a certain customer’s discount and pricing programs, which resulted in immaterial errors in our financial statements for the third quarter of 2010. In response to the identified material weaknesses, and with oversight from our Audit Committee, we are focused on improving our internal controls over financial reporting and remedying the identified material weaknesses. Beginning in January 2011, management began to design and implement certain remediation measures to address the above-described material weakness and enhance our system of internal control over financial reporting, including conducting expanded reviews and evaluations of specific customer accounts receivable aging and promotional activities reports and re-assigning senior accounting personnel to oversee the specific customer activities. We cannot assure you that we will be able to do so on a timely basis or at all.
If we fail to remediate these material weaknesses, or if our internal controls over financial reporting required under Section 404 of the Sarbanes-Oxley Act of 2002 are inadequate in the future, it could negatively impact our business and the price of our common shares.
14
Table of Contents
We have a significant amount of outstanding debt, which could adversely affect our financial health and future cash flows may not be sufficient to meet our obligations.
As of January 1, 2011, our total debt was $622.2 million. Our present debt and any future borrowings could have important adverse consequences to us and our investors, including:
| • | requiring a substantial portion of our cash flow from operations to make interest payments on this debt; |
| • | making it more difficult to satisfy debt service and other obligations; |
| • | increasing the risk of a future credit ratings downgrade of our debt, which would increase future debt costs; |
| • | increasing our vulnerability to general adverse economic and industry conditions; |
| • | reducing the cash flow available to fund capital expenditures and other corporate purposes and to grow our business; |
| • | limiting our flexibility in planning for, or reacting to, changes in our business and the industry; |
| • | placing us at a competitive disadvantage to our competitors that may not be as highly leveraged; and |
| • | limiting our ability to borrow additional funds as needed or take advantage of business opportunities, such as acquisitions, as they arise, pay cash dividends or repurchase common stock. |
To the extent we become more leveraged, the risks described above would increase. In addition, our actual cash requirements in the future may be greater than expected. We cannot assure you that our business will generate sufficient cash flow from operations, or that future borrowings will be available to us in amounts sufficient to enable us to pay our debt or to fund our other liquidity needs.
If we fail to generate sufficient cash flow from future operations to meet our debt service obligations, we may need to refinance all or a portion of our debt on or before maturity. We cannot assure you that we will be able to refinance any of our debt on attractive terms, commercially reasonable terms or at all. Our future operating performance and our ability to service or refinance our debt will be subject to future economic conditions and to financial, business and other factors, many of which are beyond our control.
Our asset based lending (“ABL”) facility, the indenture governing the 2017 Notes, and the indenture governing the 2018 Notes each contain various covenants limiting the discretion of our management in operating our business, which could prevent us from capitalizing on business opportunities and taking some corporate actions.
Our ABL facility, the indenture governing the $215.0 million of senior notes that are due on November 15, 2017 (the “2017 Notes”), and the indenture governing the 2018 Notes each impose significant operating and financial restrictions on us. These restrictions will limit or restrict, among other things, our ability and the ability of our restricted subsidiaries to:
| • | incur additional indebtedness; |
| • | make restricted payments (including paying dividends on, redeeming, repurchasing or retiring our capital stock); |
| • | make investments; |
| • | create liens; |
| • | sell assets; |
| • | enter into agreements restricting our subsidiaries’ ability to pay dividends, make loans or transfer assets to us; |
| • | engage in transactions with affiliates; and |
| • | consolidate, merge or sell all or substantially all of our assets. |
15
Table of Contents
These covenants are subject to important exceptions and qualifications. In addition, our ABL facility also requires us, under certain circumstances, to maintain compliance with a financial covenant. Our ability to comply with this covenant may be affected by events beyond our control, including those described in this “Risk Factors” section. A breach of any of the covenants contained in our ABL facility, including our inability to comply with the financial covenant, could result in an event of default, which would allow the lenders under our ABL facility to declare all borrowings outstanding to be due and payable, which would in turn trigger an event of default under the indenture governing the 2017 Notes and the indenture governing the 2018 Notes and, potentially, our other debt. At maturity or in the event of an acceleration of payment obligations, we would likely be unable to pay our outstanding debt with our cash and cash equivalents then on hand. We would, therefore, be required to seek alternative sources of funding, which may not be available on commercially reasonable terms, terms as favorable as our current agreements or at all, or face bankruptcy. If we are unable to refinance our debt or find alternative means of financing our operations, we may be required to curtail our operations or take other actions that are inconsistent with our current business practices or strategy. For additional information about our ABL facility, see “Management’s Discussion and Analysis of Financial Condition and Results of Operations—Liquidity and Capital Resources.”
A portion of our debt is variable rate debt, and changes in interest rates could adversely affect us by causing us to incur higher interest costs with respect to such variable rate debt.
Our ABL facility subjects us to interest rate risk. The rate at which we pay interest on amounts borrowed under such facility fluctuates with changes in interest rates and our debt leverage. Accordingly, with respect to any amounts from time to time outstanding under our ABL facility, we are and will be exposed to changes in interest rates. If we are unable to adequately manage our debt structure in response to changes in the market, our interest expense could increase, which would negatively impact our financial condition and results of operations. As of January 1, 2011 our variable rate debt represented 1% of our total debt.
Our financial results may be negatively impacted by global financial events.
In recent years, global financial events have resulted in the consolidation, failure or near failure of a number of institutions in the banking, insurance and investment banking industries and have substantially reduced the ability of companies to obtain financing. These events also adversely affected the financial markets. These events could continue to have a number of different effects on our business, including:
| • | a reduction in consumer spending, which could result in a reduction in our sales volume; |
| • | a negative impact on the ability of our customers to timely pay their obligations to us or our vendors to timely supply materials, thus reducing our cash flow; |
| • | an increase in counterparty risk; |
| • | an increased likelihood that one or more members of our banking syndicate may be unable to honor its commitments under our ABL facility; and |
| • | restricted access to capital markets that may limit our ability to take advantage of business opportunities, such as acquisitions. |
Other events or conditions may arise or persist directly or indirectly from the global financial events that could negatively impact our business.
We may not fully realize the expected cost savings and/or operating efficiencies from our restructuring activities.
During the last five years we have implemented, and may in the future implement, restructuring activities to support the implementation of key strategic initiatives designed to achieve long-term sustainable growth. These activities are intended to maximize our operating effectiveness and efficiency and to reduce our costs. We cannot
16
Table of Contents
be assured that we will achieve or sustain the targeted benefits under these programs or that the benefits, even if achieved, will be adequate to meet our long-term growth expectations. In addition, the implementation of key elements of these activities, such as employee job reductions and plant closures, may have an adverse impact on our business, particularly in the near-term.
Substantial disruption to production at our beverage concentrates or other beverage production facilities could occur.
A disruption in production at our beverage concentrates production facility, which manufactures almost all of our concentrates, could have a material adverse effect on our business. In addition, a disruption could occur at any of our other facilities or those of our suppliers, bottlers or distributors. The disruption could occur for many reasons, including fire, natural disasters, weather, manufacturing problems, disease, strikes, transportation interruption, government regulation or terrorism. Alternative facilities with sufficient capacity or capabilities may not be available, may cost substantially more or may take a significant time to start production, each of which could negatively affect our business and financial performance.
Our success depends, in part, on our intellectual property, which we may be unable to protect.
We possess certain intellectual property that is important to our business. This intellectual property includes trade secrets, in the form of the concentrate formulas for most of the beverages that we produce, and trademarks for the names of the beverages that we sell. While we own certain of the trademarks used to identify our beverages, other trademarks are used through licenses from third parties or by permission from our retailer brand customers. Our success depends, in part, on our ability to protect our intellectual property.
To protect this intellectual property, we rely principally on registration of trademarks, contractual responsibilities and restrictions in agreements (such as indemnification, nondisclosure and confidentiality agreements) with employees, consultants and customers, and on common law and statutory protections afforded to trademarks, trade secrets and proprietary “know-how.” In addition, we vigorously protect our intellectual property against infringements using any and all legal remedies available. Notwithstanding our efforts, we may not be successful in protecting our intellectual property for a number of reasons, including:
| • | our competitors may independently develop intellectual property that is similar to or better than ours; |
| • | employees, consultants or customers may not abide by their contractual agreements and the cost of enforcing those agreements may be prohibitive, or those agreements may prove to be unenforceable or more limited than anticipated; |
| • | foreign intellectual property laws may not adequately protect our intellectual property rights; and |
| • | our intellectual property rights may be successfully challenged, invalidated or circumvented. |
If we are unable to protect our intellectual property, our competitive position would weaken and we could face significant expense to protect or enforce our intellectual property rights. At January 1, 2011, we had $45.0 million of rights and $7.8 million of trademarks recorded as intangible assets.
Occasionally, third parties may assert that we are, or may be, infringing on or misappropriating their intellectual property rights. In these cases, we intend to defend against claims or negotiate licenses when we consider these actions appropriate. Intellectual property cases are uncertain and involve complex legal and factual questions. If we become involved in this type of litigation, it could consume significant resources and divert our attention from business operations.
If we are found to infringe on the intellectual property rights of others, we could incur significant damages, be enjoined from continuing to manufacture, market or use the affected product, or be required to obtain a license to continue manufacturing or using the affected product. A license could be very expensive to obtain or may not be available at all. Similarly, changing products or processes to avoid infringing the rights of others may be costly or impracticable.
17
Table of Contents
Our products may not meet health and safety standards or could become contaminated and we could be liable for injury, illness or death caused by consumption of our products.
We have adopted various quality, environmental, health and safety standards. However, our products may still not meet these standards or could otherwise become contaminated. A failure to meet these standards or contamination could occur in our operations or those of our bottlers, distributors or suppliers. This could result in expensive production interruptions, recalls and liability claims. We may be liable to our customers if the consumption of any of our products causes injury, illness or death. Moreover, negative publicity could be generated from false, unfounded or nominal liability claims or limited recalls. Any of these failures or occurrences could have a material adverse effect on our results of operations or cash flows.
Litigation or legal proceedings could expose us to significant liabilities and damage our reputation.
We are party to various litigation claims and legal proceedings. We evaluate these claims and proceedings to assess the likelihood of unfavorable outcomes and estimate, if possible, the amount of potential losses. We may establish a reserve as appropriate based upon assessments and estimates in accordance with our accounting policies. We base our assessments, estimates and disclosures on the information available to us at the time and rely on legal and management judgment. Actual outcomes or losses may differ materially from assessments and estimates. Actual settlements, judgments or resolutions of these claims or proceedings may negatively affect our business and financial performance. For more information, see “Item 3. Legal Proceedings.”
Changes in the legal and regulatory environment in the jurisdictions in which we operate could increase our costs or reduce our revenues, adversely affect demand for our products or result in litigation.
As a producer of beverages, we must comply with various federal, state, provincial, local and foreign laws relating to production, packaging, quality, labeling and distribution, including, in the United States, those of the federal Food, Drug and Cosmetic Act, the Fair Packaging and Labeling Act, the Federal Trade Commission Act, the Nutrition Labeling and Education Act and California Proposition 65. We are also subject to various federal, state, provincial, local and foreign environmental laws and workplace regulations. These laws and regulations include, in the United States, the Occupational Safety and Health Act, the Unfair Labor Standards Act, the Clean Air Act, the Clean Water Act, the Comprehensive Environmental Response, Compensation, and Liability Act, the Resource Conservation and Recovery Act, the Federal Motor Carrier Safety Act, laws governing equal employment opportunity, customs and foreign trade laws and regulations, laws relating to the maintenance of fuel storage tanks, laws relating to water consumption and treatment, and various other federal statutes and regulations. These laws and regulations may change as a result of political, economic, or social events. Such regulatory changes may include changes in food and drug laws, laws related to advertising, accounting standards, taxation requirements, competition laws and environmental laws, including laws relating to the regulation of water rights and treatment. Changes in laws, regulations or government policy and related interpretations may alter the environment in which we do business, which may impact our results or increase our costs or liabilities.
A number of states have passed laws setting forth warning or labeling requirements relating to products made for human consumption. For example, the California law known as “Proposition 65” requires that a specific warning appear on any product sold in California containing a substance listed by that state as having been found to cause cancer or reproductive toxicity. This law, and others like it, expose all food and beverage producers to the possibility of having to provide warnings on their products. The detection of even a trace amount of a listed substance can subject an affected product to the requirement of a warning label, although products containing listed substances that occur naturally or that are contributed to such products solely by a municipal water supply are generally exempt from the warning requirement. From time to time over the past several years, certain of our customers have received notices alleging that the labeling requirements of the relevant state regulation would apply to products manufactured by us and sold by them. There can be no assurance that we will not be adversely affected by actions against our retailer partners or us relating to Proposition 65 or similar “failure to warn” laws: were any such claim to be pursued or succeed, we might in some cases be required to
18
Table of Contents
indemnify our customers for damages, and our products might be required to bear warning labels in order to be sold in certain states. Any negative media attention, adverse publicity or action arising from allegations of violations could adversely impact consumer and retailer perceptions of our products and harm our business.
Proposed taxes on CSDs and other drinks could have an adverse effect on our business.
Federal, state, local and foreign governments have considered imposing taxes on soda and other sugary drinks. Any such taxes could negatively impact consumer demand for our products and have an adverse effect on our revenues.
We are not in compliance with the requirements of the Ontario Environmental Protection Act (“OEPA”) and, if the Ontario government seeks to enforce those requirements or implements modifications to them, we could be adversely affected.
Certain regulations under the OEPA provide that a minimum percentage of a bottler’s soft drink sales within specified areas in Ontario must be made in refillable containers. The penalty for non-compliance is a fine of $50,000 per day beginning when the first offense occurs and continuing until the first conviction, and then increasing to $100,000 per day for each subsequent conviction. These fines may be increased to equal the amount of monetary benefit acquired by the offender as a result of the commission of the offense. We, and we believe other industry participants, are currently not in compliance with the requirements of the OEPA. We do not expect to be in compliance with these regulations in the foreseeable future. Ontario is not enforcing the OEPA at this time, but if it chose to enforce the OEPA in the future, we could incur fines for non-compliance and the possible prohibition of sales of soft drinks in non-refillable containers in Ontario. We estimate that approximately 3% of our sales would be affected by the possible limitation on sales of soft drinks in non-refillable containers in Ontario if the Ontario Ministry of the Environment initiated an action to enforce the provisions of the OEPA against us. In April 2003, the Ontario Ministry of the Environment proposed to revoke these regulations in favor of new mechanisms under the Ontario Waste Diversion Act to enhance diversion from disposal of CSD containers. On December 22, 2003, the Ontario provincial government approved the implementation of the Blue Box Program plan under the Ministry of Environment Waste Diversion Act. The Program requires those parties who are brand owners or licensees of rights to brands which are manufactured, packaged or distributed for sale in Ontario to contribute to the net cost of the Blue Box Program. We generally manufacture, package and distribute products for and on behalf of third party customers. Therefore, we do not believe that we will be responsible for direct costs of the Program. However, our customers may attempt to pass these costs, or a portion of them, on to us. We do not believe that the costs for which we may ultimately be responsible under this Program will have a material adverse effect on our results of operations; however, we cannot guarantee this outcome. The Blue Box Program does not revoke any of the regulations mentioned above under the OEPA regarding refillable containers, although the industry anticipates that they will be reversed in the future.
Adverse weather conditions could affect our supply chain and reduce the demand for our products.
Severe weather conditions and natural disasters, such as freezes, frosts, floods, hurricanes, tornados, droughts or earthquakes and crop diseases may affect our facilities and our supply of raw materials such as fruit. If the supply of any of our raw materials is adversely affected by weather conditions, it may result in increased raw material costs and there can be no assurance that we will be able to obtain sufficient supplies from other sources. In addition, the sales of our products are influenced to some extent by weather conditions in the markets in which we operate. Unusually cold or rainy weather during the summer months may reduce the demand for our products and contribute to lower revenues, which could negatively impact our profitability.
Global or regional catastrophic events could impact our operations and financial results.
Our business can be affected by large-scale terrorist acts, especially those directed against the United States or other major industrialized countries in which we do business, major natural disasters, or widespread outbreaks of infectious diseases. Such events could impair our ability to manage our business, could disrupt our supply of
19
Table of Contents
raw materials, and could impact production, transportation and delivery of products. In addition, such events could cause disruption of regional or global economic activity, which can affect consumers’ purchasing power in the affected areas and, therefore, reduce demand for our products.
Our success depends in part upon our ability to recruit, retain and prepare succession plans for our CEO, CFO, senior management and key employees.
The performance of our CEO, CFO, senior management and other key employees is critical to our success. We plan to continue to invest time and resources in developing our senior management and key employee teams. Our long-term success will depend on our ability to recruit and retain capable senior management and other key employees, and any failure to do so could have a material adverse effect on our future operating results and financial condition. Further, if we fail to adequately plan for the succession of our CEO, CFO, senior management and other key employees, our operating results could be adversely affected.
Changes in future business conditions could cause business investments and/or recorded goodwill, indefinite life intangible assets or other intangible assets to become impaired, resulting in substantial losses and writedowns that would negatively impact our results of operations.
As part of our overall strategy, we will, from time to time, make investments in other businesses. These investments are made upon careful target analysis and due diligence procedures designed to achieve a desired return or strategic objective. These procedures often involve certain assumptions and judgment in determining investment amount or acquisition price. After acquisition or investment, unforeseen issues could arise that adversely affect anticipated returns or that are otherwise not recoverable as an adjustment to the purchase price. Even after careful integration efforts, actual operating results may vary significantly from initial estimates. Goodwill accounted for $130.2 million of our recorded total assets as of January 1, 2011. We evaluate the recoverability of recorded goodwill amounts annually, or when evidence of potential impairment exists. The annual impairment test is based on several factors requiring judgment and certain underlying assumptions. Our only intangible asset with an indefinite life relates to the 2001 acquisition of intellectual property from Royal Crown Company, Inc. including the right to manufacture our concentrates, with all related inventions, processes, technologies, technical and manufacturing information, know-how and the use of the Royal Crown brand outside of North America and Mexico (the “Rights”). This asset, which has a net book value of $45.0 million, is more fully described in Note 1 to the Consolidated Financial Statements.
As of January 1, 2011, other intangible assets were $326.1 million, which consisted principally of $274.5 million of customer relationships that arose from acquisitions and trademarks of $7.8 million. Customer relationships are amortized on a straight-line basis for the period over which we expect to receive economic benefits, which is up to 15 years. We review the estimated useful life of these intangible assets annually, taking into consideration the specific net cash flows related to the intangible asset, unless it is required more frequently due to a triggering event such as the loss of a customer. The permanent loss of any customer included in the intangible asset would result in impairment in the value of the intangible asset or accelerated amortization and could lead to an impairment of fixed assets that were used to service that client. Principally, a decrease in expected operating segment cash flows, changes in market conditions, loss of key customers and a change in our imputed cost of capital may indicate potential impairment of recorded goodwill or the Rights. For additional information on accounting policies we have in place for goodwill impairment, see our discussion under “Critical Accounting Policies and Estimates” in “Item 7. Management’s Discussion and Analysis of Financial Condition and Results of Operations” of this Annual Report on Form 10-K and Note 1, “Summary of Significant Accounting Policies,” in the Notes to the Consolidated Financial Statements.
Our stock price may be volatile.
Our common stock is traded on the New York Stock Exchange (the “NYSE”) and Toronto Stock Exchange (“TSX”). The market price of our common stock has fluctuated substantially in the past and could fluctuate substantially in the future, based on a variety of factors, including future announcements covering us or our key
20
Table of Contents
customers or competitors, government regulations, litigation, changes in earnings estimates by analysts, fluctuations in quarterly operating results or general conditions in our industry. Furthermore, stock prices for many companies fluctuate widely for reasons that may be unrelated to their operating results. Those fluctuations and general economic, political and market conditions, such as recessions or international currency fluctuations and demand for our services, may adversely affect the market price of our common stock.
Failure to maintain our stock exchange listings would adversely affect the trading price and liquidity of our common shares.
We have, in the past, received notice of non-compliance with NYSE listing requirements due to our share price trading below $1.00 for periods of time. While we have cured such deficiencies, if we are not able to maintain compliance with the listing requirements of the NYSE and/or TSX, our shares may be subject to removal from listing on the NYSE and/or TSX. Trading in our common shares after a delisting, if any, would likely be conducted in the over-the-counter markets in the Over-The-Counter Bulletin Board or the “pink sheets” and could also be subject to additional restrictions. As a consequence of a delisting, our shareholders would find it more difficult to dispose of, or to obtain accurate quotations as to the market value of, our common shares. In addition, a delisting would make our common shares substantially less attractive as collateral for margin and purpose loans, for investment by financial institutions under their internal policies or state investment laws, or as consideration in future capital raising.
We may not be able to renew collective bargaining agreements on satisfactory terms, or we could experience strikes.
As of January 1, 2011, 820 of our employees were covered by collective bargaining agreements in the United States, Canada and Mexico. These agreements typically expire every three to five years at various dates. We may not be able to renew our collective bargaining agreements on satisfactory terms or at all. This could result in strikes or work stoppages, which could impair our ability to manufacture and distribute our products and result in a substantial loss of sales. The terms of existing or renewed agreements could also significantly increase our costs or negatively affect our ability to increase operational efficiency.
We depend on key information systems and third-party service providers.
We depend on key information systems to accurately and efficiently transact our business, provide information to management and prepare financial reports. We have typically relied on third-party providers for the majority of our key information systems and business processing services, including hosting our primary data center. In particular, we are in the process of implementing a new SAP software platform to assist us in the management of our business and are also reorganizing certain processes within our finance and accounting departments. As a part of the reorganization, we are outsourcing certain back office transactional finance processes. Additionally, in connection with the efforts to integrate the Cliffstar business with our operations, we are transforming the Company’s information technology function from a nearly 100% outsourced, single vendor relationship to a combination of in-house resources and multi-vendor strategy. If we fail to successfully implement these projects or if the projects do not result in increased operational efficiencies, our operations may be disrupted and our operating expenses could increase, which could adversely affect our financial results.
In addition, these systems and services are vulnerable to interruptions or other failures resulting from, among other things, natural disasters, terrorist attacks, software, equipment or telecommunications failures, processing errors, computer viruses, hackers, other security issues or supplier defaults. Security, backup and disaster recovery measures may not be adequate or implemented properly to avoid such disruptions or failures. Any disruption or failure of these systems or services could cause substantial errors, processing inefficiencies, security breaches, inability to use the systems or process transactions, loss of customers or other business disruptions, all of which could negatively affect our business and financial performance.
21
Table of Contents
We also face other risks that could adversely affect our business, results of operations or financial condition, which include:
| • | any requirement to restate financial results in the event of inappropriate application of accounting principles or otherwise; |
| • | any event that could damage our reputation; |
| • | failure of our processes to prevent and detect unethical conduct of employees; |
| • | a significant failure of internal controls over financial reporting; |
| • | failure of our prevention and control systems related to employee compliance with internal policies and regulatory requirements; and |
| • | failure of corporate governance policies and procedures. |
| ITEM 1B. | UNRESOLVED STAFF COMMENTS |
None.
| ITEM 2. | PROPERTIES |
We operate twenty-six beverage production facilities in North America, twenty of which we own and six of which we lease. We also own and operate a global concentrate manufacturing facility in Columbus, Georgia. In the United Kingdom, we operate four beverage production facilities, all of which we own. In Mexico, we operate two beverage production facilities, one of which we own and one of which we lease.
Total square footage of our beverage production facilities is approximately 2.3 million square feet in the U.S.; 0.9 million square feet in Canada; 0.9 million square feet in the United Kingdom; and 0.3 million square feet in Mexico. This square footage does not include twenty-one separate leased warehouses and one owned warehouse that comprise 1.9 million square feet and four leased office spaces that comprise 0.2 million square feet. Lease terms for non-owned beverage production facilities expire between 2011 and 2022.
The beverage production facilities and square footage amounts noted above do not include vacant or underutilized properties.
| ITEM 3. | LEGAL PROCEEDINGS |
In January 2005, we were named as one of many defendants in The Consumers’ Association of Canada and Bruce Cran v. Coca-Cola Bottling Ltd. Et al., a class action suit alleging the unauthorized use by the defendants of container deposits and the imposition of recycling fees on consumers. On June 2, 2006, the British Columbia Supreme Court granted the summary trial application, which resulted in the dismissal of the plaintiffs’ action against us and the other defendants. On June 26, 2006, the plaintiffs appealed the dismissal of the action to the British Columbia Court of Appeals which was denied, and an appeal to the Supreme Court of Canada was rejected on December 20, 2007. In February 2005, similar class action claims were filed in a number of other Canadian provinces. Claims filed in Quebec have since been discontinued, but it is unclear how the dismissal of the British Columbia case will impact the other cases.
We are subject to various claims and legal proceedings with respect to matters such as governmental regulations, income taxes, and other actions arising out of the normal course of business. Management believes that the resolution of these matters will not have a material adverse effect on our financial position or results from operations.
| ITEM 4. | RESERVED |
22
Table of Contents
SUPPLEMENTAL ITEM PART I. EXECUTIVE OFFICERS OF THE REGISTRANT
The following is a list of names, ages, offices and backgrounds of all of our executive officers as of March 14, 2011. Our officers do not serve for a set term.
| Office |
Age | |||||
| Jerry Fowden |
Chief Executive Officer | 54 | ||||
| Neal Cravens |
Chief Financial Officer | 58 | ||||
| Michael Creamer |
Vice President—Human Resources | 54 | ||||
| Gregory Leiter |
Senior Vice President, Chief Accounting Officer and Assistant Secretary | 53 | ||||
| William Reis |
Senior Vice President, Chief Procurement Officer | 55 | ||||
| Marni Morgan Poe |
Vice President, General Counsel and Secretary | 41 | ||||
| Michael Gibbons |
President—U.S. Business Unit | 52 | ||||
| • | Jerry Fowden was appointed Chief Executive Officer on February 18, 2009. Prior to this appointment, he served as President of our international operating segments and Interim President, North America from May 2008 to February 2009, and as Interim President of our United Kingdom operating segment from September 2007 to May 2008. He served as Chief Executive Officer of Trader Media Group Ltd., a media company, and as a member of its parent Guardian Media Group plc’s Board of Directors from 2005 until 2007. From 2001 until 2004, he served in a variety of roles with AB InBev S.A. Belgium, an alcoholic beverage company, including President, European Zone, Western, Central and Eastern Europe from 2003 to 2004, Global Chief Operating Officer from 2002 to 2003 and Chief Executive Officer of Bass Brewers Ltd., a subsidiary of AB InBev S.A. Belgium, from 2001 to 2002. Mr. Fowden was a director of Chesapeake Corporation (now known as Canal Corporation) when it filed a voluntary Chapter 11 petition in the United States on December 29, 2008. On May 12, 2009, Chesapeake’s operating businesses were sold to a group of investors and Mr. Fowden resigned from his position as a director. Mr. Fowden currently serves on the board of directors of Constellation Brands, Inc., a premium wine company. Mr. Fowden has served on our board since March 2009. |
| • | Neal Cravens was appointed Chief Financial Officer on August 20, 2009, effective September 8, 2009. Mr. Cravens spent approximately 20 years with Seagram Company, Ltd., the beverage, consumer products, and media entertainment company, where he served as Vice President, Planning, Mergers and Acquisitions, Senior Vice President, Finance and Chief Accounting Officer, and Executive Vice President and Chief Financial Officer at the divisional level. In 2004, Mr. Cravens joined Warner Music Group as Senior Vice President Finance. He then served in the Chief Financial Officer role for Almatis GmbH, a global chemical company, during 2006, and Advantage Sales & Marketing, a consumer products broker, from 2007 to 2008. Immediately prior to joining the Company, Mr. Cravens was a financial consultant to FM Facility Maintenance, a facilities maintenance company formerly known as Integrated Process Technologies. |
| • | Michael Creamer was appointed Vice President of Human Resources for International and Tampa, Florida in April 2007 and promoted to Vice President of Human Resources for Cott in August 2008. Mr. Creamer currently serves as our Corporate Human Resources Vice President. Prior to joining Cott, Mr. Creamer was Senior Director of Human Resource Operations and International for Avanade Corporation, a global IT consultancy formed as a joint venture between Accenture and Microsoft Corporation. From 1990 to 2004, Mr. Creamer held several positions within Microsoft, including senior global human resources positions. |
| • | Gregory Leiter was appointed Vice President, Corporate Controller and Assistant Secretary of Cott in November 2007, and appointed Senior Vice President and Controller in April 2008. Mr. Leiter took on the additional role of Chief Accounting Officer in January 2010. Mr. Leiter currently serves as our Senior Vice President, Chief Accounting Officer and Assistant Secretary. Prior to joining Cott, he served from October 2006 to October 2007 as Practice Manager—Governance, Risk & Compliance |
23
Table of Contents
| with the international software firm SAP America. From January 2003 to September 2006, he held two positions with Graham Packaging Company, an international manufacturer of custom blow-molded plastic containers. From February 2006 to September 2006, he served as Graham Packaging’s Vice President—Global Business Process and from January 2003 to February 2006, he served as Director of Internal Audit. |
| • | William Reis was appointed Senior Vice President, Chief Procurement Officer in March 2007. Prior to joining Cott, he served from February 2004 to February 2007 as Senior Vice President and Chief Procurement Officer for Revlon. From February 2001 to February 2004, he served as Vice President of Global Procurement for Goldman Sachs. |
| • | Marni Morgan Poe was appointed Vice President, General Counsel and Secretary in February 2010. Prior to her appointment, she served as Corporate Counsel of the Company from September 2008 until her appointment. Prior to joining the Company, Ms. Poe was the co-founder and Chief Executive Officer of Let’s Eat Dinner, Inc., a franchisor of dinner preparation kitchens, from 2006 to 2008. From 2000 to 2006, she was a partner at the law firm of Holland & Knight LLP and an associate of the law firm from 1995 to 2000. |
| • | Mike Gibbons was appointed President of Cott’s U.S. business unit in October 2010. Prior to his appointment, Mr. Gibbons held several positions with Cott from 2004 to 2010, including General Manager of Cott’s U.S. business unit, Senior Vice President / General Manager of Cott’s Canadian business unit, and Vice President of Sales of Cott’s Canadian business unit. Prior to joining Cott, he served as Director of Sales for ConAgra. |
24
Table of Contents
| ITEM 5. | MARKET FOR THE REGISTRANT’S COMMON EQUITY AND RELATED SHAREOWNER MATTERS |
Our common shares are listed on the TSX under the ticker symbol “BCB,” and on the NYSE under the ticker symbol “COT.”
The tables below show the high and low reported per share sales prices of common shares on the TSX (in Canadian dollars) and the NYSE (in U.S. dollars) for the indicated periods for 2010 and 2009.
Toronto Stock Exchange (C$)
| 2010 | 2009 | |||||||||||||||
| High | Low | High | Low | |||||||||||||
| First Quarter |
$ | 8.98 | $ | 6.92 | $ | 1.88 | $ | 0.85 | ||||||||
| Second Quarter |
$ | 8.89 | $ | 5.94 | $ | 7.37 | $ | 1.08 | ||||||||
| Third Quarter |
$ | 8.60 | $ | 5.66 | $ | 8.96 | $ | 5.51 | ||||||||
| Fourth Quarter |
$ | 9.00 | $ | 7.46 | $ | 10.00 | $ | 7.26 | ||||||||
New York Stock Exchange (U.S.$)
| 2010 | 2009 | |||||||||||||||
| High | Low | High | Low | |||||||||||||
| First Quarter |
$ | 8.65 | $ | 6.72 | $ | 1.59 | $ | 0.65 | ||||||||
| Second Quarter |
$ | 8.88 | $ | 5.58 | $ | 6.80 | $ | 0.87 | ||||||||
| Third Quarter |
$ | 8.42 | $ | 5.41 | $ | 8.26 | $ | 5.19 | ||||||||
| Fourth Quarter |
$ | 9.08 | $ | 7.35 | $ | 9.39 | $ | 6.67 | ||||||||
As of March 8, 2011, we had 1,118 shareowners of record. This number was determined from records maintained by our transfer agent and it does not include beneficial owners of securities whose securities are held in the names of various dealers or clearing agencies. The closing sale price of our common shares on March 8, 2011 was C$8.40 on the TSX and $8.68 on the NYSE.
We have not paid cash dividends since June 1998, and do not intend to change that practice at this time. There are certain restrictions on the payment of dividends under our ABL facility, the indenture governing the 2017 Notes and the indenture governing the 2018 Notes. The ABL facility, the indenture governing the 2017 Notes and the indenture governing the 2018 Notes are discussed in “Management’s Discussion and Analysis of Financial Condition and Results of Operations” beginning on page 29.
If we pay dividends to shareowners who are non-residents of Canada, those dividends will generally be subject to Canadian withholding tax. Under current Canadian tax law, dividends paid by a Canadian corporation to a nonresident shareowner are generally subject to Canadian withholding tax at a 25% rate. Under the current tax treaty between Canada and the U.S., U.S. residents who are entitled to treaty benefits are generally eligible for a reduction in this withholding tax rate to 15% (and to 5% for a shareowner that is a corporation and is the beneficial owner of at least 10% of our voting stock). Accordingly, under current tax law, our U.S. resident shareowners who are entitled to treaty benefits will generally be subject to a Canadian withholding tax at a 15% rate on dividends paid by us, provided that they have complied with applicable procedural requirements to claim the benefit of the reduced rate under the tax treaty. The fifth protocol to the tax treaty between Canada and the U.S. places additional restrictions on the ability of U.S. residents to claim these reduced rate benefits. U.S. residents generally will be entitled on their U.S. federal income tax returns to claim a foreign tax credit, or a
25
Table of Contents
deduction, for Canadian withholding tax that applies to them, subject to certain applicable limitations. U.S. investors should consult their tax advisors with respect to the tax consequences and requirements applicable to them, based on their individual circumstances.
For information on securities authorized for issuance under our equity compensation plans, see Item 12, “Security Ownership of Certain Beneficial Owners and Management and Related Shareowner Matters.”
During 2008, 2009 and 2010, no equity securities of the Company were sold by the Company that were not registered under the Securities Act of 1933, as amended.
Calculation of aggregate market value of non-affiliate shares
For purposes of calculating the aggregate market value of common shares held by non-affiliates as shown on the cover page of this report, it was assumed that all of the outstanding shares were held by non-affiliates except for outstanding shares held or controlled by our directors and executive officers. This should not be deemed to constitute an admission that any of these persons are, in fact, affiliates of us, or that there are not other persons who may be deemed to be affiliates. For further information concerning shareholdings of officers, directors and principal stockholders see Item 12, “Security Ownership of Certain Beneficial Owners and Management and Related Shareowner Matters.”
Shareowner return performance graph
The following graph shows changes over our past five fiscal years in the value of C$100, assuming reinvestment of dividends, invested in: (i) our common shares; (ii) the Toronto Stock Exchange’s S&P/TSX Composite Index; and (iii) a peer group of publicly-traded companies in the bottling industry comprised of Coca-Cola Enterprises Inc., Coca-Cola Bottling Co. Consolidated, National Beverage Corp., Pepsi Bottling Group Inc. and PepsiAmericas Inc. The closing price of Cott’s common shares as of January 1, 2011 on the TSX was C$8.95 and on the NYSE was $9.01. The following table is in Canadian dollars.
COMPARISON OF CUMULATIVE TOTAL RETURN
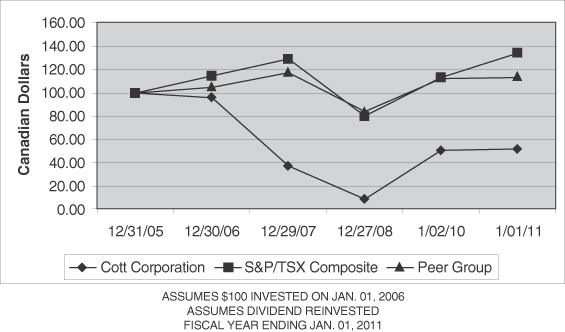
| Company/Market/Peer Group |
12/31/2005 | 12/30/2006 | 12/29/2007 | 12/27/2008 | 1/2/2010 | 1/1/2011 | ||||||||||||||||||
| Cott Corporation |
$ | 100.00 | $ | 96.98 | $ | 38.21 | $ | 8.53 | $ | 50.06 | $ | 52.14 | ||||||||||||
| S&P/TSX Composite |
$ | 100.00 | $ | 117.26 | $ | 128.68 | $ | 79.66 | $ | 116.53 | $ | 137.05 | ||||||||||||
| Peer Group |
$ | 100.00 | $ | 107.46 | $ | 119.03 | $ | 81.52 | $ | 116.15 | $ | 116.94 | ||||||||||||
26
Table of Contents
| ITEM 6. | SELECTED FINANCIAL DATA |
The following selected financial data reflects the results of operations. This information should be read in conjunction with, and is qualified by reference to “Management’s Discussion and Analysis of Financial Condition and Results of Operations” and the consolidated financial statements and notes thereto included elsewhere in this report. The financial information presented may not be indicative of future performance.
| (in millions of U.S. dollars, except per share amounts) |
January 1, 2011 1 |
January 2, 2010 |
December 27, 2008 |
December 29, 2007 2 |
December 30, 2006 3 |
|||||||||||||||
| (52 weeks) | (53 weeks) | (52 weeks) | (52 weeks) | (52 weeks) | ||||||||||||||||
| Revenue |
$ | 1,803.3 | $ | 1,596.7 | $ | 1,648.1 | $ | 1,776.4 | $ | 1,771.8 | ||||||||||
| Cost of sales |
1,537.0 | 1,346.9 | 1,467.1 | 1,578.0 | 1,554.9 | |||||||||||||||
| Gross Profit |
266.3 | 249.8 | 181.0 | 198.4 | 216.9 | |||||||||||||||
| Selling, general and administrative expenses |
166.7 | 146.8 | 179.8 | 161.9 | 176.1 | |||||||||||||||
| Loss on disposal of property, plant and equipment |
1.1 | 0.5 | 1.3 | 0.2 | — | |||||||||||||||
| Restructuring, goodwill and asset impairments and other charges: |
||||||||||||||||||||
| Restructuring |
(0.5 | ) | 1.5 | 6.7 | 24.3 | 20.5 | ||||||||||||||
| Goodwill impairments |
— | — | 69.2 | 55.8 | — | |||||||||||||||
| Asset impairments |
— | 3.6 | 37.0 | 10.7 | 15.4 | |||||||||||||||
| Other charges |
— | — | — | — | 2.6 | |||||||||||||||
| Operating income (loss) |
99.0 | 97.4 | (113.0 | ) | (54.5 | ) | 2.3 | |||||||||||||
| Contingent consideration earn-out adjustment |
(20.3 | ) | — | — | — | — | ||||||||||||||
| Other expense (income), net |
4.0 | 4.4 | (4.7 | ) | (4.7 | ) | 0.1 | |||||||||||||
| Interest expense, net |
36.9 | 29.7 | 32.3 | 32.8 | 32.2 | |||||||||||||||
| Income (loss) before income taxes |
78.4 | 63.3 | (140.6 | ) | (82.6 | ) | (30.0 | ) | ||||||||||||
| Income tax expense (benefit) |
18.6 | (22.8 | ) | (19.5 | ) | (13.9 | ) | (16.3 | ) | |||||||||||
| Net income (loss) |
$ | 59.8 | $ | 86.1 | $ | (121.1 | ) | $ | (68.7 | ) | $ | (13.7 | ) | |||||||
| Less: Net income attributable to non-controlling interests |
5.1 | 4.6 | 1.7 | 2.7 | 3.8 | |||||||||||||||
| Net income (loss) attributed to Cott Corporation |
$ | 54.7 | $ | 81.5 | $ | (122.8 | ) | $ | (71.4 | ) | $ | (17.5 | ) | |||||||
| Net income (loss) per common share |
||||||||||||||||||||
| Basic |
$ | 0.64 | $ | 1.10 | $ | (1.73 | ) | $ | (0.99 | ) | $ | (0.24 | ) | |||||||
| Diluted |
$ | 0.63 | $ | 1.08 | $ | (1.73 | ) | $ | (0.99 | ) | $ | (0.24 | ) | |||||||
| Financial Condition |
||||||||||||||||||||
| Total assets |
$ | 1,529.2 | $ | 873.8 | $ | 873.1 | $ | 1,144.4 | $ | 1,140.7 | ||||||||||
| Short-term borrowings |
7.9 | 20.2 | 107.5 | 137.0 | 107.7 | |||||||||||||||
| Current maturities of long-term debt |
6.0 | 17.6 | 7.6 | 2.4 | 2.0 | |||||||||||||||
| Long-term debt |
605.5 | 233.2 | 294.4 | 269.0 | 275.2 | |||||||||||||||
| Equity |
535.2 | 401.3 | 246.5 | 451.8 | 509.6 | |||||||||||||||
| Cash dividends paid |
— | — | — | — | — | |||||||||||||||
| 1 | In 2010, we completed the acquisition of substantially all of the assets and liabilities of Cliffstar Corporation, a privately-held corporation, and its affiliated companies for approximately $500.0 million in cash, subject to adjustments for working capital, indebtedness and certain expenses. Cliffstar is entitled to additional contingent consideration of up to a maximum of $55.0 million; the first $15.0 million of which is payable upon the achievement of milestones in upgrading certain expansion projects in 2010, and the remainder of which is based on the achievement of certain performance measures during the fiscal year ending January 1, 2011. Cliffstar is also entitled to $14.0 million of deferred consideration, which will be paid over a three-year period. |
27
Table of Contents
| 2 | During 2007, we acquired 100% of the business assets of El Riego, a Mexican water bottler, for $2.2 million. Effective December 31, 2006, we adopted the provisions related to uncertain tax positions in Accounting Standards Codification (“ASC”) No. 740, “Income Taxes,” and recorded an $8.8 million charge to our shareowners equity as of the first day of the year ended December 29, 2007. |
| 3 | There were no acquisitions during 2006. During 2006 we adopted ASC No. 718-10, “Stock Compensation,” using the modified prospective approach and therefore have not restated results for prior periods. This change resulted in the recognition of $11.4 million in share-based compensation expense, $8.4 million net of tax or $0.12 per basic and diluted share. |
28
Table of Contents
| ITEM 7. | MANAGEMENT’S DISCUSSION AND ANALYSIS OF FINANCIAL CONDITION AND RESULTS OF OPERATIONS |
Overview
We are the world’s largest retailer brand beverage company. Our objective of creating sustainable long-term growth in revenue and profitability is predicated on working closely with our retailer partners to provide proven profitable products. As a “fast follower” of innovative products, our goal is to identify which new products are succeeding in the marketplace and develop similar private label products to provide our retail partners and their consumers with high quality products at a better value. This objective is increasingly relevant in more difficult economic times.
The beverage market is subject to some seasonal variations. Our beverage sales are generally higher during the warmer months and also can be influenced by the timing of holidays, and weather fluctuations. This seasonality also causes our working capital needs to fluctuate with inventory being higher in the first half of the year to meet the peak summer demand and accounts receivable declining in the fall as customers pay their higher-than-average outstanding balances from the summer deliveries.
Retailer brand suppliers, such as us, typically operate at low margins and therefore relatively small changes in cost structures can materially impact results. In 2009 and 2010, industry carbonated soft drink (“CSD”) sales continued to decline, and ingredient and packaging costs remained volatile.
Ingredient and packaging costs represent a significant portion of our cost of sales. These costs are subject to global and regional commodity price trends. Our three largest commodities are aluminum, polyethylene terephthalate (“PET”) resin, and corn. We attempt to manage our exposure to fluctuations in ingredient and packaging costs of our products by implementing price increases as needed and entering into fixed price commitments for a portion of our ingredient and packaging requirements. In 2010, we entered into fixed price commitments for a majority of our forecasted aluminum requirements for 2010 as well as more than half of our requirements for 2011.
On August 17, 2010 (the “Acquisition Date”), we completed the acquisition of substantially all of the assets and liabilities of Cliffstar Corporation (“Cliffstar”) and its affiliated companies for approximately $500.0 million payable in cash, $14.0 million in deferred consideration to be paid over three years and contingent consideration of up to $55.0 million, the first $15.0 million of which is payable upon the achievement of milestones in upgrading of certain expansion projects in 2010, and the remainder of which is based on the achievement of certain performance measures during the fiscal year ending January 1, 2011 (the “Cliffstar Acquisition”).
The Cliffstar Acquisition was financed through the closing of a private placement offering by Cott Beverages Inc. of $375.0 million aggregate principal amount of 8.125% senior notes due 2018 (the “2018 Notes”), the underwritten public offering of 13.4 million of our common shares (the “Equity Offering”) and borrowings under our asset based lending (“ABL”) facility, which we refinanced in connection with the Cliffstar Acquisition, to increase the amount available for borrowings to $275.0 million.
Our financial liquidity, as of January 1, 2011, improved due to the reduction of outstanding borrowings under our ABL facility to $7.9 million, leaving $248.1 million of availability under the facility.
In the U.S., we have been supplying Wal-Mart with private label CSDs under an exclusive supply agreement dated December 21, 1998, between our wholly-owned subsidiary Cott Beverages Inc., and Wal-Mart Stores, Inc. (the “Exclusive U.S. Supply Contract”). We also supply Wal-Mart and its affiliated companies with a variety of products on a non-exclusive basis in the U.S., Canada, United Kingdom and Mexico, including CSDs, juice, clear, still and sparkling flavored waters, juice-based products, bottled water, energy drinks and ready-to-drink teas. On January 27, 2009, we received written notice from Wal-Mart stating that Wal-Mart was exercising its right to terminate, without cause, the Exclusive U.S. Supply Contract. The termination is effective on January 28, 2012. This has the effect of returning our relationship to more typical market terms over time, and allows Wal-Mart to introduce other suppliers in the future, if it so desires. The termination provision of the
29
Table of Contents
Exclusive U.S. Supply Contract provides for our exclusive right to supply CSDs to Wal-Mart in the U.S. to be phased out over a period of three years following notice of termination (the “Notice Period”). Accordingly, we had the exclusive right to supply at least two-thirds of Wal-Mart’s total CSD volumes in the U.S. during the first 12 months of the Notice Period, and we had the exclusive right to supply at least one-third of Wal-Mart’s total CSD volumes in the U.S. during the second 12 months of the Notice Period. During the final 12 months of the Notice Period, there is no minimum supply requirement. Notwithstanding the notice of termination of the Exclusive U.S. Supply Contract, we continue to supply Wal-Mart with all of its private label CSDs in the U.S. However, should Wal-Mart choose to introduce an additional supplier to fulfill a portion of its requirements for its private label CSDs, our operating results could be materially adversely affected. Sales to Wal-Mart in 2010, 2009 and 2008, accounted for 31.0%, 33.5% and 35.8% respectively, of total revenue.
Recent Developments
On August 17, 2010, we completed the Cliffstar Acquisition for approximately $500.0 million in cash, subject to adjustments for working capital, indebtedness and certain expenses. Cliffstar is entitled to additional contingent consideration of up to a maximum of $55.0 million; the first $15.0 million of which is payable upon the achievement of milestones in upgrading certain expansion projects in 2010, and the remainder of which is based on the achievement of certain performance measures during the fiscal year ending January 1, 2011. Cliffstar is also entitled to $14.0 million of deferred consideration, which will be paid over a three-year period.
Summary financial results
Our net income in 2010 was $54.7 million or $0.63 per diluted share, compared with net income of $81.5 million or $1.08 per diluted share in 2009.
The following items of significance impacted our 2010 financial results:
| • | the Cliffstar Acquisition contributed $232.2 million to revenue, and $5.2 million to operating income; |
| • | the transaction costs related to the Cliffstar Acquisition were $7.2 million and integration costs were $6.1 million, which are included in selling, general and administrative (“SG&A”); |
| • | gross profit declined to 14.8% in 2010 from 15.6% in 2009. Gross profit in 2010 included $12.0 million of Cliffstar related purchase accounting adjustments. Excluding these adjustments, gross profit was 15.4%; |
| • | our revenue increased 12.9% in 2010 compared to 2009. Absent foreign exchange impact, revenue increased 12.2% in 2010, primarily due to the Cliffstar Acquisition; |
| • | our filled beverage 8-ounce equivalents (“beverage case volume”) increased 7.3% driven by a 7.7% increase in the North America operating segment, primarily due to the Cliffstar Acquisition; |
| • | the interest expense increased 24.2% due to the issuance of the 2018 Notes; |
| • | the income tax expense changed from a benefit of $22.8 million in 2009 to an expense of $18.6 million in 2010 due primarily to the fact that the prior year included the utilization of valuation allowances and the utilization of accruals related to uncertain tax positions; and |
| • | our 2010 results were favorably impacted by the reduction of the contingent consideration earn-out accrual of $20.3 million related to the Cliffstar Acquisition. |
The following items of significance impacted our 2009 financial results:
| • | improved gross profit as a percentage of sales of 15.6% in 2009 from 11.0% in 2008, reflecting the benefit of local currency price increases, improved product mix and lower ingredient and packaging costs; |
| • | our revenue declined 3.1% in 2009 compared to 2008. Excluding foreign exchange impact, revenue increased 2.4% in 2009; |
30
Table of Contents
| • | the consumer shift toward retailer brand products as a result of weak economic conditions; |
| • | a slight decrease in filled beverage case volume reflecting a 1.2% decrease in our North America operating segment which was partially offset by a 2.0% increase in our U.K. operating segment; |
| • | the SG&A cost saving initiatives that resulted in an SG&A decrease of $33.0 million; |
| • | the weakening value in the Canadian dollar, pound sterling and Mexican peso each relative to the U.S. dollar resulted in a $88.1 million adverse impact on revenues, a $12.0 million adverse impact on gross profit and a $8.0 million positive impact on SG&A; |
| • | the restructuring, severance and lease termination costs of $1.5 million in connection with the plan implemented in 2009 that resulted in a further reduction of our workforce in 2009 (the “2009 Restructuring Plan”) and asset impairment costs of $3.6 million relating primarily to the loss of a customer; |
| • | a loss on the buyback of our senior unsecured notes due in 2011 (the “2011 Notes”) of $3.3 million; |
| • | a tax benefit resulting primarily from the reversal of accruals relating to uncertain tax positions, plus interest and penalties, which generated a $17.5 million benefit and a $25.0 million income tax benefit resulting from the reversal of U.S. valuation allowances. These valuation allowance reversals were caused by the carryback of net operating losses in the U.S. due to recent changes in tax law and the utilization in the current year of U.S. deferred tax assets with valuation allowances. These benefits were partially offset by $19.7 million of income tax expense resulting mostly from current year earnings; and |
| • | an extra week in fiscal 2009 that is estimated to have contributed 9.1 million additional beverage cases, $20.3 million of additional revenue and $1.3 million of additional operating income. |
The following items of significance impacted our 2008 financial results:
| • | a goodwill impairment of $69.2 million arising from lower anticipated operating cash flows related to our United Kingdom reporting unit; |
| • | an asset impairment of $35.4 million for the Rights as defined below (which are associated with the rights to manufacture concentrate formulas, with all the related inventions, processes and technical expertise, recorded as an intangible assets at the cost of acquisition, including the RC brand outside of North America and Mexico) arising from the downward trend of estimated concentrate production; |
| • | the highly competitive environment and continued volume decline in all operating segments; |
| • | a decline in revenue attributable to Wal-Mart of 15.4% in the U.S. reporting unit; |
| • | the executive transition costs of $6.8 million (including $1.9 million of non-cash stock compensation expense); |
| • | the restructuring severance and lease termination costs of $6.7 million in connection with our restructuring initiatives; |
| • | an increase in SG&A costs associated with expiring trademarks, amortization of software costs, $4.5 million of previously capitalized software costs and bad debt expense; |
| • | the decline in the foreign exchange rate compared to the U.S. dollar for the Canadian dollar, pound sterling and Mexican peso that resulted in a $27.6 million adverse impact on revenues; |
| • | the accelerated depreciation of $1.5 million resulting from Wal-Mart’s decision to remove certain of our vending machines from Wal-Mart stores along with $0.9 million of asset removal costs; and |
| • | a lower effective income tax rate resulting from a write down of United Kingdom reporting unit goodwill with no tax relief and a valuation allowance on U.S. and Mexico deferred income tax assets, offset in part by a settlement of certain tax matters under audit. |
31
Table of Contents
Critical accounting policies
Our critical accounting policies require management to make estimates and assumptions that affect the reported amounts in the consolidated financial statements and the accompanying notes. These estimates are based on historical experience, the advice of external experts or on other assumptions management believes to be reasonable. Where actual amounts differ from estimates, revisions are included in the results for the period in which actuals become known. Historically, differences between estimates and actuals have not had a significant impact on our consolidated financial statements.
Critical accounting policies and estimates used to prepare the financial statements are discussed with our Audit Committee as they are implemented and include the following:
Impairment testing of goodwill
Goodwill represents the excess purchase price of acquired businesses over the fair value of the net assets acquired. Goodwill is not amortized, but instead is tested at least annually for impairment in the fourth quarter or more frequently if we determine a triggering event has occurred during the year. Any impairment loss is recognized in our results of operations. We evaluate goodwill for impairment on a reporting unit basis. Reporting units are operations for which discrete financial information is available, and are at or one level below our operating segments. The evaluation of goodwill for each reporting unit is based upon the following approach. We compare the fair value of a reporting unit to its carrying amount. Where the carrying amount is greater than the fair value, the implied fair value of the reporting unit goodwill is determined by allocating the fair value of the reporting unit to all the assets and liabilities of the reporting unit with any of the remainder being allocated to goodwill. The implied fair value of the reporting unit goodwill is then compared to the carrying amount of that goodwill to determine the impairment loss. Any impairment in value is recognized in net income (loss). We had goodwill of $130.2 million on our balance sheet at January 1, 2011, which represents amounts for the U.S. and Canada reporting units and the RCI operating segment.
We measure the fair value of reporting units using a mix of the income approach (which is based on the discounted cash flow of the reporting unit) and the public company approach. We use a combination of the two approaches which we believe provides a more accurate valuation because it incorporates the actual cash generation of the company in addition to how a third party market participant would value the reporting unit. Because the business is assumed to continue in perpetuity, the discounted future cash flow includes a terminal value. We used a weighted average terminal growth rate of 2% for our Canada reporting unit in 2010 and 2009, respectively, and 2% and 0% for our RCI reporting unit in 2010 and 2009, respectively. The long-term growth assumptions incorporated into the discounted cash flow calculation reflect our long-term view of the market (including a decline in CSD demand), projected changes in the sale of our products, pricing of such products and operating profit margins. The estimated revenue changes in this analysis for the Canada reporting unit and RCI reporting unit ranged between -7.9% and 7.2% for 2010 and between -0.3% and 10.8% for 2009.
The discount rate used for the fair value estimates was 10% for 2010 and 11% for 2009. This rate was based on the weighted average cost of capital a market participant would use if evaluating the reporting unit as an investment. The risk-free rate for 2010 was 4.1% and is based on a 20-year U.S. Treasury Bill as of the valuation date.
All goodwill in the U.S. reporting unit is attributable to the Cliffstar Acquisition.
Each year during the fourth quarter, we re-evaluate the assumptions used to reflect changes in the business environment, such as revenue growth rates, operating profit margins and discount rate. Based on the evaluation performed this year utilizing the assumptions above, we determined that the fair value of each of our reporting units exceeded their carrying amount and as a result further impairment testing was not required. We analyzed the sensitivity these assumptions have on our overall impairment assessment and note that as of the January 1, 2011 annual assessment, the fair value for each of these reporting units was substantially in excess of its carrying value.
32
Table of Contents
We determined that as of September 27, 2008, our United Kingdom reporting unit’s goodwill was impaired based on our estimate of its fair value. This impairment analysis was triggered due to cumulative declines in our cash flows in the United Kingdom, which was lower than the forecast used to value this asset in our 2007 impairment analysis. This decrease in cash flow was partly the result of lower than anticipated volumes and the adverse impact of rising commodities on our raw material costs. Allocating this fair value to the assets and liabilities to the United Kingdom reporting unit resulted in a $69.2 million goodwill impairment charge.
Impairment testing of intangible assets with an indefinite life
Our only intangible asset with an indefinite life relates to the 2001 acquisition of intellectual property from Royal Crown Company, Inc. including the right to manufacture our concentrates, with all related inventions, processes, technologies, technical and manufacturing information, know-how and the use of the Royal Crown brand outside of North America and Mexico (the “Rights”) which has a net book value of $45.0 million. Prior to 2001, we paid a volume based royalty to the Royal Crown Company for purchase of concentrates. There are no legal, regulatory, contractual, competitive, economic, or other factors that limit the useful life of this intangible.
The life of the Rights is considered to be indefinite and therefore not amortized, but instead is tested at least annually for impairment or more frequently if we determine a triggering event has occurred during the year. For an intangible asset with an indefinite life, we compare the carrying amount of the Rights to their fair value and where the carrying amount is greater than the fair value, we recognize in income an impairment loss. To determine fair value, we use a relief from royalty method which calculates a fair value royalty rate that is applied to a forecast of future volume shipments of concentrate to produce CSDs. The forecast of future volumes is based on the estimated inter-plant shipments and RCI shipments. The royalty relief method is used since the Rights were purchased in part to avoid making future royalty payments for concentrate to the Royal Crown Company. The resulting pro forma cash flows are discounted using the same assumptions discussed above for goodwill. No impairment was calculated for the year ended January 1, 2011. As of September 27, 2008, we recorded an asset impairment related to the Rights of $27.4 million, triggered primarily by the decline of our North America case volume (including reductions in volume with Wal-Mart) and lower anticipated overseas concentrate volume in our RCI operating segment. We incurred an additional $8.0 million asset impairment as of December 27, 2008 to reflect additional anticipated volume declines in our RCI operating segment for a total impairment of $35.4 million. Absent any other changes, if our inter-plant concentrate volume declines by 1.0% from our estimated volume, the value of our Rights would decline by approximately $0.9 million. If our RCI volume declines by 1.0% from our estimated volume, the value of the Rights would decline by approximately $1.9 million. If our discounted borrowing rate increases by 100 basis points, the value of the Rights would decline by approximately $3.2 million.
Other intangible assets
As of January 1, 2011, other intangible assets were $326.1 million, which consisted principally of $274.5 million of customer relationships that arise from acquisitions. Customer relationships are amortized on a straight-line basis for the period over which we expect to receive economic benefits. We review the estimated useful life of these intangible assets annually, taking into consideration the specific net cash flows related to the intangible asset, unless a review is required more frequently due to a triggering event such as the loss of a customer. The permanent loss or significant decline in sales to any customer included in the intangible asset would result in
33
Table of Contents
impairment in the value of the intangible asset or accelerated amortization and could lead to an impairment of fixed assets that were used to service that customer. In 2010, we recorded $216.9 million of customer relationships acquired in connection with the Cliffstar Acquisition. In 2009, we recorded a $3.5 million customer relationship impairment charge for the loss of a customer.
Impairment of long-lived assets
When adverse events occur, we compare the carrying amount of long-lived assets to the estimated undiscounted future cash flows at the lowest level of independent cash flows for the group of long-lived assets and recognize any impairment loss in the Consolidated Statements of Operations, taking into consideration the timing of testing and the asset’s remaining useful life. The expected life and value of these long-lived assets is based on an evaluation of the competitive environment, history and future prospects as appropriate. We did not record any impairments of long-lived assets in 2010 or 2009. In 2008, we recorded impairment losses totaling $1.6 million for both the Elizabethtown, Kentucky facility and certain hot-filled production assets that were held-for-sale.
Inventory costs
Inventories are stated at the lower of cost, determined on the first-in, first-out method, or net realizable value. Finished goods and work-in-process include the cost of raw materials, direct labor and manufacturing overhead costs. As a result, we use an inventory reserve to adjust our costs down to a net realizable value and to reserve for estimated obsolescence of both raw and finished goods. Our accounting policy for the inventory reserve requires us to reserve an amount based on the evaluation of the aging of inventory and a detailed analysis of finished goods for high-risk customers.
Income taxes
Our income tax expense, deferred tax assets and liabilities and reserves for unrecognized tax benefits reflect management’s best assessment of estimated future taxes to be paid. We are subject to income taxes in Canada as well as in numerous foreign jurisdictions. Significant judgments and estimates are required in determining the consolidated income tax expense.
Deferred income taxes arise from temporary differences between the tax and financial statement recognition of revenue and expense. In evaluating our ability to recover our deferred tax assets within the jurisdiction from which they arise we consider all available positive and negative evidence, including scheduled reversals of deferred tax liabilities, projected future taxable income, tax planning strategies and recent financial operations. In projecting future taxable income, we begin with historical results adjusted for the results of discontinued operations and changes in accounting policies and incorporate assumptions including the amount of future Canadian and foreign pretax operating income, the reversal of temporary differences, and the implementation of feasible and prudent tax planning strategies. These assumptions require significant judgment about the forecasts of future taxable income and are consistent with the plans and estimates we are using to manage the underlying businesses.
Changes in tax laws and rates could also affect recorded deferred tax assets and liabilities in the future. Management is not aware of any such changes that would have a material effect on our results of operations, cash flows or financial position.
The calculation of our tax liabilities involves dealing with uncertainties in the application of complex tax laws and regulations in a multitude of jurisdictions across our global operations.
FASB ASC Topic 740, “Income Taxes” (“ASC 740”) provides that a tax benefit from an uncertain tax position may be recognized when it is more likely than not that the position will be sustained upon examination, including resolutions of any related appeals or litigation processes, based on the technical merits. ASC 740 also provides guidance on measurement, derecognition, classification, interest and penalties, accounting in interim periods, disclosure and transition.
34
Table of Contents
We recognize tax liabilities in accordance with ASC 740 and we adjust these liabilities when our judgment changes as a result of the evaluation of new information not previously available. Due to the complexity of some of these uncertainties, the ultimate resolution may result in a payment that is materially different from our current estimate of the tax liabilities. These differences will be reflected as increases or decreases to income tax expense in the period in which they are determined.
Pension Plans
We account for our pension plans in accordance with ASC No. 715-20, “Compensation—Defined Benefit Plans—General” (“ASC 715-20”). The funded status is the difference between the fair value of plan assets and the benefit obligation. The adjustment to accumulated other comprehensive income at adoption represents the net unrecognized actuarial gains or losses and unrecognized prior service costs. Future actuarial gains or losses that are not recognized as net periodic benefits cost in the same periods will be recognized as a component of other comprehensive income.
We maintain two defined-benefit plans that cover certain employees in the U.K. and certain other employees under a collective bargaining agreement at one plant in the U.S. We record annual amounts relating to these plans based on calculations specified by GAAP, which include various actuarial assumptions such as discount rates (5.4% to 5.7%) and assumed rates of return (6.9% to 7.0%) depending on the pension plan. Material changes in pension costs may occur in the future due to changes in these assumptions. Future annual amounts could be impacted by changes in the discount rate, changes in the expected long-term rate of return, changes in the level of contributions to the plans and other factors.
The discount rate is based on a model portfolio of AA rated bonds with a maturity matched to the estimated payouts of future pension benefits. The expected return on plan assets is based on our expectation of the long-term rates of return on each asset class based on the current asset mix of the funds, considering the historical returns earned on the type of assets in the funds, plus an assumption of future inflation. The current investment policy target asset allocation differs between our two plans, but it is between 50.0% to 70.0% for equities and 30.0% to 50.0% for bonds. The current inflation assumption is 3.7%. We review our actuarial assumptions on an annual basis and make modifications to the assumptions based on current rates and trends when appropriate. The effects of the modifications are amortized over future periods.
Recent Accounting Pronouncements—see Note 1 of the Consolidated Financial Statements.
Non-GAAP Measures
In this report, we supplement our reporting of revenue determined in accordance with GAAP by excluding the impact of foreign exchange to separate the impact of currency exchange rate changes from Cott’s results of operations and, in some cases, by excluding the impact of Cliffstar. Additionally, Cott supplements its reporting of selling, general and administrative expenses, cost of sales, and gross profit in accordance with GAAP by excluding the impact of the Cliffstar Acquisition. Cott supplements its reporting of gross margin in accordance with GAAP by excluding Cliffstar transaction-related amortization and purchase accounting adjustments. Cott excludes these items to separate the impact of these items from the underlying business. Because Cott uses these adjusted financial results in the management of its business and to understand business performance independent of the Cliffstar Acquisition, management believes this supplemental information is useful to investors for their independent evaluation and understanding of Cott’s core business performance and the performance of its management. The non-GAAP financial measures described above are in addition to, and not meant to be considered superior to, or a substitute for, Cott’s financial statements prepared in accordance with GAAP. In addition, the non-GAAP financial measures included in this report reflect management’s judgment of particular items, and may be different from, and therefore may not be comparable to, similarly titled measures reported by other companies.
35
Table of Contents
The following table summarizes our Consolidated Statements of Operations as a percentage of revenue for 2010, 2009 and 2008:
| 2010 | 2009 | 2008 | ||||||||||||||||||||||
| (in millions of U.S. dollars) |
Percent of Revenue |
Percent of Revenue |
Percent of Revenue |
|||||||||||||||||||||
| Revenue |
$ | 1,803.3 | 100.0 | % | $ | 1,596.7 | 100.0 | % | $ | 1,648.1 | 100.0 | % | ||||||||||||
| Cost of sales |
1,537.0 | 85.2 | % | 1,346.9 | 84.4 | % | 1,467.1 | 89.0 | % | |||||||||||||||
| Gross profit |
266.3 | 14.8 | % | 249.8 | 15.6 | % | 181.0 | 11.0 | % | |||||||||||||||
| Selling, general, and administrative expenses |
166.7 | 9.2 | % | 146.8 | 9.2 | % | 179.8 | 10.9 | % | |||||||||||||||
| Loss on disposal of property, plant and equipment |
1.1 | 0.1 | % | 0.5 | 0.0 | % | 1.3 | 0.1 | % | |||||||||||||||
| Restructuring |
(0.5 | ) | 0.0 | % | 1.5 | 0.1 | % | 6.7 | 0.4 | % | ||||||||||||||
| Goodwill impairments |
— | 0.0 | % | — | 0.0 | % | 69.2 | 4.3 | % | |||||||||||||||
| Asset impairment |
— | 0.0 | % | 3.6 | 0.2 | % | 37.0 | 2.2 | % | |||||||||||||||
| Operating income (loss) |
99.0 | 5.5 | % | 97.4 | 6.1 | % | (113.0 | ) | -6.9 | % | ||||||||||||||
| Contingent consideration earn-out adjustment |
(20.3 | ) | -1.1 | % | — | 0.0 | % | — | 0.0 | % | ||||||||||||||
| Other expense (income), net |
4.0 | 0.2 | % | 4.4 | 0.3 | % | (4.7 | ) | -0.3 | % | ||||||||||||||
| Interest expense, net |
36.9 | 2.0 | % | 29.7 | 1.9 | % | 32.3 | 2.0 | % | |||||||||||||||
| Income (loss) before income taxes |
78.4 | 4.4 | % | 63.3 | 3.9 | % | (140.6 | ) | -8.5 | % | ||||||||||||||
| Income tax expense (benefit) |
18.6 | 1.0 | % | (22.8 | ) | -1.4 | % | (19.5 | ) | -1.2 | % | |||||||||||||
| Net income (loss) |
59.8 | 3.4 | % | 86.1 | 5.3 | % | (121.1 | ) | -7.3 | % | ||||||||||||||
| Less: Net income attributable to non-controlling interests |
5.1 | 0.3 | % | 4.6 | 0.3 | % | 1.7 | 0.1 | % | |||||||||||||||
| Net income (loss) attributed to Cott Corporation |
$ | 54.7 | 3.1 | % | $ | 81.5 | 5.0 | % | $ | (122.8 | ) | -7.5 | % | |||||||||||
| Depreciation & amortization |
$ | 74.0 | 4.1 | % | $ | 66.2 | 4.1 | % | $ | 80.7 | 4.9 | % | ||||||||||||
The following table summarizes our revenue, operating income (loss) by operating segment for 2010, 2009 and 2008:
| (in millions of U.S. Dollars) |
2010 | 2009 | 2008 | |||||||||
| Revenue |
||||||||||||
| North America |
$ | 1,357.3 | $ | 1,173.9 | $ | 1,178.0 | ||||||
| United Kingdom |
367.1 | 359.3 | 385.3 | |||||||||
| Mexico |
50.1 | 42.7 | 61.9 | |||||||||
| RCI |
28.8 | 20.8 | 22.0 | |||||||||
| All Other |
— | — | 0.9 | |||||||||
| Total |
$ | 1,803.3 | $ | 1,596.7 | $ | 1,648.1 | ||||||
| Operating income (loss) |
||||||||||||
| North America |
$ | 75.0 | $ | 77.6 | $ | (56.3 | ) | |||||
| United Kingdom |
24.5 | 23.0 | (53.5 | ) | ||||||||
| Mexico |
(7.5 | ) | (7.1 | ) | (8.8 | ) | ||||||
| RCI |
7.0 | 3.9 | 8.1 | |||||||||
| All Other |
— | — | (2.5 | ) | ||||||||
| Total |
$ | 99.0 | $ | 97.4 | $ | (113.0 | ) | |||||
36
Table of Contents
The following table summarizes our beverage case volume by operating segment for 2010, 2009 and 2008:
| (in millions of cases) |
2010 | 2009 | 2008 | |||||||||
| Volume 8 oz. equivalent cases - Total Beverage (including concentrate) |
||||||||||||
| North America |
697.0 | 648.6 | 665.8 | |||||||||
| United Kingdom |
192.9 | 189.5 | 189.2 | |||||||||
| Mexico |
34.9 | 26.4 | 29.4 | |||||||||
| RCI |
298.6 | 220.1 | 233.4 | |||||||||
| All Other |
— | — | 0.7 | |||||||||
| Total |
1,223.4 | 1,084.6 | 1,118.5 | |||||||||
| Volume 8 oz. equivalent cases – Filled Beverage |
||||||||||||
| North America |
618.6 | 574.2 | 581.0 | |||||||||
| United Kingdom |
178.2 | 174.6 | 171.1 | |||||||||
| Mexico |
34.9 | 26.4 | 29.4 | |||||||||
| RCI |
0.1 | 0.2 | — | |||||||||
| All Other |
— | — | 0.7 | |||||||||
| Total |
831.8 | 775.4 | 782.2 | |||||||||
Revenues are attributed to operating segments based on the location of the plant.
The revenue by product tables for 2009 and 2008 have been revised to include the category “Juice” which is a significant portion of our revenue due to the Cliffstar Acquisition.
The following tables summarize revenue by product for 2010, 2009 and 2008:
| For the Year Ended January 1, 2011 | ||||||||||||||||||||
| (in millions of U.S. dollars) |
North America |
United Kingdom |
Mexico | RCI | Total | |||||||||||||||
| Revenue |
||||||||||||||||||||
| Carbonated soft drinks |
$ | 705.5 | $ | 147.1 | $ | 43.4 | $ | — | $ | 896.0 | ||||||||||
| Juice |
225.3 | 10.9 | 0.8 | — | 237.0 | |||||||||||||||
| Concentrate |
7.5 | 2.3 | — | 28.8 | 38.6 | |||||||||||||||
| All other products |
419.0 | 206.8 | 5.9 | — | 631.7 | |||||||||||||||
| Total |
$ | 1,357.3 | $ | 367.1 | $ | 50.1 | $ | 28.8 | $ | 1,803.3 | ||||||||||
| For the Year Ended January 1, 2011 | ||||||||||||||||||||
| (in millions of physical cases) |
North America |
United Kingdom |
Mexico | RCI | Total | |||||||||||||||
| 8oz. volume |
||||||||||||||||||||
| Carbonated soft drinks |
343.1 | 113.6 | 28.1 | — | 484.8 | |||||||||||||||
| Juice |
57.2 | 2.4 | 0.6 | — | 60.2 | |||||||||||||||
| Concentrate |
78.4 | 15.2 | — | 298.6 | 392.2 | |||||||||||||||
| All other products |
218.3 | 61.7 | 6.2 | — | 286.2 | |||||||||||||||
| Total |
697.0 | 192.9 | 34.9 | 298.6 | 1,223.4 | |||||||||||||||
37
Table of Contents
| For the Year Ended January 2, 2010 | ||||||||||||||||||||
| (in millions of U.S. dollars) |
North America |
United Kingdom |
Mexico | RCI | Total | |||||||||||||||
| Revenue |
||||||||||||||||||||
| Carbonated soft drinks |
$ | 760.0 | $ | 161.9 | $ | 36.4 | $ | — | $ | 958.3 | ||||||||||
| Concentrate |
6.5 | 4.6 | — | 19.7 | 30.8 | |||||||||||||||
| Juice |
— | 10.1 | 0.4 | — | 10.5 | |||||||||||||||
| All other products |
407.4 | 182.7 | 5.9 | 1.1 | 597.1 | |||||||||||||||
| Total |
$ | 1,173.9 | $ | 359.3 | $ | 42.7 | $ | 20.8 | $ | 1,596.7 | ||||||||||
| (in millions of physical cases) |
North America |
United Kingdom |
Mexico | RCI | Total | |||||||||||||||
| 8 oz. volume |
||||||||||||||||||||
| Carbonated soft drinks |
359.7 | 87.9 | 20.3 | — | 467.9 | |||||||||||||||
| Concentrate |
74.4 | 14.9 | — | 219.9 | 309.2 | |||||||||||||||
| Juice |
— | 4.3 | 0.4 | — | 4.7 | |||||||||||||||
| All other products |
214.5 | 82.4 | 5.7 | 0.2 | 302.8 | |||||||||||||||
| Total |
648.6 | 189.5 | 26.4 | 220.1 | 1,084.6 | |||||||||||||||
| For the Year Ended December 27, 2008 | ||||||||||||||||||||||||
| (in millions of U.S. dollars) |
North America |
United Kingdom |
Mexico | RCI | All Other | Total | ||||||||||||||||||
| Revenue |
||||||||||||||||||||||||
| Carbonated soft drinks |
$ | 748.7 | $ | 163.3 | $ | 59.2 | $ | — | $ | 0.9 | $ | 972.1 | ||||||||||||
| Concentrate |
5.5 | 7.2 | — | 22.0 | — | 34.7 | ||||||||||||||||||
| Juice |
— | 11.7 | — | — | — | 11.7 | ||||||||||||||||||
| All other products |
423.8 | 203.1 | 2.7 | — | — | 629.6 | ||||||||||||||||||
| Total |
$ | 1,178.0 | $ | 385.3 | $ | 61.9 | $ | 22.0 | $ | 0.9 | $ | 1,648.1 | ||||||||||||
| (in millions of physical cases) |
North America |
United Kingdom |
Mexico | RCI | All Other | Total | ||||||||||||||||||
| 8 ounce volume |
||||||||||||||||||||||||
| Carbonated soft drinks |
360.7 | 86.7 | 28.0 | — | 0.7 | 476.1 | ||||||||||||||||||
| Concentrate |
84.8 | 18.1 | — | 233.4 | — | 336.3 | ||||||||||||||||||
| Juice |
— | 4.2 | — | — | — | 4.2 | ||||||||||||||||||
| All other products |
220.3 | 80.2 | 1.4 | — | — | 301.9 | ||||||||||||||||||
| Total |
665.8 | 189.2 | 29.4 | 233.4 | 0.7 | 1,118.5 | ||||||||||||||||||
Results of operations
The following table summarizes the change in revenue by operating segment for 2010:
| For the Year Ended January 1, 2011 | ||||||||||||||||||||
| (in millions of U.S. dollars) |
Cott | North America |
United Kingdom |
Mexico | RCI | |||||||||||||||
| Change in revenue |
$ | 206.6 | $ | 183.4 | $ | 7.8 | $ | 7.4 | $ | 8.0 | ||||||||||
| Impact of foreign exchange 1 |
(11.8 | ) | (17.0 | ) | 8.0 | (2.8 | ) | — | ||||||||||||
| Change excluding foreign exchange |
$ | 194.8 | $ | 166.4 | $ | 15.8 | $ | 4.6 | $ | 8.0 | ||||||||||
| Percentage change in revenue |
12.9 | % | 15.6 | % | 2.2 | % | 17.3 | % | 38.5 | % | ||||||||||
| Percentage change in revenue excluding foreign exchange |
12.2 | % | 14.2 | % | 4.4 | % | 10.8 | % | 38.5 | % | ||||||||||
| Impact of Cliffstar Acquisition |
(232.2 | ) | (232.2 | ) | — | — | — | |||||||||||||
| Change excluding foreign exchange and Cliffstar Acquisition |
$ | (37.4 | ) | $ | (65.8 | ) | $ | 15.8 | $ | 4.6 | $ | 8.0 | ||||||||
| Percentage change in revenue excluding foreign exchange and Cliffstar Acquisition |
-2.3 | % | -5.6 | % | 4.4 | % | 10.8 | % | 38.5 | % | ||||||||||
38
Table of Contents
| 1 | Impact of foreign exchange is the difference between the current year’s revenue translated utilizing the current year’s average foreign exchange rates less the current year’s revenue translated utilizing the prior year’s average foreign exchange rates. |
The following table summarizes the change in revenue by operating segment for 2009:
| For the Year Ended January 2, 2010 | ||||||||||||||||||||||||
| (in million of U.S. dollars) |
Cott | North America |
United Kingdom |
Mexico | RCI | All Other |
||||||||||||||||||
| Change in revenue |
$ | (51.4 | ) | $ | (4.1 | ) | $ | (26.0 | ) | $ | (19.2 | ) | $ | (1.2 | ) | $ | (0.9 | ) | ||||||
| Impact of foreign exchange 1 |
88.1 | 14.5 | 62.2 | 11.5 | — | (0.1 | ) | |||||||||||||||||
| Change excluding foreign exchange |
$ | 36.7 | $ | 10.4 | $ | 36.2 | $ | (7.7 | ) | $ | (1.2 | ) | $ | (1.0 | ) | |||||||||
| Percentage change in revenue |
-3.1 | % | -0.3 | % | -6.7 | % | -31.0 | % | -5.5 | % | N/A | |||||||||||||
| Percentage change in revenue excluding foreign |
2.4 | % | 0.9 | % | 11.2 | % | -15.3 | % | -5.5 | % | N/A | |||||||||||||
| 1 | Impact of foreign exchange is the difference between the current year’s revenue translated utilizing the current year’s average foreign exchange rates less the current year’s revenue translated utilizing the prior year’s average foreign exchange rates. |
2010 versus 2009
Revenue increased $206.6 million, or 12.9% in 2010 from 2009. The Cliffstar Acquisition contributed $232.2 million to revenue. Excluding the impact of the Cliffstar Acquisition and foreign exchange, revenue decreased 2.3% primarily due to lower North America beverage case volume offset in part by improved beverage case volume in the U.K., Mexico and RCI.
2009 versus 2008
Revenue decreased 3.1% in 2009 from 2008, primarily due to lower North America beverage case volume offset in part by an improved product mix in the U.K. and higher local currency pricing in the U.S., Canada and the U.K. The weakening value in the Canadian dollar, the pound sterling and the Mexican peso, each relative to the U.S. dollar since December 27, 2008, had a collective $88.1 million negative impact on our revenue and a $12.0 million negative impact on our gross margin from 2008.
Revenue Results for Operating Segments
2010 versus 2009
North America revenue increased $183.4 million or 15.6% in 2010 from 2009. The Cliffstar Acquisition contributed $232.2 million to revenue. Excluding the impact of foreign exchange and the Cliffstar Acquisition, revenue decreased 5.6%, primarily due to a 1.8% decline in beverage case volume that resulted from national brand promotional activity in the first half of 2010. Net selling price per beverage case (which is net revenue divided by beverage case volume) was down slightly for 2010 from 2009.
39
Table of Contents
U.K. revenue increased 2.2% in 2010 from 2009, primarily as a result of a 2.1% increase in beverage case volume, and improved product mix (primarily increases in energy and sports isotonic products), offset in part by the weakening of the pound sterling. Net selling price per beverage case remained flat in 2010 from 2009. Absent foreign exchange impact, U.K. revenue increased 4.4% in 2010 from 2009. U.K. total case volume increased 1.8%.
Mexico revenue increased 17.3% in 2010 from 2009, primarily due to a 32.2% increase in beverage case volume. Net selling price per beverage case decreased 11.1% in 2010 from 2009. The increase in beverage case volume and decrease in net selling price was due primarily to new business in the retail channel and the commencement of shipments to a new bottled water customer. Absent foreign exchange impact, Mexico revenue increased 10.8% in 2010 from 2009.
RCI revenue increased 38.5% in 2010 from 2009, primarily as a result of a 35.7% improvement in total case volume due primarily to expansion of existing customer channels. Net selling price per beverage case remained flat in 2010 from 2009. RCI primarily sells concentrate.
2009 versus 2008
North America revenue decreased 0.3% in 2009 from 2008, primarily due to a 1.2% decline in beverage case volume that resulted from a continued softness in demand in most categories. Net selling price per beverage case (which is net revenue divided by beverage case volume) was up slightly for 2009 from 2008. Absent foreign exchange impact, North America revenue improved 0.9% in 2009.
U.K. revenue decreased 6.7% in 2009 from 2008, primarily as a result of a weakening of the pound sterling offset in part by a 2.0% increase in beverage case volume, improved product mix (primarily increases in energy-related drinks) and local currency price increases. Net selling price per beverage case decreased 8.4% in 2009 from 2008. Absent foreign exchange impact, U.K. revenue increased 11.2% in 2009 from 2008. The U.K. total case volume increased 0.2% due to improved sales of energy-related drinks that was partially offset by a decrease in concentrate sales.
Mexico revenue decreased 31.0% in 2009 from 2008, primarily due to a 10.2% decline in beverage case volume. Net selling price per beverage case decreased 23.2% in 2009 from 2008. Absent foreign exchange impact, Mexico revenue was 15.3% lower in 2009 from 2008. Mexico case volume decreased 10.2% in 2009 due to softness with modern trade customers and the continuing impact of our credit policies.
RCI revenue decreased 5.5% in 2009 from 2008, primarily as a result of a 5.7% decline in total case volume resulting from an unusually large sales volume in the fourth quarter of 2008 in anticipation of a price increase that was effective in 2009. Net selling price per beverage case was flat in 2009 from 2008. RCI primarily sells concentrate case volume.
Cost of Sales
2010 versus 2009
Cost of sales represented 85.2% of revenue in 2010 compared to 84.4% in 2009. Of the 85.2%, 0.6% was attributable to the Cliffstar Acquisition. Excluding the impact of the Cliffstar Acquisition, cost of sales represented 84.6% of revenue. The cost of sales as a percent of revenue for Cliffstar was 91.2%. This percentage was higher than normal due in part to increases in fixed costs resulting from upgrades of some of our production lines, and finished goods on hand being measured at fair value at the Acquisition Date. Variable costs represented 74.7% of total sales in 2010, down from 74.9% in 2009. Major elements of these variable costs included ingredient and packaging costs, distribution costs and fees paid to third-party manufacturers.
2009 versus 2008
Cost of sales represented 84.4% of revenue in 2009 compared to 89.0% in 2008. This decline was due in part to lower costs and a slight reduction in CSD and concentrate volumes. Variable costs represented 74.9% of total sales in 2009, down from 78.6% in 2008. Major elements of these variable costs included ingredient and packaging costs, distribution costs and fees paid to third-party manufacturers.
40
Table of Contents
Gross Profit
2010 versus 2009
Gross profit as a percentage of revenue decreased to 14.8% in 2010 from 15.6% in 2009. Excluding the impact of the Cliffstar Acquisition, gross profit as a percentage of revenue remained flat in 2010 compared to 2009.
2009 versus 2008
Gross profit as a percentage of revenue increased to 15.6% in 2009 from 11.0% in 2008. The overall gross profit improved by 38.0% in 2009 primarily as a result of slightly improved net selling prices in North America, improved product mix in the U.K. along with higher local currency prices and lower operating costs.
Selling, General and Administrative Expenses
2010 versus 2009
SG&A in 2010 increased $19.9 million, or 13.6%, from 2009. The Cliffstar Acquisition contributed $15.2 million of SG&A costs, or 10.4% of the increase, in 2010. Excluding the impact of the Cliffstar Acquisition, SG&A increased $4.7 million or 3.2% from 2009. The increase in the overall SG&A costs in 2010 was primarily the result of $7.2 million of transaction costs related to the Cliffstar Acquisition, and $6.7 million of integration costs, partially offset by a $3.3 million reduction in technology related costs, lower professional fees of $2.3 million, and lower compensation of $2.0 million. As a percentage of revenue, SG&A was 9.2% in 2010 and 2009, respectively.
2009 versus 2008
SG&A in 2009 decreased $33.0 million, or 18.4%, from 2008. As a percentage of revenue, SG&A was 9.2% in 2009, compared to 10.9% in 2008. The decline in the overall SG&A costs and the percentage of revenue in 2009 was primarily the result of a $2.6 million reduction in compensation costs resulting from our restructuring plans offset in part by $11.6 million of increased incentive pay over the prior year (in 2009—$3.3 million of executive severance costs; in 2008—$6.8 million of executive transition costs, including non-cash stock compensation of $1.9 million), the non-recurrence of $4.5 million of previously capitalized software expensed in 2008, a $4.9 million reduction in marketing costs as we continue to refocus away from branded products and related promotional activity, a $3.7 million decrease in professional fees, a $2.5 million reduction in depreciation expense primarily related to our vending assets, a $7.1 million reduction in amortization expense primarily related to a reduction in software costs that became fully amortized in 2009, $2.3 million improvement in bad debts as our Mexico operations stabilized and $2.4 million of reduced travel costs offset in part by $1.3 million of additional costs related to our vending operations.
Restructuring, Goodwill and Asset Impairments
2010 versus 2009
Restructuring and asset impairment charges in 2010 decreased $5.6 million from 2009. In 2010, we recorded a gain of $0.5 million related to a lease contract termination. In 2009, we recorded restructuring and asset impairments of $5.1 million, which included $3.6 million for asset impairments primarily related to customer relationships and severance costs of $1.5 million related to the organizational restructuring and headcount reductions associated with the 2009 Restructuring Plan.
2009 versus 2008
In 2009, we recorded restructuring and asset impairments of $5.1 million, which included $3.6 million for asset impairments primarily related to customer relationships and severance costs of $1.5 million related to the
41
Table of Contents
organizational restructuring and headcount reductions associated with the 2009 Restructuring Plan. In 2008, we recorded restructuring, goodwill and asset impairments of $112.9 million, which included a $69.2 million goodwill impairment charge related to our U.K. reporting unit, a $35.4 million asset impairment associated with the Rights, $1.6 million of asset impairment charges related to the decline in value of certain held-for-sale assets in our North America operating segment and $6.7 million of restructuring costs associated with our Refocus Plan, which was implemented in 2008 and resulted in a partial reduction of our workforce.
Operating Income
2010 versus 2009
Operating income in 2010 was $99.0 million, compared to operating income of $97.4 million in 2009. The Cliffstar Acquisition contributed $5.2 million in 2010. Excluding the impact of the Cliffstar Acquisition, North America operating income declined by $14.6 million or 17.7% primarily due to lower volumes.
2009 versus 2008
Operating income in 2009 was $97.4 million, compared to an operating loss of $113.0 million in 2008, primarily due to higher gross profit margins, lower SG&A costs and lower restructuring and asset impairment charges.
Other (Income) Expense, net
2010 versus 2009
In 2010, we recorded a $1.4 million write off of financing fees and $2.6 million of foreign exchange losses primarily related to intercompany loans. In 2009, we recorded a $3.3 million charge on the repayment of the 2011 Notes and $1.1 million of foreign exchange losses.
2009 versus 2008
In 2009, we recorded a $3.3 million charge on the repayment of the 2011 Notes and $1.1 million of foreign exchange losses. In 2008, we recorded $4.5 million as business interruption recovery under our insurance coverage related to our voluntary product recall that occurred in the United Kingdom in 2007. This amount was reported in Other Expense (income), net because there were no direct costs incurred in 2008 that should be offset by the insurance proceeds. In 2008, we also recorded $1.0 million of foreign exchange loss, which includes $3.2 million of foreign exchange losses related to inter-company loans.
Interest Expense
2010 versus 2009
Net interest expense in 2010 increased 24.2% from 2009 primarily due to a higher average debt balance resulting from the issuance of the 2018 Notes.
2009 versus 2008
Net interest expense in 2009 decreased 8.0% from 2008 primarily due to lower average short-term and long-term debt amounts and lower overall average interest rates.
Income Taxes
2010 versus 2009
We recorded income tax expense of $18.6 million in 2010 compared with an income tax benefit of $22.8 million in 2009. The tax benefit in 2009 was primarily the result of the utilization of $17.5 million in accruals
42
Table of Contents
related to uncertain tax positions, and $25.0 million resulting from the reversal in 2009 of U.S. valuation allowances. In 2010, we utilized $2.2 million of accruals related to uncertain tax positions and $0.7 million relating to the utilization of U.S. valuation allowances.
2009 versus 2008
We recorded an income tax benefit of $22.8 million in 2009 compared with an income tax benefit of $19.5 million in 2008. This benefit reflects the reversal of accruals relating to uncertain tax positions, plus interest and penalties, which generated a $17.5 million benefit and a $25.0 million income tax benefit resulting from the reversal of U.S. valuation allowances. These valuation allowance reversals were caused by the carryback of net operating losses in the U.S. due to recent changes in tax law and the utilization in the current year of U.S. deferred tax assets with valuation allowances. These benefits were partially offset by $19.7 million of income tax expense resulting mostly from current year earnings.
Liquidity and Capital Resources
The following table summarizes our cash flows for 2010, 2009 and 2008 as reported in our Consolidated Statements of Cash Flows in the accompanying Consolidated Financial Statements:
| For the Years Ended | ||||||||||||
| (in millions of U.S. dollars) |
January
1, 2011 |
January
2, 2010 |
December
27, 2008 |
|||||||||
| Cash provided by operating activities |
$ | 178.4 | $ | 155.1 | $ | 66.9 | ||||||
| Cash used in investing activities |
(554.7 | ) | (32.2 | ) | (54.8 | ) | ||||||
| Cash provided by (used in) financing activities |
393.3 | (107.5 | ) | (19.3 | ) | |||||||
| Effect of exchange rate changes on cash |
0.3 | 0.8 | (5.5 | ) | ||||||||
| Net increase (decrease) in cash |
17.3 | 16.2 | (12.7 | ) | ||||||||
| Cash and cash equivalents, beginning of period |
30.9 | 14.7 | 27.4 | |||||||||
| Cash and cash equivalents, end of period |
$ | 48.2 | $ | 30.9 | $ | 14.7 | ||||||
Operating activities
Cash provided by operating activities in 2010 was $178.4 million compared to $155.1 million in 2009 and $66.9 million in 2008. The $23.3 million increase from 2009 to 2010 was primarily due to improved working capital as a result of the receipt of tax refunds, and an increase in interest accruals, partially offset by investment in inventory.
The $88.2 million increase from 2008 to 2009 was primarily due to higher operating income and reductions in working capital as a result of improved collection efforts and inventory management.
Investing activities
Cash used in investing activities was $554.7 million in 2010 compared to $32.2 million in 2009 and $54.8 million in 2008. The $522.5 million increase from 2009 to 2010 was primarily due to the purchase price paid in connection with the Cliffstar Acquisition of $507.7 million, and an increase in capital expenditures of $11.7 million. The $22.6 million decrease from 2009 to 2008 was primarily due to reduced capital expenditures. In 2008, we made significant expenditures for our water bottling equipment project.
43
Table of Contents
Financing activities
Cash provided by financing activities was $393.3 million in 2010 compared to cash used of $107.5 million in 2009 and $19.3 million in 2008. In 2010, we received proceeds of $375.0 million from the issuance of the 2018 Notes and $71.1 million in net proceeds from the Equity Offering, partially offset by $14.2 million of financing fees, $12.4 million in net payments under the ABL facility, $18.7 million in payments of long-term debt, and $7.4 million of distributions to non-controlling interests.
In 2009, we substantially reduced our ABL facility borrowings, repurchased $257.8 million of the 2011 Notes offset by the receipt of $47.5 million in net proceeds from the public offering of 9,435,000 common shares at a price of $5.30 per share completed on August 11, 2009 and $211.9 million from the issuance of $215.0 million of senior notes that are due on November 15, 2017 (the “2017 Notes”). The $31.7 million increase in cash used in financing activities in 2008 was primarily the result of the purchase of $6.4 million of treasury shares by an independent trustee pursuant to certain of our equity compensation plans, and a $27.8 million reduction in our short-term borrowing facilities offset in part by financing the $32.5 million water bottling equipment project.
Financial Liquidity
As of January 1, 2011, we had total debt of $622.2 million and $48.2 million of cash and cash equivalents compared to $274.1 million of debt and $30.9 million of cash and cash equivalents as of January 2, 2010.
We believe that our level of resources, which includes cash on hand, available borrowings under the ABL facility and funds provided by operations, will be adequate to meet our expenses, capital expenditures, and debt service obligations for the next twelve months. Our ability to generate cash to meet our current expenses and debt service obligations will depend on our future performance. If we do not have enough cash to pay our debt service obligations or if the ABL facility, 2017 Notes, or 2018 Notes were to become currently due, either at maturity or as a result of a breach, we may be required to take actions such as amending our ABL facility or the indentures governing our 2017 and 2018 Notes, refinancing all or part of our existing debt, selling assets, incurring additional indebtedness or raising equity. If we need to seek additional financing, there is no assurance that this additional financing will be available.
Should we desire to consummate significant acquisition opportunities or undertake significant expansion activities, our capital needs would increase and could result in our need to increase available borrowings under our ABL facility or access public or private debt and equity markets.
As of January 1, 2011, our total availability under the ABL facility was $248.1 million, which was based on our borrowing base (accounts receivables, inventory, and fixed assets) as of January 1, 2011 (the December month-end under the terms of the credit agreement), and we had $7.9 million of ABL borrowings outstanding and $12.6 million in outstanding letters of credit. As a result, our excess availability under the ABL facility was $227.6 million. Each month’s borrowing base is not effective until submitted to the lenders, which usually occurs on the fifteenth day of the following month.
During the third quarter of 2010, we completed the Cliffstar Acquisition. The Cliffstar Acquisition was financed through the issuance of the 2018 Notes (the “Note Offering”), the Equity Offering, and borrowings under our ABL facility, which we refinanced in connection with the Cliffstar Acquisition. The ABL facility was refinanced to, among other things, provide for the Cliffstar Acquisition, the Note Offering and the application of net proceeds therefrom, the Equity Offering and the application of net proceeds therefrom and to increase the amount available for borrowings to $275.0 million. We drew down a portion of indebtedness under that facility in order to fund the Cliffstar Acquisition. We incurred $5.4 million of financing fees in connection with the refinancing of the ABL facility. Net proceeds from the Equity Offering were $71.1 million, after deducting expenses, underwriting discounts and commissions.
44
Table of Contents
Net proceeds resulting from the Note Offering were $366.4 million after issuance costs of $8.6 million. The 2018 Notes are senior unsecured obligations and rank equally with all other existing and future unsubordinated indebtedness, including indebtedness under our credit facilities. We are subject to covenants and limitations on our and/or our subsidiaries’ ability, subject to certain exceptions and qualifications, to (i) pay dividends or make distributions, repurchase equity securities, prepay subordinated debt or make certain investments, (ii) incur additional debt or issue certain disqualified stock or preferred stock, (iii) create or incur liens on assets securing indebtedness, (iv) merge or consolidate with another company (which applies to Cott and Cott Beverages Inc. only) or sell all or substantially all assets taken as a whole, (v) enter into transactions with affiliates and (vi) sell assets.
During the fourth quarter of 2009, we repurchased $237.1 million in aggregate principal amount of the 2011 Notes, pursuant to a public cash tender offer, in which we also paid an early tender premium, accrued interest and associated fees and expenses. We also purchased $20.7 million of the 2011 Notes in the third quarter of 2009. The extinguishment of these 2011 Notes that were validly tendered resulted in a charge of $3.3 million which was recorded to Other Expense (Income) in the Consolidated Statements of Operations for the year ended January 2, 2010. On February 1, 2010, we completed the redemption of the remaining $11.1 million of the 2011 Notes.
During the fourth quarter of 2009, we completed our offering of $215.0 million in aggregate principal amount of the 2017 Notes resulting in net proceeds of approximately $206.8 million after a discount of $3.1 million and issuance costs of $5.1 million. The 2017 Notes mature on November 15, 2017 and pay interest semiannually on May 15th and November 15th of each year. The 2017 Notes are senior unsecured obligations and rank equally with all other existing and future unsubordinated indebtedness, including indebtedness under our credit facilities. We are subject to covenants and limitations on our and/or our subsidiaries’ ability, subject to certain exceptions and qualifications, to (i) pay dividends or make distributions, repurchase equity securities, prepay subordinated debt or make certain investments, (ii) incur additional debt or issue certain disqualified stock or preferred stock, (iii) create or incur liens on assets, (iv) merge or consolidate with another company (which applies to Cott and Cott Beverages Inc. only) or sell all or substantially all assets taken as a whole, (v) enter into transactions with affiliates and (vi) sell assets.
Off-Balance Sheet Arrangements
We have no off-balance sheet arrangements as defined under Item 303(a)(4) of Regulation S-K as of January 1, 2011.
45
Table of Contents
Contractual Obligations
The following table shows the schedule of future payments under certain contracts, including debt agreements and guarantees, as of January 1, 2011:
| Payments due by period | ||||||||||||||||||||||||||||
| (in millions of US dollars) |
Total | 2011 | 2012 | 2013 | 2014 | 2015 | Thereafter | |||||||||||||||||||||
| 8.375% Senior notes due in 2017 |
$ | 215.0 | $ | — | $ | — | $ | — | $ | — | $ | — | $ | 215.0 | ||||||||||||||
| 8.125% Senior notes due in 2018 |
375.0 | — | — | — | — | — | 375.0 | |||||||||||||||||||||
| ABL facility 1 |
7.9 | 7.9 | — | — | — | — | — | |||||||||||||||||||||
| GE Obligation 2 |
10.5 | 4.1 | 2.6 | 1.0 | 1.1 | 1.2 | 0.5 | |||||||||||||||||||||
| Capital leases |
5.8 | 1.8 | 0.7 | 0.7 | 0.8 | 0.8 | 1.0 | |||||||||||||||||||||
| Deferred consideration 3 |
14.0 | 4.7 | 4.7 | 4.6 | — | — | — | |||||||||||||||||||||
| Contingent consideration 4 |
33.7 | 33.7 | — | — | — | — | — | |||||||||||||||||||||
| Other long-term debt |
2.0 | 0.4 | 0.2 | 0.2 | 0.3 | 0.3 | 0.6 | |||||||||||||||||||||
| Interest expense 5 |
361.0 | 48.8 | 48.7 | 48.7 | 48.7 | 48.6 | 117.5 | |||||||||||||||||||||
| Operating leases |
87.9 | 18.4 | 15.9 | 11.9 | 10.6 | 8.6 | 22.5 | |||||||||||||||||||||
| Guarantee purchase equipment |
7.0 | 7.0 | — | — | — | — | — | |||||||||||||||||||||
| Pension obligations |
1.1 | 1.1 | — | — | — | — | — | |||||||||||||||||||||
| Purchase obligations 6 |
242.7 | 141.2 | 35.7 | 31.7 | 30.2 | 3.9 | — | |||||||||||||||||||||
|
Other 7 |
0.8 | 0.8 | — | — | — | — | — | |||||||||||||||||||||
| Total |
$ | 1,364.4 | $ | 269.9 | $ | 108.5 | $ | 98.8 | $ | 91.7 | $ | 63.4 | $ | 732.1 | ||||||||||||||
| 1 | The ABL facility is considered a current liability. |
| 2 | We funded new water bottling equipment through an interim financing agreement signed in January 2008 (the “GE Obligation”). At the end of the GE Obligation, we may exchange $6.0 million of deposits for the extinguishment of $6.0 million in debt. |
| 3 | In connection with the Cliffstar Acquisition, we are required to pay $14.0 million of deferred consideration over a three year period. |
| 4 | In connection with the Cliffstar Acquisition, we are required to pay contingent consideration which has a fair value of $33.7 million. |
| 5 | Interest expense includes fixed interest on the 2018 Notes, the 2017 Notes, the GE Obligation, the ABL facility, capital leases and other long-term liabilities. Actual amounts will differ from estimates provided. |
| 6 | Purchase obligations consist of commitments for the purchase of inventory and energy. These obligations represent the minimum contractual obligations expected under the normal course of business. |
| 7 | Represents our tax liability accounted for under ASC 740 that will be settled in 2011. The contractual obligations table excludes the Company’s remaining ASC 740 uncertain tax positions liability of $12.5 million because the Company cannot make a reliable estimate as to when such amounts will be settled. |
46
Table of Contents
Debt
Our total debt is as follows:
| (in millions of U.S. dollars) |
January 1, 2011 |
January 2, 2010 |
||||||
| 8% senior subordinated notes due in 2011 |
$ | — | $ | 11.1 | ||||
| 8.375% senior notes due in 2017 1 |
215.0 | 215.0 | ||||||
| 8.125% senior notes due in 2018 |
375.0 | — | ||||||
| ABL facility |
7.9 | 20.2 | ||||||
| GE Obligation |
16.5 | 22.0 | ||||||
| Other capital leases |
5.8 | 3.2 | ||||||
| Other debt |
2.0 | 2.6 | ||||||
| Total debt |
622.2 | 274.1 | ||||||
| Less: Short-term borrowings and current debt: |
||||||||
| ABL facility |
7.9 | 20.2 | ||||||
| Total short-term borrowings |
7.9 | 20.2 | ||||||
| 8% senior subordinated notes due in 2011 |
— | 11.1 | ||||||
| GE Obligation—current maturities |
4.1 | 5.5 | ||||||
| Other capital leases—current maturities |
1.4 | 0.4 | ||||||
| Other debt—current maturities |
0.5 | 0.6 | ||||||
| Total current debt |
13.9 | 37.8 | ||||||
| Long-term debt before discount |
608.3 | 236.3 | ||||||
| Less discount on 8.375% notes |
(2.8 | ) | (3.1 | ) | ||||
| Total long-term debt |
$ | 605.5 | $ | 233.2 | ||||
| 1 | Our 8.375% senior notes were issued at a discount of 1.425% on November 13, 2009. |
Asset Based Lending Facility
On March 31, 2008, we entered into a credit agreement with JPMorgan Chase Bank, N.A. as Agent that created an ABL facility to provide financing for our North America, U.K. and Mexico operating segments. In connection with the Cliffstar Acquisition, we refinanced the ABL facility on August 17, 2010 to, among other things, provide for the Cliffstar Acquisition, the Note Offering and the application of net proceeds therefrom, the Equity Offering and the application of net proceeds therefrom and to increase the amount available for borrowings to $275.0 million. We drew down a portion of the indebtedness under the ABL facility in order to fund the Cliffstar Acquisition. We incurred $5.4 million of financing fees in connection with the refinancing of the ABL facility. The financing fees are being amortized using the straight-line method over a four-year period.
As of January 1, 2011, we had $7.9 million in borrowings under the ABL facility outstanding. The commitment fee was 0.5% per annum of the unused commitment, which was $227.6 million as of January 1, 2011.
The effective interest rate as of January 1, 2011 on LIBOR and Prime loans is based on average aggregate availability as follows:
| Average Aggregrate Availability (in millions of U.S. dollars) |
ABR Spread |
Canadian Prime Spread |
Eurodollar Spread |
CDOR Spread |
LIBOR Spread |
|||||||||||||||
| Over $150 |
1.50 | % | 1.50 | % | 2.50 | % | 2.50 | % | 2.50 | % | ||||||||||
| $75 - 150 |
1.75 | % | 1.75 | % | 2.75 | % | 2.75 | % | 2.75 | % | ||||||||||
| Under $75 |
2.00 | % | 2.00 | % | 3.00 | % | 3.00 | % | 3.00 | % | ||||||||||
47
Table of Contents
8.125% Senior Notes due in 2018
On August 17, 2010, we issued $375.0 million of 2018 Notes. The issuer of the 2018 Notes is Cott Beverages Inc., but we and most of our U.S., Canadian and United Kingdom subsidiaries guarantee the 2018 Notes. The interest on the 2018 Notes is payable semi-annually on March 1st and September 1st of each year, beginning on March 1, 2011.
We incurred $8.6 million of financing fees in connection with the issuance of the 2018 Notes. The financing fees are being amortized using the straight-line method over an eight-year period, which represents the duration of the 2018 Notes. The amortization expense calculated under the straight-line method does not differ materially from the effective-interest method.
8.375% Senior Notes due in 2017
On November 13, 2009, we issued $215.0 million of 2017 Notes. The 2017 Notes were issued at a $3.1 million discount. The issuer of the 2017 Notes is Cott Beverages Inc., but we and most of our U.S., Canadian and United Kingdom subsidiaries guarantee the 2017 Notes. The interest on the 2017 Notes is payable semi-annually on May 15th and November 15th of each year.
We incurred $5.1 million of financing fees in connection with the 2017 Notes. The financing fees are being amortized using the straight-line method over an eight-year period, which represents the duration of the 2017 Notes. The amortization expense calculated under the straight-line method does not differ materially from the effective-interest method.
8% Senior Subordinated Notes due in 2011
We repurchased the remaining outstanding 2011 Notes for $11.1 million on February 1, 2010, and recorded a loss on buyback of $0.1 million. The 2011 Notes acquired by us have been retired, and we have discontinued the payment of interest.
In 2009, the Company repurchased $257.8 million in principal amount of the 2011 Notes, and recorded a loss on buyback of $3.3 million.
GE Financing Agreement
We funded $32.5 million of water bottling equipment purchases through a finance lease arrangement in 2008. The quarterly payments under the lease obligation totaled approximately $8.8 million per annum for the first two years, $5.3 million per annum for the subsequent two years, then $1.7 million per annum for the final four years.
Credit Ratings and Covenant Compliance
Credit Ratings
Our objective is to maintain credit ratings that provide us with ready access to global capital and credit markets at favorable interest rates.
On August 9, 2010, Moody’s assigned a B3 rating to the 2018 Notes and affirmed the B2 corporate family rating and the B3 rating on the 2017 Notes. The rating outlook remains at “stable”.
On August 10, 2010 Standard & Poor’s assigned a B rating to the 2018 Notes and affirmed the B long-term corporate credit rating. S&P also affirmed the B rating on the 2017 Notes and removed the debt from negative CreditWatch.
48
Table of Contents
Any downgrade of our credit ratings by either Moody’s or S&P could increase our future borrowing costs or impair our ability to access capital markets on terms commercially acceptable to us or at all.
Covenant Compliance
8.125% Senior Notes due in 2018
Under the indenture governing the 2018 Notes, we are subject to a number of covenants, including covenants that limit our and certain of our subsidiaries’ ability, subject to certain exceptions and qualifications, to (i) pay dividends or make distributions, repurchase equity securities, prepay subordinated debt or make certain investments, (ii) incur additional debt or issue certain disqualified stock or preferred stock, (iii) create or incur liens on assets securing indebtedness, (iv) merge or consolidate with another company or sell all or substantially all assets taken as a whole, (v) enter into transactions with affiliates and (vi) sell assets. We have been in compliance with all of the covenants under the 2018 Notes and there have been no amendments to any such covenants since the 2018 Notes were issued.
8.375% Senior Notes due in 2017
Under the indenture governing the 2017 Notes, we are subject to a number of covenants, including covenants that limit our and certain of our subsidiaries’ ability, subject to certain exceptions and qualifications, to (i) pay dividends or make distributions, repurchase equity securities, prepay subordinated debt or make certain investments, (ii) incur additional debt or issue certain disqualified stock or preferred stock, (iii) create or incur liens on assets, (iv) merge or consolidate with another company (applies to Cott and Cott Beverages Inc. only) or sell all or substantially all assets taken as a whole, (v) enter into transactions with affiliates and (vi) sell assets. We have been in compliance with all of the covenants under the 2017 Notes and there have been no amendments to any such covenants since the 2017 Notes were issued.
ABL Facility
We and our restricted subsidiaries are subject to a number of business and financial covenants, including a covenant requiring a minimum fixed charge coverage ratio of at least 1.1 to 1.0 effective when and if excess availability is less than the greater of (a) $30.0 million and (b) the lesser of (i) 12.5% of the amount of the aggregate borrowing base and (ii) $37.5 million. Our fixed charge coverage ratio as calculated under this covenant as of January 1, 2011 was greater than 1.1 to 1.0. If availability is less than $37.5 million, the lenders will take dominion over the cash and will apply excess cash to reduce amounts owing under the facility. The credit agreement governing the ABL facility requires us to maintain aggregate availability of at least $15.0 million. We were in compliance with all of the applicable covenants under the ABL facility on January 1, 2011.
Capital structure
In 2010, equity increased by $133.9 million from 2009. The increase was primarily the result of net income of $54.7 million, the receipt of $71.1 million of net proceeds from the Equity Offering, a $4.5 million foreign currency translation gain on the net assets of self-sustaining foreign operations, and $5.1 million of non-controlling interest income partially offset by $7.4 million of distributions to non-controlling interest and $4.7 million of share-based compensation expense. The foreign currency translation adjustment resulted primarily from the decrease in the pound sterling relative to the U.S. dollar since December 2009, partially offset by the increase in the Canadian dollar and Mexican peso relative to the U.S. dollar since December 2009.
Dividend payments
There are certain restrictions on the payment of dividends under our ABL facility and under the indentures governing the 2017 Notes and 2018 Notes. No dividends were paid in 2010 and we do not expect to pay dividends in the future.
49
Table of Contents
| ITEM 7A. | QUANTITATIVE AND QUALITATIVE DISCLOSURES ABOUT MARKET RISK |
We do not trade market risk sensitive instruments.
Currency Exchange Rate Risk
We are exposed to changes in foreign currency exchange rates. Operations outside of the U.S. accounted for 34.2% of 2010 revenue and 36.7% of 2009 revenue, and are concentrated principally in the U.K., Canada and Mexico. We translate the revenues and expenses of our foreign operations using average exchange rates prevailing during the period. The effect of a 10.0% change in foreign currency exchange rates among the U.S. dollar versus the Canadian dollar, pound sterling and Mexican peso as of January 1, 2011, at current levels of foreign debt and operations would result in our revenues in 2010 changing by $57.8 million and our gross profit in 2010 changing by $6.4 million. These changes would not be material to our cash flows and results of operations.
Our primary exposure to foreign currency exchange rates relates to transactions in which the currency collected from customers is different from the currency utilized to purchase the product sold. In 2010, we entered into foreign currency contracts to hedge some of these currency exposures for which natural hedges do not exist. Natural hedges exist when purchases and sales within a specific country are both denominated in the same currency and, therefore, no exposure exists to hedge with foreign exchange forward, option, or swap contracts (collectively, the “foreign exchange contracts”). We do not enter into foreign exchange contracts for trading purposes. The risk of loss on a foreign exchange contract is the risk of non-performance by the counterparties, which we minimize by limiting our counterparties to major financial institutions. The fair values of the foreign exchange contracts, which are $0.6 million, are estimated using market quotes. As of January 1, 2011, we had outstanding foreign exchange forward contracts with notional amounts of $19.7 million.
Debt obligations and interest rates
We have exposure to interest rate risk from the outstanding principal amounts of our short-term and long-term debt. Our long-term debt is fixed and our short-term debt is variable. Our short-term ABL facility is vulnerable to fluctuations in the U.S. short-term base rate and the LIBOR rate. At current debt levels as of January 1, 2011, a 100 basis point increase in the current per annum interest rate for our ABL facility (excluding the $12.6 million outstanding letters of credit) would result in $0.1 million of additional interest expense during the next year. This change would not be material to our cash flows or our results of operations. The weighted average interest rate of our debt outstanding at January 1, 2011, was 8.2%.
We regularly review the structure of our debt and consider changes to the proportion of floating versus fixed rate debt through refinancing, interest rate swaps or other measures in response to the changing economic environment. Historically, we have not used derivative instruments to manage interest rate risk. If we use and fail to manage these derivative instruments successfully, or if we are unable to refinance our debt or otherwise increase our debt capacity in response to changes in the marketplace, the expense associated with debt service could increase. This would negatively impact our financial condition and profitability.
50
Table of Contents
The information below summarizes our market risks associated with long-term debt obligations as of January 1, 2011. The table presents principal cash flows and related interest rates by year of maturity. Interest rates disclosed represent the actual weighted average rates as of January 1, 2011.
| Debt Obligations | ||||||||
| (in millions of U.S. dollars) |
Outstanding debt balance |
Weighted average interest rate for debt maturing |
||||||
| Debt maturing in: |
||||||||
| 2011 |
$ | 6.3 | 6.4 | % | ||||
| 2012 |
3.5 | 7.7 | % | |||||
| 2013 |
1.9 | 7.4 | % | |||||
| 2014 |
2.2 | 7.5 | % | |||||
| 2015 |
2.3 | 7.5 | % | |||||
| Thereafter |
592.1 | 8.2 | % | |||||
| Total |
$ | 608.3 | 1 | 8.2 | % | |||
| 1 | We funded the purchase of new water bottling equipment through an interim financing agreement signed in January 2008 (the “GE Obligation”). At the end of the GE Obligation, we may exchange $6.0 million of deposits for the extinguishment of $6.0 million in debt or elect to purchase such equipment. |
Commodity Price Risk
The competitive marketplace in which we operate may limit our ability to recover increased costs through higher prices. As a result, we are subject to market risk with respect to commodity price fluctuations principally related to our purchases of aluminum, corn (for HFCS), PET resin, and juice concentrates. When possible, we manage our exposure to this risk primarily through the use of supplier pricing agreements, which enable us to establish the purchase prices for certain commodities. We estimate that a 10% increase in the market prices of these commodities over the current market prices would cumulatively increase our cost of sales during the next 12 months by approximately $55.5 million. This change would be material to our cash flows and our results of operations.
| ITEM 8. | FINANCIAL STATEMENTS AND SUPPLEMENTARY DATA |
Financial statements and exhibits filed under this item are listed in the index appearing in Item 15 of this report.
| ITEM 9. | CHANGES IN AND DISAGREEMENTS WITH ACCOUNTANTS ON ACCOUNTING AND FINANCIAL DISCLOSURE |
None.
| ITEM 9A. | CONTROLS AND PROCEDURES |
Disclosure Controls and Procedures
The Company maintains disclosure controls and procedures as defined in Rules 13a-15(e) and 15d-15(e) of the Securities Exchange Act of 1934, as amended (the “Exchange Act”). The Company’s management, under the supervision and with the participation of the Company’s Chief Executive Officer and Chief Financial Officer, carried out an evaluation of the effectiveness of the design and operation of the Company’s disclosure controls and procedures as of January 1, 2011 (the “Evaluation”). Based upon the Evaluation, the Company’s Chief Executive Officer and Chief Financial Officer concluded that, as of January 1, 2011, the Company’s disclosure controls and procedures (as defined in Rules 13a-15(e) and 15(d)-15(e) of the Exchange Act) were not effective at the reasonable assurance level as a result of the material weakness that is described in “Management’s Report on Internal Control Over Financial Reporting.” We have taken steps and are taking the actions described more fully below under “Remediation Activities” to remediate the material weakness.
51
Table of Contents
Management’s Report on Internal Control Over Financial Reporting
The Company’s management is responsible for establishing and maintaining adequate “internal control over financial reporting” (as defined in Exchange Act Rules 13a-15(f) and 15d-15(f). Management, under the supervision and with the participation of the Company’s Chief Executive Officer and Chief Financial Officer, evaluated the effectiveness of the Company’s internal control over financial reporting using the criteria set forth by the Committee of Sponsoring Organizations of the Treadway Commission (“COSO”) in Internal Control—Integrated Framework as of January 1, 2011. As a result of management’s evaluation of the Company’s internal control over financial reporting, management identified the material weakness described below. A material weakness is a deficiency, or a combination of deficiencies, in internal control over financial reporting such that there is a reasonable possibility that a material misstatement of the Company’s annual or interim financial statements will not be prevented or detected on a timely basis.
The Company did not maintain effective controls over the communication and evaluation of a certain customer’s discount and pricing programs. The Company’s control procedures identified certain differences requiring further investigation, and control procedures in place were either not adequately designed or did not operate effectively to ensure that these differences with financial reporting implications were communicated completely, accurately, and in a timely manner to appropriate accounting personnel. This control deficiency resulted in immaterial pricing errors impacting revenue, accounts receivable and accrued expenses with respect to one of our customers during the quarter ended October 2, 2010 that were corrected through a revision to the Company’s interim financial statements in Note 22 in this Annual Report on Form 10-K. Additionally, this control deficiency, if not remedied, could result in further misstatements of the aforementioned accounts and disclosures that would result in a material misstatement of the annual or interim consolidated financial statements that would not be prevented or detected. Accordingly, the Company’s management has determined this control deficiency constitutes a material weakness.
As a result of this material weakness, management has concluded that the Company’s internal control over financial reporting was not effective as of January 1, 2011 based on the COSO criteria.
The effectiveness of the Company’s internal control over financial reporting as of January 1, 2011 has been audited by PricewaterhouseCoopers LLP, the Company’s independent registered certified public accounting firm, as stated in their report which appears herein.
Cliffstar Acquisition: As permitted by Securities and Exchange Commission staff interpretive guidance for newly acquired businesses, management has excluded the Cliffstar business from its assessment of internal control over financial reporting as of January 1, 2011 because it acquired substantially all of the assets and liabilities of Cliffstar Corporation and its affiliated companies (“Cliffstar”) in August 2010. Cliffstar’s total assets and total revenues represent 22% and 13%, respectively, of the Company’s consolidated financial statement amounts as of and for the year ended January 1, 2011.
Changes in Internal Control Over Financial Reporting
There have been no changes in our internal control over financial reporting during our most recent fiscal quarter that have materially affected, or are likely to materially affect, our internal control over financial reporting.
Remediation Activities
Beginning in January 2011, with oversight from the Audit Committee, the Company’s management began to design and implement certain remediation measures to address the above-described material weakness and enhance the Company’s system of internal control over financial reporting, including expanded reviews and evaluations of specific customer accounts receivable aging and promotional activities reports and re-assignment of senior accounting personnel to oversee the specific customer activities.
52
Table of Contents
The Company believes the remediation measures will strengthen the Company’s internal control over financial reporting and remediate the material weakness identified. We will continue to monitor the effectiveness of these remediation measures and will make any changes and take such other actions that we deem appropriate given the circumstances. The identified material weakness has not been fully remediated as of the date of the filing of this annual report.
| ITEM 9B. | OTHER INFORMATION |
Not Applicable.
53
Table of Contents
| ITEM 10. | DIRECTORS AND EXECUTIVE OFFICERS OF THE REGISTRANT |
The information required by this item regarding directors is incorporated by reference to, and will be contained in, the “Election of Directors” section of our definitive proxy circular for the 2011 Annual Meeting of Shareowners, which will be filed within 120 days after January 1, 2011 (the “2011 Proxy Circular”). The information required by this item regarding audit committee financial expert disclosure is incorporated by reference to, and will be contained in, the “Corporate Governance” section of our 2011 Proxy Circular. The information required by this item regarding executive officers appears as the Supplemental Item in Part I. There have been no material changes to the procedures by which shareholders may recommend nominees to our Board of Directors.
The Audit Committee of our Board of Directors is an “audit committee” for the purposes of Section 3(a)(58)(A) of the Securities Exchange Act of 1934, as amended. The Audit Committee charter is posted on our website at www.cott.com. The members of the Audit Committee are Graham Savage (Chairman), George Burnett and Gregory Monahan. As required by the NYSE rules, the board has determined that each member of the Audit Committee is financially literate and that Mr. Savage qualifies as an “audit committee financial expert” within the meaning of the rules of the U.S. Securities and Exchange Commission.
All of our directors, officers and employees must comply with our Code of Business Conduct and Ethics. In addition, our Chief Executive Officer, Chief Financial Officer and principal accounting officer and certain other employees have a further obligation to comply with our Code of Ethics for Senior Officers. Our Code of Business Conduct and Ethics and our Code of Ethics for Senior Officers are posted on our website, www.cott.com and we intend to comply with obligations to disclose any amendment to, or waiver of, provisions of these codes by posting such information on our website.
Section 16(a) Beneficial ownership reporting compliance
The information required by this item is incorporated by reference to, and will be contained in, the “Section 16(a) Beneficial Ownership Reporting Compliance” section of our 2011 Proxy Circular.
| ITEM 11. | EXECUTIVE COMPENSATION |
The information required by this item is incorporated by reference to, and will be contained in, the “Compensation of Executive Officers” section of our 2011 Proxy Circular.
| ITEM 12. | SECURITY OWNERSHIP OF CERTAIN BENEFICIAL OWNERS AND MANAGEMENT AND RELATED SHAREOWNER MATTERS |
The information required by this item is incorporated by reference to, and will be contained in, the “Principal Shareowners,” “Security Ownership of Directors and Management” and “Equity Compensation Plan Information” sections of our 2011 Proxy Circular.
| ITEM 13. | CERTAIN RELATIONSHIPS AND RELATED TRANSACTIONS |
The information required by this item is incorporated by reference to, and will be contained in, the “Certain Relationships and Related Transactions” section of our 2011 Proxy Circular.
| ITEM 14. | PRINCIPAL ACCOUNTANT FEES AND SERVICES |
The information required by this item is incorporated by reference to, and will be contained in, the “Independent Registered Public Accounting Firm” section of our 2011 Proxy Circular.
54
Table of Contents
| ITEM 15. | EXHIBITS AND FINANCIAL STATEMENT SCHEDULES |
(a) The documents filed as part of this report are as follows:
1. Financial Statements
The consolidated financial statements and accompanying report of independent registered certified public accounting firm are listed in the Index to Consolidated Financial Statements and are filed as part of this report.
2. Financial Statement Schedules
Schedule II—Valuation and Qualifying Accounts
3. Exhibits
Exhibits required by Item 601 of Regulation S-K set forth on the “Exhibit Index.”
All other schedules called for by the applicable SEC accounting regulations are not required under the related instructions or are inapplicable and, therefore, have been omitted.
55
Table of Contents
Signatures
Pursuant to the requirements of Section 13 or 15(d) of the Securities Exchange Act of 1934, the Registrant has duly caused this report to be signed on its behalf by the undersigned, thereunto duly authorized.
Cott Corporation
| /S/ JERRY FOWDEN |
| Jerry Fowden |
| Chief Executive Officer |
| Date: March 15, 2011 |
Pursuant to the requirements of the Securities Exchange Act of 1934, this report has been signed below by the following persons on behalf of the registrant and in the capacities and on the dates indicated:
| /S/ JERRY FOWDEN Jerry
Fowden |
Date: March 15, 2011 | /S/ GREGORY MONAHAN Gregory Monahan |
Date: March 15, 2011 | |||
| /S/ NEAL CRAVENS Neal Cravens |
Date: March 15, 2011 | /S/ MARIO PILOZZI Mario Pilozzi |
Date: March 15, 2011 | |||
| /S/ GREGORY LEITER Gregory Leiter |
Date: March 15, 2011 |
/S/ GEORGE A. BURNETT George A. Burnett Director |
Date: March 15, 2011 | |||
| /S/ DAVID T. GIBBONS David T. Gibbons |
Date: March 15, 2011 | /S/ ANDREW PROZES Andrew Prozes Director |
Date: March 15, 2011 | |||
| /S/ MARK BENADIBA Mark Benadiba |
Date: March 15, 2011 | /S/ GRAHAM SAVAGE Graham Savage |
Date: March 15, 2011 | |||
|
/S/ STEPHEN H. HALPERIN Stephen H. Halperin |
Date: March 15, 2011 | /S/ ERIC ROSENFELD Eric Rosenfeld |
Date: March 15, 2011 | |||
| /S/ BETTY JANE HESS Betty Jane Hess |
Date: March 15, 2011 | |||||
56
Table of Contents
INDEX TO CONSOLIDATED FINANCIAL STATEMENTS
| Page(s) | ||
| Report of Independent Registered Certified Public Accounting Firm |
F – 2 | |
| F – 4 | ||
| F – 5 | ||
| F – 6 | ||
| F – 7 | ||
| F – 8 | ||
| F – 9 to F-54 |
F-1
Table of Contents
Report of Independent Registered Certified Public Accounting Firm
To the Board of Directors and Shareholders
Cott Corporation
In our opinion, the consolidated financial statements listed in the accompanying index present fairly, in all material respects, the financial position of Cott Corporation and its subsidiaries at January 1, 2011 and January 2, 2010 and the results of their operations and their cash flows for each of the three years in the period ended January 1, 2011 in conformity with accounting principles generally accepted in the United States of America. In addition, in our opinion, the financial statement schedule listed in the index appearing under Item 15(a)(2) presents fairly, in all material respects, the information set forth therein when read in conjunction with the related consolidated financial statements. Also in our opinion, the Company did not maintain, in all material respects, effective internal control over financial reporting as of January 1, 2011, based on criteria established in Internal Control—Integrated Framework issued by the Committee of Sponsoring Organizations of the Treadway Commission (COSO) because a material weakness in internal control over financial reporting related to the communication and evaluation of a certain customer’s discount and pricing programs existed as of that date. A material weakness is a deficiency, or combination of deficiencies, in internal control over financial reporting, such that there is a reasonable possibility that a material misstatement of the annual or interim financial statements will not be prevented or detected on a timely basis. The material weakness referred to above is described in Management’s Report on Internal Control Over Financial Reporting appearing under Item 9A . We considered this material weakness in determining the nature, timing, and extent of audit tests applied in our audit of the January 1, 2011 consolidated financial statements, and our opinion regarding the effectiveness of the Company’s internal control over financial reporting does not affect our opinion on those consolidated financial statements. The Company’s management is responsible for these financial statements and financial statement schedules, for maintaining effective internal control over financial reporting and for its assessment of the effectiveness of internal control over financial reporting included in management’s report referred to above. Our responsibility is to express opinions on these financial statements, on the financial statement schedule and on the Company’s internal control over financial reporting based on our integrated audits. We conducted our audits in accordance with the standards of the Public Company Accounting Oversight Board (United States). Those standards require that we plan and perform the audits to obtain reasonable assurance about whether the financial statements are free of material misstatement and whether effective internal control over financial reporting was maintained in all material respects. Our audits of the financial statements included examining, on a test basis, evidence supporting the amounts and disclosures in the financial statements, assessing the accounting principles used and significant estimates made by management, and evaluating the overall financial statement presentation. Our audit of internal control over financial reporting included obtaining an understanding of internal control over financial reporting, assessing the risk that a material weakness exists, and testing and evaluating the design and operating effectiveness of internal control based on the assessed risk. Our audits also included performing such other procedures as we considered necessary in the circumstances. We believe that our audits provide a reasonable basis for our opinions.
A company’s internal control over financial reporting is a process designed to provide reasonable assurance regarding the reliability of financial reporting and the preparation of financial statements for external purposes in accordance with generally accepted accounting principles. A company’s internal control over financial reporting includes those policies and procedures that (i) pertain to the maintenance of records that, in reasonable detail, accurately and fairly reflect the transactions and dispositions of the assets of the company; (ii) provide reasonable assurance that transactions are recorded as necessary to permit preparation of financial statements in accordance with generally accepted accounting principles, and that receipts and expenditures of the company are being made only in accordance with authorizations of management and directors of the company; and (iii) provide reasonable assurance regarding prevention or timely detection of unauthorized acquisition, use, or disposition of the company’s assets that could have a material effect on the financial statements.
Because of its inherent limitations, internal control over financial reporting may not prevent or detect misstatements. Also, projections of any evaluation of effectiveness to future periods are subject to the risk that controls may become inadequate because of changes in conditions, or that the degree of compliance with the policies or procedures may deteriorate.
F-2
Table of Contents
As described in Management’s Report on Internal Control Over Financial Reporting, management has excluded the Cliffstar business from its assessment of internal control over financial reporting as of January 1, 2011 because the Company acquired substantially all of the assets and liabilities of Cliffstar Corporation and its affiliated companies (“Cliffstar”). We have also excluded the Cliffstar business from our audit of internal control over financial reporting. Cliffstar’s total assets and total revenues represent 26 percent and 13 percent, respectively, of the related consolidated financial statement amounts as of and for the year ended January 1, 2011.
| /s/ PricewaterhouseCoopers LLP |
| Tampa, Florida |
| March 15, 2011 |
F-3
Table of Contents
Consolidated Statements of Operations
(in millions of U.S. dollars, except share amounts)
| For the Years Ended | ||||||||||||
| January 1, 2011 |
January 2, 2010 |
December 27, 2008 |
||||||||||
| Revenue, net |
$ | 1,803.3 | $ | 1,596.7 | $ | 1,648.1 | ||||||
| Cost of sales |
1,537.0 | 1,346.9 | 1,467.1 | |||||||||
| Gross profit |
266.3 | 249.8 | 181.0 | |||||||||
| Selling, general and administrative expenses |
166.7 | 146.8 | 179.8 | |||||||||
| Loss on disposal of property, plant & equipment |
1.1 | 0.5 | 1.3 | |||||||||
| Restructuring, goodwill and asset impairments |
||||||||||||
| Restructuring |
(0.5 | ) | 1.5 | 6.7 | ||||||||
| Goodwill impairments |
— | — | 69.2 | |||||||||
| Asset impairments |
— | 3.6 | 37.0 | |||||||||
| Operating income (loss) |
99.0 | 97.4 | (113.0 | ) | ||||||||
| Contingent consideration earn-out adjustment |
(20.3 | ) | — | — | ||||||||
| Other expense (income), net |
4.0 | 4.4 | (4.7 | ) | ||||||||
| Interest expense, net |
36.9 | 29.7 | 32.3 | |||||||||
| Income (loss) before income taxes |
78.4 | 63.3 | (140.6 | ) | ||||||||
| Income tax expense (benefit) |
18.6 | (22.8 | ) | (19.5 | ) | |||||||
| Net income (loss) |
$ | 59.8 | $ | 86.1 | $ | (121.1 | ) | |||||
| Less: Net income attributable to non-controlling interests |
5.1 | 4.6 | 1.7 | |||||||||
| Net income (loss) attributed to Cott Corporation |
$ | 54.7 | $ | 81.5 | $ | (122.8 | ) | |||||
| Net income (loss) per common share attributed to Cott Corporation |
||||||||||||
| Basic |
$ | 0.64 | $ | 1.10 | $ | (1.73 | ) | |||||
| Diluted |
0.63 | 1.08 | (1.73 | ) | ||||||||
| Weighted average outstanding shares (thousands) attributed to Cott Corporation |
||||||||||||
| Basic |
85,588 | 74,207 | 71,017 | |||||||||
| Diluted |
86,185 | 75,215 | 71,017 | |||||||||
The accompanying notes are an integral part of these consolidated financial statements.
F-4
Table of Contents
Consolidated Balance Sheets
(in millions of U.S. dollars, except share amounts)
| January 1, 2011 |
January 2, 2010 |
|||||||
| ASSETS |
||||||||
| Current assets |
||||||||
| Cash & cash equivalents |
$ | 48.2 | $ | 30.9 | ||||
| Accounts receivable, net of allowance of $8.3 ($5.9 as of January 2, 2010) |
213.6 | 152.3 | ||||||
| Income taxes recoverable |
0.3 | 20.8 | ||||||
| Inventories |
215.5 | 99.7 | ||||||
| Prepaid expenses and other assets |
32.7 | 16.8 | ||||||
| Total current assets |
510.3 | 320.5 | ||||||
| Property, plant and equipment |
503.8 | 343.0 | ||||||
| Goodwill |
130.2 | 30.6 | ||||||
| Intangibles and other assets |
371.1 | 155.5 | ||||||
| Deferred income taxes |
2.5 | 5.4 | ||||||
| Other tax receivable |
11.3 | 18.8 | ||||||
| Total assets |
$ | 1,529.2 | $ | 873.8 | ||||
| LIABILITIES AND EQUITY |
||||||||
| Current liabilities |
||||||||
| Short-term borrowings |
$ | 7.9 | $ | 20.2 | ||||
| Current maturities of long-term debt |
6.0 | 17.6 | ||||||
| Contingent consideration earn-out |
32.2 | — | ||||||
| Accounts payable and accrued liabilities |
276.6 | 169.3 | ||||||
| Total current liabilities |
322.7 | 207.1 | ||||||
| Long-term debt |
605.5 | 233.2 | ||||||
| Deferred income taxes |
43.6 | 17.5 | ||||||
| Other long-term liabilities |
22.2 | 14.7 | ||||||
| Total liabilities |
994.0 | 472.5 | ||||||
| Contingencies and Commitments—Note 17 |
||||||||
| Equity |
||||||||
| Capital stock, no par—94,750,120 (January 2, 2010—81,331,330) shares issued |
395.6 | 322.5 | ||||||
| Treasury stock |
(3.2 | ) | (4.4 | ) | ||||
| Additional paid-in-capital |
40.8 | 37.4 | ||||||
| Retained earnings |
106.5 | 51.8 | ||||||
| Accumulated other comprehensive loss |
(17.5 | ) | (21.3 | ) | ||||
| Total Cott Corporation equity |
522.2 | 386.0 | ||||||
| Non-controlling interests |
13.0 | 15.3 | ||||||
| Total equity |
535.2 | 401.3 | ||||||
| Total liabilities and equity |
$ | 1,529.2 | $ | 873.8 | ||||
Approved by the Board of Directors:
| /s/ Graham Savage |
| Director |
The accompanying notes are an integral part of these consolidated financial statements.
F-5
Table of Contents
Consolidated Statements of Cash Flows
(in millions of U.S. dollars)
| For the Years Ended | ||||||||||||
| January 1, 2011 |
January 2, 2010 |
December 27, 2008 |
||||||||||
| Operating Activities |
||||||||||||
| Net income (loss) |
$ | 59.8 | $ | 86.1 | $ | (121.1 | ) | |||||
| Depreciation & amortization |
74.0 | 66.2 | 80.7 | |||||||||
| Amortization of financing fees |
2.7 | 1.5 | 1.1 | |||||||||
| Share-based compensation expense |
4.7 | 1.3 | 5.6 | |||||||||
| Increase (decrease) in deferred income taxes |
17.0 | 6.2 | (13.4 | ) | ||||||||
| Decrease in other income tax liabilities |
— | — | (22.7 | ) | ||||||||
| Write-off of financing fees |
1.4 | — | — | |||||||||
| Loss on disposal of property, plant & equipment |
1.1 | 0.5 | 1.3 | |||||||||
| Loss on buyback of Notes |
0.1 | 1.5 | — | |||||||||
| Intangible asset impairments |
— | 3.5 | 35.4 | |||||||||
| Goodwill impairments |
— | — | 69.2 | |||||||||
| Contingent consideration earn-out adjustment |
(20.3 | ) | — | — | ||||||||
| Contract termination charge |
3.6 | — | 0.3 | |||||||||
| Contract termination payments |
(5.4 | ) | (3.8 | ) | (3.8 | ) | ||||||
| Other non-cash items |
5.5 | 2.7 | 4.7 | |||||||||
| Change in operating assets and liabilities, net of acquisition: |
||||||||||||
| Accounts receivable |
(3.9 | ) | 20.8 | 8.5 | ||||||||
| Inventories |
(28.4 | ) | 16.0 | 6.4 | ||||||||
| Prepaid expenses and other current assets |
2.6 | (1.6 | ) | (0.7 | ) | |||||||
| Other assets |
(1.6 | ) | (1.2 | ) | (6.0 | ) | ||||||
| Accounts payable and accrued liabilities |
39.8 | (6.5 | ) | (3.9 | ) | |||||||
| Income taxes recoverable |
25.7 | (38.1 | ) | 25.3 | ||||||||
| Net cash provided by operating activities |
178.4 | 155.1 | 66.9 | |||||||||
| Investing Activities |
||||||||||||
| Acquisition |
(507.7 | ) | — | — | ||||||||
| Additions to property, plant & equipment |
(44.0 | ) | (32.3 | ) | (55.9 | ) | ||||||
| Additions to intangibles |
(4.2 | ) | (1.6 | ) | (3.4 | ) | ||||||
| Proceeds from sale of property, plant & equipment |
1.2 | 1.7 | 4.5 | |||||||||
| Net cash used in investing activities |
(554.7 | ) | (32.2 | ) | (54.8 | ) | ||||||
| Financing Activities |
||||||||||||
| Payments of long-term debt |
(18.7 | ) | (265.5 | ) | (9.0 | ) | ||||||
| Issuance of long-term debt |
375.0 | 211.9 | 33.8 | |||||||||
| Borrowings on credit facility, net |
— | — | (127.5 | ) | ||||||||
| Short-term borrowings, net |
— | — | (8.1 | ) | ||||||||
| Borrowings under ABL |
366.5 | 768.1 | 1,300.3 | |||||||||
| Payments under ABL |
(379.0 | ) | (856.6 | ) | (1,192.7 | ) | ||||||
| Distributions to non-controlling interests |
(7.4 | ) | (6.6 | ) | (3.9 | ) | ||||||
| Issuance of common shares, net of offering fees |
71.1 | 47.5 | — | |||||||||
| Purchase of treasury shares |
— | — | (6.4 | ) | ||||||||
| Financing fees |
(14.2 | ) | (6.2 | ) | (5.3 | ) | ||||||
| Other financing activities |
— | (0.1 | ) | (0.5 | ) | |||||||
| Net cash provided by (used in) financing activities |
393.3 | (107.5 | ) | (19.3 | ) | |||||||
| Effect of exchange rate changes on cash |
0.3 | 0.8 | (5.5 | ) | ||||||||
| Net increase (decrease) in cash & cash equivalents |
17.3 | 16.2 | (12.7 | ) | ||||||||
| Cash & cash equivalents, beginning of period |
30.9 | 14.7 | 27.4 | |||||||||
| Cash & cash equivalents, end of period |
$ | 48.2 | $ | 30.9 | $ | 14.7 | ||||||
| Supplemental Noncash Investing and Financing Activities: |
||||||||||||
| Capital lease additions |
$ | 2.4 | $ | 0.2 | $ | 4.6 | ||||||
| Deferred consideration |
$ | 13.2 | $ | — | $ | — | ||||||
| Contingent consideration earn-out |
$ | 32.2 | $ | — | $ | — | ||||||
| Working capital adjustment |
$ | (4.7 | ) | $ | — | $ | — | |||||
| Supplemental Disclosures of Cash Flow Information: |
||||||||||||
| Cash paid for interest |
$ | 22.8 | $ | 23.8 | $ | 31.1 | ||||||
| Cash (received) paid for income taxes, net |
$ | (24.3 | ) | $ | 11.0 | $ | (9.6 | ) | ||||
The accompanying notes are an integral part of these consolidated financial statements.
F-6
Table of Contents
Consolidated Statements of Equity
(in millions of U.S. dollars, except share amounts)
| Cott Corporation Equity | ||||||||||||||||||||||||||||||||||||||||
| Number of Common Shares (In thousands) |
Number of Treasury Shares (In thousands) |
Common Shares |
Treasury Shares |
Restricted Shares |
Additional Paid-in-Capital |
Retained Earnings (Deficit) |
Accumulated Other Comprehensive Income (Loss) |
Non-Controlling Interests |
Total Equity |
|||||||||||||||||||||||||||||||
| Balance at December 29, 2007 |
71,871 | — | $ | 275.0 | $ | — | $ | (0.4 | ) | $ | 32.2 | $ | 93.1 | $ | 32.3 | $ | 19.6 | $ | 451.8 | |||||||||||||||||||||
| Treasury shares purchased—PSU Plan |
— | 1,954 | — | (5.4 | ) | — | — | — | — | — | (5.4 | ) | ||||||||||||||||||||||||||||
| Treasury shares purchased—EISPP |
— | 353 | — | (1.0 | ) | — | 1.0 | — | — | — | — | |||||||||||||||||||||||||||||
| Restricted shares |
— | — | — | — | 0.4 | (0.4 | ) | — | — | — | — | |||||||||||||||||||||||||||||
| Share-based compensation |
— | — | — | — | — | 5.3 | — | — | — | 5.3 | ||||||||||||||||||||||||||||||
| Distributions to non-controlling interests |
— | — | — | — | — | — | — | — | (3.9 | ) | (3.9 | ) | ||||||||||||||||||||||||||||
| Comprehensive income |
||||||||||||||||||||||||||||||||||||||||
| Currency translation adjustment |
— | — | — | — | — | — | — | (76.6 | ) | (0.1 | ) | (76.7 | ) | |||||||||||||||||||||||||||
| Pension liabilities |
— | — | — | — | — | — | — | (3.5 | ) | — | (3.5 | ) | ||||||||||||||||||||||||||||
| Net (loss) income |
— | — | — | — | — | — | (122.8 | ) | — | 1.7 | (121.1 | ) | ||||||||||||||||||||||||||||
| Balance at December 27, 2008 |
71,871 | 2,307 | $ | 275.0 | $ | (6.4 | ) | $ | — | $ | 38.1 | $ | (29.7 | ) | $ | (47.8 | ) | $ | 17.3 | $ | 246.5 | |||||||||||||||||||
| Common shares issued |
9,435 | — | 47.5 | — | — | — | — | — | — | 47.5 | ||||||||||||||||||||||||||||||
| Treasury shares issued—PSU Plan |
— | (560 | ) | — | 1.4 | — | (1.4 | ) | — | — | — | — | ||||||||||||||||||||||||||||
| Treasury shares issued—EISPP |
— | (243 | ) | — | 0.6 | — | (0.6 | ) | — | — | — | — | ||||||||||||||||||||||||||||
| Share-based compensation |
— | — | — | — | — | 1.3 | — | — | — | 1.3 | ||||||||||||||||||||||||||||||
| Options exercised |
25 | — | — | — | — | — | — | — | — | — | ||||||||||||||||||||||||||||||
| Distributions to non-controlling interests |
— | — | — | — | — | — | — | — | (6.6 | ) | (6.6 | ) | ||||||||||||||||||||||||||||
| Comprehensive income |
||||||||||||||||||||||||||||||||||||||||
| Currency translation adjustment |
— | — | — | — | — | — | — | 26.5 | — | 26.5 | ||||||||||||||||||||||||||||||
| Pension liabilities |
— | — | — | — | — | — | — | — | — | — | ||||||||||||||||||||||||||||||
| Net income |
— | — | — | — | — | — | 81.5 | — | 4.6 | 86.1 | ||||||||||||||||||||||||||||||
| Balance at January 2, 2010 |
81,331 | 1,504 | $ | 322.5 | $ | (4.4 | ) | $ | — | $ | 37.4 | $ | 51.8 | $ | (21.3 | ) | $ | 15.3 | $ | 401.3 | ||||||||||||||||||||
| Common shares issued |
13,486 | — | 71.1 | — | — | — | — | — | — | 71.1 | ||||||||||||||||||||||||||||||
| Treasury shares issued—PSU Plan |
— | (437 | ) | — | 1.2 | — | (1.3 | ) | — | — | — | (0.1 | ) | |||||||||||||||||||||||||||
| Tax Impact of Common Shares Issuance |
— | — | 2.0 | — | — | — | — | — | — | 2.0 | ||||||||||||||||||||||||||||||
| Treasury Shares issued—EISPP |
— | (16 | ) | — | — | — | — | — | — | — | — | |||||||||||||||||||||||||||||
| Common Shares issued—Directors Share |
||||||||||||||||||||||||||||||||||||||||
| Award |
— | — | — | — | — | 0.7 | — | — | — | 0.7 | ||||||||||||||||||||||||||||||
| Share-based compensation |
— | — | — | — | — | 4.0 | — | — | — | 4.0 | ||||||||||||||||||||||||||||||
| Distributions to non-controlling interests |
— | — | — | — | — | — | — | — | (7.4 | ) | (7.4 | ) | ||||||||||||||||||||||||||||
| Comprehensive income |
||||||||||||||||||||||||||||||||||||||||
| Currency translation adjustment |
— | — | — | — | — | — | — | 4.5 | — | 4.5 | ||||||||||||||||||||||||||||||
| Pension liabilities |
— | — | — | — | — | — | — | (0.4 | ) | — | (0.4 | ) | ||||||||||||||||||||||||||||
| Unrealized loss on derivative instruments, net of income tax |
— | — | — | — | — | — | — | (0.3 | ) | — | (0.3 | ) | ||||||||||||||||||||||||||||
| Net income |
— | — | — | — | — | — | 54.7 | — | 5.1 | 59.8 | ||||||||||||||||||||||||||||||
| Balance at January 1, 2011 |
94,817 | 1,051 | $ | 395.6 | $ | (3.2 | ) | $ | — | $ | 40.8 | $ | 106.5 | $ | (17.5 | ) | $ | 13.0 | $ | 535.2 | ||||||||||||||||||||
The accompanying notes are an integral part of these consolidated financial statements.
F-7
Table of Contents
Consolidated Statements of Comprehensive Income
(in millions of U.S. dollars)
| For the Years Ended | ||||||||||||
| January 1, 2011 |
January 2, 2010 |
December 27, 2008 |
||||||||||
| Net income (loss) |
$ | 59.8 | $ | 86.1 | $ | (121.1 | ) | |||||
| Other comprehensive income (loss), net of tax: |
||||||||||||
| Net currency translation |
4.5 | 26.5 | (76.7 | ) | ||||||||
| Pension benefit plan, net of tax |
(0.4 | ) | — | (3.5 | ) | |||||||
| Unrealized loss on derivative instruments |
(0.3 | ) | — | — | ||||||||
| Total other comprehensive income (loss), net of tax |
3.8 | 26.5 | (80.2 | ) | ||||||||
| Comprehensive income (loss) |
$ | 63.6 | $ | 112.6 | $ | (201.3 | ) | |||||
| Less: Net income attributable to non-controlling interests |
5.1 | 4.6 | 1.7 | |||||||||
| Comprehensive income (loss) attributed to Cott Corporation |
$ | 58.5 | $ | 108.0 | $ | (203.0 | ) | |||||
The accompanying notes are an integral part of these consolidated financial statements.
F-8
Table of Contents
Notes to Consolidated Financial Statements
Description of Business
Cott Corporation, together with its consolidated subsidiaries (“Cott,” “the Company,” “our Company,” “Cott Corporation,” “we,” “us,” or “our”), is the world’s largest retailer brand beverage company. Our product lines include carbonated soft drinks (“CSDs”), clear, still and sparkling flavored waters, energy-related drinks, juice, juice-based products, bottled water and ready-to-drink teas.
Note 1—Summary of Significant Accounting Policies
Basis of presentation
These consolidated financial statements have been prepared in accordance with United States (“U.S.”) generally accepted accounting principles (“GAAP”) using the U.S. dollar as the reporting currency, as the majority of our business and the majority of our shareowners are in the U.S.
For the year ended January 1, 2011, we had 52 weeks of activity compared to 53 weeks for the year ended January 2, 2010. We estimate the additional week contributed $20.3 million of additional revenue and $1.3 million of additional operating income for the year ended January 2, 2010.
We operate in five operating segments—North America (which includes our U.S. reporting unit and Canada reporting unit), United Kingdom (“U.K.”) (which includes our United Kingdom reporting unit and our Continental European reporting unit), Mexico, Royal Crown International (“RCI”) and All Other (which includes our international corporate expenses and our Asia reporting unit, which ceased operations at the end of fiscal 2008). We changed our operating segments in the third quarter of 2008 to reflect a change in our management structure and how information is reported to management.
Basis of consolidation
The financial statements consolidate our accounts, our wholly-owned and majority-owned subsidiaries and joint ventures which we control. All intercompany transactions and accounts have been eliminated in consolidation.
During the quarter ended January 1, 2011, we identified an error relating to pricing discounts of $3.7 million for one of our customers that occurred in our quarter ended October 2, 2010. The impact of this error was an overstatement of net revenue and operating results for the quarter and nine months ended October 2, 2010. We assessed the materiality of this error in accordance with guidance within ASC 250-10-S99 (SEC’s Staff Accounting Bulletin 99) and concluded that the previously issued interim financial statements for the quarter and nine months ended October 2, 2010 are not materially misstated. In accordance with guidance within ASC 250-10-S99 (SEC’s Staff Accounting Bulletin 108), we have corrected the immaterial error by revising the prior interim period financial statements for the quarter ended October 2, 2010 as shown in the quarterly financial information in Note 22. This revision will be presented prospectively in future filings. Diluted earnings per share for the quarter ended October 2, 2010 changed from $.09 to $.07 due to the correction of the error.
During the period ended September 27, 2008, we identified an error related to the expensing of certain information technology software costs that were previously capitalized and amortized over an estimated life and during the period ended December 27, 2008, we identified errors relating to foreign exchange gains and losses relating to intercompany debt transactions. We assessed the materiality of these items on the income for the year ended December 27, 2008 and all other periods subsequent to those dates, in accordance with ASC 250, and concluded that these errors were not material to any such periods. In accordance with ASC 250, the December 27, 2008 consolidated financial statements herein have been revised to correct the immaterial errors and to reflect the corrected balances of other expense, currency translation adjustment, intangible assets and
F-9
Table of Contents
selling, general and administrative expenses as of that date. This correction resulted in a reduction of intangible assets of $4.6 million and an increase in selling, general and administrative expenses of $4.6 million and net other expense of $1.0 million in the Consolidated Statements of Income (Loss).
Estimates
The preparation of these consolidated financial statements in conformity with GAAP requires management to make estimates and assumptions that affect the amounts of assets and liabilities and disclosure of contingent assets and liabilities at the date of the financial statements and the amount of revenue and expenses during the reporting period. Actual results could differ from those estimates. The consolidated financial statements include estimates and assumptions which, in the opinion of management, were significant to the underlying amounts representing the future valuation of intangible assets, long-lived assets and goodwill, accounting for share-based compensation, realization of deferred income tax assets and the resolution of tax contingencies. Determining whether impairment has occurred requires various estimates and assumptions including estimates of cash flows that are directly related to the potentially impaired asset, the useful life over which cash flows will occur and their amounts. The measurement of an impairment loss requires an estimate of fair value, which includes estimates of cash flows and the appropriate discount rate.
Accounting Policies
Revenue recognition
We recognize revenue, net of sales returns, when ownership passes to customers for products manufactured in our own plants and/or by third parties on our behalf, and when prices to our customers are fixed and collection is reasonably assured. This may be upon shipment of goods or upon delivery to the customer, depending on contractual terms. Shipping and handling costs paid by the customer to us are included in revenue. Although we accept returns of products from our customers occasionally, such returns, historically, have not been material.
Sales incentives
We participate in various incentive programs with our customers, including volume-based incentives, promotional allowance incentives and contractual rebate incentives. Sales incentives are based on our customers achieving volume targets for a period of time. They are deducted from revenue and accrued as the incentives are earned and are based on management’s estimate of the total the customer is expected to earn and claim. We regularly review customer sales forecasts to ensure volume targets will be met and adjust incentive accruals accordingly.
Cost of sales
We record shipping and handling and finished goods inventory costs in cost of sales. Finished goods inventory costs include the cost of direct labor and materials and the applicable share of overhead expense chargeable to production.
Selling, general and administrative expenses
We record all other expenses not charged to production as selling, general and administrative expenses.
Share-based compensation
Share-based compensation expense for all share-based compensation awards granted after January 1, 2006, is based on the grant-date fair value. We recognized these compensation costs net of a forfeiture rate on a straight-line basis over the requisite service period of the award, which is generally the vesting term of three years. No estimated forfeitures were included in the calculation of share-based compensation for the 2010, 2009 and 2008 share-based awards.
F-10
Table of Contents
Additional paid-in capital is adjusted by the tax impact related to the difference between the amount deducted for tax purposes and the compensation cost for accounting purposes. Where the tax deduction exceeds book compensation cost, an increase in additional paid-in capital is recorded. Where the tax deduction is less than book compensation cost, a reduction in additional paid-in capital is recorded to the extent there is an accumulated balance or charged to income tax expense if a shortfall remains after the accumulated additional paid-in capital is brought to zero.
Cash and Cash Equivalents
Cash and cash equivalents include all highly liquid investments with original maturities not exceeding three months at the time of purchase. The fair values of our cash and cash equivalents approximate the amounts shown on our Consolidated Balance Sheets due to their short-term nature.
Allowance for Doubtful Accounts
A portion of our accounts receivable is not expected to be collected due to non-payment, bankruptcies and sales returns. Our accounting policy for the provision for doubtful accounts requires us to reserve an amount based on the evaluation of the aging of accounts receivable, sales return trend analysis, detailed analysis of high-risk customers’ accounts, and the overall market and economic conditions of our customers.
Inventories
Inventories are stated at the lower of cost, determined on the first-in, first-out method, or net realizable value. Returnable bottles are valued at the lower of cost, deposit value or net realizable value. Finished goods and work-in-process include the cost of raw materials, direct labor and manufacturing overhead costs.
Property, plant and equipment
Property, plant and equipment are stated at cost less accumulated depreciation. Depreciation is determined using the straight-line method over the estimated useful lives of the assets as follows:
| Buildings |
10 to 40 years | |
| Machinery and equipment |
7 to 15 years | |
| Furniture and fixtures |
3 to 10 years | |
| Plates, films and molds |
1 to 10 years | |
| Vending |
5 to 10 years | |
| Transportation equipment |
3 to 15 years |
Leasehold improvements are amortized using the straight-line method over the remaining life of the lease. Maintenance and repairs are charged to operating expense when incurred.
F-11
Table of Contents
Goodwill and indefinite life intangible assets:
| January 1, 2011 | January 2, 2010 | |||||||||||||||||||||||
| (in millions of U.S. dollars) |
Gross Carrying Amount |
Accumulated Impairment Losses |
Net Carrying Amount |
Gross Carrying Amount |
Accumulated Impairment Losses |
Net Carrying Amount |
||||||||||||||||||
| North America |
||||||||||||||||||||||||
| Balance at beginning of year |
$ | 30.7 | $ | 4.6 | $ | 26.1 | $ | 26.5 | $ | 4.0 | $ | 22.5 | ||||||||||||
| Goodwill acquired during the year |
98.2 | — | 98.2 | — | — | — | ||||||||||||||||||
| Foreign exchange |
1.7 | 0.3 | 1.4 | 4.2 | 0.6 | 3.6 | ||||||||||||||||||
| Balance at end of year |
$ | 130.6 | $ | 4.9 | $ | 125.7 | $ | 30.7 | $ | 4.6 | $ | 26.1 | ||||||||||||
| RCI |
||||||||||||||||||||||||
| Balance at beginning of year |
$ | 4.5 | $ | — | $ | 4.5 | $ | 4.5 | $ | — | $ | 4.5 | ||||||||||||
| Goodwill acquired during the year |
— | — | — | — | — | — | ||||||||||||||||||
| Foreign exchange |
— | — | — | — | — | — | ||||||||||||||||||
| Balance at end of year |
$ | 4.5 | $ | — | $ | 4.5 | $ | 4.5 | $ | — | $ | 4.5 | ||||||||||||
| Total |
||||||||||||||||||||||||
| Balance at beginning of year |
$ | 35.2 | $ | 4.6 | $ | 30.6 | $ | 31.0 | $ | 4.0 | $ | 27.0 | ||||||||||||
| Goodwill acquired during the year |
98.2 | — | 98.2 | — | — | — | ||||||||||||||||||
| Foreign exchange |
1.7 | 0.3 | 1.4 | 4.2 | 0.6 | 3.6 | ||||||||||||||||||
| Balance at end of year |
$ | 135.1 | $ | 4.9 | $ | 130.2 | $ | 35.2 | $ | 4.6 | $ | 30.6 | ||||||||||||
Goodwill represents the excess purchase price of acquired businesses over the fair value of the net assets acquired. Goodwill is not amortized, but instead is tested at least annually for impairment in the fourth quarter or more frequently if we determine a triggering event has occurred during the year. Any impairment loss is recognized in our results of operations. We evaluate goodwill for impairment on a reporting unit basis. Reporting units are operations for which discrete financial information is available, and are at or one level below our operating segments. The evaluation of goodwill for each reporting unit is based upon the following approach. We compare the fair value of a reporting unit to its carrying amount. Where the carrying amount is greater than the fair value, the implied fair value of the reporting unit goodwill is determined by allocating the fair value of the reporting unit to all the assets and liabilities of the reporting unit with any of the remainder being allocated to goodwill. The implied fair value of the reporting unit goodwill is then compared to the carrying amount of that goodwill to determine the impairment loss. Any impairment in value is recognized in the Consolidated Statements of Operations. The goodwill on our balance sheet at January 1, 2011 represents amounts for the U.S. and Canada reporting units and the RCI operating segment.
We measure the fair value of reporting units using a mix of the income approach (which is based on the discounted cash flow of the reporting unit) and the public company approach. We use a combination of the two approaches which provides a more accurate valuation because it incorporates the actual cash generation of the company in addition to how a third party market participant would value the reporting unit. Because the business is assumed to continue in perpetuity, the discounted future cash flow includes a terminal value. We used a weighted average terminal growth rate of 2% for our Canada reporting unit in 2010 and 2009, respectively, and 2% and 0% for our RCI reporting unit in 2010 and 2009, respectively. The long-term growth assumptions incorporated into the discounted cash flow calculation reflect our long-term view of the market (including a decline in CSD demand), projected changes in the sale of our products, pricing of such products and operating profit margins. The estimated revenue changes in this analysis for the Canada reporting unit and RCI reporting unit range between -7.9% and 7.2% for 2010 and between -0.3% and 10.8% for 2009.
The discount rate used for the fair value estimates was 10% for 2010 and 11% for 2009. This rate is based on the weighted average cost of capital a market participant would use if evaluating the reporting unit as an investment. The risk-free rate for 2010 was 4.1% and is based on a 20-year U.S. Treasury Bill as of the valuation date.
F-12
Table of Contents
All goodwill in the U.S. reporting unit is attributable to the Cliffstar Acquisition.
Each year during the fourth quarter, we re-evaluate the assumptions used to reflect changes in the business environment, such as revenue growth rates, operating profit margins and discount rate. Based on the evaluation performed this year utilizing the assumptions above, we determined that the fair value of each of our reporting units exceeded their carrying amount and as a result further impairment testing was not required. We analyzed the sensitivity these assumptions have on our overall impairment assessment and note that as of January 1, 2011 annual assessment, the fair value for each of these reporting units was substantially in excess of its carrying value.
We determined that as of September 27, 2008, our United Kingdom reporting unit’s goodwill was impaired based on our estimate of its fair value. This impairment analysis was triggered due to cumulative declines in our cash flows in the United Kingdom, which was lower than the forecast used to value this asset in our 2007 impairment analysis. This decrease in cash flow was partly the result of lower than anticipated volumes and the adverse impact of rising commodities on our raw material costs. Allocating this fair value to the assets and liabilities to the United Kingdom reporting unit resulted in a $69.2 million goodwill impairment charge.
Intangible and other assets
As of January 1, 2011, other definite life assets were $326.1 million, which consisted principally of $274.5 million of customer relationships that arose from acquisitions. Customer relationships are amortized on a straight-line basis for the period over which we expect to receive economic benefits. We review the estimated useful life of these intangible assets annually, taking into consideration the specific net cash flows related to the intangible asset, unless a review is required more frequently due to a triggering event such as the loss of a customer. The permanent loss or significant decline in sales to any customer included in the intangible asset would result in impairment in the value of the intangible asset or accelerated amortization and could lead to an impairment of fixed assets that were used to service that customer. In 2010, we recorded $216.9 million of customer relationships acquired in connection with the Cliffstar Acquisition. In 2009, we recorded a $3.5 million customer relationship impairment charge for the loss of a customer.
Our only intangible asset with an indefinite life relates to the 2001 acquisition of intellectual property from Royal Crown Company, Inc. including the right to manufacture our concentrates, with all related inventions, processes, technologies, technical and manufacturing information, know-how and the use of the Royal Crown brand outside of North America and Mexico (the “Rights”) which has a net book value of $45.0 million. Prior to 2001, we paid a volume based royalty to the Royal Crown Company for purchase of concentrates. There are no legal, regulatory, contractual, competitive, economic, or other factors that limit the useful life of this intangible.
The life of the Rights is considered to be indefinite and therefore not amortized, but instead is tested at least annually for impairment or more frequently if we determine a triggering event has occurred during the year. For an intangible asset with an indefinite life, we compare the carrying amount of the Rights to their fair value and where the carrying amount is greater than the fair value, we recognize in income an impairment loss. To determine fair value, we use a relief from royalty method which calculates a fair value royalty rate that is applied to a forecast of future volume shipments of concentrate that is used to produce CSDs. The forecast of future volumes is based on the estimated inter-plant shipments and RCI shipments. The royalty relief method is used since the Rights were purchased in part to avoid making future royalty payments for concentrate to the Royal Crown Company. The resulting cash flows are discounted using the same assumptions discussed above for goodwill. No impairment was calculated as of January 1, 2011. As of September 27, 2008, we recorded an asset impairment related to the Rights of $27.4 million, triggered primarily by the decline of our North America case volume (including reductions in volume with Wal-Mart) and lower anticipated overseas concentrate volume in our RCI operating segment. We incurred an additional $8.0 million asset impairment as of December 27, 2008 to reflect additional anticipated volume declines in our RCI operating segment for a total impairment of $35.4 million. Absent any other changes, if our inter-plant concentrate volume declines by 1.0% from our estimated volume, the value of our Rights would decline by approximately $0.9 million. If our RCI volume declines by
F-13
Table of Contents
1.0% from our estimated volume, the value of the Rights would decline by approximately $1.9 million. If our discounted borrowing rate increases by 100 basis points, the value of the Rights would decline by approximately $3.2 million.
Impairment of long lived assets
When adverse events occur, we compare the carrying amount of long-lived assets to the estimated undiscounted future cash flows at the lowest level of independent cash flows for the group of long-lived assets and recognize any impairment loss in the Consolidated Statements of Operations, taking into consideration the timing of testing and the asset’s remaining useful life. The expected life and value of these long-lived assets is based on an evaluation of the competitive environment, history and future prospects as appropriate. We did not record any impairments of long-lived assets in 2010 or 2009. In 2008, we recorded impairment losses totaling $1.6 million for both the Elizabethtown, Kentucky facility and certain hot-filled production assets that were held-for-sale.
Foreign currency translation
The assets and liabilities of non-U.S. active operations, all of which are self-sustaining, are translated to U.S. dollars at the exchange rates in effect at the balance sheet dates. Revenues and expenses are translated using average monthly exchange rates prevailing during the period. The resulting gains or losses are recorded in accumulated comprehensive income under shareowners’ equity.
Taxation
We account for income taxes under the asset and liability method. Deferred tax assets and liabilities are recognized based on the differences between the accounting values of assets and liabilities and their related tax bases using currently enacted income tax rates. A valuation allowance is established to reduce deferred income tax assets if, on the basis of available evidence, it is not more likely than not that all or a portion of any deferred tax assets will be realized. We classify interest and income tax penalties as income tax expense (benefit).
We account for uncertain tax positions using a two-step process. The first step is to evaluate the tax position for recognition by determining if the weight of available evidence indicates that it is more likely than not that the position will be sustained on audit, including resolution of related appeals or litigation processes, based on the technical merits. The second step requires us to estimate and measure the tax benefit as the largest amount that is more than 50% likely to be realized upon ultimate settlement. It is inherently difficult and subjective to estimate such amounts, as we have to determine the probability of various possible outcomes. We re-evaluate these uncertain tax positions on a quarterly basis. This evaluation is based on factors including, but not limited to, changes in facts or circumstances, changes in tax law, effectively settled issues under audit, and new audit activity. Such a change in recognition or measurement would result in the recognition of a tax benefit or an additional charge to the tax provision.
We recognize interest and penalties related to unrecognized tax benefits within the income tax expense line in the accompanying Consolidated Statements of Operations. Accrued interest and penalties are included within the other long-term liabilities line in the Consolidated Balance Sheets.
Pension costs
We record annual amounts relating to defined benefit pension plans based on calculations, which include various actuarial assumptions such as discount rates and assumed rates of return depending on the pension plan. Material changes in pension costs may occur in the future due to changes in these assumptions. Future annual amounts could be impacted by changes in the discount rate, changes in the expected long-term rate of return, changes in the level of contributions to the plans and other factors. The funded status is the difference between the fair value of plan assets and the benefit obligation. Future actuarial gains or losses that are not recognized as net periodic benefits cost in the same periods will be recognized as a component of other comprehensive income.
F-14
Table of Contents
Recently issued accounting pronouncements
ASC No. 810—Variable Interest Entity (formerly SFAS No. 167)
In June 2009, the Financial Accounting Standards Board (“FASB”) issued ASC No. 810, “Amendments to FASB Interpretation No. 46(R)”, which amends FASB Interpretation No. 46 (revised December 2003), to address the elimination of the concept of a qualifying special purpose entity. ASC 810 also replaces the quantitative-based risks and rewards calculation for determining which enterprise has a controlling financial interest in a variable interest entity with an approach focused on identifying which enterprise has the power to direct the activities of a variable interest entity and the obligation to absorb losses of the entity or the right to receive benefits from the entity. Additionally, ASC 810 provides more timely and useful information about an enterprise’s involvement with a variable interest entity. ASC 810 became effective in the first quarter of 2010. This standard does not have an impact on our consolidated financial statements.
ASU 2010 -06— Improving Disclosures about Fair Value Measurements
In January 2010, the FASB issued Accounting Standards Update (“ASU”) 2010-06, “Improving Disclosures about Fair Value Measurements”. ASU 2010-06 requires additional disclosures about fair value measurements including transfers in and out of Levels 1 and 2 and a higher level of disaggregation for the different types of financial instruments. For the reconciliation of Level 3 fair value measurements, information about purchases, sales, issuances and settlements are presented separately. This standard is effective for interim and annual reporting periods beginning after December 15, 2009 with the exception of revised Level 3 disclosure requirements which are effective for interim and annual reporting periods beginning after December 15, 2010. Comparative disclosures are not required in the year of adoption. We adopted the provisions of the standard on January 3, 2010, which did not have a material impact on our financial statements.
Note 2—Acquisition
On August 17, 2010, we completed the acquisition of substantially all of the assets and liabilities of Cliffstar and its affiliated companies for approximately $500.0 million payable in cash, $14.0 million in deferred consideration to be paid over three years and contingent consideration of up to $55.0 million, the first $15.0 million of which is payable upon the achievement of milestones in upgrading certain expansion projects in 2010, and the remainder of which is based on the achievement of certain performance measures during the fiscal year ending January 1, 2011.
The total consideration paid by us in the Cliffstar Acquisition is summarized below:
| (in millions of U.S. dollars) |
||||
| Cash |
$ | 500.0 | ||
| Deferred consideration 1 |
13.2 | |||
| Contingent consideration earn-out 2 |
52.5 | |||
| Working Capital Payment 3 |
3.0 | |||
| Total Consideration |
$ | 568.7 | ||
| 1 | Principal amount of $14.0 million to be paid in three equal annual installments and recorded at fair value. |
| 2 | Represents estimated original contingent consideration based on probability of achievement of EBITDA targets recorded at fair value. |
| 3 | Represents amount paid to seller for closing balance sheet working capital. |
The Cliffstar Acquisition was financed through the issuance of $375.0 million aggregate principal amount of 8.125% senior notes due 2018 (the “2018 Notes”), the underwritten public offering of 13.4 million of our common shares (the “Equity Offering”) and borrowings under our credit facility, which we refinanced in connection with the Cliffstar Acquisition, to increase the amount available for borrowings to $275.0 million.
F-15
Table of Contents
Our primary reasons for the Cliffstar Acquisition were to expand Cott’s product portfolio and manufacturing capabilities, enhance our customer offering and growth prospects, and improve our strategic platform for the future.
The Cliffstar Acquisition is being accounted for under the acquisition method, in accordance with ASC 805, “Business Combinations”, with the assets and liabilities acquired recorded at their fair values at the Acquisition Date. Identified intangible assets, goodwill and property, plant and equipment are recorded at their estimated fair values per valuations. The results of operations of the acquired business have been included in our operating results beginning as of the Acquisition Date. We allocated the purchase price of the Cliffstar Acquisition to tangible assets, liabilities and identifiable intangible assets acquired based on their estimated fair values. The excess of the purchase price over the aggregate fair values was recorded as goodwill. The fair value assigned to identifiable intangible assets acquired was based on estimates and assumptions made by management. Intangible assets are amortized using the straight-line amortization method.
Cliffstar is entitled to contingent consideration of up to a maximum of $55.0 million, the first $15.0 million of which will be due by us if Cliffstar and its affiliated companies achieve milestones in upgrading certain expansion projects in 2010. The remaining contingent consideration will be due by us if Cliffstar and its affiliated companies meet certain targets relating to net income plus interest, income taxes, depreciation and amortization (“EBITDA”) for the fiscal year ended January 1, 2011, adjusted for certain amounts as defined in the Asset Purchase Agreement. We originally estimated the fair value of the contingent payment at $52.5 million based on financial projections of the acquired business and estimated probabilities of achievement. As the fair value was based on significant inputs not observed in the market, the contingent consideration earn-out represents a Level 3 instrument. Level 3 instruments are valued based on unobservable inputs that are supported by little or no market activity and reflect our own assumptions in measuring fair value. We believe that our estimates and assumptions are reasonable, but there is significant judgment involved. Changes in the fair value of contingent consideration liabilities subsequent to the Cliffstar Acquisition will be recorded in our Consolidated Statements of Operations. As of January 1, 2011, the contingent consideration was reduced to $32.2 million. The reduction was due to Cliffstar’s EBITDA being lower than originally projected. The decline in EBITDA is not directly correlated to the reduction in the contingent consideration earn-out accrual due to the tiers as defined in the payment calculation. For example, if EBITDA was between $80.0 million and $83.5 million, $1.00 of EBITDA equaled approximately $5.71 of contingent consideration. The reduction resulted in $20.3 million of pre-tax income which was recorded in the Consolidated Statements of Operations.
In addition to the purchase price, we incurred $7.2 million of acquisition related costs, which were expensed as incurred and recorded in the selling, general, and administrative expenses caption of our Consolidated Statements of Operations for the year ended January 1, 2011, in accordance with ASC 805, “Business Combinations”.
The following table summarizes the allocation of the purchase price to the fair value of the assets acquired and liabilities assumed in connection with the Cliffstar Acquisition.
| (in millions of U.S. dollars) |
As reported at October 2, 2010 |
Adjustments | January 1, 2011 |
|||||||||
| Accounts receivable |
$ | 51.7 | $ | 0.5 | 1 | $ | 52.2 | |||||
| Inventories |
85.8 | 1.3 | 2 | 87.1 | ||||||||
| Prepaid expenses and other assets |
5.4 | 0.3 | 1 | 5.7 | ||||||||
| Property, plant and equipment |
171.4 | (4.1 | ) 3 | 167.3 | ||||||||
| Goodwill |
95.8 | 2.4 | 4 | 98.2 | ||||||||
| Intangibles and other assets |
224.3 | — | 224.3 | |||||||||
| Accounts payable and accrued liabilities |
(62.1 | ) | (1.2 | ) 5 | (63.3 | ) | ||||||
| Other long-term liabilities |
(2.8 | ) | — | (2.8 | ) | |||||||
| Total |
$ | 569.5 | $ | (0.8 | ) | $ | 568.7 | |||||
| 1 | Adjustments related to identifiable assets |
| 2 | Adjustment based on changes in valuation assumptions related to inventory |
| 3 | Adjustment based on final valuation of property, plant and equipment |
F-16
Table of Contents
| 4 | Adjustment based on changes in the provisional amounts |
| 5 | Adjustment related to identifiable liability for a supplier agreement |
Intangible Assets
In our determination of the fair value of the intangible assets, we considered, among other factors, the best use of acquired assets, analysis of historical financial performance and estimates of future performance of Cliffstar’s products. The estimated fair values of identified intangible assets were calculated considering market participant expectations and using an income approach and estimates and assumptions provided by Cliffstar’s and our management. The following table sets forth the components of identified intangible assets associated with the Cliffstar Acquisition and their estimated weighted average useful lives:
| (in millions of U.S. dollars) |
Estimated Fair Market Value |
Estimated Useful Life |
||||||
| Customer relationships |
$ | 216.9 | 15 years | |||||
| Non-competition agreements |
6.6 | 3 years | ||||||
| Total |
$ | 223.5 | ||||||
Customer relationships represent future projected revenue that will be derived from sales to existing customers of the acquired company.
In conjunction with the closing of the Cliffstar Acquisition, certain key employees of Cliffstar executed non-competition agreements, which prevent those employees from competing with us in specified restricted territories for a period of three years from the Acquisition Date. The value of the Cliffstar business could be materially diminished without these non-competition agreements.
Goodwill
The principal factor that resulted in recognition of goodwill was that the purchase price for the Cliffstar Acquisition was based in part on cash flow projections assuming the reduction of administration costs and the integration of acquired customers and products into our operations, which is of greater value than on a standalone basis. Goodwill is expected to be deductible for tax purposes.
Supplemental Pro Forma Data (unaudited)
The following unaudited pro forma financial information for the years ended January 1, 2011 and January 2, 2010 represent the combined results of our operations as if the Cliffstar Acquisition had occurred on December 27, 2008. The unaudited pro forma results reflect certain adjustments related to the Cliffstar Acquisition such as increased amortization expense on acquired intangible assets resulting from the preliminary fair valuation of assets acquired. The unaudited pro forma financial information does not necessarily reflect the results of operations that would have occurred had we operated as a single entity during such period.
| For the Years Ended | ||||||||
| (in millions of U.S. dollars, except share amounts) |
January 1, 2011 | January 2, 2010 | ||||||
| Revenue |
$ | 2,206.5 | $ | 2,268.0 | ||||
| Net income 1 |
67.0 | 87.1 | ||||||
| Net income per common share, diluted |
$ | 0.78 | $ | 0.93 | ||||
| 1 | For the year ended January 2, 2010, Cott recorded restructuring charges of $1.5 million due to the 2009 Restructuring Plan (as defined in Note 3) and $3.6 million of asset impairments primarily related to the write-off of a customer list. For the year ended January 1, 2011, Cott recorded a restructuring gain of $0.5 million related to the North American Plan (as defined in Note 3). |
Revenues for Cliffstar since the date of the Cliffstar Acquisition were $232.2 million and operating income was $5.2 million.
F-17
Table of Contents
Note 3—Restructuring, Goodwill and Asset Impairments
The Company implements restructuring programs from time to time that are designed to improve operating effectiveness and lower costs. When the Company implements these programs, it incurs various charges, including severance, contract termination and asset impairments, and other employment related costs. In 2007, the Company implemented one such program, which involved the realignment of the management of our Canadian and U.S. businesses to a North American basis, rationalization of our product offerings, elimination of underperforming assets, an increased focus on high potential accounts, and the closure of several plants and warehouses in North America that resulted in lease contract termination losses and a partial reduction in our workforce (the “North American Plan”). The Company also implemented a plan in 2009 (the “2009 Restructuring Plan”) that resulted in a further reduction of our workforce. During the year ended January 1, 2011, the Company made $5.4 million of cash payments related to the North American Plan. These cash payments included $3.0 million related to the settlement of one of its lease obligations, which resulted in a gain of $0.4 million. In addition, the Company recorded a $0.1 million gain related to other non-cash charges for the North American Plan during the year ended January 1, 2011. In 2009, we recorded restructuring and asset impairments of $5.1 million, which included $3.6 million for asset impairments primarily related to customer relationships and severance costs of $1.5 million related to the organizational restructuring and headcount reductions associated with the 2009 Restructuring Plan.
The following table summarizes restructuring, goodwill impairment and asset impairment charges (gains) for the years ended January 1, 2011, January 2, 2010 and December 27, 2008:
| For the Years Ended | ||||||||||||
| (in millions of U.S. dollars) |
January 1, 2011 |
January 2, 2010 |
December 27, 2008 |
|||||||||
| Restructuring |
$ | (0.5 | ) | $ | 1.5 | $ | 6.7 | |||||
| Goodwill impairments |
— | — | 69.2 | |||||||||
| Asset impairments |
— | 3.6 | 37.0 | |||||||||
| $ | (0.5 | ) | $ | 5.1 | $ | 112.9 | ||||||
The following table is a summary of our restructuring liabilities as of January 1, 2011, along with charges (gains) to costs and expenses and cash payments:
North American Plan:
| (in millions of U.S. dollars) |
Balance at January 2, 2010 |
Charge (Gain) to Costs and Expenses |
Payments made during the year |
Balance at January 1, 2011 |
||||||||||||
| Lease contract termination loss |
5.8 | (0.4 | ) | (5.4 | ) | — | ||||||||||
| $ | 5.8 | $ | (0.4 | ) | $ | (5.4 | ) | $ | — | |||||||
As of January 1, 2011, no amounts are owed under the North American Plan.
The following table is a summary of our restructuring liabilities as of January 2, 2010, along with charges to costs and expenses and cash payments:
| (in millions of U.S. dollars) |
Balance at December 27, 2008 |
Charge to Costs and Expenses |
Payments made during the year |
Balance at January 2, 2010 |
||||||||||||
| Lease contract termination loss |
9.6 | — | (3.8 | ) | 5.8 | |||||||||||
| $ | 9.6 | $ | — | $ | (3.8 | ) | $ | 5.8 | ||||||||
F-18
Table of Contents
2009 Restructuring Plan:
| (in millions of U.S. dollars) |
Balance at December 27, 2008 |
Charge to Costs and Expenses |
Payments made during the year |
Balance at January 2, 2010 |
||||||||||||
| Severance and termination benefits |
$ | — | $ | 1.5 | $ | (1.5 | ) | $ | — | |||||||
| $ | — | $ | 1.5 | $ | (1.5 | ) | $ | — | ||||||||
As of January 1, 2011, no amounts were owed under the 2009 Restructuring Plan.
In 2009, $3.0 million (December 27, 2008—$5.8 million) of the lease contract termination loss liability was recorded as other long-term liabilities and $2.8 million of lease contract termination loss liability (December 27, 2008—$3.8 million) was classified as accounts payable and accrued liabilities. We also incurred $0.3 million of additional termination benefits in 2008 related to our Wyomissing property, which was closed in 2007.
In 2008, we recorded pre-tax restructuring charges totaling $6.4 million in connection with severance costs relating to headcount reductions associated with the Refocus Plan.
Year ended January 1, 2011
The following table summarizes our restructuring charges (gains) on an operating segment basis for the year ended January 1, 2011.
| (in millions of U.S. dollars) |
North America | Total | ||||||
| Restructuring (gain) |
$ | (0.5 | ) | $ | (0.5 | ) | ||
| $ | (0.5 | ) | $ | (0.5 | ) | |||
Restructuring—In 2010, we recorded pre-tax restructuring gains totaling $0.5 million primarily in connection with a gain on a lease contract termination.
Asset impairments—In 2010, we did not record any asset impairment charges related to customer relationships. In 2009, we recorded an asset impairment charge of $3.6 million related primarily to customer relationships. In accordance with ASC 360, it was determined that our customer relationship intangible asset no longer had future cash flows due to the loss of a specific customer. As a result, the customer relationship was determined to have a nil carrying value.
Year ended January 2, 2010
The following table summarizes restructuring and asset impairment charges on an operating segment basis for the year ended January 2, 2010.
| (in millions of U.S. dollars) |
North America | Total | ||||||
| Restructuring |
$ | 1.5 | $ | 1.5 | ||||
| Asset impairments |
3.6 | 3.6 | ||||||
| $ | 5.1 | $ | 5.1 | |||||
Restructuring—In 2009, we recorded pre-tax restructuring charges totaling $1.5 million in connection with severance costs relating to headcount reductions associated with the 2009 Restructuring Plan.
Asset impairments—In 2009, we recorded an asset impairment charge of $3.6 million related primarily to customer relationships. In accordance with ASC 360, it was determined that our customer relationship intangible asset no longer had future cash flows due to the loss of a specific customer. As a result, the customer relationship was determined to have a nil carrying value.
F-19
Table of Contents
Year ended December 27, 2008
The following table summarizes our restructuring, goodwill and asset impairments on an operating segment basis for the year ended December 27, 2008.
| (in millions of U.S. dollars) |
North America | U.K. | Total | |||||||||
| Restructuring |
$ | 6.7 | $ | — | $ | 6.7 | ||||||
| Goodwill impairments |
— | 69.2 | 69.2 | |||||||||
| Asset impairments |
37.0 | — | 37.0 | |||||||||
| $ | 43.7 | $ | 69.2 | $ | 112.9 | |||||||
Restructuring—On June 19, 2008, we announced the Refocus Plan. In 2008, we recorded pre-tax restructuring charges totaling $6.4 million in connection with severance costs relating to headcount reductions associated with the Refocus Plan.
Asset impairments—In 2008, we recorded an asset impairment charge related to the Rights of $35.4 million and recorded a $2.6 million asset impairment charge for our Elizabethtown facility. We also recovered $1.0 million of previously impaired held-for-sale assets (hot filled production assets) in 2008.
Goodwill impairments—We recorded a goodwill impairment loss of $69.2 million associated with our United Kingdom reporting unit as disclosed in Note 1.
Note 4—Other Expense (Income), Net
| For the Years Ended | ||||||||||||
| (in millions of U.S. dollars) |
January 1, 2011 |
January 2, 2010 |
December 27, 2008 |
|||||||||
| Foreign exchange loss |
$ | 2.6 | $ | 1.1 | $ | 1.0 | ||||||
| Insurance reimbursement |
— | — | (4.5 | ) | ||||||||
| Write-off of financing fees |
1.4 | 3.3 | — | |||||||||
| Other (gain) |
— | — | (1.2 | ) | ||||||||
| Total |
$ | 4.0 | $ | 4.4 | $ | (4.7 | ) | |||||
Note 5—Interest Expense, Net
| For the Years Ended | ||||||||||||
| (in millions of U.S. dollars) |
January 1, 2011 |
January 2, 2010 |
December 27, 2008 |
|||||||||
| Interest on long-term debt |
$ | 31.6 | $ | 23.6 | $ | 22.9 | ||||||
| Other interest expense |
5.4 | 6.2 | 10.0 | |||||||||
| Interest income |
(0.1 | ) | (0.1 | ) | (0.6 | ) | ||||||
| Total |
$ | 36.9 | $ | 29.7 | $ | 32.3 | ||||||
Note 6—Income Taxes
Income (loss) before income taxes consisted of the following:
| For the Years Ended | ||||||||||||
| (in millions of U.S. dollars) |
January 1, 2011 |
January 2, 2010 |
December 27, 2008 |
|||||||||
| Canada |
$ | 16.2 | $ | 0.8 | $ | 1.9 | ||||||
| Outside Canada |
62.2 | 62.5 | (142.5 | ) | ||||||||
| Income (loss) before income taxes |
$ | 78.4 | $ | 63.3 | $ | (140.6 | ) | |||||
F-20
Table of Contents
Income tax expense (benefit) consisted of the following:
| For the Years Ended | ||||||||||||
| (in millions of U.S. dollars) |
January 1, 2011 |
January 2, 2010 |
December 27, 2008 |
|||||||||
| Current |
||||||||||||
| Canada |
$ | 0.5 | $ | (20.2 | ) | $ | 0.4 | |||||
| Outside Canada |
1.8 | (8.8 | ) | (8.8 | ) | |||||||
| $ 2.3 | $ | (29.0 | ) | $ | (8.4 | ) | ||||||
| Deferred |
||||||||||||
| Canada |
$ | 4.0 | $ | 3.3 | $ | — | ||||||
| Outside Canada |
12.3 | 2.9 | (11.1 | ) | ||||||||
| $16.3 | $ | 6.2 | $ | (11.1 | ) | |||||||
| Income tax expense (benefit) |
$ | 18.6 | $ | (22.8 | ) | $ | (19.5 | ) | ||||
The following table reconciles income taxes calculated at the basic Canadian corporate rates with the income tax provision:
| For the Years Ended | ||||||||||||
| (in millions of U.S. dollars) |
January 1, 2011 |
January 2, 2010 |
December 27, 2008 |
|||||||||
| Income tax expense (benefit) based on |
||||||||||||
| Canadian statutory rates |
$ | 22.7 | $ | 19.9 | $ | (44.9 | ) | |||||
| Foreign tax rate differential |
4.2 | 2.7 | (4.5 | ) | ||||||||
| Tax Exempt Income |
(5.6 | ) | (2.8 | ) | (3.3 | ) | ||||||
| Increase (decrease) in valuation allowance |
1.0 | (22.7 | ) | 24.3 | ||||||||
| Decrease to ASC 740 reserve |
(2.2 | ) | (17.5 | ) | (12.7 | ) | ||||||
| Non-controlling interests |
(1.8 | ) | (1.4 | ) | (0.5 | ) | ||||||
| Non-deductible goodwill impairment |
— | — | 21.7 | |||||||||
| Other items |
0.3 | (1.0 | ) | 0.4 | ||||||||
| Income tax expense (benefit) |
$ | 18.6 | $ | (22.8 | ) | $ | (19.5 | ) | ||||
Deferred income tax assets and liabilities were recognized on temporary differences between the financial and tax bases of existing assets and liabilities as follows:
| For the Years Ended | ||||||||
| (in millions of U.S. dollars) |
January 1, 2011 |
January 2, 2010 |
||||||
| Deferred tax assets |
||||||||
| Loss carryforwards |
$ | 21.5 | $ | 10.1 | ||||
| Leases |
6.8 | 8.6 | ||||||
| Property, plant and equipment |
4.8 | 7.4 | ||||||
| Liabilities and reserves |
12.2 | 9.5 | ||||||
| Intangibles |
7.3 | 9.5 | ||||||
| Stock Options |
2.4 | 7.1 | ||||||
| Other |
2.1 | — | ||||||
| 57.1 | 52.2 | |||||||
| Deferred tax liabilities |
||||||||
| Property, plant and equipment |
(54.8 | ) | (37.3 | ) | ||||
| Intangible assets |
(5.0 | ) | (5.5 | ) | ||||
| Other |
(8.0 | ) | (1.1 | ) | ||||
| (67.8 | ) | (43.9 | ) | |||||
| Valuation allowance |
(12.7 | ) | (17.6 | ) | ||||
| Net deferred tax liability |
$ | (23.4 | ) | $ | (9.3 | ) | ||
F-21
Table of Contents
The decrease in the valuation allowance from January 2, 2010 and January 1, 2011 was primarily the result of deferred tax assets relating to equity compensation that were written off against the valuation allowance because these awards either expired or were terminated prior to the release of the valuation allowances associated with these assets.
The deferred tax assets and liabilities have been classified as follows on the consolidated balance sheet:
| For the Years Ended | ||||||||
| (in millions of U.S. dollars) |
January 1, 2011 |
January 2, 2010 |
||||||
| Deferred tax assets: |
||||||||
| Current |
$ | 18.2 | $ | 3.2 | ||||
| Long-term |
2.5 | 5.4 | ||||||
| Deferred tax liabilities: |
||||||||
| Current |
$ | (0.5 | ) | $ | (0.4 | ) | ||
| Long-term |
(43.6 | ) | (17.5 | ) | ||||
| Net deferred tax liability |
$ | (23.4 | ) | $ | (9.3 | ) | ||
As a result of certain realization requirements of ASC Topic 718, “Compensation—Stock Compensation” (“ASC 718”), the table of deferred tax assets and liabilities shown above does not include certain deferred tax assets at January 1, 2011 and January 2, 2010 that arose directly from tax deductions related to equity compensation in excess of compensation recognized for financial reporting. Equity will be increased by $0.8 million if and when such deferred tax assets are ultimately realized.
As of January 1, 2011, we have claimed the indefinite reversal exceptions of ASC 740.
As of January 1, 2011, we reflected operating loss carryforwards totaling $166.8 million and credit carryforwards totaling $1.4 million. The operating loss carryforward amount was attributable to Mexico operating loss carryforwards of $15.8 million that will expire from 2018 to 2020 and U.S. federal and state operating loss carryforwards of $26.6 million and $124.4 million, respectively. The U.S. federal operating loss carryforwards will expire from 2027 to 2030, and the state operating loss carryforwards will expire from 2011 to 2030. The credit carryforward amount was attributable to a U.S. federal alternative minimum tax credit carryforward of $0.6 million with an indefinite life and U.S. state credit carryforwards of $0.8 million that will expire from 2014 to 2017.
We establish a valuation allowance to reduce deferred tax assets if, based on the weight of the available evidence, both positive and negative, for each respective tax jurisdiction, it is more likely than not that some portion or all of the deferred tax assets will not be realized. Due to cumulative losses generated in recent years in certain U.S. states and Mexico, we have determined that it is more likely than not that the benefit from net operating loss carryforwards and other net deferred tax assets in these jurisdictions will not be realized in the future. In recognition of this risk, we have provided a valuation allowance of $12.7 million on the net deferred tax assets relating to our net deferred tax assets in these jurisdictions. If our assumptions change and we determine we will be able to realize these deferred tax assets, an income tax benefit of $12.6 million will be realized as a result of the reversal of the valuation allowance at January 1, 2011.
In 2006, the FASB issued guidance regarding provisions of uncertain tax positions in ASC 740, which provides specific guidance on the financial statement recognition, measurement, reporting and disclosure of uncertain tax positions taken or expected to be taken in a tax return. ASC 740 addresses the determination of whether tax benefits, either permanent or temporary, should be recorded in the financial statements.
F-22
Table of Contents
A reconciliation of the beginning and ending amount of our unrecognized tax benefits is as follows:
| For the Years Ended | ||||||||||||
| (in millions of U.S. dollars) |
January 1, 2011 |
January 2, 2010 |
December 27, 2008 |
|||||||||
| Unrecognized tax benefits at beginning of year |
$ | 14.7 | $ | 38.7 | $ | 62.9 | ||||||
| Additions based on tax positions taken during a prior period |
0.4 | 2.2 | 0.8 | |||||||||
| Reductions based on tax positions taken during a prior period |
(2.6 | ) | (29.9 | ) | (9.5 | ) | ||||||
| Settlement on tax positions taken during a prior period |
(0.8 | ) | (0.4 | ) | (7.4 | ) | ||||||
| Additions based on tax positions taken during the current period |
1.1 | 1.7 | 0.7 | |||||||||
| Foreign exchange |
0.5 | 2.4 | (8.8 | ) | ||||||||
| Unrecognized tax benefits at end of year |
$ | 13.3 | $ | 14.7 | $ | 38.7 | ||||||
As of January 1, 2011, we had $13.3 million of unrecognized tax benefits, a net decrease of $1.4 million from $14.7 million as of January 2, 2010. If the Company recognized its tax positions, approximately $2.3 million would favorably impact the effective tax rate. We believe it is reasonably possible that its unrecognized tax benefits will decrease or be recognized in the next twelve months by up to $0.8 million due to the settlement of certain tax positions.
We recognize interest and penalties related to unrecognized tax benefits in the provision for income taxes. We recovered $0.2 million, $2.1 million and $5.5 million of interest and penalties during the year ended January 1, 2011, January 2, 2010 and December 27, 2008, respectively. The amount of interest and penalties recognized as an asset in the Consolidated Balance Sheets for 2010 and 2009 was $2.7 million and $3.6 million, respectively.
We are currently under audit in the U.S. by the Internal Revenue Service for tax year 2008. Years prior to 2006 are closed to audit by the Internal Revenue Service. Years prior to 2005 are closed to audit by U.S. state jurisdictions. We are also currently under audit in Canada by the Canada Revenue Agency (“CRA”) for tax years 2005 through 2008. Years prior to 1997 are closed to audit by the CRA. In the U.K., years prior to 2005 are closed to audit.
Note 7—Share-based Compensation
Each of our share-based compensation plans has been approved by our shareowners, except for our 1986 Common Share Option Plan, as amended (the “Option Plan”), which was adopted prior to our initial public offering, and a stock option award granted to our Chief Executive Officer, which was an inducement grant made to attract and retain that executive. Subsequent amendments to the Option Plan that required shareowner approval have been so approved.
F-23
Table of Contents
The table below summarizes the share-based compensation expense for the years ended January 1, 2011, January 2, 2010, and December 27, 2008. This share-based compensation expense was recorded in selling, general, and administrative expenses in our Consolidated Statements of Operations. As used below, “PSUs” mean performance share units granted under our Amended and Restated Performance Share Unit Plan. As used below, “Performance-based RSUs” mean restricted share units with performance-based vesting granted under our 2010 Equity Incentive Plan. As used below, “Time-based RSUs” mean restricted share units with time-based vesting granted under our 2010 Equity Incentive Plan.
| For the Years Ended | ||||||||||||
| (in millions of U.S. dollars) |
January 1, 2011 |
January 2, 2010 |
December 27, 2008 |
|||||||||
| Stock options |
$ | 1.0 | $ | 0.1 | $ | 0.8 | ||||||
| PSUs |
0.2 | 0.8 | 2.2 | |||||||||
| Performance-based RSUs |
1.4 | — | — | |||||||||
| Time-based RSUs |
1.3 | — | — | |||||||||
| Director share units |
0.7 | — | — | |||||||||
| Share appreciation rights |
0.1 | 0.4 | 0.5 | |||||||||
| Restricted Stock |
— | 0.1 | — | |||||||||
| Interim CEO award |
— | (0.1 | ) | 0.8 | ||||||||
| Former CEO award |
— | — | 1.9 | |||||||||
| EISPP award |
— | — | 0.1 | |||||||||
| Total |
$ | 4.7 | $ | 1.3 | $ | 6.3 | ||||||
As of January 1, 2011, the unrecognized share-based compensation expense and years we expect to recognize as future compensation expense were as follows:
| (in millions of U.S. dollars) |
Unrecognized share-based compensation expense as of January 1, 2011 |
Weighted average years expected to recognize compensation |
||||||
| Performance-based RSUs |
8.6 | 2.0 | ||||||
| Time-based RSUs |
6.0 | 2.0 | ||||||
| Total |
$ | 14.6 | ||||||
Option Plan
There were no common shares issued pursuant to option exercises during the year ended January 1, 2011. Options representing 250,000 shares were granted to our Chief Executive Officer during the first quarter of 2010 at an exercise price of C$8.01 per share. The fair value of this option grant was estimated to be C$5.16 using the Black-Scholes option pricing model. On August 9, 2010, the Company entered into a Common Share Option Cancellation and Forfeiture Agreement to cancel this option award. The cancellation was effective as of September 22, 2010. The Company entered into this arrangement with the Chief Executive Officer in order to transition him to the Company’s 2010 Equity Incentive Plan, which was approved by shareholders on May 4, 2010. Future grants to this and other executive officers are expected to be governed by the terms of such plan.
Options representing 250,000 shares were issued during the year ended January 2, 2010 at an exercise price of C$1.10 and vested ratably over four quarters. The fair value of this option grant was estimated at C$0.475 using the Black-Scholes options pricing model. Options representing 125,000 shares were issued during the year ended December 27, 2008 at exercise prices ranging from C$2.60 to C$3.50 per share. The fair value of each 2008 option grant was estimated to be between C$1.50 and C$1.65 using the Black-Scholes option pricing model. These grants were fully vested at the time of the grant and therefore the entire amount was recorded as share-based compensation during the second and third quarters of 2008.
F-24
Table of Contents
The fair value of each option granted during the years ended January 1, 2011, January 2, 2010, and December 27, 2008 was estimated on the date of grant using the Black-Scholes option pricing model with the following assumptions:
| January 1, 2011 |
January 2, 2010 |
December 27, 2008 |
||||||||||
| Risk-free interest rate |
2.5 | % | 2.3 | % | 3.3 | % | ||||||
| Average expected life (years) |
5.5 | 5.5 | 5.0 | |||||||||
| Expected volatility |
74.8 | % | 50.0 | % | 76.3 | % | ||||||
Option activity was as follows:
| Shares (in thousands) |
Weighted average exercise price |
Weighted average remaining contratual term (years) |
Aggregate (C$) (in thousands) |
|||||||||||||
| Balance at December 29, 2007 |
2,368 | $ | 30.03 | 2.7 | $ | — | ||||||||||
| Granted |
125 | 3.32 | ||||||||||||||
| Forfeited or expired |
(1,601 | ) | 16.74 | |||||||||||||
| Balance at December 27, 2008 |
892 | $ | 27.52 | 3.0 | $ | — | ||||||||||
| Granted |
250 | 1.10 | ||||||||||||||
| Exercised |
(25 | ) | 2.60 | |||||||||||||
| Forfeited or expired |
(286 | ) | 31.69 | |||||||||||||
| Balance at January 2, 2010 |
831 | $ | 18.97 | 4.6 | $ | 618.1 | ||||||||||
| Granted |
250 | 8.01 | ||||||||||||||
| Forfeited or expired |
(377 | ) | 20.33 | |||||||||||||
| Balance at January 1, 2011 |
704 | $ | 16.67 | 4.2 | $ | 625.0 | ||||||||||
| Vested and expected to vest at January 1, 2011 |
704 | $ | 31.38 | 4.2 | $ | 625.0 | ||||||||||
| Exercisable at January 1, 2011 |
704 | $ | 31.38 | 4.2 | $ | 625.0 | ||||||||||
The aggregate intrinsic value amounts in the table above represent the difference between the closing price of our common stock on January 1, 2011, which was C$8.95 (January 2, 2010—C$8.66; December 27, 2008—C$1.27), and the exercise price, multiplied by the number of in-the-money stock options as of the same date. The total intrinsic value of stock options exercised during the year ended January 1, 2011 was nil (January 2, 2010—$0.1 million; December 27, 2008—nil).
Total compensation cost related to unvested awards under the option plan not yet recognized is nil. The total fair value of shares that vested during the year ended January 1, 2011 was nil.
Subsequent to the adoption of the Company’s 2010 Equity Incentive Plan on May 4, 2010, the Board determined that the Option Plan was no longer needed and terminated the Option Plan. In connection with the termination of the Option Plan, outstanding options will continue in accordance with the terms of the Option Plan plans until vested, paid out, forfeited or terminated, as applicable. No further awards will be granted under the Option Plan. Future awards are expected to be governed by the terms of the Company’s 2010 Equity Incentive Plan.
Outstanding options at January 1, 2011 were as follows:
| Options Outstanding | Options Exercisable | |||||||||||||||||||
| Range of Exercise Prices (C$) |
Number Exercisable (in thousands) |
Remaining Contractual Life (Years) |
Weighted Exercise Price (C$) |
Number Exercisable (in thousands) |
Weighted Exercise Price (C$) |
|||||||||||||||
| $1.10 – $3.50 |
350 | 7.1 | $ | 1.79 | 350 | $ | 1.79 | |||||||||||||
| $18.48 – $29.95 |
220 | 1.9 | $ | 26.70 | 220 | $ | 26.70 | |||||||||||||
| $30.25 – $43.64 |
134 | 0.4 | $ | 39.03 | 134 | $ | 39.03 | |||||||||||||
| 704 | 4.2 | $ | 16.67 | 704 | $ | 16.67 | ||||||||||||||
F-25
Table of Contents
Long-Term Incentive Plans
2010 Equity Incentive Plan
Our shareowners approved our 2010 Equity Incentive Plan (the “2010 Equity Incentive Plan”) at the Annual and Special Meeting of Shareowners held on May 4, 2010. Awards under the 2010 Equity Incentive Plan may be in the form of incentive stock options, non-qualified stock options, restricted shares, restricted share units, performance shares, performance units, stock appreciation rights, and stock payments to employees, directors and outside consultants. The 2010 Equity Incentive Plan is administered by the Human Resources and Compensation Committee of the Board of Directors (“HRCC”) or any other board committee as may be designated by the board from time to time. At the inception of the 2010 Equity Incentive Plan, 4,000,000 shares were reserved for future issuance, subject to adjustment upon a share split, share dividend, recapitalization, and other similar transactions and events.
On May 4, 2010, we granted 78,790 common shares to the non-management members of our Board of Directors under the 2010 Equity Incentive Plan. The common shares were issued in consideration of such directors’ annual board retainer fee.
In 2010, we granted 1,726,807 Performance-based RSUs and 1,396,807 Time-based RSUs to certain employees of the Company. The Performance-based RSUs vest based on the achievement of a specified target level of pre-tax income for the period beginning on January 1, 2010 and ending on the last day of our 2012 fiscal year. The amount of Performance-based RSUs that may vest and the related unrecognized compensation cost is subject to change based on the level of targeted pre-tax income that is achieved during the period beginning on January 1, 2010 and ending on the last day of our 2012 fiscal year. During the fourth quarter, the HRCC modified the original pre-tax income targets to reflect the Cliffstar Acquisition. The Time-based RSUs vest on the last day of our 2012 fiscal year.
Amended and Restated PSU Plan
Under the Amended and Restated Performance Share Unit Plan (the “PSU Plan”), PSUs were awarded to Company employees. The value of an employee’s award under our PSU Plan depended on (i) our performance over a maximum three-year performance cycle; and (ii) the market price of our common shares at the time of vesting. Performance targets were established by the HRCC. PSUs granted vested over a term not exceeding three fiscal years. As of January 1, 2011, the Trustee under the PSU Plan held 0.6 million common shares as treasury shares. The remaining outstanding awards under the PSU Plan vested in February 2011 upon the achievement of adjusted operating income exceeding zero for 2008, 2009 and 2010.
Subsequent to the adoption of the 2010 Equity Incentive Plan on May 4, 2010, the HRCC determined that certain of Cott’s long-term incentive plans were no longer needed and terminated the PSU Plan effective February 23, 2011.
Amended and Restated SAR Plan
Under the Amended and Restated Share Appreciation Rights Plan (the “SAR Plan”), share appreciation rights (“SARs”) were awarded to employees and directors of our Company. SARs typically vested on the third anniversary of the grant date. On vesting, each SAR represented the right to be paid the difference, if any, between the price of our common shares on the date of grant and their price on the vesting date of the SAR. Payments in respect of vested in-the-money SARs were made in the form of our common shares purchased on the open market by an independent trust with cash contributed by us. During the year ended January 1, 2011, 154,000 SARs vested out-of-the-money. On August 10, 2010, the Company entered into a Stock Appreciation Right Cancellation Agreement with an executive officer to cancel 100,000 previously granted SARs. The cancellation was effective as of September 2, 2010.
F-26
Table of Contents
Subsequent to the adoption of the 2010 Equity Incentive Plan on May 4, 2010, the HRCC determined that certain of Cott’s long-term incentive plans were no longer needed and terminated the SAR Plan effective February 23, 2011.
During the year ended January 1, 2011, PSU, Performance-based RSU, Time-based RSU and SAR activity was as follows:
| (in thousands) |
Number of PSUs |
Number of Performance- based RSUs |
Number of Time-based RSUs |
Number of SARs |
||||||||||||
| Balance at January 2, 2010 |
625 | — | — | 254 | ||||||||||||
| Awarded |
— | 1,727 | 1,397 | — | ||||||||||||
| Issued |
(437 | ) | — | — | — | |||||||||||
| Forfeited |
— | — | — | (254 | ) | |||||||||||
| Outstanding at January 1, 2011 |
188 | 1,727 | 1,397 | — | ||||||||||||
Other Share-Based Compensation
In 2006, Brent Willis, our former Chief Executive Officer, received a net cash award of $0.9 million at the commencement of his employment to purchase shares of the Company. The purchased shares were required to be held for a minimum of three years. Mr. Willis’s employment terminated in March 2008, and as part of his termination agreement, we ceased to enforce the requirement that he hold the shares. In 2008, $0.4 million (December 29, 2007—$0.3 million) was recorded as compensation expense. In addition, in 2006, 204,000 common shares with a fair value of $3.2 million, which vest over three years, were granted to Mr. Willis. For 2008, compensation costs of $1.4 million were expensed as compensation expense because the shares vested upon his termination. On May 16, 2007, one third of his grant vested and, as a result, he received 68,000 common shares, which was recognized as an issuance of share capital. As part of his termination agreement, the remaining 136,000 shares vested upon his termination and $0.3 million of cash (which was reclassified as a liability award) was paid based on the fair value of such shares.
In connection with his appointment, we granted to David Gibbons, our former Interim Chief Executive Officer, 720,000 restricted stock units on March 24, 2008, of which 360,000 units vested immediately. Of the remaining 360,000 restricted stock units, 300,000 vested ratably on a monthly basis over a five-month period beginning October 24, 2008 through February 27, 2009. Mr. Gibbons resigned as Interim Chief Executive Officer and his employment arrangements came to an end on February 27, 2009, at which time 6,000 prorated restricted stock units vested and the remaining 54,000 restricted stock units were forfeited. This award is recognized as compensation expense over the vesting period. For 2008, $0.8 million of this award was recorded as compensation expense to reflect the value of the 540,000 vested restricted stock units and the anticipated vesting of the 120,000 remaining shares as of December 27, 2008. The fair value and compensation costs vary based on share price and this has been accounted for as a liability award.
Restated Executive Incentive Share Purchase Plan
In the second quarter of 2007, our shareowners approved a restated executive incentive share purchase plan (the “Restated EISPP”), which allowed officers and senior management executives, as designated by the HRCC, to elect to receive their performance bonus (or a portion thereof) as common share units held on their behalf by an independent trust. If the employee elected to receive common share units, we provided to the employee an equal number of shares, which vested on January 1, 2011 due to the achievement of certain performance goals (“Match Portion”).
The Match Portion of the performance bonus was estimated based on the employee’s election and was amortized over the service period of approximately four years. During 2007, employees elected to defer a total of $1.1 million under the Restated EISPP. In 2009, the Company recorded an expense of $0.1 million related to the
F-27
Table of Contents
anticipated 2007 matching portion of the performance bonus. No amount was accrued for the Match Portion for 2008 deferrals because corporate performance goals were not achieved and no bonus amounts were deferred into the plan. Effective as of December 27, 2008, the HRCC approved an amendment to the Restated EISPP with the effect of freezing participation in the plan. The remaining outstanding Match Portion vested in February 2011 upon the achievement of cumulative EBIT growth of 10% per annum over the three-year performance cycle ending at the end of fiscal 2010.
Subsequent to the adoption of the 2010 Equity Incentive Plan on May 4, 2010, the HRCC determined that certain of Cott’s long-term incentive plans were no longer needed and terminated the Restated EISPP effective February 23, 2011.
Average Canadian—U.S. Dollar Exchange Rates for 2010, 2009 and 2008
Various compensation components in Note 7 are disclosed in Canadian dollars. The table below represents the average Canadian dollar to U.S. dollar exchange rate for the fiscal years ended 2010, 2009 and 2008 for comparative purposes:
| January 1, 2011 |
January 2, 2010 |
December 27, 2008 |
||||||||||||||
| Average exchange rate |
$ | 0.971 | $ | 0.878 | $ | 0.946 | ||||||||||
Note 8—Net Income (loss) per Common Share
Basic net income per common share is computed by dividing net income by the weighted average number of common shares outstanding during the period. Diluted net income per common share is calculated using the weighted average number of common shares outstanding adjusted to include the effect, if dilutive, of the exercise of in-the-money stock options, PSUs, Performance-based RSUs and Time-based RSUs.
A reconciliation of the numerators and denominators of the basic and diluted net income per common share computations is as follows:
| For the Years Ended | ||||||||||||
| (in thousands) |
January 1, 2011 |
January 2, 2010 |
December 27, 2008 |
|||||||||
| Weighted average number of shares outstanding—basic |
85,588 | 74,207 | 71,017 | |||||||||
| Dilutive effect of stock options |
191 | 267 | — | |||||||||
| Dilutive effect of PSUs |
161 | 741 | — | |||||||||
| Dilutive effect of Performance-based RSUs |
96 | — | — | |||||||||
| Dilutive effect of Time-based RSUs |
149 | — | — | |||||||||
| Adjusted weighted average number of shares outstanding - diluted |
86,185 | 75,215 | 71,017 | |||||||||
At January 1, 2011, options to purchase 704,000 (January 2, 2010—830,650; December 27, 2008—891,740) shares of common stock at a weighted average exercise price of C$16.67 (January 2, 2010—C$18.97; December 27, 2008—C$27.52) per share were outstanding, of which 354,000 (January 2, 2010—439,441; December 27, 2008—891,740)were not included in the computation of diluted net income per share because the options’ exercise price was greater than the average market price of our common stock.
Note 9—Segment Reporting
We produce, package and distribute private-label CSDs, clear, still and sparkling flavored waters, energy-related drinks, juice, juice-based products, bottled water and ready-to-drink teas to regional and national grocery, mass-merchandise and wholesale chains and customers in the dollar convenience and drug channels through five reportable segments – North America (which
F-28
Table of Contents
includes our U.S. reporting unit and Canada reporting unit), U.K. (which includes our United Kingdom reporting unit and our Continental European reporting unit), Mexico, Royal Crown International (“RCI”) and All Other (which includes our international corporate expenses and our Asia reporting unit, which ceased operations at the end of fiscal 2008).
Operating Segments
| For the Year Ended January 1, 2011 | ||||||||||||||||||||||||
| (in millions of U.S. dollars) |
North America |
United Kingdom |
Mexico | RCI | All Other |
Total | ||||||||||||||||||
| External revenue 1 |
$ | 1,357.3 | $ | 367.1 | $ | 50.1 | $ | 28.8 | $ | — | $ | 1,803.3 | ||||||||||||
| Depreciation and amortization |
59.1 | 12.8 | 2.1 | — | — | 74.0 | ||||||||||||||||||
| Restructuring |
(0.5 | ) | — | — | — | — | (0.5 | ) | ||||||||||||||||
| Operating income (loss) |
75.0 | 24.5 | (7.5 | ) | 7.0 | — | 99.0 | |||||||||||||||||
| Property, plant and equipment |
400.4 | 90.2 | 13.2 | — | — | 503.8 | ||||||||||||||||||
| Goodwill |
125.7 | — | — | 4.5 | — | 130.2 | ||||||||||||||||||
| Intangibles and other assets |
354.7 | 15.7 | 0.7 | — | — | 371.1 | ||||||||||||||||||
| Total assets 2 |
1,275.9 | 207.4 | 31.5 | 13.7 | 0.7 | 1,529.2 | ||||||||||||||||||
| Additions to property, plant and equipment |
31.9 | 10.6 | 1.5 | — | — | 44.0 | ||||||||||||||||||
| 1 | Intersegment revenue between North America and the other segments is not material and has not been separately disclosed in the table above. |
| 2 | Excludes intersegment receivables, investments and notes receivable. |
Operating Segments
| For the Year Ended January 2, 2010 | ||||||||||||||||||||||||
| (in millions of U.S. dollars) |
North America |
United Kingdom |
Mexico | RCI | All Other |
Total | ||||||||||||||||||
| External revenue 1 |
$ | 1,173.9 | $ | 359.3 | $ | 42.7 | $ | 20.8 | $ | — | $ | 1,596.7 | ||||||||||||
| Depreciation and amortization |
51.0 | 13.4 | 1.8 | — | — | 66.2 | ||||||||||||||||||
| Restructuring and asset impairments |
||||||||||||||||||||||||
| Restructuring |
1.5 | — | — | — | — | 1.5 | ||||||||||||||||||
| Asset impairments |
3.6 | — | — | — | — | 3.6 | ||||||||||||||||||
| Operating income (loss) |
77.6 | 23.0 | (7.1 | ) | 3.9 | — | 97.4 | |||||||||||||||||
| Property, plant and equipment |
236.5 | 93.0 | 13.5 | — | — | 343.0 | ||||||||||||||||||
| Goodwill |
26.1 | — | — | 4.5 | — | 30.6 | ||||||||||||||||||
| Intangibles and other assets |
137.0 | 17.7 | 0.8 | — | — | 155.5 | ||||||||||||||||||
| Total assets 2 |
632.1 | 197.0 | 33.4 | 10.6 | 0.7 | 873.8 | ||||||||||||||||||
| Additions to property, plant and equipment |
22.7 | 8.6 | 1.0 | — | — | 32.3 | ||||||||||||||||||
| 1 | Intersegment revenue between North America and the other segments is not material and has not been separately disclosed in the table above. |
| 2 | Excludes intersegment receivables, investments and notes receivable. |
F-29
Table of Contents
Operating Segments
| For the Year Ended December 27, 2008 | ||||||||||||||||||||||||
| (in millions of U.S. dollars) |
North America |
United Kingdom |
Mexico | RCI | All Other |
Total | ||||||||||||||||||
| External revenue 1 |
$ | 1,178.0 | $ | 385.3 | $ | 61.9 | $ | 22.0 | $ | 0.9 | $ | 1,648.1 | ||||||||||||
| Depreciation and amortization |
62.2 | 16.2 | 2.3 | — | — | 80.7 | ||||||||||||||||||
| Restructuring, goodwill and asset impairments |
||||||||||||||||||||||||
| Restructuring |
6.7 | — | — | — | — | 6.7 | ||||||||||||||||||
| Goodwill impairments |
— | 69.2 | — | — | — | 69.2 | ||||||||||||||||||
| Asset impairments |
37.0 | — | — | — | — | 37.0 | ||||||||||||||||||
| Operating (loss) income |
(56.3 | ) | (53.5 | ) | (8.8 | ) | 8.1 | (2.5 | ) | (113.0 | ) | |||||||||||||
| Property, plant and equipment |
244.1 | 88.7 | 14.0 | — | — | 346.8 | ||||||||||||||||||
| Goodwill |
22.5 | — | — | 4.5 | — | 27.0 | ||||||||||||||||||
| Intangibles and other assets |
150.2 | 18.3 | 0.9 | — | 0.2 | 169.6 | ||||||||||||||||||
| Total assets 2 |
642.3 | 189.3 | 29.9 | 11.6 | — | 873.1 | ||||||||||||||||||
| Additions to property, plant and equipment |
44.1 | 8.5 | 3.3 | — | — | 55.9 | ||||||||||||||||||
| 1 | Intersegment revenue between North America and the other segments is not material and has not been separately disclosed in the table above. |
| 2 | Excludes intersegment receivables, investments and notes receivable. Also, we reclassified certain amounts in the North America operating segment to conform to the current period’s presentation, which includes a reclassification of $4.5 million from accrued liabilities to allowance for doubtful accounts. |
For the year ended January 1, 2011, sales to Wal-Mart accounted for 31.0% (2009—33.5%; 2008—35.8%) of our total revenues, 35.3% of our North America operating segment revenues (2009—39.4%, 2008—42.1%), 16.6% of our U.K. operating segment revenues (2009—17.7%, 2008—21.1%) and 38.9% of our Mexico operating segment revenues (2009—18.4%, 2008—22.2%).
Credit risk arises from the potential default of a customer in meeting its financial obligations with us. Concentrations of credit exposure may arise with a group of customers that have similar economic characteristics or that are located in the same geographic region. The ability of such customers to meet obligations would be similarly affected by changing economic, political or other conditions. We are not currently aware of any facts that would create a material credit risk.
Revenues are attributed to countries based on the location of the plant. Revenues by geographic area are as follows:
| For the Years Ended | ||||||||||||
| (in millions of U.S. dollars) |
January
1, 2011 |
January
2, 2010 |
December
27, 2008 |
|||||||||
| United States |
$ | 1,212.1 | $ | 1,034.1 | $ | 1,006.8 | ||||||
| Canada |
201.1 | 198.7 | 229.2 | |||||||||
| United Kingdom |
368.3 | 360.6 | 385.3 | |||||||||
| Mexico |
50.1 | 42.7 | 61.9 | |||||||||
| RCI |
28.8 | 20.8 | 22.0 | |||||||||
| All Other |
— | — | 0.9 | |||||||||
| Elimination 1 |
(57.1 | ) | (60.2 | ) | (58.0 | ) | ||||||
| $ | 1,803.3 | $ | 1,596.7 | $ | 1,648.1 | |||||||
| 1 | Represents intercompany revenue among our reporting units, of which $19.0 million, $14.0 million and $12.4 million represents intersegment revenue between North America and our other operating segments for January 1, 2011, January 2, 2010, and December 27, 2008, respectively. |
F-30
Table of Contents
The revenue by product tables for 2009 and 2008 have been revised to include the category “Juice” which is a significant portion of our revenue due to the Cliffstar Acquisition.
Revenues by product are as follows:
| For the Year Ended January 1, 2011 | ||||||||||||||||||||
| (in millions of U.S. dollars) |
North America |
United Kingdom |
Mexico | RCI | Total | |||||||||||||||
| Revenue |
||||||||||||||||||||
| Carbonated soft drinks |
$ | 705.5 | $ | 147.1 | $ | 43.4 | $ | — | $ | 896.0 | ||||||||||
| Juice |
225.3 | 10.9 | 0.8 | — | 237.0 | |||||||||||||||
| Concentrate |
7.5 | 2.3 | — | 28.8 | 38.6 | |||||||||||||||
| All other products |
419.0 | 206.8 | 5.9 | — | 631.7 | |||||||||||||||
| Total |
$ | 1,357.3 | $ | 367.1 | $ | 50.1 | $ | 28.8 | $ | 1,803.3 | ||||||||||
| For the Year Ended January 2, 2010 | ||||||||||||||||||||
| (in millions of U.S. dollars) |
North America |
United Kingdom |
Mexico | RCI | Total | |||||||||||||||
| Revenue |
||||||||||||||||||||
| Carbonated soft drinks |
$ | 760.0 | $ | 161.9 | $ | 36.4 | $ | — | $ | 958.3 | ||||||||||
| Concentrate |
6.5 | 4.6 | — | 19.7 | 30.8 | |||||||||||||||
| Juice |
— | 10.1 | 0.4 | — | 10.5 | |||||||||||||||
| All other products |
407.4 | 182.7 | 5.9 | 1.1 | 597.1 | |||||||||||||||
| Total |
$ | 1,173.9 | $ | 359.3 | $ | 42.7 | $ | 20.8 | $ | 1,596.7 | ||||||||||
| For the Year Ended December 27, 2008 | ||||||||||||||||||||||||
| (in millions of U.S. dollars) |
North America |
United Kingdom |
Mexico | RCI | All Other | Total | ||||||||||||||||||
| Revenue |
||||||||||||||||||||||||
| Carbonated soft drinks |
$ | 748.7 | $ | 163.3 | $ | 59.2 | $ | — | $ | 0.9 | $ | 972.1 | ||||||||||||
| Concentrate |
5.5 | 7.2 | — | 22.0 | — | 34.7 | ||||||||||||||||||
| Juice |
— | 11.7 | — | — | — | 11.7 | ||||||||||||||||||
| All other products |
423.8 | 203.1 | 2.7 | — | — | 629.6 | ||||||||||||||||||
| Total |
$ | 1,178.0 | $ | 385.3 | $ | 61.9 | $ | 22.0 | $ | 0.9 | $ | 1,648.1 | ||||||||||||
Property, plant and equipment by geographic area are as follows:
| (in millions of U.S. dollars) |
January
1, 2011 |
January
2, 2010 |
||||||
| United States |
$ | 350.4 | $ | 188.7 | ||||
| Canada |
50.0 | 47.8 | ||||||
| United Kingdom |
90.2 | 93.0 | ||||||
| Mexico |
13.2 | 13.5 | ||||||
| $ | 503.8 | $ | 343.0 | |||||
Note 10—Accounts Receivable, Net
| (in millions of U.S. dollars) |
January
1, 2011 |
January
2, 2010 |
||||||
| Trade receivables |
$ | 209.0 | $ | 149.2 | ||||
| Allowance for doubtful accounts |
(8.3 | ) | (5.9 | ) | ||||
| Other |
12.9 | 9.0 | ||||||
| Total |
$ | 213.6 | $ | 152.3 | ||||
F-31
Table of Contents
Note 11—Inventories
| (in millions of U.S. dollars) |
January
1, 2011 |
January
2, 2010 |
||||||
| Raw materials |
$ | 90.1 | $ | 39.4 | ||||
| Finished goods |
107.3 | 45.3 | ||||||
| Other |
18.1 | 15.0 | ||||||
| Total |
$ | 215.5 | $ | 99.7 | ||||
Note 12—Property, Plant and Equipment, net
| January 1, 2011 | January 2, 2010 | |||||||||||||||||||||||
| (in millions of U.S. dollars) |
Cost | Accumulated Depreciation |
Net | Cost | Accumulated Depreciation |
Net | ||||||||||||||||||
| Land and Land Improvements |
$ | 30.2 | $ | 0.2 | $ | 30.0 | $ | 21.2 | $ | — | $ | 21.2 | ||||||||||||
| Buildings |
157.6 | 51.7 | 105.9 | 119.7 | 44.8 | 74.9 | ||||||||||||||||||
| Machinery and equipment |
||||||||||||||||||||||||
| Owned |
625.7 | 296.3 | 326.2 | 472.5 | 263.6 | 208.9 | ||||||||||||||||||
| Capital leases |
4.0 | 1.4 | 5.8 | 3.8 | 0.8 | 3.0 | ||||||||||||||||||
| Plates, films & molds |
36.2 | 28.2 | 8.0 | 32.8 | 26.1 | 6.7 | ||||||||||||||||||
| Vending |
15.6 | 13.1 | 2.5 | 18.0 | 14.7 | 3.3 | ||||||||||||||||||
| Transportation equipment |
0.7 | 0.5 | 0.2 | 0.6 | 0.5 | 0.1 | ||||||||||||||||||
| Leasehold improvements |
39.2 | 15.0 | 24.2 | 34.9 | 11.5 | 23.4 | ||||||||||||||||||
| Furniture and fixtures |
9.3 | 8.3 | 1.0 | 8.9 | 7.4 | 1.5 | ||||||||||||||||||
| Total |
$ | 918.5 | $ | 414.7 | $ | 503.8 | $ | 712.4 | $ | 369.4 | $ | 343.0 | ||||||||||||
Depreciation expense for the year ended January 1, 2011 was $52.6 million ($48.5 million—January 2, 2010; $53.5 million—December 27, 2008).
Note 13—Intangibles and Other Assets, net
| January 1, 2011 | January 2, 2010 | |||||||||||||||||||||||
| Accumulated Amortization |
Accumulated Amortization |
|||||||||||||||||||||||
| (in millions of U.S. dollars) |
Cost | Net | Cost | Net | ||||||||||||||||||||
| Intangibles |
||||||||||||||||||||||||
| Not subject to amortization |
||||||||||||||||||||||||
| Rights |
$ | 45.0 | $ | — | $ | 45.0 | $ | 45.0 | $ | — | $ | 45.0 | ||||||||||||
| Subject to amortization |
||||||||||||||||||||||||
| Customer relationships |
369.3 | 94.8 | 274.5 | 154.1 | 79.3 | 74.8 | ||||||||||||||||||
| Trademarks |
28.9 | 21.1 | 7.8 | 24.7 | 15.2 | 9.5 | ||||||||||||||||||
| Information technology |
60.3 | 52.5 | 7.8 | 54.1 | 48.3 | 5.8 | ||||||||||||||||||
| Other |
10.3 | 3.1 | 7.2 | 3.6 | 2.0 | 1.6 | ||||||||||||||||||
| 468.8 | 171.5 | 297.3 | 236.5 | 144.8 | 91.7 | |||||||||||||||||||
| 513.8 | 171.5 | 342.3 | 281.5 | 144.8 | 136.7 | |||||||||||||||||||
| Other Assets |
||||||||||||||||||||||||
| Financing costs |
23.2 | 3.6 | 19.6 | 11.4 | 2.1 | 9.3 | ||||||||||||||||||
| Deposits |
7.6 | — | 7.6 | 7.8 | — | 7.8 | ||||||||||||||||||
| Other |
4.3 | 2.7 | 1.6 | 7.3 | 5.6 | 1.7 | ||||||||||||||||||
| 35.1 | 6.3 | 28.8 | 26.5 | 7.7 | 18.8 | |||||||||||||||||||
| Total Intangibles & Other |
||||||||||||||||||||||||
| Assets |
$ | 548.9 | $ | 177.8 | $ | 371.1 | $ | 308.0 | $ | 152.5 | $ | 155.5 | ||||||||||||
F-32
Table of Contents
Amortization expense of intangibles was $26.5 million during 2010 ($20.2 million—January 2, 2010; $29.0 million—December 27, 2008). Amortization of intangibles includes $2.2 million ($4.5 million—January 2, 2010; $10.4 million—December 27, 2008) relating to information technology assets and $2.7 million ($1.6 million—January 2, 2010; $1.1 million—December 27, 2008) relating to deferred financing assets. During the year ended December 27, 2008, we recorded an asset impairment related to the Rights of $35.4 million, primarily due to the decline of our North America case volume partially offset by anticipated increased overseas concentrate volume in our RCI operating segment. See Note 1 for more information.
The estimated amortization expense for intangibles over the next five years is:
| (in millions of U.S. dollars) |
||||
| 2011 |
13.9 | |||
| 2012 |
12.9 | |||
| 2013 |
12.8 | |||
| 2014 |
12.4 | |||
| 2015 |
10.4 | |||
| Thereafter |
234.9 | |||
| $297.3 | ||||
Note 14—Accounts Payable and Accrued Liabilities
| (in millions of U.S. dollars) |
January
1, 2011 |
January
2, 2010 |
||||||
| Trade payables |
$ | 146.1 | $ | 84.5 | ||||
| Accrued compensation |
19.1 | 21.2 | ||||||
| Accrued sales incentives |
24.8 | 21.9 | ||||||
| Accrued interest |
14.1 | 2.6 | ||||||
| Restructuring—Note 3 |
1.2 | 2.8 | ||||||
| Payroll, sales and other taxes |
12.8 | 15.1 | ||||||
| Other accrued liabilities |
58.5 | 21.2 | ||||||
| Total |
$ | 276.6 | $ | 169.3 | ||||
F-33
Table of Contents
Note 15—Debt
Our total debt is as follows:
| (in millions of U.S. dollars) |
January
1, 2011 |
January
2, 2010 |
||||||
| 8% senior subordinated notes due in 2011 |
$ | — | $ | 11.1 | ||||
| 8.375% senior notes due in 2017 1 |
215.0 | 215.0 | ||||||
| 8.125% senior notes due in 2018 |
375.0 | — | ||||||
| ABL facility |
7.9 | 20.2 | ||||||
| GE Obligation |
16.5 | 22.0 | ||||||
| Other capital leases |
5.8 | 3.2 | ||||||
| Other debt |
2.0 | 2.6 | ||||||
| Total debt |
622.2 | 274.1 | ||||||
| Less: Short-term borrowings and current debt: |
||||||||
| ABL facility |
7.9 | 20.2 | ||||||
| Total short-term borrowings |
7.9 | 20.2 | ||||||
| 8% senior subordinated notes due in 2011 |
— | 11.1 | ||||||
| GE Obligation—current maturities |
4.1 | 5.5 | ||||||
| Other capital leases—current maturities |
1.4 | 0.4 | ||||||
| Other debt—current maturities |
0.5 | 0.6 | ||||||
| Total current debt |
13.9 | 37.8 | ||||||
| Long-term debt before discount |
608.3 | 236.3 | ||||||
| Less discount on 8.375% notes |
(2.8 | ) | (3.1 | ) | ||||
| Total long-term debt |
$ | 605.5 | $ | 233.2 | ||||
| 1 | Our 8.375% senior notes were issued at a discount of 1.425% on November 13, 2009. |
The long-term debt payments (which include current maturities of long-term debt) required in each of the next five years and thereafter are as follows:
| (in millions of U.S. dollars) |
Long Term Debt (incl. current) |
|||
| 2011 |
6.3 | |||
| 2012 |
3.5 | |||
| 2013 |
1.9 | |||
| 2014 |
2.2 | |||
| 2015 |
2.3 | |||
| Thereafter |
592.1 | |||
| $ | 608.3 | 1 | ||
| 1 | We funded the purchase of new water bottling equipment through an interim financing agreement signed in January 2008 (the “GE Obligation”). At the end of the GE Obligation, we may exchange $6.0 million of deposits for the extinguishment of $6.0 million in debt or elect to purchase such equipment. |
Asset Based Lending Facility
On March 31, 2008, we entered into a credit agreement with JPMorgan Chase Bank N.A. as Agent that created an ABL facility to provide financing for our North America, United Kingdom and Mexico operating segments. In connection with the Cliffstar Acquisition, we refinanced the ABL facility on August 17, 2010 to, among other things, provide for the Cliffstar Acquisition, the Note Offering and the application of net proceeds therefrom, the Equity Offering and the application of net proceeds therefrom and to increase the amount
F-34
Table of Contents
available for borrowings to $275.0 million. We drew down a portion of the indebtedness under that ABL facility in order to fund the Cliffstar Acquisition. We incurred $5.4 million of financing fees in connection with the refinancing of the ABL facility. The financing fees are being amortized using the straight-line method over a four-year period.
As of January 1, 2011, we had $7.9 million in borrowings under the ABL facility outstanding. The commitment fee was 0.5% per annum of the unused commitment, which was $227.6 million as of January 1, 2011.
The effective interest rate as of January 1, 2011 on LIBOR and Prime loans is based on average aggregate availability as follows:
| Average Aggregate Availability (in millions of U.S. dollars) |
ABR Spread |
Canadian Prime Spread |
Eurodollar Spread |
CDOR Spread |
LIBOR Spread |
|||||||||||||||
| Over $150 |
1.50 | % | 1.50 | % | 2.50 | % | 2.50 | % | 2.50 | % | ||||||||||
| $75 - 150 |
1.75 | % | 1.75 | % | 2.75 | % | 2.75 | % | 2.75 | % | ||||||||||
| Under $75 |
2.00 | % | 2.00 | % | 3.00 | % | 3.00 | % | 3.00 | % | ||||||||||
8.125% Senior Notes due in 2018
On August 17, 2010, we issued $375.0 million of senior notes that are due on September 1, 2018 (the “2018 Notes”). The issuer of the 2018 Notes is Cott Beverages Inc., but we and most of our U.S., Canadian and United Kingdom subsidiaries guarantee the 2018 Notes. The interest on the 2018 Notes is payable semi-annually on March 1st and September 1st of each year, beginning on March 1, 2011.
We incurred $8.6 million of financing fees in connection with the 2018 Notes. The financing fees are being amortized using the straight-line method over an eight-year period, which represents the duration of the 2018 Notes. The amortization expense calculated under the straight-line method does not differ materially from the effective-interest method.
8.375% Senior Notes due in 2017
On November 13, 2009, we issued $215.0 million of senior notes that are due on November 15, 2017 (the “2017 Notes”). The 2017 Notes were issued at a $3.1 million discount. The issuer of the 2017 Notes is Cott Beverages Inc., but we and most of our U.S., Canadian and United Kingdom subsidiaries guarantee the 2017 Notes. The interest on the 2017 Notes is payable semi-annually on May 15th and November 15th of each year.
We incurred $5.1 million of financing fees in connection with the 2017 Notes. The financing fees are being amortized using the straight-line method over an eight-year period, which represents the duration of the 2017 Notes. The amortization expense calculated under the straight-line method does not differ materially from the effective-interest method.
8% Senior Subordinated Notes due in 2011
We repurchased the remaining outstanding 2011 Notes for $11.1 million on February 1, 2010, and recorded a loss on buyback of $0.1 million. The 2011 Notes acquired by us have been retired, and we have discontinued the payment of interest.
In 2009, the Company repurchased $257.8 million in principal amount of the 2011 Notes, and recorded a loss on buy back of $3.3 million.
F-35
Table of Contents
GE Financing Agreement
We funded $32.5 million of water bottling equipment purchases through a finance lease arrangement in 2008. The quarterly payments under the lease obligation total approximately $8.8 million per annum for the first two years, $5.3 million per annum for the subsequent two years, then $1.7 million per annum for the final four years.
Covenant Compliance
8.125% Senior Notes due in 2018
Under the indenture governing the 2018 Notes, we are subject to a number of covenants, including covenants that limit our and certain of our subsidiaries’ ability, subject to certain exceptions and qualifications, to (i) pay dividends or make distributions, repurchase equity securities, prepay subordinated debt or make certain investments, (ii) incur additional debt or issue certain disqualified stock or preferred stock, (iii) create or incur liens on assets securing indebtedness, (iv) merge or consolidate with another company or sell all or substantially all assets taken as a whole, (v) enter into transactions with affiliates and (vi) sell assets. We believe we have been in compliance with all of the covenants under the 2018 Notes and there have been no amendments to any such covenants since the 2018 Notes were issued.
8.375% Senior Notes due in 2017
Under the indenture governing the 2017 Notes, we are subject to a number of covenants, including covenants that limit our and certain of our subsidiaries’ ability, subject to certain exceptions and qualifications, to (i) pay dividends or make distributions, repurchase equity securities, prepay subordinated debt or make certain investments, (ii) incur additional debt or issue certain disqualified stock or preferred stock, (iii) create or incur liens on assets, (iv) merge or consolidate with another company (applies to the Company and the Issuer only) or sell all or substantially all assets taken as a whole, (v) enter into transactions with affiliates and (vi) sell assets. We believe we have been in compliance with all of the covenants under the 2017 Notes and there have been no amendments to any such covenants since the 2017 Notes were issued.
ABL Facility
We and our restricted subsidiaries are subject to a number of business and financial covenants, including a covenant requiring a minimum fixed charge coverage ratio of at least 1.1 to 1.0 effective when and if excess availability is less than the greater of (a) $30.0 million and (b) the lesser of (i) 12.5% of the amount of the aggregate borrowing base and (ii) $37.5 million. Our fixed charge coverage ratio as calculated under this covenant as of January 1, 2011 was greater than 1.1 to 1.0. If availability is less than $37.5 million, the lenders will take dominion over the cash and will apply excess cash to reduce amounts owing under the facility. The credit agreement governing the ABL facility requires us to maintain aggregate availability of at least $15.0 million. We were in compliance with all of the applicable covenants under the ABL facility on January 1, 2011.
Note 16—Benefit Plans
We maintain two defined benefit plans resulting from prior acquisitions that cover certain employees at one plant in the U.S. under a collective bargaining agreement (“U.S. Plan”) and certain employees in the United Kingdom (“U.K. Plan”). Retirement benefits for employees covered by the U.S. Plan are based on years of service multiplied by a monthly benefit factor. The monthly benefit for employees under the U.K. Plan is based on years of service multiplied by a monthly benefit factor. Pension costs are funded in accordance with the provisions of the applicable law. Both plans are closed to new participants. We use a December 31 measurement date for both of our plans.
F-36
Table of Contents
Obligations and Funded Status
The following table summarizes the change in the benefit obligation, change in plan assets and unfunded status of the two plans:
| For the Years Ended | ||||||||
| (in millions of U.S. dollars) |
January 1, 2011 |
January 2, 2010 |
||||||
| Change in Benefit Obligation |
||||||||
| Benefit obligation at beginning of year |
$ | 32.3 | $ | 24.8 | ||||
| Service cost |
0.4 | 0.3 | ||||||
| Interest cost |
1.8 | 1.7 | ||||||
| Plan participant contributions |
0.1 | 0.1 | ||||||
| Benefit payments |
(0.6 | ) | (0.7 | ) | ||||
| Actuarial losses |
1.6 | 4.2 | ||||||
| Translation (losses) gains |
(1.1 | ) | 1.9 | |||||
| Benefit obligation at end of year |
$ | 34.5 | $ | 32.3 | ||||
| Change in Plan Assets |
||||||||
| Plan assets beginning of year |
$ | 23.1 | $ | 16.7 | ||||
| Employer contributions |
1.7 | 1.1 | ||||||
| Plan participant contributions |
0.1 | 0.1 | ||||||
| Benefit payments |
(0.6 | ) | (0.7 | ) | ||||
| Actual return on plan assets |
2.9 | 4.6 | ||||||
| Translation (losses) gains |
(0.8 | ) | 1.3 | |||||
| Fair value at end of year |
$ | 26.4 | $ | 23.1 | ||||
| Funded Status of Plan |
||||||||
| Projected benefit obligation |
$ | (34.5 | ) | $ | (32.3 | ) | ||
| Fair value of plan assets |
26.4 | 23.1 | ||||||
| Unfunded status |
$ | (8.1 | ) | $ | (9.2 | ) | ||
The accumulated benefit obligation for both defined benefit pension plans equalled the projected benefit obligations of $8.1 million and $9.2 million at the end of 2010 and 2009, respectively.
Periodic Pension Costs
The components of net periodic pension cost are as follows:
| For the Years Ended | ||||||||||||
| (in millions of U.S. dollars) |
January 1, 2011 |
January 2, 2010 |
December 27, 2008 |
|||||||||
| Service cost |
$ | 0.4 | $ | 0.3 | $ | 0.3 | ||||||
| Interest cost |
1.8 | 1.7 | 1.6 | |||||||||
| Expected return on plan assets |
(1.7 | ) | (1.2 | ) | (1.6 | ) | ||||||
| Amortization of prior service costs |
0.1 | 0.1 | — | |||||||||
| Amortization of net loss |
0.5 | 0.6 | 0.3 | |||||||||
| Net periodic pension cost |
$ | 1.1 | $ | 1.5 | $ | 0.6 | ||||||
F-37
Table of Contents
Accumulated Other Comprehensive Income (Loss)
Amounts included in accumulated other comprehensive income, net of tax, at year-end which have not yet been recognized in net periodic benefit cost are as follows:
| For the Years Ended | ||||||||||||
| (in millions of U.S. dollars) |
January 1, 2011 |
January 2, 2010 |
December 27, 2008 |
|||||||||
| Unamortized prior service benefit |
$ | (0.5 | ) | $ | (0.6 | ) | $ | (0.4 | ) | |||
| Unrecognized net actuarial gain (loss) |
5.8 | (6.9 | ) | (6.2 | ) | |||||||
| Unamortized prior service benefit or actual loss |
$ | 5.3 | $ | (7.5 | ) | $ | (6.6 | ) | ||||
Assumptions
Weighted average assumptions used to determine benefit obligations at year-end:
| January 1, 2011 |
January 2, 2010 |
December 27, 2008 |
||||||||||
| Discount rate |
6.2 | % | 6.3 | % | 6.0 | % | ||||||
Weighted average assumptions used to determine net periodic benefit cost at year-end:
| January 1, 2011 |
January 2, 2010 |
December 27, 2008 |
||||||||||
| U.K. Plan |
||||||||||||
| Discount rate |
5.4 | % | 5.8 | % | 6.4 | % | ||||||
| Expected long-term rate of return on plan assets |
6.9 | % | 7.2 | % | 6.9 | % | ||||||
| U.S. Plan |
||||||||||||
| Discount rate |
5.7 | % | 6.2 | % | 6.4 | % | ||||||
| Expected long-term rate of return on plan assets |
7.0 | % | 7.0 | % | 7.0 | % | ||||||
| Inflation factor |
3.7 | % | 3.7 | % | 3.1 | % | ||||||
The discount rate for the U.S. Plan is based on a model portfolio of AA rated bonds with a maturity matched to the estimated payouts of future pension benefits for this type of plan. The discount rate of the U.K. Plan is based on a model portfolio of AA rated bonds, using the redemption yields on the constituent stocks of the Merrill Lynch index with a maturity matched to the estimated future pension benefits. The weighted average return for both plans for the year ended January 1, 2011 was 12.3%. The expected return under the U.S. Plan and the U.K. Plan on plan assets are based on our expectation of the long-term average rate of return on assets in the pension funds, which is based on the allocation of assets.
Asset Mix
Our pension plan weighted-average asset allocations by asset category are as follows:
| January 1, 2011 |
January 2, 2010 |
|||||||
| U.K. Plan |
||||||||
| Equity securities |
65.9 | % | 65.5 | % | ||||
| Debt securities |
34.1 | % | 34.5 | % | ||||
| U.S. Plan |
||||||||
| Equity securities |
65.3 | % | 50.0 | % | ||||
| Debt securities |
34.7 | % | 50.0 | % | ||||
F-38
Table of Contents
Plan Assets
Our investment policy is that plan assets will be managed utilizing an investment philosophy and approach characterized by all of the following, but listed in priority order: (1) emphasis on total return, (2) emphasis on high-quality securities, (3) sufficient income and stability of income, (4) safety of principal with limited volatility of capital through proper diversification and (5) sufficient liquidity. (The target allocation percentages for the U.K. Plan assets are 70% in equity securities and 30% in debt securities. The target allocation percentages for the U.S. Plan assets are 50% in equity securities and 50% in debt securities. None of our equity or debt securities are included in plan assets.)
Cash Flows
We expect to contribute $1.1 million to the pension plans during the 2011 fiscal year.
The following benefit payments are expected to be paid:
| (in millions of U.S. dollars) |
||||
| Expected benefit payments |
||||
| FY 2011 |
$ | 0.9 | ||
| FY 2012 |
1.0 | |||
| FY 2013 |
1.0 | |||
| FY 2014 |
1.1 | |||
| FY 2015 |
1.4 | |||
| FY 2016 through FY 2019 |
9.4 | |||
Cott primarily maintains defined contribution retirement plans covering qualifying employees. The total expense with respect to these plans was $3.9 million for the year ended January 1, 2011 ($4.1 million—January 2, 2010; $5.0 million—December 27, 2008).
The fair values of the Company’s pension plan assets at January 1, 2011 were as follows:
| (in millions of U.S. dollars) |
January 1, 2011 | |||||||||||
| Level 1 | Level 2 | Level 3 | ||||||||||
| Cash and cash equivalents: |
||||||||||||
| Cash and cash equivalents |
$ | 0.1 | $ | 0.1 | $ | — | ||||||
| Equities: |
||||||||||||
| International mutual funds |
15.9 | — | — | |||||||||
| Index mutual funds |
2.5 | — | — | |||||||||
| U.S. mutual funds |
1.4 | — | — | |||||||||
| Fixed income: |
||||||||||||
| Mutual funds |
6.4 | — | — | |||||||||
| Total |
$ | 26.3 | $ | 0.1 | $ | — | ||||||
The fair values of the Company’s pension plan assets at January 2, 2010 were as follows:
| (in millions of U.S. dollars) |
January 2, 2010 | |||||||||||
| Level 1 | Level 2 | Level 3 | ||||||||||
| Cash and cash equivalents: |
||||||||||||
| Cash and cash equivalents |
$ | — | $ | — | $ | — | ||||||
| Equities: |
||||||||||||
| International mutual funds |
13.2 | — | — | |||||||||
| Index mutual funds |
2.3 | — | — | |||||||||
| U.S. mutual funds |
1.4 | — | — | |||||||||
| Fixed income: |
||||||||||||
| Mutual funds |
6.2 | — | — | |||||||||
| Total |
$ | 23.1 | $ | — | $ | — | ||||||
F-39
Table of Contents
Note 17—Commitments and Contingencies
We lease buildings, machinery and equipment, computer hardware and furniture and fixtures. All contractual increases and rent free periods included in the lease contract are taken into account when calculating the minimum lease payment and recognized on a straight line basis over the lease term. Certain leases have renewal periods and contingent rentals, which are not included in the table below. The minimum annual payments under operating leases are as follows:
| (in millions of U.S. dollars) |
||||
| 2011 |
$ | 18.4 | ||
| 2012 |
15.9 | |||
| 2013 |
11.9 | |||
| 2014 |
10.6 | |||
| 2015 |
8.6 | |||
| Thereafter |
22.5 | |||
| $ | 87.9 | |||
Operating lease expenses were:
| (in millions of U.S. dollars) |
||||
| Year ended January 1, 2011 |
$ | 20.3 | ||
| Year ended January 2, 2010 |
19.9 | |||
| Year ended December 27, 2008 |
21.8 | |||
| $ | 62.0 | |||
Operating lease expenses are shown net of sublease income of $0.3 million for 2010. As of January 1, 2011, we had commitments for capital expenditures of approximately $7.0 million and commitments for inventory of approximately $230.3 million.
In 2007, we entered into a $39.7 million purchase obligation for new equipment to support our bottled water business. Of the $39.7 million, payments of $16.5 million were made as of December 29, 2007. In the first quarter of 2008, we also entered into a capital lease with GE to fund $31.4 million of this purchase obligation. The lease provides for quarterly rental payments over a term of 96 months beginning June 1, 2008. The quarterly rental payments are $2.0 million from June 1, 2008 through May 30, 2010, declining to $1.2 million on June 1, 2010 through May 31, 2012, and declining to $0.4 million on June 1, 2012 through the balance of the lease. At the end of the lease term, we have the option to purchase the equipment at its then fair market value or return the equipment to GE.
In January 2005, we were named as one of many defendants in a class action suit alleging the unauthorized use by the defendants of container deposits and the imposition of recycling fees on consumers. On June 2, 2006, the British Columbia Supreme Court granted the summary trial application, which resulted in the dismissal of the plaintiffs’ action against us and the other defendants. On June 26, 2006, the plaintiffs appealed the dismissal of the action to the British Columbia Court of Appeals which was denied, and an appeal to the Supreme Court of Canada was rejected on December 20, 2007. In February 2005, similar class action claims were filed in a number of other Canadian provinces. Claims filed in Quebec have since been discontinued, but is unclear how the dismissal of the British Columbia case will impact the other cases.
We are subject to various claims and legal proceedings with respect to matters such as governmental regulations, and other actions arising out of the normal course of business. Management believes that the resolution of these matters will not have a material adverse effect on our financial positions, results of operations, or cash flow.
F-40
Table of Contents
We had $12.6 million in standby letters of credit outstanding as of January 1, 2011 ($9.9 million—January 2, 2010; $10.8 million—December 27, 2008).
We have future purchase obligations of $242.7 million that consist of commitments for the purchase of inventory, energy transactions, and payments related to information technology outsourcing agreements. These obligations represent the minimum contractual obligations expected under the normal course of business.
Note 18—Shares Held in Trust treated as Treasury Shares
In May 2008, an independent trustee acting under certain of our benefit plans purchased 2.3 million of our common shares to be used to satisfy future liabilities under the PSU Plan and the Restated EISPP. During the year ended January 1, 2011, we distributed 0.4 million shares from the trust to satisfy certain PSU obligations that had vested. As of January 1, 2011, 0.6 million and 0.5 million shares were held in trust. Treasury shares are reported at cost.
Note 19—Hedging Transactions and Derivative Financial Instruments
The Company is directly and indirectly affected by changes in foreign currency market conditions. These changes in market conditions may adversely impact the Company’s financial performance and are referred to as market risks. The Company, when deemed appropriate by management, uses derivatives as a risk management tool to mitigate the potential impact of foreign currency market risks. The Company’s foreign currency market risks are managed by the Company through the use of derivative instruments.
The Company purchases forward contract derivative instruments. Forward contracts are agreements to buy or sell a quantity of a currency at a predetermined future date, and at a predetermined rate or price. We do not enter into derivative financial instruments for trading purposes.
All derivatives are carried at fair value in the Consolidated Balance Sheets in the line item accounts payable and accrued liabilities. The carrying values of the derivatives reflect the impact of legally enforceable agreements with the same counterparties. These allow the Company to net settle positive and negative positions (assets and liabilities) arising from different transactions with the same counterparty.
The accounting for gains and losses that result from changes in the fair values of derivative instruments depends on whether the derivatives have been designated and qualify as hedging instruments and the type of hedging relationships. The changes in fair values of derivatives that have been designated and qualify as cash flow hedges are recorded in accumulated other comprehensive income (loss) (“AOCI”) and are reclassified into the line item in the consolidated income statement in which the hedged items are recorded in the same period the hedged items affect earnings. Due to the high degree of effectiveness between the hedging instruments and the underlying exposures being hedged, fluctuations in the value of the derivative instruments are generally offset by changes in the fair values or cash flows of the underlying exposures being hedged.
The Company formally designates and documents, at inception, the financial instrument as a hedge of a specific underlying exposure, the risk management objective and the strategy for undertaking the hedge transaction. In addition, the Company formally assesses both at the inception and at least quarterly thereafter, whether the financial instruments used in hedging transactions are effective at offsetting changes in either the fair values or cash flows of the related underlying exposures. Any ineffective portion of a financial instrument’s change in fair value is immediately recognized into earnings.
The Company estimates the fair values of its derivatives based on quoted market prices or pricing models using current market rates (refer to Note 21). The notional amounts of the derivative financial instruments do not necessarily represent amounts exchanged by the parties and, therefore, are not a direct measure of our exposure to the financial risks described above. The amounts exchanged are calculated by reference to the notional amounts and by other terms of the derivatives, such as interest rates, foreign currency exchange rates or other
F-41
Table of Contents
financial indices. The Company does not view the fair values of its derivatives in isolation, but rather in relation to the fair values or cash flows of the underlying hedged transactions. All of our derivatives are straightforward over-the-counter instruments with liquid markets.
Credit Risk Associated with Derivatives
We have established strict counterparty credit guidelines and enter into transactions only with financial institutions of investment grade or better. We mitigate pre-settlement risk by being permitted to net settle for transactions with the same counterparty.
Cash Flow Hedging Strategy
The Company uses cash flow hedges to minimize the variability in cash flows of assets or liabilities or forecasted transactions caused by fluctuations in foreign currency exchange rates. The changes in the fair values of derivatives designated as cash flow hedges are recorded in AOCI and are reclassified into the line item in the consolidated income statement in which the hedged items are recorded in the same period the hedged items affect earnings. The changes in fair values of hedges that are determined to be ineffective are immediately reclassified from AOCI into earnings. The Company did not discontinue any cash flow hedging relationships during the year ended January 1, 2011. The maximum length of time over which the Company hedges its exposure to future cash flows is typically one year. The Company maintains a foreign currency cash flow hedging program to reduce the risk that our procurement activities will be adversely affected by changes in foreign currency exchange rates. We enter into forward contracts to hedge certain portions of forecasted cash flows denominated in foreign currencies. When the U.S. dollar strengthens significantly against foreign currencies, the decline in the present value of future foreign currency cash flows is partially offset by gains in the fair value of the derivative instruments. Conversely, when the U.S. dollar weakens compared to other currencies, the increase in the present value of future foreign currency cash flows is partially offset by losses in the fair value of the derivative instruments. The total notional value of derivatives that have been designated and qualify for the Company’s foreign currency cash flow hedging program as of January 1, 2011 was approximately $19.7 million.
The Company’s derivative instruments were $0.6 million as of January 1, 2011.
The settlement of our derivative instruments resulted in a charge to cost of sales of less than $0.1 million for the year ended January 1, 2011.
Note 20—Equity Offering
On August 17, 2010, we completed an underwritten public offering of 13,340,000 common shares at a price of $5.67 per share (the “Equity Offering”). The net proceeds of the Equity Offering of $71.1 million, after deducting expenses, underwriting discounts and commissions, were used to finance, in part, the Cliffstar Acquisition.
On August 11, 2009, we completed a public offering of 9,435,000 common shares at a price of $5.30 per share (the “2009 Stock Offering”). Net proceeds of the 2009 Stock Offering were $47.5 million, after deducting expenses, underwriting discounts and commissions.
Note 21—Fair Value Measurements
ASC No. 820 defines fair value as the exchange price that would be received for an asset or paid to transfer a liability (an exit price) in the principal or most advantageous market for the asset or liability in an orderly transaction between market participants at the measurement date. Additionally, the inputs used to measure fair value are prioritized based on a three-level hierarchy. This hierarchy requires entities to maximize the use of observable inputs and minimize the use of unobservable inputs.
F-42
Table of Contents
The three levels of inputs used to measure fair value are as follows:
| • | Level 1—Quoted prices in active markets for identical assets or liabilities. |
| • | Level 2—Observable inputs other than quoted prices included in Level 1, such as quoted prices for similar assets and liabilities in active markets; quoted prices for identical or similar assets and liabilities in markets that are not active; or other inputs that are observable or can be corroborated by observable market data. |
| • | Level 3—Unobservable inputs that are supported by little or no market activity and that are significant to the fair value of the assets or liabilities. This includes certain pricing models, discounted cash flow methodologies and similar techniques that use significant unobservable inputs. |
We have certain assets and liabilities that are required to be recorded at fair value on a recurring basis in accordance with U.S. GAAP. The only assets and liabilities that are adjusted to fair value on a recurring basis are derivative instruments. The fair value of derivatives classified as Level 2 assets was $0.6 million on a recurring basis as of January 1, 2011.
| January 1, 2011 | ||||||||||||||||
| (in millions of U.S. dollars) |
Level 1 | Level 2 | Level 3 | Fair Value Measurements |
||||||||||||
| Assets |
||||||||||||||||
| Derivatives |
$ | — | $ | 0.6 | $ | — | $ | 0.6 | ||||||||
| Total Assets |
$ | — | $ | 0.6 | $ | — | $ | 0.6 | ||||||||
Fair value of financial instruments
The carrying amounts reflected in the Consolidated Balance Sheets for cash, receivables, payables, short-term borrowings and long-term debt approximate their respective fair values, except as otherwise indicated. The carrying values and estimated fair values of our significant outstanding debt as of January 1, 2011 and January 2, 2010 are as follows:
| January 1, 2011 | January 2, 2010 | |||||||||||||||
| (in millions of U.S. dollars) |
Carrying Value |
Fair Value |
Carrying Value |
Fair Value |
||||||||||||
| 8% senior subordinated notes due in 2011 1 |
$ | — | $ | — | $ | 11.1 | $ | 11.1 | ||||||||
| 8.375% senior notes due in 2017 1 |
215.0 | 232.7 | 215.0 | 222.0 | ||||||||||||
| 8.125% senior notes due in 2018 1 |
375.0 | 404.1 | — | — | ||||||||||||
| ABL facility |
7.9 | 7.9 | 20.2 | 20.2 | ||||||||||||
| Total |
$ | 597.9 | $ | 644.7 | $ | 246.3 | $ | 253.3 | ||||||||
| 1 | The fair values are based on the trading levels and bid/offer prices observed by a market participant. |
Fair value of contingent consideration
We estimated the fair value of the acquisition related contingent consideration using financial projections of the acquired business and estimated probability of achievement. The fair value was based on significant inputs not observed in the market and thus represented a Level 3 instrument. Level 3 instruments are valued based on unobservable inputs that are supported by little or no market activity and reflect our own assumptions in measuring fair value.
F-43
Table of Contents
The following table represents the change in the contingent consideration liability during the year ended January 1, 2011:
| (in millions of U.S. dollars) |
Year ended January 1, 2011 |
|||
| Beginning balance |
$ | — | ||
| Acquisition date fair value |
52.5 | |||
| Adjustments to fair value |
(20.3 | ) | ||
| Ending balance |
$ | 32.2 | ||
Note 22—Quarterly Financial Information (unaudited)
During the quarter ended January 1, 2011, we identified an error relating to pricing discounts of $3.7 million for one of our customers that occurred in our quarter ended October 2, 2010. The impact of this error was an overstatement of net revenue and operating results for the quarter and nine months ended October 2, 2010. We assessed the materiality of this error in accordance with guidance within ASC 250-10-S99 (SEC’s Staff Accounting Bulletin 99) and concluded that the previously issued interim financial statements for the quarter and nine months ended October 2, 2010 are not materially misstated. In accordance with guidance within ASC 250-10-S99 (SEC’s Staff Accounting Bulletin 108), we have corrected the immaterial error by revising the prior interim period financial statements for the quarter ended October 2, 2010 as shown in the quarterly financial information below. This revision will be presented prospectively in future filings.
| Year ended January 1, 2011 (52 weeks) | ||||||||||||||||||||
| (in millions of U.S. dollars, except per share amounts) |
First Quarter |
Second Quarter |
Third Quarter |
Fourth Quarter |
Total | |||||||||||||||
| Revenue |
$ | 362.9 | $ | 424.7 | $ | 486.9 | $ | 528.8 | $ | 1,803.3 | ||||||||||
| Cost of sales |
305.7 | 351.2 | 419.8 | $ | 460.3 | 1,537.0 | ||||||||||||||
| Gross Profit |
57.2 | 73.5 | 67.1 | 68.5 | 266.3 | |||||||||||||||
| Selling, general and administrative expenses |
32.4 | 34.5 | 47.3 | 52.5 | 166.7 | |||||||||||||||
| Loss (gain) on disposal of property, plant and equipment |
0.2 | (0.1 | ) | 0.3 | 0.7 | 1.1 | ||||||||||||||
| Restructuring |
(0.5 | ) | — | — | — | (0.5 | ) | |||||||||||||
| Operating income |
25.1 | 39.1 | 19.5 | 15.3 | 99.0 | |||||||||||||||
| Net income attributable to Cott Corporation |
$ | 11.5 | $ | 22.3 | $ | 5.8 | $ | 15.1 | $ | 54.7 | ||||||||||
| Per share data: |
||||||||||||||||||||
| Net income per common share |
||||||||||||||||||||
| Basic |
$ | 0.14 | $ | 0.28 | $ | 0.07 | $ | 0.16 | $ | 0.64 | ||||||||||
| Diluted |
$ | 0.14 | $ | 0.28 | $ | 0.07 | $ | 0.16 | $ | 0.63 | ||||||||||
| 1 | During the third quarter, we completed the Cliffstar Acquisition. We recorded $7.2 million of transaction costs related to the acquisition. These costs were recorded in SG&A. |
| 2 | During the fourth quarter we recorded a reduction to the contingent consideration earn-out accrual of $20.3 million. |
F-44
Table of Contents
| Year ended January 2, 2010 (53 weeks) | ||||||||||||||||||||
| (in millions of U.S. dollars, except per share amounts) |
First Quarter |
Second Quarter |
Third Quarter |
Fourth Quarter |
Total | |||||||||||||||
| Revenue |
$ | 367.0 | $ | 438.8 | $ | 404.9 | $ | 386.0 | $ | 1,596.7 | ||||||||||
| Cost of sales |
308.8 | 365.5 | 341.1 | $ | 331.5 | 1,346.9 | ||||||||||||||
| Gross Profit |
58.2 | 73.3 | 63.8 | 54.5 | 249.8 | |||||||||||||||
| Selling, general and administrative expenses |
34.7 | 35.1 | 36.9 | 40.1 | 146.8 | |||||||||||||||
| Loss on disposal of property, plant and equipment |
(0.1 | ) | 0.1 | — | 0.5 | 0.5 | ||||||||||||||
| Restructuring, asset and goodwill impairments: |
||||||||||||||||||||
| Restructuring |
1.2 | 0.4 | — | (0.1 | ) | 1.5 | ||||||||||||||
| Asset impairments |
0.1 | 3.4 | — | 0.1 | 3.6 | |||||||||||||||
| Operating income |
22.3 | 34.3 | 26.9 | 13.9 | 97.4 | |||||||||||||||
| Net income attributable to Cott Corporation |
$ | 19.9 | $ | 33.7 | $ | 13.9 | $ | 14.0 | $ | 81.5 | ||||||||||
| Per share data: |
||||||||||||||||||||
| Net income per common share |
||||||||||||||||||||
| Basic |
$ | 0.28 | $ | 0.48 | $ | 0.18 | $ | 0.18 | $ | 1.10 | ||||||||||
| Diluted |
$ | 0.28 | $ | 0.48 | $ | 0.18 | $ | 0.17 | $ | 1.08 | ||||||||||
| • | The fourth quarter of 2009 included an extra week, which is estimated to have contributed $20.3 million of revenue and $1.3 million of operating income, and a $3.5 million loss on the retirement of a portion of the 2011 Notes. |
| • | For the third quarter of 2009, we incurred $2.9 million of executive severance. |
Note 23—Guarantor Subsidiaries
The 2017 Notes and 2018 Notes issued by our wholly owned subsidiary, Cott Beverages, Inc., are unconditionally guaranteed on a senior basis pursuant to guarantees by Cott Corporation and certain other wholly owned subsidiaries (the “Guarantor Subsidiaries”). Such guarantees are full, unconditional and joint and several.
We have not presented separate financial statements and separate disclosures have not been provided concerning subsidiary guarantors because management has determined such information is not material to the holders of the above-mentioned notes. The following supplemental financial information sets forth on an unconsolidated basis, our Balance Sheets, Statements of Operations and Cash Flows for Cott Corporation, Cott Beverages Inc., Guarantor Subsidiaries and our other subsidiaries (the “Non-guarantor Subsidiaries”). The supplemental financial information reflects our investments and those of Cott Beverages Inc. in their respective subsidiaries using the equity method of accounting.
F-45
Table of Contents
Condensed Consolidating Statement of Operations
For the year ended January 1, 2011
(in millions of U.S. dollars)
| Cott Corporation |
Cott Beverages Inc. |
Guarantor Subsidiaries |
Non-guarantor Subsidiaries |
Elimination Entries |
Consolidated | |||||||||||||||||||
| Revenue, net |
$ | 201.0 | $ | 905.6 | $ | 600.4 | $ | 137.6 | $ | (41.3 | ) | $ | 1,803.3 | |||||||||||
| Cost of sales |
158.0 | 774.3 | 527.0 | 119.0 | (41.3 | ) | 1,537.0 | |||||||||||||||||
| Gross profit |
43.0 | 131.3 | 73.4 | 18.6 | — | 266.3 | ||||||||||||||||||
| Selling, general and administrative expenses |
31.0 | 79.1 | 42.6 | 14.0 | — | 166.7 | ||||||||||||||||||
| Loss (gain) on disposal of property, plant & equipment |
— | 1.0 | (0.1 | ) | 0.2 | — | 1.1 | |||||||||||||||||
| Restructuring |
— | (0.5 | ) | — | — | — | (0.5 | ) | ||||||||||||||||
| Operating income |
12.0 | 51.7 | 30.9 | 4.4 | — | 99.0 | ||||||||||||||||||
| Contingent consideration earn-out adjustment |
— | — | (20.3 | ) | — | — | (20.3 | ) | ||||||||||||||||
| Other expense (income), net |
2.3 | 1.3 | 0.8 | (0.4 | ) | — | 4.0 | |||||||||||||||||
| Intercompany interest |
(6.8 | ) | 8.2 | (1.3 | ) | — | (0.1 | ) | — | |||||||||||||||
| Interest expense, net |
0.2 | 35.6 | 0.9 | 0.2 | — | 36.9 | ||||||||||||||||||
| Income before income tax expense and equity income |
16.3 | 6.6 | 50.8 | 4.6 | 0.1 | 78.4 | ||||||||||||||||||
| Income tax expense |
4.5 | 12.0 | 1.7 | 0.4 | — | 18.6 | ||||||||||||||||||
| Equity income (loss) |
42.9 | 6.0 | 0.9 | — | (49.8 | ) | — | |||||||||||||||||
| Net income (loss) |
54.7 | 0.6 | 50.0 | 4.2 | (49.7 | ) | 59.8 | |||||||||||||||||
| Less: Net income attributable to non-controlling interests |
— | — | — | 5.1 | — | 5.1 | ||||||||||||||||||
| Net income (loss) attributed to Cott Corporation |
$ | 54.7 | $ | 0.6 | $ | 50.0 | $ | (0.9 | ) | $ | (49.7 | ) | $ | 54.7 | ||||||||||
F-46
Table of Contents
Condensed Consolidating Statement of Operations
For the year ended January 2, 2010
(in millions of U.S. dollars)
| Cott Corporation |
Cott Beverages Inc. |
Guarantor Subsidiaries |
Non-guarantor Subsidiaries |
Elimination Entries |
Consolidated | |||||||||||||||||||
| Revenue |
$ | 198.7 | $ | 958.8 | $ | 360.6 | $ | 126.6 | $ | (48.0 | ) | $ | 1,596.7 | |||||||||||
| Cost of sales |
167.9 | 805.9 | 313.1 | 108.0 | (48.0 | ) | 1,346.9 | |||||||||||||||||
| Gross profit |
30.8 | 152.9 | 47.5 | 18.6 | — | 249.8 | ||||||||||||||||||
| Selling, general and administrative expenses |
36.5 | 70.9 | 24.7 | 14.7 | — | 146.8 | ||||||||||||||||||
| Loss (gain) on disposal of property, plant and equipment |
0.2 | 0.4 | (0.1 | ) | — | — | 0.5 | |||||||||||||||||
| Restructuring and asset impairments: |
||||||||||||||||||||||||
| Restructuring |
0.2 | 1.3 | — | — | — | 1.5 | ||||||||||||||||||
| Asset impairments |
— | 3.6 | — | — | — | 3.6 | ||||||||||||||||||
| Operating income (loss) |
(6.1 | ) | 76.7 | 22.9 | 3.9 | — | 97.4 | |||||||||||||||||
| Other expense (income), net |
0.8 | 3.6 | — | — | — | 4.4 | ||||||||||||||||||
| Intercompany Interest expense (income), net |
(8.1 | ) | 12.9 | (4.8 | ) | — | — | — | ||||||||||||||||
| Interest expense (income), net |
0.3 | 28.9 | 0.3 | 0.2 | — | 29.7 | ||||||||||||||||||
| Income before income tax (benefit) and (loss) equity income |
0.9 | 31.3 | 27.4 | 3.7 | — | 63.3 | ||||||||||||||||||
| Income tax (benefit) expense |
(16.8 | ) | (9.7 | ) | 3.5 | 0.2 | — | (22.8 | ) | |||||||||||||||
| Equity income (loss) |
63.8 | 5.7 | 46.6 | — | (116.1 | ) | — | |||||||||||||||||
| Net income (loss) |
81.5 | 46.7 | 70.5 | 3.5 | (116.1 | ) | 86.1 | |||||||||||||||||
| Less: Net income attributable to non-controlling interests |
— | — | — | 4.6 | — | 4.6 | ||||||||||||||||||
| Net income (loss) attributed to Cott Corporation |
$ | 81.5 | $ | 46.7 | $ | 70.5 | $ | (1.1 | ) | $ | (116.1 | ) | $ | 81.5 | ||||||||||
F-47
Table of Contents
Condensed Consolidating Statement of Operations
For the year ended December 27, 2008
(in millions of U.S. dollars)
| Cott Corporation |
Cott Beverages Inc. |
Guarantor Subsidiaries |
Non-guarantor Subsidiaries |
Elimination Entries |
Consolidated | |||||||||||||||||||
| Revenue |
$ | 229.1 | $ | 942.8 | $ | 391.2 | $ | 138.2 | $ | (53.2 | ) | $ | 1,648.1 | |||||||||||
| Cost of sales |
191.7 | 858.3 | 343.4 | 126.9 | (53.2 | ) | 1,467.1 | |||||||||||||||||
| Gross profit |
37.4 | 84.5 | 47.8 | 11.3 | — | 181.0 | ||||||||||||||||||
| Selling, general and administrative expenses |
46.0 | 83.5 | 34.6 | 15.7 | — | 179.8 | ||||||||||||||||||
| Loss (gain) on disposal of property , plant and equipment |
0.5 | 1.2 | (0.4 | ) | — | — | 1.3 | |||||||||||||||||
| Restructuring, goodwill and asset impairments: |
||||||||||||||||||||||||
| Restructuring |
1.1 | 5.7 | — | (0.1 | ) | — | 6.7 | |||||||||||||||||
| Goodwill impairments |
— | — | 69.2 | — | — | 69.2 | ||||||||||||||||||
| Asset impairments |
— | 37.0 | — | — | — | 37.0 | ||||||||||||||||||
| Operating income (loss) |
(10.2 | ) | (42.9 | ) | (55.6 | ) | (4.3 | ) | — | (113.0 | ) | |||||||||||||
| Other expense (income), net |
— | (0.2 | ) | (5.3 | ) | 0.8 | — | (4.7 | ) | |||||||||||||||
| Intercompany Interest expense (income), net |
(12.4 | ) | 12.9 | (0.5 | ) | — | — | — | ||||||||||||||||
| Interest expense (income), net |
0.3 | 31.7 | — | 0.3 | — | 32.3 | ||||||||||||||||||
| Income (loss) before income tax (benefit) expense and equity (loss) income |
1.9 | (87.3 | ) | (49.8 | ) | (5.4 | ) | — | (140.6 | ) | ||||||||||||||
| Income tax (benefit) expense |
0.4 | (22.1 | ) | 1.6 | 0.6 | — | (19.5 | ) | ||||||||||||||||
| Equity income (loss) |
(124.3 | ) | 1.8 | (73.6 | ) | — | 196.1 | — | ||||||||||||||||
| Net income (loss) |
(122.8 | ) | (63.4 | ) | (125.0 | ) | (6.0 | ) | 196.1 | (121.1 | ) | |||||||||||||
| Less: Net income attributable to non-controlling interests |
— | — | — | 1.7 | — | 1.7 | ||||||||||||||||||
| Net income (loss) attributed to Cott Corporation |
$ | (122.8 | ) | $ | (63.4 | ) | $ | (125.0 | ) | $ | (7.7 | ) | $ | 196.1 | $ | (122.8 | ) | |||||||
F-48
Table of Contents
Consolidating Balance Sheet
As of January 1, 2011
(in millions of U.S. dollars)
| Cott Corporation |
Cott Beverages Inc. |
Guarantor Subsidiaries |
Non-guarantor Subsidiaries |
Elimination Entries |
Consolidated | |||||||||||||||||||
| ASSETS |
||||||||||||||||||||||||
| Current assets |
||||||||||||||||||||||||
| Cash & cash equivalents |
$ | 7.8 | $ | 9.1 | $ | 26.0 | $ | 5.3 | $ | — | $ | 48.2 | ||||||||||||
| Accounts receivable, net of allowance |
108.6 | 151.6 | 128.6 | 17.3 | (192.5 | ) | 213.6 | |||||||||||||||||
| Income taxes recoverable |
— | 1.3 | (1.3 | ) | 0.3 | — | 0.3 | |||||||||||||||||
| Inventories |
18.1 | 66.1 | 124.6 | 6.7 | — | 215.5 | ||||||||||||||||||
| Prepaid expenses and other assets |
3.6 | 19.3 | 8.1 | 1.7 | — | 32.7 | ||||||||||||||||||
| 138.1 | 247.4 | 286.0 | 31.3 | (192.5 | ) | 510.3 | ||||||||||||||||||
| Property, plant and equipment |
50.0 | 180.4 | 259.5 | 13.9 | — | 503.8 | ||||||||||||||||||
| Goodwill |
27.4 | 4.5 | 98.3 | — | — | 130.2 | ||||||||||||||||||
| Intangibles and other assets |
1.3 | 114.8 | 233.6 | 21.4 | — | 371.1 | ||||||||||||||||||
| Deferred income taxes |
3.7 | — | — | (1.2 | ) | — | 2.5 | |||||||||||||||||
| Other tax receivable |
2.5 | 7.6 | 1.2 | — | — | 11.3 | ||||||||||||||||||
| Due from affiliates |
241.8 | 166.9 | 220.9 | 41.9 | (671.5 | ) | — | |||||||||||||||||
| Investments in subsidiaries |
351.5 | — | 161.0 | (512.5 | ) | — | ||||||||||||||||||
| $ | 464.8 | $ | 1,073.1 | $ | 1,099.5 | $ | 268.3 | $ | (1,376.5 | ) | $ | 1,529.2 | ||||||||||||
| LIABILITIES |
||||||||||||||||||||||||
| Current liabilities |
||||||||||||||||||||||||
| Short-term borrowings |
— | 7.9 | — | — | — | 7.9 | ||||||||||||||||||
| Current maturities of long-term debt |
0.1 | 5.4 | 0.1 | 0.4 | — | 6.0 | ||||||||||||||||||
| Accounts payable and accrued liabilities |
97.3 | 204.0 | 185.9 | 14.1 | (192.5 | ) | 308.8 | |||||||||||||||||
| 97.4 | 217.3 | 186.0 | 14.5 | (192.5 | ) | 322.7 | ||||||||||||||||||
| Long-term debt |
— | 601.9 | 1.4 | 2.5 | (0.3 | ) | 605.5 | |||||||||||||||||
| Deferred income taxes |
— | 31.8 | 10.7 | 1.1 | — | 43.6 | ||||||||||||||||||
| Other long-term liabilities |
— | 5.4 | 16.9 | — | (0.1 | ) | 22.2 | |||||||||||||||||
| Losses and distributions in excess of investment |
(198.4 | ) | — | (322.7 | ) | — | 521.1 | — | ||||||||||||||||
| Due from affiliates |
43.2 | 219.6 | 377.2 | 31.7 | (671.7 | ) | — | |||||||||||||||||
| (57.8 | ) | 1,076.0 | 269.5 | 49.8 | (343.5 | ) | 994.0 | |||||||||||||||||
| Equity |
||||||||||||||||||||||||
| Capital stock, no par |
||||||||||||||||||||||||
| Common shares |
395.6 | 354.4 | 1,182.6 | 175.0 | (1,712.0 | ) | 395.6 | |||||||||||||||||
| Treasury shares |
(3.2 | ) | — | — | — | — | (3.2 | ) | ||||||||||||||||
| Additional paid-in-capital |
40.7 | 0.4 | — | — | (0.3 | ) | 40.8 | |||||||||||||||||
| Retained earnings (deficit) |
106.4 | (350.4 | ) | (352.0 | ) | (36.4 | ) | 738.9 | 106.5 | |||||||||||||||
| Accumulated other comprehensive (loss) income |
(16.9 | ) | (7.3 | ) | (0.6 | ) | 66.9 | (59.6 | ) | (17.5 | ) | |||||||||||||
| Total Cott Corporation equity |
522.6 | (2.9 | ) | 830.0 | 205.5 | (1,033.0 | ) | 522.2 | ||||||||||||||||
| Non-controlling interests |
— | — | — | 13.0 | — | 13.0 | ||||||||||||||||||
| Total equity |
522.6 | (2.9 | ) | 830.0 | 218.5 | (1,033.0 | ) | 535.2 | ||||||||||||||||
| $ | 464.8 | $ | 1,073.1 | $ | 1,099.5 | $ | 268.3 | $ | (1,376.5 | ) | $ | 1,529.2 | ||||||||||||
F-49
Table of Contents
Consolidating Balance Sheet
As of January 2, 2010
(in millions of U.S. dollars)
| Cott Corporation |
Cott Beverages Inc. |
Guarantor Subsidiaries |
Non-guarantor Subsidiaries |
Elimination Entries |
Consolidated | |||||||||||||||||||
| ASSETS |
||||||||||||||||||||||||
| Current assets |
||||||||||||||||||||||||
| Cash & cash equivalents |
$ | 4.2 | $ | 10.4 | $ | 12.2 | $ | 4.1 | $ | — | $ | 30.9 | ||||||||||||
| Accounts receivable |
38.1 | 77.3 | 55.8 | 17.5 | (36.4 | ) | 152.3 | |||||||||||||||||
| Income taxes receivable |
2.5 | 17.8 | — | 0.5 | — | 20.8 | ||||||||||||||||||
| Inventories |
15.9 | 61.1 | 15.8 | 6.9 | — | 99.7 | ||||||||||||||||||
| Prepaid expenses and other assets |
4.1 | 5.2 | 2.0 | 0.1 | — | 11.4 | ||||||||||||||||||
| Deferred income taxes |
1.5 | 1.7 | — | — | — | 3.2 | ||||||||||||||||||
| Other current assets |
— | — | 2.2 | — | — | 2 .2 | ||||||||||||||||||
| 66.3 | 173.5 | 88.0 | 29.1 | (36.4 | ) | 320.5 | ||||||||||||||||||
| Property, plant and equipment |
47.8 | 185.3 | 96.1 | 13.8 | — | 343.0 | ||||||||||||||||||
| Goodwill |
26.1 | 4.5 | — | — | — | 30.6 | ||||||||||||||||||
| Intangibles and other assets |
1.0 | 111.8 | 17.7 | 25.0 | — | 155.5 | ||||||||||||||||||
| Deferred income taxes |
5.6 | — | — | 0.2 | (0.4 | ) | 5.4 | |||||||||||||||||
| Other tax receivable |
— | 18.8 | — | — | — | 18.8 | ||||||||||||||||||
| Due from affiliates |
247.1 | 10.0 | 207.9 | 41.9 | (506.9 | ) | — | |||||||||||||||||
| Investments in subsidiaries |
— | 14.5 | — | 152.5 | (167.0 | ) | — | |||||||||||||||||
| 393.9 | 518.4 | 409.7 | 262.5 | (710.7 | ) | 873.8 | ||||||||||||||||||
| LIABILITIES |
||||||||||||||||||||||||
| Current liabilities |
||||||||||||||||||||||||
| Short-term borrowings |
— | 20.2 | — | — | — | 20.2 | ||||||||||||||||||
| Current maturities of long-term debt |
— | 17.2 | — | 0.4 | — | 17.6 | ||||||||||||||||||
| Income taxes payable |
— | — | 2.1 | — | — | 2 .1 | ||||||||||||||||||
| Accounts payable and accrued liabilities |
37.1 | 99.5 | 52.4 | 14.2 | (36.4 | ) | 166.8 | |||||||||||||||||
| Deferred income taxes |
— | — | 0.4 | — | — | 0.4 | ||||||||||||||||||
| 37.1 | 136.9 | 54.9 | 14.6 | (36.4 | ) | 207.1 | ||||||||||||||||||
| Long-term debt |
— | 230.5 | — | 2.7 | — | 233.2 | ||||||||||||||||||
| Deferred income taxes |
— | 6.4 | 10.9 | 0.2 | — | 17.5 | ||||||||||||||||||
| Other tax liabilities |
— | — | — | 0.9 | (0.4 | ) | 0.5 | |||||||||||||||||
| Other long-term liabilities |
0.1 | 6.5 | 7.6 | — | — | 14.2 | ||||||||||||||||||
| Losses and distributions in excess of investment |
(72.5 | ) | — | 118.8 | — | (46.3 | ) | — | ||||||||||||||||
| Due from affiliates |
43.2 | 206.6 | 234.5 | 22.6 | (506.9 | ) | — | |||||||||||||||||
| 7.9 | 586.9 | 426.7 | 41.0 | (590.0 | ) | 472.5 | ||||||||||||||||||
| Equity |
||||||||||||||||||||||||
| Capital stock |
||||||||||||||||||||||||
| Common shares |
322.5 | 279.2 | 378.0 | 175.0 | (832.2 | ) | 322.5 | |||||||||||||||||
| Treasury shares |
(4.4 | ) | — | — | — | — | (4.4 | ) | ||||||||||||||||
| Additional paid-in-capital |
37.4 | — | — | — | — | 37.4 | ||||||||||||||||||
| Retained earnings (deficit) |
51.8 | (346.2 | ) | (393.0 | ) | (27.6 | ) | 766.8 | 51.8 | |||||||||||||||
| Accumulated other comprehensive (loss) income |
(21.3 | ) | (1.5 | ) | (2.0 | ) | 58.8 | (55.3 | ) | (21.3 | ) | |||||||||||||
| Total Cott Corporation's equity |
386.0 | (68.5 | ) | (17.0 | ) | 206.2 | (120.7 | ) | 386.0 | |||||||||||||||
| Non-controlling interests |
— | — | — | 15.3 | — | 15.3 | ||||||||||||||||||
| Total equity |
386.0 | (68.5 | ) | (17.0 | ) | 221.5 | (120.7 | ) | 401.3 | |||||||||||||||
| $ | 393.9 | $ | 518.4 | $ | 409.7 | $ | 262.5 | $ | (710.7 | ) | $ | 873.8 | ||||||||||||
F-50
Table of Contents
Condensed Consolidating Statement of Cash Flows
For the year ended January 1, 2011
(in millions of U.S. dollars)
| Cott Corporation |
Cott Beverages Inc. |
Guarantor Subsidiaries |
Non-guarantor Subsidiaries |
Elimination Entries |
Consolidated | |||||||||||||||||||
| Operating activities |
||||||||||||||||||||||||
| Net income |
$ | 54.7 | $ | 0.6 | $ | 50.0 | $ | 4.2 | $ | (49.7 | ) | $ | 59.8 | |||||||||||
| Depreciation & amortization |
6.3 | 35.4 | 26.4 | 5.9 | — | 74.0 | ||||||||||||||||||
| Amortization of financing fees |
0.4 | 2.1 | 0.2 | — | — | 2.7 | ||||||||||||||||||
| Share-based compensation expense |
0.7 | 3.9 | 0.1 | — | — | 4.7 | ||||||||||||||||||
| Increase in deferred income taxes |
2.3 | 12.0 | 1.7 | 1.1 | — | 17.0 | ||||||||||||||||||
| Write-off of financing fees |
0.2 | 1.0 | 0.2 | — | — | 1.4 | ||||||||||||||||||
| Loss on disposal of property, plant & equipment |
— | 1.0 | (0.1 | ) | 0.2 | — | 1.1 | |||||||||||||||||
| Loss on buyback of Notes |
— | 0.1 | — | — | — | 0.1 | ||||||||||||||||||
| Contingent consideration earn-out adjustment |
— | — | (20.3 | ) | — | — | (20.3 | ) | ||||||||||||||||
| Contract termination loss |
— | 3.6 | — | — | — | 3.6 | ||||||||||||||||||
| Contract termination payments |
— | (5.4 | ) | — | — | — | (5.4 | ) | ||||||||||||||||
| Equity (income) loss, net of distributions |
(42.9 | ) | (6.0 | ) | (0.9 | ) | — | 49.8 | — | |||||||||||||||
| Intercompany transactions |
8.9 | 7.7 | — | — | (16.5 | ) | — | |||||||||||||||||
| Other non-cash items |
2.0 | 3.8 | — | (0.3 | ) | — | 5.5 | |||||||||||||||||
| Change in operating assets and liabilities, net of acquisition |
(35.3 | ) | 63.4 | (17.9 | ) | 7.6 | 16.4 | 34.2 | ||||||||||||||||
| Net cash (used in) provided by operating activities |
(2.8 | ) | 123.1 | 39.4 | 18.7 | — | 178.4 | |||||||||||||||||
| Investing activities |
||||||||||||||||||||||||
| Acquisition |
— | (507.7 | ) | — | — | — | (507.7 | ) | ||||||||||||||||
| Additions to property, plant & equipment |
(5.4 | ) | (26.5 | ) | (10.6 | ) | (1.5 | ) | — | (44.0 | ) | |||||||||||||
| Additions to intangibles |
— | (4.2 | ) | — | — | — | (4.2 | ) | ||||||||||||||||
| Proceeds from sale of property, plant & equipment |
— | 0.3 | 0.3 | 0.6 | — | 1.2 | ||||||||||||||||||
| Advances to affiliates |
21.0 | — | (12.3 | ) | (8.8 | ) | 0.1 | — | ||||||||||||||||
| Net cash provided by (used in) investing activities |
15.6 | (538.1 | ) | (22.6 | ) | (9.7 | ) | 0.1 | (554.7 | ) | ||||||||||||||
| Financing activities |
||||||||||||||||||||||||
| Payments of long-term debt |
0.1 | (18.3 | ) | — | (0.5 | ) | — | (18.7 | ) | |||||||||||||||
| Issuance of long-term debt |
— | 375.0 | — | — | — | 375.0 | ||||||||||||||||||
| Borrowings under ABL |
— | 307.1 | 59.4 | — | — | 366.5 | ||||||||||||||||||
| Payments under ABL |
— | (319.3 | ) | (59.7 | ) | — | — | (379.0 | ) | |||||||||||||||
| Advances from affiliates |
8.8 | 12.3 | (21.0 | ) | — | (0.1 | ) | 0.0 | ||||||||||||||||
| Intercompany contributions |
(89.8 | ) | 71.1 | 18.7 | — | — | (0.0 | ) | ||||||||||||||||
| Distributions to non-controlling interests |
— | — | — | (7.4 | ) | — | (7.4 | ) | ||||||||||||||||
| Issuance of common shares, net of offering fees |
71.1 | — | — | — | — | 71.1 | ||||||||||||||||||
| Financing fees |
— | (14.2 | ) | — | — | — | (14.2 | ) | ||||||||||||||||
| Net cash (used in) provided by financing activities |
(9.8 | ) | 413.7 | (2.6 | ) | (7.9 | ) | (0.1 | ) | 393.3 | ||||||||||||||
| Effect of exchange rate changes on cash |
0.6 | — | (0.4 | ) | 0.1 | — | 0.3 | |||||||||||||||||
| Net increase (decrease) in cash & cash equivalents |
3.6 | (1.3 | ) | 13.8 | 1.2 | — | 17.3 | |||||||||||||||||
| Cash & cash equivalents, beginning of period |
4.2 | 10.4 | 12.2 | 4.1 | — | 30.9 | ||||||||||||||||||
| Cash & cash equivalents, end of period |
$ | 7.8 | $ | 9.1 | $ | 26.0 | $ | 5.3 | $ | — | $ | 48.2 | ||||||||||||
F-51
Table of Contents
Condensed Consolidating Statement of Cash Flows
For the year ended January 2, 2010
(in millions of U.S. dollars)
| Cott Corporation |
Cott Beverages Inc. |
Guarantor Subsidiaries |
Non-guarantor Subsidiaries |
Elimination Entries |
Consolidated | |||||||||||||||||||
| Operating activities |
||||||||||||||||||||||||
| Net income (loss) |
$ | 81.5 | $ | 46.7 | $ | 70.5 | $ | 3.5 | $ | (116.1 | ) | $ | 86.1 | |||||||||||
| Depreciation and amortization |
8.1 | 37.9 | 14.6 | 5.6 | — | 66.2 | ||||||||||||||||||
| Amortization of financing fees |
0.2 | 1.1 | 0.2 | — | — | 1.5 | ||||||||||||||||||
| Share-based compensation |
0.1 | 1.2 | — | — | — | 1.3 | ||||||||||||||||||
| Deferred income taxes |
3.3 | 2.9 | 0.1 | (0.1 | ) | — | 6.2 | |||||||||||||||||
| Loss (gain) on disposal of property, plant and equipment |
0.2 | 0.4 | (0.1 | ) | — | — | 0.5 | |||||||||||||||||
| Equity (loss) income , net of distributions |
(62.4 | ) | (5.7 | ) | (46.7 | ) | (1.3 | ) | 116.1 | — | ||||||||||||||
| Intercompany transactions |
8.6 | 6.9 | — | — | (15.5 | ) | — | |||||||||||||||||
| Loss on buyback of 2011 Notes |
1.5 | — | — | — | — | 1.5 | ||||||||||||||||||
| Asset impairments |
— | 0.1 | — | — | — | 0.1 | ||||||||||||||||||
| Intangible impairments |
— | 3.5 | — | — | — | 3.5 | ||||||||||||||||||
| Lease contract termination payments |
— | (3.8 | ) | — | — | — | (3.8 | ) | ||||||||||||||||
| Other non-cash items |
— | 2.6 | — | — | — | 2.6 | ||||||||||||||||||
| Net change in non-cash working capital |
(102.0 | ) | 64.6 | (0.5 | ) | 11.8 | 15.5 | (10.6 | ) | |||||||||||||||
| Net cash (used in) provided by operating activities |
(60.9 | ) | 158.4 | 38.1 | 19.5 | — | 155 .1 | |||||||||||||||||
| Investing activities |
||||||||||||||||||||||||
| Additions to property, plant and equipment |
(4.3 | ) | (18.4 | ) | (8.6 | ) | (1.0 | ) | — | (32.3 | ) | |||||||||||||
| Proceeds from disposal of property, plant and equipment |
— | 1.5 | 0.2 | — | — | 1.7 | ||||||||||||||||||
| Advances to affiliates |
12.6 | — | (11.2 | ) | (9.9 | ) | 8.5 | — | ||||||||||||||||
| Additions to intangibles and other assets |
— | (1.6 | ) | — | — | — | (1.6 | ) | ||||||||||||||||
| Net cash provided by (used in) investing activities |
8.3 | (18.5 | ) | (19.6 | ) | (10.9 | ) | 8.5 | (32.2 | ) | ||||||||||||||
| Financing activities |
||||||||||||||||||||||||
| Payments of long-term debt |
— | (265.2 | ) | — | (0.3 | ) | — | (265.5 | ) | |||||||||||||||
| Issue of long-term debt |
— | 211.9 | — | — | — | 211.9 | ||||||||||||||||||
| Long-term borrowings—ABL |
87.0 | 595.0 | 86.1 | — | — | 768.1 | ||||||||||||||||||
| Long-term repayments—ABL |
(90.1 | ) | (679.4 | ) | (87.1 | ) | — | — | (856.6 | ) | ||||||||||||||
| Advances from affiliates |
10.0 | 11.3 | (12.8 | ) | — | (8.5 | ) | — | ||||||||||||||||
| Distributions to subsidiary minority shareowner |
— | — | — | (6.6 | ) | — | (6.6 | ) | ||||||||||||||||
| Issuance of common shares |
47.5 | — | — | — | — | 47.5 | ||||||||||||||||||
| Deferred financing fees |
— | (6.2 | ) | — | — | — | (6.2 | ) | ||||||||||||||||
| Other financing activities |
— | — | — | (0.1 | ) | — | (0.1 | ) | ||||||||||||||||
| Net cash provided by (used in) financing activities |
54.4 | (132.6 | ) | (13.8 | ) | (7.0 | ) | (8.5 | ) | (107.5 | ) | |||||||||||||
| Effect of exchange rate on cash |
0.3 | — | 0.1 | 0.4 | — | 0.8 | ||||||||||||||||||
| Net increase in cash & cash equivalents |
2.1 | 7.3 | 4.8 | 2.0 | — | 16.2 | ||||||||||||||||||
| Cash and cash equivalents, beginning of period |
2.1 | 3.1 | 7.4 | 2.1 | — | 14.7 | ||||||||||||||||||
| Cash and cash equivalents, end of |
$ | 4.2 | $ | 10.4 | $ | 12.2 | $ | 4.1 | $ | — | $ | 30.9 | ||||||||||||
F-52
Table of Contents
Condensed Consolidating Statement of Cash Flows
For the year ended December 27, 2008
(in millions of U.S. dollars)
| Cott Corporation |
Cott Beverages Inc. |
Guarantor Subsidiaries |
Non-guarantor Subsidiaries |
Elimination Entries |
Consolidated | |||||||||||||||||||
| Operating activities |
||||||||||||||||||||||||
| Net (loss) income |
$ | (122.8 | ) | $ | (63.4 | ) | $ | (125.0 | ) | $ | (6.0 | ) | $ | 196.1 | $ | (121.1 | ) | |||||||
| Depreciation and amortization |
13.6 | 41.6 | 19.5 | 6.0 | — | 80.7 | ||||||||||||||||||
| Amortization of financing fees |
0.2 | 0.7 | 0.2 | — | — | 1.1 | ||||||||||||||||||
| Share-based compensation |
2.1 | 3.4 | 0.1 | — | — | 5.6 | ||||||||||||||||||
| Deferred income taxes |
(27.9 | ) | 30.7 | (3.2 | ) | (13.0 | ) | — | (13.4 | ) | ||||||||||||||
| Tax receivable |
— | — | — | — | — | — | ||||||||||||||||||
| Increase (decrease) in other income tax liabilities |
21.3 | (42.7 | ) | (1.3 | ) | — | — | (22.7 | ) | |||||||||||||||
| Loss (gain) on disposal of property, plant and equipment |
0.5 | 1.2 | (0.4 | ) | — | — | 1.3 | |||||||||||||||||
| Equity income (loss), net of distributions |
124.3 | (1.8 | ) | 73.6 | — | (196.1 | ) | — | ||||||||||||||||
| Intercompany transactions |
9.7 | 3.8 | 3.0 | — | (16.5 | ) | — | |||||||||||||||||
| Asset impairments |
— | 1.6 | — | — | — | 1.6 | ||||||||||||||||||
| Intangible impairments |
— | 35.4 | — | — | — | 35.4 | ||||||||||||||||||
| Goodwill impairments |
— | — | 69.2 | — | — | 69.2 | ||||||||||||||||||
| Lease contract termination loss |
— | 0.3 | — | — | — | 0.3 | ||||||||||||||||||
| Lease contract termination payments |
— | (3.8 | ) | — | — | — | (3.8 | ) | ||||||||||||||||
| Other non-cash items |
1.5 | 1.6 | — | — | — | 3.1 | ||||||||||||||||||
| Net change in non-cash working capital |
(34.5 | ) | 5.1 | 30.0 | 29.0 | — | 29.6 | |||||||||||||||||
| Net cash (used in) provided by operating activities |
(12.0 | ) | 13.7 | 65.7 | 16.0 | (16.5 | ) | 66.9 | ||||||||||||||||
| Investing activities |
||||||||||||||||||||||||
| Additions to property, plant and equipment |
(2.5 | ) | (42.6 | ) | (8.5 | ) | (2.3 | ) | — | (55.9 | ) | |||||||||||||
| Acquisitions |
— | — | — | — | — | — | ||||||||||||||||||
| Proceeds from disposal of property, plant and equipment |
2.5 | 1.9 | 0.1 | — | — | 4.5 | ||||||||||||||||||
| Advances to affiliates |
22.4 | — | (10.4 | ) | (6.0 | ) | (6.0 | ) | — | |||||||||||||||
| Investment in subsidiary |
— | — | — | — | — | — | ||||||||||||||||||
| Additions to intangibles and other assets |
(0.3 | ) | (3.1 | ) | — | — | — | (3.4 | ) | |||||||||||||||
| Net cash provided by (used in) investing activities |
22.1 | (43.8 | ) | (18.8 | ) | (8.3 | ) | (6.0 | ) | (54.8 | ) | |||||||||||||
| Financing activities |
||||||||||||||||||||||||
| Payments of long-term debt |
— | (8.7 | ) | — | (0.3 | ) | — | (9.0 | ) | |||||||||||||||
| Issue of long-term debt |
— | 33.8 | — | — | — | 33.8 | ||||||||||||||||||
| Payments on extinguishment of credit facility |
(20.4 | ) | (91.9 | ) | (13.9 | ) | (1.3 | ) | — | (127.5 | ) | |||||||||||||
| Short-term borrowings |
— | (8.1 | ) | — | — | — | (8.1 | ) | ||||||||||||||||
| Long-term borrowings—ABL |
40.9 | 1,196.9 | 62.5 | — | — | 1,300.3 | ||||||||||||||||||
| Long-term repayments—ABL |
(38.0 | ) | (1,092.2 | ) | (62.5 | ) | — | — | (1,192.7 | ) | ||||||||||||||
| Advances from affiliates |
6.0 | 10.4 | (22.4 | ) | — | 6.0 | — | |||||||||||||||||
| Distributions to subsidiary minority shareowner |
— | — | — | (3.9 | ) | — | (3.9 | ) | ||||||||||||||||
| Issuance of common shares |
— | — | — | — | — | — | ||||||||||||||||||
| Purchase of treasury shares |
(6.4 | ) | — | — | — | — | (6.4 | ) | ||||||||||||||||
| Issuance of short-term debt |
— | — | — | — | — | — | ||||||||||||||||||
| Deferred financing fees |
(0.8 | ) | (3.7 | ) | (0.8 | ) | — | — | (5.3 | ) | ||||||||||||||
| Dividends paid |
— | (3.0 | ) | (9.7 | ) | (3.8 | ) | 16.5 | — | |||||||||||||||
| Other financing activities |
(0.2 | ) | (0.3 | ) | — | — | — | (0.5 | ) | |||||||||||||||
| Net cash (used in) provided by financing activities |
(18.9 | ) | 33.2 | (46.8 | ) | (9.3 | ) | 22.5 | (19.3 | ) | ||||||||||||||
| Effect of exchange rate on cash |
(2.3 | ) | — | (3.0 | ) | (0.2 | ) | — | (5.5 | ) | ||||||||||||||
| Net (decrease ) increase in cash |
(11.1 | ) | 3.1 | (2.9 | ) | (1.8 | ) | — | (12.7 | ) | ||||||||||||||
| Cash and cash equivalents, beginning of period |
13.2 | — | 10.3 | 3.9 | — | 27.4 | ||||||||||||||||||
| Cash and cash equivalents, end of period |
$ | 2.1 | $ | 3.1 | $ | 7.4 | $ | 2.1 | $ | — | $ | 14.7 | ||||||||||||
F-53
Table of Contents
Schedule II—Valuation and Qualifying Accounts
| (in millions of U.S. dollars) |
Year ended January 1, 2011 | |||||||||||||||||||||||
| Description |
Balance at Beginning of Year |
Reduction in Sales |
Charged to Costs and Expenses |
Charged to Other Accounts |
Deductions | Balance at End of Year |
||||||||||||||||||
| Reserves deducted in the balance sheet from the asset to which they apply |
||||||||||||||||||||||||
| Allowances for losses on: |
||||||||||||||||||||||||
| Accounts receivables |
$ | (5.9 | ) | $ | — | $ | (0.6 | ) | $ | (0.1 | ) | $ | (0.4 | ) | $ | (7.0 | ) | |||||||
| Inventories |
(6.7 | ) | — | (1.3 | ) | 0.2 | 1.1 | (6.7 | ) | |||||||||||||||
| Deferred income tax liabilities |
(17.6 | ) | — | 4.4 | 0.5 | — | (12.7 | ) | ||||||||||||||||
| $ | (30.2 | ) | $ | — | $ | 2.5 | $ | 0.6 | $ | 0.7 | $ | (26.4 | ) | |||||||||||
| (in millions of U.S. dollars) |
Year ended January 2, 2010 | |||||||||||||||||||||||
| Description |
Balance at Beginning of Year |
Reduction in Sales |
Charged to Costs and Expenses |
Charged to Other Accounts |
Deductions | Balance at End of Year |
||||||||||||||||||
| Reserves deducted in the balance sheet from the asset to which they apply |
||||||||||||||||||||||||
| Allowances for losses on: |
||||||||||||||||||||||||
| Accounts receivables |
$ | (5.5 | ) | $ | — | $ | (0.8 | ) | $ | 0.6 | $ | (0.2 | ) | $ | (5.9 | ) | ||||||||
| Inventories |
(7.1 | ) | — | 0.6 | (0.1 | ) | (0.1 | ) | (6.7 | ) | ||||||||||||||
| Deferred income tax liabilities |
(42.7 | ) | — | 22.7 | 2.4 | — | (17.6 | ) | ||||||||||||||||
| $ | (55.3 | ) | $ | — | $ | 22.5 | $ | 2.9 | $ | (0.3 | ) | $ | (30.2 | ) | ||||||||||
| (in millions of U.S. dollars) |
Year ended December 27, 2008 | |||||||||||||||||||||||
| Description |
Balance at Beginning of Year |
Reduction in Sales |
Charged to Costs and Expenses |
Charged to Other Accounts |
Deductions | Balance at End of Year |
||||||||||||||||||
| Reserves deducted in the balance sheet from the asset to which they apply |
||||||||||||||||||||||||
| Allowances for losses on: |
||||||||||||||||||||||||
| Accounts receivables |
$ | (4.9 | ) | $ | — | $ | (2.4 | ) | $ | 1.5 | $ | 0.3 | $ | (5.5 | ) | |||||||||
| Inventories |
(14.8 | ) | — | (8.3 | ) | 1.3 | 14.7 | (7.1 | ) | |||||||||||||||
| Deferred income tax liabilities |
(20.8 | ) | — | 34.6 | (19.5 | ) | — | (5.7 | ) | |||||||||||||||
| Other tax liabilities |
(36.6 | ) | — | (5.1 | ) | 23.4 | — | (18.3 | ) | |||||||||||||||
| Accrued sales incentives |
(22.9 | ) | (34.1 | ) | — | 5.0 | 31.0 | (21.0 | ) | |||||||||||||||
| $ | (100.0 | ) | $ | (34.1 | ) | $ | 18.8 | $ | 11.7 | $ | 46.0 | $ | (57.6 | ) | ||||||||||
F-54
Table of Contents
Cott Corporation
Exhibit Index
| Number |
Description | |
| 2.1 | Agreement Relating to the Sale and Purchase of the Whole of the Issued Share Capital of Macaw (Holdings) Limited, dated August 10, 2005, between Andrew Cawthray and Others and Martyn Rose and Cott Beverages Limited (incorporated by reference to Exhibit 2.1 to our Form 8-K dated August 16, 2005). | |
| 2.2 | Asset Purchase Agreement, dated as of July 7, 2010, by and among Cott Corporation, Caroline LLC, a wholly-owned subsidiary of Cott Corporation, Cliffstar Corporation, each of the Cliffstar companies named therein, and Stanley Star, solely in his capacity as sellers’ representative (incorporated by reference to Exhibit 2.1 to our Form 8-K/A filed July 9, 2010). | |
| 3.1 | Articles of Amalgamation of Cott Corporation (incorporated by reference to Exhibit 3.1 to our Form 10-K filed February 28, 2007). | |
| 3.2 | Amended and Restated By-laws of Cott Corporation (incorporated by reference to Exhibit 3.2 to our Form 10-Q filed May 10, 2007). | |
| 4.1 | Indenture dated as of December 21, 2001 governing the 8.0% Senior Subordinated Notes due in 2011, between Cott Beverages Inc. (as issuer) and HSBC Bank USA (as trustee) (incorporated by reference to Exhibit 4.3 to our Form 10-K filed March 8, 2002). | |
| 4.2 | Registration Rights Agreement dated as of December 21, 2001, among Cott Beverages Inc., the Guarantors named therein and Lehman Brothers Inc., BMO Nesbitt Burns Corp. and CIBC World Markets Corp. (incorporated by reference to Exhibit 4.4 to our Form 10-K filed March 8, 2002). | |
| 4.3 | Supplemental Indenture dated as of November 13, 2009 governing the 8.0% Senior Subordinated Notes due 2011, by and among Cott Beverages Inc., Cott Corporation, the guarantors identified therein and HSBC Bank USA, National Association, as trustee (incorporated by reference to Exhibit 4.4 to our Form 8-K filed on November 16, 2009). | |
| 4.4 | Indenture dated as of November 13, 2009, governing the 8.375% Senior Notes due 2017, by and among Cott Beverages Inc., Cott Corporation, the guarantors identified therein and HSBC Bank USA, National Association, as trustee (incorporated by reference to Exhibit 4.1 to our Form 8-K filed on November 16, 2009). | |
| 4.5 | Form of 8.375% Senior Note due 2017 (incorporated by reference to Exhibit 4.2 to our Form 8-K filed on November 16, 2009). | |
| 4.6 | Registration Rights Agreement, dated as of November 13, 2009, among Cott Beverages Inc., Cott Corporation, the guarantors identified therein and Barclays Capital Inc., J.P. Morgan Securities Inc. and Deutsche Bank Securities Inc. (incorporated by reference to Exhibit 4.3 to our Form 8-K filed on November 16, 2009). | |
| 4.7 | Indenture dated as of August 17, 2010, governing the 8.125% Senior Notes due 2018, by and among Cott Beverages Inc., Cott Corporation, the guarantors identified therein and HSBC Bank USA, National Association, as trustee (incorporated by reference to Exhibit 4.1 to our Form 8-K filed August 20, 2010). | |
| 4.8 | Form of 8.125% Senior Note due 2018 (included as Exhibit A to Exhibit 4.7, which is incorporated by reference to Exhibit 4.1 to our Form 8-K filed August 20, 2010). | |
| 4.9 | Registration Rights Agreement, dated as of August 17, 2010, among Cott Beverages Inc., Cott Corporation, the guarantors identified therein and Deutsche Bank Securities Inc., as representative to the Initial Purchasers (incorporated by reference to Exhibit 4.3 to our Form 8-K filed August 20, 2010). | |
EX-1
Table of Contents
| Number |
Description | |
| 10.1 1 | Supply Agreement, dated December 21, 1998, between Wal-Mart Stores, Inc. and Cott Beverages USA, Inc. (now “Cott Beverages Inc.”) (filed herewith). | |
| 10.2 2 | Second Canadian Employee Share Purchase Plan effective January 2, 2001 (incorporated by reference to Exhibit 10.11 to our Form 10-K filed March 20, 2001). | |
| 10.3 1 | Supply Agreement executed November 11, 2003, effective January 1, 2002 between Crown Cork & Seal Company, Inc. and Cott Corporation (incorporated by reference to Exhibit 10.14 to our Form 10-Q/A filed August 5, 2004). | |
| 10.4 2 | Share Plan for Non-Employee Directors effective November 1, 2003 (incorporated by reference to Exhibit 10.15 to our Form 10-K filed March 18, 2004). | |
| 10.5 2 | Employment Offer Letter to Matthew A. Kane, Jr. dated March 12, 2004 (incorporated by reference to Exhibit 10.42 to our Form 10-K filed March 11, 2008). | |
| 10.6 2 | Restated 1986 Common Share Option Plan of Cott Corporation/Corporation Cott as amended through October 20, 2004 (incorporated by reference to Exhibit 10.15 to our Form 10-K filed March 16, 2005). | |
| 10.7 1 | Amendment to Supply Agreement between Crown Cork & Seal USA, Inc. (successor to Crown Cork & Seal Company, Inc.) and Cott Corporation, dated December 23, 2004 (incorporated by reference to Exhibit 10.17 to our Form 10-K filed March 16, 2005). | |
| 10.8 2 | Cott Corporation Executive Incentive Share Purchase Plan (2008 Restatement) effective December 31, 2006 (incorporated by reference to Exhibit 4.1 of our Form S-8 filed on June 20, 2008). | |
| 10.9 2 | Employment Offer Letter to William Reis dated January 29, 2007 (incorporated by reference to Exhibit 10.43 to our Form 10-K filed March 11, 2008). | |
| 10.10 2 | Employment Offer Letter to Michael Creamer dated April 16, 2007 (incorporated by reference to Exhibit 10.19 to our Form 10-K filed March 11, 2009). | |
| 10.11 2 | Amended and Restated Retention, Severance and Non-Competition Plan (incorporated by reference to Exhibit 10.6 to our Form 10-Q filed August 9, 2007). | |
| 10.12 2 | Amended and Restated Performance Share Unit Plan (incorporated by reference to Exhibit 10.7 to our Form 10-Q filed August 9, 2007). | |
| 10.13 2 | Amended and Restated Share Appreciation Rights Plan (incorporated by reference to Exhibit 10.8 to our Form 10-Q filed August 9, 2007). | |
| 10.14 2 | Employment Offer Letter to Gregory Leiter, executed October 15, 2007 (incorporated by reference to Exhibit 10.41 to our Form 10-K filed March 11, 2008). | |
| 10.15 2 | Employment Offer Letter to Jerry Fowden dated February 29, 2008 (incorporated by reference to Exhibit 10.29 to our Form 10-K filed March 11, 2009). | |
| 10.16 1 | Credit Agreement dated as of August 17, 2010 among Cott Corporation, Cott Beverages Inc., Cott Beverages Limited, Cliffstar LLC and the other Loan Parties party thereto, the Lenders party thereto, JPMorgan Chase Bank, N.A., London Branch as UK Security Trustee, JPMorgan Chase Bank, N.A., as Administrative Agent and Administrative Collateral Agent, General Electric Capital Corporation, as Co-Collateral Agent and Bank of America, N.A., as Documentation Agent (incorporated by reference to Exhibit 10.1 to our Form 10-Q filed November 10, 2010). | |
| 10.17 2 | Employment Agreement with David T. Gibbons dated April 23, 2008 (incorporated by reference to Exhibit 10.3 to our Form 10-Q filed May 13, 2008). | |
EX-2
Table of Contents
| Number |
Description | |
| 10.18 | Agreement between Cott Corporation and Crescendo Partners II, L.P., Series I, Crescendo Investments II, LLC, Crescendo Partners III, L.P., Crescendo Investments III, LLC, Eric Rosenfeld, Mark Benadiba, Mario Pilozzi, Csaba Reider, and Greg Monahan, dated June 18, 2008 (incorporated by reference to Exhibit 99.1 to the amended Schedule 13D filed by Crescendo Partners, L.P. on June 20, 2008). | |
| 10.19 2 | Employment Offer Letter to Neal Cravens dated August 19, 2009 (incorporated by reference to Exhibit 10.1 to our Form 10-Q filed October 29, 2009). | |
| 10.20 2 | Severance Agreement with Juan Figuereo dated September 1, 2009 and effective October 31, 2009 (incorporated by reference to Exhibit 10.21 to our Form 10-K filed March 16, 2010). | |
| 10.21 2 | Amendment No. 1 to Restated Executive Investment Share Purchase Plan, effective December 28, 2008 (incorporated by reference to Exhibit 10.1 to our Form 10-Q filed May 5, 2009). | |
| 10.22 2 | Employment Agreement between Cott Corporation and Jerry Fowden dated February 18, 2009 (incorporated by reference to Exhibit 10.1 to our Form 8-K dated February 24, 2009). | |
| 10.23 2 | Cott Corporation Severance and Non-Competition Plan, dated February 18, 2009 (incorporated by reference to Exhibit 10.2 to our Form 8-K dated February 24, 2009). | |
| 10.24 2 | Amendment to Employment Agreement between Cott Corporation and David T. Gibbons dated February 18, 2009 (incorporated by reference to Exhibit 10.3 to our Form 8-K dated February 24, 2009). | |
| 10.25 2 | Employment Offer Letter to Marni Morgan Poe dated January 14, 2010 (incorporated by reference to Exhibit 10.1 to our Form 10-Q filed May 12, 2010). | |
| 10.26 2 | Severance Agreement with Matthew A. Kane, Jr. dated January 26, 2010 and effective February 15, 2010 (incorporated by reference to Exhibit 10.2 to our Form 10-Q filed May 12, 2010). | |
| 10.27 2 | Common Share Option Cancellation and Forfeiture Agreement between Jerry Fowden and Cott Corporation, dated August 9, 2010 (incorporated by reference to Exhibit 10.1 to our Form 8-K filed August 10, 2010). | |
| 10.28 2 | Stock Appreciation Right Cancellation Agreement between Neal Cravens and Cott Corporation, dated August 10, 2010 (incorporated by reference to Exhibit 10.2 to our Form 8-K filed August 10, 2010). | |
| 10.29 | 2010 Equity Incentive Plan (incorporated by reference to Appendix B of our Definitive Proxy Statement on Schedule 14A filed on April 1, 2010). | |
| 10.30 | Amendment to 2010 Equity Incentive Plan (incorporated by reference to Exhibit 4.2 to our Form 8-K filed on May 4, 2010). | |
| 10.31 | Form of Restricted Share Unit Award Agreement with Time-Based Vesting under Cott Corporation’s 2010 Equity Incentive Plan (incorporated by reference to Exhibit 10.4 to our Form 10-Q filed November 10, 2010). | |
| 10.32 | Form of Restricted Share Unit Award Agreement with Performance-Based Vesting under Cott Corporation’s 2010 Equity Incentive Plan (incorporated by reference to Exhibit 10.5 to our Form 10-Q filed November 10, 2010). | |
| 10.33 2 | Employment Offer Letter to Michael Gibbons dated March 6, 2009 (filed herewith). | |
| 10.34 1 | Supply Agreement executed December 21, 2010, effective January 1, 2011 between Crown Cork & Seal USA, Inc. and Cott Corporation (filed herewith). | |
| 10.35 1 | Termination of Supply Agreement and Release dated as of December 31, 2010 between Crown Cork & Seal USA, Inc. and Cott Corporation (filed herewith). | |
EX-3
Table of Contents
| Number |
Description | |
| 21.1 | List of Subsidiaries of Cott Corporation (filed herewith). | |
| 23.1 | Consent of Independent Registered Certified Public Accounting Firm (filed herewith). | |
| 31.1 | Certification of the Chief Executive Officer pursuant to section 302 of the Sarbanes-Oxley Act of 2002 for the year ended January 1, 2011 (filed herewith). | |
| 31.2 | Certification of the Chief Financial Officer pursuant to section 302 of the Sarbanes-Oxley Act of 2002 for the year ended January 1, 2011 (filed herewith). | |
| 32.1 | Certification of the Chief Executive Officer pursuant to section 906 of the Sarbanes-Oxley Act of 2002 for the year ended January 1, 2011 (furnished herewith). | |
| 32.2 | Certification of the Chief Financial Officer pursuant to section 906 of the Sarbanes-Oxley Act of 2002 for the year ended January 1, 2011 (furnished herewith). | |
| 1 | Document is subject to request for confidential treatment. |
| 2 | Indicates a management contract or compensatory plan. |
EX-4