Attached files
| file | filename |
|---|---|
| EX-3.1 - EXHIBIT 3.01 - CAPITAL BANK CORP | ex3_1.htm |
| EX-32.1 - EXHIBIT 32.01 - CAPITAL BANK CORP | ex32_1.htm |
| EX-31.1 - EXHIBIT 31.01 - CAPITAL BANK CORP | ex31_1.htm |
| EX-32.2 - EXHIBIT 32.02 - CAPITAL BANK CORP | ex32_2.htm |
| EX-31.2 - EXHIBIT 31.02 - CAPITAL BANK CORP | ex31_2.htm |
UNITED STATES
SECURITIES AND EXCHANGE COMMISSION
Washington, D.C. 20549
FORM 10-K
ANNUAL REPORT PURSUANT TO SECTION 13 OR 15(d)
OF THE SECURITIES EXCHANGE ACT OF 1934
For the Fiscal Year Ended December 31, 2010

CAPITAL BANK CORPORATION
(Exact name of registrant as specified in its charter)
|
North Carolina
|
000-30062
|
56-2101930
|
||
|
(State or other jurisdiction of
incorporation or organization) |
(Commission
File Number)
|
(I.R.S. Employer
Identification No.)
|
333 Fayetteville Street, Suite 700
Raleigh, North Carolina 27601
(Address of principal executive offices)
(919) 645-6400
(Registrant’s telephone number, including area code)
Securities registered pursuant to Section 12(b) of the Act:
Common Stock, no par value
(Title of class)
NASDAQ Global Select Market
(Name of each exchange on which registered)
Securities registered pursuant to Section 12(g) of the Act:
None
Indicate by check mark if the registrant is a well-known seasoned issuer, as defined in Rule 405 of the Securities Act. Yes o No þ
Indicate by check mark if the registrant is not required to file reports pursuant to Section 13 or Section 15(d) of the Act. Yes o No þ
Indicate by check mark whether the registrant (1) has filed all reports required to be filed by Section 13 or 15(d) of the Securities Exchange Act of 1934 during the preceding 12 months (or for such shorter period that the registrant was required to file such reports), and (2) has been subject to such filing requirements for the past 90 days. Yes þ No o
Indicate by check mark whether the registrant has submitted electronically and posted on its corporate Website, if any, every Interactive Data File required to be submitted and posted pursuant to Rule 405 of Regulation S-T during the preceding 12 months (or for such shorter period that the registrant was required to submit and post such files). Yes o No o
Indicate by check mark if disclosure of delinquent filers pursuant to Item 405 of Regulation S-K is not contained herein, and will not be contained, to the best of registrant’s knowledge, in definitive proxy or information statements incorporated by reference in Part III of this Form 10-K or any amendment of this Form 10-K. o
Indicate by check mark whether the registrant is a large accelerated filer, an accelerated filer, a non-accelerated filer, or a smaller reporting company. See the definitions of “large accelerated filer,” “accelerated filer,” and “smaller reporting company” in Rule 12b-2 of the Exchange Act:
|
Large accelerated filer o
|
Accelerated filer o
|
Non-accelerated filer o
|
(Do not check here if a smaller reporting company)
|
|
Smaller reporting company þ
|
Indicate by check mark whether the registrant is a shell company (as defined in Rule 12b-2 of the Exchange Act). Yes ¨ No þ
The aggregate market value of the registrant’s common stock, no par value per share, as of June 30, 2010, held by those persons deemed by the registrant to be non-affiliates was approximately $32,245,730 (9,921,763 shares held by non-affiliates at $3.25 per share). For purposes of the foregoing calculation only, all directors, executive officers, and 5% shareholders of the registrant have been deemed affiliates.
As of March 11, 2011 there were 85,491,011 shares outstanding of the registrant’s common stock, no par value.
|
DOCUMENTS INCORPORATED BY REFERENCE
|
|||
|
Document Incorporated
|
Where
|
||
|
1.
|
Portions of the registrant’s Proxy Statement for the Annual Meeting of Shareholders to be held on May 26, 2011
|
Part III
|
|
Annual Report on Form 10-K for the Year Ended December 31, 2010
INDEX
|
PART I
|
Page No.
|
||
|
Item 1.
|
4
|
||
|
Item 1A.
|
15
|
||
|
Item 1B.
|
Unresolved Staff Comments
|
28
|
|
|
Item 2.
|
Properties
|
28
|
|
|
Item 3.
|
Legal Proceedings
|
28
|
|
|
Item 4.
|
(Removed and Reserved)
|
28
|
|
|
PART II
|
|||
|
Item 5.
|
Market for Registrant’s Common Equity, Related Stockholder Matters and Issuer Purchases of Equity Securities
|
28
|
|
|
Item 6.
|
Selected Financial Data
|
30
|
|
|
Item 7.
|
31
|
||
|
Item 7A.
|
Quantitative and Qualitative Disclosures about Market Risk
|
58
|
|
|
Item 8.
|
Financial Statements and Supplementary Data
|
60
|
|
|
60
|
|||
|
61
|
|||
|
62
|
|||
|
63
|
|||
|
65
|
|||
|
99
|
|||
|
Item 9.
|
Changes in and Disagreements with Accountants on Accounting and Financial Disclosure
|
101
|
|
|
Item 9A.
|
101
|
||
|
Item 9A(T).
|
Controls and Procedures
|
103
|
|
|
Item 9B.
|
Other Information
|
103
|
|
|
PART III
|
|||
|
Item 10.
|
Directors, Executive Officers and Corporate Governance
|
103
|
|
|
Item 11.
|
Executive Compensation
|
104
|
|
|
Item 12.
|
Security Ownership of Certain Beneficial Owners and Management, and Related Stockholder Matters
|
104
|
|
|
Item 13.
|
Certain Relationships and Related Transactions, and Director Independence
|
104
|
|
|
Item 14.
|
Principal Accounting Fees and Services
|
104
|
|
|
PART IV
|
|||
|
Item 15.
|
Exhibits and Financial Statement Schedules
|
104
|
|
|
Signatures
|
|||
PART I
Information set forth in this Annual Report on Form 10-K contains various “forward looking statements” within the meaning of Section 27A of the Securities Act of 1933, as amended (the “Securities Act”) and Section 21E of the Securities Exchange Act of 1934, as amended (the “Exchange Act”), which statements represent the Company’s judgment concerning the future and are subject to business, economic and other risks and uncertainties, both known and unknown, that could cause the Company’s actual operating results and financial position to differ materially from the forward looking statements. Such forward looking statements can be identified by the use of forward looking terminology such as “may,” “will,” “expect,” “anticipate,” “estimate,” “believe,” or “continue,” or the negative thereof or other variations thereof or comparable terminology.
Capital Bank Corporation (the “Company”) cautions that any such forward looking statements are further qualified by important factors that could cause the Company’s actual operating results to differ materially from those in the forward looking statements, including without limitation, the management of the Company’s growth, the risks associated with possible or completed acquisitions, the risks associated with the Bank’s loan portfolio, competition within the industry, dependence on key personnel, government regulation and the other risk factors described in Part I- Item 1A. Risk Factors.
Any forward looking statements contained in this Annual Report on Form 10-K are as of the date hereof, and the Company undertakes no duty to update them if views change later. These forward looking statements should not be relied upon as representing the Company’s views as of any date subsequent to the date hereof.
General
Capital Bank Corporation is a bank holding company incorporated under the laws of North Carolina on August 10, 1998. The Company’s primary wholly-owned subsidiary is Capital Bank, a state-chartered banking corporation that was incorporated under the laws of the State of North Carolina on May 30, 1997 and commenced operations on June 20, 1997. The Company also serves as the holding company for CB Trustee, LLC and has interests in three trusts, Capital Bank Statutory Trust I, II and III (hereinafter collectively referred to as the “Trusts”). These Trusts are not consolidated with the financial statements of the Company. CB Trustee, LLC was established to facilitate the administration of deeds of trust relating to real property used as collateral to secure loans made by the Bank and has no assets, liabilities, operational income or expenses. Capital Bank Investment Services, Inc. currently has no operations and is inactive, but remains a subsidiary of the Company.
Capital Bank is a community bank engaged in the general commercial banking business, primarily in markets in central and western North Carolina. As of December 31, 2010, the Company had assets of approximately $1.6 billion, $1.3 billion in loans, $1.3 billion in deposits, and $76.7 million in shareholders’ equity. The Company’s corporate office is located at 333 Fayetteville Street, Suite 700, Raleigh, North Carolina 27601, and its telephone number is (919) 645-6400. The Bank operates 32 branch offices in North Carolina: five branch offices in Raleigh, four in Asheville, four in Fayetteville, three in Burlington, three in Sanford, two in Cary, and one each in Clayton, Graham, Hickory, Holly Springs, Mebane, Morrisville, Oxford, Siler City, Pittsboro, Wake Forest and Zebulon.
The Bank offers a full range of banking services, including the following: checking accounts; savings accounts; NOW accounts; money market accounts; certificates of deposit; individual retirement accounts; loans for real estate, construction, businesses, agriculture, personal use, home improvement and automobiles; equity lines of credit; mortgage loans; credit loans; consumer loans; credit cards; safe deposit boxes; bank money orders; internet banking; electronic funds transfer services including wire transfers and remote deposit capture; traveler’s checks; and free notary services to all Bank customers. In addition, the Bank provides automated teller machine access to its customers for cash withdrawals through nationwide ATM networks. Through a partnership between the Bank’s financial services division and Capital Investment Companies, an unaffiliated Raleigh, North Carolina-based broker-dealer, the Bank also makes available a complete line of uninsured investment products and services. The securities involved in these services are not deposits or other obligations of the Bank and are not insured by the FDIC.
The Trusts were formed for the sole purpose of issuing trust preferred securities. The proceeds from such issuances were loaned to the Company in exchange for subordinated debentures, which are the sole assets of the Trusts. The Company’s obligation under the subordinated debentures constitutes a full and unconditional guarantee by the Company of the Trusts’ obligations under the trust preferred securities. The Trusts have no operations other than those that are incidental to the issuance of the trust preferred securities.
Transaction with North American Financial Holdings, Inc.
On January 28, 2011, the Company completed the issuance and sale to North American Financial Holdings, Inc. (“NAFH”) of 71,000,000 shares of common stock for $181,050,000 in cash (the “Investment”). As a result of the Investment and following the completion of the Company’s rights offering on March 11, 2011, NAFH currently owns approximately 83% of the Company’s common stock. The Company’s shareholders approved the issuance of such shares to NAFH, and an amendment to the Company’s articles of incorporation to increase the authorized shares of common stock to 300,000,000 shares from 50,000,000 shares, at a special meeting of shareholders held on December 16, 2010. In connection with the investment, each existing Company shareholder received one contingent value right per share that entitles the holder to receive up to $0.75 in cash per CVR at the end of a five-year period based on the credit performance of the Bank’s existing loan portfolio.
Also in connection with the investment, pursuant to an agreement among NAFH, the U.S. Treasury Department (“Treasury”), and the Company, the Company’s Series A Preferred Stock and warrant to purchase shares of common stock issued by the Company to the Treasury in connection with the Troubled Asset Relief Program (“TARP”) were repurchased (the “TARP Repurchase”). Following the TARP Repurchase, the Series A Preferred Stock and warrant are no longer outstanding, and accordingly the Company no longer expects to be subject to the restrictions imposed by the terms of the Series A Preferred Stock, or certain regulatory provisions of the Emergency Economic Stabilization Act of 2008 (“EESA”) and the American Recovery and Reinvestment Act of 2009 (“ARRA”) that are imposed on TARP recipients.
Pursuant to the Investment Agreement, shareholders as of January 27, 2011 received non-transferable rights to purchase a number of shares of the Company’s common stock proportional to the number of shares of common stock held by such holders on such date, at a purchase price equal to $2.55 per share, subject to certain limitations (the “Rights Offering”). 1,613,165 shares of the Company’s common stock were issued in exchange for $4,113,570.75 upon completion of the Rights Offering on March 11, 2011.
Upon closing of the investment, R. Eugene Taylor, NAFH’s Chief Executive Officer, Christopher G. Marshall, NAFH’s Chief Financial Officer, and R. Bruce Singletary, NAFH’s Chief Risk Officer, were named as the Company’s CEO, CFO and CRO, respectively, and members of the Company’s Board of Directors. In addition to the aforementioned members of NAFH management, the Company’s Board of Directors was reconstituted with a combination of two existing members (Oscar A. Keller III and Charles F. Atkins) and two additional NAFH-designated members (Peter N. Foss and William A. Hodges).
Lending Activities
The Bank originates a variety of loans, including loans secured by real estate, loans for construction, loans for commercial purposes, loans to individuals for personal and household purposes and loans to municipalities. A significant portion of the loan portfolio is related to real estate. The economic trends in the areas served by the Bank are influenced by the significant industries within the regions. Consistent with the Company’s emphasis on being a community-oriented financial institution, most of its lending activity is with customers located in and around counties in which it has banking offices. The ultimate collectability of the Bank’s loan portfolio is susceptible to changes in the market conditions of these geographic regions.
The Company uses a centralized risk management process to ensure uniform credit underwriting that adheres to its loan policies as approved annually by the Board of Directors. Lending policies are reviewed on a regular basis to confirm that the Company is prudent in setting underwriting criteria. Credit risk is managed through a number of methods including a loan approval process that establishes consistent procedures for the processing and approval of loan requests, risk grading of all commercial loans and certain consumer loans, and coding of all loans by purpose, class and collateral type. The Company also seeks to focus on underwriting loans that enhance a balanced, diversified portfolio. Management analyzes the Bank’s commercial real estate concentrations by market region on a regular basis in an attempt to prevent over-exposure to any one type of commercial real estate loan and incorporates third party real estate and market analysis to monitor market conditions.
The Company believes that early detection of potential credit problems through regular contact with the Bank’s clients, coupled with consistent reviews of the borrowers’ financial condition, are important factors in overall credit risk management. Management has designed an active system for the purpose of identifying problem loans and managing the quality of the portfolio. This system includes a problem loan detection program, which is designed to prioritize potential problem loans at an early stage to enable timely solutions by senior management. Under this program, loans that are projected to be 30 or more days past due at month-end are reviewed on a weekly basis. Additionally, the Bank employs a loan review department that audits a minimum of 25% of commercial loan commitments annually, concentrating on potentially high risk portions of the portfolio, a sample of each consumer loan officer’s loan portfolio and all unsecured commercial loans greater than $500,000. All findings are reported to senior management and the Audit Committee of the Board of Directors. The Bank has recently enhanced its loan review function to include an annual review of all loans in excess of $500,000. Another part of the Company’s approach to proactively managing credit quality is to aggressively work with customers for which a problem loan has been identified to potentially resolve issues before defaults result.
The amounts and types of loans outstanding for the past five years ended December 31 are shown on the following table:
|
2010
|
2009
|
2008
|
2007
|
2006
|
|||||||||||||||||||||||||||
|
(Dollars in thousands)
|
Amount
|
% of
Total
|
Amount
|
% of
Total
|
Amount
|
% of
Total
|
Amount
|
% of
Total
|
Amount
|
% of
Total
|
|||||||||||||||||||||
|
Commercial real estate
|
$
|
806,184
|
64
|
%
|
$
|
892,523
|
64
|
%
|
$
|
803,634
|
64
|
%
|
$
|
708,768
|
65
|
%
|
$
|
638,492
|
64
|
%
|
|||||||||||
|
Consumer real estate
|
262,955
|
21
|
262,503
|
19
|
235,688
|
19
|
196,706
|
18
|
195,853
|
19
|
|||||||||||||||||||||
|
Commercial and industrial
|
145,435
|
12
|
183,733
|
13
|
186,474
|
15
|
169,389
|
15
|
155,673
|
15
|
|||||||||||||||||||||
|
Consumer
|
6,163
|
1
|
9,692
|
1
|
11,215
|
1
|
13,540
|
1
|
12,246
|
1
|
|||||||||||||||||||||
|
Other loans
|
33,742
|
2
|
41,851
|
3
|
17,357
|
1
|
6,704
|
1
|
5,788
|
1
|
|||||||||||||||||||||
|
$
|
1,254,479
|
100
|
%
|
$
|
1,390,302
|
100
|
%
|
$
|
1,254,368
|
100
|
%
|
$
|
1,095,107
|
100
|
%
|
$
|
1,008,052
|
100
|
%
|
||||||||||||
Investing Activities
Investment securities represent a significant portion of the Company’s assets. The Bank invests in securities as allowable under bank regulations. These securities include obligations of the U.S. Treasury, U.S. government agencies, U.S. government-sponsored entities, including mortgage-backed securities, bank eligible obligations of any state or political subdivision, privately-issued mortgage-backed securities, bank eligible corporate obligations, mutual funds and limited types of equity securities.
The Bank’s investment activities are governed internally by a written, Board-approved policy. The investment policy is carried out by the Company’s Risk Committee, which meets regularly to review the economic environment and establish investment strategies. The Risk Committee also has much broader responsibilities, which are discussed under “Management’s Discussion and Analysis of Financial Condition and Results of Operations—Market Risk” contained elsewhere in this report.
Investment strategies are reviewed by the Risk Committee based on the interest rate environment, balance sheet mix, actual and anticipated loan demand, funding opportunities and the overall interest rate sensitivity of the Company. In general, the investment portfolio is managed in a manner appropriate to the attainment of the following goals: (i) to provide a sufficient margin of liquid assets to meet unanticipated deposit and loan fluctuations and overall funds management objectives; (ii) to provide eligible securities to secure public funds and other borrowings; and (iii) to earn the maximum return on funds invested that is commensurate with meeting the requirements of (i) and (ii).
Funding Activities
Deposits are the primary source of funds for lending and investing activities, and their cost is the largest category of interest expense. Scheduled payments, as well as prepayments, and maturities from portfolios of loans and investment securities also provide a stable source of funds. The Company’s funding activities are monitored and governed through the Company’s overall asset/liability management process, which is further discussed under “Management’s Discussion and Analysis of Financial Condition and Results of Operations—Market Risk” contained elsewhere in this report. The Company conducts its funding activities in compliance with all applicable laws and regulations.
Deposits are attracted principally from clients within the Bank’s branch network through the offering of a broad selection of deposit instruments to individuals and businesses, including noninterest-bearing checking accounts, interest-bearing checking accounts, savings accounts, money market deposit accounts, certificates of deposit and individual retirement accounts. Deposit account terms vary with respect to the minimum balance required, the time period the funds must remain on deposit and service charge schedules. Interest rates paid on specific deposit types are determined based on (i) the interest rates offered by competitors, (ii) the anticipated amount and timing of funding needs, (iii) the availability and cost of alternative sources of funding, and (iv) the anticipated future economic conditions and interest rates. Client deposits are attractive sources of funding because of their stability and relative cost. Deposits are regarded as an important part of the overall client relationship and provide opportunities to cross-sell other services. In addition, the Bank gathers a portion of its deposit base through brokered deposits. At December 31, 2010, brokered deposits represented approximately 8% of the Company’s total deposits compared to 5% at December 31, 2009.
The types and mix of deposit accounts for the past five years ended December 31 are shown on the following table:
|
2010
|
2009
|
2008
|
2007
|
2006
|
|||||||||||||||||||||||||||
|
(Dollars in thousands)
|
Amount
|
% of
Total
|
Amount
|
% of
Total
|
Amount
|
% of
Total
|
Amount
|
% of
Total
|
Amount
|
% of
Total
|
|||||||||||||||||||||
|
Demand, noninterest checking
|
$
|
116,113
|
9
|
%
|
$
|
141,069
|
10
|
%
|
$
|
125,281
|
10
|
%
|
$
|
114,780
|
10
|
%
|
$
|
120,945
|
11
|
%
|
|||||||||||
|
NOW accounts
|
185,782
|
14
|
175,084
|
13
|
144,985
|
11
|
119,299
|
11
|
109,692
|
11
|
|||||||||||||||||||||
|
Money market accounts
|
137,422
|
10
|
184,146
|
13
|
212,780
|
16
|
229,560
|
21
|
221,502
|
21
|
|||||||||||||||||||||
|
Savings accounts
|
30,639
|
2
|
28,958
|
2
|
28,726
|
2
|
32,399
|
3
|
35,049
|
3
|
|||||||||||||||||||||
|
Time deposits
|
873,330
|
65
|
848,708
|
62
|
803,542
|
61
|
602,660
|
55
|
568,021
|
54
|
|||||||||||||||||||||
|
$
|
1,343,286
|
100
|
%
|
$
|
1,377,965
|
100
|
%
|
$
|
1,315,314
|
100
|
%
|
$
|
1,098,698
|
100
|
%
|
$
|
1,055,209
|
100
|
%
|
||||||||||||
The Company’s ability to borrow funds from nondeposit sources provides additional flexibility in meeting its liquidity needs. Short-term borrowings include federal funds purchased, securities sold under repurchase agreements, short-term Federal Home Loan Bank (“FHLB”) borrowings, Federal Reserve Bank (“FRB”) discount window borrowings and brokered deposits. The Company also utilizes longer-term borrowings when management determines that the pricing and maturity options available through these sources create cost-effective options for funding asset growth and satisfying capital needs. The Company’s long-term borrowings include long-term FHLB advances, structured repurchase agreements and subordinated debt.
Market Area and Competition
Capital Bank’s primary markets are in central and western North Carolina. The Bank’s Triangle market includes operations in Wake, Johnston and Granville counties. The Triangle, which includes Raleigh, North Carolina’s capital, as well as Chapel Hill, Durham and Research Triangle Park, has a well-diversified economic base with a mixture of businesses, universities, and large medical institutions. The Bank’s Sandhills market includes operations in Cumberland, Lee and Chatham counties. The Sandhills market, which includes the city of Fayetteville, has a large military community and is home to Fort Bragg, the largest global Army installation with 10% of the Army’s active forces. Fayetteville and the surrounding Sandhills market have in recent years experienced significant growth due to the 2005 Base Realignment and Closure process (“BRAC”). Lee and Chatham counties are also significant centers for various industries, including agriculture, manufacturing, lumber and tobacco. The Bank’s Triad market includes operations in Alamance County, which has a diversified economic base, comprised primarily of manufacturing, agriculture, retail and wholesale trade, government, services and utilities. The Bank’s Western market includes operations in Buncombe and Catawba counties. Catawba County, which includes the town of Hickory, is a regional center for manufacturing and wholesale trade. The economic base of the city of Asheville, in Buncombe County, is comprised primarily of services, health care, tourism and manufacturing.
Local economic conditions in the markets that the Bank serves affect the Bank’s results of operations and, as a result, the Company’s results of operations. The following tables present certain important economic indicators at the latest date available for regions in which the Bank has branches:
Unemployment Rate:
|
Region
|
12/08
|
12/09
|
12/10
|
% Change
2008–2010
|
% Change
2009–2010
|
||
|
United States
|
7.1%
|
9.7%
|
9.1%
|
28.2%
|
-6.2%
|
||
|
North Carolina
|
8.2%
|
11.1%
|
9.7%
|
18.3%
|
-12.6%
|
||
|
Triangle:
|
|||||||
|
Raleigh/Cary MSA
|
6.2%
|
9.0%
|
7.8%
|
25.8%
|
-13.3%
|
||
|
Sandhills:
|
|||||||
|
Fayetteville MSA
|
7.2%
|
9.3%
|
9.0%
|
25.0%
|
-3.2%
|
||
|
Triad:
|
|||||||
|
Burlington MSA
|
8.8%
|
12.5%
|
10.1%
|
14.8%
|
-19.2%
|
||
|
Western:
|
|||||||
|
Asheville MSA
|
6.4%
|
9.0%
|
7.9%
|
23.4%
|
-12.2%
|
||
|
Hickory/Lenoir/Morganton MSA
|
10.2%
|
14.9%
|
12.4%
|
21.6%
|
-16.8%
|
||
|
Source: North Carolina Employment Security Commission (NC ESC)
|
|||||||
Median Household Income:
|
Region
|
2009
|
||
|
United States (1)
|
$49,777
|
||
|
North Carolina (2)
|
$60,434
|
||
|
Triangle:
|
|||
|
Granville County (2)
|
$50,698
|
||
|
Johnston County (2)
|
$54,089
|
||
|
Wake County (2)
|
$75,682
|
||
|
Sandhills:
|
|||
|
Chatham County (2)
|
$54,654
|
||
|
Cumberland County (2)
|
$50,583
|
||
|
Lee County (2)
|
$49,375
|
||
|
Triad:
|
|||
|
Alamance County (2)
|
$50,579
|
||
|
Western:
|
|||
|
Buncombe County (2)
|
$47,450
|
||
|
Catawba County (2)
|
$51,200
|
Bankruptcy Filings(3)(4) (Business and Individual):
|
Region
|
2009
|
2010
|
% Change
|
||
|
United States
|
1,402,816
|
1,593,081
|
8.1%
|
||
|
North Carolina
|
27,740
|
26,674
|
-3.8%
|
||
|
North Carolina – Eastern District
|
11,702
|
10,760
|
-8.0%
|
||
|
North Carolina – Middle District
|
7,520
|
7,160
|
-4.8%
|
||
|
North Carolina – Western District
|
8,518
|
8,754
|
2.8%
|
|
(1)
|
Source: Report, “Income, Poverty, and Health Insurance Coverage in the United States: 2009”. Released by the US Census Bureau/US Dept. of Commerce-Economics and Statistics Administration, September 2010.
|
|
|
(2)
|
Source: NC Dept. of Commerce, Economic Development Intelligence System (EDIS)
|
|
|
(3)
|
Source: United States Courts
|
|
|
(4)
|
Bankruptcy data is for the 12-month period ended December 31, 2010 and 2009.
|
Commercial banking in North Carolina is extremely competitive. The Company competes in its market areas with some of the largest banking organizations in the state and the country, other community financial institutions, such as federally and state-chartered savings and loan institutions and credit unions, as well as consumer finance companies, mortgage companies and other lenders engaged in the business of extending credit. Many of the Company’s competitors have broader geographic markets, easier access to capital and lower cost funding, and higher lending limits than the Company; and are also able to provide more services and make greater use of media advertising.
Despite the competition in its market areas, the Company believes that it has certain competitive advantages that distinguish it from its competition. The Company believes that its primary competitive advantages are its strong local identity and affiliation with the communities it serves, and its emphasis on providing specialized services to small- and medium-sized business enterprises, professionals and upper-income individuals. The Bank offers customers modern, high-tech banking without compromising community values such as prompt, personal service and friendliness. The Bank offers many personalized services and attracts customers by being responsive and sensitive to their individualized needs. The Company relies on goodwill and referrals from shareholders and satisfied customers, as well as traditional media to attract new customers. To enhance a positive image in the communities in which it has branches, the Bank supports and participates in local events and its officers and directors serve on boards of local civic and charitable organizations.
Employees
As of December 31, 2010, the Company employed 406 persons, of which 389 were full-time and 17 were part-time. None of the Company’s employees are represented by a collective bargaining unit or agreement. The Company considers relations with its employees to be good.
Supervision and Regulation
Holding companies, banks and many of their non-bank affiliates are extensively regulated under both federal and state law. The following is a brief summary of certain statutes, rules and regulations affecting the Company and the Bank. This summary is qualified in its entirety by reference to the particular statutory and regulatory provisions referred to below and is not intended to be an exhaustive description of the statutes or regulations applicable to the Company’s or the Bank’s business. Supervision, regulation and examination of the Company and the Bank by bank regulatory agencies is intended primarily for the protection of the Bank’s depositors rather than holders of the Company’s common stock.
On October 28, 2010, the Bank entered into an informal Memorandum of Understanding with the FDIC and the NC Commissioner. In accordance with the terms of the MOU, the Bank has agreed to, among other things, (i) increase regulatory capital to achieve and maintain a minimum Tier 1 leverage capital ratio of at least 8% and a total risk-based capital ratio of at least 12%, (ii) monitor and reduce its commercial real estate concentration, (iii) timely identify and reduce its overall level of problem loans, (iv) establish and maintain an adequate allowance for loan losses, and (v) ensure adherence to loan policy guidelines. In addition, the Bank must obtain regulatory approval prior to paying any dividends to the Company. The MOU will remain in effect until modified, terminated, lifted, suspended or set aside by the regulatory authorities. In addition, the Company consults with the Federal Reserve Bank of Richmond prior to payment of any dividends or interest on debt.
The Company is also regulated by the SEC as a result of its publicly traded common stock. The regulatory compliance burden of being a publicly traded company has increased significantly over the last decade.
Holding Company Regulation
General
The Company is a bank holding company registered with the Federal Reserve under the Bank Holding Company Act of 1956 (the “BHCA”). As such, the Company and the Bank are subject to the supervision, examination and reporting requirements contained in the BHCA and the regulation of the Federal Reserve. The BHCA requires that a bank holding company obtain the prior approval of the Federal Reserve before: (i) acquiring direct or indirect ownership or control of more than five percent of the voting shares of any bank; (ii) taking any action that causes a bank to become a subsidiary of a bank holding company; (iii) acquiring all or substantially all of the assets of any bank; or (iv) merging or consolidating with any other bank holding company.
The BHCA generally prohibits a bank holding company and its subsidiaries, with certain exceptions, from engaging in or acquiring or retaining direct or indirect control of any company engaged in (i) activities other than banking or managing or controlling banks or other permissible subsidiaries, or (ii) those activities not determined by the Federal Reserve to be closely related to banking, or managing or controlling banks. In determining whether a particular activity is permissible, the Federal Reserve must consider whether the performance of such an activity can reasonably be expected to produce benefits to the public, such as greater convenience, increased competition or gains in efficiency, that outweigh possible adverse effects, such as undue concentration of resources, decreased or unfair competition, conflicts of interest or unsound banking practices. For example, extending credit and servicing loans, leasing real or personal property, providing securities brokerage services, providing certain data processing services, acting as agent or broker in selling credit life insurance and certain other types of insurance underwriting activities have all been determined by regulations of the Federal Reserve to be permissible non-bank activities.
The Federal Reserve has the power to order a bank holding company or its subsidiaries to terminate any activity or to terminate its ownership or control of any subsidiary when it believes that continuation of such activity or such ownership or control constitutes a serious risk to the financial safety, soundness or stability of any bank subsidiary of that bank holding company.
Additional Restrictions and Oversight
Subsidiary banks of a bank holding company are subject to certain restrictions imposed by the Federal Reserve on any extensions of credit to the bank holding company or any of its subsidiaries, investments in the stock or securities of the bank holding company and the acceptance of such stock or securities as collateral for loans to any borrower. A bank holding company and its subsidiaries are also prevented from engaging in certain tie-in arrangements in connection with any extension of credit, lease or sale of property or furnishing of services. An example of a prohibited tie-in would be any arrangement that would condition the provision or cost of services on a customer obtaining additional services from the bank holding company or any of its other subsidiaries.
The Federal Reserve may issue cease and desist orders against bank holding companies and non-bank subsidiaries to stop actions believed to present a serious threat to a subsidiary bank. The Federal Reserve regulates certain debt obligations, changes in control of bank holding companies and capital requirements.
Under the provisions of North Carolina law, the Bank is registered with and subject to supervision by the North Carolina Office of the Commissioner of Banks.
Capital Requirements
The Federal Reserve has established risk-based capital guidelines for bank holding companies. The minimum standard for the ratio of capital to risk-weighted assets (including certain off-balance-sheet obligations, such as standby letters of credit) is eight percent, of which at least four percent must consist of common equity, retained earnings, and a limited amount of perpetual preferred stock and minority interests in the equity accounts of consolidated subsidiaries, less certain goodwill items and other adjustments (“Tier 1 capital”). The remainder (“Tier 2 capital”) may consist of mandatorily redeemable convertible debt securities, a limited amount of other preferred stock, subordinated debt and loan loss reserves.
In addition, the Federal Reserve has established minimum leverage ratio guidelines for bank holding companies. These guidelines provide for a minimum leverage ratio of Tier 1 capital to adjusted average quarterly assets less certain amounts (“Leverage Ratio”) equal to three percent for bank holding companies that meet certain specified criteria, including having the highest regulatory rating. All other bank holding companies will generally be required to maintain a Leverage Ratio of at least four percent.
The guidelines provide that bank holding companies experiencing significant growth, whether through internal expansion or acquisitions, will be expected to maintain strong capital ratios well above the minimum supervisory levels without significant reliance on intangible assets. The same heightened requirements apply to bank holding companies with supervisory, financial, operational or managerial weaknesses, as well as to other banking institutions if warranted by particular circumstances or the institution’s risk profile. Furthermore, the guidelines indicate that the Federal Reserve will continue to consider a “tangible Tier 1 Leverage Ratio” (deducting all intangibles) in evaluating proposals for expansion or new activity. The Federal Reserve has not advised the Company of any specific minimum Leverage Ratio or tangible Tier 1 Leverage Ratio applicable to it.
As of December 31, 2010, the Company had Tier 1 risk-adjusted, total regulatory capital and leverage capital of approximately 8.07%, 9.59% and 6.45%, respectively. Those same ratios as of December 31, 2009 were 10.16%, 11.41% and 8.94%, respectively.
Anti-Money Laundering and the USA PATRIOT Act
The United and Strengthening of America by Providing Appropriate Tools Required to Intercept and Obstruct Terrorism Act of 2001 (the “USA PATRIOT Act”) contains anti-money laundering provisions that impose affirmative obligations on a broad range of financial institutions, including banks, brokers and dealers. Among other requirements, the USA PATRIOT Act requires all financial institutions to establish anti-money laundering programs that include, at a minimum, internal policies, procedures and controls; specific designation of an anti-money laundering compliance officer; ongoing employee training programs; and an independent audit function to test the anti-money laundering program. The USA Patriot Act requires financial institutions that establish, maintain, administer or manage private banking accounts for non-United States persons or their representatives to establish appropriate, specific, and where necessary, enhanced due diligence policies, procedures and controls designed to detect and report money laundering. The Company has established policies and procedures that the Company believes will comply with the requirements of the USA PATRIOT Act.
Emergency Economic Stabilization Act of 2008
In response to recent unprecedented market turmoil, the Emergency Economic Stabilization Act of 2008 was enacted on October 3, 2008. EESA authorized the Treasury to purchase or guarantee up to $700 billion in troubled assets from financial institutions under the Troubled Asset Relief Program. Pursuant to authority granted under EESA, the Treasury created the TARP Capital Purchase Program under which the Treasury was authorized to invest up to $250 billion in senior preferred stock of U.S. banks and savings associations or their holding companies.
Institutions participating in the TARP or CPP were required to issue warrants for common or preferred stock or senior debt to the Treasury. If an institution participates in the CPP or if the Treasury acquires a meaningful equity or debt position in the institution as a result of TARP participation, the institution is required to meet certain standards for executive compensation and corporate governance, including a prohibition against incentives to take unnecessary and excessive risks, recovery of bonuses paid to senior executives based on materially inaccurate earnings or other statements and a prohibition against agreements for the payment of golden parachutes. Following the TARP Repurchase, we do not expect these additional standards to be applicable to the Company.
American Recovery and Reinvestment Act of 2009
ARRA was enacted on February 17, 2009 and includes a wide variety of programs intended to stimulate the economy and provide for extensive infrastructure, energy, health and education needs. In addition, ARRA imposes certain executive compensation and corporate governance obligations on all current and future TARP recipients, including the Company, until the institution has redeemed the preferred stock, which TARP recipients are now permitted to do under ARRA without regard to the three year holding period and without the need to raise new capital, subject to approval of its primary federal regulator.
Additionally, ARRA amends Section 111 of EESA to require the Treasury to adopt additional standards with respect to executive compensation and corporate governance for TARP recipients, which are set forth in the TARP Standards for Compensation and Corporate Governance: Interim Final Rule (“Interim Final Rule”), adopted by the Treasury on June 15, 2009. Following the TARP Repurchase, we do not expect these additional standards to be applicable to the Company.
Dodd-Frank Wall Street Reform and Consumer Protection Act
On July 21, 2010, President Obama signed into law the Dodd-Frank Act, which was intended primarily to overhaul the financial regulatory framework following the global financial crisis and will impact all financial institutions including the Company and the Bank. The Dodd-Frank Act contains provisions that will, among other things, establish a Bureau of Consumer Financial Protection, establish a systemic risk regulator, consolidate certain federal bank regulators and impose increased corporate governance and executive compensation requirements. The Dodd-Frank Act requires various federal agencies to adopt a broad range of new implementing rules and regulations and to prepare numerous studies and reports for the U.S. Congress. The federal agencies are given significant discretion in drafting the implementing rules and regulations, and consequently, many of the details and much of the impact of the Dodd-Frank Act are not yet known.
Bank Regulation
General
The Bank is subject to numerous state and federal statues and regulations that affect its business, activities and operations, and is supervised and examined by the NC Commissioner and the FDIC. The FDIC and the NC Commissioner regularly examine the operations of banks over which they exercise jurisdiction. They have the authority to approve or disapprove the establishment of branches, mergers, consolidations and other similar corporate actions. They also have authority to prevent the continuance or development of unsafe or unsound banking practices and other violations of law. The FDIC and the NC Commissioner regulate and monitor all areas of the operations of banks and their subsidiaries, including loans, mortgages, the issuance of securities, capital adequacy, loss reserves and compliance with the Community Reinvestment Act of 1977 (“CRA”) as well as other laws and regulations. Interest and certain other charges collected and contracted for by banks are also subject to state usury laws and certain federal laws concerning interest rates.
Deposit Insurance
The deposit accounts of the Bank are insured by the Deposit Insurance Fund (the “DIF”) of the FDIC. Pursuant to EESA and ARRA, the maximum deposit insurance amount per depositor was temporarily increased from $100,000 to $250,000. The Dodd-Frank Act permanently increased the maximum amount of deposit insurance for banks, savings institutions and credit unions to $250,000 per depositor, retroactive to January 1, 2009. The Dodd-Frank Act also provides unlimited deposit insurance for non-interest bearing transaction accounts through December 31, 2013.
The FDIC issues regulations and conducts periodic examinations, requires the filing of reports and generally supervises the operations of its insured banks. This supervision and regulation is intended primarily for the protection of depositors. Any insured bank that is not operated in accordance with or does not conform to FDIC regulations, policies and directives may be sanctioned for noncompliance. Civil and criminal proceedings may be instituted against any insured bank or any director, officer or employee of such bank for the violation of applicable laws and regulations, breaches of fiduciary duties or engaging in any unsafe or unsound practice. The FDIC has the authority to terminate insurance of accounts pursuant to procedures established for that purpose.
The Bank is subject to insurance assessments imposed by the FDIC. The FDIC imposes a risk-based deposit premium assessment system, which was amended pursuant to the Federal Deposit Insurance Reform Act of 2005. Under this system, as amended, the assessment rates for an insured depository institution vary according to the level of risk incurred in its activities. To arrive at an assessment rate for a banking institution, the FDIC places it in one of four risk categories determined by reference to its capital levels and supervisory ratings. In addition, in the case of those institutions in the lowest risk category, the FDIC further determines its assessment rate based on certain specified financial ratios or, if applicable, its long-term debt ratings.
Recently, the FDIC has been actively seeking to replenish the DIF. The FDIC increased risk-based assessment rates uniformly by seven basis points, on an annual basis, beginning in the first quarter of 2009. On May 22, 2009, the FDIC adopted a final rule imposing a five basis point special assessment on each insured depository institution’s qualifying assets less Tier 1 capital as of June 30, 2009. The FDIC collected this special assessment on September 30, 2009. On November 12, 2009, the FDIC adopted a final rule that required insured financial institutions to prepay their estimated quarterly risk-based assessments for the fourth quarter of 2009 and for the following three years. Such prepaid assessments were collected on December 30, 2009 at a rate based on the insured institution’s modified third quarter 2009 assessment rate. The Company’s prepaid assessment was $7.3 million. Under the Dodd-Frank Act, the minimum designated reserve ratio of the DIF increased from 1.15 percent to 1.35 percent of estimated insured deposits. Additionally, the Dodd-Frank Act revised the assessment base against which an insured depository institution’s deposit insurance premiums paid to the DIF will be calculated. Under the FDIC’s proposed rules, the assessment base will change from adjusted domestic deposits to average consolidated total assets minus average tangible equity.
Dividends and Capital Requirements
Under North Carolina corporation laws, the Company may not pay a dividend or distribution, if after giving it effect, the Company would not be able to pay its debts as they become due in the usual course of business or the Company’s total assets would be less than its liabilities. In general, the Company’s ability to pay cash dividends is dependent upon the amount of dividends paid to the Company by the Bank. The ability of the Bank to pay dividends to the Company is subject to statutory and regulatory restrictions on the payment of cash dividends, including the requirement under the North Carolina banking laws that cash dividends be paid only out of undivided profits and only if the Bank has surplus of a specified level. During 2009, the Office of the Commissioner of Banks authorized a one-time transfer of funds from the Bank’s permanent surplus account to undivided profits for the purpose of paying dividends to the Company.
Like the Company, the Bank is required by federal regulations to maintain certain minimum capital levels. The levels required of the Bank are the same as required for the Company. As of December 31, 2010, the Bank had Tier 1 risk-adjusted, total regulatory capital and leverage capital of approximately 7.97%, 9.50% and 6.37%, respectively. Those same ratios as of December 31, 2009 were 7.42%, 8.68% and 6.52%, respectively. The Bank’s regulatory capital ratios as of December 31, 2009 were revised after its Call Reports were restated and amended in 2010 to reflect an adjustment to the regulatory capital treatment of the injection of proceeds from the sale of Series A Preferred Stock from the Company into the Bank in 2008.
Federal Deposit Insurance Corporation Improvement Act of 1991
The Federal Deposit Insurance Corporation Improvement Act of 1991 (“FDICIA”) provides for, among other things, (i) publicly available annual financial condition and management reports for certain financial institutions, including audits by independent accountants, (ii) the establishment of uniform accounting standards by federal banking agencies, (iii) the establishment of a “prompt corrective action” system of regulatory supervision and intervention, based on capitalization levels, with greater scrutiny and restrictions placed on depository institutions with lower levels of capital, (iv) additional grounds for the appointment of a conservator or receiver, and (v) restrictions or prohibitions on accepting brokered deposits, except for institutions which significantly exceed minimum capital requirements. FDICIA also provides for increased funding of the FDIC insurance funds and the implementation of risk-based premiums.
A central feature of FDICIA is the requirement that the federal banking agencies take “prompt corrective action” with respect to depository institutions that do not meet minimum capital requirements. Pursuant to FDICIA, the federal bank regulatory authorities have adopted regulations setting forth a five-tiered system for measuring the capital adequacy of the depository institutions that they supervise. Under these regulations, a depository institution is classified in one of the following capital categories: “well capitalized,” “adequately capitalized,” “undercapitalized,” “significantly undercapitalized” and “critically undercapitalized.” An institution may be deemed by the regulators to be in a capitalization category that is lower than is indicated by its actual capital position if, among other things, it receives an unsatisfactory examination rating with respect to asset quality, management, earnings or liquidity. FDICIA provides the federal banking agencies with significantly expanded powers to take enforcement action against institutions which fail to comply with capital or other standards. Such action may include the termination of deposit insurance by the FDIC or the appointment of a receiver or conservator for the institution.
Community Reinvestment Act of 1977
Banks are also subject to the CRA, which requires the appropriate federal bank regulatory agency, in connection with its examination of a bank, to assess such bank’s record in meeting the credit needs of the community served by that bank, including low- and moderate-income neighborhoods. Each institution is assigned one of the following four ratings of its record in meeting community credit needs: “outstanding,” “satisfactory,” “needs to improve” or “substantial noncompliance.” The regulatory agency’s assessment of the bank’s record is made available to the public. Further, such assessment is required of any bank which has applied to (i) charter a national bank, (ii) obtain deposit insurance coverage for a newly chartered institution, (iii) establish a new branch office that will accept deposits, (iv) relocate an office, or (v) merge or consolidate with, or acquire the assets or assume the liabilities of, a federally regulated financial institution. In the case of a bank holding company applying for approval to acquire a bank or other bank holding company, the Federal Reserve will assess the record of each subsidiary bank of the applicant bank holding company, and such records may be the basis for denying the application.
The Gramm-Leach-Bliley Modernization Act of 1999’s “CRA Sunshine Requirements” call for financial institutions to publicly disclose certain written agreements made in fulfillment of the CRA. Banks that are parties to such agreements must report to federal regulators the amount and use of any funds expended under such agreements on an annual basis, along with such other information as regulators may require.
Monetary Policy and Economic Controls
The Company and the Bank are directly affected by governmental policies and regulatory measures affecting the banking industry in general. Of primary importance is the Federal Reserve, whose actions directly affect the money supply which, in turn, affects banks’ lending abilities by increasing or decreasing the cost and availability of funds to banks. The Federal Reserve regulates the availability of bank credit in order to combat recession and curb inflationary pressures in the economy by open market operations in United States government securities, changes in the discount rate on member bank borrowings, changes in reserve requirements against bank deposits, and limitations on interest rates that banks may pay on time and savings deposits.
Deregulation of interest rates paid by banks on deposits and the types of deposits that may be offered by banks has eliminated minimum balance requirements and rate ceilings on various types of time deposit accounts. The effect of these specific actions and, in general, the deregulation of deposit interest rates has generally increased banks’ cost of funds and made them more sensitive to fluctuations in money market rates. In view of the changing conditions in the national economy and money markets, as well as the effect of actions by monetary and fiscal authorities, no prediction can be made as to possible future changes in interest rates, deposit levels, loan demand, or the business and earnings of the Bank or the Company. As a result, banks, including the Bank, face a significant challenge to maintain acceptable net interest margins.
Directors and Executive Officers
Set forth below is information concerning our directors and executive officers. The members of our Board of Directors are elected by the shareholders, and NAFH holds approximately 83% of the voting power for election of directors. So long as our Board of Directors consists of less than nine members, it will not be divided into separate classes and each member will be elected by our shareholders annually for a one-year term. Each director and executive officer will hold office until his death, resignation, retirement, removal, disqualification, or until his successor is elected (or appointed) and qualified. All ages below are as of March 11, 2011.
|
Name
|
Position
|
||
|
R. Eugene Taylor
|
President, Chief Executive Officer and Chairman of the Board
|
||
|
Christopher G. Marshall
|
Executive Vice President, Chief Financial Officer and Director
|
||
|
R. Bruce Singletary
|
Executive Vice President, Chief Risk Officer and Director
|
||
|
Charles F. Atkins
|
Director
|
||
|
Peter N. Foss
|
Director
|
||
|
William A. Hodges
|
Director
|
||
|
Oscar A. Keller III
|
Director
|
R. Eugene Taylor. Mr. Taylor, who is 63, is the Chairman and Chief Executive Officer of NAFH. Mr. Taylor assumed the title of Chief Executive Officer of Capital Bank Corporation and Capital Bank and was appointed Chairman of the Board of Directors of Capital Bank Corporation and Capital Bank on January 28, 2011 upon NAFH’s designation pursuant to the Investment Agreement. Prior to founding NAFH in 2009, Mr. Taylor served as an advisor to Fortress Investment Group, a global investment management firm. Prior to his role at Fortress, Mr. Taylor worked at Bank of America where he served in leadership positions across the United States. In 2001, he was named President of Bank of America Consumer & Commercial Banking, and in 2005, he became President of Global Corporate & Investment Banking and was named Vice Chairman of the corporation. He also served on Bank of America’s Risk & Capital and Management Operating Committees. Mr. Taylor is the Chairman of the board of directors of TIB Financial Corp., a bank holding company in which NAFH has a majority interest. Mr. Taylor is a Florida native and received his Bachelor of Science in Finance from Florida State University.
Mr. Taylor is expected to bring to our Board of Directors valuable and extensive experience from managing and overseeing a broad range of operations during his tenure at Bank of America. His experience in leadership roles and activities in the Southeast qualify him to serve as the Chairman of our Board of Directors.
Christopher G. Marshall. Mr. Marshall, who is 51, is the Chief Financial Officer of NAFH. Mr. Marshall was appointed as a director on our Board of Directors and the board of directors of Capital Bank and as our Chief Financial Officer on January 28, 2011 upon NAFH’s designation pursuant to the Investment Agreement. Mr. Marshall served as a Senior Advisor to the Chief Executive Officer and Chief Restructuring Officer of GMAC (Ally Bank) and as an advisor to the Blackstone Group, an investment and advisory firm. From 2006 through 2008, Mr. Marshall served as the CFO of Fifth Third Bancorp. Mr. Marshall served as Chief Operations Executive of Bank of America’s Global Consumer and Small Business Bank from 2004 to 2006 after holding various positions throughout Bank of America beginning in 2001. Prior to joining Bank of America, Mr. Marshall served as CFO and COO of Honeywell Global Business Services from 1999 to 2001. From 1995 to 1999, he served as CFO of AlliedSignal Technical Services Corporation. Prior to that, he held several managerial positions at TRW, Inc. from 1987 to 1995. Mr. Marshall is a director of TIB Financial Corp., a bank holding company in which NAFH has a majority interest. Mr. Marshall earned a Bachelor of Science degree in Business Administration from the University of Florida and obtained a Master of Business Administration degree from Pepperdine University.
Mr. Marshall is expected to bring to our Board of Directors extensive experience from service in leadership positions, including his tenure as Chief Financial Officer of Fifth Third Bancorp, and in other operating roles at both financial and non-financial companies.
R. Bruce Singletary. Mr. Singletary, who is 60, is the Chief Risk Officer of NAFH. Mr. Singletary was appointed as a director on our Board of Directors and the board of directors of Capital Bank, and as Chief Risk Officer of both the Company and of Capital Bank on January 28, 2011 upon NAFH’s designation pursuant to the Investment Agreement. Prior to joining NAFH, he spent 31 years at Bank of America and its predecessor companies with the last 19 years in various credit risk roles. Mr. Singletary originally joined C&S National Bank as a credit analyst in Atlanta, Georgia. In 1991, Mr. Singletary was named Senior Credit Policy Executive of C&S Sovran, which was renamed NationsBank in January 1992, for the geographic areas of Maryland, Virginia and the District of Columbia. Mr. Singletary led the credit function of NationsBank from 1990 to 1998. In 1998, Mr. Singletary relocated to Florida to establish a centralized underwriting function to serve middle market commercial clients in the Southeast. In 2000, Mr. Singletary assumed credit responsibility for Bank of America’s middle market leveraged finance portfolio for the eastern half of the United States. In 2004, Mr. Singletary served as Senior Risk Manager for commercial banking for Bank of America’s Florida Bank. Mr. Singletary is a director of TIB Financial Corp., a bank holding company in which NAFH has a majority interest. Mr. Singletary earned a Bachelor of Science degree in Industrial Management from Clemson University and obtained a Masters of Business Administration degree from Georgia State University.
Mr. Singletary has substantial experience in the banking sector and brings a perspective reflecting many years of overseeing credit analysis at complex financial institutions, which qualify him to serve as a director.
Charles F. Atkins. Mr. Atkins, who is 61, has served as a director of Capital Bank since its inception in 1997 and was elected to serve as a director of the Company in 2003. He is currently, and has been for the past 21 years, President of Cam-L Properties, Inc., a commercial real estate development company located in Sanford, North Carolina.
Mr. Atkins has substantial experience with community banking, as he was an organizer of Capital Bank, and in his position with a real estate development company has developed an extensive understanding of certain real estate markets in which the Bank makes loans. During his tenure with the Company, he has obtained knowledge of the Company’s business, history and organization, which has enhanced his ability to serve as director.
Peter N. Foss. Mr. Foss, who is 67, serves on the Board of Directors of NAFH. Mr. Foss was appointed as a director on our Board of Directors on January 28, 2011 upon NAFH’s designation pursuant to the Investment Agreement. Peter Foss has been President of the General Electric Olympic Sponsorship and Corporate Accounts since 2003. In addition, Mr. Foss has served as General Manager for Enterprise Selling, with additional responsibilities for Sales Force Effectiveness and Corporate Sales Programs. He has been with GE for 29 years, and prior to this assignment, served for six years as the President of GE Polymerland, a commercial organization representing GE Plastics in the global marketplace. Prior to Polymerland, Mr. Foss served in various commercial roles in the company, including introducing LEXAN ® film in the 1970s and was the Market Development Manager on the ULTEM ® introduction team in 1982. He has also served as the Regional General Manager for four of the GE Plastics regions including leading the GE Plastics effort in Mexico in the mid 1990s. Mr. Foss is a director of TIB Financial Corp., a bank holding company in which NAFH has a majority interest. Mr. Foss earned a Bachelor of Science degree in Chemistry from Massachusetts College of Pharmacy, Boston.
Mr. Foss has gained extensive experience in managing and executing complex projects and has overseen large-scale sales efforts in his prior positions, as set forth above. This background gives him valuable perspective on operating concerns relevant to our business.
William A. Hodges. Mr. Hodges, who is 62, is a member of the Board of Directors of NAFH. Mr. Hodges was appointed as a director on our Board of Directors on January 28, 2011 upon NAFH’s designation pursuant to the Investment Agreement. Mr. Hodges has been President and Owner of LKW Development LLC, a Charlotte-based residential land developer and homebuilder, since 2005. Prior to that, Mr. Hodges worked for ten years in various functions at Bank of America. From 2004 to 2005, he served as Chairman of Bank of America’s Capital Commitment Committee. Mr. Hodges served as Managing Director and Head of Debt Capital Markets from 1998 to 2004 and as Managing Director and Head of the Real Estate Finance Group from 1996 to 1998. Prior to the Bank of America acquisition, he served as Market President and Head of Mid-Atlantic Commercial Banking for NationsBank from 1992 to 1996. Mr. Hodges began his career at North Carolina National Bank (NCNB), where he worked for twenty years in various roles, including Chief Credit Officer of Florida operations and as a manager in the Real Estate Banking and Special Assets Groups. Mr. Hodges is a director of TIB Financial Corp., a bank holding company in which NAFH has a majority interest. Mr. Hodges earned a bachelor’s degree in history from the University of North Carolina at Chapel Hill and a master’s degree in finance from Georgia State University.
Mr. Hodges’ substantial experience in the banking and real estate sectors allows him to bring to the board a valuable perspective on matters that are of key importance to the discussions regarding the financial and other risks faced by the Company.
Oscar A. Keller III. Mr. Keller, who is 66, has served as a director of Capital Bank since its inception in 1997 and as a director of the Company since its inception, and as Chairman of the Board of Directors of the Company from the Company’s inception through the closing of the Investment. Mr. Keller was also a founding director of Triangle Bank from 1988 to 1998, and served on its executive committee and audit committee. Furthermore, he served as a director of Triangle Leasing Corp. from 1989 to 1992. He is currently, and has been for the past 15 years, Chief Executive Officer of Earthtec of NC, Inc., an environmental treatment facility in Sanford, North Carolina. He also serves as a director of Capital Bank Foundation, Inc. Mr. Keller is also currently the Chairman of the Sanford Lee County Regional Airport Authority (Raleigh Executive Jet Port), Vice Chairman of Lee County Economic Development Corp. and a member of Triangle Regional Partnership Staying on Top 2 committee.
During his term as Chairman of the Board of Directors, Mr. Keller has had the opportunity to develop extensive knowledge of the Company’s business, history and organization which, along with his personal experience in markets that the Bank serves, has supplemented his ability to effectively contribute to the Board. Mr. Keller is a founder of the Bank and a well regarded community leader in Sanford, North Carolina.
Website Access to Capital Bank Corporation’s Filings with the Securities and Exchange Commission
All of the Company’s electronic filings with the SEC, including the Annual Report on Form 10-K, Quarterly Reports on Form 10-Q, Current Reports on Form 8-K and amendments to these reports filed or furnished pursuant to Section 13(a) or 15(d) of the Securities Exchange Act of 1934, as amended (the “Exchange Act”), have been made available at no cost on the Company’s web site, www.capitalbank-us.com, as soon as reasonably practicable after the Company has filed such material with, or furnished it to, the SEC. The Company’s SEC filings are also available through the SEC’s web site at www.sec.gov. In addition, any reports the Company files with the SEC are available at the SEC’s Public Reference Room at 100 F Street, N.E., Washington, DC 20549. Information may be obtained about the Public Reference Room by calling the SEC at 1-800-SEC-0330.
Risks Related to Our Business
U.S. and international credit markets and economic conditions could adversely affect our liquidity, financial condition and profitability.
Global market and economic conditions continue to be disruptive and volatile and the disruption has particularly had a negative impact on the financial sector. The capital and credit markets have placed downward pressure on stock prices, and the availability of capital, credit and liquidity has been adversely affected for many issuers, in some cases, without regard to those issuers’ underlying financial condition or performance. Although we have not suffered any significant liquidity problems as a result of these recent events, the cost and availability of funds may be adversely affected by illiquid credit markets. Continued turbulence in U.S. and international markets and economies may also adversely affect our liquidity, financial condition and profitability.
Legislative and regulatory actions taken now or in the future to address the current liquidity and credit crisis in the financial industry may significantly affect our liquidity or financial condition.
The Federal Reserve, U.S. Congress, the Treasury, the FDIC and others have taken numerous actions to address the current liquidity and credit situation in the financial markets. These measures include actions to encourage loan restructuring and modification for homeowners; the establishment of significant liquidity and credit facilities for financial institutions and investment banks; and coordinated efforts to address liquidity and other weaknesses in the banking sector. The EESA, which established TARP, was enacted on October 3, 2008. As part of TARP, the Treasury created the Capital Purchase Program (“CPP”), which authorized the Treasury to invest up to $250 billion in senior preferred stock of U.S. banks and savings associations or their holding companies for the purpose of stabilizing and providing liquidity to the U.S. financial markets.
On February 17, 2009, the ARRA was enacted as a sweeping economic recovery package intended to stimulate the economy and provide for extensive infrastructure, energy, health and education needs. We participated in the CPP and sold $41.3 million of our Series A Preferred Stock and a warrant to purchase 749,619 shares of our common stock to the Treasury, which securities are no longer outstanding as a result of the TARP Repurchase. There can be no assurance as to the actual impact that EESA or its programs, including the CPP, and ARRA or its programs, will have on the national economy or financial markets. The failure of these significant legislative measures to help stabilize the financial markets and a continuation or worsening of current financial market conditions could materially and adversely affect our financial condition, results of operations, liquidity or stock price.
On July 21, 2010, President Obama signed into law the Dodd-Frank Wall Street Reform and Consumer Protection Act (the “Dodd-Frank Act”), which was intended primarily to overhaul the financial regulatory framework following the global financial crisis and will impact all financial institutions including our holding company and Capital Bank. The Dodd-Frank Act contains provisions that will, among other things, establish a Bureau of Consumer Financial Protection, establish a systemic risk regulator, consolidate certain federal bank regulators and impose increased corporate governance and executive compensation requirements. While many of the provisions in the Dodd-Frank Act are aimed at financial institutions significantly larger than us, and some will affect only institutions with different charters than us or institutions that engage in activities in which we do not engage, it will likely increase our regulatory compliance burden and may have a material adverse effect on us, including by increasing the costs associated with our regulatory examinations and compliance measures.
The Dodd-Frank Act requires various federal agencies to adopt a broad range of new implementing rules and regulations and to prepare numerous studies and reports for the U.S. Congress. The federal agencies are given significant discretion in drafting the implementing rules and regulations, and consequently, many of the details and much of the impact of the Dodd-Frank Act may not be known for many months or years. We are closely monitoring all relevant sections of the Dodd-Frank Act to ensure continued compliance with laws and regulations. While the ultimate effect of the Dodd-Frank Act on us cannot be determined yet, the law is likely to result in increased compliance costs and fees paid to regulators, along with possible restrictions on our operations.
Further, the U.S. Congress and state legislatures and federal and state regulatory authorities continually review banking laws, regulations and policies for possible changes. Changes to statutes, regulations or regulatory policies, including interpretation and implementation of statutes, regulation or policies, including the Dodd-Frank Act, could affect us in substantial and unpredictable ways, including limiting the types of financial services and products we may offer or increasing the ability of non-banks to offer competing financial services and products. While we cannot predict the regulatory changes that may be borne out of the current economic crisis, and we cannot predict whether we will become subject to increased regulatory scrutiny by any of these regulatory agencies, any regulatory changes or scrutiny could increase or decrease the cost of doing business, limit or expand our permissible activities, or affect the competitive balance among banks, credit unions, savings and loan associations and other institutions. We cannot predict whether additional legislation will be enacted and, if enacted, the effect that it, or any regulations, would have on our business, financial condition or results of operations.
Changes in local economic conditions could lead to higher loan charge-offs and reduce our net income and growth.
Our business is subject to periodic fluctuations based on local economic conditions in central and western North Carolina. These fluctuations are not predictable, cannot be controlled and may have a material adverse impact on our operations and financial condition even if other favorable events occur. Our operations are locally oriented and community-based. Accordingly, we expect to continue to be dependent upon local business conditions as well as conditions in the local residential and commercial real estate markets we serve. For example, an increase in unemployment, a decrease in real estate values or increases in interest rates, as well as other factors, could weaken the economies of the communities we serve.
Weakness in our market areas could depress our earnings and consequently our financial condition because:
|
•
|
customers may not want or need our products or services;
|
|
|
•
|
borrowers may not be able to repay their loans;
|
|
|
•
|
the value of the collateral securing loans to borrowers may decline; and
|
|
|
•
|
the quality of our loan portfolio may decline.
|
Any of the latter three scenarios could require us to charge off a higher percentage of loans and/or increase provisions for credit losses, which would reduce our net income.
Because the majority of our borrowers are individuals and businesses located and doing business in Wake, Granville, Lee, Cumberland, Johnston, Chatham, Alamance, Buncombe and Catawba Counties, North Carolina, our success will depend significantly upon the economic conditions in those and the surrounding counties. Unfavorable economic conditions or a continued increase in unemployment rates in those and the surrounding counties may result in, among other things, a deterioration in credit quality or a reduced demand for credit and may harm the financial stability of our customers. Due to our limited market areas, these negative conditions may have a more noticeable effect on us than would be experienced by a larger institution that is able to spread these risks of unfavorable local economic conditions across a large number of diversified economies.
We are exposed to risks in connection with the loans we make.
A significant source of risk for us arises from the possibility that losses will be sustained because borrowers, guarantors and related parties may fail to perform in accordance with the terms of their loans. We have underwriting and credit monitoring procedures and credit policies, including the establishment and review of the allowance for loan losses, that we believe are appropriate to minimize this risk by assessing the likelihood of nonperformance, tracking loan performance and diversifying our loan portfolio. Such policies and procedures, however, may not prevent unexpected losses that could adversely affect our results of operations. Loan defaults result in a decrease in interest income and may require the establishment of or an increase in loan loss reserves. Furthermore, the decrease in interest income resulting from a loan default or defaults may be for a prolonged period of time as we seek to recover, primarily through legal proceedings, the outstanding principal balance, accrued interest and default interest due on a defaulted loan plus the legal costs incurred in pursuing our legal remedies. No assurance can be given that recent market conditions will not result in our need to increase loan loss reserves or charge off a higher percentage of loans, thereby reducing net income.
A significant portion of our loan portfolio is secured by real estate, and events that negatively impact the real estate market could hurt our business.
A significant portion of our loan portfolio is secured by real estate. As of December 31, 2010, approximately 85% of our loans had real estate as a primary or secondary component of collateral. The real estate collateral in each case provides an alternate source of repayment in the event of default by the borrower and may deteriorate in value during the time the credit is extended. A continued weakening of the real estate market in our primary market areas could continue to result in an increase in the number of borrowers who default on their loans and a reduction in the value of the collateral securing their loans, which in turn could have an adverse effect on our profitability and asset quality. If we are required to liquidate the collateral securing a loan to satisfy the debt during a period of reduced real estate values, our earnings and shareholders’ equity could be adversely affected. The declines in home prices in the markets we serve, along with the reduced availability of mortgage credit, also may result in increases in delinquencies and losses in our portfolio of loans related to residential real estate construction and development. Further declines in home prices coupled with a deepened economic recession and continued rises in unemployment levels could drive losses beyond that which is provided for in our allowance for loan losses. In that event, our earnings could be adversely affected.
Additionally, recent weakness in the secondary market for residential lending could have an adverse impact on our profitability. Significant ongoing disruptions in the secondary market for residential mortgage loans have limited the market for and liquidity of most mortgage loans other than conforming Fannie Mae and Freddie Mac loans. The effects of ongoing mortgage market challenges, combined with the ongoing correction in residential real estate market prices and reduced levels of home sales, could result in further price reductions in single family home values, adversely affecting the value of collateral securing mortgage loans held, mortgage loan originations and gains on sale of mortgage loans. Continued declines in real estate values and home sales volumes, and financial stress on borrowers as a result of job losses or other factors, could have further adverse effects on borrowers that result in higher delinquencies and greater charge-offs in future periods, which could adversely affect our financial condition or results of operations.
Our real estate and land acquisition and development loans are based upon estimates of costs and the value of the complete project.
We extend real estate land loans, construction loans, and acquisition and development loans to builders and developers, primarily for the construction/development of properties. We originate these loans on a presold and speculative basis and they include loans for both residential and commercial purposes. As of December 31, 2010, these loans totaled $350.6 million, or 28% of our total loan portfolio. Approximately $77.1 million of this amount was for construction of residential properties and $49.3 million was for construction of commercial properties. Additionally, approximately $144.1 million was for acquisition and development loans for both residential and commercial properties. Land loans, which are loans made with raw land as security, totaled $80.1 million, or 6% of our portfolio, as of December 31, 2010.
In general, construction and land lending involves additional risks because of the inherent difficulty in estimating a property’s value both before and at completion of the project. Construction costs may exceed original estimates as a result of increased materials, labor or other costs. In addition, because of current uncertainties in the residential and commercial real estate markets, property values have become more difficult to determine than they have been historically. Construction and land acquisition and development loans often involve the repayment dependent, in part, on the ability of the borrower to sell or lease the property. These loans also require ongoing monitoring. In addition, speculative construction loans to a residential builder are often associated with homes that are not presold, and thus pose a greater potential risk than construction loans to individuals on their personal residences. As of December 31, 2010, $61.3 million of our residential construction loans were for speculative construction loans. Slowing housing sales have been a contributing factor to an increase in nonperforming loans as well as an increase in delinquencies.
Nonperforming real estate land loans, construction loans and acquisition and development loans totaled $50.7 million and $24.6 million as of December 31, 2010 and December 31, 2009, respectively.
Our non-owner occupied commercial real estate loans may be dependent on factors outside the control of our borrowers.
We originate non-owner occupied commercial real estate loans for individuals and businesses for various purposes, which are secured by commercial properties. These loans typically involve repayment dependent upon income generated, or expected to be generated, by the property securing the loan in amounts sufficient to cover operating expenses and debt service. This may be adversely affected by changes in the economy or local market conditions. Non-owner occupied commercial real estate loans expose a lender to greater credit risk than loans secured by residential real estate because the collateral securing these loans typically cannot be liquidated as easily as residential real estate. If we foreclose on a non-owner occupied commercial real estate loan, our holding period for the collateral typically is longer than a 1-4 family residential property because there are fewer potential purchasers of the collateral. Additionally, non-owner occupied commercial real estate loans generally have relatively large balances to single borrowers or related groups of borrowers. Accordingly, charge-offs on non-owner occupied commercial real estate loans may be larger on a per loan basis than those incurred with our residential or consumer loan portfolios.
As of December 31, 2010, our non-owner occupied commercial real estate loans totaled $283.9 million, or 23% of our total loan portfolio. Nonperforming non-owner occupied commercial real estate loans totaled $2.7 million and $1.0 million as of December 31, 2010 and December 31, 2009, respectively.
Repayment of our commercial business loans is dependent on the cash flows of the borrower, which may be unpredictable, and the collateral securing these loans may fluctuate in value.
We offer different types of commercial loans to a variety of small to medium-sized businesses. The types of commercial loans offered are owner-occupied term real estate loans, business lines of credit and term equipment financing. Commercial business lending involves risks that are different from those associated with non-owner occupied commercial real estate lending. Our commercial business loans are primarily underwritten based on the cash flow of the borrower and secondarily on the underlying collateral, including real estate. The borrowers’ cash flow may be unpredictable, and collateral securing these loans may fluctuate in value. Some of our commercial business loans are collateralized by equipment, inventory, accounts receivable or other business assets, and the liquidation of collateral in the event of default is often an insufficient source of repayment because accounts receivable may be uncollectible and inventories may be obsolete or of limited use.
As of December 31, 2010, our commercial business loans totaled $315.9 million, or 25% of our total loan portfolio. Of this amount, $170.5 million was secured by owner-occupied real estate and $145.4 million was secured by business assets. Nonperforming commercial business loans totaled $14.0 million and $10.6 million as of December 31, 2010 and December 31, 2009, respectively.
A portion of our commercial real estate loan portfolio utilizes interest reserves which may not accurately portray the financial condition of the project and the borrower’s ability to repay the loan.
Some of our commercial real estate loans utilize interest reserves to fund the interest payments and are funded from loan proceeds. Our decision to establish a loan-funded interest reserve upon origination of a loan is based on the feasibility of the project, the creditworthiness of the borrower and guarantors and the protection provided by the real estate and other collateral. When applied appropriately, an interest reserve can benefit both the lender and the borrower. For the lender, an interest reserve provides an effective means for addressing the cash flow characteristics of a properly underwritten acquisition, development and construction loan. Similarly, for the borrower, interest reserves provide the funds to service the debt until the property is developed, and cash flow is generated from the sale or lease of the developed property.
Although potentially beneficial to the lender and the borrower, our use of interest reserves carries certain risks. Of particular concern is the possibility that an interest reserve may not accurately reflect problems with a borrower’s willingness or ability to repay the debt consistent with the terms and conditions of the loan obligation. For example, a project that is not completed in a timely manner or falters once completed may appear to perform if the interest reserve keeps the loan current. In some cases, we may extend, renew or restructure the term of certain loans, providing additional interest reserves to keep the loan current. As a result, the financial condition of the project may not be apparent and developing problems may not be addressed in a timely manner. Consequently, we may end up with a matured loan where the interest reserve has been fully advanced, and the borrower’s financial condition has deteriorated. In addition, the project may not be complete, its sale or lease-up may not be sufficient to ensure timely repayment of the debt or the value of the collateral may have declined, exposing us to increasing credit losses.
As of December 31, 2010 we had a total of 28 active residential and commercial acquisition, development and construction loans funded by an interest reserve with a total outstanding balance of $48.0 million, representing approximately 4% of our total outstanding loans. Total commitments on these loans equaled $55.2 million with total remaining interest reserves of $1.3 million, representing a weighted average term of approximately seven months of remaining interest coverage.
Our allowance for loan losses may prove to be insufficient to absorb losses in our loan portfolio.
Lending money is a substantial part of our business, and each loan carries a certain risk that it will not be repaid in accordance with its terms or that any underlying collateral will not be sufficient to assure repayment. This risk is affected by, among other things:
|
•
|
cash flow of the borrower and/or the project being financed;
|
|
|
•
|
the changes and uncertainties as to the future value of the collateral, in the case of a collateralized loan;
|
|
|
•
|
the duration of the loan;
|
|
|
•
|
the credit history of a particular borrower; and
|
|
|
•
|
changes in economic and industry conditions.
|
We maintain an allowance for loan losses, which is a reserve established through a provision for loan losses charged to expense, which we believe is appropriate to provide for probable losses in our loan portfolio. The amount of this allowance is determined by our management through periodic reviews and consideration of several factors, including, but not limited to:
|
•
|
our general reserve, based on our historical default and loss experience and certain other qualitative factors; and
|
|
|
•
|
our specific reserve, based on our evaluation of impaired loans and their underlying collateral.
|
The determination of the appropriate level of the allowance for loan losses inherently involves a high degree of subjectivity and requires us to make significant estimates of current credit risks and future trends, all of which may undergo material changes. Continuing deterioration in economic conditions affecting borrowers, new information regarding existing loans, identification of additional problem loans and other factors, both within and outside of our control, may require an increase in the allowance for loan losses. In addition, bank regulatory agencies periodically review our allowance for loan losses and may require an increase in the provision for probable loan losses or the recognition of further loan charge-offs, based on judgments different than those of management. In addition, if charge-offs in future periods exceed the allowance for loan losses, we will need additional provisions to increase the allowance for loan losses. Any increases in the allowance for loan losses will result in a decrease in net income and, possibly, capital, and may have a material adverse effect on our financial condition and results of operations.
If our allowance for loan losses is not adequate, we may be required to make further increases in our provisions for loan losses and to charge off additional loans, which could adversely affect our results of operations.
For the year ended December 31, 2010, we recorded a provision for loan losses of $58.5 million compared to $23.1 million for the year ended December 31, 2009, an increase of $35.4 million. We also recorded net loan charge-offs of $48.6 million for year ended December 31, 2010 compared to $11.8 million for the year ended December 31, 2009. As of December 31, 2010 and December 31, 2009, our allowance for loan losses totaled $36.1 million and $26.1 million, respectively, which represented 50% and 66% of nonperforming loans, respectively. Generally, our nonperforming loans and assets reflect operating difficulties of individual borrowers resulting from weakness in the local economy; however, more recently the deterioration in the general economy has become a significant contributing factor to the increased levels of delinquencies and nonperforming loans.
Slower sales and excess inventory in the housing market has been the primary cause of the increase in delinquencies and foreclosures for residential construction loans, which represented 4% of our nonperforming loans as of December 31, 2010. In addition, slowing housing sales have been a contributing factor to the increase in nonperforming loans as well as the increase in delinquencies. We are experiencing increasing loan delinquencies and credit losses. As of December 31, 2010, our total nonperforming loans increased to $71.9 million, or 5.73% of total loans, compared to $39.5 million, or 2.84% of total loans, as of December 31, 2009. As of December 31, 2010, our total past due loans, excluding nonperforming loans, increased to $13.5 million, or 1.08% of total loans, compared to $9.3 million, or 0.67% of total loans, as of December 31, 2009. If current trends in the housing and real estate markets continue, we expect that we will continue to experience higher than normal delinquencies and credit losses. Moreover, until general economic conditions improve, we may continue to experience increased delinquencies and credit losses. As a result, we may be required to make additional provisions for loan losses and to charge off additional loans in the future, which could materially adversely affect our financial condition and results of operations.
We have extended the maturity date and terms of a large amount of loans, which could increase the level of our troubled debt restructured loans.
A significant portion of our loans are renewed, or extended, upon maturity. As a prudent risk management strategy, in certain situations we prefer to fund loans with a relatively short maturity date, which provides us with the flexibility of reviewing the borrower’s financial condition and the appropriateness of loan terms on a more frequent basis. Upon renewal, loans are underwritten in the same manner and pursuant to the same approval process as a new loan origination. As of December 31, 2010 and December 31, 2009, loans outstanding totaling $681.4 million and $708.6 million, respectively, had been renewed or had terms extended at a previous maturity date.
While this practice provides certain benefits and flexibility to us as the lender, the extension or renewal of loans carries certain risks. If interest rates or other terms are modified upon extension of credit or if loan terms are renewed in situations where the borrower is experiencing financial difficulty and a concession is granted, the modification or renewal may require classification as a troubled debt restructuring (“TDR”).
In accordance with accounting standards, we classify loans as TDRs when certain modifications are made to the loan terms and concessions are granted to the borrowers due to their financial difficulty. Our practice is to only restructure loans for borrowers in financial difficulty that have designed a viable business plan to fully pay off all obligations, including outstanding debt, interest and fees, either by generating additional income from the business or through liquidation of assets. Generally, these loans are restructured to provide the borrower additional time to execute its business plan. With respect to restructured loans, we grant concessions by (1) reduction of the stated interest rate for the remaining original life of the debt or (2) extension of the maturity date at a stated interest rate lower than the current market rate for new debt with similar risk. Restructured loans where a concession has been granted through extension of the maturity date generally include extension of payments in an interest only period, extension of payments with capitalized interest and extension of payments through a forbearance agreement. These extended payment terms are also combined with a reduction of the stated interest rate in certain cases. In situations where a TDR is unsuccessful and the borrower is unable to satisfy the terms of the restructured agreement, the loan is placed on nonaccrual status and is written down to the underlying collateral value. As of December 31, 2010 and 2009, performing and nonperforming TDRs totaled $18.5 million and $50.3 million, respectively. As of December 31, 2010 and 2009, performing TDRs totaled $4.5 million and $34.2 million, respectively.
We continue to hold and acquire a significant amount of other real estate, which has led to increased operating expenses and vulnerability to additional declines in real property values.
We foreclose on and take title to the real estate serving as collateral for many of our loans as part of our business. Real estate owned by the Bank and not used in the ordinary course of its operations is referred to as “other real estate” or “ORE” property. At December 31, 2010, we had ORE with an aggregate book value of $18.3 million, compared to $10.7 million at December 31, 2009. Increased ORE balances have led to greater expenses as we incur costs to manage and dispose of the properties. We expect that our earnings will continue to be negatively affected by various expenses associated with ORE, including personnel costs, insurance and taxes, completion and repair costs, valuation adjustments and other expenses associated with property ownership, as well as by the funding costs associated with assets that are tied up in ORE. Any further decrease in real estate market prices may lead to additional ORE write-downs, with a corresponding expense in our statement of operations. We evaluate ORE properties periodically and write down the carrying value of the properties if the results of our evaluation require it. The expenses associated with ORE and any further property write-downs could have a material adverse effect on our financial condition and results of operations.
We are subject to environmental liability risk associated with lending activities.
A significant portion of our loan portfolio is secured by real property. During the ordinary course of business, we may foreclose on and take title to properties securing certain loans. In doing so, there is a risk that hazardous or toxic substances could be found on these properties. If hazardous or toxic substances are found, we may be liable for remediation costs, as well as for personal injury and property damage. Environmental laws may require us to incur substantial expenses to address unknown liabilities and may materially reduce the affected property’s value or limit our ability to use or sell the affected property. In addition, future laws or more stringent interpretations or enforcement policies with respect to existing laws may increase our exposure to environmental liability. Although we have policies and procedures to perform an environmental review before initiating any foreclosure action on nonresidential real property, these reviews may not be sufficient to detect all potential environmental hazards. The remediation costs and any other financial liabilities associated with an environmental hazard could have a material adverse effect on our financial condition and results of operations.
Changes in interest rates may have an adverse effect on our profitability.
Our earnings and financial condition are dependent to a large degree upon net interest income, which is the difference between interest earned from loans and investments and interest paid on deposits and borrowings. Approximately 56% of our loans were variable rate loans as of December 31, 2010, which means that our interest income will generally decrease in lower interest rate environments and rise in higher interest rate environments. Our net interest income will be adversely affected if market interest rates change such that the interest we earn on loans and investments decreases faster than the interest we pay on deposits and borrowings. We cannot predict with certainty or control changes in interest rates. Regional and local economic conditions and the policies of regulatory authorities, including monetary policies of the Federal Reserve, affect interest income and interest expense. We have ongoing policies and procedures designed to manage the risks associated with changes in market interest rates. However, changes in interest rates still may have an adverse effect on our earnings and financial condition.
The fair value of our investments could decline.
The majority of our investment portfolio as of December 31, 2010 has been designated as available-for-sale. Unrealized gains and losses in the estimated value of the available-for-sale portfolio must be “marked to market” and reflected as a separate item in shareholders’ equity (net of tax) as accumulated other comprehensive income. As of December 31, 2010, we maintained $215.0 million, or 96%, of our total investment securities as available-for-sale. Shareholders’ equity will continue to reflect the unrealized gains and losses (net of tax) of these investments. The fair value of our investment portfolio may decline, causing a corresponding decline in shareholders’ equity.
Management believes that several factors affect the fair values of our investment portfolio. These include, but are not limited to, changes in interest rates or expectations of changes, changes to the credit ratings and financial condition of security issuers, the degree of volatility in the securities markets, inflation rates or expectations of inflation, and the slope of the interest rate yield curve. The yield curve refers to the differences between shorter-term and longer-term interest rates; a positively sloped yield curve means shorter-term rates are lower than longer-term rates. These and other factors may impact specific categories of the portfolio differently, and we cannot predict the effect these factors may have on any specific category.
Government regulations may prevent or impact our ability to pay dividends, engage in acquisitions or operate in other ways.
Current and future legislation and the policies established by federal and state regulatory authorities will affect our operations. Banking regulations, designed primarily for the protection of depositors, may limit our growth and the return to our current and/or potential investors by restricting certain of our activities, such as:
|
•
|
payment of dividends to our shareholders;
|
|
|
•
|
possible mergers with, or acquisitions of or by, other institutions;
|
|
|
•
|
our desired investments;
|
|
|
•
|
loans and interest rates on loans;
|
|
|
•
|
interest rates paid on our deposits;
|
|
|
•
|
the possible expansion of our branch offices; and/or
|
|
|
•
|
our ability to provide securities or trust services.
|
We cannot predict what changes, if any, will be made to existing federal and state legislation and regulations or the effect that such changes may have on our future business and earnings prospects. Many of these regulations are intended to protect depositors, the public and the FDIC, not shareholders. The cost of compliance with regulatory requirements including those imposed by the SEC may adversely affect our ability to operate profitably.
Specifically, federal and state governments could pass additional legislation responsive to current credit conditions that reduces the amounts borrowers are contractually required to pay under existing loan contracts or that limits our ability to foreclose on property or other collateral. If proposals such as these, or other proposals limiting our rights as a creditor, were to be implemented, we could experience higher credit losses on our loans or increased expense in pursuing our remedies as a creditor.
We have entered into an MOU that requires us to maintain elevated capital ratios and take other actions, and failure to comply with the terms of the MOU may result in adverse consequences.
On October 28, 2010, the Bank entered into an informal Memorandum of Understanding with the FDIC and the NC Commissioner. Regulatory oversight and actions are on the rise as a result of the current severe economic conditions and the related impact on the banking industry, specifically real estate loans.
In accordance with the terms of the MOU, the Bank has agreed to, among other things, (i) increase regulatory capital to achieve and maintain a minimum Tier 1 leverage capital ratio of at least 8% and a total risk-based capital ratio of at least 12%, (ii) monitor and reduce its commercial real estate concentration, (iii) timely identify and reduce its overall level of problem loans, (iv) establish and maintain an adequate allowance for loan losses, and (v) ensure adherence to loan policy guidelines. The MOU will remain in effect until modified, terminated, lifted, suspended or set aside by the regulatory authorities. In addition, the Bank must obtain regulatory approval prior to paying any dividends to the Company. The MOU may limit our ability to commit capital resources as we are required to preserve capital to meet the MOU’s requirements.
In addition, the Company consults with the Federal Reserve Bank of Richmond prior to payment of any dividends or interest on debt.
We are committed to expeditiously addressing and resolving all the issues raised in the MOU, and our Board of Directors and management have initiated actions to comply with its provisions, including the recent completion of the Investment. A material failure to comply with the terms of the MOU could subject us to additional regulatory actions, including a cease and desist order or other action, and further regulation, which may have a material adverse effect on our future business, results of operations and financial condition.
We are subject to examination and scrutiny by a number of regulatory authorities, and, depending upon the findings and determinations of our regulatory authorities, we may be required to make adjustments to our business, operations or financial position and could become subject to formal or informal regulatory orders.
We are subject to examination by federal and state banking regulators. Federal and state regulators have the ability to impose substantial sanctions, restrictions and requirements on us and our banking subsidiaries if they determine, upon conclusion of their examination or otherwise, violations of laws with which we or our subsidiaries must comply or weaknesses or failures with respect to general standards of safety and soundness, including, for example, in respect of any financial concerns that the regulators may identify and desire for us to address. Such enforcement may be formal or informal and can include directors’ resolutions, memoranda of understanding, cease and desist orders, civil money penalties and termination of deposit insurance and bank closures. Enforcement actions may be taken regardless of the capital levels of the institutions, and regardless of prior examination findings. In particular, institutions that are not sufficiently capitalized in accordance with regulatory standards may also face capital directives or prompt corrective actions. Enforcement actions may require certain corrective steps (including staff additions or changes), impose limits on activities (such as lending, deposit taking, acquisitions or branching), prescribe lending parameters (such as loan types, volumes and terms) and require additional capital to be raised, any of which could adversely affect our financial condition and results of operations. The imposition of regulatory sanctions, including monetary penalties, may have a material impact on our financial condition and results of operations and/or damage our reputation. In addition, compliance with any such action could distract management’s attention from our operations, cause us to incur significant expenses, restrict us from engaging in potentially profitable activities and limit our ability to raise capital.
We are dependent on our key personnel, including our senior management and directors, and our inability to integrate our new management and directors into our business and hire and retain key personnel may adversely affect our operations and financial performance.
We are, and for the foreseeable future will be, dependent on the services of our senior management and directors. In connection with the Investment, R. Eugene Taylor, Christopher G. Marshall, Peter N. Foss, William A. Hodges and R. Bruce Singletary were appointed to our Board of Directors. Mr. Oscar A. Keller, III and Charles F. Atkins remained as members of our Board of Directors following the closing of the Investment and all other prior directors of the Company resigned effective January 28, 2011. In addition, we appointed several new executive officers in connection with the Investment: R. Eugene Taylor as President, Chief Executive Officer and Chairman of the Board, Christopher G. Marshall as Executive Vice President and Chief Financial Officer and R. Bruce Singletary as Executive Vice President and Chief Risk Officer. B. Grant Yarber remained with the Company as Market President for North Carolina and Michael R. Moore, David C. Morgan and Mark Redmond remained with the Company as Executive Vice Presidents. We may not be able to integrate our new management and directors into our business without encountering potential difficulties, including but not limited to the loss of key employees and customers; possible changes in strategic direction, business plan, operations, control procedures and policies; and transitional issues related to changing responsibilities of management.
In addition, successful execution of our growth strategy will continue to place significant demands on our management and directors. The loss of any such person’s services may disrupt our operations and growth, and there can be no assurance that a suitable successor could be retained upon the terms and conditions that we would offer. Further, as we continue to grow our operations both in our current markets and other markets that we may target, we expect to continue to be dependent on our senior management and their relationships in such markets. Our inability to attract or retain additional personnel could materially adversely affect our business or growth prospects in one or more markets.
We may enter into acquisitions, combinations, or other strategic transactions at any time, which could expose us to potential risks.
We intend to continue to explore expanding our branch system through selective acquisitions of existing banks or bank branches, including through FDIC-assisted transactions. We may also explore combinations with other banks or bank branches in which NAFH has a majority interest, or enter into other strategic transactions. We cannot say with any certainty that we will be able to consummate, or if consummated, successfully integrate, future acquisitions or combinations, or that we will not incur disruptions or unexpected expenses in integrating such acquisitions. In the ordinary course of business, we evaluate potential acquisitions, combinations, and other transactions that would bolster our ability to cater to the small business, individual and residential lending markets in our target markets. In attempting to make such acquisitions, combinations, and other transactions we may compete with other financial institutions, many of which have greater financial and operational resources. The process of identifying transaction opportunities, negotiating potential transactions, obtaining the required regulatory approvals and integrating new operations and personnel requires a significant amount of time and expense and may divert management’s attention from our existing business. In addition, since the consideration for an acquired bank or branch may involve cash, notes or the issuance of shares of common stock, existing shareholders could experience dilution in the value of their shares of our common stock in connection with such acquisitions. Any given transaction, if and when consummated, may adversely affect our results of operations or overall financial condition. In addition, we may expand our branch network through de novo branches in existing or new markets. These de novo branches will have expenses in excess of revenues for varying periods after opening, which could decrease our reported earnings.
Our ability to raise additional capital could be limited, could affect our liquidity and could be dilutive to existing shareholders.
We may be required or choose to raise additional capital, including for strategic, regulatory or other reasons. Current conditions in the capital markets are such that traditional sources of capital may not be available to us on reasonable terms if we need to raise additional capital, and the inability to access the capital markets could impair our liquidity, which is important to our business. In such case, there is no guarantee that we will be able to successfully raise additional capital at all or on terms that are favorable or otherwise not dilutive to existing shareholders.
We compete with larger companies for business.
The banking and financial services business in our market areas continues to be a competitive field and is becoming more competitive as a result of:
|
•
|
changes in regulations;
|
|
|
•
|
changes in technology and product delivery systems; and
|
|
|
•
|
the accelerating pace of consolidation among financial services providers.
|
We may not be able to compete effectively in our markets, and our results of operations could be adversely affected by the nature or pace of change in competition. We compete for loans, deposits and customers with various bank and nonbank financial services providers, many of which have substantially greater resources, including higher total assets and capitalization, greater access to capital markets and a broader offering of financial services.
The failure of other financial institutions could adversely affect us.
Our ability to engage in routine transactions, including, for example, funding transactions, could be adversely affected by the actions and potential failures of other financial institutions. We have exposure to many different industries and counterparties, and we routinely execute transactions with a variety of counterparties in the financial services industry. As a result, defaults by, or even rumors or concerns about, one or more financial institutions with which we do business, or the financial services industry generally, have led to market-wide liquidity problems and could lead to losses or defaults by us or by others. In addition, our credit risk may be exacerbated when the collateral we hold cannot be sold at prices that are sufficient for us to recover the full amount of our exposure. Any such losses could materially and adversely affect our financial condition and results of operations.
Consumers may decide not to use banks to complete their financial transactions, which could limit our revenue.
Technology and other changes are allowing parties to complete financial transactions through alternative methods that historically have involved banks. For example, consumers can now maintain funds in brokerage accounts or mutual funds that would have historically been held as bank deposits. Consumers can also complete transactions such as paying bills and/or transferring funds directly without the assistance of banks through the use of various electronic payment systems. The process of eliminating banks as intermediaries could result in the loss of fee income, as well as the loss of customer deposits and the related income generated from those deposits. The loss of these revenue streams and the lower cost deposits as a source of funds could have a material adverse effect on our financial condition and results of operations.
Technological advances impact our business.
The banking industry is undergoing rapid technological changes with frequent introductions of new technology-driven products and services. In addition to improving customer services, the effective use of technology increases efficiency and enables financial institutions to reduce costs. Our future success will depend, in part, on our ability to address the needs of our customers by using technology to provide products and services that will satisfy customer demands for convenience as well as to create additional efficiencies in our operations. Many of our competitors have substantially greater resources than we do to invest in technological improvements. We may not be able to effectively implement new technology-driven products and services or successfully market such products and services to our customers.
Our information systems, or those of our third party contractors, may experience an interruption or breach in security.
We rely heavily on our communications and information systems, and those of third party contractors, to conduct our business. Any failure, interruption or breach in security of these systems could result in failures or disruptions in our customer relationship management, general ledger, deposit, loan and other systems. While we have policies and procedures designed to prevent or limit the effect of the failure, interruption or security breach of our information systems, there can be no assurance that we can prevent any such failures, interruptions or security breaches of our information systems, or those of our third party contractors, or, if they do occur, that they will be adequately addressed. The occurrence of any failures, interruptions or security breaches of such information systems could damage our reputation, result in a loss of customer business, subject us to additional regulatory scrutiny, or expose us to civil litigation and possible financial liability, any of which could have a material adverse effect on our financial condition and results of operations.
Our controls and procedures may fail or be circumvented.
Management regularly reviews and updates our internal controls, disclosure controls and procedures and corporate governance policies and procedures. Any system of controls, however well designed and operated, is based in part on certain assumptions and can provide only reasonable, not absolute, assurances that the objectives of the system are met. Any failure or circumvention of our controls and procedures or failure to comply with regulations related to controls and procedures could have a material adverse effect on our business, results of operations and financial condition.
We have experienced net losses during the last three completed fiscal years, and we are uncertain as to whether or when we will again be profitable.
We have experienced net losses during the years ended December 31, 2010, 2009 and 2008, and losses may continue. Our ability to generate profit in the future requires successful growth in revenues and management of expenses, among other factors. While we expect to be able to generate profit over time, our operating losses may continue for an unknown period of time.
Risks Related to Ownership of Our Common Stock
NAFH is a controlling shareholder and may have interests that differ from the interests of our other shareholders.
NAFH currently owns approximately 83.1% of the Company’s outstanding voting power. As a result, NAFH will be able to control the election of our directors, determine our corporate and management policies and determine the outcome of any corporate transaction or other matter submitted to our shareholders for approval. Such transactions may include mergers and acquisitions (which may include mergers of the Company and/or its subsidiaries with or into NAFH and/or NAFH’s other subsidiaries), sales of all or some of the Company’s assets (including sales of such assets to NAFH and/or NAFH’s other subsidiaries) or purchases of assets from NAFH and/or NAFH’s other subsidiaries, and other significant corporate transactions.
Five of our seven directors, our Chief Executive Officer, our Chief Financial Officer, and our Chief Risk Officer are affiliated with NAFH. NAFH also has sufficient voting power to amend our organizational documents. The interests of NAFH may differ from those of our other shareholders, and it may take actions that advance its interests to the detriment of our other shareholders. Additionally, NAFH is in the business of making investments in or acquiring financial institutions and may, from time to time, acquire and hold interests in businesses that compete directly or indirectly with us. NAFH may also pursue, for its own account, acquisition opportunities that may be complementary to our business, and as a result, those acquisition opportunities may not be available to us.
This concentration of ownership could also have the effect of delaying, deferring or preventing a change in our control or impeding a merger or consolidation, takeover or other business combination that could be favorable to the other holders of our common stock, and the trading price of our common stock may be adversely affected by the absence or reduction of a takeover premium in the trading price.
As a controlled company, we are exempt from certain NASDAQ corporate governance requirements.
Our common stock is currently listed on the NASDAQ Global Select Market. NASDAQ generally requires a majority of directors to be independent and requires independent director oversight over the nominating and executive compensation functions. However, under NASDAQ’s rules, if another company owns more than 50% of the voting power for the election of directors of a listed company, that company is considered a “controlled company” and exempt from rules relating to independence of the board of directors and the compensation and nominating committees. We are a controlled company because NAFH owns more than 50% of our voting power for the election of directors. Accordingly, we are exempt from certain corporate governance requirements, and holders of our common stock may not have all the protections that these rules are intended to provide.
The trading volume in our common stock has been low, and market conditions and other factors may affect the value of our common stock, which may make it difficult for you to sell your shares at times, volumes or prices you find attractive.
While our common stock is traded on the NASDAQ Global Select Market, our common stock is thinly traded and has substantially less liquidity than the average trading market for many other publicly traded companies. Trading volume may remain low as a result of the Investment and NAFH’s acquisition of a majority stake in the Company. Thinly traded stocks can be more volatile than stock trading in an active public market. Our stock price has been volatile in the past and several factors could cause the price to fluctuate substantially in the future. These factors include but are not limited to changes in analysts’ recommendations or projections, our announcement of developments related to our business, operations and stock performance of other companies deemed to be peers, news reports of trends, concerns, irrational exuberance on the part of investors and other issues related to the financial services industry. Recently, the stock market has experienced a high level of price and volume volatility, and market prices for the stock of many companies, including those in the financial services sector, have experienced wide price fluctuations that have not necessarily been related to operating performance. Our stock price may fluctuate significantly in the future, and these fluctuations may be unrelated to our performance. General market declines or market volatility in the future, especially in the financial institutions sector of the economy, could adversely affect the price of our common stock, and the current market price may not be indicative of future market prices. Therefore, our shareholders may not be able to sell their shares at the volume, prices or times that they desire.
We may choose to voluntarily delist our common stock from NASDAQ or cease to be a reporting issuer under SEC rules.
We may choose to, or our majority shareholder NAFH may cause us to, voluntarily delist from the NASDAQ Global Select Market. If we were to delist from NASDAQ, we may or may not list ourselves on another exchange, and may or may not be required to continue to file periodic and current reports and other information as a reporting issuer under SEC rules. A delisting of our common stock could negatively impact you by reducing the liquidity and market price of our common stock, reducing information available to you about the Company on an ongoing basis and potentially reducing the number of investors willing to hold or acquire our common stock. In addition, if we were to delist from NASDAQ, we would no longer be subject to any of the corporate governance rules applicable to NASDAQ listed companies. See also “—As a controlled company, we are exempt from certain NASDAQ corporate governance requirements.”
We may issue additional shares of common stock or convertible securities that will dilute the percentage ownership interest of existing shareholders and may dilute the book value per share of our common stock and adversely affect the terms on which we may obtain additional capital.
Our authorized capital includes 300,000,000 shares of common stock. As of March 11, 2011, we had 85,491,011 shares of common stock outstanding and had reserved for issuance 297,880 shares underlying options that are exercisable at an average price of $12.11 per share. In addition, as of March 11, 2011, we had the ability to issue 605,359 shares of common stock pursuant to options and restricted stock that may be granted in the future under our existing equity compensation plans. Although we presently do not have any intention of issuing additional common stock (other than pursuant to our equity compensation plans), we may do so in the future in order to meet our capital needs and regulatory requirements, and we will be able to do so without shareholder approval. Subject to applicable NASDAQ Listing Rules, our Board of Directors generally has the authority, without action by or vote of the shareholders, to issue all or part of any authorized but unissued shares of common stock for any corporate purpose, including issuance of equity-based incentives under or outside of our equity compensation plans. We may seek additional equity capital in the future as we develop our business and expand our operations. Any issuance of additional shares of common stock or convertible securities will dilute the percentage ownership interest of our shareholders and may dilute the book value per share of our common stock.
Our ability to pay dividends and other obligations is subject to regulatory limitations and the Bank’s ability to pay dividends to us, which is also subject to regulatory limitations.
Our ability to pay our obligations and declare and pay dividends depends on certain federal regulatory considerations, including the guidelines of the Federal Reserve regarding capital adequacy and dividends. The Company consults with the Federal Reserve Bank of Richmond prior to payment of any dividends or interest on debt. If we are not permitted to make these payments, we may experience adverse consequences under our agreements with the holders of our debt. Holders of our common stock are only entitled to receive such dividends as our Board of Directors may declare out of funds legally available for such payments. Although we have historically paid cash dividends on our common stock, we are not required to do so and our Board of Directors voted in the first quarter of 2010 to suspend the payment of our quarterly cash dividend. This may continue to adversely affect the market price of our common stock.
We are a separate legal entity from the Bank and our other subsidiaries, and we do not have significant operations of our own. We have historically depended on the Bank’s cash and liquidity as well as dividends to pay our operating expenses. Various federal and state statutory provisions limit the amount of dividends that subsidiary banks can pay to their holding companies without regulatory approval. The Bank is also subject to limitations under state law regarding the payment of dividends, including the requirement that dividends may be paid only out of undivided profits and only if the Bank has surplus of a specified level. In addition, the Bank’s MOU requires the Bank to obtain regulatory approval prior to paying any cash dividends to us.
It is possible, depending upon the financial condition of the Bank and other factors, that the federal and state regulatory agencies could take the position that payment of dividends by the Bank would constitute an unsafe or unsound banking practice. In the event the Bank is unable to pay dividends sufficient to satisfy our obligations or is otherwise unable to pay dividends to us, we may not be able to service our obligations as they become due or to pay dividends on our common stock. Consequently, the inability to receive dividends from the Bank could adversely affect our financial condition, results of operations, cash flows and prospects.
The holders of our subordinated debentures have rights that are senior to those of our shareholders.
We have issued $34.3 million of subordinated debentures, which are senior to our shares of common stock. As a result, we must make payments on the subordinated debentures (and the trust preferred securities related to a portion of the subordinated debentures) before any dividends can be paid on our common stock and, in the event of bankruptcy, dissolution or liquidation, the holders of the debentures must be satisfied before any distributions can be made to the holders of common stock.
An investment in our common stock is not an insured deposit.
Our common stock is not a bank deposit and, therefore, is not insured against loss by the FDIC, any other deposit insurance fund or by any other public or private entity. Investment in our common stock is inherently risky for the reasons described in this “Risk Factors” section and elsewhere in this report and is subject to the same market forces that affect the price of common stock in any company. As a result, our shareholders may lose some or all of their investment in our common stock.
None
The Company currently leases property located at 333 Fayetteville Street, Raleigh, North Carolina for its principal offices and a branch office. The lease is for 65,330 square feet, of which 47,785 square feet is for the Company’s principal offices and for the branch office. The remaining leased square footage is currently being subleased to various other entities. The Company owns 14 properties throughout North Carolina that are used as branch offices, which are located in Burlington (3), Clayton, Fayetteville (3), Graham, Hickory, Mebane, Raleigh, Sanford, Siler City, and Zebulon. The Company’s operations center is located in one of the Burlington offices. The Company leases 17 other properties throughout North Carolina that are used as branch offices and which are located in Asheville (4), Cary (2), Fayetteville, Holly Springs, Morrisville, Oxford, Pittsboro, Raleigh (3), Sanford (2), and Wake Forest. Additionally, the Company signed an agreement in 2010 to lease a building under construction to accommodate the Company’s planned relocation of an existing branch in Sanford. Management believes the terms of the various leases, which are reviewed on an annual basis, are consistent with market standards and were arrived at through arm’s length bargaining.
There are no material pending legal proceedings to which the Company or its subsidiaries is a party or to which any of the Company’s or its subsidiaries’ property is subject. In addition, the Company is not aware of any threatened litigation, unasserted claims or assessments that could have a material adverse effect on the Company’s business, operating results or condition.
PART II
ITEM 5. MARKET FOR REGISTRANT’S COMMON EQUITY, RELATED STOCKHOLDER MATTERS AND ISSUER PURCHASES OF EQUITY SECURITIES
Shares of Capital Bank Corporation common stock are traded on the NASDAQ Global Select Market under the symbol “CBKN.” The following table sets forth, for the quarters shown, the range of high and low sales prices of our common stock on the NASDAQ Global Select Market and the cash dividends declared on the common stock. As of March 11, 2011, we had approximately 85,491,011 shares of common stock outstanding, held of record by approximately 2,213 shareholders. The last reported sales price of our common stock on the NASDAQ Global Select Market on March 11, 2011, was $3.49 per share.
|
High
|
Low
|
Cash Dividends
per Share Declared
|
||||||||
|
2010
|
||||||||||
|
First quarter
|
$
|
4.70
|
$
|
3.00
|
$
|
0.00
|
||||
|
Second quarter
|
6.95
|
3.01
|
0.00
|
|||||||
|
Third quarter
|
3.53
|
1.60
|
0.00
|
|||||||
|
Fourth quarter
|
3.09
|
1.50
|
0.00
|
|||||||
|
2009
|
||||||||||
|
First quarter
|
$
|
7.00
|
$
|
4.00
|
$
|
0.08
|
||||
|
Second quarter
|
6.39
|
4.13
|
0.08
|
|||||||
|
Third quarter
|
6.90
|
4.59
|
0.08
|
|||||||
|
Fourth quarter
|
5.74
|
3.80
|
0.08
|
|||||||
Dividend Policy
Our shareholders are entitled to receive such dividends or distributions as our Board of Directors authorizes in its discretion. Our ability to pay dividends is subject to the restrictions of the North Carolina Business Corporation Act, the guidelines of the Federal Reserve regarding capital adequacy and dividends, and our organizational documents, including our Articles of Incorporation. There are also various statutory limitations on the ability of the Bank to pay dividends to us. The Bank’s MOU requires the Bank to obtain regulatory approval prior to paying any cash dividends to us, and the Company consults with the Federal Reserve Bank of Richmond prior to payment of any dividends or interest on debt.
Subject to the legal availability of funds to pay dividends, during 2009 we declared and paid dividends totaling $0.32 per share (see chart above for declared quarterly dividends). We have currently suspended payment of our quarterly cash dividend. Our Board of Directors will continue to evaluate the payment of cash dividends quarterly and determine whether such cash dividends are in our best interest in the business judgment of our Board of Directors and are consistent with maintaining our status as a “well capitalized” institution under applicable banking laws and regulations. Our earnings and projected future earnings as well as capital levels will be reviewed by the Board of Directors on a quarterly basis to determine whether a quarterly dividend will be paid to shareholders, and if so, the appropriate amount. Actual declaration of any future dividends and the establishment of the record dates related thereto remains subject to further action by our Board of Directors as well as the limitations discussed above.
Recent Sales of Unregistered Securities
Other than as disclosed in our Current Report on Form 8-K, filed with the SEC on March 22, 2010, the Company did not sell any securities in the fiscal year ended December 31, 2010 that were not registered under the Securities Act of 1933, as amended (the “Securities Act”).
Repurchases of Equity Securities
On January 24, 2008, the Company’s Board of Directors authorized the repurchase (in the open market or in any private transaction) of up to 1,000,000 shares of the Company’s currently outstanding shares of common stock. As of December 31, 2010, there were an aggregate of 989,900 shares remaining authorized for future repurchases. There were no repurchases (both open market and private transactions) during the year ended December 31, 2010 of any of the Company’s securities registered under Section 12 of the Exchange Act, by or on behalf of the Company, or any affiliated purchaser of the Company.
Stock Performance Graph
The following graph compares the cumulative total shareholder return on the Company’s common stock since the last trading day of 2005 with the cumulative return for the same period of: (i) the NASDAQ Composite Index; and (ii) the NASDAQ Bank Index, which is a broad-based capitalization-weighted index of domestic and foreign common stocks of banks that are traded on NASDAQ. The Company’s common stock began trading on the NASDAQ SmallCap Market on December 18, 1997. As of April 1, 2002, the Company’s common stock has been trading on the NASDAQ Global Select Market. The graph assumes an investment of $100 on the last trading day of 2005 in the Company’s common stock and in each index and that all dividends, if any, were reinvested.
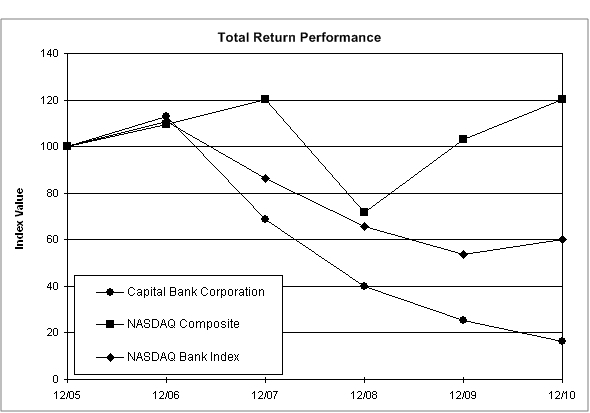
|
Period Ending
|
||||||||
|
Index
|
12/05
|
12/06
|
12/07
|
12/08
|
12/09
|
12/10
|
||
|
Capital Bank Corporation
|
100.00
|
112.90
|
68.73
|
40.00
|
25.19
|
16.22
|
||
|
NASDAQ Composite
|
100.00
|
109.52
|
120.27
|
71.51
|
102.89
|
120.29
|
||
|
NASDAQ Bank Index
|
100.00
|
111.01
|
86.51
|
65.81
|
53.63
|
60.01
|
||
The following table sets forth the Company’s selected financial data for the most recent five years ended December 31:
|
As of and for the Years Ended December 31,
|
||||||||||||||||
|
2010
|
2009
|
2008
|
2007
|
2006
|
||||||||||||
|
(Dollars in thousands)
|
||||||||||||||||
|
Selected Balance Sheet Data
|
||||||||||||||||
|
Cash and cash equivalents
|
$
|
66,745
|
$
|
29,513
|
$
|
54,455
|
$
|
40,172
|
$
|
54,332
|
||||||
|
Investment securities
|
223,292
|
245,492
|
278,138
|
259,116
|
239,047
|
|||||||||||
|
Loans
|
1,254,479
|
1,390,302
|
1,254,368
|
1,095,107
|
1,008,052
|
|||||||||||
|
Allowance for loan losses
|
36,061
|
26,081
|
14,795
|
13,571
|
13,347
|
|||||||||||
|
Intangible assets
|
1,774
|
2,711
|
3,857
|
63,345
|
64,543
|
|||||||||||
|
Total assets
|
1,585,547
|
1,734,668
|
1,654,232
|
1,517,603
|
1,422,384
|
|||||||||||
|
Deposits
|
1,343,286
|
1,377,965
|
1,315,314
|
1,098,698
|
1,055,209
|
|||||||||||
|
Borrowings and repurchase agreements
|
121,000
|
173,543
|
147,010
|
208,642
|
160,162
|
|||||||||||
|
Subordinated debentures
|
34,323
|
30,930
|
30,930
|
30,930
|
30,930
|
|||||||||||
|
Shareholders’ equity
|
76,688
|
139,785
|
148,514
|
164,300
|
161,681
|
|||||||||||
|
Tangible common equity
|
33,635
|
95,795
|
103,378
|
100,955
|
97,138
|
|||||||||||
|
Summary of Operations
|
||||||||||||||||
|
Interest income
|
$
|
77,722
|
$
|
83,141
|
$
|
85,020
|
$
|
94,537
|
$
|
86,952
|
||||||
|
Interest expense
|
26,759
|
34,263
|
42,424
|
50,423
|
40,770
|
|||||||||||
|
Net interest income
|
50,963
|
48,878
|
42,596
|
44,114
|
46,182
|
|||||||||||
|
Provision for loan losses
|
58,545
|
23,064
|
3,876
|
3,606
|
531
|
|||||||||||
|
Net interest income (loss) after provision for loan losses
|
(7,582
|
)
|
25,814
|
38,720
|
40,508
|
45,651
|
||||||||||
|
Noninterest income
|
15,549
|
10,167
|
11,051
|
9,511
|
9,636
|
|||||||||||
|
Noninterest expense
|
54,309
|
49,810
|
106,662
|
39,037
|
36,678
|
|||||||||||
|
Net income (loss) before taxes
|
(46,342
|
)
|
(13,829
|
)
|
(56,891
|
)
|
10,982
|
18,609
|
||||||||
|
Income tax expense (benefit)
|
15,124
|
(7,013
|
)
|
(1,207
|
)
|
3,124
|
6,271
|
|||||||||
|
Net income (loss)
|
(61,466
|
)
|
(6,816
|
)
|
(55,684
|
)
|
7,858
|
12,338
|
||||||||
|
Dividends and accretion on preferred stock
|
2,355
|
2,352
|
124
|
–
|
–
|
|||||||||||
|
Net income (loss) attributable to common shareholders
|
$
|
(63,821
|
)
|
$
|
(9,168
|
)
|
$
|
(55,808
|
)
|
$
|
7,858
|
$
|
12,338
|
|||
|
For the Years Ended December 31,
|
|||||||||||||||||
|
2010
|
2009
|
2008
|
2007
|
2006
|
|||||||||||||
|
Per Share Data
|
|||||||||||||||||
|
Net income (loss) – basic
|
$
|
(4.98
|
)
|
$
|
(0.80
|
)
|
$
|
(4.94
|
)
|
$
|
0.69
|
$
|
1.06
|
||||
|
Net income (loss) – diluted
|
(4.98
|
)
|
(0.80
|
)
|
(4.94
|
)
|
0.68
|
1.06
|
|||||||||
|
Book value
|
2.75
|
8.68
|
9.54
|
14.71
|
14.19
|
||||||||||||
|
Tangible book value
|
2.61
|
8.44
|
9.20
|
9.04
|
8.53
|
||||||||||||
|
Common stock dividends
|
–
|
0.32
|
0.32
|
0.32
|
0.24
|
||||||||||||
|
Common shares outstanding
|
12,877,846
|
11,348,117
|
11,238,085
|
11,169,777
|
11,393,990
|
||||||||||||
|
Diluted shares outstanding
|
12,810,905
|
11,470,314
|
11,302,769
|
11,492,728
|
11,683,674
|
||||||||||||
|
Basic shares outstanding
|
12,810,905
|
11,470,314
|
11,302,769
|
11,424,171
|
11,598,502
|
||||||||||||
|
Performance Ratios
|
|||||||||||||||||
|
Return on average shareholders’ equity
|
(47.86
|
)%
|
(4.62
|
)%
|
(32.93
|
)%
|
4.78
|
%
|
7.64
|
%
|
|||||||
|
Return on average assets
|
(3.63
|
)
|
(0.40
|
)
|
(3.52
|
)
|
0.54
|
0.91
|
|||||||||
|
Net interest margin 1
|
3.27
|
3.14
|
3.07
|
3.52
|
3.94
|
||||||||||||
|
Efficiency ratio 2
|
81.65
|
84.36
|
77.30
|
72.80
|
65.71
|
||||||||||||
|
Capital Ratios
|
|||||||||||||||||
|
Tangible equity to tangible assets
|
4.73
|
%
|
7.91
|
%
|
8.77
|
%
|
6.94
|
%
|
7.16
|
%
|
|||||||
|
Tangible common equity to tangible assets
|
2.12
|
5.53
|
6.26
|
6.94
|
7.16
|
||||||||||||
|
Average shareholders’ equity to average total assets
|
7.59
|
8.72
|
10.68
|
11.32
|
11.93
|
||||||||||||
|
Leverage ratio
|
6.45
|
8.94
|
10.58
|
9.10
|
9.42
|
||||||||||||
|
Tier 1 risk-based capital
|
8.07
|
10.16
|
12.17
|
10.19
|
10.76
|
||||||||||||
|
Total risk-based capital
|
9.59
|
11.41
|
13.24
|
11.28
|
11.92
|
||||||||||||
|
Asset Quality Ratios
|
|||||||||||||||||
|
Nonperforming loans to gross loans
|
5.73
|
%
|
2.84
|
%
|
0.73
|
%
|
0.55
|
%
|
0.49
|
%
|
|||||||
|
Nonperforming assets to total assets
|
5.69
|
2.90
|
0.63
|
0.50
|
0.42
|
||||||||||||
|
Allowance for loan losses to gross loans
|
2.87
|
1.88
|
1.18
|
1.24
|
1.32
|
||||||||||||
|
Allowance for loan losses to nonperforming loans
|
50.12
|
66.01
|
162.31
|
226.86
|
272.28
|
||||||||||||
|
Net charge-offs to average loans
|
3.60
|
0.89
|
0.30
|
0.32
|
0.46
|
||||||||||||
|
1
|
Net interest margin is presented on a tax equivalent basis.
|
|
2
|
Efficiency ratio is computed by dividing noninterest expense by the sum of net interest income and noninterest income, net of the goodwill impairment charge in 2008.
|
ITEM 7. MANAGEMENT’S DISCUSSION AND ANALYSIS OF FINANCIAL CONDITION AND RESULTS OF OPERATIONS
The following discussion and analysis is intended to aid the reader in understanding and evaluating the results of operations and financial condition of the Company and its consolidated subsidiaries. As described above, the Trusts are not consolidated with the financial statements of the Company. This discussion is designed to provide more comprehensive information about the major components of the Company’s results of operations and financial condition, liquidity, and capital resources than can be obtained from reading the financial statements alone. This discussion should be read in conjunction with, and is qualified in its entirety by reference to, the Company’s consolidated financial statements, including the related notes thereto presented elsewhere in this report.
Overview
Capital Bank is a full-service state chartered community bank conducting business throughout North Carolina. The Bank operates through four North Carolina regions: Triangle, Sandhills, Triad and Western. The Bank was incorporated on May 30, 1997 and opened its first branch in June of that same year in Raleigh, North Carolina. In 1999, the shareholders of the Bank approved the reorganization of the Bank into a bank holding company. In 2001, the Company received approval to become a financial holding company. As of December 31, 2010, the Company conducted no business other than holding stock in the Bank and each of the Trusts.
The Bank’s business consists principally of attracting deposits from the general public and investing these funds in loans secured by commercial real estate, secured and unsecured commercial and consumer loans, single-family residential mortgage loans and home equity lines. As a community bank, the Bank’s profitability depends primarily upon its levels of net interest income, which is the difference between interest income from interest-earning assets and interest expense on interest-bearing liabilities. When interest-earning assets approximate or exceed interest-bearing liabilities, any positive interest rate spread will generate net interest income.
The Bank’s profitability is also affected by its provision for loan losses, noninterest income and other operating expenses. Noninterest income primarily consists of service charges and ATM fees, debit card transaction fees, fees generated from originating mortgage loans, commission income generated from brokerage activity, and the increase in cash surrender value of bank-owned life insurance, or BOLI. Operating expenses primarily consist of employee compensation and benefits, occupancy related expenses, depreciation and maintenance expenses on furniture and equipment, data processing and telecommunications, advertising and public relations, professional fees, other real estate and loan-related losses, FDIC deposit insurance and other noninterest expenses.
The Bank’s operations are influenced significantly by local economic conditions and by policies of financial institution regulatory authorities. The Bank’s cost of funds is influenced by interest rates on competing investments and by rates offered on similar investments by competing financial institutions in our market area, as well as general market interest rates. Lending activities are affected by the demand for financing, which in turn is affected by the prevailing interest rates.
Transaction with North American Financial Holdings, Inc.
On January 28, 2011, the Company completed the issuance and sale to North American Financial Holdings, Inc. of 71,000,000 shares of common stock for $181,050,000 in cash. As a result of the Investment and following the completion of the Rights Offering on March 11, 2011, NAFH currently owns approximately 83% of the Company’s common stock. The Company’s shareholders approved the issuance of such shares to NAFH, and an amendment to the Company’s articles of incorporation to increase the authorized shares of common stock to 300,000,000 shares from 50,000,000 shares, at a special meeting of shareholders held on December 16, 2010. In connection with the Investment, each existing Company shareholder received one contingent value right per share that entitles the holder to receive up to $0.75 in cash per CVR at the end of a five-year period based on the credit performance of the Bank’s existing loan portfolio.
Also in connection with the Investment, pursuant to an agreement among NAFH, the Treasury, and the Company, the Company’s Series A Preferred Stock and warrant to purchase shares of common stock issued by the Company to the Treasury in connection with the TARP were repurchased. Following the TARP Repurchase, the Series A Preferred Stock and warrant are no longer outstanding, and accordingly the Company no longer expects to be subject to the restrictions imposed by the terms of the Series A Preferred Stock, or certain regulatory provisions of the EESA and the ARRA that are imposed on TARP recipients.
Pursuant to the Investment Agreement, shareholders as of January 27, 2011 received non-transferable rights to purchase a number of shares of the Company’s common stock proportional to the number of shares of common stock held by such holders on such date, at a purchase price equal to $2.55 per share, subject to certain limitations. 1,613,165 shares of the Company’s common stock were issued in exchange for $4,113,570.75 upon completion of the Rights Offering on March 11, 2011.
Upon closing of the investment, R. Eugene Taylor, NAFH’s Chief Executive Officer, Christopher G. Marshall, NAFH’s Chief Financial Officer, and R. Bruce Singletary, NAFH’s Chief Risk Officer, were named as the Company’s CEO, CFO and CRO, respectively, and members of the Company’s Board of Directors. In addition to the aforementioned members of NAFH management, the Company’s Board of Directors was reconstituted with a combination of two existing members (Oscar A. Keller III and Charles F. Atkins) and two additional NAFH-designated members (Peter N. Foss and William A. Hodges).
Critical Accounting Policies and Estimates
The following discussion and analysis of the Company’s financial condition and results of operations are based on the Company’s consolidated financial statements, which have been prepared in accordance with accounting principles generally accepted in the United States (“U.S. GAAP”). The preparation of these financial statements requires the Company to make estimates and judgments regarding uncertainties that affect the reported amounts of assets, liabilities, revenues and expenses, and related disclosure of contingent assets and liabilities. On an ongoing basis, the Company evaluates its estimates, including those related to the allowance for loan losses, other-than-temporary impairment on investment securities, income taxes, and impairment of long-lived assets. The Company bases its estimates on historical experience and on various other assumptions that are believed to be reasonable under the circumstances, the results of which form the basis for making judgments about the carrying values of assets and liabilities that are not readily apparent from other sources. However, because future events and their effects cannot be determined with certainty, actual results may differ from these estimates under different assumptions or conditions, and the Company may be exposed to gains or losses that could be material.
The Company’s significant accounting policies are discussed below and in Item 8, Financial Statements and Supplementary Data, Notes to Consolidated Financial Statements – Note 1. Management believes that the following accounting policies are the most critical to aid in fully understanding and evaluating the Company’s reported financial results, and they require management’s most difficult, subjective or complex judgments, resulting from the need to make estimates about the effect of matters that are inherently uncertain. Management has reviewed these critical accounting policies and related disclosures with the Audit Committee of the Board of Directors.
|
•
|
Allowance for Loan Losses – The allowance for loan losses represents management’s estimate of probable credit losses that are inherent in the existing loan portfolio. Management’s calculation of the allowance for loan losses consists of reserves on loans individually evaluated for impairment and reserves on loans collectively evaluated for impairment. Specific reserves, or charge-offs, are applied to individually impaired loans based on estimated fair value. Reserves on collectively evaluated loans are determined by applying loss rates to pools of loans that are grouped according to loan type and internal risk ratings. Loss rates are based on historical loss experience in each pool and management’s consideration of certain environmental factors such as levels of and trends in delinquencies, impaired loans and classified assets; levels of and trends in charge-offs and recoveries; trends in nature, volume and terms of loans; existence of and changes in portfolio concentrations; changes in national, regional and local economic conditions; changes in the experience, ability and depth of lending management; changes in the quality of the loan review system; and the effect of other external factors such as legal and regulatory requirements. If economic conditions were to decline significantly or the financial condition of the Bank’s customers were to deteriorate, additional increases to the allowance for loan losses may be required.
|
|
|
•
|
Other-Than-Temporary Impairment on Investment Securities – Management evaluates each held-to-maturity and available-for-sale investment security in an unrealized loss position for other-than-temporary impairment based on an analysis of the facts and circumstances of each individual investment, which includes consideration of changes in general market conditions and changes in the financial strength of specific bond issuers. For debt securities determined to be other-than-temporarily impaired, the impairment is separated into the following: (1) the amount representing credit loss and (2) the amount related to all other factors. The amount representing credit loss is calculated based on management’s estimate of future cash flows and recoverability of the investment and is recorded in current earnings. Future adverse changes in market conditions or adverse changes in the financial strength of bond issuers could result in an other-than-temporary impairment charge that may impact earnings.
|
|
|
•
|
Income Tax Valuation Allowance – A valuation allowance is recorded for deferred tax assets if management determines that it is more likely than not that some portion or all of the deferred tax assets will not be realized. Management considers recent and anticipated future taxable income and ongoing prudent and feasible tax planning strategies in determining the need, if any, for a valuation allowance. As of December 31, 2010, the Company recorded a full valuation allowance on its deferred tax assets.
|
|
|
•
|
Impairment of Long-Lived Assets – Long-lived assets, including identified intangible assets other than goodwill, are evaluated for impairment whenever events or changes in circumstances indicate that the carrying value may not be recoverable. An impairment loss is recognized if the sum of the undiscounted future cash flows is less than the carrying amount of the asset. Assets to be disposed of are transferred to other real estate owned and are reported at the lower of the carrying amount or fair value less costs to sell. Future events or circumstances indicating that the carrying value of long-lived assets is not recoverable may require an impairment charge to earnings.
|
Executive Summary
The following is a brief summary of our significant results for the year ended December 31, 2010:
|
•
|
Net loss to common shareholders was ($34.1) million, or ($2.59) per share, in the fourth quarter of 2010 compared with ($7.8) million, or ($0.68) per share, in the fourth quarter of 2009. In 2010, net loss to common shareholders was ($63.8) million, or ($4.98) per share, compared with ($9.2) million, or ($0.80) per share, in 2009.
|
|
|
•
|
Net interest margin was 3.16% in the fourth quarter of 2010 compared with 3.48% in the third quarter of 2010 and 3.25% in the fourth quarter of 2009. In 2010, net interest margin was 3.27% compared with 3.14% in 2009.
|
|
|
•
|
Nonperforming assets, including accruing restructured loans, were 5.98% of total assets as of December 31, 2010 compared with 5.69% as of September 30, 2010 and 4.87% as of December 31, 2009.
|
|
|
•
|
Allowance for loan losses increased to 2.87% of total loans as of December 31, 2010 from 2.74% as of September 30, 2010 and 1.88% as of December 31, 2009.
|
|
|
•
|
Provision for loan losses was $20.0 million in the fourth quarter of 2010 compared with $6.8 million in the third quarter of 2010 and $11.8 million in the fourth quarter of 2009. In 2010, provision for loan losses was $58.5 million compared with $23.1 million in 2009.
|
|
|
•
|
Deferred tax assets were fully reserved with the valuation allowance increasing to $31.8 million as of December 31, 2010 from $8.8 million as of September 30, 2010 and $0 as of December 31, 2009.
|
Results of Operations
Year Ended December 31, 2010 Compared with Year Ended December 31, 2009
Net loss attributable to common shareholders was $63.8 million, or $4.98 per diluted share, in 2010 compared to net loss attributable to common shareholders of $9.2 million, or $0.80 per diluted share, in 2009. Results of operations for 2010 primarily reflect higher net interest income of $2.1 million on an improved net interest margin, an increase of $35.5 million in provision for loan losses, an increase in noninterest expense by $4.5 million, an increase of $5.4 million in noninterest income primarily due to gains on sales of certain investment securities, and higher tax expense resulting from a full valuation allowance on deferred tax assets.
Net Interest Income
Net interest income is the difference between total interest income and total interest expense and is the Company’s principal source of earnings. The amount of net interest income is determined by the volume of interest-earning assets, the level of rates earned on those assets, and the volume and cost of supporting funds. Net interest income increased from $48.9 million for the year ended December 31, 2009 to $51.0 million for the year ended December 31, 2010. Net interest spread is the difference between rates earned on interest-earning assets and the interest paid on deposits and other borrowed funds. Net interest margin is the total of net interest income divided by average earning assets. Average interest-earning assets for the year ended December 31, 2010 were $1.60 billion compared to $1.61 billion for the year ended December 31, 2009, a decrease of 0.4%. On a fully taxable equivalent (“TE”) basis, net interest spread was 3.05% and 2.82% for the years ended December 31, 2010 and 2009, respectively. The net interest margin on a fully TE basis increased to 3.27% for the year ended December 31, 2010 from 3.14% for the year ended December 31, 2009. The yield on average interest-earning assets was 4.93% and 5.27% for the years ended December 31, 2010 and 2009, respectively, while the interest rate on average interest-bearing liabilities for those periods was 1.88% and 2.45%, respectively.
The improvement in net interest margin was primarily due to the significant decline in funding costs through disciplined pricing controls and a declining interest rate environment. Partially offsetting declining funding costs was a significant increase in loans on nonaccrual status and the expiration of an interest rate swap on prime-indexed commercial loans which benefited income in 2009.
The following two tables set forth certain information regarding the Company’s yield on interest-earning assets and cost of interest-bearing liabilities and the component changes in net interest income. The first table, Average Balances, Interest Earned or Paid, and Interest Yields/Rates, reflects the Company’s effective yield on earning assets and cost of funds. Yields and costs are computed by dividing income or expense for the year by the respective daily average asset or liability balance. Changes in net interest income from year to year can be explained in terms of fluctuations in volume and rate. The second table, Rate and Volume Variance Analysis, presents further information on those changes. For each category of interest-earning asset and interest-bearing liability, we have provided information on changes attributable to:
|
•
|
changes in volume, which are changes in average volume multiplied by the average rate for the previous period;
|
|
|
•
|
changes in rates, which are changes in average rate multiplied by the average volume for the previous period;
|
|
|
•
|
changes in rate/volume, which are changes in average rate multiplied by the changes in average volume; and
|
|
|
•
|
total change, which is the sum of the previous columns.
|
Average Balances, Interest Earned or Paid, and Interest Yields/Rates
For the Years Ended December 31, 2010, 2009 and 2008
Tax Equivalent Basis 1
|
2010
|
2009
|
2008
|
||||||||||||||||||||||||||
|
(Dollars in thousands)
|
Average Balance
|
Amount Earned
|
Average Rate
|
Average Balance
|
Amount Earned
|
Average Rate
|
Average Balance
|
Amount Earned
|
Average Rate
|
|||||||||||||||||||
|
Assets
|
||||||||||||||||||||||||||||
|
Loans 2
|
$
|
1,353,191
|
$
|
69,084
|
5.11
|
%
|
$
|
1,316,737
|
$
|
70,412
|
5.35
|
%
|
$
|
1,174,870
|
$
|
72,494
|
6.17
|
%
|
||||||||||
|
Investment securities 3
|
213,402
|
9,986
|
4.68
|
269,240
|
14,483
|
5.38
|
254,216
|
14,026
|
5.52
|
|||||||||||||||||||
|
Interest-bearing deposits
|
38,003
|
89
|
0.23
|
25,312
|
42
|
0.17
|
11,293
|
128
|
1.13
|
|||||||||||||||||||
|
Total interest-earning assets
|
1,604,596
|
$
|
79,159
|
4.93
|
%
|
1,611,289
|
$
|
84,937
|
5.27
|
%
|
1,440,379
|
$
|
86,648
|
6.02
|
%
|
|||||||||||||
|
Cash and due from banks
|
18,149
|
15,927
|
22,477
|
|||||||||||||||||||||||||
|
Other assets
|
103,667
|
83,283
|
133,566
|
|||||||||||||||||||||||||
|
Allowance for loan losses
|
(34,757
|
)
|
(18,535
|
)
|
(13,846
|
)
|
||||||||||||||||||||||
|
Total assets
|
$
|
1,691,655
|
$
|
1,691,964
|
$
|
1,582,576
|
||||||||||||||||||||||
|
Liabilities and Equity
|
||||||||||||||||||||||||||||
|
NOW and money market accounts
|
$
|
327,811
|
$
|
2,794
|
0.85
|
%
|
$
|
363,522
|
$
|
4,527
|
1.25
|
%
|
$
|
336,899
|
$
|
6,655
|
1.98
|
%
|
||||||||||
|
Savings deposits
|
30,555
|
41
|
0.13
|
29,171
|
47
|
0.16
|
29,756
|
122
|
0.41
|
|||||||||||||||||||
|
Time deposits
|
878,068
|
18,247
|
2.08
|
822,003
|
23,463
|
2.85
|
691,140
|
26,265
|
3.80
|
|||||||||||||||||||
|
Total interest-bearing deposits
|
1,236,434
|
21,082
|
1.71
|
1,214,696
|
28,037
|
2.31
|
1,057,795
|
33,042
|
3.12
|
|||||||||||||||||||
|
Repurchase agreements
|
1,564
|
5
|
0.32
|
10,919
|
24
|
0.22
|
29,929
|
387
|
1.29
|
|||||||||||||||||||
|
Borrowed funds
|
150,207
|
4,541
|
3.02
|
143,241
|
5,147
|
3.59
|
168,501
|
7,234
|
4.29
|
|||||||||||||||||||
|
Subordinated debt
|
33,550
|
1,131
|
3.37
|
30,930
|
1,055
|
3.41
|
30,930
|
1,761
|
5.69
|
|||||||||||||||||||
|
Total interest-bearing liabilities
|
1,421,755
|
$
|
26,759
|
1.88
|
%
|
1,399,786
|
$
|
34,263
|
2.45
|
%
|
1,287,155
|
$
|
42,424
|
3.30
|
%
|
|||||||||||||
|
Noninterest-bearing deposits
|
130,944
|
132,535
|
114,982
|
|||||||||||||||||||||||||
|
Other liabilities
|
10,519
|
12,148
|
11,352
|
|||||||||||||||||||||||||
|
Total liabilities
|
1,563,218
|
1,544,469
|
1,413,489
|
|||||||||||||||||||||||||
|
Shareholders’ equity
|
128,437
|
147,495
|
169,087
|
|||||||||||||||||||||||||
|
Total liabilities and shareholders’ equity
|
$
|
1,691,655
|
$
|
1,691,964
|
$
|
1,582,576
|
||||||||||||||||||||||
|
Net interest spread 4
|
3.05
|
%
|
2.82
|
%
|
2.72
|
%
|
||||||||||||||||||||||
|
Tax equivalent adjustment
|
$
|
1,437
|
$
|
1,796
|
$
|
1,628
|
||||||||||||||||||||||
|
Net interest income and net interest margin 5
|
$
|
52,400
|
3.27
|
%
|
$
|
50,674
|
3.14
|
%
|
$
|
44,224
|
3.07
|
%
|
||||||||||||||||
|
1
|
The tax equivalent basis is computed using a federal tax rate of 34%.
|
|
2
|
Loans include mortgage loans held for sale in addition to nonaccrual loans for which accrual of interest has not been recorded.
|
|
3
|
The average balance for investment securities excludes the effect of their mark-to-market adjustment, if any.
|
|
4
|
Net interest spread represents the difference between the average yield on interest-earning assets and the average cost of interest-bearing liabilities.
|
|
5
|
Net interest margin represents net interest income divided by average interest-earning assets.
|
Rate and Volume Variance Analysis
Tax Equivalent Basis 1
|
December 31, 2010 vs. 2009
|
December 31, 2009 vs. 2008
|
|||||||||||||||||||
|
(Dollars in thousands)
|
Rate
Variance
|
Volume
Variance
|
Total
Variance
|
Rate
Variance
|
Volume
Variance
|
Total
Variance
|
||||||||||||||
|
Interest income:
|
||||||||||||||||||||
|
Loans
|
$
|
(3,189
|
)
|
$
|
1,861
|
$
|
(1,328
|
)
|
$
|
(9,671
|
)
|
$
|
7,589
|
$
|
(2,082
|
)
|
||||
|
Investment securities
|
(1,884
|
)
|
(2,613
|
)
|
(4,497
|
)
|
(351
|
)
|
808
|
457
|
||||||||||
|
Interest-bearing deposits
|
17
|
30
|
47
|
(109
|
)
|
23
|
(86
|
)
|
||||||||||||
|
Total interest income
|
(5,056
|
)
|
(722
|
)
|
(5,778
|
)
|
(10,131
|
)
|
8,420
|
(1,711
|
)
|
|||||||||
|
Interest expense:
|
||||||||||||||||||||
|
Savings and interest-bearing demand deposits and other
|
(1,437
|
)
|
(302
|
)
|
(1,739
|
)
|
(2,534
|
)
|
331
|
(2,203
|
)
|
|||||||||
|
Time deposits
|
(6,381
|
)
|
1,165
|
(5,216
|
)
|
(6,537
|
)
|
3,735
|
(2,802
|
)
|
||||||||||
|
Repurchase agreements
|
11
|
(30
|
)
|
(19
|
)
|
(321
|
)
|
(42
|
)
|
(363
|
)
|
|||||||||
|
Borrowed funds
|
(817
|
)
|
211
|
(606
|
)
|
(1,179
|
)
|
(908
|
)
|
(2,087
|
)
|
|||||||||
|
Subordinated debt
|
(12
|
)
|
88
|
76
|
(706
|
)
|
–
|
(706
|
)
|
|||||||||||
|
Total interest expense
|
(8,636
|
)
|
1,132
|
(7,504
|
)
|
(11,277
|
)
|
3,116
|
(8,161
|
)
|
||||||||||
|
Increase (decrease) in net interest income
|
$
|
3,580
|
$
|
(1,854
|
)
|
$
|
1,726
|
$
|
1,146
|
$
|
5,304
|
$
|
6,450
|
|||||||
|
1
|
The tax equivalent basis is computed using a federal tax rate of 34%.
|
Interest income on loans decreased from $70.2 million in 2009 to $68.5 million in 2010, a decline of $1.7 million, or 2.4%. This decrease was primarily due to declining yields on the Company’s loan portfolio, partially offset by growth in average loan balances over the same period. Declining yields on the loan portfolio reduced interest income by $3.2 million in 2010 compared to 2009, and the increase in average loan balances generated $1.9 million in additional interest income. Average loan balances, which yielded 5.11% and 5.35% for the years ended December 31, 2010 and 2009, respectively, increased from $1.32 billion in 2009 to $1.35 billion in 2010. The Company’s interest rate swap on prime-indexed commercial loans, which expired in October 2009, increased loan interest income by $3.5 million for the year ended December 31, 2009, representing a benefit to net interest margin of 0.22%. The Company received no such benefit in 2010.
Interest income on investment securities decreased from $12.9 million in 2009 to $9.2 million in 2010, a decrease of $3.8 million, or 29.1%. This decrease was due to a decline in the size of the investment portfolio coupled with lower fixed income investment yields. Average investment balances, at book value, decreased from $269.2 million for the year ended December 31, 2009 to $213.4 million for the year ended December 31, 2010, and the tax equivalent yield on investment securities decreased from 5.38% to 4.68% over the same period. Average investment balances declined as management sold certain municipal bonds to reduce the duration of its fixed income portfolio earlier in the year and then repositioned its portfolio later in the year to execute certain interest rate risk, liquidity, and tax strategies. Additionally, yields have fallen as prepayments on higher yielding mortgage-backed securities and proceeds from sales of certain long-dated municipal bonds have been re-invested generally at lower rates in shorter-dated U.S. government agency debt and other high quality mortgage bonds issued by U.S. government sponsored entities.
Interest expense decreased from $34.3 million in 2009 to $26.8 million in 2010, a decline of $7.5 million, or 21.9%. This decrease is primarily due to declining interest rates, partially offset by growth in average interest-bearing liability balances. Declining interest rates reduced interest expense by $8.6 million in 2010 compared to 2009, and the increase in average balances resulted in $1.1 million of higher interest expense. Average total interest-bearing deposits, including savings, interest-bearing demand deposits and time deposits, increased from $1.21 billion for the year ended December 31, 2009 to $1.24 billion for the year ended December 31, 2010. The average rate paid on interest-bearing deposits decreased from 2.31% in 2009 to 1.71% in 2010, reflecting disciplined pricing controls and re-pricing of maturing time deposits in a lower interest rate environment. The interest rate on time deposits, which comprised 65.0% of total deposits as of December 31, 2010 and 61.6% of total deposits as of December 31, 2009, decreased from 2.85% in 2009 to 2.08% in 2010.
Average borrowings, including repurchase agreements and subordinated debt, increased from $185.1 million for the year ended December 31, 2009 to $185.3 million for the year ended December 31, 2009. The average rate paid on borrowings decreased from 3.36% in 2009 to 3.06% in 2010.
Provision for Loan Losses
Provision for loan losses totaled $58.5 million for the year ended December 31, 2010 compared with $23.1 million for the year ended December 31, 2009. The loan loss provision increased significantly in 2010 due to higher levels of nonperforming assets, increased charge-offs, and downgrades to risk ratings of certain loans in the portfolio. Net charge-offs increased from $11.8 million, or 0.89% of average loans, in 2009 to $48.6 million, or 3.60% of average loans, in 2010. In the fourth quarter of 2010, net charge-offs totaled $20.2 million, or 6.24% of average loans (annualized),which was an increase from $5.3 million, or 1.52% of average loans (annualized), in the fourth quarter of 2009. Of the fourth quarter 2010 charge-offs, $9.5 million was related to one residential development project in the Company’s Triangle region.
Nonperforming assets, which include nonperforming loans and other real estate, totaled 5.69% of total assets as of December 31, 2010, an increase from 2.90% as of December 31, 2009. Nonperforming assets, including accruing restructured loans, totaled 5.98% of total assets as of December 31, 2010, an increase from 4.87% as of December 31, 2009. Loans past due more than 30 days, excluding nonperforming loans, increased to 1.08% of total loans as of December 31, 2010 compared to 0.67% as of December 31, 2009. The allowance for loan losses increased to 2.87% of total loans as of December 31, 2010 compared with 1.88% as of December 31, 2009. The allowance for loan losses covered 50% of nonperforming loans as of December 31, 2010, which was a decrease from 66% as of December 31, 2009.
Prior to the fourth quarter of 2010, the Company provided specific reserves on many of its impaired loans as part of the allowance for loan losses and charged down impaired loans to estimated fair value only if legal action had begun against a borrower in default or where a “confirmed loss” existed. However, during the fourth quarter of 2010, the Company began charging down all impaired loans to current fair value. This change in practice has not impacted the amount of loan loss provision, since impaired loans are valued the same under both methods, but the change does increase the amount of net charge-offs recorded and decreases the level of allowance for loan losses. As of December 31, 2010 and 2009, the Company had recorded cumulative charge-offs of $17.9 million and $6.7 million, respectively, on impaired loans. If these cumulative charge-offs had instead been recorded as specific reserves, the allowance for loan losses would have increased from 2.87% of total loans to 4.24% of total loans as of December 31, 2010 and would have increased from 1.88% of total loans to 2.35% of total loans as of December 31, 2009.
The elevated provision for loan losses, net charge-offs and nonperforming assets reflect the economic climate in the Company’s primary markets and consistent application of the Company’s policy to recognize losses as they occur. Given significant volatility and rapid changes in current market conditions, management cannot predict its nonperforming loan levels into the future but anticipates that problem loans may remain elevated, or even increase, into 2011 as the Company continues working to resolve problem loans in these challenging market conditions.
Noninterest Income
Noninterest income increased from $10.2 million in 2009 to $15.5 million in 2010, an increase of 52.9%. The following table presents the detail of noninterest income and related changes for the years ended December 31, 2010 and 2009:
|
2010
|
2009
|
$ Change
|
% Change
|
||||||||||
|
(Dollars in thousands)
|
|||||||||||||
|
Noninterest income:
|
|||||||||||||
|
Service charges and other fees
|
$
|
3,311
|
$
|
3,883
|
$
|
(572
|
)
|
(14.7
|
)%
|
||||
|
Bank card services
|
2,020
|
1,539
|
481
|
31.3
|
|||||||||
|
Mortgage origination and other loan fees
|
1,861
|
1,935
|
(74
|
)
|
(3.8
|
)
|
|||||||
|
Brokerage fees
|
963
|
698
|
265
|
38.0
|
|||||||||
|
Bank-owned life insurance
|
699
|
1,830
|
(1,131
|
)
|
(61.8
|
)
|
|||||||
|
Net gain on sale of investment securities
|
5,855
|
173
|
5,682
|
NM
|
|||||||||
|
Net other-than-temporary impairment losses on securities
|
–
|
(498
|
)
|
498
|
(100.0
|
)
|
|||||||
|
Other
|
840
|
607
|
233
|
38.4
|
|||||||||
|
Total noninterest income
|
$
|
15,549
|
$
|
10,167
|
$
|
5,382
|
52.9
|
%
|
The increase in noninterest income was primarily related to net gains of $5.9 million recorded on the sale of investment securities in 2010 as compared to net gains of $173 thousand recorded in 2009. The Company sold a significant portion of its U.S. government agency bond and mortgage-backed securities portfolio and reinvested the proceeds in an effort to reposition the investment portfolio to execute certain interest rate risk management, liquidity, and tax strategies. During the years ended December 31, 2010 and 2009, proceeds received from these sales totaled $202.2 million and $23.5 million, respectively. Included as a reduction to net gain on sale of investment securities in 2009 was a $320 thousand loss on an equity investment in Silverton Bank. Additionally, noninterest income was decreased in 2009 as an other-than-temporary impairment loss was recorded on an investment in trust preferred securities issued by a financial institution.
Also contributing to increased noninterest income, bank card services, which includes interchange fees related to debit card and credit card transactions, increased primarily due to higher debit card usage on consumer products where debit card issuance is optional. Brokerage fees increased as a result of improved sales efforts and market conditions.
Partially offsetting the increase in noninterest income was a nonrecurring BOLI gain of $913 thousand recorded in 2009. Service charge income decreased due to a reduction in the volume of overdrafts and non-sufficient funds transactions. Mortgage origination and other loan fees declined by $74 thousand due to fewer prepayment penalties recognized on business loans, partially offset by increased residential mortgage refinancing activity.
Noninterest Expense
Noninterest expense increased from $49.8 million in 2009 to $54.3 million in 2010, an increase of 9.0%. The following table presents the detail of noninterest expense and related changes for the years ended December 31, 2010 and 2009:
|
2010
|
2009
|
$ Change
|
% Change
|
||||||||||
|
(Dollars in thousands)
|
|||||||||||||
|
Noninterest expense:
|
|||||||||||||
|
Salaries and employee benefits
|
$
|
22,675
|
$
|
22,112
|
$
|
563
|
2.5
|
%
|
|||||
|
Occupancy
|
5,906
|
5,630
|
276
|
4.9
|
|||||||||
|
Furniture and equipment
|
3,183
|
3,155
|
28
|
0.9
|
|||||||||
|
Data processing and telecommunications
|
2,092
|
2,317
|
(225
|
)
|
(9.7
|
)
|
|||||||
|
Advertising and public relations
|
1,887
|
1,610
|
277
|
17.2
|
|||||||||
|
Office expenses
|
1,260
|
1,383
|
(123
|
)
|
(8.9
|
)
|
|||||||
|
Professional fees
|
2,514
|
1,488
|
1,026
|
69.0
|
|||||||||
|
Business development and travel
|
1,350
|
1,244
|
106
|
8.5
|
|||||||||
|
Amortization of core deposit intangible
|
937
|
1,146
|
(209
|
)
|
(18.2
|
)
|
|||||||
|
ORE losses and miscellaneous loan costs
|
5,006
|
1,646
|
3,360
|
204.1
|
|||||||||
|
Directors’ fees
|
1,061
|
1,418
|
(357
|
)
|
(25.2
|
)
|
|||||||
|
FDIC deposit insurance
|
3,846
|
2,721
|
1,125
|
41.3
|
|||||||||
|
Other
|
2,592
|
3,940
|
(1,348
|
)
|
(34.2
|
)
|
|||||||
|
Total noninterest expense
|
$
|
54,309
|
$
|
49,810
|
$
|
4,499
|
9.0
|
%
|
The increase in noninterest expense was primarily due to a $3.4 million increase in other real estate and miscellaneous loan costs, of which $2.2 million was related to increased valuation adjustments to and losses on the sale of other real estate with the remaining increase representing higher loan workout, appraisal and foreclosure costs to resolve problem assets. FDIC deposit insurance expense rose by $1.1 million with a higher deposit insurance assessment rate and a change in risk category as determined by the FDIC.
Further, salaries and employee benefits expense increased by $563 thousand due to lower deferred loan costs, which decrease expense, and increased employee health insurance expense. Occupancy expense increased primarily due to additional overhead costs incurred as new branches were opened in the Triangle region late in 2009. Advertising and public relations expense increased by $277 thousand due in part from radio and television ads promoting the Company’s special financing program for home buyers. Professional fees increased by $1.0 million due to higher legal and consulting expense. Business development and travel expenses increased primarily due to marketing efforts associated with the Company’s withdrawn public stock offering in 2010. While slightly higher, furniture and equipment expense remained relatively consistent.
Partially offsetting the increase in noninterest expense, data processing and telecommunications costs dropped by $225 thousand as the Company realized cost savings through renegotiation of certain vendor contracts. Office expense decreased by $123 thousand primarily due to cost savings initiatives within the Company’s branch network and operations areas. Core deposit intangible amortization decreased by $209 thousand as intangible assets acquired in previous acquisitions are amortized on an accelerated method over the expected benefit of the core deposit premium. Directors’ fees decreased by $357 thousand due to acceleration of benefit payments on a retirement plan upon the death of a former director in 2009 and in part due to the board reduction and reorganization in late 2009. Lastly, other expenses declined as the Company incurred $1.9 million of direct nonrecurring expenses related to its proposed stock offering in 2009. These expenses were recorded in other noninterest expense and primarily represented investment banking, legal and accounting costs related to the proposed offering. The Company also incurred direct nonrecurring expenses related to a separate proposed public stock offering in 2010 that was later withdrawn.
Income Taxes
Income tax expense recorded in the year ended December 31, 2010 was primarily impacted by the valuation allowance recorded against deferred tax assets in 2010. Due to a cumulative three-year, pre-tax loss position, significant net operating losses in 2010, and ongoing stress on the Company’s financial performance from elevated credit losses, the Company fully reserved its deferred tax assets as of December 31, 2010 with a valuation allowance of $31.8 million. A cumulative loss position makes it more difficult for management to rely on future earnings as a reliable source of future taxable income to realize deferred tax assets. In future periods, the Company may be able to reduce some or all of the valuation allowance upon a determination that it will be able to realize such tax savings.
Year Ended December 31, 2009 Compared with Year Ended December 31, 2008
The Company’s net loss totaled $6.8 million for the year ended December 31, 2009 compared to a net loss of $55.7 million for the year ended December 31, 2008. Net loss attributable to common shareholders was $9.2 million, or $0.80 per diluted share, in 2009 compared to net loss attributable to common shareholders of $55.8 million, or $4.94 per diluted share, in 2008. Results of operations for 2009 primarily reflect higher net interest income of $6.3 million on an improved net interest margin and growth in earning assets, an increase of $19.2 million in provision for loan losses, an increase in noninterest expense (excluding a goodwill impairment charge of $65.2 million in 2008) of $8.3 million, and increased income tax benefits of $5.8 million.
Net Interest Income
Net interest income increased from $42.6 million for the year ended December 31, 2008 to $48.9 million for the year ended December 31, 2009. Average interest-earning assets for the year ended December 31, 2009 were $1.61 billion compared to $1.44 billion for the year ended December 31, 2008, an increase of 11.9%. On a fully TE basis, net interest spread was 2.82% and 2.72% for the years ended December 31, 2009 and 2008, respectively. The net interest margin on a fully TE basis increased to 3.14% for the year ended December 31, 2009 from 3.07% for the year ended December 31, 2008. The yield on average interest-earning assets was 5.27% and 6.02% for the years ended December 31, 2009 and 2008, respectively, while the rate on average interest-bearing liabilities for those periods was 2.45% and 3.30%, respectively.
Interest income on loans decreased from $72.5 million in 2008 to $70.2 million in 2009, a decline of $2.3 million, or 3.2%. This decrease was primarily due to declining yields on the Company’s loan portfolio, partially offset by growth in average loan balances over the same period. Declining yields on the loan portfolio reduced interest income by $9.7 million in 2009 compared to 2008, and the increase in average loan balances generated $7.6 million in additional interest income. Average loan balances, which yielded 5.35% and 6.17% for the years ended December 31, 2009 and 2008, respectively, increased from $1.17 billion in 2008 to $1.32 billion in 2009. The Company’s interest rate swap on prime-indexed commercial loans increased loan interest income by $3.5 million and $2.6 million for the years ended December 31, 2009 and 2008, respectively, representing a benefit to net interest margin of 0.22% and 0.18%, respectively.
Interest income on investment securities increased from $12.4 million in 2008 to $12.9 million in 2009, an increase of $523 thousand, or 4.2%. This increase was due to growth in the investment portfolio coupled with lower fixed income investment yields. Average investment balances, at book value, increased from $254.2 million for the year ended December 31, 2008 to $269.2 million for the year ended December 31, 2009 while the tax equivalent yield on investment securities decreased from 5.52% to 5.38% over the same period. These lower investment yields primarily reflect principal paydowns as well as calls and sales of higher yielding mortgage-backed securities and other investments being re-invested at lower market rates.
Interest expense decreased from $42.4 million in 2008 to $34.3 million in 2009, a decline of $8.2 million, or 19.2%. This decrease is primarily due to declining interest rates, partially offset by growth in average interest-bearing liability balances. Declining interest rates reduced interest expense by $11.3 million in 2009 compared to 2008, and the increase in average balances resulted in $3.1 million of higher interest expense. Average total interest-bearing deposits, including savings, interest-bearing demand deposits and time deposits, increased from $1.06 billion for the year ended December 31, 2008 to $1.21 billion for the year ended December 31, 2009. The average rate paid on interest-bearing deposits decreased from 3.12% in 2008 to 2.31% in 2009, primarily due to declining interest rates in the wholesale and retail markets. The interest rate on time deposits, which comprised 61.6% of total deposits as of December 31, 2009 and 61.1% of total deposits as of December 31, 2008, decreased from 3.80% in 2008 to 2.85% in 2009.
Average borrowings, including subordinated debt and repurchase agreements, decreased from $229.4 million for the year ended December 31, 2008 to $185.1 million for the year ended December 31, 2009. The average rate paid on borrowings, including subordinated debt and repurchase agreements, decreased from 4.09% in 2008 to 3.36% in 2009. This decrease reflects the effects of falling interest rates on the Company’s variable rate borrowings.
Provision for Loan Losses
Provision for loan losses was $23.1 million for the year ended December 31, 2009 compared to $3.9 million for the year ended December 31, 2008. The increase in the provision was due to continued deteriorating economic conditions and weakness in local real estate markets which resulted in significantly higher levels of nonperforming assets and impaired loans as well as downgrades to the credit ratings of certain loans in the portfolio. Further, a significant decline in commercial real estate values contributed to higher levels of specific reserves or charge-offs on impaired loans. Net charge-offs increased from $3.5 million, or 0.30% of average loans, in 2008 to $11.8 million, or 0.89% of average loans, in 2009.
Nonperforming assets, which include nonperforming loans and other real estate, totaled 2.90% of total assets as of December 31, 2009, an increase from 0.63% as of December 31, 2008. Nonperforming assets, including accruing restructured loans, totaled 4.87% of total assets as of December 31, 2009, an increase from 0.99% as of December 31, 2008. Loans past due more than 30 days, excluding nonperforming loans, increased to 0.67% of total loans as of December 31, 2009 compared to 0.42% as of December 31, 2008. The allowance for loan losses increased to 1.88% of total loans as of December 31, 2009 compared with 1.18% as of December 31, 2008. The allowance for loan losses covered 66% of nonperforming loans as of December 31, 2009, which was a decrease from 162% as of December 31, 2008.
Noninterest Income
Noninterest income decreased from $11.1 million in 2008 to $10.2 million in 2009, a decrease of 8.0%. The following table presents the detail of noninterest income and related changes for the years ended December 31, 2009 and 2008:
|
2009
|
2008
|
$ Change
|
% Change
|
||||||||||
|
(Dollars in thousands)
|
|||||||||||||
|
Noninterest income:
|
|||||||||||||
|
Service charges and other fees
|
$
|
3,883
|
$
|
4,545
|
$
|
(662
|
)
|
(14.6
|
)%
|
||||
|
Bank card services
|
1,539
|
1,332
|
207
|
15.5
|
|||||||||
|
Mortgage origination and other loan fees
|
1,935
|
2,148
|
(213
|
)
|
(9.9
|
)
|
|||||||
|
Brokerage fees
|
698
|
732
|
(34
|
)
|
(4.6
|
)
|
|||||||
|
Bank-owned life insurance
|
1,830
|
952
|
878
|
92.2
|
|||||||||
|
Gain on sale of branch
|
–
|
374
|
(374
|
)
|
(100.0
|
)
|
|||||||
|
Net gain on sale of investment securities
|
173
|
249
|
(76
|
)
|
(30.5
|
)
|
|||||||
|
Net other-than-temporary impairment losses on securities
|
(498
|
)
|
–
|
(498
|
)
|
NM
|
|||||||
|
Other
|
607
|
719
|
(112
|
)
|
(15.6
|
)
|
|||||||
|
Total noninterest income
|
$
|
10,167
|
$
|
11,051
|
$
|
(884
|
)
|
(8.0
|
)%
|
Contributing to the decrease in noninterest income was a gain of $374 thousand recorded on the sale of the Company’s Greensboro branch in 2008. In 2009, the Company recorded an other-than-temporary credit impairment charge of $498 thousand related to an investment in trust preferred securities issued by a financial institution. Following an analysis of the financial condition of the issuer and a decision by the issuer to suspend interest payments on the securities, management determined the unrealized loss to be credit related and therefore wrote the securities down to estimated fair market value with the loss charged to earnings.
Service charge income, which includes overdraft and non-sufficient funds charges, decreased primarily from a decline in consumer spending during the recent economic recession. Bank card services, which includes income received from debit card transactions, increased primarily due to checking account growth. Mortgage origination and other loan fees include origination fees from brokered mortgage loans as well as prepayment penalties and other miscellaneous loan fees that are not recorded to interest income. Mortgage fees increased by $330 thousand, which was primarily a result of higher levels of brokered mortgage originations benefited by a continued favorable interest rate environment for residential mortgage refinancing and home purchase activity. Other loan fees declined by $543 thousand due to a drop in prepayment penalties charged as fewer business loans were prepaid. Brokerage fees declined with increased concerns about the economic recession and volatility in the stock markets. Partially offsetting the noninterest income decline was an increase in BOLI income, which was primarily due to collection of a policy claim in 2009.
Noninterest Expense
Noninterest expense decreased from $106.7 million in 2008 to $49.8 million in 2009, a decrease of 53.3%. The following table presents the detail of noninterest expense and related changes for the years ended December 31, 2009 and 2008:
|
2009
|
2008
|
$ Change
|
% Change
|
||||||||||
|
(Dollars in thousands)
|
|||||||||||||
|
Noninterest expense:
|
|||||||||||||
|
Salaries and employee benefits
|
$
|
22,112
|
$
|
20,951
|
$
|
1,161
|
5.5
|
%
|
|||||
|
Occupancy
|
5,630
|
4,458
|
1,172
|
26.3
|
|||||||||
|
Furniture and equipment
|
3,155
|
3,135
|
20
|
0.6
|
|||||||||
|
Data processing and telecommunications
|
2,317
|
2,135
|
182
|
8.5
|
|||||||||
|
Advertising and public relations
|
1,610
|
1,515
|
95
|
6.3
|
|||||||||
|
Office expenses
|
1,383
|
1,317
|
66
|
5.0
|
|||||||||
|
Professional fees
|
1,488
|
1,479
|
9
|
0.6
|
|||||||||
|
Business development and travel
|
1,244
|
1,393
|
(149
|
)
|
(10.7
|
)
|
|||||||
|
Amortization of core deposit intangible
|
1,146
|
1,037
|
109
|
10.5
|
|||||||||
|
ORE losses and miscellaneous loan costs
|
1,646
|
898
|
748
|
83.3
|
|||||||||
|
Directors’ fees
|
1,418
|
1,044
|
374
|
35.8
|
|||||||||
|
FDIC deposit insurance
|
2,721
|
685
|
2,036
|
297.2
|
|||||||||
|
Goodwill impairment charge
|
–
|
65,191
|
(65,191
|
)
|
(100.0
|
)
|
|||||||
|
Other
|
3,940
|
1,424
|
2,516
|
176.7
|
|||||||||
|
Total noninterest expense
|
$
|
49,810
|
$
|
106,662
|
$
|
(56,852
|
)
|
(53.3
|
)%
|
The primary reason for the significant decline in noninterest expense was the $65.2 million goodwill impairment charge in 2008.
Salaries and employee benefits rose primarily due to increased staffing requirements as new branches were opened during 2008 and 2009 in addition to the four branches purchased in the Fayetteville market during December 2008. Regular salaries and wages increased by $3.0 million as the average number of full-time equivalent employees increased from 342 in 2008 to 390 in 2009. Partially offsetting increased costs from additional headcount was a reduction in bonus expense of $1.0 million and 401(k) plan employer match expense of $385 thousand as the Company suspended its incentive plan and retirement plan matching contributions in light of market conditions. Further, deferred loan costs increased by $863 thousand which resulted in decreased salaries expense. Loan cost deferrals are applied to each loan originated and renewed based on an estimated cost to process and underwrite those originations and renewals. Deferred costs increase the loan balance and are amortized as a component of interest income through the maturity of the respective loans.
Occupancy expense increased primarily from higher levels of facilities costs related to new branch locations but also from higher rent due to sale-leaseback agreements transactions on three existing branch facilities in September 2008. While slightly higher, furniture and equipment expense, advertising and public relations expense, office expenses, and professional fees remained relatively consistent from 2008 to 2009. Data processing and communications costs rose as management continued to update the Company’s technology infrastructure to support business growth. Business development and travel costs declined as management continued to closely monitor and control discretionary spending and as a second partner was recruited to sublease the corporate airplane. Core deposit intangible amortization increased from additional amortization required on the core deposit intangible recognized as part of the acquisition of four Fayetteville branches in December 2008.
Other real estate and miscellaneous loan costs increased $748 thousand, of which $241 thousand was related to increased valuation adjustments to and losses on the sale of other real estate, with the remaining increase representing higher loan workout, appraisal and foreclosure costs to resolve problem assets. Directors’ fees increased largely from an accelerated payout of deferred compensation benefits upon the death of a former director. FDIC deposit insurance expense increased partially due to a mandatory special assessment of $765 thousand charged and collected in 2009. The remaining increase in FDIC deposit insurance expense was due to deposit growth as well as increases in assessment rates charged by the FDIC to cover higher monitoring costs and losses from insured financial institutions taken into receivership. The Company incurred $1.9 million of direct nonrecurring expenses related to its recent proposed public stock offering that was withdrawn in January 2010. These expenses are recorded in other noninterest expense and represent investment banking, due diligence, legal and accounting costs as well as other miscellaneous filing and printing costs related to the proposed offering. The Company also recognized a loss of $361 thousand, which was recorded in other noninterest expense, related to the repurchase of a mortgage loan previously sold to an investor in the secondary market.
Income Taxes
The Company’s income tax benefit increased from $1.2 million for the year ended December 31, 2008 to $7.0 million for the year ended December 31, 2009. This increase was due primarily to a larger pre-tax loss in 2009 compared to 2008, excluding the goodwill impairment charge in 2008. Also partially contributing to the increased tax benefit was a nonrecurring benefit of $504 thousand recorded from income tax refunds from federal and state tax authorities upon the amendment of multiple tax returns from previous years. These amended returns were filed during the third quarter of 2009 following a thorough review by the Company’s tax professionals of previously filed federal and state tax returns. The Company’s effective tax rate was 50.7% and 2.1% for the years ended December 31, 2009 and 2008, respectively. The increased effective tax rate was related to higher levels of tax exempt income relative to the pre-tax loss in each year. The goodwill impairment charge also significantly reduced the Company’s effective tax rate in 2008.
Analysis of Financial Condition
Overview
The Company’s financial condition is measured in terms of its asset and liability composition as well as asset quality. The fluctuation and composition of the balance sheet in 2010 reflected a decline in the loan portfolio as the Company focused on resolving problem loans and preserving capital.
Total assets as of December 31, 2010 were $1.59 billion, a decrease of $149.1 million from $1.73 billion as of December 31, 2009. Earning assets, which represented 97.0% and 94.6% of total assets as of December 31, 2010 and 2009, respectively, decreased from $1.64 billion as of December 31, 2009 to $1.54 billion as of December 31, 2010. Loans declined from $1.39 billion as of December 31, 2009 to $1.25 billion as of December 31, 2010, a decrease of 9.8%. The declining loan portfolio reflected an effort by the Company to de-leverage its balance sheet to preserve capital and reduce its exposure to certain sectors of the commercial real estate market. Allowance for loan losses was $36.1 million as of December 31, 2010 compared to $26.1 million as of December 31, 2009, representing approximately 2.87% and 1.88%, respectively, of total loans.
Total investment securities decreased by $22.2 million in 2010 as management sold certain municipal bonds to reduce the duration of its fixed income portfolio earlier in the year and then repositioned its portfolio later in the year to execute certain interest rate risk, liquidity, and tax strategies. The Company’s portfolio also experienced relatively high levels of paydowns on U.S. government sponsored mortgage-backed securities. The cash surrender value of BOLI policies decreased by $15.8 million after the Company surrendered certain BOLI contracts on former employees and directors in 2010 for the purpose of repositioning the BOLI portfolio for capital, liquidity and tax planning purposes. Deferred tax assets declined by $12.1 million in 2010 as the Company recorded a full valuation allowance on its deferred tax position.
Total deposits declined from $1.38 billion as of December 31, 2009 to $1.34 billion as of December 31, 2010, a decrease of 2.52%. Savings accounts and time deposits increased by $1.7 million and $24.6 million, respectively, during 2010 while checking accounts and money market accounts decreased by $14.3 million and $46.7 million, respectively. Time deposits represented 65.0% of total deposits at December 31, 2010 compared to 61.6% at December 31, 2009. Borrowings and securities sold under agreements to repurchase decreased by $52.5 million in 2010 as the Company paid off certain borrowings with increased liquidity from paydowns on loans and investment securities as well as the surrender of certain BOLI contracts. Subordinated debt increased by $3.4 million in 2010 from the private placement offering of investment units consisting of subordinated debt and common stock in the first quarter of the year.
Total shareholders’ equity decreased from $139.8 million as of December 31, 2009 to $76.7 million as of December 31, 2010. The Company’s accumulated deficit increased by $63.8 million for the year ended December 31, 2010, reflecting a $61.5 million net loss and dividends and accretion on preferred stock of $2.3 million. Common stock increased primarily due to $5.1 million of net proceeds from the issuance of shares of the Company’s common stock as part of the private placement offering. Accumulated other comprehensive income (loss), which includes the unrealized gain or loss on available-for-sale investment securities, net of tax, was a net unrealized loss of $1.3 million as of December 31, 2010 compared to a net unrealized gain of $4.0 million as of December 31, 2009.
Investment Securities
Investment securities represent the second largest component of earning assets and are used to generate interest income through the employment of excess funds, to provide liquidity, to fund loan demand or deposit liquidation, and to pledge as collateral for FHLB advances, public funds and repurchase agreements, as necessary. The Company’s securities portfolio consists primarily of debt securities issued by U.S. government agencies, mortgage-backed securities issued by Fannie Mae and Freddie Mac, non-agency mortgage-backed securities, municipal bonds, and corporate bonds.
As securities are purchased, they are designated as available for sale or held to maturity based upon management’s intent, which incorporates liquidity needs, interest rate expectations, asset/liability management strategies and capital requirements. In recent years, management has generally identified new securities purchased as available for sale. Investment securities available for sale are carried at their fair value and were in a net unrealized loss position of $2.0 million as of December 31, 2010, a decline from a net unrealized gain position of $6.5 million as of December 31, 2009. Changes to the fair value of available-for-sale investment securities are recorded to other comprehensive income. Investment securities held to maturity are carried at amortized cost and were in a net unrealized loss position of $54 thousand as of December 31, 2009. The Company had no investment securities designated as held to maturity as of December 31, 2010.
As of December 31, 2010 and 2009, the recorded value of investments securities totaled $223.3 million and $245.5 million, respectively, with $215.0 million and $235.4 million, respectively, classified as available for sale and recorded at fair value and $0 and $3.7 million, respectively, classified as held to maturity and recorded at amortized cost. In addition, the Company owned other investments which totaled $8.3 million and $6.4 million as of December 31, 2010 and 2009, respectively. Other investments primarily includes the Company’s investment in FHLB stock which does not have a readily determinable fair value and is recorded at cost and reviewed periodically for impairment. Factors affecting changes in the investment portfolio balance include loan growth, funding levels, interest rates available for reinvestment of maturing securities, and changes to the interest rate yield curve.
The following table reflects the carrying value of the Company’s investment portfolio as of December 31, 2010, 2009 and 2008:
|
2010
|
2009
|
2008
|
||||||||
|
(Dollars in thousands)
|
||||||||||
|
Available for sale:
|
||||||||||
|
U.S. agency obligations
|
$
|
18,934
|
$
|
1,029
|
$
|
5,448
|
||||
|
Municipal bonds
|
21,009
|
72,894
|
70,430
|
|||||||
|
Mortgage-backed securities issued by GSEs
|
165,423
|
151,658
|
181,906
|
|||||||
|
Non-agency mortgage-backed securities
|
6,587
|
7,797
|
5,809
|
|||||||
|
Other securities
|
3,038
|
2,048
|
3,063
|
|||||||
|
214,991
|
235,426
|
266,656
|
||||||||
|
Held to maturity:
|
||||||||||
|
U.S. agency obligations
|
–
|
–
|
–
|
|||||||
|
Municipal bonds
|
–
|
300
|
300
|
|||||||
|
Mortgage-backed securities issued by GSEs
|
–
|
1,576
|
2,103
|
|||||||
|
Non-agency mortgage-backed securities
|
–
|
1,800
|
2,791
|
|||||||
|
–
|
3,676
|
5,194
|
||||||||
|
Other investments
|
8,301
|
6,390
|
6,288
|
|||||||
|
$
|
223,292
|
$
|
245,492
|
$
|
278,138
|
|||||
On at least a quarterly basis, the Company completes an other-than-temporary impairment (“OTTI”) assessment of its investment portfolio. The Company considers many factors, including the severity and duration of the impairment and recent events specific to the issuer or industry, including any changes in credit ratings.
In the year ended December 31, 2009, losses on 3 securities were determined to represent OTTI. The first of these investments was a private label mortgage security with a book value and unrealized loss of $699,000 and ($212,000), respectively, as of December 31, 2010 compared with a book value and unrealized loss of $810,000 and ($381,000), respectively, as of December 31, 2009. This impairment determination was based on the extent and duration of the unrealized loss as well as credit rating downgrades from rating agencies to below investment grade. Based on its analysis of expected cash flows, management expects to receive all contractual principal and interest from this security and therefore did not consider any of the unrealized loss to represent credit impairment. The second of these investments was subordinated debt of a community bank with a book value and unrealized loss of $1.0 million and ($202,000), respectively, as of both December 31, 2010 and 2009. This impairment determination was based on the extent of the unrealized loss as well as recent adverse economic and market conditions for community banks in general. Based on its review of capital, liquidity and earnings of this institution, management expects to receive all contractual principal and interest from this security and therefore did not consider any of the unrealized loss to represent credit impairment. Unrealized losses from these two investments were related to factors other than credit and were recorded to other comprehensive income. The third of these investments was an investment in trust preferred securities of a community bank with a par value of $1.0 million. This investment was determined to be credit impaired and was written down to estimated fair value with a $498,000 charge to income in the year ended December 31, 2009.
The following table summarizes the gross unrealized losses and fair value of the Company’s investments in an unrealized loss position for which OTTI has not been recognized in income, aggregated by investment category and length of time that individual securities have been in a continuous unrealized loss position, as of December 31, 2010:
|
Less than 12 Months
|
12 Months or Greater
|
Total
|
|||||||||||||||||
|
(Dollars in thousands)
|
Fair Value
|
Unrealized Losses
|
Fair Value
|
Unrealized Losses
|
Fair Value
|
Unrealized Losses
|
|||||||||||||
|
Available for sale:
|
|||||||||||||||||||
|
U.S. agency obligations
|
$
|
8,916
|
$
|
87
|
$
|
–
|
$
|
–
|
$
|
8,916
|
$
|
87
|
|||||||
|
Municipal bonds
|
14,886
|
1,134
|
2,453
|
387
|
17,339
|
1,521
|
|||||||||||||
|
Mortgage-backed securities issued by GSEs
|
14,473
|
195
|
–
|
–
|
14,473
|
195
|
|||||||||||||
|
Non-agency mortgage-backed securities
|
–
|
–
|
4,183
|
242
|
4,183
|
242
|
|||||||||||||
|
Other securities
|
–
|
–
|
2,536
|
214
|
2,536
|
214
|
|||||||||||||
|
Total at December 31, 2010
|
$
|
38,275
|
$
|
1,416
|
$
|
9,172
|
$
|
843
|
$
|
47,447
|
$
|
2,259
|
|||||||
As of December 31, 2010, unrealized losses on the Company’s investments in non-agency mortgage-backed securities, or private label mortgage securities, are related to 4 different securities. These losses are due to a combination of changes in credit spreads and other market factors. These mortgage securities are not issued or guaranteed by an agency of the federal government but are instead issued by private financial institutions and therefore carry an element of credit risk. Management closely monitors the performance of these securities and the underlying mortgages, which includes a detailed review of credit ratings, prepayment speeds, delinquency rates, default rates, current loan-to-values, geography of collateral, remaining terms, interest rates, loan types, etc. The Company has engaged a third party expert to provide a quarterly “stress test” of each private label mortgage security through a model using assumptions to simulate certain credit events and recessionary conditions and their impact on the performance and expected cash flows of each mortgage security.
Unrealized losses on the Company’s investments in municipal bonds are related to 30 different securities. These losses are primarily related to concerns in the marketplace regarding credit quality of certain municipalities in light of the recent economic recession and high unemployment rates as well as expectations of future market interest rates. Management monitors the underlying credit of these bonds by reviewing the financial strength of the issuers and the sources of taxes and other revenues available to service the debt. Unrealized losses on other securities relate to an investment in subordinated debt of one corporate financial institution. Management monitors the financial strength of this institution by reviewing its quarterly financial reports and considers its capital, liquidity and earnings in this review.
The securities in an unrealized loss position as of December 31, 2010 not previously determined to have OTTI continue to perform and are expected to perform through maturity, and the issuers have not experienced significant adverse events that would call into question their ability to repay these debt obligations according to contractual terms. Further, because the Company does not intend to sell these investments and it is not more likely than not that the Company will be required to sell the investments before recovery of their amortized cost bases, which may be maturity, the Company does not consider unrealized losses on such securities to represent OTTI as of December 31, 2010.
The table below reflects the carrying value and weighted average yield on debt securities by final contractual maturities as of December 31, 2010. Expected maturities will differ from contractual maturities because borrowers may have the right to call or prepay obligations with or without call or prepayment penalties.
|
Less Than
1 Year
|
1–5 Years
|
5–10 Years
|
More Than
10 Years
|
Total
|
|||||||||||||||||||||||||||||
|
Amount
|
Yield
|
Amount
|
Yield
|
Amount
|
Yield
|
Amount
|
Yield
|
Other
|
Amount
|
Yield
|
|||||||||||||||||||||||
|
(Dollars in thousands)
|
|||||||||||||||||||||||||||||||||
|
Available for Sale:
|
|||||||||||||||||||||||||||||||||
|
U.S. agency securities
|
$
|
–
|
–
|
%
|
$
|
15,962
|
1.07
|
%
|
$
|
2,972
|
2.14
|
%
|
$
|
–
|
–
|
%
|
$
|
–
|
$
|
18,934
|
1.24
|
%
|
|||||||||||
|
Municipal bonds 1
|
301
|
4.52
|
1,880
|
5.14
|
555
|
6.29
|
18,273
|
6.09
|
–
|
21,009
|
6.00
|
||||||||||||||||||||||
|
MBSs issued by GSEs
|
–
|
–
|
62
|
5.16
|
43,707
|
2.00
|
121,654
|
2.89
|
–
|
165,423
|
2.66
|
||||||||||||||||||||||
|
Non-agency MBSs
|
–
|
–
|
–
|
–
|
1,369
|
4.79
|
5,218
|
4.98
|
–
|
6,587
|
4.94
|
||||||||||||||||||||||
|
Corporate bonds 2
|
–
|
–
|
–
|
–
|
798
|
3.80
|
502
|
–
|
–
|
1,300
|
2.53
|
||||||||||||||||||||||
|
Other securities
|
–
|
–
|
–
|
–
|
–
|
–
|
–
|
–
|
1,738
|
1,738
|
–
|
||||||||||||||||||||||
|
Total
|
$
|
301
|
4.52
|
%
|
$
|
17,904
|
1.51
|
%
|
$
|
49,401
|
2.16
|
%
|
$
|
145,647
|
3.36
|
%
|
$
|
1,738
|
$
|
214,991
|
2.90
|
%
|
|||||||||||
|
1
|
Municipal bonds shown at tax equivalent yield computed using a federal tax rate of 34%.
|
|
2
|
Corporate bond due after ten years is an other-than-temporarily impaired corporate bond for which the Company is no longer accruing interest.
|
As of December 31, 2010, the projected weighted average life of the Company’s U.S. agency bonds, municipal bonds and mortgage-backed securities was 2.1 years, 10.7 years and 4.4 years, respectively, assuming a flat interest rate environment.
Loans
Total loans were $1.25 billion and $1.39 billion as of December 31, 2010 and 2009, respectively. The declining loan portfolio reflects an effort by the Company to de-leverage its balance sheet to preserve capital and reduce its exposure to certain sectors of the commercial real estate market. As of December 31, 2010, commercial real estate (non-owner occupied), consumer real estate, commercial owner occupied, commercial and industrial, consumer non-real estate and other loans (including agriculture and municipal loans) amounted to $634.5 million, $263.0 million, $170.5 million, $145.4 million, $6.2 million, and $33.7 million, respectively. As of December 31, 2009, such loans amounted to $697.8 million, $262.5 million, $194.4 million, $183.7 million, $9.7 million, and $41.9 million, respectively.
The loan portfolio is comprised mainly of loans to small- and mid-sized businesses as well as individuals located within the Company’s four primary markets: Triangle, Sandhills, Triad and Western regions. The economic trends of the areas in North Carolina served by the Company are influenced by the significant businesses and industries within these regions. The ultimate collectability of the Company’s loan portfolio is highly susceptible to changes in the market conditions of these geographic regions.
The following table reflects contractual maturities and weighted average yields by maturity category as of December 31, 2010:
|
Less Than
1 Year
|
1–5 Years
|
More Than
5 Years
|
Total
|
|||||||||||||||||||||
|
Amount
|
Yield
|
Amount
|
Yield
|
Amount
|
Yield
|
Amount
|
Yield
|
|||||||||||||||||
|
(Dollars in thousands)
|
||||||||||||||||||||||||
|
Commercial real estate – non-owner occupied
|
$
|
298,681
|
5.25
|
%
|
$
|
312,998
|
5.70
|
%
|
$
|
22,851
|
6.47
|
%
|
$
|
634,530
|
5.52
|
%
|
||||||||
|
Consumer real estate
|
25,360
|
5.57
|
65,772
|
6.20
|
171,823
|
4.39
|
262,955
|
4.96
|
||||||||||||||||
|
Commercial real estate – owner occupied
|
24,414
|
5.99
|
125,998
|
6.07
|
20,058
|
6.36
|
170,470
|
6.09
|
||||||||||||||||
|
Commercial and industrial
|
70,124
|
5.29
|
70,586
|
5.32
|
4,725
|
6.25
|
145,435
|
5.34
|
||||||||||||||||
|
Consumer
|
1,814
|
6.24
|
2,863
|
7.46
|
1,486
|
9.24
|
6,163
|
7.53
|
||||||||||||||||
|
Other
|
5,380
|
5.56
|
4,401
|
6.13
|
23,961
|
4.70
|
33,742
|
5.02
|
||||||||||||||||
|
Total
|
$
|
425,773
|
5.32
|
%
|
$
|
582,618
|
5.80
|
%
|
$
|
244,904
|
4.84
|
%
|
$
|
1,253,295
|
5.45
|
%
|
||||||||
The following table reflects the mixture of commercial loans and weighted average yields by rate type for notes with contractual maturities greater than one year as of December 31, 2010:
|
Fixed Rate
|
Floating Rate
|
Adjustable Rate
|
Total
|
|||||||||||||||||||||
|
Amount
|
Yield
|
Amount
|
Yield
|
Amount
|
Yield
|
Amount
|
Yield
|
|||||||||||||||||
|
(Dollars in thousands)
|
||||||||||||||||||||||||
|
Due after 1 year:
|
||||||||||||||||||||||||
|
Commercial real estate – non-owner occupied
|
$
|
169,117
|
6.42
|
%
|
$
|
164,304
|
5.07
|
%
|
$
|
2,428
|
5.27
|
%
|
$
|
335,849
|
5.75
|
%
|
||||||||
|
Commercial real estate – owner occupied
|
126,773
|
6.42
|
16,258
|
4.06
|
3,025
|
3.86
|
146,056
|
6.11
|
||||||||||||||||
|
Commercial and industrial
|
26,652
|
6.56
|
42,106
|
4.89
|
6,553
|
3.72
|
75,311
|
5.38
|
||||||||||||||||
|
Total
|
$
|
322,542
|
6.43
|
%
|
$
|
222,668
|
4.96
|
%
|
$
|
12,006
|
4.07
|
%
|
$
|
557,216
|
5.79
|
%
|
||||||||
Given the nature of the Company’s primary markets, a significant portion of the loan portfolio is secured by commercial real estate. As of December 31, 2010, approximately 51% of the loan portfolio had non-owner occupied commercial real estate as a primary component of collateral. The real estate collateral in each case provides an alternate source of repayment in the event of default by the borrower. Real estate values in many markets have declined over the past year, which may continue to negatively impact the ability of certain borrowers to repay their loans. The Company continues to thoroughly review and monitor its commercial real estate concentration and sets limits by sector and region based on this internal review.
Although potentially beneficial to the lender and the borrower, the use of interest reserves carries certain risks. Of particular concern is the possibility that an interest reserve may not accurately reflect problems with a borrower’s willingness or ability to repay the debt consistent with the terms and conditions of the loan obligation. For example, a project that is not completed in a timely manner or falters once completed may appear to perform if the interest reserve keeps the loan current. In some cases, a lender may extend, renew or restructure the term of certain loans, providing additional interest reserves to keep the loan current. As a result, the financial condition of the project may not be apparent and developing problems may not be addressed in a timely manner. Consequently, a lender may end up with a matured loan where the interest reserve has been fully advanced, and the borrower’s financial condition has deteriorated. In addition, the project may not be complete, its sale or lease-up may not be sufficient to ensure timely repayment of the debt or the value of the collateral may have declined, exposing the lender to increasing credit losses.
To mitigate risks related to the use of interest reserves, the Company follows an interest reserve policy approved by its Board of Directors which sets underwriting standards for loans with interest reserves. These policies include loan-to-value, or LTV, limits as well as guarantor strength and equity requirements. Additionally, strict monitoring requirements are followed. LTV limits have been established based on regulatory guidelines for each loan type, and interest reserve loans with an LTV (using an updated independent appraisal) exceeding those limits are generally placed on nonaccrual status.
As of December 31, 2010, the Company had a total of 28 loans funded by an interest reserve with total outstanding balances of $48.0 million, representing approximately 4% of total outstanding loans. Total commitments on these loans equaled $55.2 million with total remaining interest reserves of $1.3 million, representing a weighted average term of approximately 7 months of remaining interest coverage. The following table summarizes the Company’s residential and commercial acquisition, development and construction, or ADC, loans with active interest reserves as of December 31, 2010 and 2009:
|
Outstanding
Balance
|
Unfunded
Commitments
|
Number
of Loans
|
Remaining
Interest
Reserves
|
Balance on
Nonaccrual
|
||||||||||||
|
(Dollars in thousands)
|
||||||||||||||||
|
December 31, 2010
|
||||||||||||||||
|
Residential ADC
|
$
|
12,702
|
$
|
1,009
|
14
|
$
|
351
|
$
|
3,311
|
|||||||
|
Commercial ADC
|
35,281
|
6,174
|
14
|
974
|
–
|
|||||||||||
|
Total 1
|
$
|
47,983
|
$
|
7,183
|
28
|
$
|
1,325
|
3,311
|
||||||||
|
December 31, 2009
|
||||||||||||||||
|
Residential ADC
|
$
|
69,698
|
$
|
5,370
|
31
|
$
|
1,449
|
$
|
7,099
|
|||||||
|
Commercial ADC
|
72,565
|
31,169
|
19
|
3,547
|
–
|
|||||||||||
|
Total 1
|
$
|
142,263
|
$
|
36,539
|
50
|
$
|
4,996
|
7,099
|
||||||||
|
1
|
Excludes loans where interest reserves have previously been depleted and the borrower is paying from other sources.
|
Nonperforming Assets and Impaired Loans
Loans are generally classified as nonaccrual if they are past due as to maturity or payment of principal or interest for a period of more than 90 days, unless such loans are well secured and in the process of collection. If a loan or a portion of a loan is classified as doubtful or as partially charged off, the loan is generally classified as nonaccrual. Loans that are on a current payment status or past due less than 90 days may also be classified as nonaccrual if repayment in full of principal and/or interest is in doubt. Loans may be returned to accrual status when all principal and interest amounts contractually due (including arrearages) are reasonably assured of repayment within an acceptable period of time, and there is a sustained period of repayment performance of interest and principal by the borrower in accordance with the contractual terms.
The following table presents an analysis of nonperforming assets as of December 31, 2010 and 2009:
|
2010
|
2009
|
||||||
|
(Dollars in thousands)
|
|||||||
|
Nonperforming assets:
|
|||||||
|
Nonperforming loans:
|
|||||||
|
Commercial real estate
|
$
|
53,371
|
$
|
25,593
|
|||
|
Consumer real estate
|
3,758
|
3,330
|
|||||
|
Commercial owner occupied
|
8,198
|
6,607
|
|||||
|
Commercial and industrial
|
5,830
|
3,974
|
|||||
|
Consumer
|
6
|
8
|
|||||
|
Other loans
|
781
|
–
|
|||||
|
Total nonperforming loans
|
71,944
|
39,512
|
|||||
|
Other real estate:
|
|||||||
|
Construction, land development, and other land
|
10,797
|
2,863
|
|||||
|
1-4 family residential properties
|
4,529
|
2,060
|
|||||
|
1-4 family residential properties sold with 100% financing
|
1,004
|
3,314
|
|||||
|
Commercial properties
|
1,086
|
1,199
|
|||||
|
Closed branch office
|
918
|
1,296
|
|||||
|
Total other real estate
|
18,334
|
10,732
|
|||||
|
Total nonperforming assets
|
90,278
|
50,244
|
|||||
|
Performing restructured loans
|
4,463
|
34,177
|
|||||
|
Total nonperforming assets and restructured loans
|
$
|
94,741
|
$
|
84,421
|
|||
|
Asset quality ratios:
|
|||||||
|
Nonperforming loans to total loans
|
5.73
|
%
|
2.84
|
%
|
|||
|
Nonperforming assets to total assets
|
5.69
|
2.90
|
|||||
|
Nonperforming assets and restructured loans to total assets
|
5.98
|
4.87
|
|||||
|
Allowance for loan losses to total loans
|
2.87
|
1.88
|
|||||
|
Allowance for loan losses to nonperforming loans
|
50.12
|
66.01
|
|||||
Other real estate, which includes foreclosed assets and other real property held for sale, increased to $18.3 million as of December 31, 2010 from $10.7 million as of December 31, 2009. As of December 31, 2010, other real estate included $918 thousand of real estate from a closed branch office held for sale and included $1.0 million of residential properties sold to individuals prior to December 31, 2010 where the Company financed 100% of the purchase price of the home at closing. These financed properties will remain in other real estate until regular payments are made by the borrowers that total at least 5% of the original purchase price, which is expected to occur in early 2011, at which time the property will be moved out of other real estate and into the performing mortgage loan portfolio.
The remaining increase in other real estate was primarily due to the repossession of commercial and residential real estate in 2010. The Company is actively marketing all of its foreclosed properties. Such properties are adjusted to fair value upon transfer of the loans or premises to other real estate. Subsequently, these properties are carried at the lower of carrying value or updated fair value. The Company obtains updated appraisals and/or internal evaluations for all other real estate. The Company considers all other real estate to be classified as Level 2 fair value estimates based on current appraised values as of December 31, 2010.
Individually impaired loans primarily consist of nonperforming loans and troubled debt restructurings (“TDRs”) but can include other loans identified by management as being impaired. Individually impaired loans totaled $76.5 million and $77.3 million as of December 31, 2010 and 2009, respectively. The following table summarizes the Company’s individually impaired loans and performing TDRs as of December 31, 2010 and 2009:
|
2010
|
2009
|
||||||
|
(Dollars in thousands)
|
|||||||
|
Impaired loans:
|
|||||||
|
Impaired loans with related allowance for loan losses
|
$
|
2,378
|
$
|
58,509
|
|||
|
Impaired loans for which the full loss has been charged off
|
74,141
|
18,756
|
|||||
|
Total impaired loans
|
76,519
|
77,265
|
|||||
|
Allowance for loan losses related to impaired loans
|
(529
|
)
|
(6,112
|
)
|
|||
|
Net carrying value of impaired loans
|
$
|
75,990
|
$
|
71,153
|
|||
|
Performing TDRs:
|
|||||||
|
Commercial real estate
|
$
|
3,856
|
$
|
27,532
|
|||
|
Consumer real estate
|
121
|
598
|
|||||
|
Commercial owner occupied
|
421
|
4,633
|
|||||
|
Commercial and industrial
|
65
|
1,288
|
|||||
|
Consumer
|
–
|
126
|
|||||
|
Total performing TDRs
|
$
|
4,463
|
$
|
34,177
|
|||
Loans are classified as TDRs by the Company when certain modifications are made to the loan terms and concessions are granted to the borrowers due to financial difficulty experienced by those borrowers. The Company only restructures loans for borrowers in financial difficulty that have designed a viable business plan to fully pay off all obligations, including outstanding debt, interest, and fees, either by generating additional income from the business or through liquidation of assets. Generally, these loans are restructured to provide the borrower additional time to execute upon their plans. The Company grants concessions by (1) reduction of the stated interest rate for the remaining original life of the debt or (2) extension of the maturity date at a stated interest rate lower than the current market rate for new debt with similar risk. The Company does not generally grant concessions through forgiveness of principal or accrued interest. Restructured loans where a concession has been granted through extension of the maturity date generally include extension of payments in an interest only period, extension of payments with capitalized interest and extension of payments through a forbearance agreement. These extended payment terms are also combined with a reduction of the stated interest rate in certain cases. Success in restructuring loan terms has been mixed but this has proven to be a useful tool in certain situations to protect collateral values and to allow certain borrowers additional time to execute upon defined business plans. In situations where a TDR is unsuccessful and the borrower is unable to follow through with terms of the restructured agreement, the loan is placed on nonaccrual status and continues to be written down to the underlying collateral value.
The Company’s policy with respect to accrual of interest on loans restructured in a TDR follows relevant supervisory guidance. That is, if a borrower has demonstrated performance under the previous loan terms and shows capacity to perform under the restructured loan terms, continued accrual of interest at the restructured interest rate is likely. If a borrower was materially delinquent on payments prior to the restructuring but shows the capacity to meet the restructured loan terms, the loan will likely continue as nonaccrual going forward. Lastly, if the borrower does not perform under the restructured terms, the loan is placed on nonaccrual status. The Company will continue to closely monitor these loans and will cease accruing interest on them if management believes that the borrowers may not continue performing based on the restructured note terms. If a loan is restructured a second time, after previously being classified as a TDR, that loan is automatically placed on nonaccrual status. The Company’s policy with respect to nonperforming loans requires the borrower to make a minimum of six consecutive payments in accordance with the loan terms before that loan can be placed back on accrual status. Further, the borrower must show capacity to continue performing into the future prior to restoration of accrual status.
All TDRs are considered to be individually impaired and are evaluated as such in the quarterly allowance calculation. As of December 31, 2010, there was no allowance for loan losses allocated to TDRs as all of these loans were charged down to estimated fair value. Outstanding nonperforming TDRs totaled $14.0 million as of December 31, 2010.
Allowance for Loan Losses
The allowance for loan losses represents management’s best estimate of probable credit losses that are inherent in the loan portfolio at the balance sheet date and is determined by management through at least quarterly evaluations of the loan portfolio. The allowance calculation consists of reserves on loans individually evaluated for impairment and reserves on loans collectively evaluated for impairment.
The evaluation of the allowance for loan losses is inherently subjective, and management uses the best information available to establish this estimate. However, if factors such as economic conditions differ substantially from assumptions, or if amounts and timing of future cash flows expected to be received on impaired loans vary substantially from the estimates, future adjustments to the allowance for loan losses may be necessary. In addition, various regulatory agencies, as an integral part of their examination process, periodically review the Company’s allowance for loan losses. Such agencies may require the Company to recognize additions to the allowance for loan losses based on their judgments about all relevant information available to them at the time of their examination. Any adjustments to original estimates are made in the period in which the factors and other considerations indicate that adjustments to the allowance for loan losses are necessary.
Management has allocated the allowance for loan losses by loan purpose for the past five years ended December 31, as shown in the following table:
|
As of December 31,
|
||||||||||||||||||||||||||||||
|
2010
|
2009
|
2008
|
2007
|
2006
|
||||||||||||||||||||||||||
|
(Dollars in thousands)
|
Amount
|
% of
Total
Allowance
|
Amount
|
% of
Total
Allowance
|
Amount
|
% of
Total
Allowance
|
Amount
|
% of
Total
Allowance
|
Amount
|
% of
Total
Allowance
|
||||||||||||||||||||
|
Commercial
|
$
|
21,734
|
60
|
%
|
$
|
14,187
|
54
|
%
|
$
|
9,749
|
66
|
%
|
$
|
10,231
|
75
|
%
|
$
|
8,744
|
59
|
%
|
||||||||||
|
Construction
|
11,499
|
32
|
10,343
|
40
|
3,548
|
24
|
1,812
|
13
|
3,276
|
25
|
||||||||||||||||||||
|
Consumer
|
614
|
2
|
481
|
2
|
620
|
4
|
631
|
5
|
408
|
3
|
||||||||||||||||||||
|
Home equity lines
|
1,003
|
3
|
491
|
2
|
570
|
4
|
419
|
3
|
669
|
8
|
||||||||||||||||||||
|
Mortgage
|
1,211
|
3
|
579
|
2
|
308
|
2
|
478
|
4
|
250
|
5
|
||||||||||||||||||||
|
Total
|
$
|
36,061
|
100
|
%
|
$
|
26,081
|
100
|
%
|
$
|
14,795
|
100
|
%
|
$
|
13,571
|
100
|
%
|
$
|
13,347
|
100
|
%
|
||||||||||
The following table presents the allowance for loan losses, allocated according to collateral risk within the loan portfolio consistent with other loan-related disclosures, for the past three years ended December 31:
|
As of December 31,
|
||||||||||||||||||
|
2010
|
2009
|
2008
|
||||||||||||||||
|
(Dollars in thousands)
|
Amount
|
% of
Total
Allowance
|
Amount
|
% of
Total
Allowance
|
Amount
|
% of
Total
Allowance
|
||||||||||||
|
Commercial real estate
|
$
|
20,995
|
58
|
%
|
$
|
14,987
|
58
|
%
|
$
|
6,825
|
46
|
%
|
||||||
|
Consumer real estate
|
4,732
|
13
|
2,383
|
9
|
2,360
|
16
|
||||||||||||
|
Commercial owner occupied
|
3,395
|
9
|
2,650
|
10
|
1,878
|
13
|
||||||||||||
|
Commercial and industrial
|
6,432
|
18
|
5,536
|
21
|
3,233
|
22
|
||||||||||||
|
Consumer
|
354
|
1
|
326
|
1
|
316
|
2
|
||||||||||||
|
Other loans
|
153
|
1
|
199
|
1
|
183
|
1
|
||||||||||||
|
Total
|
$
|
36,061
|
100
|
%
|
$
|
26,081
|
100
|
%
|
$
|
14,795
|
100
|
%
|
||||||
The allowance is established through a provision for loan losses charged to expense. Loans are charged against the allowance for loan losses when management believes that the collectability of the principal is unlikely. The following table presents an analysis of changes in the allowance for loan losses for the previous five years ended December 31:
|
2010
|
2009
|
2008
|
2007
|
2006
|
|||||||||||
|
(Dollars in thousands)
|
|||||||||||||||
|
Allowance for loan losses, beginning of year
|
$
|
26,081
|
$
|
14,795
|
$
|
13,571
|
$
|
13,347
|
$
|
9,592
|
|||||
|
Adjustment for loans acquired in acquisition
|
–
|
–
|
845
|
–
|
7,650
|
||||||||||
|
Net charge-offs:
|
|||||||||||||||
|
Loans charged off:
|
|||||||||||||||
|
Commercial real estate
|
38,220
|
8,026
|
1,991
|
1,292
|
1,278
|
||||||||||
|
Consumer real estate
|
3,923
|
2,016
|
125
|
2,264
|
268
|
||||||||||
|
Commercial and industrial
|
6,639
|
1,903
|
1,658
|
1,265
|
3,541
|
||||||||||
|
Consumer
|
429
|
252
|
794
|
403
|
172
|
||||||||||
|
Other loans
|
209
|
–
|
–
|
28
|
–
|
||||||||||
|
Total charge-offs
|
49,420
|
12,197
|
4,568
|
5,252
|
5,259
|
||||||||||
|
Recoveries of loans previously charged off:
|
|||||||||||||||
|
Commercial real estate
|
664
|
200
|
650
|
455
|
129
|
||||||||||
|
Consumer real estate
|
54
|
107
|
28
|
1,295
|
54
|
||||||||||
|
Commercial and industrial
|
115
|
63
|
316
|
9
|
536
|
||||||||||
|
Consumer
|
22
|
49
|
77
|
111
|
58
|
||||||||||
|
Total recoveries
|
855
|
419
|
1,071
|
1,870
|
777
|
||||||||||
|
Total net charge-offs
|
48,565
|
11,778
|
3,497
|
3,382
|
4,482
|
||||||||||
|
Provision for loan losses
|
58,545
|
23,064
|
3,876
|
3,606
|
587
|
||||||||||
|
Allowance for loan losses, end of year
|
$
|
36,061
|
$
|
26,081
|
$
|
14,795
|
$
|
13,571
|
$
|
13,347
|
|||||
|
Net charge-offs to average loans during the year
|
3.60
|
%
|
0.89
|
%
|
0.30
|
%
|
0.32
|
%
|
0.46
|
%
|
|||||
Loans Individually Evaluated for Impairment
A loan is considered individually impaired, based on current information and events, if it is probable that the Company will be unable to collect the scheduled payments of principal and interest when due according to the contractual terms of the loan agreement. Reserves, or charge-offs, on individually impaired loans that are collateral dependent are based on the fair value of the underlying collateral while reserves, or charge-offs, on loans that are not collateral dependent are based on either an observable market price, if available, or the present value of expected future cash flows discounted at the historical effective interest rate. For certain individually impaired loans on borrower relationships less than $500 thousand, management aggregates these loans based on common risk characteristics and uses historical loss statistics as a means of measuring impairment, or reserves, on those loans. Management evaluates loans that are classified as doubtful, substandard or special mention to determine whether they are individually impaired. This evaluation includes several factors, including review of the loan payment status and the borrower’s financial condition and operating results such as cash flows, operating income or loss, etc.
As of December 31, 2010 and 2009, the recorded investment in impaired loans for which the full loss was charged-off totaled $74.1 million and $18.8 million, respectively, and the aggregate unpaid principal balances of these loans totaled $92.1 million and $25.0 million, respectively. The difference between the recorded investment and unpaid principal balance represents cumulative charge-offs over the life of these impaired loans. As of December 31, 2010 and 2009, the recorded investment in impaired loans with a related allowance totaled $2.4 million and $58.5 million, respectively, with related reserves of $529 thousand and $6.1 million, respectively. In 2009, the Company charged down impaired loans to estimated fair value if legal action had begun against the borrower in default. The remainder of impaired loans was reserved based upon estimated fair value. However, in 2010, the Company changed its practice and currently charges down all individually impaired loans to estimated fair value except for the small group of individually impaired loans on borrower relationships less than $500 thousand that are aggregated for impairment measurement purposes. Given the Company’s concentration in real estate lending, the vast majority of individually impaired loans are collateral dependent and are therefore valued based on underlying collateral values. In the case of unsecured loans that become impaired, unpaid principal balances are fully charged off.
The Company employs a dedicated Special Assets Group that monitors problem loans and formulates collection and/or resolution plans for those borrowers. Special Assets and the lender who underwrote the problem loan remain updated on market conditions and inspect the collateral on a regular basis. If there is reason to believe that collateral values have been negatively affected by market or other forces, an updated appraisal is ordered to assess the change in value. The Company’s management generally seeks to ensure that appraisals are not more than twelve months old for all individually impaired loans.
For most individually impaired loans, the fair value of underlying collateral is estimated based on a current independent appraised value, adjusted for estimated costs to sell. These are considered Level 2 fair value estimates. For certain impaired loans where appraisals are aged or where market conditions have significantly changed since the appraisal date, a further reduction is made to appraised value to arrive at the fair value of collateral. These are considered Level 3 fair value estimates. In other situations, management will use broker price opinions, internal valuations or other valuation sources. These are also considered Level 3 fair value estimates. Estimated fair value on impaired loans totaled $76.0 million as of December 31, 2010. Of this amount, $61.0 million of impaired loans were valued based on current independent appraisals, and $15.0 million of impaired loans were valued based on a combination of adjusted appraised values, internal valuations, and other valuation sources or methods. Internal valuations are used primarily for equipment valuations or for certain real estate valuations where recent home sales data was used to estimate value for similar fully or partially built houses. For any impaired loan where a reserve has previously been established, or where a partial charge-off has been recorded, an updated appraisal that reflects a further decline in value will result in an additional reserve or partial charge-off during the current period.
Loans Collectively Evaluated for Impairment
Reserves on loans collectively evaluated for impairment are determined by applying loss rates to pools of loans that are grouped according to the Company’s two-dimensional risk rating system. The first digit of the risk rating represents the credit quality of the borrower and is used to calculate the probability of default used in the “pooled” reserve calculation, while the second digit represents the loan collateral type and is used to calculate the loss given default also used in the “pooled” reserve calculation. The first digit ranges from 1 to 9, where a higher rating represents higher credit risk, and is selected on the financial strength and overall resources of the borrower, and the second digit is chosen by the type of primary collateral securing the loan.
At the origination of each commercial loan, the loan officer evaluates the relative risk of the loan and assigns a corresponding risk rating based upon completion a standardized risk rating worksheet that is reviewed by management. To ensure that loans are properly risk rated after origination, loan officers are required to re-evaluate assigned risk ratings whenever the borrower’s financial condition or ability to repay their loan changes. At a minimum, risk ratings are reassigned whenever a loan is renewed or modified. Additionally, the Bank employs a loan review department that audits loans based on a defined scope. Loans are reviewed for credit quality, sufficiency of credit and collateral documentation, proper loan approval, covenant, policy and procedure adherence, and continuing accuracy of the loan’s risk rating. The loan review department reports its findings to senior management and the Audit Committee of the Company’s Board of Directors.
In addition to using historical default and charge-off experience for each pool to calculate loss rates on loans collectively evaluated for impairment, management also considers the following environmental factors in establishing these loss rates:
|
•
|
Levels of and trends in delinquencies, impaired loans and classified assets;
|
|
|
•
|
Levels of and trends in charge-offs and recoveries;
|
|
|
•
|
Trends in nature, volume and terms of loans;
|
|
|
•
|
Existence of and changes in portfolio concentrations by product type and geographical location;
|
|
|
•
|
Changes in national, regional and local economic conditions;
|
|
|
•
|
Changes in the experience, ability and depth of lending management;
|
|
|
•
|
Changes in the quality of the loan review system; and
|
|
|
•
|
The effect of other external factors such as legal and regulatory requirements.
|
As of December 31, 2010, the Company used two years of default and charge-off history for purposes of calculating reserves on loans evaluated collectively. Nonperforming loans and net charge-offs have significantly increased over the past two years, particularly in the commercial real estate portfolio, and such increases have directly impacted loss rates and the resulting allowance for loan losses for each loan pool.
Commercial Real Estate Analysis
|
Residential Construction & Development
Loan Analysis by Type:
|
Residential
Land /
Development
|
Residential
Construction
|
Total
|
|||||||
|
(Dollars in thousands)
|
||||||||||
|
December 31, 2010
|
||||||||||
|
Loans outstanding
|
$
|
102,797
|
$
|
77,120
|
$
|
179,917
|
||||
|
Nonaccrual loans
|
35,934
|
3,180
|
39,114
|
|||||||
|
Allowance for loan losses
|
4,975
|
3,996
|
8,971
|
|||||||
|
YTD net charge-offs
|
27,096
|
3,382
|
30,478
|
|||||||
|
Loans outstanding to total loans
|
8.19
|
%
|
6.15
|
%
|
14.34
|
%
|
||||
|
Nonaccrual loans to loans in category
|
34.96
|
4.12
|
21.74
|
|||||||
|
Allowance to loans in category
|
4.84
|
5.18
|
4.99
|
|||||||
|
YTD net charge-offs to average loans in category (annualized)
|
20.41
|
3.80
|
13.75
|
|||||||
|
December 31, 2009
|
||||||||||
|
Loans outstanding
|
$
|
162,733
|
$
|
100,724
|
$
|
263,457
|
||||
|
Nonaccrual loans
|
16,935
|
7,102
|
24,037
|
|||||||
|
Allowance for loan losses
|
7,569
|
1,707
|
9,276
|
|||||||
|
Loans outstanding to total loans
|
11.70
|
%
|
7.24
|
%
|
18.95
|
%
|
||||
|
Nonaccrual loans to loans in category
|
10.41
|
7.05
|
9.12
|
|||||||
|
Allowance to loans in category
|
4.65
|
1.69
|
3.52
|
|||||||
Residential Construction & Development
|
Loan Analysis by Region:
|
Loans
Outstanding
|
Percent of
Total Loans
Outstanding
|
Nonaccrual
Loans
|
Nonaccrual
Loans
to Loans
Outstanding
|
Allowance
for Loan
Losses
|
Allowance
to Loans
Outstanding
|
|||||||||||||
|
(Dollars in thousands)
|
|||||||||||||||||||
|
December 31, 2010
|
|||||||||||||||||||
|
Triangle
|
$
|
134,858
|
74.96
|
%
|
$
|
30,310
|
22.48
|
%
|
$
|
6,898
|
5.12
|
%
|
|||||||
|
Sandhills
|
24,816
|
13.79
|
979
|
3.95
|
1,080
|
4.35
|
|||||||||||||
|
Triad
|
4,584
|
2.55
|
–
|
–
|
417
|
9.10
|
|||||||||||||
|
Western
|
15,659
|
8.70
|
7,825
|
49.97
|
576
|
3.68
|
|||||||||||||
|
Total
|
$
|
179,917
|
100.00
|
%
|
$
|
39,114
|
21.74
|
%
|
$
|
8,971
|
4.99
|
%
|
|||||||
|
December 31, 2009
|
|||||||||||||||||||
|
Triangle
|
$
|
185,319
|
70.34
|
%
|
$
|
14,349
|
7.74
|
%
|
$
|
7,325
|
3.95
|
%
|
|||||||
|
Sandhills
|
31,257
|
11.86
|
–
|
–
|
412
|
1.32
|
|||||||||||||
|
Triad
|
5,509
|
2.09
|
106
|
1.92
|
86
|
1.56
|
|||||||||||||
|
Western
|
41,372
|
15.71
|
9,582
|
23.16
|
1,453
|
3.51
|
|||||||||||||
|
Total
|
$
|
263,457
|
100.00
|
%
|
$
|
24,037
|
9.12
|
%
|
$
|
9,276
|
3.52
|
%
|
|||||||
Commercial Construction & Development
|
and Other CRE
Loan Analysis by Type: |
Commercial Land /
Development
|
Commercial
Construction
|
Multifamily
|
Other Non-
Residential CRE
|
Total
|
|||||||||||
|
(Dollars in thousands)
|
||||||||||||||||
|
December 31, 2010
|
||||||||||||||||
|
Loans outstanding
|
$
|
121,415
|
$
|
49,255
|
$
|
39,831
|
$
|
244,112
|
$
|
454,613
|
||||||
|
Nonaccrual loans
|
11,579
|
–
|
–
|
2,678
|
14,257
|
|||||||||||
|
Allowance for loan losses
|
5,122
|
1,268
|
668
|
4,966
|
12,024
|
|||||||||||
|
YTD net charge-offs
|
1,641
|
(3
|
)
|
10
|
1,061
|
2,709
|
||||||||||
|
Loans outstanding to total loans
|
9.68
|
%
|
3.93
|
%
|
3.18
|
%
|
19.46
|
%
|
36.24
|
%
|
||||||
|
Nonaccrual loans to loans in category
|
9.54
|
–
|
–
|
1.10
|
3.14
|
|||||||||||
|
Allowance to loans in category
|
4.22
|
2.57
|
1.68
|
2.03
|
2.64
|
|||||||||||
|
YTD net charge-offs to average loans in category (annualized)
|
1.31
|
(0.01
|
)
|
0.02
|
0.48
|
0.61
|
||||||||||
|
December 31, 2009
|
||||||||||||||||
|
Loans outstanding
|
$
|
128,745
|
$
|
59,918
|
$
|
43,379
|
$
|
202,295
|
$
|
434,337
|
||||||
|
Nonaccrual loans
|
529
|
–
|
325
|
702
|
1,556
|
|||||||||||
|
Allowance for loan losses
|
1,732
|
462
|
474
|
3,043
|
5,711
|
|||||||||||
|
Loans outstanding to total loans
|
9.26
|
%
|
4.31
|
%
|
3.12
|
%
|
14.55
|
%
|
31.24
|
%
|
||||||
|
Nonaccrual loans to loans in category
|
0.41
|
–
|
0.75
|
0.35
|
0.36
|
|||||||||||
|
Allowance to loans in category
|
1.35
|
0.77
|
1.09
|
1.50
|
1.31
|
|||||||||||
Commercial Construction & Development
|
and Other CRE
Loan Analysis by Region: |
Loans
Outstanding
|
Percent of
Total Loans
Outstanding
|
Nonaccrual
Loans
|
Nonaccrual
Loans
to Loans
Outstanding
|
Allowance
for Loan
Losses
|
Allowance
to Loans
Outstanding
|
|||||||||||||
|
(Dollars in thousands)
|
|||||||||||||||||||
|
December 31, 2010
|
|||||||||||||||||||
|
Triangle
|
$
|
291,377
|
64.09
|
%
|
$
|
13,364
|
4.59
|
%
|
$
|
7,240
|
2.48
|
%
|
|||||||
|
Sandhills
|
66,292
|
14.58
|
815
|
1.23
|
2,504
|
3.78
|
|||||||||||||
|
Triad
|
41,441
|
9.12
|
–
|
–
|
1,122
|
2.71
|
|||||||||||||
|
Western
|
55,503
|
12.21
|
78
|
0.14
|
1,158
|
2.09
|
|||||||||||||
|
Total
|
$
|
454,613
|
100.00
|
%
|
$
|
14,257
|
3.14
|
%
|
$
|
12,024
|
2.64
|
%
|
|||||||
|
December 31, 2009
|
|||||||||||||||||||
|
Triangle
|
$
|
281,664
|
64.85
|
%
|
$
|
361
|
0.13
|
%
|
$
|
3,653
|
1.30
|
%
|
|||||||
|
Sandhills
|
60,593
|
13.95
|
605
|
1.00
|
937
|
1.55
|
|||||||||||||
|
Triad
|
35,987
|
8.29
|
41
|
0.11
|
576
|
1.60
|
|||||||||||||
|
Western
|
56,093
|
12.91
|
549
|
0.98
|
545
|
0.97
|
|||||||||||||
|
Total
|
$
|
434,337
|
100.00
|
%
|
$
|
1,556
|
0.36
|
%
|
$
|
5,711
|
1.31
|
%
|
|||||||
Deposits
Total deposits decreased from $1.38 billion as of December 31, 2009 to $1.34 billion as of December 31, 2010. Of these amounts, $116.1 million and $141.1 million represented noninterest-bearing demand deposits as of December 31, 2010 and 2009, respectively, and $1.23 billion and $1.24 billion represented interest-bearing deposits as of December 31, 2010 and 2009, respectively. Balances in time deposits of $100,000 and greater decreased from $341.4 million as of December 31, 2009 to $327.5 million as of December 31, 2010. The average interest rate on time deposits of $100,000 or greater decreased from 2.74% as of December 31, 2009 to 1.97% as of December 31, 2010.
The following table reflects the scheduled maturities and average rates of time deposits as of December 31, 2010:
|
Time Deposits
$100,000 or Greater
|
Time Deposits
Less than $100,000
|
||||||||||||
|
(Dollars in thousands)
|
Amount
|
Weighted
Average Rate |
Amount
|
Weighted
Average Rate |
|||||||||
|
Three months or less
|
$
|
13,952
|
1.11
|
%
|
$
|
77,004
|
0.64
|
%
|
|||||
|
Over three months to one year
|
28,930
|
1.76
|
114,686
|
1.15
|
|||||||||
|
Over one year to three years
|
253,107
|
1.95
|
315,341
|
1.87
|
|||||||||
|
Over three years
|
31,463
|
2.73
|
38,847
|
2.71
|
|||||||||
|
$
|
327,452
|
1.97
|
%
|
$
|
545,878
|
1.61
|
%
|
||||||
Borrowings and Subordinated Debt
Advances from the FHLB totaled $51.0 million and $49.0 million as of December 31, 2010 and 2009, respectively, and had a weighted average rate of 4.2% and 4.7% as of December 31, 2010 and 2009, respectively. In addition, FHLB overnight borrowings on the Company’s credit line at that institution totaled $20.0 million and $18.0 million as of December 31, 2010 and 2010, respectively. These advances as well as the Company’s credit line with the FHLB were collateralized by eligible 1–4 family mortgages, home equity loans, commercial loans, and mortgage-backed securities. Outstanding structured repurchase agreements totaled $50.0 million as of December 31, 2010 and 2009. These repurchase agreements had a weighted average rate of 4.1% as of December 31, 2010 and 2009 and were collateralized by certain U.S. agency and mortgage-backed securities.
The Company maintains a credit line at the Federal Reserve Bank’s (“FRB”) discount window that is used for short-term funding needs and as an additional source of liquidity. Primary credit borrowings totaled $0 and $50.0 million as of December 31, 2010 and 2009, respectively. These borrowings as well as the Company’s credit line at the discount window were collateralized by eligible commercial construction as well as commercial and industrial loans. The Company had total average outstanding borrowings of $150.2 million and $143.2 million with effective borrowing costs of 3.02% and 3.59% in 2010 and 2009, respectively.
Further, the Company had $34.3 million and $30.9 million of subordinated debentures outstanding as of December 31, 2010 and 2009, respectively. The subordinated debt issues pay interest at varying spreads to 90-day LIBOR, and the effective interest rate was 3.37% and 3.41% in 2010 and 2009, respectively.
Capital Resources
Total shareholders’ equity decreased from $139.8 million as of December 31, 2009 to $76.7 million as of December 31, 2010. The Company’s accumulated deficit increased by $63.8 million for the year ended December 31, 2010, reflecting a $61.5 million net loss and dividends and accretion on preferred stock of $2.3 million. Accumulated other comprehensive income (loss), which includes the unrealized gain or loss on available-for-sale investment securities, net of tax, decreased from a positive $4.0 million as of December 31, 2009 to a negative $1.3 million as of December 31, 2010.
As of December 31, 2010, the Company had a leverage ratio of 6.45%, a Tier 1 capital ratio of 8.07%, and a total risk-based capital ratio of 9.59%. These ratios exceed the federal regulatory minimum requirements for an “adequately capitalized” bank. The Company’s tangible equity to tangible assets ratio decreased from 7.91% as of December 31, 2009 to 4.73% as of December 31, 2010, and its tangible common equity to tangible assets ratio declined from 5.53% as of December 31, 2009 to 2.12% as of December 31, 2010.
Recent Items Impacting Capital Resources
Private Placement Offering of Investment Units
On March 18, 2010, the Company sold 849 investment units (the “Units”) for gross proceeds of $8.5 million. Each Unit was priced at $10,000 and consisted of a $3,996.90 subordinated promissory note and a number of shares of the Company’s common stock valued at $6,003.10. The offering and sale of the Units was limited to accredited investors. As a result of the sale of the Units, the Company sold $3.4 million in aggregate principal amount of subordinated promissory notes due March 18, 2020 (the “Notes”) and 1,468,770 shares of the Company’s common stock valued at $5.1 million. The Company is obligated to pay interest on the Notes at 10% per annum payable in quarterly installments commencing on the third month anniversary of the date of issuance of the Notes. The Company may prepay the Notes at any time after March 18, 2015 subject to approval by the Federal Reserve and compliance with applicable law.
Informal Regulatory Agreement
On October 28, 2010, the Bank entered into an informal Memorandum of Understanding (“MOU”) with the Federal Depository Insurance Corporation and the North Carolina Commissioner of Banks. An MOU is characterized by regulatory authorities as an informal action that is not published or publicly available and that is used when circumstances warrant a milder form of action than a formal supervisory action, such as a formal written agreement or order. In accordance with the terms of the MOU, the Bank has agreed to, among other things, (i) increase regulatory capital to achieve and maintain a minimum Tier 1 leverage capital ratio of at least 8% and a total risk-based capital ratio of at least 12%, (ii) monitor and reduce its commercial real estate concentration, (iii) timely identify and reduce its overall level of problem loans, (iv) establish and maintain an adequate allowance for loan losses, and (v) ensure adherence to loan policy guidelines. In addition, the Bank must obtain regulatory approval prior to paying any dividends to the Company. The MOU will remain in effect until modified, terminated, lifted, suspended or set aside by the regulatory authorities. In addition, the Company consults with the Federal Reserve Bank of Richmond prior to payment of any dividends or interest on debt.
Transaction with North American Financial Holdings, Inc.
On January 28, 2011, the Company completed the issuance and sale to North American Financial Holdings, Inc. (“NAFH”) of 71,000,000 shares of common stock for $181,050,000 in cash (the “Investment”). As a result of the Investment and following the completion of the Rights Offering on March 11, 2011, NAFH currently owns approximately 83% of the Company’s common stock. The Company’s shareholders approved the issuance of such shares to NAFH, and an amendment to the Company’s articles of incorporation to increase the authorized shares of common stock to 300,000,000 shares from 50,000,000 shares, at a special meeting of shareholders held on December 16, 2010. In connection with the Investment, each existing Company shareholder received one contingent value right per share that entitles the holder to receive up to $0.75 in cash per CVR at the end of a five-year period based on the credit performance of the Bank’s existing loan portfolio.
In connection with the investment, pursuant to an agreement among NAFH, the Treasury, and the Company, the Company’s Series A Preferred Stock and warrant to purchase shares of common stock issued by the Company to the Treasury in connection with TARP were repurchased. Following the TARP Repurchase, the Series A Preferred Stock and warrant are no longer outstanding, and accordingly the Company no longer expects to be subject to the restrictions imposed by the terms of its Series A Preferred Stock, or certain regulatory provisions of EESA and ARRA that are imposed on TARP recipients.
Pursuant to the Investment Agreement, shareholders as of January 27, 2011 received non-transferable rights to purchase a number of shares of the Company’s common stock proportional to the number of shares of common stock held by such holders on such date, at a purchase price equal to $2.55 per share, subject to certain limitations. 1,613,165 shares of the Company’s common stock were issued in exchange for $4,113,570.75 upon completion of the Rights Offering on March 11, 2011.
Following the investment by NAFH and subsequent to December 31, 2010, management believes that, based on its preliminary unaudited calculation, the Company and the Bank are “well capitalized” and that the Bank’s regulatory capital ratios are in compliance with its MOU as described above.
Liquidity Management
Liquidity management involves the ability to meet the cash flow requirements of depositors desiring to withdraw funds or borrowers needing assurance that sufficient funds will be available to meet their credit needs. To ensure the Company is positioned to meet immediate and future cash demands, management relies on internal analysis of its liquidity, knowledge of current economic and market trends and forecasts of future conditions. Regulatory agencies set certain minimum liquidity standards, including the setting of a reserve requirement by the FRB. The Company submits weekly reports to the FRB to ensure that it meets those requirements. As of December 31, 2010, the Company met all of its regulatory liquidity requirements.
The Company had $66.7 million in its most liquid assets, cash and cash equivalents as of December 31, 2010. The Company’s principal sources of funds are deposits, borrowings and capital. Core deposits (total deposits less certificates of deposits in the amount of $100,000 or more), one of the most stable sources of liquidity, together with equity capital funded $1.09 billion, or 68.9%, of total assets as of December 31, 2010 compared to $1.18 billion, or 67.8% of total assets as of December 31, 2009.
Changes in the Company’s on-balance sheet liquidity can be demonstrated by an analysis of its cash flows separated by operating activities, investing activities and financing activities. Operating activities generated $9.7 million of liquidity for the year ended December 31, 2010 compared to $10.9 million for the year ended December 31, 2009. The principal elements of operating activities are net income (loss), adjusted for significant noncash expenses such as the provision for loan losses, depreciation, amortization, deferred income taxes and changes in other assets and liabilities. Investing activities generated $109.3 million of cash in the year ended December 31, 2010 compared to $119.5 million used in the year ended December 31, 2009. The principal elements of investing activities are proceeds and principal repayments from investment securities offset by purchases of investment securities, net loan growth, and proceeds from the sale of premises and equipment offset by purchases of premises and equipment. While the Company only has one municipal bond with a final contractual maturity falling within the next 12 months, management expects to receive principal repayments of $48.2 million on its debt securities in 2011. These projected principal repayments include cash flows from regularly scheduled payments on mortgage-backed securities as well as anticipated prepayments on mortgage-backed securities and other debt securities assuming a flat interest rate environment. During 2010, the Company purchased $232.6 million of investment securities, while proceeds from repayments/calls/maturities of investment securities totaled $253.9 million. Financing activities used $81.7 million of cash for the year ended December 31, 2010 compared to $83.7 million generated for the year ended December 31, 2009. The principal elements of financing activities are net deposit growth, proceeds from borrowings offset by principal repayments on borrowings, and issuance of stock offset by repurchases of stock and dividends paid.
In addition to benefiting the Company’s capital position, the investment transaction with NAFH on January 28, 2011 significantly improved the Company’s liquidity position by increasing cash levels due to the cash purchase price of $181,050,000, net of expenses and the TARP repurchase of $41,279,000.
Additional sources of liquidity are available to the Company through the FRB and through membership in the FHLB system. As of December 31, 2010, the Company had a maximum and available borrowing capacity of $91.7 million and $20.7 million, respectively, through the FHLB. These funds can be made available with various maturities and interest rate structures. Borrowings cannot exceed 20% of total assets or 20 times the amount of FHLB stock owned by the borrowing bank. Borrowings with the FHLB are collateralized by a blanket lien on certain qualifying assets. The Company also maintains a credit line at the FRB’s discount window that is used for short-term funding needs and as an additional source of available liquidity. As of December 31, 2010, the Company had a maximum and available borrowing capacity of $77.0 million at the discount window. Available credit at the discount window is collateralized by eligible commercial construction and commercial and industrial loans. The Company also maintains off-balance sheet liquidity from other sources such as federal funds lines, repurchase agreement lines and through brokered deposit sources.
Off-Balance Sheet Arrangements
As part of its normal course of business to meet the financing needs of its customers, the Bank is at times party to financial instruments with off-balance sheet credit risks. These instruments include commitments to extend credit and standby letters of credit. The following table reflects maturities of contractual obligations as of December 31, 2010:
|
Payments Due by Period
|
||||||||||||||||
|
(Dollars in thousands)
|
Less Than
1 Year
|
1–3
Years
|
3–5
Years
|
More Than
5 Years
|
Total
Committed
|
|||||||||||
|
Contractual obligations:
|
||||||||||||||||
|
Borrowings
|
$
|
51,000
|
$
|
3,000
|
$
|
7,000
|
$
|
60,000
|
$
|
121,000
|
||||||
|
Subordinated debentures
|
–
|
–
|
–
|
34,323
|
34,323
|
|||||||||||
|
Operating leases
|
4,112
|
7,977
|
7,440
|
29,747
|
49,276
|
|||||||||||
|
$
|
55,112
|
$
|
10,977
|
$
|
14,440
|
$
|
124,070
|
$
|
204,599
|
|||||||
The following table reflects expirations of off-balance sheet commitments as of December 31, 2010:
|
Amount of Commitment Expiration by Period
|
||||||||||||||||
|
(Dollars in thousands)
|
Less Than
1 Year
|
1–3
Years
|
3–5
Years
|
More Than
5 Years
|
Total
Committed
|
|||||||||||
|
Off-balance sheet commitments:
|
||||||||||||||||
|
Standby letters of credit
|
$
|
10,268
|
$
|
17
|
$
|
–
|
$
|
–
|
$
|
10,285
|
||||||
|
Commitments to extend credit
|
80,525
|
16,924
|
17,058
|
60,811
|
175,318
|
|||||||||||
|
$
|
90,793
|
$
|
16,941
|
$
|
17,058
|
$
|
60,811
|
$
|
185,603
|
|||||||
Impact of Inflation
The Company’s financial statements have been prepared in accordance with U.S. GAAP, which require the measurement of financial position and operating results in terms of historic dollars without consideration for changes in the relative purchasing power of money over time due to inflation. The rate of inflation has been relatively moderate over the past few years and has not materially impacted the Company’s results of operations; however, the effect of inflation on interest rates may in the future materially impact the Company’s operations, which rely on the spread between the yield on earning assets and rates paid on deposits and borrowings as the major source of earnings. Operating costs, such as salaries and wages, occupancy and equipment costs, can also be negatively impacted by inflation.
Recent Accounting Developments
Refer to Item 8. Financial Statements and Supplementary Data, Notes to Consolidated Financial Statements – Note 1, Summary of Significant Accounting Policies, for a discussion of recent accounting developments.
The Company intends to reach its strategic financial objectives through the effective management of market risk. Like many financial institutions, the Company’s most significant market risk exposure is interest rate risk. The Company’s primary goal in managing interest rate risk is to minimize the effect that changes in interest rates have on earnings and capital. This is accomplished through the active management of asset and liability portfolios, which includes the strategic pricing of asset and liability accounts and ensuring a proper maturity combination of assets and liabilities. The goal of these activities is the development of maturity and repricing opportunities in the Company’s portfolios of assets and liabilities that will produce consistent net interest income during periods of changing interest rates. The Company’s Management Risk Committee and Board Risk Committee (referred to collectively as the “Risk Committee”) monitor loan, investment and liability portfolios to ensure comprehensive management of interest rate risk. These portfolios are analyzed to ensure proper fixed- and variable-rate mixes under several interest rate scenarios.
The asset/liability management process is intended to achieve relatively stable net interest margins and to assure adequate capital and liquidity levels by coordinating the amounts, maturities, or repricing opportunities of earning assets, deposits and borrowed funds. The Risk Committee has the responsibility to determine and achieve the most appropriate volume and combination of earning assets and interest-bearing liabilities, and ensure an adequate level of liquidity and capital, within the context of corporate performance objectives. The Risk Committee also sets policy guidelines and establishes long-term strategies with respect to interest rate risk exposure, capital and liquidity. The Risk Committee meets regularly to review the Company’s interest rate risk, capital levels and liquidity positions in relation to present and prospective market and business conditions, and adopts balance sheet management strategies intended to ensure that the potential impact of earnings, capital and liquidity as a result of fluctuations in interest rates is within acceptable guidelines.
When necessary, the Company utilizes derivative financial instruments to manage interest rate risk, to facilitate asset/liability management strategies, and to manage other risk exposures. As of December 31, 2010, the only derivative instruments maintained by the Company were interest rate lock commitments and forward loan sale commitments related to mortgage lending activities.
As a financial institution, most of the Company’s assets and liabilities are monetary in nature. This differs greatly from most commercial and industrial companies’ balance sheets, which are comprised primarily of fixed assets or inventories. Movements in interest rates and actions of the Federal Reserve to regulate the availability and cost of credit have a greater effect on a financial institution’s profitability than do the effects of higher costs for goods and services. Through its balance sheet management function, which is monitored by the Risk Committee, the Company believes it is positioned to respond to changing needs for liquidity, changes in interest rates and inflationary trends.
The Company utilizes an outside asset/liability management advisory firm to help management evaluate interest rate risk and develop asset/liability management strategies. One tool used is a computer simulation model which projects the Company’s performance under different interest rate scenarios. Analyses are prepared monthly, which evaluate the Company’s performance in a base strategy that reflects the Company’s current year operating plan. Three interest rate scenarios (Flat, Rising and Declining) are applied to the base strategy to determine the effect of changing interest rates on net interest income and equity. The analysis completed as of December 31, 2010 indicated that the Company’s interest rate risk exposure and equity at risk exposure over a twelve-month time horizon were within the guidelines established by the Company’s Board of Directors.
The table below measures the impact on net interest income (“NII”) and economic value of equity (“EVE”) of immediate +/- 1.00% and +/- 2.00% changes in interest rates, assuming the interest rate changes occurred on December 31, 2010. Actual results could differ from these estimates.
|
Estimated %
Change in NII (over 12 months
following change)
|
Estimated %
Change in EVE (immediately
following change)
|
||||
|
Changes in rates:
|
|||||
|
+ 2.00%
|
12.6%
|
0.4%
|
|||
|
+ 1.00%
|
2.4%
|
(2.5%)
|
|||
|
No rate change:
|
|
|
|||
|
– 1.00%
|
(1.8%)
|
4.2%
|
|||
|
– 2.00%
|
(5.5%)
|
24.1%
|
As a secondary measure of interest rate sensitivity, the Company also reviews its ratio of cumulative rate sensitive assets to rate sensitive liabilities (“Gap Ratio”). This ratio measures an entity’s balance sheet sensitivity to repricing assets and liabilities. A ratio over 1.0 indicates that an entity may be somewhat asset sensitive, and a ratio under 1.0 indicates that an entity may be somewhat liability sensitive. The table below presents the Company’s Gap Ratio as of December 31, 2010.
|
Cumulative Gap Ratio
|
|||
|
1 year
|
1.89
|
||
|
2 years
|
1.23
|
||
|
3 years
|
0.98
|
||
|
4 years
|
1.02
|
||
|
5 years
|
0.98
|
||
|
Overall
|
1.09
|
The Company is asset sensitive through the one-year and two-year cumulative time periods. Many variable rate loans in the portfolio, while technically subject to immediate repricing in response to changing interest rates, have interest rate floors embedded in the terms of the note agreements. Given the current low prime rate, many of the Company’s variable rate loans will earn interest at the respective floor rates and will function similar to fixed rate loans until the prime rate is increased by a significant amount. The Risk Committee regularly monitors its interest rate sensitivity and reviews additional analysis incorporating the impact of floor rates on its Gap Ratio.
ITEM 8. FINANCIAL STATEMENTS AND SUPPLEMENTARY DATA
CONSOLIDATED BALANCE SHEETS
December 31, 2010 and 2009
|
December 31,
|
|||||||
|
2010
|
2009
|
||||||
|
(Dollars in thousands)
|
|||||||
|
Assets
|
|||||||
|
Cash and cash equivalents:
|
|||||||
|
Cash and due from banks
|
$
|
13,646
|
$
|
25,002
|
|||
|
Interest-bearing deposits with banks
|
53,099
|
4,511
|
|||||
|
Total cash and cash equivalents
|
66,745
|
29,513
|
|||||
|
Investment securities:
|
|||||||
|
Investment securities – available for sale, at fair value
|
214,991
|
235,426
|
|||||
|
Investment securities – held to maturity, at amortized cost
|
–
|
3,676
|
|||||
|
Other investments
|
8,301
|
6,390
|
|||||
|
Total investment securities
|
223,292
|
245,492
|
|||||
|
Mortgage loans held for sale
|
6,993
|
–
|
|||||
|
Loans:
|
|||||||
|
Loans – net of unearned income and deferred fees
|
1,254,479
|
1,390,302
|
|||||
|
Allowance for loan losses
|
(36,061
|
)
|
(26,081
|
)
|
|||
|
Net loans
|
1,218,418
|
1,364,221
|
|||||
|
Other real estate (“ORE”)
|
18,334
|
10,732
|
|||||
|
Premises and equipment, net
|
25,034
|
23,756
|
|||||
|
Bank-owned life insurance
|
6,972
|
22,746
|
|||||
|
Core deposit intangible, net
|
1,774
|
2,711
|
|||||
|
Deferred tax asset
|
–
|
12,096
|
|||||
|
Other assets
|
17,985
|
23,401
|
|||||
|
Total assets
|
$
|
1,585,547
|
$
|
1,734,668
|
|||
|
Liabilities
|
|||||||
|
Deposits:
|
|||||||
|
Demand, noninterest checking
|
$
|
116,113
|
$
|
141,069
|
|||
|
NOW accounts
|
185,782
|
175,084
|
|||||
|
Money market deposit accounts
|
137,422
|
184,146
|
|||||
|
Savings accounts
|
30,639
|
28,958
|
|||||
|
Time deposits
|
873,330
|
848,708
|
|||||
|
Total deposits
|
1,343,286
|
1,377,965
|
|||||
|
Securities sold under agreements to repurchase
|
–
|
6,543
|
|||||
|
Borrowings
|
121,000
|
167,000
|
|||||
|
Subordinated debentures
|
34,323
|
30,930
|
|||||
|
Other liabilities
|
10,250
|
12,445
|
|||||
|
Total liabilities
|
1,508,859
|
1,594,883
|
|||||
|
Shareholders’ Equity
|
|||||||
|
Preferred stock, $1,000 par value; 100,000 shares authorized; 41,279 shares issued and outstanding (liquidation
preference of $41,279) |
40,418
|
40,127
|
|||||
|
Common stock, no par value; 300,000,000 shares authorized; 12,877,846 and 11,348,117 shares issued and outstanding
|
145,594
|
139,909
|
|||||
|
Accumulated deficit
|
(108,027
|
)
|
(44,206
|
)
|
|||
|
Accumulated other comprehensive income (loss)
|
(1,297
|
)
|
3,955
|
||||
|
Total shareholders’ equity
|
76,688
|
139,785
|
|||||
|
Total liabilities and shareholders’ equity
|
$
|
1,585,547
|
$
|
1,734,668
|
|||
The accompanying notes are an integral part of these consolidated financial statements.
CONSOLIDATED STATEMENTS OF OPERATIONS
For the Years Ended December 31, 2010, 2009 and 2008
|
2010
|
2009
|
2008
|
||||||||
|
(Dollars in thousands except per share data)
|
||||||||||
|
Interest income:
|
||||||||||
|
Loans and loan fees
|
$
|
68,474
|
$
|
70,178
|
$
|
72,494
|
||||
|
Investment securities:
|
||||||||||
|
Taxable interest income
|
7,483
|
9,849
|
8,935
|
|||||||
|
Tax-exempt interest income
|
1,596
|
3,026
|
3,169
|
|||||||
|
Dividends
|
80
|
46
|
294
|
|||||||
|
Federal funds and other interest income
|
89
|
42
|
128
|
|||||||
|
Total interest income
|
77,722
|
83,141
|
85,020
|
|||||||
|
Interest expense:
|
||||||||||
|
Deposits
|
21,082
|
28,037
|
33,042
|
|||||||
|
Borrowings and repurchase agreements
|
5,677
|
6,226
|
9,382
|
|||||||
|
Total interest expense
|
26,759
|
34,263
|
42,424
|
|||||||
|
Net interest income
|
50,963
|
48,878
|
42,596
|
|||||||
|
Provision for loan losses
|
58,545
|
23,064
|
3,876
|
|||||||
|
Net interest income (loss) after provision for loan losses
|
(7,582
|
)
|
25,814
|
38,720
|
||||||
|
Noninterest income:
|
||||||||||
|
Service charges and other fees
|
3,311
|
3,883
|
4,545
|
|||||||
|
Bank card services
|
2,020
|
1,539
|
1,332
|
|||||||
|
Mortgage origination and other loan fees
|
1,861
|
1,935
|
2,148
|
|||||||
|
Brokerage fees
|
963
|
698
|
732
|
|||||||
|
Bank-owned life insurance
|
699
|
1,830
|
952
|
|||||||
|
Gain on sale of branch
|
–
|
–
|
374
|
|||||||
|
Other income
|
840
|
607
|
719
|
|||||||
|
Securities gains (losses):
|
||||||||||
|
Realized securities gains, net
|
5,855
|
173
|
249
|
|||||||
|
Other-than-temporary impairments
|
–
|
(1,082
|
)
|
–
|
||||||
|
Less: non-credit portion recognized in other comprehensive income
|
–
|
584
|
–
|
|||||||
|
Total securities gains (losses), net
|
5,855
|
(325
|
)
|
249
|
||||||
|
Total noninterest income
|
15,549
|
10,167
|
11,051
|
|||||||
|
Noninterest expense:
|
||||||||||
|
Salaries and employee benefits
|
22,675
|
22,112
|
20,951
|
|||||||
|
Occupancy
|
5,906
|
5,630
|
4,458
|
|||||||
|
Furniture and equipment
|
3,183
|
3,155
|
3,135
|
|||||||
|
Data processing and telecommunications
|
2,092
|
2,317
|
2,135
|
|||||||
|
Advertising and public relations
|
1,887
|
1,610
|
1,515
|
|||||||
|
Office expenses
|
1,260
|
1,383
|
1,317
|
|||||||
|
Professional fees
|
2,514
|
1,488
|
1,479
|
|||||||
|
Business development and travel
|
1,350
|
1,244
|
1,393
|
|||||||
|
Amortization of core deposit intangible
|
937
|
1,146
|
1,037
|
|||||||
|
ORE losses and miscellaneous loan costs
|
5,006
|
1,646
|
898
|
|||||||
|
Directors’ fees
|
1,061
|
1,418
|
1,044
|
|||||||
|
FDIC deposit insurance
|
3,846
|
2,721
|
685
|
|||||||
|
Goodwill impairment charge
|
–
|
–
|
65,191
|
|||||||
|
Other expenses
|
2,592
|
3,940
|
1,424
|
|||||||
|
Total noninterest expense
|
54,309
|
49,810
|
106,662
|
|||||||
|
Net loss before income taxes
|
(46,342
|
)
|
(13,829
|
)
|
(56,891
|
)
|
||||
|
Income tax expense (benefit)
|
15,124
|
(7,013
|
)
|
(1,207
|
)
|
|||||
|
Net loss
|
(61,466
|
)
|
(6,816
|
)
|
(55,684
|
)
|
||||
|
Dividends and accretion on preferred stock
|
2,355
|
2,352
|
124
|
|||||||
|
Net loss attributable to common shareholders
|
$
|
(63,821
|
)
|
$
|
(9,168
|
)
|
$
|
(55,808
|
)
|
|
|
Net loss per common share – basic
|
$
|
(4.98
|
)
|
$
|
(0.80
|
)
|
$
|
(4.94
|
)
|
|
|
Net loss per common share – diluted
|
$
|
(4.98
|
)
|
$
|
(0.80
|
)
|
$
|
(4.94
|
)
|
|
The accompanying notes are an integral part of these consolidated financial statements.
CONSOLIDATED STATEMENTS OF CHANGES IN SHAREHOLDERS’ EQUITY AND COMPREHENSIVE LOSS
For the Years Ended December 31, 2010, 2009 and 2008
|
Preferred Stock
|
Common Stock
|
Other Comprehensive
Income
|
Retained Earnings
(Accumulated
|
||||||||||||||||||
|
Shares
|
Amount
|
Shares
|
Amount
|
(Loss)
|
Deficit)
|
Total
|
|||||||||||||||
|
(Dollars in thousands)
|
|||||||||||||||||||||
|
Balance at January 1, 2008
|
–
|
$
|
–
|
11,169,777
|
$
|
136,154
|
$
|
161
|
$
|
27,985
|
$
|
164,300
|
|||||||||
|
Comprehensive loss:
|
|||||||||||||||||||||
|
Net loss
|
(55,684
|
)
|
(55,684
|
)
|
|||||||||||||||||
|
Net unrealized loss on investment securities, net of tax benefit of $9
|
(13
|
)
|
(13
|
)
|
|||||||||||||||||
|
Net unrealized gain on cash flow hedge, net of tax of $464
|
738
|
738
|
|||||||||||||||||||
|
Total comprehensive loss
|
(54,959
|
)
|
|||||||||||||||||||
|
Issuance of preferred stock with warrants, net of issuance costs
|
41,279
|
39,827
|
1,333
|
41,160
|
|||||||||||||||||
|
Accretion of preferred stock discount
|
12
|
(12
|
)
|
–
|
|||||||||||||||||
|
Repurchase of common stock
|
(10,166
|
)
|
(92
|
)
|
(92
|
)
|
|||||||||||||||
|
Issuance of common stock for options exercised
|
26,591
|
206
|
206
|
||||||||||||||||||
|
Restricted stock awards
|
24,000
|
288
|
288
|
||||||||||||||||||
|
Stock option expense
|
32
|
32
|
|||||||||||||||||||
|
Modification of directors’ deferred compensation plan
|
943
|
943
|
|||||||||||||||||||
|
Directors’ deferred compensation
|
27,883
|
345
|
345
|
||||||||||||||||||
|
Dividends on preferred stock
|
(112
|
)
|
(112
|
)
|
|||||||||||||||||
|
Dividends on common stock ($0.32 per share)
|
(3,597
|
)
|
(3,597
|
)
|
|||||||||||||||||
|
Balance at December 31, 2008
|
41,279
|
$
|
39,839
|
11,238,085
|
$
|
139,209
|
$
|
886
|
$
|
(31,420
|
)
|
$
|
148,514
|
||||||||
|
Comprehensive loss:
|
|||||||||||||||||||||
|
Net loss
|
(6,816
|
)
|
(6,816
|
)
|
|||||||||||||||||
|
Net unrealized gain on investment securities, net of tax of $3,169
|
5,051
|
5,051
|
|||||||||||||||||||
|
Net unrealized loss on cash flow hedge, net of tax benefit of $1,215
|
(1,936
|
)
|
(1,936
|
)
|
|||||||||||||||||
|
Prior service cost recognized on SERP, net of amortization
|
(46
|
)
|
(46
|
)
|
|||||||||||||||||
|
Total comprehensive loss
|
(3,747
|
)
|
|||||||||||||||||||
|
Accretion of preferred stock discount
|
288
|
(288
|
)
|
–
|
|||||||||||||||||
|
Restricted stock awards
|
16,692
|
107
|
107
|
||||||||||||||||||
|
Stock option expense
|
50
|
50
|
|||||||||||||||||||
|
Directors’ deferred compensation
|
93,340
|
543
|
543
|
||||||||||||||||||
|
Dividends on preferred stock
|
(2,064
|
)
|
(2,064
|
)
|
|||||||||||||||||
|
Dividends on common stock ($0.32 per share)
|
(3,618
|
)
|
(3,618
|
)
|
|||||||||||||||||
|
Balance at December 31, 2009
|
41,279
|
$
|
40,127
|
11,348,117
|
$
|
139,909
|
$
|
3,955
|
$
|
(44,206
|
)
|
$
|
139,785
|
||||||||
|
Comprehensive loss:
|
|||||||||||||||||||||
|
Net loss
|
(61,466
|
)
|
(61,466
|
)
|
|||||||||||||||||
|
Net unrealized loss on investment securities, net of tax benefit of $3,300
|
(5,260
|
)
|
(5,260
|
)
|
|||||||||||||||||
|
Prior service cost recognized on SERP, net of amortization
|
8
|
8
|
|||||||||||||||||||
|
Total comprehensive loss
|
(66,718
|
)
|
|||||||||||||||||||
|
Accretion of preferred stock discount
|
291
|
(291
|
)
|
–
|
|||||||||||||||||
|
Issuance of common stock
|
1,468,770
|
5,065
|
5,065
|
||||||||||||||||||
|
Restricted stock forfeiture
|
(3,508
|
)
|
(10
|
)
|
(10
|
)
|
|||||||||||||||
|
Stock option expense
|
54
|
54
|
|||||||||||||||||||
|
Directors’ deferred compensation
|
64,467
|
576
|
576
|
||||||||||||||||||
|
Dividends on preferred stock
|
(2,064
|
)
|
(2,064
|
)
|
|||||||||||||||||
|
Balance at December 31, 2010
|
41,279
|
$
|
40,418
|
12,877,846
|
$
|
145,594
|
$
|
(1,297
|
)
|
$
|
(108,027
|
)
|
$
|
76,688
|
|||||||
The accompanying notes are an integral part of these consolidated financial statements.
CONSOLIDATED STATEMENTS OF CASH FLOWS
For the Years Ended December 31, 2010, 2009 and 2008
|
2010
|
2009
|
2008
|
||||||||
|
(Dollars in thousands)
|
||||||||||
|
Cash flows from operating activities:
|
||||||||||
|
Net loss
|
$
|
(61,466
|
)
|
$
|
(6,816
|
)
|
$
|
(55,684
|
)
|
|
|
Adjustments to reconcile net loss to net cash provided by operating activities:
|
||||||||||
|
Provision for loan losses
|
58,545
|
23,064
|
3,876
|
|||||||
|
Loss on repurchase of mortgage loans
|
–
|
361
|
–
|
|||||||
|
Amortization of core deposit intangible
|
937
|
1,146
|
1,037
|
|||||||
|
Depreciation
|
2,629
|
2,893
|
2,639
|
|||||||
|
Goodwill impairment charge
|
–
|
–
|
65,191
|
|||||||
|
Stock-based compensation
|
736
|
702
|
477
|
|||||||
|
(Gain) loss on securities, net
|
(5,855
|
)
|
325
|
(249
|
)
|
|||||
|
Amortization of premium on securities, net
|
98
|
180
|
80
|
|||||||
|
Loss on disposal of premises, equipment and other real estate
|
444
|
88
|
81
|
|||||||
|
ORE valuation adjustments
|
2,088
|
217
|
–
|
|||||||
|
Bank-owned life insurance income
|
(699
|
)
|
(378
|
)
|
(779
|
)
|
||||
|
Deferred income tax expense (benefit)
|
15,396
|
(4,708
|
)
|
(3,715
|
)
|
|||||
|
Gain on sale of branch
|
–
|
–
|
(374
|
)
|
||||||
|
Net change in:
|
||||||||||
|
Mortgage loans held for sale
|
(6,993
|
)
|
–
|
–
|
||||||
|
Accrued interest receivable and other assets
|
5,070
|
(5,972
|
)
|
1,344
|
||||||
|
Accrued interest payable and other liabilities
|
(1,279
|
)
|
(220
|
)
|
(1,553
|
)
|
||||
|
Net cash provided by operating activities
|
9,651
|
10,882
|
12,371
|
|||||||
|
Cash flows from investing activities:
|
||||||||||
|
Loan (originations) principal repayments, net
|
68,805
|
(162,132
|
)
|
(124,503
|
)
|
|||||
|
Additions to premises and equipment
|
(3,938
|
)
|
(3,326
|
)
|
(4,750
|
)
|
||||
|
Proceeds from sales of premises, equipment and real estate owned
|
8,350
|
5,686
|
7,693
|
|||||||
|
Proceeds from surrender of bank-owned life insurance
|
16,473
|
–
|
–
|
|||||||
|
Net cash paid in branch sale
|
–
|
–
|
(7,757
|
)
|
||||||
|
Net cash received in business combination
|
–
|
–
|
50,573
|
|||||||
|
(Purchases) sales of FHLB stock, net
|
(1,680
|
)
|
(20
|
)
|
1,272
|
|||||
|
Purchases of securities – available for sale
|
(232,579
|
)
|
(31,842
|
)
|
(91,243
|
)
|
||||
|
Proceeds from sales of securities – available for sale
|
164,012
|
21,703
|
38,359
|
|||||||
|
Proceeds from principal repayments/calls/maturities of securities – available
for sale
|
89,021
|
48,947
|
27,913
|
|||||||
|
Proceeds from principal repayments/calls/maturities of securities – held to maturity
|
853
|
1,503
|
4,824
|
|||||||
|
Net cash provided by (used in) investing activities
|
109,317
|
(119,481
|
)
|
(97,619
|
)
|
|||||
|
Cash flows from financing activities:
|
||||||||||
|
Increase (decrease) in deposits, net
|
(34,679
|
)
|
62,651
|
125,134
|
||||||
|
Decrease in repurchase agreements, net
|
(6,543
|
)
|
(8,467
|
)
|
(24,890
|
)
|
||||
|
Proceeds from borrowings
|
189,000
|
183,000
|
302,600
|
|||||||
|
Principal repayments of borrowings
|
(235,000
|
)
|
(148,000
|
)
|
(335,600
|
)
|
||||
|
Repayment of federal funds purchased
|
–
|
–
|
(5,395
|
)
|
||||||
|
Proceeds from issuance of subordinated debentures
|
3,393
|
–
|
–
|
|||||||
|
Proceeds from issuance of preferred stock
|
–
|
–
|
41,160
|
|||||||
|
Proceeds from issuance of common stock
|
5,065
|
–
|
206
|
|||||||
|
Repurchase of common stock
|
–
|
–
|
(92
|
)
|
||||||
|
Dividends paid
|
(2,972
|
)
|
(5,527
|
)
|
(3,592
|
)
|
||||
|
Net cash provided by (used in) financing activities
|
(81,736
|
)
|
83,657
|
99,531
|
||||||
|
(continued on next page)
|
||||||||||
CAPITAL BANK CORPORATION
CONSOLIDATED STATEMENTS OF CASH FLOWS (Continued)
For the Years Ended December 31, 2010, 2009 and 2008
|
2010
|
2009
|
2008
|
||||||||
|
(Dollars in thousands)
|
||||||||||
|
Net change in cash and cash equivalents
|
$
|
37,232
|
$
|
(24,942
|
)
|
$
|
14,283
|
|||
|
Cash and cash equivalents at beginning of year
|
29,513
|
54,455
|
40,172
|
|||||||
|
Cash and cash equivalents at end of year
|
$
|
66,745
|
$
|
29,513
|
$
|
54,455
|
||||
|
Supplemental Disclosure of Cash Flow Information
|
||||||||||
|
Noncash investing activities:
|
||||||||||
|
Transfers of loans and premises to ORE
|
$
|
18,453
|
$
|
15,356
|
$
|
2,645
|
||||
|
Transfers of securities from held to maturity to available for sale
|
2,822
|
–
|
–
|
|||||||
|
Cash paid for (received from):
|
||||||||||
|
Income taxes
|
$
|
(2,190
|
)
|
$
|
(4,521
|
)
|
$
|
2,815
|
||
|
Interest
|
27,219
|
35,364
|
41,983
|
|||||||
The accompanying notes are an integral part of these consolidated financial statements.
1. Summary of Significant Accounting Policies
Organization and Nature of Operations
Capital Bank Corporation (the “Company”) is a bank holding company incorporated under the laws of North Carolina on August 10, 1998. The Company’s primary wholly-owned subsidiary is Capital Bank (the “Bank”), a state-chartered banking corporation that was incorporated under the laws of North Carolina on May 30, 1997 and commenced operations on June 20, 1997. In addition, the Company has interest in three trusts, Capital Bank Statutory Trust I, II, and III (hereinafter collectively referred to as the “Trusts”).
The Bank is a community bank engaged in general commercial banking, providing a full range of banking services. The majority of the Bank’s customers are individuals and small- to medium-size businesses. The Bank’s primary source of revenue is interest earned from loans to customers, interest earned from invested cash and securities, and noninterest income derived from various fees. The Bank operates 32 branch offices in North Carolina: five branch offices in Raleigh, four in Asheville, four in Fayetteville, three in Burlington, three in Sanford, two in Cary, and one each in Clayton, Graham, Hickory, Holly Springs, Mebane, Morrisville, Oxford, Siler City, Pittsboro, Wake Forest and Zebulon. The Company’s corporate headquarters is located at 333 Fayetteville Street in Raleigh, North Carolina.
The Trusts were formed for the sole purpose of issuing trust preferred securities and are not consolidated with the financial statements of the Company. The proceeds from such issuances were loaned to the Company in exchange for the subordinated debentures, which are the sole assets of the Trusts. A portion of the proceeds from the issuance of the subordinated debentures were used by the Company to repurchase shares of Company common stock. The Company’s obligation under the subordinated debentures constitutes a full and unconditional guarantee by the Company of the Trust’s obligations under the trust preferred securities. The Trusts have no operations other than those that are incidental to the issuance of the trust preferred securities (See Note 9 – Subordinated Debentures).
Transaction with North American Financial Holdings, Inc.
On January 28, 2011, the Company completed the issuance and sale to North American Financial Holdings, Inc. of 71,000,000 shares of common stock for $181,050,000 in cash. As a result of the Investment and following the completion of the Rights Offering on March 11, 2011, NAFH currently owns approximately 83% of the Company’s common stock. The Company’s shareholders approved the issuance of such shares to NAFH, and an amendment to the Company’s articles of incorporation to increase the authorized shares of common stock to 300,000,000 shares from 50,000,000 shares, at a special meeting of shareholders held on December 16, 2010. In connection with the Investment, each existing Company shareholder received one contingent value right per share that entitles the holder to receive up to $0.75 in cash per CVR at the end of a five-year period based on the credit performance of the Bank’s existing loan portfolio.
Also in connection with the Investment, pursuant to an agreement among NAFH, the Treasury, and the Company, the Company’s Series A Preferred Stock and warrant to purchase shares of common stock issued by the Company to the Treasury in connection with the TARP were repurchased. Following the TARP Repurchase, the Series A Preferred Stock and warrant are no longer outstanding, and accordingly the Company no longer expects to be subject to the restrictions imposed by the terms of the Series A Preferred Stock or certain regulatory provisions of the EESA and the ARRA that are imposed on TARP recipients.
Pursuant to the Investment Agreement, shareholders as of January 27, 2011 received non-transferable rights to purchase a number of shares of the Company’s common stock proportional to the number of shares of common stock held by such holders on such date, at a purchase price equal to $2.55 per share, subject to certain limitations. 1,613,165 shares of the Company’s common stock were issued in exchange for $4,113,570.75 upon completion of the Rights Offering on March 11, 2011.
See Note 21 (Subsequent Events) for more details on this transaction.
Consolidation
The consolidated financial statements include the accounts of the Company and its wholly-owned subsidiaries. All significant intercompany accounts and transactions have been eliminated in consolidation. Assets held by the Company in trust are not assets of the Company and are not included in the consolidated financial statements.
Capital Bank Corporation – Notes to Consolidated Financial Statements
Use of Estimates in the Preparation of Financial Statements
The preparation of consolidated financial statements in conformity with accounting principles generally accepted in the United States (“U.S. GAAP”) requires management to make estimates and assumptions that affect the reported amounts of assets and liabilities, and disclosure of contingent assets and liabilities, at the date of the consolidated financial statements, and the reported amounts of revenues and expenses during the reporting period. The more significant estimates that are particularly susceptible to significant change relate to the determination of the allowance for loan losses, other-than-temporary impairment on investment securities, deferred tax asset valuation allowances, and impairment of long-lived assets. Actual results could differ from those estimates.
Cash and Cash Equivalents
Cash and cash equivalents include demand and time deposits (with original maturities of 90 days or less) at other institutions, federal funds sold and other short-term investments. Generally, federal funds are purchased and sold for one-day periods. At times, the Company places deposits with high credit quality financial institutions in amounts, which may be in excess of federally insured limits. Depository institutions are required to maintain reserve and clearing balances with the Federal Reserve Bank (“FRB”). Accordingly, the Company held funds with the FRB to cover daily reserve and clearing balance requirements totaling $5.2 million and $6.1 million as of December 31, 2010 and 2009, respectively.
Investment Securities
Investments in certain securities are classified into three categories and accounted for as follows:
|
•
|
Held to Maturity – Debt securities that the institution has the positive intent and ability to hold to maturity are classified as held to maturity and reported at amortized cost; or
|
|
|
•
|
Trading Securities – Debt and equity securities that are bought and held principally for the purpose of selling in the near term are classified as trading securities and reported at fair value, with unrealized gains and losses included in earnings; or
|
|
|
•
|
Available for Sale – Debt and equity securities not classified as either held-to-maturity securities or trading securities are classified as available-for-sale securities and reported at fair value, with unrealized gains and losses reported as other comprehensive income, a separate component of shareholders’ equity.
|
The initial classification of securities is determined at the date of purchase. Gains and losses on sales of investment securities, computed based on specific identification of the adjusted cost of each security, are included in noninterest income at the time of the sales. Premiums and discounts on debt securities are recognized in interest income using the level interest yield method over the period to maturity, or when the debt securities are called.
At each reporting date, the Company evaluates each held to maturity and available for sale investment security in a loss position for other-than-temporary impairment. The review includes an analysis of the facts and circumstances of each individual investment such as (1) the length of time and the extent to which the fair value has been below cost, (2) changes in the earnings performance, credit rating, asset quality, or business prospects of the issuer, (3) the ability of the issuer to make principal and interest payments, (4) changes in the regulatory, economic, or technological environment of the issuer, and (5) changes in the general market condition of either the geographic area or industry in which the issuer operates.
Regardless of these factors, if the Company has developed a plan to sell the security or it is likely that the Company will be forced to sell the security in the near future, then the impairment is considered other-than-temporary and the carrying value of the security is permanently written down to the current fair value with the difference between the new carrying value and the amortized cost charged to earnings. If the Company does not intend to sell the security and it is not more likely than not that the Company will be required to sell the security before recovery of its amortized cost basis less any current period credit loss, the other-than-temporary impairment is separated into the following: (1) the amount representing the credit loss and (2) the amount related to all other factors. The amount of the total other-than-temporary impairment related to the credit loss is recognized in earnings, and the amount of the total other-than-temporary impairment related to other factors is recognized in other comprehensive income, net of applicable taxes.
Capital Bank Corporation – Notes to Consolidated Financial Statements
Other investments primarily include Federal Home Loan Bank of Atlanta (“FHLB”) stock, which does not have a readily determinable fair value because its ownership is restricted and lacks a market for trading. This investment is carried at cost and is periodically evaluated for impairment.
Mortgage Loans Held for Sale
Loans originated and intended for sale in the secondary market are carried at the lower of cost or estimated fair value. The fair values of mortgage loans held for sale are based on commitments on hand from investors within the secondary market for loans with similar characteristics. Net unrealized losses, if any, are recognized through a valuation allowance by charges to income.
Loans
Loans are stated at the amount of unpaid principal, net of any unearned income, charge-offs, net deferred loan origination fees and costs, and unamortized premiums or discounts. Interest on loans is calculated by using the simple interest method on daily balances of the principal amount outstanding. Deferred loan fees and costs are amortized to interest income over the contractual life of the loan using the level interest yield method.
For disclosures regarding the credit quality of loans and the allowance for loan losses, the loan portfolio is disaggregated into segments and then further disaggregated into classes. A portfolio segment is defined as the level at which an entity develops and documents a systematic method for determining its allowance for credit losses. A class is generally determined based on the initial measurement attribute (i.e. amortized cost or purchased credit impaired), risk characteristics of the loan, and an entity’s method for monitoring and assessing credit risk. Commercial loan portfolio segments include commercial real estate (“CRE”), commercial and industrial (“C&I”), and other loans, which includes agricultural and municipal loans. Classes within CRE include CRE – construction and land development, CRE – non-owner occupied, and CRE – owner occupied. Consumer loan portfolio segments include consumer real estate and other consumer loans. Classes within consumer real estate include residential mortgage and home equity lines of credit.
Nonperforming Assets and Impaired Loans
Loans are considered past due when the contractual amounts due with respect to principal and interest are not received within 30 days of the contractual due date. Loans are generally classified as nonaccrual if they are past due for a period of more than 90 days, unless such loans are well secured and in the process of collection. If a loan or a portion of a loan is classified as doubtful or as partially charged off, the loan is generally classified as nonaccrual. Loans that are on a current payment status or past due less than 90 days may also be classified as nonaccrual if repayment in full of principal and/or interest is in doubt. Loans may be returned to accrual status when all principal and interest amounts contractually due (including arrearages) are reasonably assured of repayment within an acceptable period of time, and there is a sustained period of repayment performance of interest and principal by the borrower in accordance with the contractual terms.
While a loan is classified as nonaccrual and the future collectability of the recorded loan balance is doubtful, collections of interest and principal are generally applied as a reduction to the principal outstanding, except in the case of loans with scheduled amortizations where the payment is generally applied to the oldest payment due. When the future collectability of the recorded loan balance is expected, interest income may be recognized on a cash basis. In the case where a nonaccrual loan had been partially charged off, recognition of interest on a cash basis is limited to that which would have been recognized on the recorded loan balance at the contractual interest rate. Receipts in excess of that amount are recorded as recoveries to the allowance for loan losses until prior charge-offs have been fully recovered.
Assets acquired as a result of foreclosure are recorded at estimated fair value in other real estate. Any excess of cost over estimated fair value at the time of foreclosure is charged to the allowance for loan losses. Valuations are periodically performed on these properties, and any subsequent write-downs are charged to noninterest expense. Routine maintenance and other holding costs are included in noninterest expense.
A loan is classified as a troubled debt restructuring (“TDR”) by the Company when certain modifications are made to the loan terms and concessions are granted to the borrowers due to financial difficulty experienced by those borrowers. The Company only restructures loans for borrowers in financial difficulty that have designed a viable business plan to fully pay off all obligations, including outstanding debt, interest, and fees, either by generating additional income from the business or through liquidation of assets. Generally, these loans are restructured to provide the borrower additional time to execute upon their plans. The Company grants concessions by (1) reduction of the stated interest rate for the remaining original life of the debt or (2) extension of the maturity date at a stated interest rate lower than the current market rate for new debt with similar risk. The Company does not generally grant concessions through forgiveness of principal or accrued interest.
Capital Bank Corporation – Notes to Consolidated Financial Statements
Restructured loans where a concession has been granted through extension of the maturity date generally include extension of payments in an interest only period, extension of payments with capitalized interest and extension of payments through a forbearance agreement. These extended payment terms are also combined with a reduction of the stated interest rate in certain cases. In situations where a TDR is unsuccessful and the borrower is unable to follow through with terms of the restructured agreement, the loan is placed on nonaccrual status and continues to be written down to the underlying collateral value.
The Company’s policy with respect to accrual of interest on loans restructured in a TDR follows relevant supervisory guidance. That is, if a borrower has demonstrated performance under the previous loan terms and shows capacity to perform under the restructured loan terms, continued accrual of interest at the restructured interest rate is likely. If a borrower was materially delinquent on payments prior to the restructuring but shows the capacity to meet the restructured loan terms, the loan will likely continue as nonaccrual going forward. Lastly, if the borrower does not perform under the restructured terms, the loan is placed on nonaccrual status. The Company closely monitors these loans and ceases accruing interest on them if management believes that the borrowers may not continue performing based on the restructured note terms. If a loan is restructured a second time, after previously being classified as a TDR, that loan is automatically placed on nonaccrual status. The Company’s policy with respect to nonperforming loans requires the borrower to make a minimum of six consecutive payments in accordance with the loan terms before that loan can be placed back on accrual status. Further, the borrower must show capacity to continue performing into the future prior to restoration of accrual status.
Allowance for Loan Losses
The allowance for loan losses is established through a provision for loan losses charged to expense. Loans are charged against the allowance for loan losses when management believes that the collectability of principal is unlikely. Subsequent recoveries, if any, are credited to the allowance. The allowance for loan losses represents management’s best estimate of probable credit losses that are inherent in the loan portfolio at the balance sheet date and is determined by management through at least quarterly evaluations of the loan portfolio.
The allowance calculation consists of reserves on loans individually evaluated for impairment and reserves on loans collectively evaluated for impairment. A loan is considered impaired, based on current information and events, if it is probable that the Company will be unable to collect the scheduled payments of principal and interest when due according to the contractual terms of the loan agreement. Reserves, or charge-offs, on individually impaired loans that are collateral dependent are based on the fair value of the underlying collateral while reserves, or charge-offs, on loans that are not collateral dependent are based on either an observable market price, if available, or the present value of expected future cash flows discounted at the historical effective interest rate. Management evaluates loans that are classified as doubtful, substandard or special mention to determine whether or not they are individually impaired. This evaluation includes several factors, including review of the loan payment status and the borrower’s financial condition and operating results such as cash flows, operating income or loss, etc.
Reserves on loans collectively evaluated for impairment are determined by applying loss rates to pools of loans that are grouped according to loan collateral type and credit risk. Loss rates are based on the Company’s historical loss experience in each pool and management’s consideration of the following environmental factors:
|
•
|
Levels of and trends in delinquencies, impaired loans and classified assets;
|
|
|
•
|
Levels of and trends in charge-offs and recoveries;
|
|
|
•
|
Trends in nature, volume and terms of loans;
|
|
|
•
|
Existence of and changes in portfolio concentrations by product type and geographical location;
|
|
|
•
|
Changes in national, regional and local economic conditions;
|
|
|
•
|
Changes in the experience, ability and depth of lending management;
|
|
|
•
|
Changes in the quality of the loan review system; and
|
|
|
•
|
The effect of other external factors such as legal and regulatory requirements.
|
Capital Bank Corporation – Notes to Consolidated Financial Statements
The evaluation of the allowance for loan losses is inherently subjective, and management uses the best information available to establish this estimate. However, if factors such as economic conditions differ substantially from assumptions, or if amounts and timing of future cash flows expected to be received on impaired loans vary substantially from the estimates, future adjustments to the allowance for loan losses may be necessary. In addition, various regulatory agencies, as an integral part of their examination process, periodically review the Company’s allowance for loan losses. Such agencies may require the Company to recognize additions to the allowance for loan losses based on their judgments about all relevant information available to them at the time of their examination. Any adjustments to original estimates are made in the period in which the factors and other considerations indicate that adjustments to the allowance for loan losses are necessary.
Bank-Owned Life Insurance
The Company has purchased life insurance policies on certain key employees and directors. These policies are recorded in other assets at their cash surrender value, or the amount that can be realized. Income from these policies and changes in the net cash surrender value are recorded in noninterest income.
Premises and Equipment
Premises and equipment are stated at cost less accumulated depreciation and amortization. Depreciation and amortization are computed by the straight-line method based on estimated service lives of assets. Useful lives range from 3 to 10 years for furniture and equipment, and 10 to 40 years for buildings. The cost of leasehold improvements is being amortized using the straight-line method over the terms of the related leases. Repairs and maintenance are charged to expense as incurred. Upon disposition, the asset and related accumulated depreciation and/or amortization are relieved, and any gains or losses are reflected in earnings.
Long-lived assets are reviewed for impairment whenever events or changes in circumstances indicate that the carrying value may not be recoverable. An impairment loss is recognized if the sum of the undiscounted future cash flows is less than the carrying amount of the asset. Assets to be disposed of are transferred to other real estate owned and are reported at the lower of the carrying amount or fair value less costs to sell.
Goodwill and Other Intangible Assets
Goodwill represents the cost in excess of the fair value of net assets acquired (including identifiable intangibles) in transactions accounted for as business combinations. Goodwill has an indefinite useful life and is evaluated for impairment annually, or more frequently if events and circumstances indicate that the asset might be impaired. An impairment loss is recognized to the extent that the carrying amount exceeds the asset’s fair value. The goodwill impairment analysis is a two-step test. The first, used to identify potential impairment, involves comparing each reporting unit’s estimated fair value to its carrying value, including goodwill. If the estimated fair value of a reporting unit exceeds its carrying value, goodwill is considered not to be impaired. If the carrying value exceeds estimated fair value, there is an indication of potential impairment and the second step is performed to measure the amount of impairment.
If required, the second step involves calculating an implied fair value of goodwill for each reporting unit for which the first step indicated impairment. The implied fair value of goodwill is determined in a manner similar to the amount of goodwill calculated in a business combination, by measuring the excess of the estimated fair value of the reporting unit, as determined in the first step, over the aggregate estimated fair values of the individual assets, liabilities and identifiable intangibles as if the reporting unit was being acquired in a business combination. If the implied fair value of goodwill exceeds the carrying value of goodwill assigned to the reporting unit, there is no impairment. If the carrying value of goodwill assigned to a reporting unit exceeds the implied fair value of the goodwill, an impairment charge is recorded for the excess.
Other intangible assets include premiums paid for acquisitions of core deposits and other identifiable intangible assets. Intangible assets other than goodwill, which are determined to have finite lives, are amortized based upon the estimated economic benefits received.
Deferred tax asset and liability balances are determined by application to temporary differences of the tax rate expected to be in effect when taxes will become payable or receivable. Temporary differences are differences between the tax basis of assets and liabilities and their reported amounts in the consolidated financial statements that will result in taxable or deductible amounts in future years. The effect of a change in tax rates on deferred taxes is recognized in income in the period that includes the enactment date. A tax position is recognized as a benefit only if it is more likely than not that the tax position would be sustained in a tax examination, with a tax examination being presumed to occur. The amount recognized is the largest amount of tax benefit that is greater than 50% likely of being realized on examination. For tax positions not meeting the “more likely than not” test, no tax benefit is recorded.
A valuation allowance is recorded for deferred tax assets if the Company determines that it is more likely than not that some portion or all of the deferred tax assets will not be realized. In future periods, the Company may be able to reduce some or all of the valuation allowance upon a determination that it will be able to realize such tax savings.
Derivative Instruments
The Company uses derivative instruments to manage and mitigate interest rate risk, to facilitate asset and liability management strategies, and to manage other risk exposures. A derivative is a financial instrument that derives its cash flows, and therefore its value, by reference to an underlying instrument, index, or referenced interest rate.
Derivatives are recorded on the consolidated balance sheet at fair value. For fair value hedges, the change in the fair value of the derivative and the corresponding change in fair value of the hedged risk in the underlying item being hedged are accounted for in earnings. Any difference in these two changes in fair value results in hedge ineffectiveness that results in a net impact to earnings. For cash flow hedges, changes in the fair value of the derivative are, to the extent that the hedging relationship is effective, recorded as other comprehensive income and subsequently recognized in earnings at the same time that the hedged item is recognized in earnings. Any portion of a hedge that is ineffective is recognized immediately as other noninterest income or expense.
Derivative contracts are written in amounts referred to as notional amounts. Notional amounts only provide the basis for calculating payments between counterparties and do not represent amounts to be exchanged between parties and are not a measure of financial risk. Like other financial instruments, derivatives contain an element of credit risk, which is the possibility that the Company will incur a loss because a counterparty fails to meet its contractual obligations. Potential credit losses are minimized through careful evaluation of counterparty credit standing, selection of counterparties from a limited group of high quality institutions, and other contract provisions.
Advertising Costs
The Company expenses advertising costs as they are incurred and advertising communications costs the first time the advertising takes place. The Company may establish accruals for committed advertising costs as incurred.
Stock-Based Compensation
Compensation cost is recognized for stock options and restricted stock awards issued to employees in addition to stock issued through a deferred compensation plan for non-employee directors. Compensation cost is measured as the fair value of these awards on their date of grant. A Black-Scholes option pricing model is utilized to estimate the fair value of stock options, while the market price of the Company’s common stock at the date of grant is used as the fair value of restricted stock awards. Compensation cost is recognized over the required service period, generally defined as the vesting period for stock options awards and as the restriction period for restricted stock awards.
Option pricing models require the use of highly subjective assumptions, including expected stock volatility, which if changed can materially affect fair value estimates. The expected life of options used in the option pricing model is the period the options are expected to remain outstanding. Expected stock price volatility is based on the historical volatility of the Company’s common stock for a period approximating the expected life of the option, the expected dividend yield is based on the Company’s historical annual dividend payout, and the risk-free rate is based on the implied yield available on U.S. Treasury issues.
Capital Bank Corporation – Notes to Consolidated Financial Statements
Fair Value Measurements
Fair value is defined as the exchange price that would be received to sell an asset or paid to transfer a liability in the principal or most advantageous market for the asset or liability in an orderly transaction between market participants on the measurement date. The Company follows the fair value hierarchy which gives the highest priority to quoted prices in active markets (observable inputs) and the lowest priority to the management’s assumptions (unobservable inputs). For assets and liabilities recorded at fair value, the Company’s policy is to maximize the use of observable inputs and minimize the use of unobservable inputs when developing fair value measurements.
The Company utilizes fair value measurements to record fair value adjustments to certain assets and liabilities and to determine fair value disclosures. Available-for-sale investment securities and derivatives are recorded at fair value on a recurring basis. Additionally, the Company may be required to record at fair value other assets on a nonrecurring basis, such as loans held for sale, impaired loans and certain other assets. These nonrecurring fair value adjustments typically involve application of lower of cost or market accounting or write-downs of individual assets.
The Company groups assets and liabilities at fair value in three levels, based on the markets in which the assets and liabilities are traded and the reliability of the assumptions used to determine fair value. An adjustment to the pricing method used within either Level 1 or Level 2 inputs could generate a fair value measurement that effectively falls to a lower level in the hierarchy. These levels are described as follows:
|
•
|
Level 1 – Valuations for assets and liabilities traded in active exchange markets.
|
|
|
•
|
Level 2 – Valuations for assets and liabilities that can be obtained from readily available pricing sources via independent providers for market transactions involving similar assets or liabilities. The Company’s principal market for these securities is the secondary institutional markets, and valuations are based on observable market data in those markets.
|
|
|
•
|
Level 3 – Valuations for assets and liabilities that are derived from other valuation methodologies, including option pricing models, discounted cash flow models and similar techniques, and not based on market exchange, dealer, or broker traded transactions. Level 3 valuations incorporate certain assumptions and projections in determining the fair value assigned to such assets or liabilities.
|
The determination of where an asset or liability falls in the fair value hierarchy requires significant judgment. The Company evaluates its hierarchy disclosures at each reporting period and based on various factors, it is possible that an asset or liability may be classified differently from quarter to quarter. However, the Company expects changes in classifications between levels will be rare.
Earnings (Loss) per Common Share
Basic earnings (loss) per common share (“EPS”) excludes dilution and is computed by dividing net income (loss) attributable to common shareholders by the weighted average number of common shares outstanding for the period. Diluted EPS assumes the conversion, exercise or issuance of all potential common stock instruments, such as stock options and warrants, unless the effect is to reduce a loss or increase earnings. Basic EPS is adjusted for outstanding stock options and warrants using the treasury stock method in order to compute diluted EPS. The calculation of basic and diluted EPS for the years ended December 31, 2010, 2009 and 2008 were as follows:
|
2010
|
2009
|
2008
|
||||||||
|
(Dollars in thousands except per share data)
|
||||||||||
|
Net loss attributable to common shareholders
|
$
|
(63,821
|
)
|
$
|
(9,168
|
)
|
$
|
(55,808
|
)
|
|
|
Shares used in the computation of earnings per share:
|
||||||||||
|
Weighted average number of shares outstanding – basic
|
12,810,905
|
11,470,314
|
11,302,769
|
|||||||
|
Incremental shares from assumed exercise of stock options
|
–
|
–
|
–
|
|||||||
|
Weighted average number of shares outstanding – diluted
|
12,810,905
|
11,470,314
|
11,302,769
|
|||||||
|
Net loss per common share – basic
|
$
|
(4.98
|
)
|
$
|
(0.80
|
)
|
$
|
(4.94
|
)
|
|
|
Net loss per common share – diluted
|
$
|
(4.98
|
)
|
$
|
(0.80
|
)
|
$
|
(4.94
|
)
|
|
Capital Bank Corporation – Notes to Consolidated Financial Statements
For the years ended December 31, 2010, 2009 and 2008, outstanding options to purchase 297,880, 366,583 and 238,672 shares, respectively, of common stock were excluded from the diluted calculation because the option price exceeded the average fair market value of the associated shares of common stock. For the year ended December 31, 2008, outstanding options to purchase 139,411 shares of common stock were excluded from the diluted calculation because the dilutive effect of those options would have reduced net loss per common share in that year.
For the years ended December 31, 2010, 2009 and 2008, outstanding warrants issued to the U.S. Treasury to purchase 749,619 shares of common stock were excluded from the diluted calculation because the warrant exercise price exceeded the average fair market value of the associated shares of common stock.
Comprehensive Income (Loss)
Comprehensive income (loss) represents the change in the Company’s equity during the period from transactions and other events and circumstances from non-owner sources. Total comprehensive income (loss) consists of net income (loss) and other comprehensive income (loss). The Company’s other comprehensive income (loss) and accumulated other comprehensive income (loss) are comprised of unrealized gains and losses on certain investments in debt securities, and in prior years, derivatives that qualified as cash flow hedges to the extent that the hedge was effective. The Company’s other comprehensive income (loss) for the years ended December 31, 2010, 2009 and 2008 was as follows:
|
2010
|
2009
|
2008
|
||||||||
|
(Dollars in thousands)
|
||||||||||
|
Unrealized gains (losses) on securities – available for sale
|
$
|
(8,560
|
)
|
$
|
8,220
|
$
|
(22
|
)
|
||
|
Unrealized gain (loss) on cash flow hedge
|
–
|
(3,151
|
)
|
1,202
|
||||||
|
Prior service cost recognized on SERP, net of amortization
|
8
|
(46
|
)
|
–
|
||||||
|
Income tax effect
|
3,300
|
(1,954
|
)
|
(455
|
)
|
|||||
|
Other comprehensive income (loss)
|
$
|
(5,252
|
)
|
$
|
3,069
|
$
|
725
|
|||
Segment Information
Operating segments are components of an enterprise about which separate financial information is available that is evaluated regularly by the chief operating decision maker in deciding how to allocate resources and in assessing performance. The Company has determined that it has one significant operating segment, which is the providing of general commercial banking and financial services to individuals and businesses primarily located in North Carolina. The Company’s various products and services are those generally offered by community banks, and the allocation of its resources is based on the overall performance of the institution versus individual regions, branches or products and services.
Reclassifications
Certain amounts previously reported have been reclassified to conform to the current year’s presentation. These reclassifications impacted certain noninterest income and noninterest expense items and had no effect on total assets, net income, or shareholders’ equity previously reported. The noninterest income and noninterest expense reclassifications were made in an effort to more clearly disclose certain elements in the Consolidated Statements of Operations.
Current Accounting Developments
In January 2011, the Financial Accounting Standards Board (the “FASB”) issued Accounting Standards Update (“ASU”) 2011-1, Deferral of the Effective Date of Disclosures about Troubled Debt Restructurings in Update No. 2010-20, to amend FASB Accounting Standards Codification (“ASC”) Topic 320, Receivables. The amendments in this update temporarily delay the effective date of the disclosures about troubled debt restructurings in ASU 2010-20 for public entities. The delay is intended to allow the FASB time to complete its deliberations on what constitutes a troubled debt restructuring. The effective date of the new disclosures about troubled debt restructurings for public entities and the guidance for determining what constitutes a troubled debt restructuring will then be coordinated.
Capital Bank Corporation – Notes to Consolidated Financial Statements
In December 2010, the FASB issued ASU 2010-29, Disclosure of Supplementary Pro Forma Information for Business Combinations, to amend ASC Topic 805, Business Combinations. The amendments in this update specify that if a public entity presents comparative financial statements, the entity should disclose revenue and earnings of the combined entity as though the business combination(s) that occurred during the current year had occurred as of the beginning of the comparable prior annual reporting period only. The amendments in this update are effective prospectively for business combinations for which the acquisition date is on or after the beginning of the first annual reporting period beginning on or after December 15, 2010. Management does not believe that adoption of this update will have a material impact on the Company’s financial position or results of operations.
In July 2010, the FASB issued ASU 2010-20, Disclosures about the Credit Quality of Financing Receivables and the Allowance for Credit Losses, to amend ASC Topic 320, Receivables. The amendments in this update are intended to provide disclosures that facilitate financial statement users’ evaluation of the nature of credit risk inherent in the entity’s portfolio of financing receivables, how that risk is analyzed and assessed in arriving at the allowance for credit losses, and the changes and reasons for those changes in the allowance for credit losses. The disclosures as of the end of a reporting period are effective for interim and annual periods ending on or after December 15, 2010. The disclosures about activity that occurs during a reporting period are effective for interim and annual reporting periods beginning on or after December 15, 2010. Adoption of this update did not have a material impact on the Company’s financial position or results of operations.
In April 2010, the FASB issued ASU 2010-18, Effect of a Loan Modification When the Loan Is Part of a Pool That Is Accounted for as a Single Asset, to amend ASC Topic 320, Receivables. The amendments in this update provide that for acquired troubled loans which meet the criteria to be accounted for within a pool, modifications to one or more of these loans does not result in the removal of the modified loan from the pool even if the modification would otherwise be considered a troubled debt restructuring. The pool of assets in which the loan is included will continue to be considered for impairment. The amendments do not apply to loans not meeting the criteria to be accounted for within a pool. These amendments were effective for modifications of loans accounted for within pools occurring in the first interim or annual period ending on or after July 15, 2010. Adoption of this update did not have a material impact on the Company’s financial position or results of operations.
In February 2010, the FASB issued ASU 2010-09, Amendments to Certain Recognition and Disclosure Requirements, to amend ASC Topic 855, Subsequent Events. The amendments in this update removed the requirement to disclose the date through which subsequent events have been evaluated and became effective immediately upon issuance. Adoption of this update did not have a material impact on the Company’s financial position or results of operations.
2. Investment Securities
Investment securities as of December 31, 2010 and 2009 are summarized as follows:
|
Amortized
Cost
|
Unrealized
Gains
|
Unrealized
Losses
|
Fair
Value
|
||||||||||
|
(Dollars in thousands)
|
|||||||||||||
|
December 31, 2010
|
|||||||||||||
|
Available for sale:
|
|||||||||||||
|
U.S. agency obligations
|
$
|
19,003
|
$
|
18
|
$
|
87
|
$
|
18,934
|
|||||
|
Municipal bonds
|
22,455
|
75
|
1,521
|
21,009
|
|||||||||
|
Mortgage-backed securities issued by GSEs
|
165,540
|
78
|
195
|
165,423
|
|||||||||
|
Non-agency mortgage-backed securities
|
6,790
|
39
|
242
|
6,587
|
|||||||||
|
Other securities
|
3,252
|
–
|
214
|
3,038
|
|||||||||
|
217,040
|
210
|
2,259
|
214,991
|
||||||||||
|
Other investments
|
8,301
|
–
|
–
|
8,301
|
|||||||||
|
Total at December 31, 2010
|
$
|
225,341
|
$
|
210
|
$
|
2,259
|
$
|
223,292
|
|||||
Capital Bank Corporation – Notes to Consolidated Financial Statements
|
Amortized
Cost
|
Unrealized
Gains
|
Unrealized
Losses
|
Fair
Value
|
||||||||||
|
(Dollars in thousands)
|
|||||||||||||
|
December 31, 2009
|
|||||||||||||
|
Available for sale:
|
|||||||||||||
|
U.S. agency obligations
|
$
|
1,000
|
$
|
29
|
$
|
–
|
$
|
1,029
|
|||||
|
Municipal bonds
|
72,556
|
1,006
|
668
|
72,894
|
|||||||||
|
Mortgage-backed securities issued by GSEs
|
144,762
|
6,896
|
–
|
151,658
|
|||||||||
|
Non-agency mortgage-backed securities
|
8,345
|
19
|
567
|
7,797
|
|||||||||
|
Other securities
|
2,252
|
–
|
204
|
2,048
|
|||||||||
|
228,915
|
7,950
|
1,439
|
235,426
|
||||||||||
|
Held to maturity:
|
|||||||||||||
|
Municipal bonds
|
$
|
300
|
$
|
7
|
$
|
–
|
$
|
307
|
|||||
|
Mortgage-backed securities issued by GSEs
|
1,576
|
84
|
–
|
1,660
|
|||||||||
|
Non-agency mortgage-backed securities
|
1,800
|
–
|
145
|
1,655
|
|||||||||
|
3,676
|
91
|
145
|
3,622
|
||||||||||
|
Other investments
|
6,390
|
–
|
–
|
6,390
|
|||||||||
|
Total at December 31, 2009
|
$
|
238,981
|
$
|
8,041
|
$
|
1,584
|
$
|
245,438
|
|||||
Credit related other than temporary impairments (“OTTI”) are recognized in net income (loss) and non-credit related impairments are recognized in other comprehensive income (loss) during the period the impairment is identified. Gross realized gains and losses and OTTI recognized in net income and other comprehensive income are reflected in the following table:
|
Years Ended December 31,
|
||||||||||
|
2010
|
2009
|
2008
|
||||||||
|
(Dollars in thousands)
|
||||||||||
|
Gross realized gains
|
$
|
5,863
|
$
|
493
|
$
|
323
|
||||
|
Gross realized losses
|
(8
|
)
|
(320
|
)
|
(74
|
)
|
||||
|
Net realized gains
|
5,855
|
173
|
249
|
|||||||
|
OTTI recognized on non-agency mortgage-backed securities:
|
||||||||||
|
Total OTTI on non-agency mortgage-backed securities
|
–
|
(381
|
)
|
–
|
||||||
|
Non-credit portion recognized in other comprehensive income
|
–
|
381
|
–
|
|||||||
|
Credit related OTTI on non-agency mortgage-backed securities
recognized in income
|
–
|
–
|
–
|
|||||||
|
OTTI recognized on corporate bonds (in other securities):
|
||||||||||
|
Total OTTI on corporate bonds
|
–
|
(701
|
)
|
–
|
||||||
|
Non-credit portion recognized in other comprehensive income
|
–
|
202
|
–
|
|||||||
|
Credit related OTTI on corporate bonds recognized in income
|
–
|
(498
|
)
|
–
|
||||||
|
Total OTTI recognized in income
|
–
|
(498
|
)
|
–
|
||||||
|
Securities gains (losses), net
|
$
|
5,855
|
$
|
(325
|
)
|
$
|
249
|
|||
On at least a quarterly basis, the Company completes an OTTI assessment of its investment portfolio. The Company considers many factors, including the severity and duration of the impairment and recent events specific to the issuer or industry, including any changes in credit ratings.
Capital Bank Corporation – Notes to Consolidated Financial Statements
In the year ended December 31, 2009, losses on 3 securities were determined to represent OTTI. The first of these investments was a private label mortgage security with a book value and unrealized loss of $699,000 and ($212,000), respectively, as of December 31, 2010 compared with a book value and unrealized loss of $810,000 and ($381,000), respectively, as of December 31, 2009. This impairment determination was based on the extent and duration of the unrealized loss as well as credit rating downgrades from rating agencies to below investment grade. Based on its analysis of expected cash flows, management expects to receive all contractual principal and interest from this security and therefore did not consider any of the unrealized loss to represent credit impairment. The second of these investments was subordinated debt of a community bank with a book value and unrealized loss of $1.0 million and ($202,000), respectively, as of both December 31, 2010 and 2009. This impairment determination was based on the extent of the unrealized loss as well as recent adverse economic and market conditions for community banks in general. Based on its review of capital, liquidity and earnings of this institution, management expects to receive all contractual principal and interest from this security and therefore did not consider any of the unrealized loss to represent credit impairment. Unrealized losses from these two investments were related to factors other than credit and were recorded to other comprehensive income. The third of these investments was an investment in trust preferred securities of a community bank with a par value of $1.0 million. This investment was determined to be credit impaired and was written down to estimated fair value with a $498,000 charge to income in the year ended December 31, 2009.
The following table summarizes the gross unrealized losses and fair value of the Company’s investments in an unrealized loss position for which OTTI has not been recognized in income, aggregated by investment category and length of time that individual securities have been in a continuous unrealized loss position, as of December 31, 2010 and 2009:
|
Less than 12 Months
|
12 Months or Greater
|
Total
|
|||||||||||||||||
|
(Dollars in thousands)
|
Fair Value
|
Unrealized Losses
|
Fair Value
|
Unrealized Losses
|
Fair Value
|
Unrealized Losses
|
|||||||||||||
|
December 31, 2010
|
|||||||||||||||||||
|
Available for sale:
|
|||||||||||||||||||
|
U.S. agency obligations
|
$
|
8,916
|
$
|
87
|
$
|
–
|
$
|
–
|
$
|
8,916
|
$
|
87
|
|||||||
|
Municipal bonds
|
14,886
|
1,134
|
2,453
|
387
|
17,339
|
1,521
|
|||||||||||||
|
Mortgage-backed securities issued by GSEs
|
14,473
|
195
|
–
|
–
|
14,473
|
195
|
|||||||||||||
|
Non-agency mortgage-backed securities
|
–
|
–
|
4,183
|
242
|
4,183
|
242
|
|||||||||||||
|
Other securities
|
–
|
–
|
2,536
|
214
|
2,536
|
214
|
|||||||||||||
|
Total at December 31, 2010
|
$
|
38,275
|
$
|
1,416
|
$
|
9,172
|
$
|
843
|
$
|
47,447
|
$
|
2,259
|
|||||||
|
December 31, 2009
|
|||||||||||||||||||
|
Available for sale:
|
|||||||||||||||||||
|
Municipal bonds
|
$
|
21,194
|
$
|
448
|
$
|
2,382
|
$
|
220
|
$
|
23,576
|
$
|
668
|
|||||||
|
Non-agency mortgage-backed securities
|
3,711
|
93
|
2,791
|
474
|
6,502
|
567
|
|||||||||||||
|
Other securities
|
–
|
–
|
1,546
|
204
|
1,546
|
204
|
|||||||||||||
|
24,905
|
541
|
6,719
|
898
|
31,624
|
1,439
|
||||||||||||||
|
Held to maturity:
|
|||||||||||||||||||
|
Non-agency mortgage-backed securities
|
–
|
–
|
1,655
|
145
|
1,655
|
145
|
|||||||||||||
|
Total at December 31, 2009
|
$
|
24,905
|
$
|
541
|
$
|
8,374
|
$
|
1,043
|
$
|
33,279
|
$
|
1,584
|
|||||||
As of December 31, 2010, unrealized losses on the Company’s investments in non-agency mortgage-backed securities, or private label mortgage securities, are related to 4 different securities. These losses are due to a combination of changes in credit spreads and other market factors. These mortgage securities are not issued or guaranteed by an agency of the federal government but are instead issued by private financial institutions and therefore carry an element of credit risk. Management closely monitors the performance of these securities and the underlying mortgages, which includes a detailed review of credit ratings, prepayment speeds, delinquency rates, default rates, current loan-to-values, geography of collateral, remaining terms, interest rates, loan types, etc. The Company has engaged a third party expert to provide a quarterly “stress test” of each private label mortgage security through a model using assumptions to simulate certain credit events and recessionary conditions and their impact on the performance and expected cash flows of each mortgage security.
Capital Bank Corporation – Notes to Consolidated Financial Statements
Unrealized losses on the Company’s investments in municipal bonds are related to 30 different securities. These losses are primarily related to concerns in the marketplace regarding credit quality of certain municipalities in light of the recent economic recession and high unemployment rates as well as expectations of future market interest rates. Management monitors the underlying credit of these bonds by reviewing the financial strength of the issuers and the sources of taxes and other revenues available to service the debt. Unrealized losses on other securities relate to an investment in subordinated debt of one corporate financial institution. Management monitors the financial strength of this institution by reviewing its quarterly financial reports and considers its capital, liquidity and earnings in this review.
The securities in an unrealized loss position as of December 31, 2010 not previously determined to have OTTI continue to perform and are expected to perform through maturity, and the issuers have not experienced significant adverse events that would call into question their ability to repay these debt obligations according to contractual terms. Further, because the Company does not intend to sell these investments and it is not more likely than not that the Company will be required to sell the investments before recovery of their amortized cost bases, which may be maturity, the Company does not consider unrealized losses on such securities to represent OTTI as of December 31, 2010.
Other investment securities primarily include an investment in Federal Home Loan Bank (“FHLB”) stock, which has no readily determinable market value and is recorded at cost. As of December 31, 2010 and 2009, the Company’s investment in FHLB stock totaled $7.7 million and $6.0 million, respectively. Based on its quarterly evaluation, management has concluded that the Company’s investment in FHLB stock was not impaired as of December 31, 2010 and that ultimate recoverability of the par value of this investment is probable. During 2009, the Company recorded an investment loss of $320,000 related to an equity investment in Silverton Bank, a correspondent financial institution that was closed by its regulators in 2009. The loss represented the full amount of the Company’s investment in Silverton Bank and was recorded as a reduction to noninterest income.
The amortized cost and estimated market values of available-for-sale debt securities as of December 31, 2010 by final contractual maturities are summarized in the table below. Expected maturities will differ from contractual maturities because borrowers may have the right to call or prepay obligations with or without call or prepayment penalties.
|
Available for Sale
|
|||||||
|
(Dollars in thousands)
|
Amortized Cost
|
Fair Value
|
|||||
|
Debt securities:
|
|||||||
|
Due within one year
|
$
|
300
|
$
|
301
|
|||
|
Due after one year through five years
|
17,882
|
17,904
|
|||||
|
Due after five years through ten years
|
49,567
|
49,401
|
|||||
|
Due after ten years
|
147,541
|
145,647
|
|||||
|
Total debt securities
|
215,290
|
213,253
|
|||||
|
Equity securities
|
1,750
|
1,738
|
|||||
|
Total investment securities
|
$
|
217,040
|
$
|
214,991
|
|||
As of December 31, 2010 and 2009, investment securities with book values totaling $68.2 million and $149.7 million, respectively, were pledged to secure public deposits, repurchase agreements, FHLB advances and other borrowings.
The composition of the loan portfolio by loan class as of December 31, 2010 and 2009 was as follows:
|
2010
|
2009
|
||||||
|
(Dollars in thousands)
|
|||||||
|
Commercial real estate:
|
|||||||
|
Construction and land development
|
$
|
350,587
|
$
|
452,120
|
|||
|
Commercial real estate – non-owner occupied
|
283,943
|
245,674
|
|||||
|
Total commercial real estate – non-owner occupied
|
634,530
|
697,794
|
|||||
|
Consumer real estate:
|
|||||||
|
Residential mortgage
|
173,777
|
165,374
|
|||||
|
Home equity lines
|
89,178
|
97,129
|
|||||
|
Total consumer real estate
|
262,955
|
262,503
|
|||||
|
Commercial real estate – owner occupied
|
170,470
|
194,359
|
|||||
|
Commercial and industrial
|
145,435
|
183,733
|
|||||
|
Consumer
|
6,163
|
9,692
|
|||||
|
Other loans
|
33,742
|
41,851
|
|||||
|
1,253,295
|
1,389,932
|
||||||
|
Deferred loan fees and origination costs, net
|
1,184
|
370
|
|||||
|
$
|
1,254,479
|
$
|
1,390,302
|
||||
Loans pledged as collateral for certain borrowings totaled $341.5 million and $279.6 million as of December 31, 2010 and 2009, respectively.
4. Allowance for Loan Losses and Credit Quality
The following is a summary of activity in the allowance for loan losses for the years ended December 31, 2010, 2009 and 2008:
|
2010
|
2009
|
2008
|
||||||||
|
(Dollars in thousands)
|
||||||||||
|
Balance at beginning of year
|
$
|
26,081
|
$
|
14,795
|
$
|
13,571
|
||||
|
Loans charged off
|
(49,420
|
)
|
(12,197
|
)
|
(4,568
|
)
|
||||
|
Recoveries of loans previously charged off
|
855
|
419
|
1,071
|
|||||||
|
Net charge-offs
|
(48,565
|
)
|
(11,778
|
)
|
(3,497
|
)
|
||||
|
Acquired in business combination
|
–
|
–
|
845
|
|||||||
|
Provision for loan losses
|
58,545
|
23,064
|
3,876
|
|||||||
|
Balance at end of year
|
$
|
36,061
|
$
|
26,081
|
$
|
14,795
|
||||
The allowance for credit losses includes the allowance for loan losses and the reserve for unfunded lending commitments, which is included in other liabilities on the Consolidated Balance Sheets. As of December 31, 2010 and 2009, the reserve for unfunded lending commitments totaled $623,000 and $351,000, respectively. The following is an analysis of activity in the allowance for loan losses by portfolio segment in addition to the disaggregation of the allowance and outstanding loan balances by impairment method as of and for the year ended December 31, 2010:
|
CRE –
Non-Owner
Occupied
|
Consumer
Real Estate
|
CRE –
Owner
Occupied
|
Commercial
and
Industrial
|
Consumer
|
Other
|
Total
|
||||||||||||||||
|
(Dollars in thousands)
|
||||||||||||||||||||||
|
Allowance for loan losses:
|
||||||||||||||||||||||
|
Beginning balance
|
$
|
14,987
|
$
|
2,383
|
$
|
2,650
|
$
|
5,536
|
$
|
326
|
$
|
199
|
$
|
26,081
|
||||||||
|
Charge-offs
|
(33,803
|
)
|
(3,923
|
)
|
(4,417
|
)
|
(6,639
|
)
|
(429
|
)
|
(209
|
)
|
(49,420
|
)
|
||||||||
|
Recoveries
|
616
|
54
|
48
|
115
|
22
|
–
|
855
|
|||||||||||||||
|
Provision
|
39,195
|
6,218
|
5,114
|
7,420
|
435
|
163
|
58,545
|
|||||||||||||||
|
Ending balance – total
|
$
|
20,995
|
$
|
4,732
|
$
|
3,395
|
$
|
6,432
|
$
|
354
|
$
|
153
|
$
|
36,061
|
||||||||
|
Ending balance – individually evaluated for impairment
|
$
|
212
|
$
|
87
|
$
|
139
|
$
|
89
|
$
|
2
|
$
|
–
|
$
|
529
|
||||||||
|
Ending balance – collectively evaluated for impairment
|
$
|
20,783
|
$
|
4,645
|
$
|
3,256
|
$
|
6,343
|
$
|
352
|
$
|
153
|
$
|
35,532
|
||||||||
|
Loans:
|
||||||||||||||||||||||
|
Ending balance – total
|
$
|
634,530
|
$
|
262,955
|
$
|
170,470
|
$
|
145,435
|
$
|
6,163
|
$
|
33,742
|
$
|
1,253,295
|
||||||||
|
Ending balance – individually evaluated for impairment
|
$
|
57,227
|
$
|
3,879
|
$
|
8,613
|
$
|
6,013
|
$
|
6
|
$
|
781
|
$
|
76,519
|
||||||||
|
Ending balance – collectively evaluated for impairment
|
$
|
577,303
|
$
|
259,076
|
$
|
161,857
|
$
|
139,422
|
$
|
6,157
|
$
|
32,961
|
$
|
1,176,776
|
||||||||
The following is an analysis presenting impaired loan information by loan class as of December 31, 2010:
|
Recorded
Investment
|
Unpaid
Principal
Balance
|
Related
Allowance
|
||||||||
|
(Dollars in thousands)
|
||||||||||
|
Impaired loans for which the full loss has been charged-off:
|
||||||||||
|
Commercial real estate:
|
||||||||||
|
Construction and land development
|
$
|
53,675
|
$
|
65,918
|
$
|
–
|
||||
|
Commercial real estate – non-owner occupied
|
2,678
|
3,772
|
–
|
|||||||
|
Consumer real estate:
|
||||||||||
|
Residential mortgage
|
3,222
|
4,436
|
–
|
|||||||
|
Home equity lines
|
236
|
332
|
–
|
|||||||
|
Commercial real estate – owner occupied
|
8,083
|
10,475
|
–
|
|||||||
|
Commercial and industrial
|
5,466
|
6,128
|
–
|
|||||||
|
Other loans
|
781
|
990
|
–
|
|||||||
|
Total with no related allowance
|
|
74,141
|
|
92,051
|
|
–
|
||||
|
Impaired loans with an allowance recorded:
|
||||||||||
|
Commercial real estate:
|
||||||||||
|
Construction and land development
|
|
874
|
|
874
|
|
212
|
||||
|
Consumer real estate:
|
||||||||||
|
Residential mortgage
|
380
|
380
|
79
|
|||||||
|
Home equity lines
|
41
|
41
|
8
|
|||||||
|
Commercial real estate – owner occupied
|
530
|
530
|
139
|
|||||||
|
Commercial and industrial
|
547
|
565
|
89
|
|||||||
|
Consumer
|
6
|
6
|
2
|
|||||||
|
Total with an allowance
|
|
2,378
|
|
2,396
|
|
529
|
||||
|
Total impaired loans:
|
||||||||||
|
Commercial
|
|
72,634
|
|
89,252
|
|
440
|
||||
|
Consumer
|
3,885
|
5,195
|
89
|
|||||||
|
Total impaired loans
|
$
|
76,519
|
$
|
94,447
|
$
|
529
|
||||
Capital Bank Corporation – Notes to Consolidated Financial Statements
All TDRs are classified as individually impaired. The following table summarizes the Company’s recorded investment in TDRs as of December 31, 2010 and 2009:
|
2010
|
2009
|
||||||
|
(Dollars in thousands)
|
|||||||
|
Nonperforming TDRs:
|
|||||||
|
Commercial real estate
|
$
|
10,775
|
$
|
13,926
|
|||
|
Consumer real estate
|
808
|
1,031
|
|||||
|
Commercial owner occupied
|
2,271
|
1,127
|
|||||
|
Commercial and industrial
|
106
|
–
|
|||||
|
Total nonperforming TDRs
|
13,960
|
16,084
|
|||||
|
Performing TDRs:
|
|||||||
|
Commercial real estate
|
3,856
|
27,532
|
|||||
|
Consumer real estate
|
121
|
598
|
|||||
|
Commercial owner occupied
|
421
|
4,633
|
|||||
|
Commercial and industrial
|
65
|
1,288
|
|||||
|
Consumer
|
–
|
126
|
|||||
|
Total performing TDRs
|
4,463
|
34,177
|
|||||
|
Total TDRs
|
$
|
18,423
|
$
|
50,261
|
|||
As of December 31, 2010, there was no allowance for loan losses allocated to TDRs as all of these loans were charged down to estimated fair value. As of December 31, 2009, the allowance for loan losses allocated to nonperforming and performing TDRs totaled $0.7 million and $3.5 million, respectively.
To monitor and quantify credit risk in the loan portfolio, the Company uses a two-dimensional risk rating system. The first digit represents the credit quality of the borrower and is used to calculate the probability of default used in the “pooled” reserve calculation on loans evaluated collectively for impairment, while the second digit represents the loan collateral type and is used to calculate the loss given default also used in the “pooled” reserve calculation. The first digit ranges from 1 to 9, where a higher rating represents higher credit risk, and is selected on the financial strength and overall resources of the borrower, and the second digit is chosen by the type of primary collateral securing the loan. Based on these two components, the Company determines the risk profile for every commercial loan and non-pass rated consumer loans in the portfolio. The nine risk rating categories (first digit) can generally be described by the following groupings:
|
•
|
Pass (risk rating 1–6) – These loans range from superior quality with minimal credit risk to loans requiring heightened management attention but that are still an acceptable risk and continue to perform as contracted.
|
|
|
•
|
Special Mention (risk rating 7) – Loans in this category have potential weaknesses that deserve management’s close attention. If left uncorrected, these potential weaknesses may result in deterioration of the repayment prospects for the asset or the institution’s credit position at some future date. They contain unfavorable characteristics and are generally undesirable. Loans in this category are currently protected by current sound net worth and paying capacity of the obligor or of the collateral pledged, if any, but are potentially weak and constitute an undue and unwarranted credit risk, but not to the point of a Substandard classification. A Special Mention loan has potential weaknesses, which if not checked or corrected, weaken the asset or inadequately protect the Bank’s position at some future date.
|
|
|
•
|
Substandard (risk rating 8) – Loans in this category are inadequately protected by the current sound worth and paying capacity of the obligor or of the collateral pledged, if any. Assets so classified must have a well-defined weakness or weaknesses that jeopardize the liquidation of the debt. They are characterized by the distinct possibility that the Bank will sustain some loss if the deficiencies are not corrected. Loss potential, while existing in the aggregate amount of substandard assets, does not have to exist in individual assets classified substandard. A substandard loan normally has one or more well-defined weaknesses that could jeopardize repayment of the debt. The likely need to liquidate assets to correct the problem, rather than repayment from successful operations is the key distinction between Special Mention and Substandard.
|
|
|
•
|
Doubtful (risk rating 9) – For loans in this category, the borrower’s ability to continue repayment is highly unlikely. Full collection based on currently known facts, conditions, and values is highly questionable and improbable. The possibility of loss is extremely high, but because of certain important and specific reasonable pending factors, which work to the bank’s advantage and strengthen the asset in the near term, its classification as loss is deferred until its more exact status may be determined. Loans in this category are immediately placed on nonaccrual with all payments applied to principal until such time as the potential loss exposure is eliminated.
|
The following is an analysis of the Company’s commercial credit risk profile based on internally assigned risk ratings as of December 31, 2010:
|
CRE –
Construction
and Land
Development
|
CRE –
Non-Owner
Occupied
|
CRE –
Owner
Occupied
|
Commercial
and
Industrial
|
Other
|
Total
|
||||||||||||||
|
(Dollars in thousands)
|
|||||||||||||||||||
|
Risk rating:
|
|||||||||||||||||||
|
Pass
|
$
|
250,557
|
$
|
266,523
|
$
|
154,156
|
$
|
101,674
|
$
|
32,961
|
$
|
805,871
|
|||||||
|
Special mention
|
20,178
|
12,505
|
2,287
|
20,488
|
–
|
55,458
|
|||||||||||||
|
Substandard
|
79,852
|
4,610
|
13,967
|
23,266
|
781
|
122,476
|
|||||||||||||
|
Doubtful
|
–
|
305
|
60
|
7
|
–
|
372
|
|||||||||||||
|
Total
|
$
|
350,587
|
$
|
283,943
|
$
|
170,470
|
$
|
145,435
|
$
|
33,742
|
$
|
984,177
|
|||||||
The following is an analysis of the Company’s consumer credit risk profile based on the internally assigned risk rating as of December 31, 2010:
|
Consumer Real
Estate – Residential
Mortgage
|
Consumer Real
Estate – Home Equity
|
Other
Consumer
|
Total
|
||||||||||
|
(Dollars in thousands)
|
|||||||||||||
|
Risk rating:
|
|||||||||||||
|
Pass
|
$
|
162,002
|
$
|
85,000
|
$
|
5,803
|
$
|
252,805
|
|||||
|
Special mention
|
5,518
|
1,972
|
188
|
7,678
|
|||||||||
|
Substandard
|
6,138
|
2,110
|
172
|
8,420
|
|||||||||
|
Doubtful
|
119
|
96
|
–
|
215
|
|||||||||
|
Total
|
$
|
173,777
|
$
|
89,178
|
$
|
6,163
|
$
|
269,118
|
|||||
Capital Bank Corporation – Notes to Consolidated Financial Statements
The following is an aging analysis of the Company’s portfolio by loan class as of December 31, 2010:
|
30–59
Days
Past Due
and Still
Accruing
|
60–89
Days
Past Due
and Still
Accruing
|
Greater
than
90 Days
and Still
Accruing
|
Total
Past Due
and Still
Accruing
|
Nonaccrual
Loans
|
Current
Loans
|
Total
Loans
|
||||||||||||||||
|
(Dollars in thousands)
|
||||||||||||||||||||||
|
Commercial real estate:
|
||||||||||||||||||||||
|
Construction and land development
|
$
|
6,166
|
$
|
204
|
$
|
–
|
$
|
6,370
|
$
|
50,693
|
$
|
293,524
|
$
|
350,587
|
||||||||
|
Commercial real estate – non-owner occupied
|
509
|
–
|
–
|
509
|
2,678
|
280,756
|
283,943
|
|||||||||||||||
|
Consumer real estate:
|
||||||||||||||||||||||
|
Residential mortgage
|
2,213
|
329
|
–
|
2,542
|
3,481
|
167,754
|
173,777
|
|||||||||||||||
|
Home equity lines
|
498
|
109
|
–
|
607
|
277
|
88,294
|
89,178
|
|||||||||||||||
|
Commercial real estate – owner occupied
|
3,165
|
–
|
–
|
3,165
|
8,198
|
159,107
|
170,470
|
|||||||||||||||
|
Commercial and industrial
|
175
|
146
|
–
|
321
|
5,830
|
139,284
|
145,435
|
|||||||||||||||
|
Consumer
|
4
|
4
|
–
|
8
|
6
|
6,149
|
6,163
|
|||||||||||||||
|
Other loans
|
–
|
–
|
–
|
–
|
781
|
32,961
|
33,742
|
|||||||||||||||
|
Total
|
$
|
12,730
|
$
|
792
|
$
|
–
|
$
|
13,522
|
$
|
71,944
|
$
|
1,167,829
|
$
|
1,253,295
|
||||||||
For the years ended December 31, 2010, 2009 and 2008, no interest income was recognized on loans while in nonaccrual status, including cash received for interest on these loans. Cumulative interest payments collected on nonaccrual loans and applied as a reduction to the principal balance of the respective loans totaled $837,000 and $366,000 as of December 31, 2010 and 2009, respectively.
5. Premises and Equipment
Premises and equipment as of December 31, 2010 and 2009 were as follows:
|
2010
|
2009
|
||||||
|
(Dollars in thousands)
|
|||||||
|
Land
|
$
|
6,795
|
$
|
6,210
|
|||
|
Buildings and leasehold improvements
|
17,927
|
16,072
|
|||||
|
Furniture and equipment
|
19,163
|
21,300
|
|||||
|
Automobiles
|
265
|
179
|
|||||
|
Construction in progress
|
411
|
1,308
|
|||||
|
44,561
|
45,069
|
||||||
|
Less accumulated depreciation and amortization
|
(19,527
|
)
|
(21,313
|
)
|
|||
|
$
|
25,034
|
$
|
23,756
|
||||
Depreciation expense for the years ended December 31, 2010, 2009 and 2008 was $2.6 million, $2.9 million, and $2.6 million, respectively.
Capital Bank Corporation – Notes to Consolidated Financial Statements
6. Goodwill and Other Intangible Assets
The changes in carrying amounts of goodwill and other intangible assets (core deposit intangibles) for the years ended December 31, 2010, 2009 and 2008 were as follows:
|
Goodwill
|
Core Deposit Intangible
|
||||||||||||
|
(Dollars in thousands)
|
Gross
|
Accumulated
Amortization
|
Net
|
||||||||||
|
Balance at January 1, 2008
|
$
|
59,776
|
$
|
7,089
|
$
|
(3,520
|
)
|
$
|
3,569
|
||||
|
Amortization expense
|
–
|
–
|
(1,037
|
)
|
(1,037
|
)
|
|||||||
|
Branch acquisition in December 2008
|
5,415
|
1,325
|
–
|
1,325
|
|||||||||
|
Goodwill impairment charge
|
(65,191
|
)
|
–
|
–
|
–
|
||||||||
|
Balance at December 31, 2008
|
–
|
8,414
|
(4,557
|
)
|
3,857
|
||||||||
|
Amortization expense
|
–
|
–
|
(1,146
|
)
|
(1,146
|
)
|
|||||||
|
Balance at December 31, 2009
|
–
|
8,414
|
(5,703
|
)
|
2,711
|
||||||||
|
Amortization expense
|
–
|
–
|
(937
|
)
|
(937
|
)
|
|||||||
|
Balance at December 31, 2010
|
$
|
–
|
$
|
8,414
|
$
|
(6,640
|
)
|
$
|
1,774
|
||||
Core deposit intangibles are amortized over periods of up to ten years using an accelerated method approximating the period of economic benefits received. Estimated amortization expense for the next five years is as follows: 2011–$737,000; 2012–$527,000; 2013–$294,000; 2014–$109,000; 2015–$72,000; and thereafter–$35,000.
Goodwill is reviewed for potential impairment at least annually at the reporting unit level. An impairment loss is recorded to the extent that the carrying amount of goodwill exceeds its implied fair value. The Company’s annual goodwill impairment evaluation in 2008 resulted in a goodwill impairment charge of $65.2 million, which was recorded to noninterest expense for the year ended December 31, 2008. This impairment charge, representing the full amount of goodwill on the Consolidated Balance Sheet, was primarily due to a significant decline in the market value of the Company’s common stock during 2008 to below tangible book value for an extended period of time.
Core deposit intangibles are evaluated for impairment if events and circumstances indicate a potential for impairment. Such an evaluation of other intangible assets is based on undiscounted cash flow projections. No impairment charges were recorded for other intangible assets in the years ended December 31, 2010, 2009 and 2008.
7. Deposits
|
|
|
As of December 31, 2010, the scheduled maturities of time deposits were as follows:
|
Amount
|
Weighted
Average Rate |
||||||
|
(Dollars in thousands)
|
|||||||
|
2011
|
$
|
234,572
|
1.06
|
%
|
|||
|
2012
|
311,121
|
2.02
|
|||||
|
2013
|
257,327
|
1.76
|
|||||
|
2014
|
11,698
|
2.69
|
|||||
|
2015
|
58,568
|
2.72
|
|||||
|
Thereafter
|
44
|
2.64
|
|||||
|
$
|
873,330
|
1.74
|
%
|
||||
Time deposits of $100,000 or greater totaled $327.5 million and $341.4 million as of December 31, 2010 and 2009, respectively, while brokered deposits (excluding reciprocal CDARS deposits of $29.2 million and $35.0 million as of December 31, 2010 and 2009, respectively) totaled $110.5 million and $70.1 million as of December 31, 2010 and 2009, respectively. Deposit overdrafts of $71,000 and $94,000 were included in total loans as of December 31, 2010 and 2009, respectively.
Capital Bank Corporation – Notes to Consolidated Financial Statements
In the normal course of business, certain directors and executive officers of the Company, including their immediate families and companies in which they have an interest, may be deposit customers.
8. Borrowings
The following is an analysis of securities sold under agreements to repurchase as of December 31, 2010 and 2009:
|
End of Period
|
Daily Average Balance
|
|||||||||||||||
|
(Dollars in thousands)
|
Balance
|
Weighted
Average Rate |
Balance
|
Interest
Rate
|
Maximum
Outstanding at
Any Month End
|
|||||||||||
|
2010
|
||||||||||||||||
|
Securities sold under agreements to repurchase
|
$
|
–
|
–
|
%
|
$
|
1,564
|
0.32
|
%
|
$
|
5,026
|
||||||
|
2009
|
||||||||||||||||
|
Securities sold under agreements to repurchase
|
$
|
6,543
|
0.18
|
%
|
$
|
10,919
|
0.22
|
%
|
$
|
14,158
|
||||||
Interest expense on federal funds purchased totaled $0, $2,000 and $34,000 for the years ended December 31, 2010, 2009 and 2008, respectively. Interest expense on securities sold under agreements to repurchase totaled $5,000, $21,000 and $353,000 for the years ended December 31, 2010, 2009 and 2008, respectively.
The following table presents information regarding the Company’s outstanding borrowings as of December 31, 2010 and 2009:
|
2010
|
2009
|
||||||
|
(Dollars in thousands)
|
|||||||
|
FHLB advances without call options or where call options expired prior to December 31, 2010; fixed interest rates on advances outstanding as of December 31, 2010 ranging from 1.86% to 5.50%; maturity dates on those advances ranging from January 26, 2011 to January 20, 2015
|
$
|
41,000
|
$
|
39,000
|
|||
|
FHLB advance with next quarterly call option on February 22, 2011; fixed interest rate of 3.63%; matures on August 21, 2017
|
10,000
|
10,000
|
|||||
|
FHLB overnight borrowings; interest rate of 0.47% as of December 31, 2010, subject to change daily
|
20,000
|
18,000
|
|||||
|
Structured repurchase agreements without call options or where call options expired prior to December 31, 2010; fixed interest rates on advances outstanding as of December 31, 2010 of 3.72% and 3.79%; agreements mature on December 18, 2017
|
20,000
|
10,000
|
|||||
|
Structured repurchase agreements with various forms of call options remaining; fixed interest rates ranging from 3.56% to 4.75%; maturity dates ranging from November 6, 2016 to March 22, 2019
|
30,000
|
40,000
|
|||||
|
Federal Reserve Bank primary credit facility; current interest rate of 0.75% as of December 31, 2010
|
–
|
50,000
|
|||||
|
$
|
121,000
|
$
|
167,000
|
Advances from the FHLB totaled $51.0 million and $49.0 million as of December 31, 2010 and 2009, respectively, and had a weighted average rates of 4.22% and 4.69% as of December 31, 2010 and 2009, respectively. In addition, overnight borrowings on the Company’s credit line at the FHLB totaled $20.0 million and $18.0 million as of December 31, 2010 and 2009, respectively. These fixed rate advances as well as the Company’s credit line with the FHLB were collateralized by eligible 1–4 family mortgages, home equity loans and commercial loans totaling $216.3 million and $118.0 million as of December 31, 2010 and 2009, respectively. In addition, the Company pledged certain mortgage-backed securities with a book value of $0 and $46.4 million as of December 31, 2010 and 2009, respectively. As of December 31, 2010, the Company had $20.7 million of available borrowing capacity with the FHLB.
Capital Bank Corporation – Notes to Consolidated Financial Statements
Outstanding structured repurchase agreements totaled $50.0 million as of December 31, 2010 and 2009. These repurchase agreements had a weighted average rate of 4.06% as of December 31, 2010 and 2009 and were collateralized by certain U.S. agency and mortgage-backed securities with a book value of $61.2 million and $57.4 million as of December 31, 2010 and 2009, respectively.
The Company maintains a credit line at the FRB discount window that is used for short-term funding needs and as an additional source of liquidity. Primary credit borrowings as well as the Company’s credit line at the discount window were collateralized by eligible commercial construction as well as commercial and industrial loans totaling $125.2 million and $161.6 million as of December 31, 2010 and 2009, respectively. As of December 31, 2010, the Company had $77.0 million of available borrowing capacity with the FRB.
As of December 31, 2010, the scheduled maturities of borrowings were as follows:
|
Balance
|
Weighted
Average Rate
|
||||||
|
(Dollars in thousands)
|
|||||||
|
2011
|
$
|
51,000
|
3.21
|
%
|
|||
|
2012
|
–
|
–
|
|||||
|
2013
|
3,000
|
1.86
|
|||||
|
2014
|
3,000
|
2.43
|
|||||
|
2015
|
4,000
|
2.92
|
|||||
|
Thereafter
|
60,000
|
3.99
|
|||||
|
$
|
121,000
|
3.54
|
%
|
||||
9. Subordinated Debentures
Capital Bank Statutory Trusts
The Company formed Capital Bank Statutory Trust I, Capital Bank Statutory Trust II and Capital Bank Statutory Trust III (the “Trusts”) in June 2003, December 2003 and December 2005, respectively. Each issued $10 million of its floating-rate capital securities (the “trust preferred securities”), with a liquidation amount of $1,000 per capital security, in pooled offerings of trust preferred securities. The Trusts sold their common securities to the Company for an aggregate of $900,000, resulting in total proceeds from each offering equal to $10.3 million, or $30.9 million in aggregate. The Trusts then used these proceeds to purchase $30.9 million in principal amount of the Company’s Floating Rate Junior Subordinated Deferrable Interest Debentures (the “Debentures”). Following payment by the Company of a placement fee and other expenses of the offering, the Company’s net proceeds from the offerings aggregated $30.0 million.
The trust preferred securities each have 30-year maturities and became redeemable after five years by the Company with certain exceptions. Prior to the redemption date, the trust preferred securities may be redeemed at the option of the Company after the occurrence of certain events, including without limitation events that would have a negative tax effect on the Company or the Trusts, would cause the trust preferred securities to no longer qualify as Tier 1 capital, or would result in the Trusts being treated as an investment company. The Trusts’ ability to pay amounts due on the trust preferred securities is solely dependent upon the Company making payment on the Debentures. The Company’s obligation under the Debentures constitutes a full and unconditional guarantee by the Company of the Trusts’ obligations under the trust preferred securities.
The securities associated with each trust are floating rate, based on 90-day LIBOR, and adjust quarterly. Trust I securities adjust at LIBOR + 3.10%, Trust II securities adjust at LIBOR + 2.85% and Trust III securities adjust at LIBOR +1.40%.
The Debentures, which are subordinate and junior in right of payment to all present and future senior indebtedness and certain other financial obligations of the Company, are the sole assets of the Trusts, and the Company’s payment under the Debentures is the sole source of revenue for the Trusts.
The assets and liabilities of the Trusts are not consolidated into the consolidated financial statements of the Company. Interest on the Debentures is included in the Consolidated Statements of Operations as interest expense. The Debentures are recorded in subordinated debentures on the Consolidated Balance Sheets. For regulatory purposes, the $30 million of trust preferred securities qualifies as Tier 1 capital, subject to certain limitations, or Tier 2 capital in accordance with regulatory reporting requirements. The Company recorded interest expense on the Debentures of $865,000, $1.1 million and $1.8 million for the years ended December 31, 2010, 2009 and 2008, respectively.
Capital Bank Corporation – Notes to Consolidated Financial Statements
Private Placement Offering of Investment Units
On March 18, 2010, the Company sold 849 investment units (“Units”) to certain accredited investors for gross proceeds of $8.5 million. Each Unit was priced at $10,000 and consisted of a $3,996.90 subordinated promissory note and a number of shares of the Company’s common stock valued at $6,003.10. As a result of the sale of the Units, the Company sold $3.4 million in aggregate principal amount of subordinated promissory notes due March 18, 2020 (the “Notes”) and 1,468,770 shares of the Company’s common stock valued at $5.1 million. The Notes are recorded in subordinated debentures on the Condensed Consolidated Balance Sheets. The Company may prepay the Notes at any time after March 18, 2015 subject to regulatory approval and compliance with applicable law. The Company’s obligation to repay the Notes is subordinate to all indebtedness owed by the Company to its current and future secured creditors and general creditors and certain other financial obligations of the Company.
The Company is obligated to pay annual interest on the Notes at 10% payable in quarterly installments. The Company recorded interest expense on the Notes of $266,000 for the year ended December 31, 2010.
10. Leases
The Company has non-cancelable operating leases for its corporate office, certain branch locations and corporate aircraft that expire at various times through 2036. Certain of the leases contain escalating rent clauses, for which the Company recognizes rent expense on a straight-line basis. The Company subleases certain office space and the corporate aircraft to outside parties. Future minimum lease payments under the leases and sublease receipts for years subsequent to December 31, 2010 are as follows:
|
Lease Payments
|
Sublease Receipts
|
||||||
|
(Dollars in thousands)
|
|||||||
|
2011
|
$
|
4,112
|
$
|
383
|
|||
|
2012
|
4,058
|
295
|
|||||
|
2013
|
3,919
|
242
|
|||||
|
2014
|
3,817
|
240
|
|||||
|
2015
|
3,623
|
247
|
|||||
|
Thereafter
|
29,747
|
62
|
|||||
|
$
|
49,276
|
$
|
1,469
|
||||
Rent expense under operating leases was $3.8 million, $3.3 million and $2.7 million for the years ended December 31, 2010, 2009 and 2008, respectively.
11. Related Party Transactions
In the normal course of business, certain directors and executive officers of the Company, including their immediate families and companies in which they have an interest, may be borrowers. Total loans to such groups and activity during the year ended December 31, 2010 is summarized as follows:
|
2010
|
||||
|
(Dollars in thousands)
|
||||
|
Balance as of December 31, 2009
|
$
|
103,326
|
||
|
Advances
|
14,734
|
|||
|
Repayments
|
(31,090
|
)
|
||
|
Balance as of December 31, 2010
|
$
|
86,970
|
In addition, such groups had available unused lines of credit in the amount of $10.7 million as of December 31, 2010. These transactions were made on substantially the same terms, including interest rates and collateral, as those prevailing at the time for comparable loans with persons not related to the Company. Certain deposits are held by related parties, and the rates and terms of these accounts are consistent with those of non-related parties. Further, the Company paid an aggregate of $2.8 million, $1.2 million and $1.1 million to companies owned by members of the board of directors or immediate family members for leased space, equipment, construction and consulting services in the years ended December 31, 2010, 2009 and 2008, respectively.
Capital Bank Corporation – Notes to Consolidated Financial Statements
12. Employee Benefit Plans
401(k) Retirement Plan
The Company maintains the Capital Bank 401(k) Retirement Plan (the “Plan”) for the benefit of its employees, which includes provisions for employee contributions, subject to limitation under the Internal Revenue Code, and discretionary matching contributions by the Company. The Plan provides that employee’s contributions are 100% vested at all times, and the Company’s matching contributions vest 20% after the second year of service, an additional 20% after the third and fourth years of service and the remaining 40% after the fifth year of service. Through May 31, 2009, the Company matched 100% of employee contributions up to 6% of an employee’s salary. Effective June 1, 2009, the Company suspended its discretionary matching contributions to the Plan. Aggregate matching contributions, which are recorded in salaries and employee benefits expense on the Consolidated Statements of Operations, for the years ended December 31, 2010, 2009 and 2008 were $0, $387,000 and $772,000, respectively.
Supplemental Retirement Plans
In May 2005, the Company established two supplemental retirement plans for the benefit of certain executive officers and certain directors of the Company. The Capital Bank Defined Benefit Supplemental Executive Retirement Plan (“Executive Plan”) covers the Company’s chief executive officer and three other members of executive management. Under the Executive Plan, the participants were to receive a supplemental retirement benefit equal to a targeted percentage of the participant’s average annual salary during the last three years of employment. Under the Executive Plan, benefits vest over an eight-year period with the first 20% vesting after four years of service and 20% vesting annually thereafter. The Capital Bank Supplemental Retirement Plan for Directors (“Director Plan”) covered certain directors and provided for a fixed annual retirement benefit to be paid for a number of years equal to the director’s total years of service, up to a maximum of ten years. As of December 31, 2010, there were four executives participating in the Executive Plan and fourteen current and former directors participating in the Director Plan
For the years ended December 31, 2010, 2009 and 2008, the Company recognized $255,000, $236,000 and $154,000, respectively, of expense related to the Executive Plan; and $238,000, $353,000 and $315,000, respectively, of expense related to the Director Plan. The obligations associated with the two plans are included in other liabilities on the Consolidated Balance Sheets and totaled $1.0 million and $774,000 (Executive Plan) and $1.6 million and $1.5 million (Director Plan) as of December 31, 2010 and 2009, respectively. On January 28, 2011, cash benefit payments were made to participants from both the Executive Plan and Director Plan in connection with the controlling investment in the Company made by NAFH. See Note 21 (Subsequent Events) for more details on these transactions.
13. Stock-Based Compensation
Stock Options
Pursuant to the Capital Bank Corporation Equity Incentive Plan (“Equity Incentive Plan”), the Company has a stock option plan providing for the issuance of up to 1,150,000 options to purchase shares of the Company’s stock to officers and directors. As of December 31, 2010, options for 288,100 shares of common stock were outstanding and options for 604,359 shares of common stock remained available for future issuance. In addition, there were 566,071 options which were assumed under various plans from previously acquired financial institutions, of which 9,780 remain outstanding. Grants of options are made by the Board of Directors or the Compensation/Human Resources Committee of the Board. All grants must be made with an exercise price at no less than fair market value on the date of grant, must be exercised no later than 10 years from the date of grant, and may be subject to some vesting provisions.
A summary of the activity during the years ending December 31, 2010, 2009 and 2008 of the Company’s stock option plans, including the weighted average exercise price (“WAEP”) is presented below:
|
2010
|
2009
|
2008
|
|||||||||||||||||
|
Shares
|
WAEP
|
Shares
|
WAEP
|
Shares
|
WAEP
|
||||||||||||||
|
Outstanding at beginning of year
|
366,583
|
$
|
11.76
|
377,083
|
$
|
11.71
|
384,075
|
$
|
12.56
|
||||||||||
|
Granted
|
19,250
|
4.38
|
–
|
–
|
63,500
|
6.24
|
|||||||||||||
|
Exercised
|
–
|
–
|
–
|
–
|
(26,591
|
)
|
6.62
|
||||||||||||
|
Forfeited and expired
|
(87,953
|
)
|
8.93
|
(10,500
|
)
|
10.09
|
(43,901
|
)
|
14.31
|
||||||||||
|
Outstanding at end of year
|
297,880
|
$
|
12.11
|
366,583
|
$
|
11.76
|
377,083
|
$
|
11.71
|
||||||||||
|
Options exercisable at year end
|
226,430
|
$
|
13.53
|
285,983
|
$
|
12.33
|
273,783
|
$
|
12.41
|
||||||||||
Capital Bank Corporation – Notes to Consolidated Financial Statements
The following table summarizes information about the Company’s stock options as of December 31, 2010:
|
Exercise Price
|
Number
Outstanding
|
Weighted Average
Remaining Contractual
Life in Years
|
Number
Exercisable
|
Intrinsic
Value
|
|||||||||
|
$3.85 – $6.00
|
78,750
|
8.31
|
24,000
|
$
|
–
|
||||||||
|
$6.01 – $9.00
|
–
|
–
|
–
|
–
|
|||||||||
|
$9.01 – $12.00
|
74,880
|
1.20
|
73,380
|
–
|
|||||||||
|
$12.01 – $15.00
|
20,000
|
5.63
|
13,600
|
–
|
|||||||||
|
$15.01 – $18.00
|
70,000
|
4.16
|
61,200
|
–
|
|||||||||
|
$18.01 – $18.37
|
54,250
|
3.99
|
54,250
|
–
|
|||||||||
|
297,880
|
4.58
|
226,430
|
$
|
–
|
|||||||||
The fair values of options granted are estimated on the date of the grants using the Black-Scholes option pricing model. Option pricing models require the use of highly subjective assumptions, including expected stock volatility, which when changed can materially affect fair value estimates. The expected life of the options used in this calculation is the period the options are expected to be outstanding. Expected stock price volatility is based on the historical volatility of the Company’s common stock for a period approximating the expected life; the expected dividend yield is based on the Company’s historical annual dividend payout; and the risk-free rate is based on the implied yield available on U.S. Treasury issues. The following weighted-average assumptions were used in determining fair value for options granted in the years ended December 31, 2010, 2009 and 2008, respectively:
|
Assumptions
|
2010
|
2009
|
2008
|
||||||
|
Dividend yield
|
–
|
–
|
6.3%
|
||||||
|
Expected volatility
|
33.0%
|
–
|
26.4%
|
||||||
|
Risk-free interest rate
|
3.1%
|
–
|
2.2%
|
||||||
|
Expected life
|
7 years
|
–
|
7 years
|
The weighted average fair value of options granted for the years ended December 31, 2010 and 2008 was $1.80 and $0.77, respectively. There were no options granted in the year ended December 31, 2009.
As of December 31, 2010, the Company had unamortized compensation expense related to stock options of $103,000, which was expected to be amortized over the remaining vesting period of the respective option grants. For the years ended December 31, 2010, 2009 and 2008, the Company recorded compensation expense of $54,000, $50,000 and $32,000, respectively, related to stock options. On January 28, 2011, vesting was accelerated on certain outstanding stock options in connection with the controlling investment in the Company made by NAFH. See Note 21 (Subsequent Events) for more details.
Restricted Stock
Pursuant to the Equity Incentive Plan, the Board of Directors may grant restricted stock to certain employees and Board members at its discretion. There have been no restricted stock grants since 2008. Nonvested shares are subject to forfeiture if employment terminates prior to the vesting dates. The Company expenses the cost of the stock awards, determined to be the fair value of the shares at the date of grant, ratably over the period of the vesting. Nonvested restricted stock for the year ended December 31, 2010 is summarized in the following table:
|
Shares
|
Weighted Average
Grant Date Fair Value
|
||||||
|
Nonvested at beginning of period
|
24,000
|
$
|
8.08
|
||||
|
Granted
|
–
|
–
|
|||||
|
Vested
|
(11,900
|
)
|
10.19
|
||||
|
Forfeited
|
(400
|
)
|
6.00
|
||||
|
Nonvested at end of period
|
11,700
|
$
|
6.00
|
||||
Capital Bank Corporation – Notes to Consolidated Financial Statements
As of December 31, 2010, the Company had 11,700 shares of nonvested restricted stock grants, which represented unrecognized compensation expense of $70,000 to be recognized over the remaining vesting period of the respective grants. Total compensation expense related to these restricted stock awards for the years ended December 31, 2010, 2009 and 2008 was $106,000, $109,000 and $98,000, respectively. On January 28, 2011, vesting was accelerated on certain outstanding nonvested restricted shares in connection with the controlling investment in the Company made by NAFH. See Note 21 (Subsequent Events) for more details.
Deferred Compensation for Non-employee Directors
The Company administered the Capital Bank Corporation Deferred Compensation Plan for Outside Directors (“Deferred Compensation Plan”). Eligible directors may have elected to participate in the Deferred Compensation Plan by deferring all or part of their directors’ fees for at least one calendar year, in exchange for common stock of the Company. If a director did not elect to defer all or part of his fees, then he was not considered a participant in the Deferred Compensation Plan. The amount deferred was equal to 125 percent of total director fees. Each participant was fully vested in his account balance. The Deferred Compensation Plan provided for payment of share units in shares of common stock of the Company after the participant ceased to serve as a director for any reason. For the years ended December 31, 2010, 2009 and 2008, the Company recognized compensation expense of $576,000, $543,000 and $322,000, respectively, related to the Deferred Compensation Plan.
Prior to amendment on November 20, 2008, the Deferred Compensation Plan was classified as a liability-based plan due to certain plan provisions which would have allowed plan participants to receive payments in either cash or shares of common stock. The Deferred Compensation Plan was reclassified to an equity-based plan when amended after the plan terms were modified to require all participants in the Deferred Compensation Plan to receive deferred payments in shares of common stock. Upon amendment in 2008, the liability for plan benefits was adjusted to a fair market value of $943,000 and was reclassified to equity. Benefits under this plan are now recognized as compensation expense and a corresponding increase to equity based on fair value of the deferred stock at date of grant.
On January 28, 2011, all of the share units under the Deferred Compensation Plan became payable to participants in shares of common stock of the Company in connection with the controlling investment in the Company made by NAFH, which was a change in control under the Deferred Compensation Plan. See Note 21 (Subsequent Events) for more details.
14. Income Taxes
Income taxes charged to operations for the years ended December 31, 2010, 2009 and 2008 consisted of the following components:
|
2010
|
2009
|
2008
|
||||||||
|
(Dollars in thousands)
|
||||||||||
|
Current income tax expense (benefit)
|
$
|
(272
|
)
|
$
|
(2,305
|
)
|
$
|
2,508
|
||
|
Deferred income tax expense (benefit)
|
15,396
|
(4,708
|
)
|
(3,715
|
)
|
|||||
|
Total income tax expense (benefit)
|
$
|
15,124
|
$
|
(7,013
|
)
|
$
|
(1,207
|
)
|
||
A reconciliation of the difference between income tax expense (benefit) and the amount computed by applying the statutory federal income tax rate of 34% is as follows:
|
Amount
|
Percent of Pretax Loss
|
||||||||||||||||||
|
(Dollars in thousands)
|
2010
|
2009
|
2008
|
2010
|
2009
|
2008
|
|||||||||||||
|
Tax benefit at statutory rate on net loss before taxes
|
$
|
(15,756
|
)
|
$
|
(4,702
|
)
|
$
|
(19,342
|
)
|
34.00
|
%
|
34.00
|
%
|
34.00
|
%
|
||||
|
State taxes, net of federal benefit
|
(1,894
|
)
|
(558
|
)
|
18
|
4.09
|
4.03
|
(0.03
|
)
|
||||||||||
|
Increase (reduction) in taxes resulting from:
|
|||||||||||||||||||
|
Valuation allowance on deferred tax asset
|
31,821
|
–
|
–
|
(68.67
|
)
|
–
|
–
|
||||||||||||
|
Tax exempt interest
|
(945
|
)
|
(1,184
|
)
|
(1,085
|
)
|
2.04
|
8.56
|
1.91
|
||||||||||
|
Nontaxable BOLI income
|
(238
|
)
|
(622
|
)
|
(324
|
)
|
0.51
|
4.50
|
0.57
|
||||||||||
|
Taxable income on BOLI surrender
|
1,981
|
–
|
–
|
(4.27
|
)
|
–
|
–
|
||||||||||||
|
Goodwill impairment charge
|
–
|
–
|
19,360
|
–
|
–
|
(34.03
|
)
|
||||||||||||
|
Other, net
|
155
|
53
|
166
|
(0.34
|
)
|
(0.38
|
)
|
(0.29
|
)
|
||||||||||
|
$
|
15,124
|
$
|
(7,013
|
)
|
$
|
(1,207
|
)
|
(32.64
|
)%
|
50.71
|
%
|
2.13
|
%
|
||||||
Capital Bank Corporation – Notes to Consolidated Financial Statements
Significant components of deferred tax assets and liabilities as of December 31, 2010 and 2009 were as follows:
|
2010
|
2009
|
||||||
|
(Dollars in thousands)
|
|||||||
|
Deferred tax assets:
|
|||||||
|
Allowance for loan losses
|
$
|
14,143
|
$
|
10,191
|
|||
|
ORE valuation adjustments
|
666
|
84
|
|||||
|
Intangible assets
|
1,808
|
1,743
|
|||||
|
Net unrealized loss on investment securities
|
790
|
–
|
|||||
|
Deferred compensation
|
2,632
|
2,485
|
|||||
|
Deferred rent
|
335
|
242
|
|||||
|
Nonaccrual interest
|
323
|
141
|
|||||
|
Deferred gain on sale-leaseback
|
318
|
359
|
|||||
|
Stock offering costs
|
–
|
640
|
|||||
|
Net operating loss carryforwards
|
11,587
|
–
|
|||||
|
AMT credit carryforward
|
1,831
|
596
|
|||||
|
Other
|
304
|
412
|
|||||
|
Gross deferred tax assets before valuation allowance
|
34,737
|
16,893
|
|||||
|
Less: valuation allowance
|
(31,821
|
)
|
–
|
||||
|
Gross deferred tax assets after valuation allowance
|
2,916
|
16,893
|
|||||
|
Deferred tax liabilities:
|
|||||||
|
Depreciation
|
1,202
|
834
|
|||||
|
FHLB stock dividends
|
343
|
343
|
|||||
|
Net unrealized gain on investment securities
|
–
|
2,510
|
|||||
|
Deferred loan origination costs
|
719
|
493
|
|||||
|
Prepaid expenses
|
515
|
328
|
|||||
|
Other
|
137
|
289
|
|||||
|
Gross deferred tax liabilities
|
2,916
|
4,797
|
|||||
|
Net deferred tax asset
|
$
|
–
|
$
|
12,096
|
|||
As of December 31, 2010 and 2009, the Company had net deferred tax assets before valuation allowance of $31.8 million and $12.1 million, respectively. A valuation allowance is provided when it is more likely than not that some portion of the deferred tax asset will not be realized. Due to a cumulative three-year, pre-tax loss position, significant net operating losses in 2010, and ongoing stress on the Company’s financial performance from elevated credit losses, the Company fully reserved its deferred tax assets as of December 31, 2010. A cumulative loss position makes it more difficult for management to rely on future earnings as a reliable source of future taxable income to realize deferred tax assets. In future periods, the Company may be able to reduce some or all of the valuation allowance upon a determination that it will be able to realize such tax savings.
The Company and its subsidiaries are subject to U.S. federal income tax as well as North Carolina income tax. The Company has concluded all U.S. federal income tax matters for years through 2006.
15. Derivative Instruments
The Company enters into interest rate lock commitments with customers and commitments to sell mortgages to investors. The period of time between the issuance of a mortgage loan commitment and the closing and sale of the mortgage loan is generally less than 60 days. Interest rate lock commitments and forward loan sale commitments represent derivative instruments which are carried at fair value. These derivative instruments do not qualify for hedge accounting. The fair values of the Company’s interest rate lock commitments and forward loan sales commitments are based on current secondary market pricing and are included on the Condensed Consolidated Balance Sheets in mortgage loans held for sale and on the Condensed Consolidated Statements of Operations in mortgage origination and other loan fees.
As of December 31, 2010, the Company had $10.3 million of commitments outstanding to originate mortgage loans held for sale at fixed rates and $17.3 million of forward commitments under best efforts contracts to sell mortgages to three different investors. The fair value adjustments of the interest rate lock commitments and forward loan sales commitments were not considered material as of December 31, 2010. Thus, there was no impact to the Condensed Consolidated Statements of Operations for the year ended December 31, 2010. There were no such commitments outstanding as of December 31, 2009.
Capital Bank Corporation – Notes to Consolidated Financial Statements
16. Commitments, Contingencies and Concentrations of Credit Risk
To meet the financial needs of its customers, the Company is party to financial instruments with off-balance-sheet risk in the normal course of business. These financial instruments are comprised of unused lines of credit, overdraft lines and standby letters of credit. These instruments involve, to varying degrees, elements of credit risk in excess of the amount recognized in the balance sheet.
The Company’s exposure to credit loss in the event of nonperformance by the other party is represented by the contractual amount of those instruments. The Company uses the same credit policies in making these commitments as it does for on-balance-sheet instruments. The amount of collateral obtained, if deemed necessary by the Company, upon extension of credit is based on management’s credit evaluation of the borrower. Collateral held varies but may include trade accounts receivable, property, plant and equipment, and income-producing commercial properties. Since many unused lines of credit expire without being drawn upon, the total commitment amounts do not necessarily represent future cash requirements.
The Company’s exposure to off-balance-sheet credit risk as of December 31, 2010 and 2009 was as follows:
|
2010
|
2009
|
||||||
|
(Dollars in thousands)
|
|||||||
|
Commitments to extend credit
|
$
|
175,318
|
$
|
231,691
|
|||
|
Standby letters of credit
|
10,285
|
9,144
|
|||||
|
Total commitments
|
$
|
185,603
|
$
|
240,835
|
|||
Because the majority of the Company’s lending is concentrated in Alamance, Buncombe, Catawba, Chatham, Cumberland, Granville, Johnston, Lee and Wake counties in North Carolina, economic conditions in those and surrounding counties significantly impact the ability of borrowers to repay their loans. As of December 31, 2010 and 2009, $1.07 billion (85%) and $1.15 billion (83%), respectively, of the total loan portfolio was secured by real estate, including commercial owner occupied loans. The credits in the loan portfolio are diversified, and the Company does not have significant concentrations to any one credit relationship.
The Company has limited partnership investments in two related private investment funds which totaled $1.8 million as of December 31, 2010 and 2009. These investments were included in other assets on the Consolidated Balance Sheets. Remaining capital commitments for these funds totaled $1.6 million as of December 31, 2010.
17. Fair Value
Fair Value Measurements
The Company utilizes fair value measurements to record fair value adjustments to certain assets and liabilities and to determine fair value disclosures. For example, investment securities, available for sale, are recorded at fair value on a recurring basis. Additionally, the Company may be required to record at fair value other assets on a nonrecurring basis, such as loans held for sale, impaired loans and certain other assets. These nonrecurring fair value adjustments typically involve application of lower of cost or market accounting or write-downs of individual assets. The following is a description of valuation methodologies used for assets and liabilities recorded at fair value.
Investment securities, available for sale, are recorded at fair value on a recurring basis. Fair value measurement is based upon quoted prices, if available. If quoted prices are not available, fair values are measured using independent pricing models or other model-based valuation techniques such as the present value of future cash flows, adjusted for the security’s credit rating, prepayment assumptions and other factors such as credit loss assumptions. Level 1 securities include those traded on an active exchange, U.S. Treasury securities that are traded by dealers or brokers in active over-the-counter markets, and money market funds. Level 2 securities include mortgage-backed securities issued by government sponsored entities and corporate entities as well as municipal bonds. Securities classified as Level 3 include corporate debt instruments that are not actively traded and where certain assumptions are used to calculate fair value.
Mortgage loans held for sale are carried at the lower of cost or estimated fair value. The fair values of mortgage loans held for sale are based on commitments on hand from investors within the secondary market for loans with similar characteristics. As such, the fair value adjustment for mortgage loans held for sale is classified as nonrecurring Level 2.
Capital Bank Corporation – Notes to Consolidated Financial Statements
Loans are not recorded at fair value on a recurring basis. However, certain loans are determined to be impaired, and those loans are charged down to estimated fair value. The fair value of impaired loans that are collateral dependent is based on collateral value. For impaired loans that are not collateral dependent, estimated value is based on either an observable market price, if available, or the present value of expected future cash flows. Those impaired loans not requiring a charge-off represent loans for which the estimated fair value exceeds the recorded investments in such loans. When the fair value of an impaired loan is based on an observable market price or a current appraised value with no adjustments, the Company records the impaired loan as nonrecurring Level 2. When an appraised value is not available, or management determines the fair value of the collateral is further impaired below the appraised value, and there is no observable market price, the Company classifies the impaired loan as nonrecurring Level 3.
Other real estate, which includes foreclosed assets, is adjusted to fair value upon transfer of loans and premises to other real estate. Subsequently, other real estate is carried at the lower of carrying value or fair value. Fair value is based upon independent market prices, appraised values of the collateral or management’s estimation of the value of the collateral. When the fair value of the collateral is based on an observable market price or a current appraised value, the Company records other real estate as nonrecurring Level 2. When an appraised value is not available, or management determines the fair value of the collateral is further impaired below the appraised value, and there is no observable market price, the Company classifies other real estate as nonrecurring Level 3.
Assets and liabilities measured at fair value on a recurring basis as of December 31, 2010 and 2009 are summarized below:
|
Quoted Prices in
Active Markets
(Level 1)
|
Significant Other
Observable
Inputs
(Level 2)
|
Significant
Unobservable
Inputs
(Level 3)
|
Total
|
||||||||||
|
(Dollars in thousands)
|
|||||||||||||
|
December 31, 2010
|
|||||||||||||
|
Investment securities – available for sale:
|
|||||||||||||
|
U.S. agency obligations
|
$
|
–
|
$
|
18,934
|
$
|
–
|
$
|
18,934
|
|||||
|
Municipal bonds
|
–
|
21,009
|
–
|
21,009
|
|||||||||
|
Mortgage-backed securities issued by GSEs
|
–
|
165,423
|
–
|
165,423
|
|||||||||
|
Non-agency mortgage-backed securities
|
–
|
6,587
|
–
|
6,587
|
|||||||||
|
Other securities
|
1,738
|
–
|
1,300
|
3,038
|
|||||||||
|
Total
|
$
|
1,738
|
$
|
211,953
|
$
|
1,300
|
$
|
214,991
|
|||||
|
Quoted Prices in
Active Markets
(Level 1)
|
Significant Other
Observable
Inputs
(Level 2)
|
Significant
Unobservable
Inputs
(Level 3)
|
Total
|
||||||||||
|
(Dollars in thousands)
|
|||||||||||||
|
December 31, 2009
|
|||||||||||||
|
Investment securities – available for sale:
|
|||||||||||||
|
U.S. agency obligations
|
$
|
–
|
$
|
1,029
|
$
|
–
|
$
|
1,029
|
|||||
|
Municipal bonds
|
–
|
72,894
|
–
|
72,894
|
|||||||||
|
Mortgage-backed securities issued by GSEs
|
–
|
151,658
|
–
|
151,658
|
|||||||||
|
Non-agency mortgage-backed securities
|
–
|
7,797
|
–
|
7,797
|
|||||||||
|
Other securities
|
748
|
–
|
1,300
|
2,048
|
|||||||||
|
Total
|
$
|
748
|
$
|
233,378
|
$
|
1,300
|
$
|
235,426
|
|||||
Capital Bank Corporation – Notes to Consolidated Financial Statements
The table below presents a reconciliation and income statement classification of gains and losses for all assets measured at fair value on a recurring basis using significant unobservable inputs (Level 3) for year ended December 31, 2010:
|
Level 3
Securities |
||||
|
(Dollars in thousands)
|
||||
|
Balance at beginning of period
|
$
|
1,300
|
||
|
Total unrealized losses included in:
|
||||
|
Net income (loss)
|
–
|
|||
|
Other comprehensive income (loss)
|
–
|
|||
|
Purchases, sales and issuances, net
|
–
|
|||
|
Transfers in and (out) of Level 3
|
–
|
|||
|
Balance at end of period
|
$
|
1,300
|
Assets and liabilities measured at fair value on a nonrecurring basis as of December 31, 2010 and 2009 are summarized below:
|
Quoted Prices in
Active Markets
(Level 1)
|
Significant Other
Observable
Inputs
(Level 2)
|
Significant
Unobservable
Inputs
(Level 3)
|
Total
|
||||||||||
|
(Dollars in thousands)
|
|||||||||||||
|
December 31, 2010
|
|||||||||||||
|
Impaired loans
|
$
|
–
|
$
|
61,006
|
$
|
14,985
|
$
|
75,990
|
|||||
|
Other real estate
|
–
|
18,334
|
–
|
18,334
|
|||||||||
|
December 31, 2009
|
|||||||||||||
|
Impaired loans
|
$
|
–
|
$
|
36,972
|
$
|
34,181
|
$
|
71,153
|
|||||
|
Other real estate
|
–
|
10,732
|
–
|
10,732
|
|||||||||
Fair Value of Financial Instruments
Due to the nature of the Company’s business, a significant portion of its assets and liabilities consist of financial instruments. Accordingly, the estimated fair values of these financial instruments are disclosed. Quoted market prices, if available, are utilized as an estimate of the fair value of financial instruments. Because no quoted market prices exist for a significant part of the Company’s financial instruments, the fair value of such instruments has been derived based on management’s assumptions with respect to future economic conditions, the amount and timing of future cash flows and estimated discount rates. Different assumptions could significantly affect these estimates. Accordingly, the net amounts ultimately collected could be materially different from the estimates presented below. In addition, these estimates are only indicative of the values of individual financial instruments and should not be considered an indication of the fair value of the Company taken as a whole.
Fair values of cash and cash equivalents are equal to the carrying value. Estimated fair values of investment securities are based on quoted market prices, if available, or model-based values from pricing sources for mortgage-backed securities and municipal bonds. Fair value of the loan portfolio has been estimated using the present value of expected future cash flows, discounted at a current market rate for each loan type. The amount of expected credit losses and the timing of those losses were factored into expected future cash flows as of December 31, 2010. At December 31, 2009, the credit risk component of the loan portfolio was set at the recorded allowance for loan losses balance for purposes of estimating fair value. Thus, there was no difference between the carrying amount and estimated fair value attributed to credit risk in the portfolio as of December 31, 2009. Carrying amounts for accrued interest approximate fair value given the short-term nature of interest receivable and payable.
Fair values of time deposits and borrowings are estimated by discounting the future cash flows using the current rates offered for similar deposits and borrowings with the same remaining maturities. Fair value of subordinated debt is estimated based on current market prices for similar trust preferred issues of financial institutions with equivalent credit risk. The estimated fair value for the Company’s subordinated debt is significantly lower than carrying value since credit spreads (i.e., spread to LIBOR) on similar trust preferred issues are currently much wider than when these securities were originally issued. Interest-bearing deposit liabilities and repurchase agreements with no stated maturities are predominately at variable rates and, accordingly, the fair values have been estimated to equal the carrying amounts (the amount payable on demand).
Capital Bank Corporation – Notes to Consolidated Financial Statements
The carrying values and estimated fair values of the Company’s financial instruments as of December 31, 2010 and 2009 are as follows:
|
2010
|
2009
|
||||||||||||
|
(Dollars in thousands)
|
Carrying
Amount
|
Estimated
Fair Value
|
Carrying
Amount
|
Estimated
Fair Value
|
|||||||||
|
Financial assets:
|
|||||||||||||
|
Cash and cash equivalents
|
$
|
66,745
|
$
|
66,745
|
$
|
29,513
|
$
|
29,513
|
|||||
|
Investment securities
|
223,292
|
223,292
|
245,492
|
245,438
|
|||||||||
|
Mortgage loans held for sale
|
6,993
|
6,993
|
–
|
–
|
|||||||||
|
Loans
|
1,218,418
|
1,146,256
|
1,364,221
|
1,368,233
|
|||||||||
|
Accrued interest receivable
|
5,158
|
5,158
|
6,590
|
6,590
|
|||||||||
|
Financial liabilities:
|
|||||||||||||
|
Non-maturity deposits
|
$
|
469,956
|
$
|
469,956
|
$
|
529,257
|
$
|
529,257
|
|||||
|
Time deposits
|
873,330
|
885,105
|
848,708
|
861,378
|
|||||||||
|
Securities sold under agreements to repurchase
|
–
|
–
|
6,543
|
6,543
|
|||||||||
|
Borrowings
|
121,000
|
126,787
|
167,000
|
171,278
|
|||||||||
|
Subordinated debt
|
34,323
|
19,164
|
30,930
|
12,200
|
|||||||||
|
Accrued interest payable
|
1,363
|
1,363
|
1,824
|
1,824
|
|||||||||
|
Unrecognized financial instruments:
|
|||||||||||||
|
Commitments to extend credit
|
175,318
|
167,817
|
231,691
|
231,691
|
|||||||||
|
Standby letters of credit
|
10,285
|
10,285
|
9,144
|
9,144
|
|||||||||
18. Capital Purchase Program
On December 12, 2008, the Company entered into a Securities Purchase Agreement—Standard Terms (“Securities Purchase Agreement”) with the Treasury pursuant to which, among other things, the Company sold to the Treasury for an aggregate purchase price of $41.3 million, 41,279 shares of Series A Preferred Stock and warrants to purchase up to 749,619 shares of common stock (“Warrants”) of the Company.
The Series A Preferred Stock ranked senior to the Company’s common shares and paid a compounding cumulative dividend, in cash, at a rate of 5% per annum for the first five years, and 9% per annum thereafter on the liquidation preference of $1,000 per share. While the Series A Preferred Stock was outstanding, the Company was prohibited from paying any dividend with respect to shares of common stock or repurchasing or redeeming any shares of the Company’s common shares unless all accrued and unpaid dividends were paid on the Series A Preferred Stock for all past dividend periods. The Series A Preferred Stock was non-voting, other than class voting rights on matters that could adversely affect the Series A Preferred Stock. The Series A Preferred Stock was callable at par after three years. In connection with the adoption of ARRA, subject to the approval of the Treasury and the Federal Reserve, the Company could redeem the Series A Preferred Stock at any time regardless of whether or not it had replaced such funds from any other source. The Treasury may also have transferred the Series A Preferred Stock to a third party at any time. The Series A Preferred Stock qualified as Tier 1 capital in accordance with regulatory capital requirements (See Note 19 – Regulatory Matters and Restrictions).
The Warrants had a term of 10 years and were exercisable at any time, in whole or in part, at an exercise price of $8.26 per share (subject to certain anti-dilution adjustments).
The $41.3 million in proceeds was allocated to the Series A Preferred Stock and the Warrants based on their relative fair values at issuance (approximately $40.0 million was allocated to the Series A Preferred Stock and approximately $1.3 million to the Warrants). The difference between the initial value allocated to the Series A Preferred Stock of approximately $40.0 million and the liquidation value of $41.3 million was to be charged to retained earnings and accreted to preferred stock over the first five years of the contract as an adjustment to the dividend yield using the effective yield method. Thus, at the end of the five year accretion period, the preferred stock balance was to have equaled the liquidation value of $41.3 million. The amount charged to retained earnings was deducted from the numerator in calculating basic and diluted earnings per common share. During the years ended December 31, 2010, 2009 and 2008, the Company recorded accretion of the preferred stock discount of $291,000, $288,000 and $12,000, respectively.
Capital Bank Corporation – Notes to Consolidated Financial Statements
The fair value of the Series A Preferred Stock was estimated using a discount rate of 11%, which approximated the dividend yield on the S&P U.S. Preferred Stock Index on the issuance date, and an expected life of five years. The fair value of each Warrant issued was estimated to be $1.42 on the date of issuance using the Black-Scholes option pricing model. The following assumptions were used in determining fair value for the Warrants:
|
Warrant Assumptions
|
December 12, 2008
|
||
|
Dividend yield
|
4.4%
|
||
|
Expected volatility
|
26.4%
|
||
|
Risk-free interest rate
|
2.6%
|
||
|
Expected life
|
10 years
|
On January 28, 2011, all outstanding shares of Series A Preferred Stock and the Warrants were repurchased and cancelled in connection with the controlling investment in the Company made by NAFH. See Note 21 (Subsequent Events) for more details on these transactions.
19. Regulatory Matters and Restrictions
The Company and the Bank are subject to various regulatory capital requirements administered by federal and state banking agencies. Failure to meet minimum capital requirements can initiate certain mandatory, and possibly additional discretionary, actions by regulators that, if undertaken, could have a direct material effect on the Company’s financial position and results of operation. Quantitative measures established by regulation to ensure capital adequacy require the Company and the Bank to maintain minimum amounts and ratios, as set forth in the table below.
On October 28, 2010, the Bank entered into an informal Memorandum of Understanding (“MOU”) with the Federal Depository Insurance Corporation and the North Carolina Commissioner of Banks. An MOU is characterized by regulatory authorities as an informal action that is not published or publicly available and that is used when circumstances warrant a milder form of action than a formal supervisory action, such as a formal written agreement or order. In accordance with the terms of the MOU, the Bank has agreed to, among other things, (i) increase regulatory capital to achieve and maintain a minimum Tier 1 leverage capital ratio of at least 8% and a total risk-based capital ratio of at least 12%, (ii) monitor and reduce its commercial real estate concentration, (iii) timely identify and reduce its overall level of problem loans, (iv) establish and maintain an adequate allowance for loan losses, and (v) ensure adherence to loan policy guidelines. In addition, the Bank must obtain regulatory approval prior to paying any dividends to the Company. The MOU will remain in effect until modified, terminated, lifted, suspended or set aside by the regulatory authorities. In addition, the Company consults with the Federal Reserve Bank of Richmond prior to payment of any dividends or interest on debt.
The Bank, as a North Carolina banking corporation, may pay dividends only out of undivided profits as determined pursuant to North Carolina General Statutes Section 53–87. However, state and federal regulatory authorities may limit payment of dividends by any bank for other reasons, including when it is determined that such a limitation is in the public interest and is necessary to ensure financial soundness of the Bank. On February 1, 2010, the Company announced that its Board of Directors voted to suspend payment of the Company’s quarterly cash dividend to its common shareholders.
The Company and the Bank must maintain minimum capital amounts and ratios. The Company’s and the Bank’s actual capital amounts and ratios as of December 31, 2010 and 2009 and the minimum requirements are presented in the following table:
|
Minimum Requirements To Be:
|
|||||||||||||||||||
|
Actual
|
Adequately Capitalized
|
Well Capitalized
|
|||||||||||||||||
|
(Dollars in thousands)
|
Amount
|
Ratio
|
Amount
|
Ratio
|
Amount
|
Ratio
|
|||||||||||||
|
Capital Bank Corporation:
|
|||||||||||||||||||
|
2010
|
|||||||||||||||||||
|
Total capital (to risk-weighted assets)
|
$
|
126,280
|
9.59
|
%
|
$
|
105,289
|
8.00
|
%
|
n/a
|
n/a
|
|||||||||
|
Tier I capital (to risk-weighted assets)
|
106,186
|
8.07
|
52,644
|
4.00
|
n/a
|
n/a
|
|||||||||||||
|
Tier I capital (to average assets)
|
106,186
|
6.45
|
65,858
|
4.00
|
n/a
|
n/a
|
|||||||||||||
|
2009
|
|||||||||||||||||||
|
Total capital (to risk-weighted assets)
|
$
|
173,261
|
11.41
|
%
|
$
|
121,460
|
8.00
|
%
|
n/a
|
n/a
|
|||||||||
|
Tier I capital (to risk-weighted assets)
|
154,227
|
10.16
|
60,730
|
4.00
|
n/a
|
n/a
|
|||||||||||||
|
Tier I capital (to average assets)
|
154,227
|
8.94
|
69,043
|
4.00
|
n/a
|
n/a
|
|||||||||||||
|
Minimum Requirements To Be:
|
|||||||||||||||||||
|
Actual
|
Adequately Capitalized
|
Well Capitalized
|
|||||||||||||||||
|
(Dollars in thousands)
|
Amount
|
Ratio
|
Amount
|
Ratio
|
Amount
|
Ratio
|
|||||||||||||
|
Capital Bank:
|
|||||||||||||||||||
|
2010
|
|||||||||||||||||||
|
Total capital (to risk-weighted assets)
|
$
|
124,841
|
9.50
|
%
|
$
|
105,112
|
8.00
|
%
|
$
|
131,391
|
10.00
|
%
|
|||||||
|
Tier I capital (to risk-weighted assets)
|
104,774
|
7.97
|
52,556
|
4.00
|
78,834
|
6.00
|
|||||||||||||
|
Tier I capital (to average assets)
|
104,774
|
6.37
|
65,821
|
4.00
|
82,276
|
5.00
|
|||||||||||||
|
2009
|
|||||||||||||||||||
|
Total capital (to risk-weighted assets)
|
$
|
131,469
|
8.68
|
%
|
$
|
121,231
|
8.00
|
%
|
$
|
151,539
|
10.00
|
%
|
|||||||
|
Tier I capital (to risk-weighted assets)
|
112,435
|
7.42
|
60,615
|
4.00
|
90,923
|
6.00
|
|||||||||||||
|
Tier I capital (to average assets)
|
112,435
|
6.52
|
68,934
|
4.00
|
86,167
|
5.00
|
|||||||||||||
The Bank’s regulatory capital ratios as of December 31, 2009 were revised after its Call Reports were restated and amended in 2010 to reflect an adjustment to the regulatory capital treatment of the injection of proceeds from the sale of Series A Preferred Stock from the Company into the Bank in 2008.
20. Parent Company Financial Information
Condensed financial information of the financial holding company of the Bank as of December 31, 2010 and 2009 and for the years ended December 31, 2010, 2009 and 2008 is presented below:
Condensed Balance Sheets
|
As of December 31,
|
|||||||
|
2010
|
2009
|
||||||
|
(Dollars in thousands)
|
|||||||
|
Assets:
|
|||||||
|
Cash
|
$
|
492
|
$
|
1,523
|
|||
|
Equity investment in subsidiary
|
105,278
|
168,633
|
|||||
|
Note receivable due from subsidiary
|
3,393
|
–
|
|||||
|
Other assets
|
2,178
|
2,810
|
|||||
|
Total assets
|
$
|
111,341
|
$
|
172,966
|
|||
|
Liabilities:
|
|||||||
|
Subordinated debt
|
$
|
34,323
|
$
|
30,930
|
|||
|
Dividends payable
|
258
|
1,166
|
|||||
|
Other liabilities
|
72
|
1,085
|
|||||
|
Total liabilities
|
34,653
|
33,181
|
|||||
|
Shareholders’ equity
|
76,688
|
139,785
|
|||||
|
Total liabilities and shareholders’ equity
|
$
|
111,341
|
$
|
172,966
|
|||
Condensed Statements of Operations
|
For the Years Ended December 31,
|
||||||||||
|
2010
|
2009
|
2008
|
||||||||
|
(Dollars in thousands)
|
||||||||||
|
Dividends from wholly-owned subsidiaries
|
$
|
3,548
|
$
|
6,409
|
$
|
2,750
|
||||
|
Undistributed net loss of subsidiaries
|
(63,065
|
)
|
(11,245
|
)
|
(57,256
|
)
|
||||
|
Interest income
|
299
|
46
|
106
|
|||||||
|
Interest expense
|
1,140
|
1,072
|
1,800
|
|||||||
|
Other expense
|
88
|
1,974
|
92
|
|||||||
|
Net loss before income taxes
|
(60,446
|
)
|
(7,836
|
)
|
(56,292
|
)
|
||||
|
Income tax expense (benefit)
|
1,020
|
(1,020
|
)
|
(608
|
)
|
|||||
|
Net loss
|
$
|
(61,466
|
)
|
$
|
(6,816
|
)
|
$
|
(55,684
|
)
|
|
Capital Bank Corporation – Notes to Consolidated Financial Statements
Condensed Statements of Cash Flows
|
For the Years Ended December 31,
|
||||||||||
|
2010
|
2009
|
2008
|
||||||||
|
(Dollars in thousands)
|
||||||||||
|
Operating activities:
|
||||||||||
|
Net loss
|
$
|
(61,466
|
)
|
$
|
(6,816
|
)
|
$
|
(55,684
|
)
|
|
|
Equity in undistributed net loss of subsidiaries
|
63,065
|
11,245
|
57,256
|
|||||||
|
Net change in other assets and liabilities
|
93
|
1,591
|
(412
|
)
|
||||||
|
Net cash provided by operating activities
|
1,692
|
6,020
|
1,160
|
|||||||
|
Investing activities:
|
||||||||||
|
Payments for equity investments in subsidiary
|
(5,065
|
)
|
–
|
(41,279
|
)
|
|||||
|
Payment for note receivable due from subsidiary
|
(3,393
|
)
|
–
|
–
|
||||||
|
Net cash used in investing activities
|
(8,458
|
)
|
–
|
(41,279
|
)
|
|||||
|
Financing activities:
|
||||||||||
|
Proceeds from issuance of subordinated debt
|
3,393
|
–
|
–
|
|||||||
|
Proceeds from issuance of preferred stock, net of issuance costs
|
–
|
–
|
41,160
|
|||||||
|
Proceeds from issuance of common stock
|
5,314
|
700
|
872
|
|||||||
|
Payments to repurchase common stock
|
–
|
–
|
(92
|
)
|
||||||
|
Dividends paid
|
(2,972
|
)
|
(5,527
|
)
|
(3,592
|
)
|
||||
|
Net cash provided by (used in) financing activities
|
5,735
|
(4,827
|
)
|
38,348
|
||||||
|
Net change in cash and cash equivalents
|
(1,031
|
)
|
1,193
|
(1,771
|
)
|
|||||
|
Cash and cash equivalents, beginning of year
|
1,523
|
330
|
2,101
|
|||||||
|
Cash and cash equivalents, end of year
|
$
|
492
|
$
|
1,523
|
$
|
330
|
||||
21. Subsequent Events (Unaudited)
On January 28, 2011, the Company completed the issuance and sale to North American Financial Holdings, Inc. of 71,000,000 shares of common stock for $181,050,000 in cash. As a result of the Investment and following the completion of the Rights Offering on March 11, 2011, NAFH currently owns approximately 83% of the Company’s common stock. The Company’s shareholders approved the issuance of such shares to NAFH, and an amendment to the Company’s articles of incorporation to increase the authorized shares of common stock to 300,000,000 shares from 50,000,000 shares, at a special meeting of shareholders held on December 16, 2010. In connection with the Investment, each existing Company shareholder received one CVR per share that entitles the holder to receive up to $0.75 in cash per contingent value right at the end of a five-year period based on the credit performance of the Bank’s existing loan portfolio.
Also in connection with the Investment, pursuant to an agreement among NAFH, the Treasury, and the Company, the Company’s Series A Preferred Stock and warrant to purchase shares of common stock issued by the Company to the Treasury in connection with the TARP were repurchased. Following the TARP Repurchase, the Series A Preferred Stock and warrant are no longer outstanding, and accordingly the Company no longer expects to be subject to the restrictions imposed by the terms of the Series A Preferred Stock, or certain regulatory provisions of the EESA and the ARRA that are imposed on TARP recipients.
Pursuant to the Investment Agreement, shareholders as of January 27, 2011 received non-transferable rights to purchase a number of shares of the Company’s common stock proportional to the number of shares of common stock held by such holders on such date, at a purchase price equal to $2.55 per share, subject to certain limitations. 1,613,165 shares of the Company’s common stock were issued in exchange for $4,113,570.75 upon completion of the Rights Offering on March 11, 2011.
Upon closing of the investment, R. Eugene Taylor, NAFH’s Chief Executive Officer, Christopher G. Marshall, NAFH’s Chief Financial Officer, and R. Bruce Singletary, NAFH’s Chief Risk Officer, were named as the Company’s CEO, CFO and CRO, respectively, and members of the Company’s Board of Directors. In addition to the aforementioned members of NAFH management, the Company’s Board of Directors was reconstituted with a combination of two existing members (Oscar A. Keller III and Charles F. Atkins) and two additional NAFH-designated members (Peter N. Foss and William A. Hodges).
Capital Bank Corporation – Notes to Consolidated Financial Statements
Also in connection with the closing of the Investment, the Company amended the Executive Plan to waive, with respect to unvested amounts only, any “change in control” provision and corresponding entitlement to change in control benefits that would otherwise be triggered by the Investment or any subsequent transaction or series of transactions that result in an affiliate of NAFH holding the Company’s outstanding voting securities or total voting power. On January 28, 2011, the Company received written waivers from each of the participants in the Executive Plan pursuant to which such executives waived the previously described change in control benefits under the SERP and the accelerated vesting of their outstanding unvested Company stock options in connection with the transactions contemplated by the Investment Agreement. Cash payments made to participants in the Executive Plan upon change in control related to vested benefits totaled $1.1 million. The Director Plan was not amended, and cash payments made to participants upon change in control pursuant to terms of this plan totaled $3.2 million.
In Staff Accounting Bulletin Topic No. 5.J, Push Down Basis of Accounting Required in Certain Limited Circumstances, the Securities and Exchange Commission (“SEC”) staff indicated that it believes push-down accounting is required in purchase transactions that result in an entity becoming substantially wholly owned. In determining whether a company has become substantially wholly owned, the SEC staff has stated that push-down accounting would be required if 95% or more of the company has been acquired, permitted if 80% to 95% has been acquired, and prohibited if less than 80% of the company is acquired. The Company has elected to use push-down accounting, and as such, will apply the acquisition method of accounting due to NAFH’s acquisition of 85% of the Company’s outstanding common stock on January 28, 2011.
22. Selected Quarterly Financial Data (Unaudited)
Selected unaudited quarterly balances and results of operations as of and for the years ended December 31, 2010 and 2009 are as follows:
|
Three Months Ended
|
|||||||||||||
|
December 31
|
September 30
|
June 30
|
March 31
|
||||||||||
|
(Dollars in thousands except per share data)
|
|||||||||||||
|
2010
|
|||||||||||||
|
Total assets
|
$
|
1,585,547
|
$
|
1,649,699
|
$
|
1,694,336
|
$
|
1,739,857
|
|||||
|
Cash and cash equivalents
|
66,745
|
68,069
|
41,417
|
53,341
|
|||||||||
|
Investment securities
|
223,292
|
196,046
|
228,812
|
232,780
|
|||||||||
|
Loans
|
1,254,479
|
1,324,932
|
1,351,101
|
1,376,085
|
|||||||||
|
Allowance for loan losses
|
36,061
|
36,249
|
35,762
|
29,160
|
|||||||||
|
Deposits
|
1,343,286
|
1,359,411
|
1,370,777
|
1,380,539
|
|||||||||
|
Borrowings
|
121,000
|
129,000
|
153,000
|
172,000
|
|||||||||
|
Subordinated debt
|
34,323
|
34,323
|
34,323
|
34,323
|
|||||||||
|
Shareholders’ equity
|
76,688
|
116,103
|
125,479
|
138,792
|
|||||||||
|
Net interest income
|
$
|
12,287
|
$
|
13,382
|
$
|
12,744
|
$
|
12,550
|
|||||
|
Provision for loan losses
|
20,011
|
6,763
|
20,037
|
11,734
|
|||||||||
|
Noninterest income
|
8,004
|
2,500
|
2,514
|
2,531
|
|||||||||
|
Noninterest expense
|
15,129
|
14,210
|
12,380
|
12,590
|
|||||||||
|
Net loss before taxes
|
(14,849
|
)
|
(5,091
|
)
|
(17,159
|
)
|
(9,243
|
)
|
|||||
|
Income tax expense (benefit)
|
18,634
|
3,975
|
(3,576
|
)
|
(3,909
|
)
|
|||||||
|
Net loss
|
(33,483
|
)
|
(9,066
|
)
|
(13,583
|
)
|
(5,334
|
)
|
|||||
|
Dividends and accretion on preferred stock
|
589
|
588
|
589
|
589
|
|||||||||
|
Net loss attributable to common shareholders
|
$
|
(34,072
|
)
|
$
|
(9,654
|
)
|
$
|
(14,172
|
)
|
$
|
(5,923
|
)
|
|
|
Net loss per common share – basic
|
$
|
(2.59
|
)
|
$
|
(0.74
|
)
|
$
|
(1.09
|
)
|
$
|
(0.49
|
)
|
|
|
Net loss per common share – diluted
|
$
|
(2.59
|
)
|
$
|
(0.74
|
)
|
$
|
(1.09
|
)
|
$
|
(0.49
|
)
|
|
|
Three Months Ended
|
|||||||||||||
|
December 31
|
September 30
|
June 30
|
March 31
|
||||||||||
|
(Dollars in thousands except per share data)
|
|||||||||||||
|
2009
|
|||||||||||||
|
Total assets
|
$
|
1,734,668
|
$
|
1,734,950
|
$
|
1,695,342
|
$
|
1,665,611
|
|||||
|
Cash and cash equivalents
|
29,513
|
52,694
|
72,694
|
39,917
|
|||||||||
|
Investment securities
|
245,492
|
262,499
|
268,224
|
286,310
|
|||||||||
|
Loans
|
1,390,302
|
1,357,243
|
1,293,340
|
1,277,064
|
|||||||||
|
Allowance for loan losses
|
26,081
|
19,511
|
18,602
|
18,480
|
|||||||||
|
Deposits
|
1,377,965
|
1,385,250
|
1,380,842
|
1,340,974
|
|||||||||
|
Borrowings
|
167,000
|
147,000
|
117,000
|
127,000
|
|||||||||
|
Subordinated debt
|
30,930
|
30,930
|
30,930
|
30,930
|
|||||||||
|
Shareholders’ equity
|
139,785
|
149,525
|
143,306
|
142,674
|
|||||||||
|
Net interest income
|
$
|
12,978
|
$
|
13,555
|
$
|
12,164
|
$
|
10,181
|
|||||
|
Provision for loan losses
|
11,822
|
3,564
|
1,692
|
5,986
|
|||||||||
|
Noninterest income
|
1,830
|
2,507
|
3,724
|
2,106
|
|||||||||
|
Noninterest expense
|
14,683
|
11,098
|
12,465
|
11,564
|
|||||||||
|
Net income (loss) before taxes
|
(11,697
|
)
|
1,400
|
1,731
|
(5,263
|
)
|
|||||||
|
Income tax expense (benefit)
|
(4,452
|
)
|
(2,143
|
)
|
382
|
(800
|
)
|
||||||
|
Net income (loss)
|
(7,245
|
)
|
3,543
|
1,349
|
(4,463
|
)
|
|||||||
|
Dividends and accretion on preferred stock
|
588
|
590
|
587
|
587
|
|||||||||
|
Net income (loss) attributable to common shareholders
|
$
|
(7,833
|
)
|
$
|
2,953
|
$
|
762
|
$
|
(5,050
|
)
|
|||
|
Net income (loss) per common share – basic
|
$
|
(0.68
|
)
|
$
|
0.26
|
$
|
0.07
|
$
|
(0.45
|
)
|
|||
|
Net income (loss) per common share – diluted
|
$
|
(0.68
|
)
|
$
|
0.26
|
$
|
0.07
|
$
|
(0.45
|
)
|
|||
Board of Directors and Shareholders
Capital Bank Corporation and Subsidiaries
We have audited the accompanying consolidated balance sheet of Capital Bank Corporation (the Company) and Subsidiaries as of December 31, 2010, and the related consolidated statements of operations, changes in shareholders’ equity and loss and cash flows for the year ended December 31, 2010. These consolidated financial statements are the responsibility of the Corporation’s management. Our responsibility is to express an opinion on these consolidated financial statements based on our audit.
We conducted our audit in accordance with the standards of the Public Company Accounting Oversight Board (United States). Those standards require that we plan and perform the audit to obtain reasonable assurance about whether the financial statements are free of material misstatement. An audit includes examining, on a test basis, evidence supporting the amounts and disclosures in the financial statements. An audit also includes assessing the accounting principles used and significant estimates made by management, as well as evaluating the overall financial statement presentation. We believe that our audit provides a reasonable basis for our opinion.
In our opinion, the consolidated financial statements referred to above present fairly, in all material respects, the financial position of Capital Bank Corporation and Subsidiaries as of December 31, 2010 and the results of their operations and their cash flows for the year ended December 31, 2010, in conformity with accounting principles generally accepted in the United States of America.
We also have audited, in accordance with the standards of the Public Company Accounting Oversight Board (United States), of Capital Bank Corporation and subsidiaries’ internal control over financial reporting as of December 31, 2010, based on criteria established in Internal Control—Integrated Framework issued by the Committee of Sponsoring Organizations of the Treadway Commission (COSO) and our report dated March 15, 2011, expressed an unqualified opinion on the effectiveness of Capital Bank Corporation’s internal control over financial reporting.
/s/ ELLIOTT DAVIS PLLC
Charlotte, North Carolina
March 15, 2011
Report of Independent Registered Public Accounting Firm
Board of Directors and Shareholders
of Capital Bank Corporation and Subsidiaries
We have audited the accompanying consolidated balance sheet of Capital Bank Corporation (a North Carolina corporation) and subsidiaries as of December 31, 2009, and the related consolidated statements of operations, changes in shareholders’ equity and comprehensive income (loss) and cash flows for the years in the periods ended December 31, 2009 and 2008. These consolidated financial statements are the responsibility of the Corporation’s management. Our responsibility is to express an opinion on these consolidated financial statements based on our audits.
We conducted our audits in accordance with the standards of the Public Company Accounting Oversight Board (United States). Those standards require that we plan and perform the audits to obtain reasonable assurance about whether the financial statements are free of material misstatement. An audit includes examining, on a test basis, evidence supporting the amounts and disclosures in the financial statements. An audit also includes assessing the accounting principles used and significant estimates made by management, as well as evaluating the overall financial statement presentation. We believe that our audits provide a reasonable basis for our opinion.
In our opinion, the consolidated financial statements referred to above present fairly, in all material respects, the financial position of Capital Bank Corporation and subsidiaries as of December 31, 2009, and the results of its operations and its cash flows for the years in the periods ended December 31, 2009 and 2008, in conformity with accounting principles generally accepted in the United States of America.
We also have audited, in accordance with the standards of the Public Company Accounting Oversight Board (United States), the effectiveness of Capital Bank Corporation’s internal control over financial reporting as of December 31, 2009, based on criteria established in Internal Control—Integrated Framework issued by the Committee of Sponsoring Organizations of the Treadway Commission (COSO) and our report dated March 10, 2010 (not separately included herein), expressed an unqualified opinion.
/s/ GRANT THORNTON LLP
Raleigh, North Carolina
March 10, 2010
ITEM 9. CHANGES IN AND DISAGREEMENTS WITH ACCOUNTANTS ON ACCOUNTING AND FINANCIAL DISCLOSURE
None
ITEM 9A. CONTROLS AND PROCEDURES
Evaluation of Disclosure Controls and Procedures. The Company’s management, under the supervision of and with the participation of the Company’s Chief Executive Officer and Chief Financial Officer, has evaluated the effectiveness of the Company’s disclosure controls and procedures, as such term is defined in Rules 13a-15(e) and 15d-15(e) under the Exchange Act, as of the end of the period covered by this report. Our disclosure controls and procedures were designed to provide reasonable assurance of achieving their control objectives. Based on our evaluation, the Company’s Chief Executive Officer and the Chief Financial Officer have concluded that, as of the end of the period covered by this report, the Company’s disclosure controls and procedures are effective at the reasonable assurance level, in that they are reasonably designed to ensure that all material information relating to the Company required to be included in the Company’s reports filed or submitted under the Exchange Act is recorded, processed, summarized and reported within the time periods specified in the rules and forms of the SEC, and that such information is accumulated and communicated to the Company’s management, including the Company’s Chief Executive Officer and Chief Financial Officer, as appropriate to allow timely decisions regarding required disclosure.
Changes in Internal Control Over Financial Reporting. There have not been any changes in the Company’s internal control over financial reporting, as such term is defined in Rules 13a-15(f) and 15d-15(f) under the Exchange Act, during the Company’s fiscal quarter ended December 31, 2010 that have materially affected, or are reasonably likely to materially affect, the Company’s internal control over financial reporting. From time to time, the Company makes changes to its internal control over financial reporting that are intended to enhance the effectiveness of its internal control over financial reporting and which do not have a material effect on its overall internal control over financial reporting.
Management’s Report on Internal Control Over Financial Reporting. The Company’s management is responsible for establishing and maintaining adequate internal control over financial reporting, as that term is defined in Rules 13a-15(f) and 15d-15(f) under the Exchange Act. The Company’s internal control over financial reporting was designed to provide reasonable assurance regarding the reliability of financial reporting and the preparation of financial statements for external purposes in accordance with accounting principles generally accepted in the United States.
Because of its inherent limitations, internal control over financial reporting may not prevent or detect misstatements. Also, projections of any evaluation of effectiveness to future periods are subject to the risk that controls may become inadequate because of changes in conditions, or that the degree of compliance with policies or procedures may deteriorate.
Management has assessed the effectiveness of the Company’s internal control over financial reporting as of December 31, 2010. Management based its assessment on the criteria for effective internal control over financial reporting set forth by the Committee of Sponsoring Organizations of the Treadway Commission in Internal Control—Integrated Framework. Based on this assessment, management concluded that, as of December 31, 2010, the Company maintained effective internal control over financial reporting.
Elliott Davis PLLC, an independent registered public accounting firm, who audited the consolidated financial statements of the Company included in this Annual Report on Form 10-K, has also audited the effectiveness of the Company’s internal control over financial reporting. Such report is included below.
Limitations on the Effectiveness of Controls. A company’s internal control over financial reporting includes those policies and procedures that (i) pertain to the maintenance of records that, in reasonable detail, accurately and fairly reflect the transactions and dispositions of the assets of the company; (ii) provide reasonable assurance that transactions are recorded as necessary to permit preparation of financial statements in accordance with generally accepted accounting principles, and that receipts and expenditures of the company are being made only in accordance with authorizations of management and directors of the company; and (iii) provide reasonable assurance regarding prevention or timely detection of unauthorized acquisition, use, or disposition of the company’s assets that could have a material effect on the financial statements.
Further, the design of disclosure controls and internal control over financial reporting must reflect the fact that there are resource constraints, and the benefits of controls must be considered relative to their costs. Because of the inherent limitations in all control systems, no evaluation of controls can provide absolute assurance that all control issues and instances of fraud, if any, within the Company have been detected. The Company plans to continue to evaluate the effectiveness of its disclosure controls and procedures and its internal control over financial reporting on an ongoing basis and will take action as appropriate.
Report of Independent Registered Public Accounting Firm
To the Board of Directors and Shareholders
Capital Bank Corporation and Subsidiaries
We have audited Capital Bank Corporation and Subsidiaries’ (the “Company”) internal control over financial reporting as of December 31, 2010, based on criteria established in Internal Control — Integrated Framework issued by the Committee of Sponsoring Organizations of the Treadway Commission. The Company’s management is responsible for maintaining effective internal control over financial reporting and for its assessment of the effectiveness of internal control over financial reporting included in the accompanying Management’s Report on Internal Control Over Financial Reporting. Our responsibility is to express an opinion on the company’s internal control over financial reporting based on our audit.
We conducted our audit in accordance with the standards of the Public Company Accounting Oversight Board (United States). Those standards require that we plan and perform the audit to obtain reasonable assurance about whether effective internal control over financial reporting was maintained in all material respects. Our audit included obtaining an understanding of internal control over financial reporting, assessing the risk that a material weakness exists, and testing and evaluating the design and operating effectiveness of internal control based on the assessed risk. Our audit also included performing such other procedures as we considered necessary in the circumstances. We believe that our audit provides a reasonable basis for our opinion.
A company’s internal control over financial reporting is a process designed to provide reasonable assurance regarding the reliability of financial reporting and the preparation of financial statements for external purposes in accordance with generally accepted accounting principles. A company’s internal control over financial reporting includes those policies and procedures that (a) pertain to the maintenance of records that, in reasonable detail, accurately and fairly reflect the transactions and dispositions of the assets of the company; (b) provide reasonable assurance that transactions are recorded as necessary to permit preparation of financial statements in accordance with generally accepted accounting principles, and that receipts and expenditures of the company are being made only in accordance with authorizations of management and directors of the company; and (c) provide reasonable assurance regarding prevention or timely detection of unauthorized acquisition, use, or disposition of the company’s assets that could have a material effect on the financial statements.
Because of its inherent limitations, internal control over financial reporting may not prevent or detect misstatements. Also, projections of any evaluation of effectiveness to future periods are subject to the risk that controls may become inadequate because of changes in conditions, or that the degree of compliance with the policies or procedures may deteriorate.
In our opinion, Capital Bank Corporation and Subsidiaries maintained, in all material respects, effective internal control over financial reporting as of December 31, 2010, based on criteria established in Internal Control — Integrated Framework issued by the Committee of Sponsoring Organizations of the Treadway Commission.
We have also audited, in accordance with the standards of the Public Company Accounting Oversight Board (United States), the consolidated balance sheet of the Company as of December 31, 2010 and the related consolidated statements of operations, changes in shareholders’ equity and comprehensive loss and cash flows in the year ended December 31, 2010 and our report dated March 15, 2011, expressed an unqualified opinion.
/s/ ELLIOTT DAVIS PLLC
Charlotte, North Carolina
March 15, 2011
ITEM 9A(T). CONTROLS AND PROCEDURES
Not Applicable.
Submission of Matters to a Vote of Security Holders
A Special Meeting of Shareholders was held on December 16, 2010. The following matters were submitted to a vote of the shareholders with the results shown below:
|
Proposal 1: To approve the issuance of shares of the Company’s common stock, no par value per share (“Common Stock”), under the terms of the Investment Agreement, dated November 3, 2010, among the Company, its wholly-owned subsidiary Capital Bank, and North American Financial Holdings, Inc. The votes were cast as follows:
|
|||||
|
Votes For
|
Votes Against
|
Abstained
|
Broker Non-Votes
|
||
|
6,480,642
|
365,389
|
49,440
|
0
|
||
Proposal 1 was approved.
|
Proposal 2: To approve an amendment to the Company’s Articles of Incorporation to increase the authorized shares of Common Stock to three hundred million (300,000,000) shares from fifty million (50,000,000) shares. The votes were cast as follows:
|
|||||
|
Votes For
|
Votes Against
|
Abstained
|
Broker Non-Votes
|
||
|
6,442,376
|
410,462
|
42,633
|
0
|
||
Proposal 2 was approved.
|
Proposal 3: To grant the proxy holders discretionary authority to vote to adjourn the Special Meeting, if necessary, in order to solicit additional proxies in the event that there are not sufficient affirmative votes present at the Special Meeting to approve the proposals that may be considered and acted upon at the Special Meeting. The votes were cast as follows:
|
|||||
|
Votes For
|
Votes Against
|
Abstained
|
Broker Non-Votes
|
||
|
6,341,664
|
448,896
|
104,911
|
0
|
||
Proposal 3 was approved.
The matters listed above are described in detail in our definitive proxy statement dated November 19, 2010 for the Special Meeting of Shareholders held on December 16, 2010.
This Part incorporates certain information from the definitive proxy statement (the “2011 Proxy Statement”) for the Company’s 2011 Annual Meeting of Shareholders, to be filed with the SEC within 120 days after the end of the Company’s fiscal year.
ITEM 10. DIRECTORS, EXECUTIVE OFFICERS AND CORPORATE GOVERNANCE
Information concerning the Company’s executive officers is included under the caption “Executive Officers” in Part I. – Item 1. Business of this report. Information concerning the Company’s directors and filing of certain reports of beneficial ownership is incorporated by reference to the sections entitled “Proposal 1: Election of Directors” and “Section 16(a) Beneficial Ownership Reporting Compliance” in the 2011 Proxy Statement. Information concerning the Audit Committee of the Company’s Board of Directors is incorporated by reference to the section entitled “Information about Our Board of Directors – Board of Directors Committees – Audit Committee” in the 2011 Proxy Statement. There have been no material changes to the procedures by which security holders may recommend nominees to the Company’s Board of Directors since the date of the Company’s Proxy Statement for the Company’s 2010 Annual Meeting of Shareholders.
The Company has adopted a Code of Business Conduct and Ethics (our “Code of Ethics”) that applies to our employees, officers and directors. The complete Code of Ethics is available on our website at www.capitalbank-us.com. If at any time it is not available on our website, we will provide a copy upon written request made to our Corporate Secretary, Capital Bank Corporation, 333 Fayetteville Street, Suite 700, Raleigh, North Carolina 27601, telephone (919) 645-6400. Information on our website is not part of this report. If we amend or grant any waiver from a provision of our Code of Ethics that applies to our executive officers, we will publicly disclose such amendment or waiver as required by applicable law, including by posting such amendment or waiver on our website at www.capitalbank-us.com or by filing a Current Report on Form 8-K.
This information is incorporated by reference from the sections entitled “Compensation,” “Compensation/Human Resources Committee Interlocks and Insider Participation” and “Compensation/Human Resources Committee Report” in the 2011 Proxy Statement.
ITEM 12. SECURITY OWNERSHIP OF CERTAIN BENEFICIAL OWNERS AND MANAGEMENT AND RELATED STOCKHOLDER MATTERS
This information is incorporated by reference from the sections entitled “Principal Shareholders” and “Compensation – Equity Compensation Plan Information” in the 2011 Proxy Statement.
ITEM 13. CERTAIN RELATIONSHIPS AND RELATED TRANSACTIONS, AND DIRECTOR INDEPENDENCE
This information is incorporated by reference from the sections entitled “Director Compensation – Certain Transactions” and “Information about Our Board of Directors” in the 2011 Proxy Statement.
ITEM 14. PRINCIPAL ACCOUNTING FEES AND SERVICES
This information is incorporated by reference from the section entitled “Proposal 2: Ratification of Appointment of Independent Registered Public Accounting Firm – Audit Firm Fee Summary” in the 2011 Proxy Statement.
ITEM 15. EXHIBITS AND FINANCIAL STATEMENT SCHEDULES
|
(a)(1)
|
Financial Statements. The financial statements and information listed below are included in this report in Part II, Item 8:
|
Financial Statements and Information
|
•
|
Consolidated Balance Sheets as of December 31, 2010 and 2009
|
|
|
•
|
Consolidated Statements of Operations for the years ended December 31, 2010, 2009 and 2008
|
|
|
•
|
Consolidated Statements of Changes in Shareholders’ Equity and Comprehensive Income (Loss) for the years ended December 31, 2010, 2009 and 2008
|
|
|
•
|
Consolidated Statements of Cash Flows for the years ended December 31, 2010, 2009 and 2008
|
|
|
•
|
Notes to Consolidated Financial Statements
|
|
|
•
|
Reports of Independent Registered Public Accounting Firm
|
|
|
(a)(2)
|
Financial Statement Schedules. All applicable financial statement schedules required under Regulation S-X and pursuant to Industry Guide 3 under the Securities Act have been included in the Notes to the Consolidated Financial Statements or in Part II Item 7.
|
|
|
(a)(3)
|
Exhibits. The exhibits required by Item 601 of Regulation S-K are listed in the Exhibit Index immediately following the signature pages to this report.
|
|
SIGNATURES
Pursuant to the requirements of Section 13 or 15(d) of the Securities Exchange Act of 1934, the registrant has duly caused this report to be signed on its behalf by the undersigned, thereunto duly authorized, in Raleigh, North Carolina, on the 15th day of March 2011.
|
CAPITAL BANK CORPORATION
|
|||
|
By:
|
/s/ Christopher G. Marshall
|
||
|
Christopher G. Marshall
|
|||
|
Chief Financial Officer
|
|||
SIGNATURES AND POWER OF ATTORNEY
KNOW ALL MEN BY THESE PRESENTS, that each person whose signature appears below constitutes and appoints R. Eugene Taylor and Christopher G. Marshall, and each of them, with full power to act without the other, his true and lawful attorneys-in-fact and agents, with full powers of substitution and resubstitution, for him and in his name, place and stead, in any and all capacities, to sign any or all amendments to this report, and to file the same, with all exhibits thereto, and other documents in connection therewith, with the Securities and Exchange Commission, granting unto said attorneys-in-fact and agents full power and authority to do and perform each and every act and thing requisite and necessary to be done in and about the premises, as fully for all intents and purposes as he might or could do in person, hereby ratifying and confirming all that said attorneys-in-fact and agents, or their substitutes, may lawfully do or cause to be done by virtue hereof.
Pursuant to the requirements of the Securities Exchange Act of 1934, this report has been signed below by the following persons on behalf of the registrant in the capacities indicated and on March 15, 2011.
|
Signature
|
Title
|
||
|
/s/ R. Eugene Taylor
|
President, Chief Executive Officer
|
||
|
R. Eugene Taylor
|
and Chairman of the Board
|
||
|
(Principal Executive Officer)
|
|||
|
/s/ Christopher G. Marshall
|
Executive Vice President, Chief Financial Officer
|
||
|
Christopher G. Marshall
|
and Director
|
||
|
(Principal Financial Officer and Principal
|
|||
|
Accounting Officer)
|
|||
|
/s/ R. Bruce Singletary
|
Executive Vice President, Chief Risk Officer
|
||
|
R. Bruce Singletary
|
and Director
|
||
|
/s/ Charles F. Atkins
|
Director
|
||
|
Charles F. Atkins
|
|||
|
/s/ Peter N. Foss
|
Director
|
||
|
Peter N. Foss
|
|||
|
/s/ William A. Hodges
|
Director
|
||
|
William A. Hodges
|
|||
|
/s/ Oscar A. Keller, III
|
Director
|
||
|
Oscar A. Keller, III
|
EXHIBIT INDEX
|
Exhibit No.
|
Description
|
|
|
2.01
|
Merger Agreement, dated June 29, 2005, by and among Capital Bank Corporation and 1st State Bancorp, Inc. (incorporated by reference to Exhibit 2.1 to the Company’s Current Report on Form 8-K filed with the SEC on June 29, 2005)
|
|
|
2.02
|
List of Schedules Omitted from Merger Agreement included as Exhibit 2.1 above (incorporated by reference to Exhibit 2.2 to the Company’s Current Report on Form 8-K filed with the SEC on June 29, 2005)
|
|
|
3.01
|
Articles of Incorporation of the Company, as amended**
|
|
|
3.02
|
Bylaws of the Company, as amended to date (incorporated by reference to Exhibit 3.02 to the Company’s Annual Report on Form 10-K filed with the SEC on March 29, 2002)
|
|
|
4.01
|
Specimen Common Stock Certificate of the Company (incorporated by reference to Exhibit 4.1 to the Company’s Registration Statement on Form S-4 (File No. 333-65853) filed with the SEC on October 19, 1998, as amended on November 10, 1998, December 21, 1998 and February 8, 1999)
|
|
|
4.02
|
In accordance with Item 601(b) (4) (iii) (A) of Regulation S-K, certain instruments respecting long-term debt of the registrant have been omitted but will be furnished to the SEC upon request.
|
|
|
4.03
|
Specimen Series A Preferred Stock Certificate of the Company (incorporated by reference to Exhibit 4.3 to the Company’s Current Report on Form 8-K filed with the SEC on December 15, 2008)
|
|
|
4.04
|
Warrant to Purchase up to 749,619 Shares of Common Stock (incorporated by reference to Exhibit 4.2 to the Company’s Current Report on Form 8-K filed with the SEC on December 15, 2008)
|
|
|
10.01
|
Equity Incentive Plan (incorporated by reference to Exhibit 10.02 to the Company’s Annual Report on Form 10-K filed with the SEC on March 28, 2003)*
|
|
|
10.02
|
Form of Stock Award Agreement under the Capital Bank Corporation Equity Incentive Plan (incorporated by reference to Exhibit 10.1 to the Company’s Current Report on Form 8-K filed with the SEC on December 28, 2007)*
|
|
|
10.03
|
Form of Incentive Stock Option Agreement under the Capital Bank Corporation Equity Incentive Plan (incorporated by reference to Exhibit 99.3 to the Company’s Registration Statement on Form S-8 (File No. 333-160699) filed with the SEC on July 20, 2009)*
|
|
|
10.04
|
Amended and Restated Deferred Compensation Plan for Outside Directors (incorporated by reference from Appendix A to the Company’s Proxy Statement for Annual Meeting held on May 26, 2005)*
|
|
|
10.05
|
Amended and Restated Deferred Compensation Plan for Outside Directors, effective November 20, 2008 (incorporated by reference to Exhibit 10.4 to the Company’s Annual Report on Form 10-K filed with the SEC on March 16, 2009)*
|
|
|
10.06
|
Capital Bank Defined Benefit Supplemental Executive Retirement Plan (incorporated by reference to Exhibit 10.1 to the Company’s Current Report on Form 8-K filed with the SEC on May 27, 2005)*
|
|
|
10.07
|
Amended and Restated Capital Bank Defined Benefit Supplemental Executive Retirement Plan, effective December 18, 2008 (incorporated by reference to Exhibit 10.6 to the Company’s Annual Report on Form 10-K filed with the SEC on March 16, 2009)*
|
|
|
10.08
|
Capital Bank Supplemental Retirement Plan for Directors (incorporated by reference to Exhibit 10.2 to the Company’s Current Report on Form 8-K filed with the SEC on May 27, 2005)*
|
|
|
10.09
|
Amended and Restated Capital Bank Supplemental Retirement Plan for Directors, effective December 18, 2008 (incorporated by reference to Exhibit 10.8 to the Company’s Annual Report on Form 10-K filed with the SEC on March 16, 2009)*
|
|
Exhibit No.
|
Description
|
|
|
10.10
|
Amended and Restated Employment Agreement, dated September 17, 2008, by and between Capital Bank Corporation, Capital Bank and B. Grant Yarber (incorporated by reference to Exhibit 10.1 to the Company’s Current Report on Form 8-K filed with the SEC on September 22, 2008)*
|
|
|
10.11
|
Employment Agreement, dated January 31, 2008, by and between Michael R. Moore and Capital Bank Corporation (incorporated by reference to Exhibit 10.2 to the Company’s Current Report on Form 8-K filed with the SEC on January 31, 2008)*
|
|
|
10.12
|
Employment Agreement, dated January 25, 2008, by and between David C. Morgan and Capital Bank Corporation (incorporated by reference to Exhibit 10.1 to the Company’s Current Report on Form 8-K filed with the SEC on January 31, 2008)*
|
|
|
10.13
|
Amended and Restated Employment Agreement, dated September 17, 2008, by and between Capital Bank Corporation, Capital Bank and Mark Redmond (incorporated by reference to Exhibit 10.2 to the Company’s Current Report on Form 8-K filed with the SEC on September 22, 2008)*
|
|
|
10.14
|
Letter Agreement, dated November 18, 2008, by and between Capital Bank and Ralph J. Edwards (incorporated by reference to Exhibit 10.14 to the Company’s Annual Report on Form 10-K filed with the SEC on March 10, 2010)*
|
|
|
10.15
|
Lease Agreement, dated November 16, 1999, between Crabtree Park, LLC and the Company (incorporated by reference to Exhibit 10.01 to the Company’s Annual Report on Form 10-K filed with the SEC on March 27, 2000)
|
|
|
10.16
|
Lease Agreement, dated November 1, 2005, by and between Capital Bank Corporation and 333 Ventures, LLC (incorporated by reference to Exhibit 10.1 to the Company’s Current Report on Form 8-K filed with the SEC on November 28, 2005)
|
|
|
10.17
|
Agreement, dated November 2001, between Fiserv Solutions, Inc. and the Company (incorporated by reference to Exhibit 10.08 to the Company’s Annual Report on Form 10-K filed with the SEC on March 29, 2002)
|
|
|
10.18
|
Letter Agreement, dated December 12, 2008, including Securities Purchase Agreement—Standard Terms incorporated by reference therein, by and between the Company and the United States Department of the Treasury (incorporated by reference to Exhibit 10.1 to the Company’s Current Report on Form 8-K filed with the SEC on December 15, 2008)
|
|
|
10.19
|
Form of Waiver with Senior Executive Officers (incorporated by reference to Exhibit 10.2 to the Company’s Current Report on Form 8-K filed with the SEC on December 15, 2008)
|
|
|
10.20
|
Form of Letter Agreement Limiting Executive Compensation with Senior Executive Officers (incorporated by reference to Exhibit 10.3 to the Company’s Current Report on Form 8-K filed with the SEC on December 15, 2008)
|
|
|
10.21
|
Summary of Material Terms of the Capital Bank Annual Incentive Plan (incorporated by reference to Exhibit 10.1 to the Company’s Quarterly Report on Form 10-Q for the period ended March 31, 2008 filed with the SEC on May 8, 2008)*
|
|
|
10.22
|
Purchase and Assumption Agreement, dated September 25, 2008, by and between Capital Bank, a wholly-owned subsidiary of Capital Bank Corporation, and Omni National Bank (incorporated by reference to Exhibit 10.1 to the Company’s Quarterly Report on Form 10-Q for the period ended September 30, 2008 filed with the SEC on November 7, 2008)
|
|
|
10.22
|
Real Estate Purchase Agreement, dated October 6, 2008, by and between Capital Bank, a wholly-owned subsidiary of Capital Bank Corporation, Michael R. Moore and Viola V. Moore (incorporated by reference to Exhibit 10.1 to the Company’s Current Report on Form 8-K filed with the SEC on October 9, 2008)
|
|
Exhibit No.
|
Description
|
|
| 10.23 |
Letter of Intent, dated December 13, 2009, between Patriot Financial Partners, L.P., Patriot Financial Partners Parallel, L.P. and Capital Bank Corporation (incorporated by reference to Exhibit 10.1 to the Company’s Current Report on Form 8-K filed with the SEC on December 14, 2009)
|
|
|
10.24
|
Investment Agreement, dated November 3, 2010, among Capital Bank Corporation, Capital Bank and North American Financial Holdings, Inc. (incorporated by reference to Exhibit 10.1 to the Company’s Current Report on Form 8-K filed with the SEC on November 4, 2010)
|
|
|
10.25
|
First Amendment to Investment Agreement, dated January 14, 2011, among Capital Bank Corporation, Capital Bank and North American Financial Holdings, Inc. (incorporated by reference to Exhibit 10.1 to the Company’s Current Report on Form 8-K filed with the SEC on January 14, 2010)
|
|
|
10.26
|
Amendment to Amended and Restated Employment Agreement, dated January 14, 2011, among Capital Bank, Capital Bank Corporation, and B. Grant Yarber (incorporated by reference to Exhibit 10.2 to the Company’s Current Report on Form 8-K filed with the SEC on January 14, 2010)*
|
|
|
10.27
|
Amendment to Employment Agreement, dated January 14, 2011, among Capital Bank, Capital Bank Corporation, and Michael R. Moore (incorporated by reference to Exhibit 10.3 to the Company’s Current Report on Form 8-K filed with the SEC on January 14, 2010)*
|
|
|
10.28
|
Amendment to Employment Agreement, dated January 14, 2011, among Capital Bank, Capital Bank Corporation, and David C. Morgan (incorporated by reference to Exhibit 10.4 to the Company’s Current Report on Form 8-K filed with the SEC on January 14, 2010)*
|
|
|
10.29
|
Amendment to Amended and Restated Employment Agreement, dated January 14, 2011, among Capital Bank, Capital Bank Corporation, and Mark Redmond (incorporated by reference to Exhibit 10.5 to the Company’s Current Report on Form 8-K filed with the SEC on January 14, 2010)*
|
|
|
10.30
|
Contingent Value Rights Agreement dated January 28, 2011, by Capital Bank Corporation (incorporated by reference to Exhibit 10.1 to the Company’s Current Report on Form 8-K filed with the SEC on January 31, 2010)
|
|
|
10.31
|
Registration Rights Agreement dated January 28, 2011, by and between Capital Bank Corporation and North American Financial Holdings, Inc. (incorporated by reference to Exhibit 10.2 to the Company’s Current Report on Form 8-K filed with the SEC on January 31, 2010)
|
|
|
10.32
|
Form of Indemnification Agreement by and between Capital Bank Corporation and its directors and certain officers (incorporated by reference to Exhibit 10.3 to the Company’s Current Report on Form 8-K filed with the SEC on January 31, 2010)
|
|
|
10.33
|
Form of Indemnification Agreement by and between Capital Bank and its directors and certain officers (incorporated by reference to Exhibit 10.4 to the Company’s Current Report on Form 8-K filed with the SEC on January 31, 2010)
|
|
|
10.34
|
Amendment to Capital Bank Defined Benefit Supplemental Retirement Plan (incorporated by reference to Exhibit 10.5 to the Company’s Current Report on Form 8-K filed with the SEC on January 31, 2010)*
|
|
|
21.01
|
Subsidiaries of the Registrant**
|
|
|
23.01
|
Consent of Independent Registered Public Accounting Firm**
|
|
|
23.02
|
Consent of Independent Registered Public Accounting Firm**
|
|
|
31.01
|
Certification of Chief Executive Officer Pursuant to Rule 13a-14(a) or Rule 15d-14(a), As Adopted Pursuant to Section 302 of the Sarbanes-Oxley Act of 2002**
|
|
|
Exhibit No.
|
Description
|
|
| 31.02 |
Certification of Chief Financial Officer Pursuant to Rule 13a-14(a) or Rule 15d-14(a), As Adopted Pursuant to Section 302 of the Sarbanes-Oxley Act of 2002**
|
|
|
32.01
|
Certification Pursuant to 18 U.S.C. Section 1350, As Adopted Pursuant to Section 906 of The Sarbanes-Oxley Act of 2002. [This exhibit is being furnished pursuant to Section 906 of the Sarbanes-Oxley Act of 2002 and shall not, except to the extent required by that act, be deemed to be incorporated by reference into any document or filed herewith for purposes of liability under the Securities Exchange Act of 1934, as amended, or the Securities Act of 1933, as amended, as the case may be.]**
|
|
|
32.02
|
Certification Pursuant to 18 U.S.C. Section 1350, As Adopted Pursuant to Section 906 of The Sarbanes-Oxley Act of 2002. [This exhibit is being furnished pursuant to Section 906 of the Sarbanes-Oxley Act of 2002 and shall not, except to the extent required by that act, be deemed to be incorporated by reference into any document or filed herewith for purposes of liability under the Securities Exchange Act of 1934, as amended, or the Securities Act of 1933, as amended, as the case may be.]**
|
|
|
*
|
Represents a management contract or compensatory plan or arrangement
|
|
**
|
Filed herewith
|
|
Exhibit 21.01
|
SUBSIDIARIES
Capital Bank
(North Carolina)
Capital Bank Investment Services, Inc.
(North Carolina)
Capital Bank Statutory Trust I
(Delaware)
Capital Bank Statutory Trust II
(Delaware)
Capital Bank Statutory Trust III
(Delaware)
CB Trustee, LLC
(North Carolina)
|
Exhibit 23.01
|
CONSENT OF INDEPENDENT REGISTERED PUBLIC ACCOUNTING FIRM
We have issued our reports dated March 15, 2011, with respect to the consolidated financial statements and internal control over financial reporting included in the Annual Report of Capital Bank Corporation on Form 10-K for the year ended December 31, 2010. We hereby consent to the incorporation by reference of said reports in the Registration Statements of Capital Bank Corporation on Form S-3 (File No. 333-155567, effective November 21, 2008) and Forms S-8 (File No. 333-148273, effective December 21, 2007, No. 333-125195, effective May 24, 2005, No. 333-42628, effective July 31, 2000, No. 333-82602, effective February 12, 2002, No. 333-102774, effective January 28, 2003, No. 333-76919, effective April 23, 1999, No. 333-151782, effective June 19, 2008, No. 333-160689, effective July 20, 2009 and No. 333-160699, effective July 20, 2009).
/s/ ELLIOTT DAVIS PLLC
Charlotte, North Carolina
March 15, 2011
|
Exhibit 23.02
|
CONSENT OF INDEPENDENT REGISTERED PUBLIC ACCOUNTING FIRM
We have issued our report dated March 10, 2010, with respect to the consolidated financial statements included in the Annual Report of Capital Bank Corporation on Form 10-K for the year ended December 31, 2010. We hereby consent to the incorporation by reference of said reports in the Registration Statements of Capital Bank Corporation on Form S-3 (File No. 333-155567, effective November 21, 2008) and Forms S-8 (File No. 333-148273, effective December 21, 2007, No. 333-125195, effective May 24, 2005, No. 333-42628, effective July 31, 2000, No. 333-82602, effective February 12, 2002, No. 333-102774, effective January 28, 2003, No. 333-76919, effective April 23, 1999, No. 333-151782, effective June 19, 2008, No. 333-160689, effective July 20, 2009 and No. 333-160699, effective July 20, 2009).
/s/ GRANT THORNTON LLP
Raleigh, North Carolina
March 15, 2011
- 113 -