Attached files
| file | filename |
|---|---|
| 8-K - 8-K - BROADWIND, INC. | a11-7939_18k.htm |
| EX-99.1 - EX-99.1 - BROADWIND, INC. | a11-7939_1ex99d1.htm |
Exhibit 99.2
|
|
Investor Teleconference March 15, 2011 4Q10 and year-end 2010 results |
|
|
2 Industry Data and Forward-Looking Statements Broadwind obtained the industry and market data used throughout this presentation from its own research, internal surveys and studies conducted by third parties, independent industry associations or general publications and other publicly available information. Independent industry publications and surveys generally state that they have obtained information from sources believed to be reliable, but do not guarantee the accuracy and completeness of such information. Forecasts are particularly likely to be inaccurate, especially over long periods of time. We are not aware of any misstatements in the industry data we have presented herein, but estimates involve risks and uncertainties and are subject to change based on various factors beyond Broadwind’s control. This presentation includes “forward-looking statements” within the meaning of the safe harbor provisions of the United States Private Securities Litigation Reform Act of 1995 – that is, statements related to future, not past, events. Forward-looking statements are based on current expectations and include any statement that does not directly relate to a current or historical fact. In this context, forward-looking statements often address our expected future business and financial performance, and often contain words such as “anticipate”, “believe”, “intend”, “expect”, “plan”, “will” or other similar words. These forward-looking statements involve certain risks and uncertainties that ultimately may not prove to be accurate and are subject to change based on various factors. Actual results and future events could differ materially from those anticipated in such statements. For further discussion of risks and uncertainties, individuals should refer to Broadwind's filings with the Securities and Exchange Commission. Broadwind undertakes no obligation and does not intend to update these forward-looking statements to reflect events or circumstances occurring after this presentation. You are cautioned not to place undue reliance on these forward-looking statements, which speak only as of the date of this presentation. All forward-looking statements are qualified in their entirety by this cautionary statement. This document contains non-GAAP financial information. Broadwind’s management believes that certain non-GAAP financial measures may provide users of this financial information meaningful comparisons between current results and results in prior operating periods. Management believes that these non-GAAP financial measures can provide additional meaningful reflection of underlying trends of the business because they provide a comparison of historical information that excludes certain infrequently occurring or non-operational items that impact the overall comparability. Non-GAAP financial measures should be viewed in addition to, and not as an alternative for, the Company’s reported results prepared in accordance with GAAP. Please see Broadwind’s earnings release dated as of March 15, 2011 for a reconciliation of certain non-GAAP measures presented in this document. |
|
|
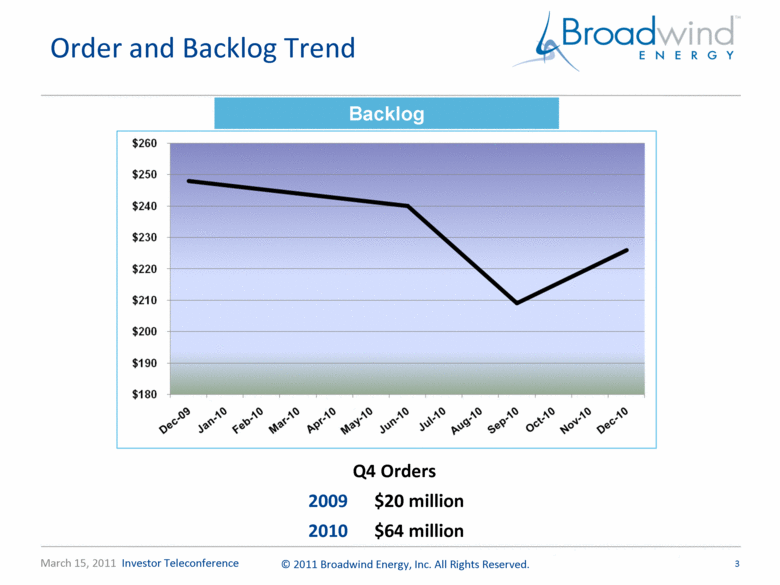
Order and Backlog Trend 3 Backlog Q4 Orders $20 million $64 million |
|
|
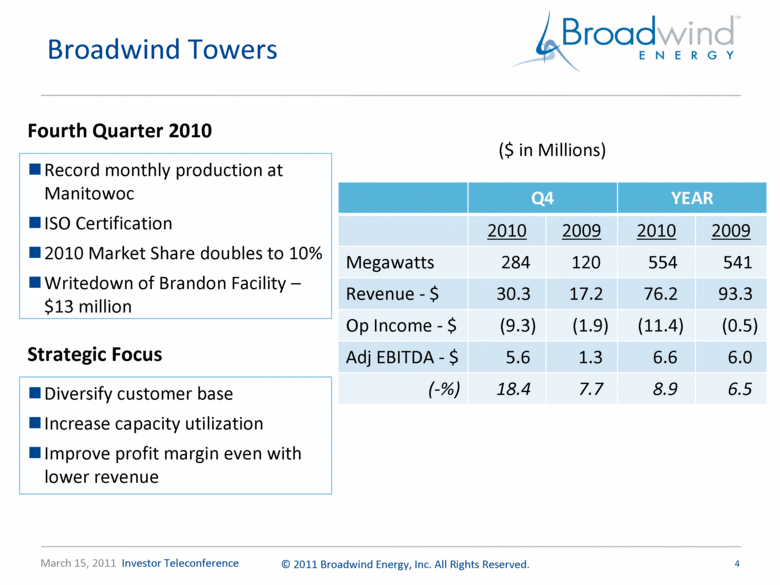
Broadwind Towers Fourth Quarter 2010 Record monthly production at Manitowoc ISO Certification 2010 Market Share doubles to 10% Writedown of Brandon Facility – $13 million ($ in Millions) Q4 YEAR 2010 2009 2010 2009 Megawatts 284 120 554 541 Revenue - $ 30.3 17.2 76.2 93.3 Op Income - $ (9.3) (1.9) (11.4) (0.5) Adj EBITDA - $ 5.6 1.3 6.6 6.0 (-%) 18.4 7.7 8.9 6.5 4 Diversify customer base Increase capacity utilization Improve profit margin even with lower revenue Strategic Focus |
|
|
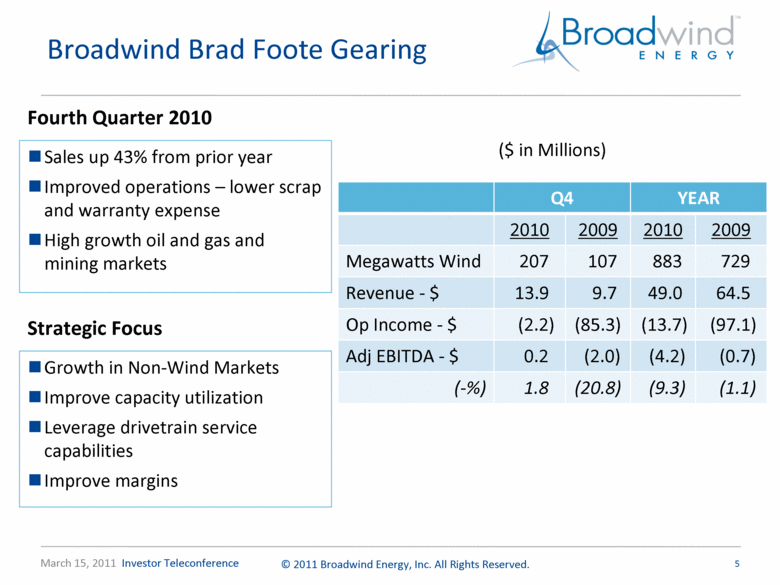
Broadwind Brad Foote Gearing Fourth Quarter 2010 Sales up 43% from prior year Improved operations – lower scrap and warranty expense High growth oil and gas and mining markets ($ in Millions) Q4 YEAR 2010 2009 2010 2009 Megawatts Wind 207 107 883 729 Revenue - $ 13.9 9.7 49.0 64.5 Op Income - $ (2.2) (85.3) (13.7) (97.1) Adj EBITDA - $ 0.2 (2.0) (4.2) (0.7) (-%) 1.8 (20.8) (9.3) (1.1) 5 Growth in Non-Wind Markets Improve capacity utilization Leverage drivetrain service capabilities Improve margins Strategic Focus |
|
|
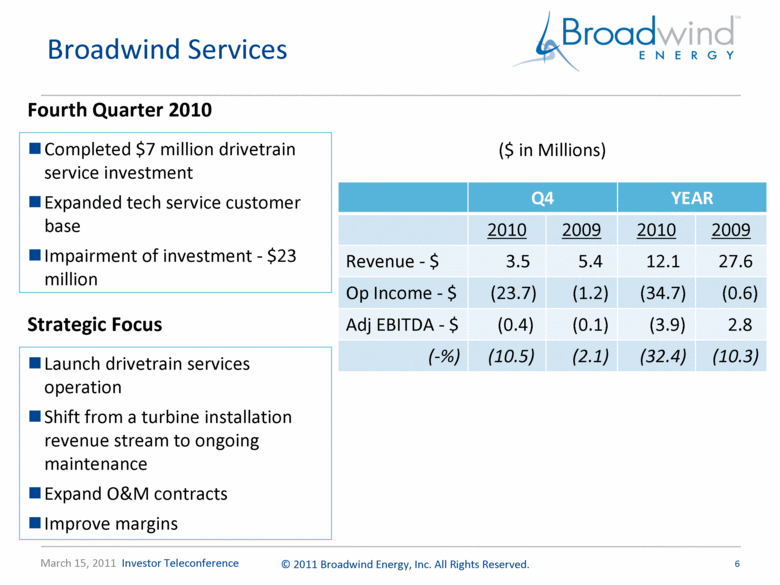
Broadwind Services Fourth Quarter 2010 Completed $7 million drivetrain service investment Expanded tech service customer base Impairment of investment - $23 million ($ in Millions) Q4 YEAR 2010 2009 2010 2009 Revenue - $ 3.5 5.4 12.1 27.6 Op Income - $ (23.7) (1.2) (34.7) (0.6) Adj EBITDA - $ (0.4) (0.1) (3.9) 2.8 (-%) (10.5) (2.1) (32.4) (10.3) 6 Launch drivetrain services operation Shift from a turbine installation revenue stream to ongoing maintenance Expand O&M contracts Improve margins Strategic Focus |
|
|
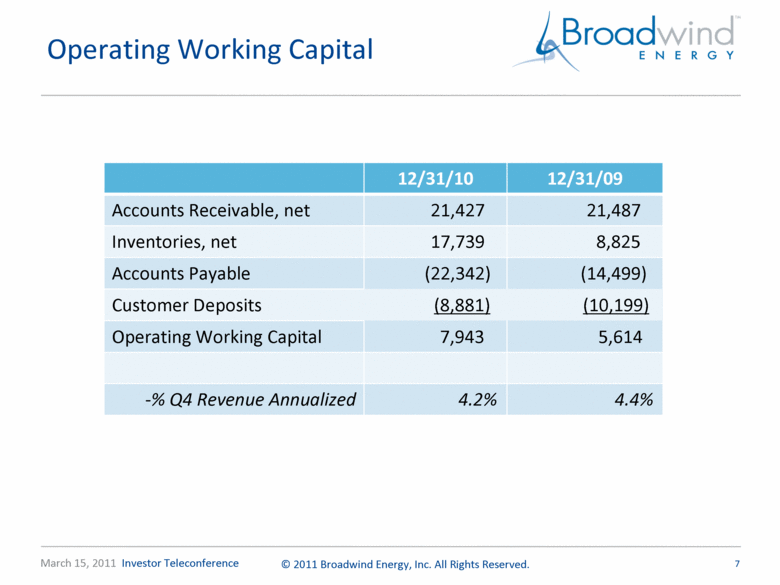
Operating Working Capital 7 12/31/10 12/31/09 Accounts Receivable, net 21,427 21,487 Inventories, net 17,739 8,825 Accounts Payable (22,342) (14,499) Customer Deposits (8,881) (10,199) Operating Working Capital 7,943 5,614 -% Q4 Revenue Annualized 4.2% 4.4% |
|
|
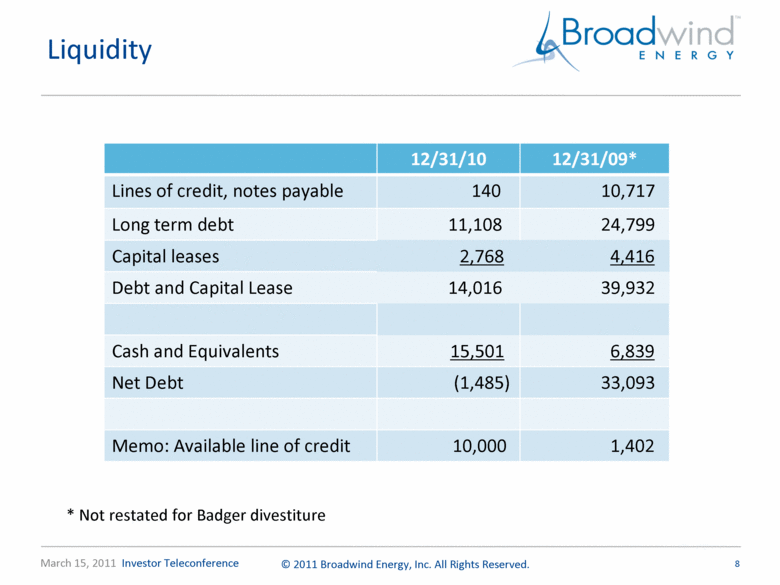
Liquidity 8 12/31/10 12/31/09* Lines of credit, notes payable 140 10,717 Long term debt 11,108 24,799 Capital leases 2,768 4,416 Debt and Capital Lease 14,016 39,932 Cash and Equivalents 15,501 6,839 Net Debt (1,485) 33,093 Memo: Available line of credit 10,000 1,402 * Not restated for Badger divestiture |
|
|
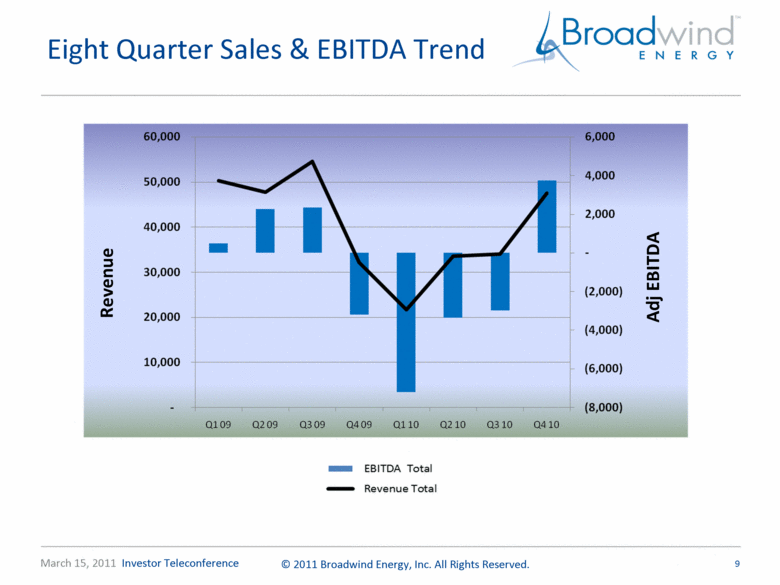
Eight Quarter Sales & EBITDA Trend 9 Revenue Adj EBITDA |

