Attached files
Table of Contents
UNITED STATES
SECURITIES AND EXCHANGE COMMISSION
Washington, D.C. 20549
FORM 10-K
ANNUAL REPORT PURSUANT TO SECTION 13 OR 15(d) OF THE SECURITIES EXCHANGE ACT OF 1934
For the fiscal year ended December 31, 2010
Commission file number: 000-33063
SIERRA BANCORP
(Exact name of registrant as specified in its charter)
| California | 33-0937517 | |
| (State of incorporation) | (I.R.S. Employer Identification Number) |
86 North Main Street, Porterville, California 93257
(Address of principal executive offices) (Zip Code)
(559) 782-4900
Registrant’s telephone number, including area code
Securities registered pursuant to Section 12(b) of the Act:
| Title of Each Class |
Name of Each Exchange on Which Registered | |
| Common Stock, No Par Value |
The NASDAQ Stock Market LLC (NASDAQ Global Select Market) |
Securities registered pursuant to Section 12(g) of the Act: None
Indicate by check mark if the registrant is a well-known seasoned issuer, as defined in Rule 405 of the Securities Act. ¨ Yes þ No
Indicate by check mark if the registrant is not required to file reports pursuant to Section 13 or Section 15(d) of the Act. ¨ Yes þ No
Indicate by check mark whether the registrant (1) has filed all reports required to be filed by Section 13 or 15(d) of the Securities Exchange Act of 1934 during the preceding 12 months (or for such shorter period that the registrant was required to file such reports), and (2) has been subject to such filing requirements for the past 90 days. þ Yes ¨ No
Indicate by check mark whether the Registrant has submitted electronically and posted on its corporate Web site, if any, every Interactive Data File required to be submitted and posted pursuant to Rule 405 of Regulation S-T during the preceding 12 months (or for such shorter period that the registrant was required to submit and post such files). ¨ Yes ¨ No
Indicate by check mark if disclosure of delinquent filers pursuant to Item 405 of Regulation S-K is not contained herein, and will not be contained, to the best of registrant’s knowledge, in definitive proxy or information statements incorporated by reference in Part III of this Form 10-K or any amendment to this form 10-K. þ
Indicate by check mark whether the registrant is a large accelerated filer, an accelerated filer, a non-accelerated filer, or a smaller reporting company.
| Large accelerated filer ¨ | Accelerated filer þ | Non-accelerated filer ¨ | Smaller Reporting Company ¨ | |||
| (Do not check if a smaller reporting company) |
Indicate by check mark whether the registrant is a shell company (as defined in Rule 12b-2 of the Act). ¨ Yes þ No
As of June 30, 2010, the last business day of the registrant’s most recently completed second fiscal quarter, the aggregate market value of the voting stock held by non-affiliates of the registrant was approximately $95 million, based on the closing price reported to the registrant on that date of $11.50 per share. Shares of Common Stock held by each officer and director and each person or control group owning more than ten percent of the outstanding Common Stock have been excluded in that such persons may be deemed to be affiliates. This determination of affiliate status is not necessarily a conclusive determination for other purposes.
The number of shares of Common Stock of the registrant outstanding as of January 31, 2011 was 13,976,941.
Documents Incorporated by Reference: Portions of the definitive proxy statement for the 2011 Annual Meeting of Shareholders to be filed with the Securities and Exchange Commission pursuant to SEC Regulation 14A are incorporated by reference in Part III, Items 10-14.
Table of Contents
| ITEM |
PAGE | |||||||
| 1 | ||||||||
| Item 1. |
1 | |||||||
| Item 1A. |
15 | |||||||
| Item 1B. |
24 | |||||||
| Item 2. |
24 | |||||||
| Item 3. |
24 | |||||||
| Item 4. |
24 | |||||||
| 25 | ||||||||
| Item 5. |
25 | |||||||
| Item 6. |
27 | |||||||
| Item 7. |
Management’s Discussion and Analysis of Financial Condition and Results of Operations |
29 | ||||||
| Item 7A. |
60 | |||||||
| Item 8. |
61 | |||||||
| Item 9. |
Changes in and Disagreements with Accountants on Accounting and Financial Disclosure |
109 | ||||||
| Item 9A. |
109 | |||||||
| Item 9B. |
111 | |||||||
| 111 | ||||||||
| Item 10. |
111 | |||||||
| Item 11. |
111 | |||||||
| Item 12. |
Security Ownership of Certain Beneficial Owners and Management and Related Shareholder Matters |
112 | ||||||
| Item 13. |
Certain Relationships and Related Transactions and Director Independence |
112 | ||||||
| Item 14. |
112 | |||||||
| 113 | ||||||||
| Item 15. |
113 | |||||||
| 115 | ||||||||
Table of Contents
General
The Company
Sierra Bancorp (the “Company”), headquartered in Porterville, California, is a California corporation registered as a bank holding company under the Bank Holding Company Act of 1956, as amended. The Company was incorporated in November 2000 and acquired all of the outstanding shares of Bank of the Sierra (the “Bank”) in August 2001. The Company’s principal subsidiary is the Bank, and the Company exists primarily for the purpose of holding the stock of the Bank and of such other subsidiaries it may acquire or establish. The Company’s main source of revenue is dividends paid by the Bank, but we may explore supplemental sources of income in the future. The expenditures of the Company, including but not limited to the cost of servicing debt, audit costs, shareholder expenses, and the payment of dividends to shareholders, if and when declared by our Board of Directors, are paid from cash on hand at the holding company or from dividends remitted to the Company by the Bank.
At the present time, the Company’s only other direct subsidiaries are Sierra Statutory Trust II and Sierra Capital Trust III, which were formed in March 2004 and June 2006, respectively, solely to facilitate the issuance of capital trust pass-through securities (“TRUPS”). Pursuant to the Financial Accounting Standards Board’s (FASB’s) standard on the consolidation of variable interest entities, these trusts are not reflected on a consolidated basis in the financial statements of the Company. References herein to the “Company” include Sierra Bancorp and its consolidated subsidiary, the Bank, unless the context indicates otherwise.
At December 31, 2010, the Company had consolidated assets of $1.287 billion, gross loans of $806 million, deposits of $1.052 billion and shareholders’ equity of $160 million. The Company’s liabilities include $31 million in debt obligations due to Sierra Statutory Trust II and Sierra Capital Trust III, related to TRUPS issued by those entities.
The Bank
The Bank is a California state-chartered bank headquartered in Porterville, California, that offers a full range of retail and commercial banking services to communities in the central and southern sections of the San Joaquin Valley. Our branch footprint stretches from Fresno on the north to Bakersfield on the south, and on the southern end extends east through the Tehachapi plateau and into the northwestern tip of the Mojave Desert. The Bank was incorporated in September 1977 and opened for business in January 1978, and in the ensuing years has grown to be the largest independent bank headquartered in the South San Joaquin Valley. Our growth has primarily been organic, but includes the acquisition of Sierra National Bank in 2000.
We currently operate 25 full service branch offices throughout our geographic footprint, as well as an internet branch which provides the ability to open deposit accounts and submit certain loan applications online. The Bank’s newest “brick and mortar” branches opened for business in Selma in February 2011 and Farmersville in March 2010. In January 2011 we closed our first branch ever, in Bakersfield on California Avenue, due to lease issues. The locations of the Bank’s current offices are:
| Porterville: | Administrative Headquarters 86 North Main Street |
Main Office 90 North Main Street |
West Olive Branch 1498 West Olive Avenue | |||
| Bakersfield: | Bakersfield Ming Office 8500 Ming Avenue |
Bakersfield Riverlakes Office 4060 Coffee Road |
Bakersfield East Hills Office 2501 Mt. Vernon Avenue | |||
| California City: | California City Office 8031 California City Blvd. |
|||||
| Clovis: | Clovis Office 1710 Clovis Avenue |
|||||
1
Table of Contents
| Delano: | Delano Office 1126 Main Street |
|||||
| Dinuba: | Dinuba Office 401 East Tulare Street |
|||||
| Exeter: | Exeter Office 1103 West Visalia Road |
|||||
| Farmersville: | Farmersville Office 400 West Visalia Road |
|||||
| Fresno: | Fresno Shaw Office 636 East Shaw Avenue |
Fresno Herndon Office 7029 N. Ingram Avenue |
Fresno Sunnyside Office 5775 E. Kings Canyon Rd. | |||
| Hanford: | Hanford Office 427 West Lacey Boulevard |
|||||
| Lindsay: | Lindsay Office 142 South Mirage Avenue |
|||||
| Reedley: | Reedley Office 1095 W. Manning Street |
|||||
| Selma: | Selma Office 2446 McCall Avenue |
|||||
| Tehachapi: | Tehachapi Downtown Office 224 West “F” Street |
Tehachapi Old Town Office 21000 Mission Street |
||||
| Three Rivers: | Three Rivers Office 40884 Sierra Drive |
|||||
| Tulare: | Tulare Office 246 East Tulare Avenue |
Tulare Prosperity Office 1430 E Prosperity Avenue |
||||
| Visalia: | Visalia Mooney Office 2515 South Mooney Blvd. |
Visalia Downtown Office 128 East Main Street |
||||
In addition to our full-service branches, the Bank has an agricultural credit unit with staff located at our corporate headquarters, which provides a complete line of credit services in support of the agricultural activities that are key to the economies of the communities we serve. Ag lending clients include a full range of individual farming customers, small business farming organizations, and major corporate farming units. We also actively engage in Small Business Administration (SBA) lending, and a specialized SBA lending unit is also housed at corporate headquarters. We have been designated as an SBA Preferred Lender since 1999.
The Bank’s gross loan and lease balances totaled $806 million at the end of 2010. The Bank’s lending activities include real estate, commercial (including small business), agricultural, and consumer loans. The bulk of our real estate loans are secured by commercial or professional office properties which are predominantly owner-occupied. We also employ real estate lending specialists who are responsible for a complete line of land acquisition and development loans, construction loans for residential and commercial development, permanent mortgage loans, and multifamily credit facilities. Secondary market services are provided through the Bank’s affiliations with Freddie Mac, Fannie Mae and various non-governmental programs.
As of December 31, 2010, the percentage of our total loan and lease portfolio for each of the principal areas in which we directed our lending activities was as follows: (i) loans secured by real estate (77.3%); (ii) commercial and industrial loans (including SBA loans) (14.2%); (iii) consumer loans (5.7%); (iv) direct finance leases (1.3%); and (v) agricultural production loans (1.5%). Real estate loans and related activities generated total revenue of $40.8 million in 2010 and $44.3 million in 2009. Interest, fees, and loan sale income on real-estate secured loans totaled approximately 50% of our total interest and other income for 2010 and 51% in 2009.
2
Table of Contents
In addition to loans, we offer a wide range of deposit products for retail and business banking markets including checking accounts, savings accounts (including money market demand accounts), time deposits, retirement accounts, and sweep accounts. The Bank’s deposit accounts are insured by the Federal Deposit Insurance Corporation (FDIC) up to maximum insurable amounts. We have also been in the CDARS network since its inception, and through CDARS are able to offer full FDIC insurance coverage to depositors with balances of up to $50 million. We attract deposits from throughout our market area with direct-mail campaigns, a customer-oriented product mix, competitive pricing, convenient locations, and drive-up banking, and we strive to retain our deposit customers by providing a consistently high level of service and soliciting customer feedback. At December 31, 2010 we had 85,379 deposit accounts totaling $1.052 billion, compared to 79,550 deposit accounts totaling $1.125 billion at December 31, 2009.
We offer a multitude of other products and services to complement our lending and deposit services. These include cashier’s checks, traveler’s checks, gift cards, bank-by-mail, night depository, safe deposit boxes, direct deposit, automated payroll services, electronic funds transfers, online banking, ATMs, and other customary banking services. In addition to onsite ATMs at all of our branches, we operate our own offsite ATMs at eight different non-branch locations. Furthermore, the Bank is a member of the Allpoint network, which provides our customers with surcharge-free access to over 35,000 ATMs across the nation, including 4,600 in California. Our customers also have access to electronic point-of-sale payment alternatives nationwide, via the Pulse EFT network. Internet banking, including optional bill-pay functionality and mobile banking capabilities (via cell phones and other mobile devices), had close to 29,000 individual and business users as of the end of 2010. Retail customers who prefer access channels other than traditional branches also have the ability to open Bank of the Sierra deposit accounts online, and business customers have the option of utilizing remote deposit capture capabilities to send their check deposits to us electronically. Furthermore, to ensure that the personal banking preferences of all customers are addressed, we operate a telephone banking system that is accessible 24 hours a day seven days a week, and we have a customer service group accessible by toll-free telephone.
To provide non-deposit investment options we have a strategic alliance with Investment Centers of America, Inc. of Bismarck, North Dakota (“ICA”). Through this arrangement, registered and licensed representatives of ICA provide our customers with convenient access to annuities, insurance products, mutual funds, and a full range of investment products. They conduct business from offices located in our Porterville, Visalia, Tulare, Fresno, Bakersfield and Tehachapi branches.
We have not engaged in any material research activities related to the development of new products or services during the last two fiscal years. However, our officers and employees are continually searching for ways to increase public convenience, enhance public access to the electronic payments system, and enable us to improve our competitive position. The cost to the Bank for these development, operations, and marketing activities cannot be calculated with any degree of certainty.
We hold no patents or licenses (other than licenses required by appropriate bank regulatory agencies), franchises, or concessions. Our business has a modest seasonal component due to the heavy agricultural orientation of the Central Valley. As our branches in more metropolitan areas such as Fresno and Bakersfield have expanded, however, we have become less reliant on the agriculture-related base. We are not dependent on a single customer or group of related customers for a material portion of our core deposits, nor is a material portion of our loans concentrated within a single industry or group of related industries. Our efforts to comply with government and regulatory mandates on consumer protection and privacy, anti-terrorism, and other initiatives have resulted in significant ongoing expense to the Bank, including staffing additions and costs associated with compliance-related software. However, as far as can be determined there has been no material effect upon our capital expenditures, earnings, or competitive position as a result of environmental regulation at the Federal, state, or local level.
Recent Developments
On October 19, 2010, Sierra Bancorp sold 2,325,000 shares of its common stock at a price of $10 per share, in a registered direct offering to select institutional investors. The shares were sold pursuant to the Company’s $100 million shelf registration that became effective on July 28, 2010. The aggregate proceeds totaled $23.3 million, while net proceeds from the offering, after placement fees and other transaction expenses, were approximately $22.0 million.
3
Table of Contents
Proceeds are available for general corporate purposes, as described in the Company’s Prospectus Supplement concerning the offering filed with the SEC on October 14, 2010 pursuant to Rule 424(b)(5).
Recent Accounting Pronouncements
Information on recent accounting pronouncements is contained in Footnote 2 to the Financial Statements.
Competition
The banking business in California in general, and specifically in many of our market areas, is highly competitive with respect to virtually all products and services. The industry continues to consolidate, particularly with the relatively large number of recent FDIC-assisted takeovers of failed banks. There are also many unregulated companies competing for business in our markets with financial products targeted at highly profitable customer segments. Many of these competitors are able to compete across geographic boundaries, and provide customers with meaningful alternatives to nearly all significant banking services and products. These competitive trends are likely to continue.
With respect to commercial bank competitors, the business is dominated by a relatively small number of major banks that operate a large number of offices within our geographic footprint. Based on June 30, 2010 FDIC market share data for the combined four counties within which the Company operates, namely Tulare, Kern, Fresno, and Kings counties, the top four institutions are multi-billion dollar entities with an aggregate of 142 offices that control 52.8% of deposit market share. The largest portion of deposits in the combined four-county area was with Bank of America (22.0%), followed by Wells Fargo (18.7%), Union Bank of California (6.4%), and J.P. Morgan Chase (5.6%). Bank of the Sierra ranks fifth on the 2010 market share list with 5.3% of total deposits in the referenced four-county area. In Tulare County, however, where the Bank was originally formed, we rank first for total number of branch locations (12, including our online branch), and first for deposit market share with 20.1% of total deposits. The larger banks noted above have, among other advantages, the ability to finance wide-ranging advertising campaigns and to allocate their resources to regions of highest yield and demand. They can also offer certain services that we do not offer directly but may offer indirectly through correspondent institutions. By virtue of their greater total capitalization, these banks also have substantially higher lending limits than we do. For customers whose needs exceed our legal lending limit, we typically arrange for the sale, or “participation”, of some of the balances to financial institutions that are not within our geographic footprint.
In addition to other banks, our competitors include savings institutions, credit unions, and numerous non-banking institutions such as finance companies, leasing companies, insurance companies, brokerage firms, and investment banking firms. We have also witnessed increased competition from specialized companies that offer wholesale finance, credit card, and other consumer finance services, as well as services that circumvent the banking system by facilitating payments via the internet, wireless devices, prepaid cards, or other means. Technological innovations have lowered traditional barriers of entry and enabled many of these companies to compete in financial services markets. Such innovation has, for example, made it possible for non-depository institutions to offer customers automated transfer payment services that previously were considered traditional banking products. Many customers now expect a choice of delivery channels, including telephone, mail, internet, ATMs, self-service branches, and/or in-store branches. These products are offered by traditional banks and savings associations, as well as credit unions, brokerage firms, asset management groups, finance and insurance companies, internet-based companies, and mortgage banking firms.
Strong competition for deposits and loans among financial institutions and non-banks alike affects interest rates and other terms on which financial products are offered to customers. Mergers between financial institutions have placed additional pressure on other banks within the industry to remain competitive by streamlining operations, reducing expenses, and increasing revenues. Competition has also intensified due to federal and state interstate banking laws enacted in the mid-1990’s, which permit banking organizations to expand into other states. The relatively large California market has been particularly attractive to out-of-state institutions. The Financial Modernization Act, enacted in 2000, has made it possible for full affiliations to occur between banks and securities firms, insurance companies, and other financial companies, which has further intensified competitive conditions.
4
Table of Contents
For years we have countered rising competition by offering a broad array of products, with accommodative policies that allow flexibility in structure and term that cannot always be matched by our competitors. We also offer our customers community-oriented, personalized service, and rely on local promotional activity and personal contacts by our officers, directors, employees, and shareholders. This approach appears to be well-received by the populace of the San Joaquin Valley, who appreciate a high-touch, customer-oriented environment in which to conduct their financial transactions. Layered onto our traditional personal-contact banking philosophy are telephone banking, internet banking, online bill payment and cash management capabilities, which were initiated to meet the needs of customers with electronic access requirements and provide automated 24-hour banking. This high-tech and high-touch approach allows individuals to customize access to the Bank to their particular preference.
Employees
As of December 31, 2010 the Company had 318 full-time and 90 part-time employees. On a full time equivalent basis staffing stood at 390 at December 31, 2010, down from 402 at December 31, 2009.
Regulation and Supervision
Banks and bank holding companies are heavily regulated by federal and state laws. Most banking regulations are intended primarily for the protection of depositors and the deposit insurance fund and not for the benefit of shareholders. The following is a summary of certain statutes, regulations and regulatory guidance affecting the Company and the Bank. This summary is not intended to be a complete explanation of such statutes, regulations and guidance and their effects on the Company and the Bank and is qualified in its entirety by such statutes, regulations and guidance, all of which are subject to change in the future.
Regulation of the Company Generally
The Company’s stock is traded on the NASDAQ Global Select Market under the symbol BSRR, and as such the Company is subject to NASDAQ rules and regulations including those related to corporate governance. The Company is also subject to the periodic reporting requirements of Section 13 of the Securities Exchange Act of 1934 (the “Exchange Act”) which requires the Company to file annual, quarterly and other current reports with the Securities and Exchange Commission (the “SEC”). The Company is subject to additional regulations including, but not limited to, the proxy and tender offer rules promulgated by the SEC under Sections 13 and 14 of the Exchange Act; the reporting requirements of directors, executive officers and principal shareholders regarding transactions in the Company’s common stock, and short-swing profits rules promulgated by the SEC, under Section 16 of the Exchange Act; and certain additional reporting requirements for principal shareholders of the Company promulgated by the SEC under Section 13 of the Exchange Act. As a publicly traded company which had more than $75 million in public float as of June 30, 2010, the Company is classified as an “accelerated filer” for purposes of its Exchange Act filing requirements. In addition to accelerated time frames for filing SEC periodic reports, this also means that the Company is subject to the requirements of Section 404 of the Sarbanes-Oxley Act of 2002 with regard to documenting, testing, and attesting to internal controls over financial reporting.
The Company is a bank holding company within the meaning of the Bank Holding Company Act of 1956 and is registered as such with the Federal Reserve Board. A bank holding company is required to file with the Federal Reserve annual reports and other information regarding its business operations and those of its subsidiaries. It is also subject to periodic examination by the Federal Reserve and is required to obtain Federal Reserve approval before acquiring, directly or indirectly, ownership of the voting shares of any bank if, after such acquisition, it would directly or indirectly own or control more than 5% of the voting stock of that bank, unless it already owns a majority of the voting stock of that bank.
The Federal Reserve Board has determined by regulation certain activities in which a bank holding company may or may not conduct business. A bank holding company must engage, with certain exceptions, in the business of banking or managing or controlling banks or furnishing services to or performing services for its subsidiary banks. The principal exceptions to these prohibitions involve non-bank activities identified by statute, by Federal Reserve regulation, or by Federal Reserve order as activities so closely related to the business of banking or of managing or
5
Table of Contents
controlling banks as to be a proper incident thereto, including securities brokerage services, investment advisory services, fiduciary services, and management advisory and data processing services, among others. A bank holding company that also qualifies as and elects to become a “financial holding company” may engage in a broader range of activities that are financial in nature (and complementary to such activities), specifically non-bank activities identified by the Gramm-Leach-Bliley Act of 1999 or by Federal Reserve and Treasury regulation as financial in nature or incidental to a financial activity. Activities that are defined as financial in nature include securities underwriting, dealing, and market making, sponsoring mutual funds and investment companies, engaging in insurance underwriting and agency activities, and making merchant banking investments in non-financial companies. To become and remain a financial holding company, a bank holding company and its subsidiary banks must be well capitalized, well managed, and, except in limited circumstances, have at least a satisfactory rating under the Community Reinvestment Act. The Company has no current intention of becoming a financial holding company, but may do so at some point in the future if deemed appropriate in view of opportunities or circumstances at the time.
The Company and the Bank are deemed to be affiliates of each other within the meaning set forth in the Federal Reserve Act and are subject to Sections 23A and 23B of the Federal Reserve Act. The Federal Reserve Board has also issued Regulation W, which codifies prior regulations under Sections 23A and 23B of the Federal Reserve Act and interpretative guidance with respect to affiliate transactions. This means, for example, that there are limitations on loans by the Bank to affiliates, and that all affiliate transactions must satisfy certain limitations and otherwise be on terms and conditions at least as favorable to the Bank as would be available for non-affiliates. In addition, we must comply with the Federal Reserve Act and Regulation O issued by the Federal Reserve Board, which require that loans and extensions of credit to our executive officers, directors and principal shareholders, or any company controlled by any such persons, shall, among other conditions, be made on substantially the same terms and follow credit-underwriting procedures no less stringent than those prevailing at the time for comparable transactions with non-insiders.
Regulations and policies of the Federal Reserve Board require a bank holding company to serve as a source of financial and managerial strength to its subsidiary banks. It is the Federal Reserve Board’s policy that a bank holding company should stand ready to use available resources to provide adequate capital funds to a subsidiary bank during periods of financial stress or adversity and should maintain the financial flexibility and capital-raising capacity to obtain additional resources for assisting a subsidiary bank. Under certain conditions, the Federal Reserve Board may conclude that certain actions of a bank holding company, such as a payment of a cash dividend, would constitute an unsafe and unsound banking practice. The Federal Reserve Board also has the authority to regulate bank holding companies’ debt, including the authority to impose interest rate ceilings and reserve requirements on such debt. Under certain circumstances, the Federal Reserve Board may require a bank holding company to file written notice and obtain its approval prior to purchasing or redeeming its equity securities, unless certain conditions are met.
Regulation of the Bank Generally
As a California state-chartered bank whose accounts are insured by the FDIC up to the maximum limits allowable by law, the Bank is subject to regulation, supervision and regular examination by the California Department of Financial Institutions (the “DFI”) and the FDIC. In addition, while the Bank is not a member of the Federal Reserve System, the Bank is subject to certain regulations of the Federal Reserve Board. The regulations of these agencies govern most aspects of the Bank’s business, including the making of periodic reports by the Bank, and the Bank’s activities relating to dividends, investments, loans, borrowings, capital requirements, certain check-clearing activities, branching, mergers and acquisitions, reserves against deposits and numerous other areas. Supervision, legal action and examination by the FDIC are generally intended to protect depositors and are not intended for the protection of shareholders.
The earnings and growth of the Bank are largely dependent on our ability to maintain a favorable differential, or “spread,” between our yield on interest-earning assets and the average rate paid on our deposits and other interest-bearing liabilities. As a result, the Bank’s performance is influenced by general economic conditions, both domestic and foreign, the monetary and fiscal policies of the federal government, and the policies of the regulatory agencies, particularly the Federal Reserve Board. The Federal Reserve Board implements national monetary policies (such as, for example, seeking to curb inflation and combat recession) by its open-market operations in United States government
6
Table of Contents
securities, by adjusting the required level of reserves for financial institutions subject to its reserve requirements, and by varying the discount rate applicable to borrowings by banks that participate in the Federal Reserve System. The actions of the Federal Reserve Board in these areas influence the growth of bank loans, investments and deposits and also affect interest rates on loans and deposits. The nature and impact of any future changes in monetary policies cannot be predicted with any degree of certainty.
Capital Adequacy Requirements
The Company and the Bank are subject to the regulations of the Federal Reserve Board and the FDIC, respectively, governing capital adequacy. Each of the federal regulators has established risk-based and leverage capital guidelines for the banks and/or bank holding companies it regulates, which set total capital requirements and define capital in terms of “core capital elements,” or Tier 1 capital; and “supplemental capital elements,” or Tier 2 capital. Tier 1 capital is generally defined as the sum of the core capital elements less goodwill and certain other deductions, including the unrealized net gains or losses (after tax adjustments) on investment securities available for sale carried at fair market value and disallowed deferred tax assets. The following items are defined as core capital elements: (i) common shareholders’ equity; (ii) qualifying non-cumulative perpetual preferred stock and related surplus (and, in the case of holding companies, senior perpetual preferred stock issued to the U.S. Treasury Department pursuant to the Troubled Asset Relief Program); (iii) minority interests in the equity accounts of consolidated subsidiaries; and (iv) qualifying trust preferred securities up to a specified limit as discussed below. Supplementary capital elements include: (i) allowance for loan and lease losses (but not more than 1.25% of an institution’s risk-weighted assets); (ii) perpetual preferred stock and related surplus not qualifying as core capital; (iii) hybrid capital instruments, perpetual debt and mandatory convertible debt instruments; and, (iv) term subordinated debt and intermediate-term preferred stock and related surplus. The maximum amount of supplemental capital elements, which qualify as Tier 2 capital, is limited to 100% of Tier 1 capital.
In March 2005, the Federal Reserve Board adopted a final rule allowing bank holding companies to continue to include trust preferred securities in their Tier 1 capital. The amount that can be included is limited to 25% of core capital elements, net of goodwill less any associated deferred tax liability. As of December 31, 2010, TRUPS made up approximately 17% of the Company’s Tier 1 capital. In addition, since the Company had less than $15 billion in assets at December 31, 2009, under the Dodd-Frank Act the Company can continue to include its TRUPS in Tier 1 capital to the extent permitted by FRB guidelines. See “Dodd-Frank Wall Street Reform and Consumer Protection Act” below.
The minimum required ratio of qualifying total capital to total risk-weighted assets is 8% (“Total Risk-Based Capital Ratio”), at least one-half of which must be in the form of Tier 1 capital, and the minimum required ratio of Tier 1 capital to total risk-weighted assets is 4% (“Tier 1 Risk-Based Capital Ratio”). Risk-based capital ratios are calculated to provide a measure of capital relative to the degree of risk associated with a financial institution’s operations for transactions reported on the balance sheet as assets, and transactions, such as letters of credit and recourse arrangements, which are recorded as off-balance sheet items. Under risk-based capital guidelines, the nominal dollar amounts of assets and credit-equivalent amounts of off-balance sheet items are multiplied by one of several risk adjustment percentages, which range from 0% for assets with low credit risk, such as cash on hand and certain U.S. Treasury securities, to 100% for assets with relatively high credit risk, such as unsecured loans. As of December 31, 2010 and 2009, Bank-only Total Risk-Based Capital Ratios were 19.31% and 16.04%, respectively, and the Bank’s Tier 1 Risk-Based Capital Ratios were 18.04% and 14.78%, respectively. As of December 31, 2010 and 2009, the consolidated Company’s Total Risk-Based Capital Ratios were 20.33% and 16.67%, respectively, and its Tier 1 Risk-Based Capital Ratios were 19.06% and 15.41%, respectively.
The FDIC and the Federal Reserve Board have also established guidelines for a financial institution’s leverage ratio, defined as Tier 1 capital to adjusted total assets. Banks and bank holding companies that have received the highest rating of the five categories used by regulators to rate banks and are not anticipating or experiencing any significant growth must maintain a leverage ratio of at least 3%. All other institutions are typically required to maintain a leverage ratio of at least 4% to 5%; however, federal regulations also provide that financial institutions must maintain capital levels commensurate with the level of risk to which they are exposed, including the volume and severity of problem loans, and federal regulators may set higher capital requirements when an institution’s particular
7
Table of Contents
circumstances warrant. Bank-only leverage ratios were 13.07% and 11.44% on December 31, 2010 and 2009, respectively. As of December 31, 2010 and 2009, the consolidated Company’s leverage ratios were 13.84% and 11.91%, respectively.
Risk-based capital requirements also take into account concentrations of credit involving collateral or loan type, and the risks of “non-traditional” activities (those that have not customarily been part of the banking business). The regulations require institutions with high or inordinate levels of risk to operate with higher minimum capital standards, and authorize the regulators to review an institution’s management of such risks in assessing an institution’s capital adequacy. Additionally, the regulatory Statements of Policy on risk-based capital include exposure to interest rate risk as a factor that the regulators will consider in evaluating a financial institution’s capital adequacy, although interest rate risk does not impact the calculation of an institution’s risk-based capital ratios. Interest rate risk is the exposure of a bank’s current and future earnings and equity capital to adverse movement in interest rates. While interest rate risk is inherent in a financial institution’s role as a financial intermediary, it introduces volatility to the institution’s earnings and economic value.
For more information on the Company’s capital, see Part II, Item 7, Management’s Discussion and Analysis of Financial Condition and Results of Operation – Capital Resources. Risk-based capital ratio requirements are discussed in greater detail in the following section.
Prompt Corrective Action Provisions
Federal law requires each federal banking agency to take prompt corrective action to resolve the problems of insured financial institutions, including but not limited to those that fall below one or more prescribed minimum capital ratios. The federal banking agencies have by regulation defined the following five capital categories: “well capitalized” (Total Risk-Based Capital Ratio of 10%; Tier 1 Risk-Based Capital Ratio of 6%; and Leverage Ratio of 5%); “adequately capitalized” (Total Risk-Based Capital Ratio of 8%; Tier 1 Risk-Based Capital Ratio of 4%; and Leverage Ratio of 4%, or 3% if the institution receives the highest rating from its primary regulator); “undercapitalized” (Total Risk-Based Capital Ratio of less than 8%; Tier 1 Risk-Based Capital Ratio of less than 4%; or Leverage Ratio of less than 4%, or 3% if the institution receives the highest rating from its primary regulator); “significantly undercapitalized” (Total Risk-Based Capital Ratio of less than 6%; Tier 1 Risk-Based Capital Ratio of less than 3%; or Leverage Ratio less than 3%); and “critically undercapitalized” (tangible equity to total assets less than 2%). As of December 31, 2010 and 2009, both the Company and the Bank were deemed to be well capitalized for regulatory capital purposes. A bank may be treated as though it were in the next lower capital category if, after notice and the opportunity for a hearing, the appropriate federal agency finds an unsafe or unsound condition or practice so warrants, but no bank may be treated as “critically undercapitalized” unless its actual capital ratio warrants such treatment.
At each successively lower capital category, an insured bank is subject to increased restrictions on its operations. For example, a bank is generally prohibited from paying management fees to any controlling persons or from making capital distributions if to do so would make the bank “undercapitalized.” Asset growth and branching restrictions apply to undercapitalized banks, which are required to submit written capital restoration plans meeting specified requirements (including a guarantee by the parent holding company, if any). “Significantly undercapitalized” banks are subject to broad regulatory authority, including among other things, capital directives, forced mergers, restrictions on the rates of interest they may pay on deposits, restrictions on asset growth and activities, and prohibitions on paying bonuses or increasing compensation to senior executive officers without FDIC approval. Even more severe restrictions apply to “critically undercapitalized” banks. Most importantly, except under limited circumstances, not later than 90 days after an insured bank becomes critically undercapitalized the appropriate federal banking agency is required to appoint a conservator or receiver for the bank.
In addition to measures taken under the prompt corrective action provisions, insured banks may be subject to potential actions by the federal regulators for unsafe or unsound practices in conducting their businesses or for violations of any law, rule, regulation or any condition imposed in writing by the agency or any written agreement with the agency. Enforcement actions may include the issuance of cease and desist orders, termination of insurance of deposits (in the
8
Table of Contents
case of a bank), the imposition of civil money penalties, the issuance of directives to increase capital, formal and informal agreements, or removal and prohibition orders against “institution-affiliated” parties.
Safety and Soundness Standards
The federal banking agencies have also adopted guidelines establishing safety and soundness standards for all insured depository institutions. Those guidelines relate to internal controls, information systems, internal audit systems, loan underwriting and documentation, compensation and interest rate exposure. In general, the standards are designed to assist the federal banking agencies in identifying and addressing problems at insured depository institutions before capital becomes impaired. If an institution fails to meet the requisite standards, the appropriate federal banking agency may require the institution to submit a compliance plan and could institute enforcement proceedings if an acceptable compliance plan is not submitted or adhered to.
The Dodd-Frank Wall Street Reform and Consumer Protection Act
The Dodd-Frank Wall Street Reform and Consumer Protection Act (“Dodd-Frank”) was enacted in July 2010, and is expected to have a broad impact on the financial services industry, including significant regulatory and compliance changes. The provisions of Dodd-Frank most relevant to the Company and the banking industry in general are outlined in this section.
Dodd-Frank excludes trust preferred securities from Tier I capital calculations, although it grandfathers trust preferred securities issued before May 19, 2010 by bank holding companies with less than $15 billion in total assets. The Company’s trust-preferred securities were issued prior to that date, so they remain eligible for inclusion in Tier 1 capital. Another provision of Dodd-Frank eliminates the current restriction on the payment of interest on business demand deposit accounts, effective one year after the date of enactment. Dodd-Frank also adopted the so-called “Volcker rule,” which, subject to certain exceptions, prohibits any banking entity from engaging in proprietary trading, or sponsoring or investing in a hedge fund or private equity fund. In addition, it establishes a framework for the regulators to liquidate large institutions that pose systemic risks.
Other key provisions in Dodd-Frank change the assessment base for deposit insurance premiums, revise the designated reserve ratio (“DRR”) for the FDIC’s Deposit Insurance Fund, and increase the level of deposit insurance per depositor. The assessment base has historically consisted of an institution’s total domestic deposits, but commencing in the second quarter of 2011 it changes to average consolidated total assets minus average tangible equity. The result is that larger financial institutions, which typically have a greater proportion of assets funded by non-deposit liabilities, will pay a greater percentage of the aggregate insurance assessment and smaller banks will pay proportionately less. Changes to the DRR include the following: the minimum was raised to 1.35% from 1.15%, with the burden of the increase to be assessed to financial institutions with assets greater than $10 billion; a deadline of September 30, 2020 was established for reaching the 1.35% minimum ratio; the 1.50% upper limit was removed, effectively eliminating a cap on the size of the fund; and, the requirement to pay dividends when the reserve ratio exceeds 1.35% was eliminated, but gives the FDIC discretionary authority to pay dividends when the reserve ratio exceeds 1.50%. Dodd-Frank also provides for a permanent increase in FDIC deposit insurance per depositor from $100,000 to $250,000 retroactive to January 1, 2008, and extends unlimited deposit insurance coverage for non-interest bearing transaction accounts through December 31, 2012.
Dodd-Frank has a number of provisions intended to protect investors, including risk retention requirements for certain asset-backed securities, reforms to the regulation of credit rating agencies, and the establishment of an Investor Advisory Committee and an Office of Investor Advocate. It also provides a number of changes to corporate governance procedures for public companies, including proxy access requirements for shareholders, non-binding shareholder votes on executive compensation, the establishment of an independent compensation committee, and executive compensation disclosures and compensation claw-backs. The Federal Reserve is also required to issue regulations regarding incentive-based pay practices for institutions with more than $1 billion in assets.
Dodd-Frank also establishes the Bureau of Consumer Financial Protection, an independent entity housed within the Federal Reserve. It gives the Bureau the authority to prohibit practices that it finds to be “unfair,” “deceptive,” or
9
Table of Contents
“abusive”, and expands certain disclosure requirements. Furthermore, the Durbin Amendment to Dodd-Frank limits interchange fees for debit card transactions to an amount established as “reasonable” under regulations to be issued by the Federal Reserve. Cards issued by banks with less than $10 billion in assets are exempt from this requirement, although this exemption has been criticized as being ineffective because smaller banks will have to match the rates being offered by their larger competitors.
The Mortgage Reform and Anti-Predatory Lending Act is another important provision of Dodd-Frank for community banks. It places new regulations on mortgage originators and imposes new disclosure requirements and appraisal reforms, the most important of which are: the creation of a mortgage originator duty of care; the establishment of certain underwriting requirements so that, at the time of origination, the consumer has a reasonable ability to repay the loan; the creation of documentation requirements intended to eliminate “no document” and “low document” loans; the prohibition of steering incentives for mortgage originators; a prohibition on yield spread premiums and prepayment penalties in many cases; and, a provision that allows borrowers to assert as a foreclosure defense a contention that the lender violated the anti-steering restrictions or “reasonable repayment” requirements.
The Company is currently evaluating the potential impact the Dodd-Frank Act will have on its business, financial condition, results of operations and prospects, and expects that some provisions of Dodd-Frank may have adverse effects on the Company, including the cost of complying with the numerous new regulations and reporting requirements. Many aspects of Dodd-Frank are subject to rulemaking and will take effect over several years, making it difficult to project the overall financial impact on the Company and the financial services industry more generally. Provisions in the legislation that affect deposit insurance assessments and payment of interest on demand deposits could increase the costs associated with deposits.
The Emergency Economic Stabilization Act of 2008 and the Troubled Asset Relief Program
In response to the market turmoil and financial crises affecting the overall banking system and financial markets in the United States, the Emergency Economic Stabilization Act of 2008 (“EESA”) was enacted in October 2008. In February 2009, the American Recovery and Reinvestment Act of 2009 (the “Stimulus Bill”) was enacted, which among other things augmented certain provisions of the EESA. Under the EESA, the Treasury Department has authority to purchase up to $700 billion in mortgage loans, mortgage-related securities and certain other financial instruments, including debt and equity securities issued by financial institutions in the Troubled Asset Relief Program (the “TARP”). The purpose of the TARP is to restore confidence and stability to the U.S. banking system and to encourage financial institutions to increase lending to customers and to each other.
The Treasury Department allocated $250 billion in TARP-authorized funds to the TARP Capital Purchase Program, which was developed to purchase senior preferred stock from qualifying financial institutions in order to strengthen their capital and liquidity positions and encourage them to increase lending to creditworthy borrowers. Qualifying financial institutions could be approved to issue preferred stock to the Treasury Department in amounts not less than 1% of their risk-weighted assets and not more than the lesser of $25 billion or 3% of risk-weighted assets. After evaluating the strategic advantages and operating restrictions inherent in issuing preferred shares to the U.S. government, Sierra Bancorp elected not to participate in the capital purchase element of TARP.
The EESA also established a Temporary Liquidity Guarantee Program (“TLGP”) that gave the FDIC the ability to provide a guarantee for newly-issued senior unsecured debt and non-interest bearing transaction deposit accounts at eligible insured institutions. The Company is currently participating in the transaction account guarantee program. This program was initially scheduled to continue through December 31, 2010, but the Dodd-Frank Act has extended full deposit insurance coverage for non-interest bearing transaction accounts through December 31, 2012, and all financial institutions are required to participate in this extended guarantee program. For non-interest bearing transaction deposit accounts, a 10 basis point annual FDIC insurance premium surcharge was applied to deposit amounts in excess of $250,000 through December 31, 2009, and a risk-based surcharge of between 15 and 25 basis points was applied beginning January 1, 2010.
10
Table of Contents
Deposit Insurance
The Bank’s deposits are insured under the Federal Deposit Insurance Act, up to the maximum applicable limits by the Deposit Insurance Fund (“DIF”) of the FDIC and are subject to deposit insurance assessments to maintain the DIF. In October 2010, the FDIC adopted a revised restoration plan to ensure that the DIF’s designated reserve ratio reaches 1.35% of insured deposits by September 30, 2020, the deadline mandated by the Dodd-Frank Act. However, financial institutions like Bank of the Sierra with assets of less than $10 billion are required to be exempt from the cost of this increase, and the FDIC plans further rulemaking in 2011 regarding the method that will be used to reach the requisite 1.35% minimum reserve ratio while offsetting the effect of required increases on such smaller institutions. In addition, because of lower expected losses over the next five years and the additional time provided by Dodd-Frank to meet the minimum DRR, the FDIC eliminated the uniform 3 basis point increase in assessment rates that was previously scheduled to go into effect on January 1, 2011. Furthermore, the restoration plan proposed an increase in the DRR to 2% of estimated insured deposits as a long-term goal for the fund. The FDIC also proposed future assessment rate reductions in lieu of dividends, when the DRR reaches 1.5% or greater.
As noted above, the Dodd-Frank Act provided for a permanent increase in FDIC deposit insurance per depositor from $100,000 to $250,000 retroactive to January 1, 2008, and extended unlimited deposit insurance coverage for non-interest bearing transaction accounts through December 31, 2012. Furthermore, the FDIC redefined its deposit insurance premium assessment base from an institution’s total domestic deposits to its total assets less tangible equity, effective in the second quarter of 2011. The changes to the assessment base necessitated changes to assessment rates, which will become effective April 1, 2011. While revised assessment rates will be lower than current rates, the assessment base will be larger, and the expectation is that approximately the same amount of assessment revenue will be collected by the FDIC as under the current structure.
To help address liquidity issues created by potential timing differences between the collection of premiums and charges against the DIF, in November 2009 the FDIC adopted a final rule to require insured institutions to prepay, on December 31, 2009, their estimated quarterly risk-based deposit insurance assessments for the fourth quarter of 2009, and for all of 2010, 2011 and 2012. Our prepaid assessment, a non-earning asset, was $4.3 million as of December 31, 2010. Until such time as our prepaid FDIC assessment is fully utilized, our accounting offset for FDIC assessment expense is the prepaid assessment rather than cash.
In addition to DIF assessments, banks must pay quarterly assessments that are applied to the retirement of Financing Corporation bonds issued in the 1980’s to assist in the recovery of the savings and loan industry. The assessment amount fluctuates, but is currently 1.02 basis points of insured deposits. These assessments will continue until the Financing Corporation bonds mature in 2019.
Community Reinvestment Act
The Bank is subject to certain requirements and reporting obligations involving Community Reinvestment Act (“CRA”) activities. The CRA generally requires federal banking agencies to evaluate the record of a financial institution in meeting the credit needs of its local communities, including low and moderate income neighborhoods. The CRA further requires the agencies to consider a financial institution’s efforts in meeting its community credit needs when evaluating applications for, among other things, domestic branches, consummating mergers or acquisitions, or the formation of holding companies. In measuring a bank’s compliance with its CRA obligations, the regulators utilize a performance-based evaluation system under which CRA ratings are determined by the bank’s actual lending, service, and investment performance, rather than on the extent to which the institution conducts needs assessments, documents community outreach activities or complies with other procedural requirements. In connection with its assessment of CRA performance, the FDIC assigns a rating of “outstanding,” “satisfactory,” “needs to improve” or “substantial noncompliance.” The Bank was last examined for CRA compliance in late 2010, although a final assessment rating from that exam has not yet been issued. The Bank received a “satisfactory” CRA Assessment Rating in August 2007.
11
Table of Contents
Privacy and Data Security
The Gramm-Leach-Bliley Act, also known as the Financial Modernization Act of 1999 (the “Financial Modernization Act”), imposed requirements on financial institutions with respect to consumer privacy. The statute generally prohibits disclosure of consumer information to non-affiliated third parties unless the consumer has been given the opportunity to object and has not objected to such disclosure. Financial institutions are further required to disclose their privacy policies to consumers annually. Financial institutions, however, are required to comply with state law if it is more protective of consumer privacy than the Financial Modernization Act. The statute also directed federal regulators, including the Federal Reserve and the FDIC, to prescribe standards for the security of consumer information.
Other Consumer Protection Laws and Regulations
Activities of all insured banks are subject to a variety of statutes and regulations designed to protect consumers, including the Fair Credit Reporting Act, Equal Credit Opportunity Act, and Truth-in-Lending Act. Interest and other charges collected or contracted for by the Bank are also subject to state usury laws and certain other federal laws concerning interest rates. The Bank’s loan operations are also subject to federal laws and regulations applicable to credit transactions. Together, these laws and regulations include provisions that:
| • | govern disclosures of credit terms to consumer borrowers; |
| • | require financial institutions to provide information to enable the public and public officials to determine whether a financial institution is fulfilling its obligation to help meet the housing needs of the communities it serves; |
| • | prohibit discrimination on the basis of race, creed, or other prohibited factors in extending credit; |
| • | govern the use and provision of information to credit reporting agencies; and |
| • | govern the manner in which consumer debts may be collected by collection agencies. |
The Bank’s deposit operations are also subject to laws and regulations that:
| • | impose a duty to maintain the confidentiality of consumer financial records and prescribe procedures for complying with administrative subpoenas of financial records; and |
| • | govern automatic deposits to and withdrawals from deposit accounts and customers’ rights and liabilities arising from the use of automated teller machines and other electronic banking services. |
In November 2009, the Board of Governors of the Federal Reserve System promulgated a rule entitled “Electronic Fund Transfers”, with a mandatory compliance date of July 1, 2010. The rule, which applies to all FDIC-regulated institutions, prohibits financial institutions from assessing an overdraft fee for paying automated teller machine (ATM) and one-time point-of-sale debit card transactions, unless the customer affirmatively opts in to the overdraft service for those types of transactions. The opt-in provision establishes requirements for clear disclosure of fees and terms of overdraft services for ATM and one-time debit card transactions. The rule does not apply to other types of transactions, such as check, automated clearinghouse (ACH) and recurring debit card transactions. Implementation of this rule has reduced our annual service charge income by an estimated $1 million, or 9%, all else being equal.
12
Table of Contents
Interstate Banking and Branching
The Riegle Neal Interstate Banking and Branching Efficiency Act of 1994 (the “Interstate Banking Act”) regulates the interstate activities of banks and bank holding companies and establishes a framework for nationwide interstate banking and branching. Since 1995, adequately capitalized and managed bank holding companies have been permitted to acquire banks located in any state, subject to two exceptions: first, any state may still prohibit bank holding companies from acquiring a bank which is less than five years old; and second, no interstate acquisition can be consummated by a bank holding company if the acquirer would control more than 10% of the deposits held by insured depository institutions nationwide or 30% or more of the deposits held by insured depository institutions in any state in which the target bank has branches. In 1995, California enacted legislation to implement important provisions of the Interstate Banking Act and to repeal California’s previous interstate banking laws, which were largely preempted by the Interstate Banking Act. A bank may establish and operate de novo branches in any state in which the bank does not maintain a branch if that state has enacted legislation to expressly permit all out-of-state banks to establish branches in that state. However, California law expressly prohibits an out-of-state bank which does not already have a California branch office from (i) purchasing a branch office of a California bank (as opposed to purchasing the entire bank) and thereby establishing a California branch office, or (ii) establishing a de novo branch in California.
The Interstate Banking Act and related California laws have increased competition in the environment in which we operate to the extent that out-of-state financial institutions directly or indirectly enter our market areas. It appears that the Interstate Banking Act has also contributed to the accelerated consolidation of the banking industry, with many large out-of-state banks having entered the California market as a result of this legislation.
USA Patriot Act of 2001
The impact of the USA Patriot Act of 2001 (the “Patriot Act”) on financial institutions of all kinds has been significant and wide ranging. The Patriot Act substantially enhanced existing anti-money laundering and financial transparency laws, and required appropriate regulatory authorities to adopt rules to promote cooperation among financial institutions, regulators, and law enforcement entities in identifying parties that may be involved in terrorism or money laundering. Under the Patriot Act, financial institutions are subject to prohibitions regarding specified financial transactions and account relationships, as well as enhanced due diligence and “know your customer” standards in their dealings with foreign financial institutions and foreign customers. The Patriot Act also requires all financial institutions to establish anti-money laundering programs. The Bank expanded its Bank Secrecy Act Compliance Department and intensified due diligence procedures concerning the opening of new accounts to fulfill the anti-money laundering requirements of the Patriot Act. The Bank also implemented new systems and procedures to identify suspicious activity reports, and reports any such activity to the Financial Crimes Enforcement Network.
Sarbanes-Oxley Act of 2002
The Company is subject to the Sarbanes-Oxley Act of 2002 (“Sarbanes-Oxley”) which addresses, among other issues, corporate governance, auditing and accounting, executive compensation, and enhanced and timely disclosure of corporate information. Among other things, Sarbanes-Oxley mandates chief executive and chief financial officer certifications of periodic financial reports, additional financial disclosures concerning off-balance sheet items, and speedier transaction reporting requirements for executive officers, directors and 10% shareholders than were previously required. In addition, Sarbanes-Oxley heightened penalties for non-compliance with the Exchange Act. SEC rules promulgated pursuant to Sarbanes-Oxley impose obligations and restrictions on auditors and audit committees intended to enhance their independence from management, and include extensive additional disclosure, corporate governance and other related rules.
Commercial Real Estate Lending Concentrations
In December 2006, the federal bank regulatory agencies released Guidance on Concentrations in Commercial Real Estate (“CRE”) Lending, Sound Risk Management Practices (the “Guidance”). The Guidance, which was issued in response to the agencies’ concern that rising CRE concentrations might expose institutions to unanticipated earnings and capital volatility in the event of adverse changes in the commercial real estate market, reinforces existing
13
Table of Contents
regulations and guidelines for real estate lending and loan portfolio management. Highlights of the Guidance include the following:
| • | The agencies have observed that CRE concentrations have been rising over the past several years with small to mid-size institutions showing the most significant increase in CRE concentrations over the last decade. However, some institutions’ risk management practices are not evolving with their increasing CRE concentrations, and therefore, the Guidance reminds institutions that strong risk management practices and appropriate levels of capital are important elements of a sound CRE lending program. |
| • | The Guidance applies to national banks and state chartered banks, and is also broadly applicable to bank holding companies. For purposes of the Guidance, CRE loans include loans for land development and construction, other land loans, and loans secured by multifamily and nonfarm residential properties. The definition also extends to loans to real estate investment trusts and unsecured loans to developers if their performance is closely linked to the performance of the general CRE market. |
| • | The agencies recognize that banks serve a vital role in their communities by supplying credit for business and real estate development, therefore the Guidance is not intended to limit banks’ CRE lending. Instead, the Guidance encourages institutions to identify and monitor credit concentrations, establish internal concentration limits, and report concentrations to management and the board of directors on a periodic basis. |
| • | The agencies recognize that different types of CRE lending present different levels of risk, and therefore, institutions are encouraged to segment their CRE portfolios to acknowledge these distinctions. However, the CRE portfolio should not be divided into multiple sections simply to avoid the appearance of risk concentration. |
| • | Institutions should address the following key elements in establishing a risk management framework for identifying, monitoring, and controlling CRE risk: (1) board of directors and management oversight; (2) portfolio management; (3) management information systems; (4) market analysis; (5) credit underwriting standards; (6) portfolio stress testing and sensitivity analysis; and (7) credit review function. |
| • | As part of the ongoing supervisory monitoring processes, the agencies will use certain criteria to identify institutions that are potentially exposed to significant CRE concentration risk. An institution that has experienced rapid growth in CRE lending, has notable exposure to a specific type of CRE, or is approaching or exceeds specified supervisory criteria may be identified for further supervisory analysis. |
The Bank believes that the Guidance is applicable to it, as it has a relatively high level concentration in CRE loans. The Bank and its board of directors have discussed the Guidance and believe that the Bank’s underwriting policies, management information systems, independent credit administration process and monitoring of real estate loan concentrations is sufficient to address the Guidance.
Allowance for Loan and Lease Losses
In December 2006, the federal bank regulatory agencies released an Interagency Policy Statement on the Allowance for Loan and Lease Losses (“ALLL”), which revises and replaces the banking agencies’ 1993 policy statement on the ALLL. The revised statement was issued to ensure consistency with generally accepted accounting principles (GAAP) and more recent supervisory guidance, and it extended the scope to include credit unions.
Highlights of the revised statement include the following:
| • | The revised statement emphasizes that the ALLL represents one of the most significant estimates in an institution’s financial statements and regulatory reports, and that an assessment of the appropriateness of the ALLL is critical to an institution’s safety and soundness. |
| • | Each institution has a responsibility to develop, maintain, and document a comprehensive, systematic, and consistently applied process for determining the amounts of the ALLL. An institution must maintain an ALLL that is sufficient to cover estimated credit losses on individual impaired loans as well as estimated credit losses inherent in the remainder of the portfolio. |
| • | The revised statement updated the previous guidance on the following issues regarding ALLL: (1) responsibilities of the board of directors, management, and bank examiners; (2) factors to be considered in the estimation of ALLL; and (3) objectives and elements of an effective loan review system. |
14
Table of Contents
Other Pending and Proposed Legislation
Other legislative and regulatory initiatives which could affect the Company, the Bank and the banking industry in general are pending, and additional initiatives may be proposed or introduced before the United States Congress, the California legislature and other governmental bodies in the future. Such proposals, if enacted, may further alter the structure, regulation and competitive relationship among financial institutions, and may subject the Bank to increased regulation, disclosure and reporting requirements. In addition, the various banking regulatory agencies often adopt new rules and regulations to implement and enforce existing legislation. It cannot be predicted whether, or in what form, any such legislation or regulations may be enacted or the extent to which the business of the Company or the Bank would be affected thereby.
You should carefully consider the following risk factors and all other information contained in this Annual Report before making investment decisions concerning the Company’s common stock. The risks and uncertainties described below are not the only ones the Company faces. Additional risks and uncertainties not presently known to the Company or that the Company currently believes are immaterial may also adversely impact the Company’s business. If any of the events described in the following risk factors occur, the Company’s business, results of operations and financial condition could be materially adversely affected. In addition, the trading price of the Company’s common stock could decline due to any of the events described in these risks.
Risks Relating to the Bank and to the Business of Banking in General
Our business has been and may continue to be adversely affected by volatile conditions in the financial markets and unfavorable economic conditions generally. From December 2007 through June 2009, the U.S. economy was in recession. Business activity across a wide range of industries and regions in the U. S. was greatly reduced. The financial markets and the financial services industry in particular suffered unprecedented disruption, causing a number of institutions to fail or to require government intervention to avoid failure.
As a result of these financial and economic crises, many lending institutions, including our company, have experienced significant declines in the performance of their loans, particularly construction, development and land loans, and unsecured commercial and consumer loans. Our total nonperforming assets stood at $66.6 million at December 31, 2010, relative to $72.6 million at December 31, 2009 and $36.9 million at December 31, 2008, representing 8.07%, 7.98% and 3.87% of total gross loans and other real estate owned at December 31, 2010, December 31, 2009 and December 31, 2008, respectively.
The California economy has been particularly hard hit, and the economic decline has been a major factor leading to the significant increase in the Company’s nonperforming assets and loan charge-offs since December 31, 2007. While unemployment levels have always been relatively high in the San Joaquin Valley and in Tulare County, which is our geographic center and the base of our agriculturally oriented communities, the unemployment rate reached 17.7% in December 2010, up from 17.1% in December 2009 and 13.5% in December 2008. Local unemployment rates were well above the 12.5% aggregate unemployment rate for California as of December 2010.
Although there are indications of improving economic conditions nationally, certain sectors, such as real estate, remain weak and unemployment remains high, especially in our local markets. The state government, most local governments, and many businesses are still in serious difficulty due to lower consumer spending and the lack of liquidity in the credit markets. In addition, the values of the real estate collateral supporting many commercial loans and home mortgages have declined and may continue to decline. Further negative market developments also may continue to adversely affect consumer confidence levels and payment patterns, which could cause delinquencies and default rates to remain at high levels.
If business and economic conditions do not improve generally or in the principal markets in which we do business, the prolonged economic weakness could have one or more of the following adverse effects on our business:
15
Table of Contents
| • | a decrease in the demand for loans or other products and services offered by us; |
| • | a decrease in the value of our loans or other assets secured by residential or commercial real estate; |
| • | a decrease in deposit balances due to overall reductions in the accounts of customers; |
| • | an impairment of our investment securities; and |
| • | an increase in the number of borrowers who become delinquent, file for protection under bankruptcy laws or default on their loans or other obligations to us, which in turn could result in a higher level of nonperforming assets, net charge-offs and provision for credit losses, which would reduce our earnings. |
Challenges in the agricultural industry could have an adverse effect on our customers and their ability to make payments to us. While the current high level of the Company’s nonperforming assets is comprised mainly of other real estate owned and loans secured by land, lots, and residential real estate, difficulties facing the agricultural industry in our market areas have contributed to high levels of nonperforming assets in the past. This is due to the fact that a sizable portion of our total loan portfolio consists of loans to borrowers either directly or indirectly involved in the agricultural industry. A great number of our borrowers may not be individually directly involved in agriculture, but many of the jobs in the San Joaquin Valley are ancillary to the regular production, processing, marketing and sales of agricultural commodities.
The entry of global suppliers into the market has, in the past, led to excess market supply of many agricultural products, and a drop in consumer demand is currently contributing to softness in the market. Because of increased supply from overseas competition, declining demand and other factors, low prices currently characterize the markets for many agricultural products. The ripple effect of lower commodity prices for milk, nuts, olives, grapes, oranges and tree fruit has a tendency to depress land prices, lower borrower income, and decrease collateral values. Weather patterns are also of critical importance to row crop, tree fruit, and citrus production. A degenerative cycle of weather has the potential to adversely affect agricultural industries as well as consumer purchasing power, and could lead to further unemployment throughout the San Joaquin Valley. Another potential looming issue that could have a major impact on the agricultural industry involves water distribution rights. If the amount of water available to agriculture becomes increasingly scarce due to drought and/or diversion to other uses, farmers may not be able to continue to produce agricultural products at a reasonable profit, which has the potential to force many out of business. Such conditions have affected and may continue to adversely affect our borrowers and, by extension, our business, and if general agricultural conditions decline further our level of nonperforming assets could increase.
Concentrations of real estate loans could subject us to increased risks in the event of a prolonged real estate recession or natural disaster. Our loan portfolio is heavily concentrated in real estate loans, particularly commercial real estate. At December 31, 2010, 77% of our loan portfolio consisted of loans secured by real estate. Balances secured by commercial buildings and construction and development loans represented 63% of all real estate loans, while loans secured by non-construction residential properties accounted for 28%, and loans secured by farmland were 9% of real estate loans.
The Company’s $66.6 million balance of nonperforming assets at December 31, 2010 included $20.7 million in foreclosed assets, primarily other real estate owned (OREO) consisting of vacant land, lots, and residential properties. Nonperforming loans totaling $45.9 million comprised the remainder of the nonperforming assets, and $38.9 million of that balance was in nonperforming real estate loans. The largest block of nonperforming real estate loans was $22.1 million in commercial real estate loans, and nonperforming construction and development loans totaled $10.2 million.
The Central Valley residential real estate market experienced significant deflation in property values during 2008 and 2009, and foreclosures have continued to occur at relatively high rates since the beginning of the recession. If residential real estate values slide further, and/or if this weakness further impacts commercial real estate values, the Company’s nonperforming assets could increase from current levels. Such an increase could have a material adverse effect on our financial condition and results of operations by reducing our income, increasing our expenses, and leaving less cash available for lending and other activities. As noted above, the primary collateral for many of our loans consists of commercial real estate properties, and continued deterioration in the real estate market in the areas the Company serves would likely reduce the value of the collateral value for many of our loans and could negatively impact the repayment ability of many of our borrowers. It might also reduce further the amount of loans the
16
Table of Contents
Company makes to businesses in the construction and real estate industry, which could negatively impact our organic growth prospects. Similarly, the occurrence of a natural disaster like those California has experienced in the past, including earthquakes, brush fires, and flooding, could impair the value of the collateral we hold for real estate secured loans and negatively impact our results of operations.
In addition, banking regulators now give commercial real estate loans extremely close scrutiny, due to risks relating to the cyclical nature of the real estate market and related risks for lenders with high concentrations of such loans. The regulators have required banks with relatively high levels of CRE loans to implement enhanced underwriting standards, internal controls, risk management policies and portfolio stress testing, which has resulted in higher allowances for possible loan losses. Expectations for higher capital levels have also materialized. Any increase in our allowance for loan losses would adversely affect our net income, and any requirement that we maintain higher capital levels could adversely impact financial performance measures such as earnings per share.
Our concentrations of commercial real estate, construction and land development, and commercial and industrial loans expose us to increased lending risks. Commercial real estate, construction and land development, and commercial and industrial loans and leases, including agricultural production loans but not including SBA loans, comprised approximately 64% of our total loan portfolio as of December 31, 2010, and expose the Company to a greater risk of loss than residential real estate and consumer loans, which comprised a smaller percentage of the total loan portfolio. Commercial real estate and land development loans typically involve larger loan balances to single borrowers or groups of related borrowers compared to residential loans. Consequently, an adverse development with respect to one commercial loan or one credit relationship exposes us to a significantly greater risk of loss compared to an adverse development with respect to one residential mortgage loan.
Repayment of our commercial loans is often dependent on the cash flows of the borrower, which may be unpredictable, and the collateral securing these loans may fluctuate in value. At December 31, 2010, we had $118 million or 15% of total loans in commercial loans and leases, including agricultural production loans but not including SBA loans. Commercial lending involves risks that are different from those associated with residential and commercial real estate lending. Real estate lending is generally considered to be collateral based lending with loan amounts based on predetermined loan to collateral values and liquidation of the underlying real estate collateral being viewed as the primary source of repayment in the event of borrower default. Our commercial loans are primarily made based on the cash flow of the borrower and secondarily on any underlying collateral provided by the borrower. The borrower’s cash flow may be unpredictable, and collateral securing these loans may fluctuate in value. Although commercial loans are often collateralized by equipment, inventory, accounts receivable, or other business assets, the liquidation of collateral in the event of default is often an insufficient source of repayment because accounts receivable may be uncollectible and inventories may be obsolete or of limited use, among other things. Accordingly, the repayment of commercial loans depends primarily on the cash flow and credit worthiness of the borrower and secondarily on the underlying collateral provided by the borrower.
Nonperforming assets take significant time to resolve and adversely affect our results of operations and financial condition. Our nonperforming assets adversely affect our net income in various ways. Until economic and market conditions improve, we expect that our nonperforming loans will continue at relatively high levels, which will negatively impact earnings and could have a substantial adverse impact if conditions deteriorate further. We do not record interest income on non-accrual loans, thereby adversely affecting our level of interest income. Additionally, our non-interest expense has increased due to the costs of reappraising adversely classified assets, legal and other costs associated with loan collections, operating costs related to foreclosed assets, and various other expenses that would not typically be incurred in a normal operating environment. Furthermore, when we receive collateral through foreclosures and similar proceedings, we are required to record the collateral at its fair market value less estimated selling costs, which may result in write-downs or losses. An increase in the level of nonperforming assets also increases our risk profile and may impact the capital levels our regulators believe is appropriate in light of such risks. We utilize various techniques such as loan sales, workouts and restructurings to manage our problem assets. Decreases in the value of these problem assets, the underlying collateral, or in the borrowers’ performance or financial condition, could adversely affect our business, results of operations and financial condition. In addition, the resolution of nonperforming assets requires a significant commitment of time from management and staff, which can
17
Table of Contents
be detrimental to performance of their other responsibilities. There can be no assurance that we will avoid further increases in nonperforming loans in the future.
We may experience loan and lease losses in excess of our allowance for such losses. We endeavor to limit the risk that borrowers might fail to repay; nevertheless, losses can and do occur. We maintain an allowance for estimated loan and lease losses in our accounting records, based on estimates of the following:
| • | historical experience with our loans; |
| • | evaluation of economic conditions; |
| • | regular reviews of the quality mix and size of the overall loan portfolio; |
| • | a detailed cash flow analysis for nonperforming loans; |
| • | regular reviews of delinquencies; and |
| • | the quality of the collateral underlying our loans. |
We maintain our allowance for loan and lease losses at a level that we believe is adequate to absorb specifically identified probable losses as well as any other losses inherent in our loan portfolio at a given date. While we strive to carefully monitor credit quality and to identify loans that may become nonperforming, at any time there are loans in the portfolio that could result in losses, but that have not been identified as nonperforming or potential problem loans. We cannot be sure that we will be able to identify deteriorating loans before they become nonperforming assets, or that we will be able to limit losses on those loans that have been identified. Changes in economic, operating and other conditions, including changes in interest rates, deteriorating values in underlying collateral (most of which consists of real estate), and the financial condition of borrowers, which are beyond our control, may cause our estimate of probable losses or actual loan losses to exceed our current allowance. In addition, the FDIC and the DFI, as part of their supervisory functions, periodically review our allowance for loan and lease losses. Such agencies may require us to increase our provision for loan and lease losses or to recognize further losses, based on their judgments, which may be different from those of our management. Any such increase in the allowance required by the FDIC or the DFI could also hurt our business.
Our use of appraisals in deciding whether to make a loan on or secured by real property does not ensure the value of the real property collateral. In considering whether to make a loan secured by real property, we generally require an appraisal of the property. However, an appraisal is only an estimate of the value of the property at the time the appraisal is made, and an error in fact or judgment could adversely affect the reliability of an appraisal. In addition, events occurring after the initial appraisal may cause the value of the real estate to decrease. As a result of any of these factors the value of collateral backing a loan may be less than supposed, and if a default occurs we may not recover the outstanding balance of the loan.
Our expenses have increased and could continue to increase as a result of increases in FDIC insurance premiums. The FDIC, absent extraordinary circumstances, must establish and implement a plan to restore the deposit insurance reserve ratio to 1.35% of estimated insured deposits or the comparable percentage of the assessment base at any time the reserve ratio falls below 1.35%. Recent bank failures have depleted the deposit insurance fund balance, which has been in a negative position since the end of 2009, and the FDIC currently has until September 30, 2020 to bring the reserve ratio back to the statutory minimum. As noted above under “Regulation and Supervision – Deposit Insurance”, the FDIC has implemented a restoration plan that adopts a new assessment base and establishes new assessment rates starting with the second quarter of 2011. The FDIC also imposed a special assessment in 2009 and required the prepayment of three years of FDIC insurance premiums at the end of 2009. The prepayments are designed to help address liquidity issues created by potential timing differences between the collection of premiums and charges against the DIF, but it is generally expected that assessment rates will remain relatively high in the near term due to the significant cost of bank failures and the relatively large number of troubled banks. Any further significant premium increases or special assessments could have a material adverse effect on our financial condition and results of operations.
We may not be able to continue to attract and retain banking customers, and our efforts to compete may reduce our profitability. Competition in the banking industry in the markets we serve may limit our ability to continue to attract and retain banking customers. The banking business in our current and intended future market areas is highly competitive with respect to virtually all products and services. In California generally, and in our
18
Table of Contents
service areas specifically, branches of major banks dominate the commercial banking industry. Such banks have substantially greater lending limits than we have, offer certain services we cannot offer directly, and often operate with “economies of scale” that result in lower operating costs than ours on a per loan or per asset basis. We also compete with numerous financial and quasi-financial institutions for deposits and loans, including providers of financial services over the Internet. New technology and other changes are allowing parties to effectuate financial transactions that previously required the involvement of banks. For example, consumers can maintain funds that would have historically been held as bank deposits in brokerage accounts or mutual funds. Consumers can also complete transactions such as paying bills and transferring funds directly without the assistance of banks. The process of eliminating banks as intermediaries, known as “disintermediation,” could result in the loss of fee income, as well as the loss of customer deposits and the related income generated from those deposits. The loss of these revenue streams and the lower cost deposits as a source of funds could have a material adverse effect on our financial condition and results of operations.
In addition, with the increase in bank failures, customers are increasingly concerned about the extent to which their deposits are insured by the FDIC. Customers may withdraw deposits in an effort to ensure that the amount they have on deposit with their bank is fully insured. Decreases in deposits may adversely affect our funding costs and net income. Ultimately, competition can and does increase our cost of funds, reduce loan yields and drive down our net interest margin, thereby reducing profitability. It can also make it more difficult for us to continue to increase the size of our loan portfolio and deposit base, and could cause us to rely more heavily on wholesale borrowings, which are generally more expensive than deposits.
If we are not able to successfully keep pace with technological changes affecting the industry, our business could be hurt. The financial services industry is constantly undergoing technological change, with the frequent introduction of new technology-driven products and services. The effective use of technology increases efficiency and enables financial institutions to better service clients and reduce costs. Our future success depends, in part, upon our ability to address the needs of our clients by using technology to provide products and services that will satisfy client demands, as well as create additional efficiencies within our operations. Some of our competitors have substantially greater resources to invest in technological improvements. We may not be able to effectively implement new technology-driven products and services or be successful in marketing these products and services to our clients. Failure to successfully keep pace with technological change in the financial services industry could have a material adverse impact on our business and, in turn, on our financial condition and results of operations.
If our information systems were to experience a system failure or a breach in security, our business and reputation could suffer. We rely heavily on communications and information systems to conduct our business. The computer systems and network infrastructure we use could be vulnerable to unforeseen problems. Our operations are dependent upon our ability to protect our computer equipment against damage from fire, power loss, telecommunications failure or a similar catastrophic event. In addition, we must be able to protect our computer systems and network infrastructure against physical damage, security breaches and service disruption caused by the Internet or other users. Such computer break-ins and other disruptions would jeopardize the security of information stored in and transmitted through our computer systems and network infrastructure. We have protective measures in place to prevent or limit the effect of the failure, interruption or security breach of our information systems and will continue to implement security technology and monitor and update operational procedures to prevent such damage. However, if such failures, interruptions or security breaches were to occur, they could result in damage to our reputation, a loss of customers, increased regulatory scrutiny, or possible exposure to financial liability, any of which could have a material adverse effect on our financial condition and results of operations.
We are subject to a variety of operational risks, including reputational risk, legal risk and compliance risk, and the risk of fraud or theft by employees or outsiders, which may adversely affect our business and results of operations. We are exposed to many types of operational risks, including reputational risk, legal and compliance risk, the risk of fraud or theft by employees or outsiders, and unauthorized transactions by employees or operational errors, including clerical or record-keeping errors or those resulting from faulty or disabled computer or telecommunications systems.
19
Table of Contents
If personal, non-public, confidential or proprietary information of customers in our possession were to be mishandled or misused, we could suffer significant regulatory consequences, reputational damage and financial loss. Such mishandling or misuse could occur, for example, if information were erroneously provided to parties who are not permitted to have the information, either by fault of our systems, employees, or counterparties, or where such information is intercepted or otherwise inappropriately taken by third parties.
Because the nature of the financial services business involves a high volume of transactions, certain errors may be repeated or compounded before they are discovered and successfully rectified. Our necessary dependence upon automated systems to record and process transactions and our large transaction volume may further increase the risk that technical flaws or employee tampering or manipulation of those systems could result in losses that are difficult to detect. We also may be subject to disruptions of our operating systems arising from events that are wholly or partially beyond our control (for example, computer viruses or electrical or telecommunications outages, or natural disasters, disease pandemics or other damage to property or physical assets) which may give rise to disruption of service to customers and to financial loss or liability. We are further exposed to the risk that our external vendors may be unable to fulfill their contractual obligations (or will be subject to the same risk of fraud or operational errors by their respective employees as we are) and to the risk that we (or our vendors’) business continuity and data security systems prove to be inadequate. The occurrence of any of these risks could result in a diminished ability to operate our business (for example, by requiring us to expend significant resources to correct the defect), as well as potential liability to clients, reputational damage and regulatory intervention, which could adversely affect our business, financial condition and results of operations, perhaps materially.
Recently enacted and potential further financial regulatory reforms could have a significant impact on our business, financial condition and results of operations. The Dodd-Frank Wall Street Reform and Consumer Protection Act was enacted in July 2010. Dodd-Frank is expected to have a broad impact on the financial services industry, including significant regulatory and compliance changes. Many of the requirements called for in Dodd-Frank will be implemented over time and most will be subject to implementing regulations over the course of several years. Given the uncertainty associated with the manner in which the provisions of Dodd-Frank will be implemented by the various regulatory agencies and through regulations, the full extent of the impact these requirements will have on our operations is unclear. The changes resulting from Dodd-Frank may impact the profitability of business activities, require changes to certain business practices, impose more stringent capital, liquidity and leverage requirements or otherwise adversely affect our business. In particular, the potential impact of Dodd-Frank on our operations and activities, both currently and prospectively, include, among others:
| • | a reduction in the ability to generate or originate revenue-producing assets as a result of compliance with heightened capital standards; |
| • | increased cost of operations due to greater regulatory oversight, supervision and examination of banks and bank holding companies, and higher deposit insurance premiums; |
| • | the limitation on the ability to raise new capital through the use of trust preferred securities, as any new issuances of these securities are not includible as Tier 1 capital; |
| • | a potential reduction in fee income due to limits on interchange fees applicable to larger institutions which could effectively reduce the fees we can charge; and |
| • | the limitation on the ability to expand consumer product and service offerings due to anticipated stricter consumer protection laws and regulations. |
Further, we may be required to invest significant management attention and resources to evaluate and make any changes necessary to comply with new statutory and regulatory requirements under the Dodd-Frank Act, which may negatively impact results of operations and financial condition.
Additionally, we cannot predict whether there will be additional proposed laws or reforms that would affect the U.S. financial system or financial institutions, whether or when such changes may be adopted, how such changes may be interpreted and enforced or how such changes may affect us. However, the costs of complying with any additional laws or regulations could have a material adverse effect on our financial condition and results of operations.
We may be adversely affected by the soundness of other financial institutions. Our ability to engage in routine funding transactions could be adversely affected by the actions and liquidity of other financial institutions. Financial
20
Table of Contents
institutions are often interconnected as a result of trading, clearing, counterparty, or other business relationships. We have exposure to many different industries and counterparties, and routinely execute transactions with counterparties in the financial services industry, including commercial banks, brokers and dealers, investment banks, and other institutional clients. Many of these transactions expose us to credit risk in the event of a default by a counterparty or client. In addition, our credit risk may be exacerbated when collateral held by us cannot be liquidated at prices sufficient to recover the full amount of the credit or derivative exposure due to us. Any such losses could adversely affect our business, financial condition or results of operations.
Changes in interest rates could adversely affect our profitability, business and prospects. Banking companies’ earnings depend largely on the relationship between the cost of funds, primarily deposits and borrowings, and the yield on earning assets, such as loans and investment securities. That relationship, known as the interest rate spread, is subject to fluctuation and is affected by the monetary policies of the Federal Reserve Board and the international interest rate environment, as well as by economic, regulatory and competitive factors which influence interest rates, the volume and mix of interest earning assets and interest bearing liabilities, and the level of nonperforming assets. Many of these factors are beyond our control. We are subject to interest rate risk to the degree that our interest bearing liabilities re-price or mature more slowly or more rapidly or on a different basis than our interest earning assets. For example, if the rate of interest we pay on interest-bearing deposits, borrowings, and other liabilities increases more than the rate of interest we receive on loans, securities, and other interest-earning assets, our net interest income and therefore our earnings could be adversely affected. Our earnings could also be adversely affected if the rates on our loans and other investments fall more quickly than those on our deposits and other liabilities.
In addition, fluctuations in interest rates affect the demand of customers for products and services. For example, rising interest rates are generally associated with a lower volume of loan originations, while lower interest rates typically generate increased loan originations. Moreover, an increase in the general level of interest rates may adversely affect the ability of certain borrowers to make variable-rate loan payments as they adjust upward. Accordingly, changes in market interest rates could materially and adversely affect our net interest spread, asset quality, loan origination volume, business, financial condition, results of operations, and cash flows.
We depend on our executive officers and key personnel to implement our business strategy and could be harmed by the loss of their services. We believe that our continued growth and success depends in large part upon the skills of our management team and other key personnel. The competition for qualified personnel in the financial services industry is intense, and the loss of key personnel or an inability to continue to attract, retain or motivate key personnel could adversely affect our business. If we are not able to retain our existing key personnel or attract additional qualified personnel, our business operations would be hurt. None of our executive officers have employment agreements.
The value of securities in our investment securities portfolio may be negatively affected by continued disruptions in securities markets. The market for some of the investment securities held in our portfolio has experienced volatility and disruption for the last several years. These market conditions may have a detrimental effect on the value of our securities, such as reduced valuations because of the perception of heightened credit risks or due to illiquid markets for certain securities. There can be no assurance that the declines in market value associated with these disruptions will not result in other-than-temporary impairments of these assets, which would lead to accounting charges that could have a material adverse effect on our results of operations and capital levels.
We are exposed to risk of environmental liabilities with respect to properties to which we obtain title. Approximately 77% of our loan portfolio at December 31, 2010 was secured by real estate. In the normal course of business, we may foreclose and take title to real estate, and could be subject to environmental liabilities with respect to these properties. We may be held liable to a governmental entity or to third parties for property damage, personal injury, investigation and clean-up costs incurred by these parties in connection with environmental contamination, or may be required to investigate or clean up hazardous or toxic substances, or chemical releases at a property. The costs associated with investigation or remediation activities could be substantial. In addition, if we are the owner or former owner of a contaminated site, we may be subject to common law claims by third parties based on damages and costs resulting from environmental contamination emanating from the property. These costs and claims could adversely affect our business and prospects.
21
Table of Contents
The recent repeal of federal prohibitions on payment of interest on demand deposits could increase our interest expense. All federal prohibitions on the ability of financial institutions to pay interest on demand deposit accounts were repealed as part of the Dodd-Frank Act. As a result, beginning on July 21, 2011, financial institutions could commence offering interest on demand deposits to compete for clients. We do not yet know what interest rates other institutions may offer. Our interest expense will increase and our net interest margin will decrease if we begin offering interest on demand deposits to attract additional customers or maintain current customers, which could have a material adverse effect on our business, financial condition and results of operations.
Risks Related to our Common Stock
The price of our common stock may fluctuate significantly, and this may make it difficult for you to sell shares of common stock at times or at prices you find attractive. The trading price of our common stock may fluctuate widely as a result of a number of factors, many of which are outside our control. In addition, the stock market is subject to fluctuations in share prices and trading volumes that affect the market prices of the shares of many companies. These broad market fluctuations could adversely affect the market price of our common stock. Among the factors that could affect our common stock price in the future are:
| • | actual or anticipated quarterly fluctuations in our operating results and financial condition; |
| • | formal regulatory action against us; |
| • | changes in revenue or earnings estimates or publication of research reports and recommendations by financial analysts; |
| • | failure to meet analysts’ revenue or earnings estimates; |
| • | speculation in the press or investment community; |
| • | strategic actions by us or our competitors, such as acquisitions or restructurings; |
| • | acquisitions of other banks or financial institutions, through FDIC-assisted transactions or otherwise; |
| • | actions by shareholders; |
| • | fluctuations in the stock price, trading volumes, and operating results of our competitors; |
| • | general market conditions and, in particular, market conditions for the financial services industry; |
| • | fluctuations in the stock prices and/or operating results of our competitors; |
| • | proposed or adopted regulatory changes or developments; |
| • | anticipated or pending investigations, proceedings, or litigation that involve or affect us; and |
| • | domestic and international economic factors unrelated to our performance. |
The stock market and, in particular, the market for financial institution stocks, has experienced significant volatility. As a result, the market price of our common stock may be volatile. In addition, the trading volume in our common stock may fluctuate more than usual and cause significant price variations to occur. The trading price of the shares of our common stock also depends on many other factors which may change from time to time, including, without limitation, our financial condition, performance, creditworthiness and prospects, future sales of our equity or equity related securities, and other factors identified elsewhere in this report. The capital and credit markets have been experiencing volatility and disruption for several years, at times reaching unprecedented levels. In some cases, the markets have produced downward pressure on stock prices and credit availability for certain issuers without regard to those issuers’ underlying financial strength. A significant decline in our stock price could result in substantial losses for individual shareholders and could lead to costly and disruptive securities litigation.
We may pursue additional capital in the future, which may not be available on acceptable terms or at all, could dilute the holders of our outstanding common stock, and may adversely affect the market price of our common stock. In the current economic environment, we believe it is prudent to consider alternatives for raising capital when opportunities to raise capital at attractive prices present themselves, in order to further strengthen our capital and better position ourselves to take advantage of opportunities that may arise in the future. Our ability to raise additional capital, if needed, will depend on, among other things, conditions in the capital markets at the time, which are outside of our control, and our financial performance. We cannot provide any assurance that such capital will be available to us on acceptable terms or at all. Any such capital raising alternatives could dilute the holders of our outstanding common stock, and may adversely affect the market price of our common stock and our performance measures such as earnings per share.
22
Table of Contents
The Company relies heavily on the payment of dividends from the Bank. Other than $8.2 million in cash available at the holding company level at December 31, 2010, the Company’s ability to meet debt service requirements and to pay dividends depends on the Bank’s ability to pay dividends to the Company, as it has no other source of significant income. However, the Bank is subject to regulations limiting the amount of dividends it may pay. For example, the payment of dividends by the Bank is affected by the requirement to maintain adequate capital pursuant to the capital adequacy guidelines issued by the Federal Deposit Insurance Corporation. All banks and bank holding companies are required to maintain a minimum ratio of qualifying total capital to total risk-weighted assets of 8%, at least one-half of which must be in the form of Tier 1 capital, and a ratio of Tier 1 capital to average adjusted assets of 4%. If (i) any of these required ratios are increased; (ii) the total of risk-weighted assets of the Bank increases significantly; and/or (iii) the Bank’s income declines significantly, the Bank’s Board of Directors may decide or be required to retain a greater portion of the Bank’s earnings to achieve and maintain the required capital or asset ratios. This will reduce the amount of funds available for the payment of dividends by the Bank to the Company. Further, in some cases, the Federal Reserve Board could take the position that it has the power to prohibit the Bank from paying dividends if, in its view, such payments would constitute unsafe or unsound banking practices. The Bank’s ability to pay dividends to the Company is also limited by the California Financial Code. Whether dividends are paid and their frequency and amount will also depend on the financial condition and performance, and the discretion of the Board of Directors of the Bank. Information concerning the Company’s dividend policy and historical dividend practices is set forth below under “Dividend Policy.” However, no assurance can be given that our future performance will justify the payment of dividends in any particular year.
You may not be able to sell your shares at the times and in the amounts you want if the trading market for our stock is not active. Although our stock has been listed on NASDAQ for many years, trading in our stock does not consistently occur in high volumes and cannot always be characterized as an active trading market. The limited trading market for our common stock may exaggerate fluctuations in the value of our common stock, leading to price volatility in excess of that which would occur in a more active trading market. Future sales of substantial amounts of common stock in the public market, or the perception that such sales may occur, could also adversely affect the prevailing market price of our common stock.
Your investment may be diluted because of the ability of management to offer stock to others and stock options. The shares of our common stock do not have preemptive rights. This means that you may not be entitled to buy additional shares if shares are offered to others in the future. We are authorized to issue 24,000,000 shares of common stock, and as of December 31, 2010 we had 13,976,741 shares of our common stock outstanding. Except for certain limitations imposed by NASDAQ, nothing restricts management’s ability to offer additional shares of stock for fair value to others in the future. Any issuances of common stock would dilute our shareholders’ ownership interests and may dilute the per share book value of our common stock. In addition, when our directors, executive officers and key employees exercise any of their stock options, your ownership in the Company will be diluted. As of December 31, 2010, there were outstanding options to purchase an aggregate of 834,868 shares of our common stock with an average exercise price of $14.24 per share. At the same date there were an additional 1,023,920 shares available for grant under our 2007 Stock Incentive Plan.
Shares of our preferred stock issued in the future could have dilutive and other effects. Shares of our preferred stock eligible for future issuance and sale could have a dilutive effect on the market for shares of our common stock. Our Articles of Incorporation authorize us to issue 10,000,000 shares of preferred stock, none of which is presently outstanding. Although our Board of Directors has no present intent to authorize the issuance of shares of preferred stock, such shares could be authorized in the future. If such shares of preferred stock are made convertible into shares of common stock, there could be a dilutive effect on the shares of common stock then outstanding. In addition, shares of preferred stock may be provided a preference over holders of common stock upon our liquidation or with respect to the payment of dividends, in respect of voting rights or in the redemption of our common stock. The rights, preferences, privileges and restrictions applicable to any series or preferred stock would be determined by resolution of our Board of Directors.
The holders of our debentures have rights that are senior to those of our shareholders. In 2004 we issued $15,464,000 of junior subordinated debt securities due March 17, 2034 and in 2006 we issued an additional $15,464,000 of junior subordinated debt securities due September 23, 2036 in order to raise additional regulatory
23
Table of Contents
capital. These junior subordinated debt securities are senior to the shares of our common stock. As a result, we must make interest payments on the debentures before any dividends can be paid on our common stock, and in the event of our bankruptcy, dissolution or liquidation, the holders of the debt securities must be paid in full before any distributions may be made to the holders of our common stock. In addition, we have the right to defer interest payments on the junior subordinated debt securities for up to five years, during which time no dividends may be paid to holders of our common stock. In the event that the Bank is unable to pay dividends to us, then we may be unable to pay the amounts due to the holders of the junior subordinated debt securities and, thus, we would be unable to declare and pay any dividends on our common stock.
Provisions in our articles of incorporation could delay or prevent changes in control of our corporation or our management. Our articles of incorporation contain provisions for staggered terms of office for members of the board of directors; no cumulative voting in the election of directors; and the requirement that our board of directors consider the potential social and economic effects on our employees, depositors, customers and the communities we serve as well as certain other factors, when evaluating a possible tender offer, merger or other acquisition of the Company. These provisions make it more difficult for another company to acquire us, which could cause our shareholders to lose an opportunity to be paid a premium for their shares in an acquisition transaction, and reduce the current and future market price of our common stock.
ITEM 1B. UNRESOLVED STAFF COMMENTS
Not applicable.
The Company’s administrative headquarters is located at 86 North Main Street, Porterville, California, and is leased through July 2013 from parties unrelated to the Company. It consists of approximately 37,000 square feet in a three-story building of which the Company is sole occupant. The Company’s main office is located at 90 N. Main Street, Porterville, California, adjacent to its administrative headquarters, and it consists of a one-story brick building that sits upon unencumbered property owned by the Company. The Company also owns unencumbered property on which 14 of its other offices are located, namely the following branches: Porterville West Olive, Bakersfield Ming, California City, Dinuba, Exeter, Farmersville, Fresno Shaw, Hanford, Lindsay, Tehachapi Downtown, Tehachapi Old Town, Three Rivers, Tulare, and Visalia Mooney. The remaining branches are all leased from unrelated parties. In addition, the Company operates a technology center in Porterville which consists of approximately 12,000 square feet in a freestanding single-story building that is leased from unrelated parties, and the Bank has eight remote ATM locations leased from unrelated parties. While limited branch expansion is planned over the course of the next few years, management believes that existing back office facilities are adequate to accommodate the Company’s operations for the immediately foreseeable future.
From time to time, the Company is a party to claims and legal proceedings arising in the ordinary course of business. After taking into consideration information furnished by counsel to the Company as to the current status of these claims or proceedings to which the Company is a party, management is of the opinion that the ultimate aggregate liability represented thereby, if any, will not have a material adverse affect on the financial condition of the Company.
24
Table of Contents
ITEM 5. MARKET FOR REGISTRANT’S COMMON EQUITY, RELATED SHAREHOLDER MATTERS AND ISSUER PURCHASES OF EQUITY SECURITIES
(a) Market Information
Sierra Bancorp’s Common Stock trades on the NASDAQ Global Select Market under the symbol BSRR, and the CUSIP number for our stock is #82620P102. Trading in the Common Stock of the Company has not consistently occurred in high volumes, and such trading activity cannot always be characterized as constituting an active trading market. The following table summarizes trades of the Company’s Common Stock, setting forth the approximate high and low sales prices and volume of trading for the periods indicated, based upon information provided by public sources.
| Calendar Quarter Ended |
Sale Price of the Company’s Common Stock (per share) |
Approximate Trading Volume In Shares |
||||||||||
| High | Low | |||||||||||
| March 31, 2009 |
$ | 21.61 | $ | 6.10 | 1,732,221 | |||||||
| June 30, 2009 |
$ | 15.26 | $ | 9.39 | 1,345,876 | |||||||
| September 30, 2009 |
$ | 14.21 | $ | 11.55 | 1,247,179 | |||||||
| December 31, 2009 |
$ | 12.70 | $ | 7.00 | 2,041,361 | |||||||
| March 31, 2010 |
$ | 13.73 | $ | 7.18 | 1,898,909 | |||||||
| June 30, 2010 |
$ | 14.12 | $ | 11.49 | 1,871,420 | |||||||
| September 30, 2010 |
$ | 12.50 | $ | 10.81 | 1,605,491 | |||||||
| December 31, 2010 |
$ | 13.10 | $ | 10.06 | 1,916,775 | |||||||
(b) Holders
As of February 15, 2011 there were approximately 2,672 shareholders of the Company’s Common Stock. Per the Company’s stock transfer agent there were 595 registered holders of record on that date, and there were approximately 2,077 beneficial holders whose shares are held under a street name.
(c) Dividends
The Company paid cash dividends totaling $2.9 million, or $0.24 per share in 2010, and $4.1 million, or $0.40 per share in 2009, representing 40% of annual net earnings for dividends paid in 2010 and 46% in 2009. The Company’s general dividend policy is to pay cash dividends within the range of typical peer payout ratios, provided that such payments do not adversely affect the Company’s financial condition and are not overly restrictive to its growth capacity. While most of our peers have elected to suspend dividend payments, at least temporarily, the Company’s Board has concluded that a certain level of dividend should be maintained as long as our core operating performance remains adequate and policy or regulatory restrictions do not preclude such payments. That said, in an effort to conserve capital in an uncertain environment and maintain a rational dividend payout ratio, our quarterly per-share dividend was reduced in 2009 and lowered again in 2010, and no assurance can be given that our financial performance in any given year will justify the continued payment of a cash dividend. As a bank holding company that currently has no significant assets other than its equity interest in the Bank, the Company’s ability to declare dividends depends primarily upon current levels of cash on hand, as supplemented by dividends it might receive from the Bank. The Bank’s dividend practices in turn depend upon the Bank’s earnings, financial position, current and anticipated capital requirements, and other factors deemed relevant by the Bank’s Board of Directors at that time. The power of the Bank’s Board of Directors to declare cash dividends is also subject to statutory and regulatory restrictions. Under California banking law, the Bank may declare dividends in an amount not exceeding the lesser of its retained earnings or its net income for the last three years (reduced by dividends paid during such period) or, with the prior approval of the California Commissioner of Financial Institutions, in an amount not exceeding the greatest of (i) the retained earnings of the Bank, (ii) the net income of the Bank for its last fiscal year, or (iii) the net income of the Bank for its
25
Table of Contents
current fiscal year. The payment of any cash dividends by the Bank will depend not only upon the Bank’s earnings during a specified period, but also on the Bank meeting certain regulatory capital requirements.
The Company’s ability to pay dividends is also limited by state corporation law. The California General Corporation Law allows a California corporation to pay dividends if the company’s retained earnings equal at least the amount of the proposed dividend. If a California corporation does not have sufficient retained earnings available for the proposed dividend, it may still pay a dividend to its shareholders if immediately after the dividend the sum of the company’s assets (exclusive of goodwill and deferred charges) would be at least equal to 125% of its liabilities (not including deferred taxes, deferred income and other deferred liabilities) and the current assets of the company would be at least equal to its current liabilities, or, if the average of its earnings before taxes on income and before interest expense for the two preceding fiscal years was less than the average of its interest expense for the two preceding fiscal years, at least equal to 125% of its current liabilities. In addition, during any period in which the Company has deferred payment of interest otherwise due and payable on its subordinated debt securities, it may not make any dividends or distributions with respect to its capital stock (see “Item 7, Management’s Discussion and Analysis of Financial Condition and Results of Operations – Capital Resources”).
(d) Securities Authorized for Issuance under Equity Compensation Plans
The following table provides information as of December 31, 2010, with respect to options outstanding and available under our 2007 Stock Incentive Plan and the now-terminated 1998 Stock Option Plan, which are our only equity compensation plans other than an employee benefit plan meeting the qualification requirements of Section 401(a) of the Internal Revenue Code:
| Plan Category |
Number of Securities to be Issued Upon Exercise of Outstanding Options |
Weighted-Average Exercise Price of Outstanding Options |
Number of Securities Remaining Available for Future Issuance |
|||||||||
| Equity compensation plans approved by security holders |
834,868 | $ | 14.24 | 1,023,920 | ||||||||
(e) Performance Graph
The following is a five-year performance graph comparing the total cumulative shareholder return on the Company’s common stock to the cumulative total returns of the NASDAQ Composite Index (a broad equity market index), the SNL Bank Index, and the SNL $1 billion to $5 billion (asset size) Bank Index (the latter two qualifying as peer bank indices), assuming a $100 investment on December 31, 2005 and reinvestment of dividends:
26
Table of Contents
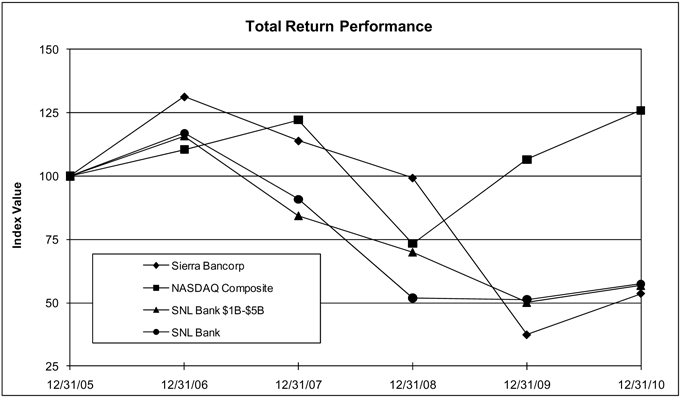
| Period Ending | ||||||||||||||||||||||||
| Index |
12/31/05 | 12/31/06 | 12/31/07 | 12/31/08 | 12/31/09 | 12/31/10 | ||||||||||||||||||
| Sierra Bancorp |
100.00 | 131.25 | 113.87 | 99.24 | 37.40 | 53.70 | ||||||||||||||||||
| NASDAQ Composite |
100.00 | 110.39 | 122.15 | 73.32 | 106.57 | 125.91 | ||||||||||||||||||
| SNL Bank $1B-$5B |
100.00 | 115.72 | 84.29 | 69.91 | 50.11 | 56.81 | ||||||||||||||||||
| SNL Bank |
100.00 | 116.98 | 90.90 | 51.87 | 51.33 | 57.52 | ||||||||||||||||||
Source : SNL Financial LC, Charlottesville, VA
(f) Stock Repurchases
The Company has a non-expiring stock repurchase program that became effective July 1, 2003, under which all share repurchases are executed in accordance with SEC Rule 10b-18. The plan initially allowed for the repurchase of up to 250,000 shares, and was supplemented by an additional 250,000 shares in May 2005, another 250,000 shares in March 2006, and 500,000 shares in April 2007. As noted in the table below, the Company did not repurchase any of its Common Stock during the fourth quarter of 2010, nor do we anticipate repurchasing any Common Stock in 2011.
| October | November | December | ||||||||||
| Total shares purchased |
0 | 0 | 0 | |||||||||
| Average per share price |
N/A | N/A | N/A | |||||||||
| Number of shares purchased as part of publicly announced plan or program |
0 | 0 | 0 | |||||||||
| Maximum number of shares remaining for purchase under a plan or program |
100,669 | 100,669 | 100,669 | |||||||||
| ITEM 6. | SELECTED FINANCIAL DATA |
The following table presents selected historical financial information concerning the Company, which should be read in conjunction with our audited consolidated financial statements, including the related notes and “Management’s Discussion and Analysis of Financial Condition and Results of Operations,” included elsewhere herein. The selected financial data as of December 31, 2010 and 2009, and for each of the years in the three year period ended December 31, 2010, is derived from our audited consolidated financial statements and related notes which are included in this Annual Report. The selected financial data for prior years is derived from our audited financial statements which are not included in this Annual Report. Throughout this Annual Report, information is for the consolidated Company unless otherwise stated.
27
Table of Contents
Selected Financial Data
| As of and for the years ended December 31, | ||||||||||||||||||||
| (Dollars in thousands, except per share data) | 2010 | 2009 | 2008 | 2007 | 2006 | |||||||||||||||
| Income Statement Summary |
||||||||||||||||||||
| Interest income |
$ | 63,831 | $ | 70,146 | $ | 77,938 | $ | 87,816 | $ | 81,004 | ||||||||||
| Interest expense |
$ | 7,649 | $ | 12,177 | $ | 21,329 | $ | 31,435 | $ | 25,131 | ||||||||||
| Net interest income before provision for loan losses |
$ | 56,182 | $ | 57,969 | $ | 56,609 | $ | 56,381 | $ | 55,873 | ||||||||||
| Provision for loan losses |
$ | 16,680 | $ | 21,574 | $ | 19,456 | $ | 3,252 | $ | 3,851 | ||||||||||
| Non-interest income |
$ | 17,861 | $ | 17,279 | $ | 15,987 | $ | 14,635 | $ | 10,986 | ||||||||||
| Non-interest expense |
$ | 50,234 | $ | 44,138 | $ | 35,859 | $ | 35,981 | $ | 33,841 | ||||||||||
| Income before provision for income taxes |
$ | 7,129 | $ | 9,536 | $ | 17,281 | $ | 31,783 | $ | 29,167 | ||||||||||
| Provision for income taxes |
$ | (234 | ) | $ | 608 | $ | 3,868 | $ | 10,761 | $ | 9,977 | |||||||||
| Net Income |
$ | 7,363 | $ | 8,928 | $ | 13,413 | $ | 21,022 | $ | 19,190 | ||||||||||
| Balance Sheet Summary |
||||||||||||||||||||
| Total loans, net |
$ | 783,601 | $ | 859,875 | $ | 929,629 | $ | 909,312 | $ | 872,811 | ||||||||||
| Allowance for loan losses |
$ | (21,138 | ) | $ | (23,715 | ) | $ | (15,094 | ) | $ | (12,276 | ) | $ | (11,579 | ) | |||||
| Securities available for sale |
$ | 331,730 | $ | 278,168 | $ | 243,413 | $ | 184,917 | $ | 190,272 | ||||||||||
| Cash and due from banks |
$ | 42,435 | $ | 66,234 | $ | 46,010 | $ | 44,022 | $ | 52,675 | ||||||||||
| Federal funds sold |
$ | 210 | $ | — | $ | 5,500 | $ | — | $ | 6,290 | ||||||||||
| Foreclosed assets |
$ | 20,691 | $ | 25,654 | $ | 7,127 | $ | 556 | $ | — | ||||||||||
| Premises and equipment, net |
$ | 20,190 | $ | 20,069 | $ | 19,280 | $ | 18,255 | $ | 17,978 | ||||||||||
| Total Interest-Earning Assets |
$ | 1,137,805 | $ | 1,194,700 | $ | 1,200,603 | $ | 1,109,600 | $ | 1,084,174 | ||||||||||
| Total Assets |
$ | 1,286,571 | $ | 1,335,549 | $ | 1,326,292 | $ | 1,233,735 | $ | 1,215,074 | ||||||||||
| Total Interest-Bearing liabilities |
$ | 860,944 | $ | 953,156 | $ | 974,177 | $ | 874,393 | $ | 827,752 | ||||||||||
| Total Deposits |
$ | 1,052,274 | $ | 1,125,432 | $ | 1,061,498 | $ | 850,147 | $ | 868,445 | ||||||||||
| Total Liabilities |
$ | 1,126,974 | $ | 1,201,069 | $ | 1,219,492 | $ | 1,134,271 | $ | 1,124,703 | ||||||||||
| Total Shareholders’ Equity |
$ | 159,597 | $ | 134,480 | $ | 106,800 | $ | 99,464 | $ | 90,371 | ||||||||||
| Per Share Data |
||||||||||||||||||||
| Net Income Per Basic Share |
$ | 0.61 | $ | 0.86 | $ | 1.40 | $ | 2.17 | $ | 1.96 | ||||||||||
| Net Income Per Diluted Share |
$ | 0.60 | $ | 0.86 | $ | 1.37 | $ | 2.09 | $ | 1.87 | ||||||||||
| Book Value |
$ | 11.42 | $ | 11.57 | $ | 11.04 | $ | 10.39 | $ | 9.27 | ||||||||||
| Cash Dividends |
$ | 0.24 | $ | 0.40 | $ | 0.68 | $ | 0.62 | $ | 0.54 | ||||||||||
| Weighted Average Common Shares Outstanding Basic |
12,109,717 | 10,343,502 | 9,607,184 | 9,700,048 | 9,766,729 | |||||||||||||||
| Weighted Average Common Shares Outstanding Diluted |
12,192,345 | 10,415,084 | 9,779,657 | 10,044,915 | 10,273,911 | |||||||||||||||
| Key Operating Ratios: |
||||||||||||||||||||
| Performance Ratios: |
||||||||||||||||||||
| Return on Average Equity (1) |
5.16 | % | 7.56 | % | 12.86 | % | 22.28 | % | 22.75 | % | ||||||||||
| Return on Average Assets (2) |
0.56 | % | 0.68 | % | 1.05 | % | 1.74 | % | 1.70 | % | ||||||||||
| Net Interest Spread (tax-equivalent) (3) |
4.72 | % | 4.74 | % | 4.52 | % | 4.45 | % | 4.77 | % | ||||||||||
| Net Interest Margin (tax-equivalent) |
4.90 | % | 5.00 | % | 4.98 | % | 5.28 | % | 5.60 | % | ||||||||||
| Dividend Payout Ratio (4) |
39.86 | % | 46.34 | % | 48.73 | % | 28.64 | % | 27.53 | % | ||||||||||
| Equity to Assets Ratio (5) |
10.82 | % | 9.03 | % | 8.12 | % | 7.79 | % | 7.46 | % | ||||||||||
| Efficiency Ratio (tax-equivalent) |
66.64 | % | 57.69 | % | 48.73 | % | 49.36 | % | 49.63 | % | ||||||||||
| Net Loans to Total Deposits at Period End |
74.47 | % | 76.40 | % | 87.58 | % | 106.96 | % | 100.50 | % | ||||||||||
| Asset Quality Ratios: |
||||||||||||||||||||
| Non-Performing Loans to Total Loans |
5.70 | % | 5.31 | % | 3.15 | % | 0.98 | % | 0.08 | % | ||||||||||
| Non-Performing Assets to Total Loans and Other Real Estate Owned |
8.07 | % | 7.98 | % | 3.87 | % | 1.04 | % | 0.08 | % | ||||||||||
| Net Charge-offs (recoveries) to Average Loans |
2.26 | % | 1.40 | % | 1.79 | % | 0.28 | % | 0.19 | % | ||||||||||
| Allowance for Loan Losses to Net Loans at Period End |
2.70 | % | 2.76 | % | 1.62 | % | 1.35 | % | 1.33 | % | ||||||||||
| Allowance for Loan Losses to Non-Performing Loans |
46.00 | % | 50.49 | % | 50.67 | % | 135.62 | % | 1680.55 | % | ||||||||||
| Capital Ratios: |
||||||||||||||||||||
| Tier 1 Capital to Adjusted Total Assets |
13.84 | % | 11.91 | % | 9.92 | % | 10.22 | % | 9.92 | % | ||||||||||
| Tier 1 Capital to Total Risk-weighted Assets |
19.06 | % | 15.41 | % | 12.34 | % | 12.11 | % | 11.77 | % | ||||||||||
| Total Capital to Total Risk-weighted Assets |
20.33 | % | 16.67 | % | 13.59 | % | 13.33 | % | 12.98 | % | ||||||||||
| (1) | Net income divided by average shareholders’ equity. |
| (2) | Net income divided by average total assets. |
| (3) | Represents the average rate earned on interest-earning assets less the average rate paid on interest-bearing liabilities. |
| (4) | Dividends declared per share divided by net income per share. |
| (5) | Average equity divided by average total assets. |
28
Table of Contents
ITEM 7. MANAGEMENT’S DISCUSSION AND ANALYSIS OF FINANCIAL CONDITION AND RESULTS OF OPERATIONS
This discussion presents Management’s analysis of the financial condition of the Company as of December 31, 2010 and December 31, 2009, and the results of operations for each of the years in the three-year period ended December 31, 2010. The discussion should be read in conjunction with the Consolidated Financial Statements of the Company and the Notes related thereto presented elsewhere in this Form 10-K Annual Report (see Item 8 below).
Statements contained in this report or incorporated by reference that are not purely historical are forward looking statements within the meaning of Section 21E of the Securities Exchange Act of 1934 as amended, including the Company’s expectations, intentions, beliefs, or strategies regarding the future. All forward-looking statements concerning economic conditions, growth rates, income, expenses, or other values which are included in this document are based on information available to the Company on the date noted, and the Company assumes no obligation to update any such forward-looking statements. It is important to note that the Company’s actual results could materially differ from those in such forward-looking statements. Risk factors that could cause actual results to differ materially from those in forward-looking statements include but are not limited to those outlined previously in Item 1A.
Critical Accounting Policies
The Company’s financial statements are prepared in accordance with accounting principles generally accepted in the United States. The financial information and disclosures contained within those statements are significantly impacted by Management’s estimates and judgments, which are based on historical experience and various other assumptions that are believed to be reasonable under current circumstances. Actual results may differ from those estimates under divergent conditions.
Critical accounting policies are those that involve the most complex and subjective decisions and assessments, and have the greatest potential impact on the Company’s stated results of operations. In Management’s opinion, the Company’s critical accounting policies deal with the following areas: the establishment of the Company’s allowance for loan losses, as explained in detail in the “Provision for Loan Losses” and “Allowance for Loan Losses” sections of this discussion and analysis; the valuation of nonperforming real estate loans and foreclosed assets; deferred loan origination costs, which are estimated based on an annual evaluation of expenses (primarily salaries) associated with successful loan originations and are allocated to individual loans as they are booked, but can actually vary significantly for individual loans depending on the characteristics of such loans (deferred amounts are disclosed below in conjunction with salaries expense, under “Non-interest Revenue and Operating Expense”); income taxes, especially with regard to the ability of the Company to recover deferred tax assets, as discussed in the “Provision for Income Taxes” and “Other Assets” sections of this discussion and analysis; goodwill, which is evaluated annually for impairment based on the fair value of the Company and for which it has been determined that no impairment exists; and equity-based compensation, which is discussed in greater detail in footnote 2 (Significant Accounting Policies) to the financial statements contained herein, under the caption “Stock-Based Compensation.” Critical accounting areas are evaluated on an ongoing basis to ensure that the Company’s financial statements incorporate the most recent expectations with regard to these areas.
Summary of Performance
There are signs of improvement in the national economy, but California’s economy remains under considerable stress and recessionary conditions have depressed the Company’s earnings for the past three years. Furthermore, industry-wide regulatory pressures on certain components of non-interest income exacerbated the negative impact of economic conditions on our financial performance in 2010. Net income was $7.4 million in 2010, a drop of $1.6 million, or 18%, from the $8.9 million in net earnings recognized in 2009. Likewise, net income in 2009 was $4.5 million lower than 2008 net earnings of $13.4 million. Net income per diluted share was $0.60 for 2010, as compared to $0.86 in 2009 and $1.37 in 2008. The Company’s Return on Average Assets was 0.56% and Return on Average Equity was 5.16% in 2010, as compared to 0.68% and 7.56%, respectively for 2009, and 1.05% and 12.86%, respectively in 2008.
29
Table of Contents
The following are major factors impacting the Company’s results of operations in recent years:
| • | Net interest income declined by $1.787 million, or 3%, in 2010 relative to 2009, but reflects an increase of $1.360 million, or 2%, in 2009 relative to 2008. The decline in 2010 is due to an $11 million drop in the average balance of interest-earning assets and a 10 basis point slide in our net interest margin. Our net interest margin was negatively impacted in 2010 by a shift from average loan balances into lower-yielding investment balances, higher average balances for non-interest earning cash and due from banks and other non-earning assets, and a $418,000 increase in net interest reversals on loans placed on non-accrual status. The increase in net interest income in 2009 relative to 2008 was due to the fact that net interest reversals were $1.810 million lower in 2009. |
| • | A relatively large provision for loan losses had a material negative impact on our financial results in 2010, 2009 and 2008. Our loan loss provision was $16.680 million in 2010, relative to $21.574 million in 2009 and $19.456 million in 2008. In 2010, our loan loss provision was primarily utilized to build general reserves for performing loans due to higher historical loss factors, provide specific reserves for loans that migrated into impaired status, and replenish reserves subsequent to loan charge-offs. We experienced net charge offs totaling $19.257 million in 2010, $12.953 million in 2009, and 16.638 million in 2008. Charge-offs were higher in 2010 because reserves that had been established in prior periods for specifically-identified losses on certain impaired loans were determined to be uncollectible and written off. In 2009, a rising level of impaired loans required greater specific reserves. A significant increase in nonperforming assets and a higher level of charge-offs are factors that contributed to the loan loss provision required in 2008. |
| • | Non-interest income increased by $582,000, or 3%, in 2010 relative to 2009, and by $1.292 million, or 8%, in 2009 relative to 2008. A higher level of losses on the sale of OREO and a lower level of deposit service charges had an unfavorable impact on the comparative level of non-interest income in 2010, but these negatives were more than offset by a $1.544 million increase in gains on the sale of investment securities, a higher level of check card interchange fees, and a lower level of pass-through losses on our low-income housing tax credit investments. For 2009, the primary drivers behind the higher level of non-interest income relative to 2008 were an increase in income associated with deferred compensation BOLI and investment gains, which were partially offset by lower income in other areas stemming from non-recurring income in 2008. |
| • | Operating expense increased by $6.096 million, or 14%, in 2010 relative to 2009, and by $8.279 million, or 23%, in 2009 compared to 2008. The increase in 2010 is primarily the result of the following: Loan costs increased by $4.146 million, due to a higher level of OREO write-downs and OREO operating expense; and salaries were up by $1.906 million, largely because of higher incentive compensation accruals. These and other expense increases were partially offset by a $941,000 drop in FDIC costs in 2010, resulting from an industry-wide special assessment in the second quarter of 2009 and a declining assessment base in 2010. The principal causes of the increase in 2009 relative to 2008 include higher FDIC assessments, higher compensation costs due to a drop in deferred salaries related to successful loan originations and higher accruals associated with deferred compensation plans, and an increase in OREO write-downs and other lending-related costs. Several non-recurring items also affected operating expense, as explained in detail below under “Non-interest Revenue and Operating Expense.” |
| • | A negative income tax provision helped boost net income in 2010. The negative provision is the result of a high level of tax credits relative to our tax liability, which is favorably impacted by tax-exempt interest income and BOLI income. |
The Company’s assets totaled $1.287 billion at December 31, 2010, relative to total assets of $1.336 billion at December 31, 2009. Total liabilities were $1.127 billion at the end of 2010 compared to $1.201 billion at the end of 2009, and we had shareholders’ equity totaling $160 million at December 31, 2010 relative to $134 million at December 31, 2009. The following summarizes recent key balance sheet changes during 2010:
30
Table of Contents
| • | Total assets declined by $49 million, or 4%. Investment securities, fed funds sold, cash, and balances due from banks were up by a combined $30 million, or 9%, but that growth was more than offset by a drop of $76 million, or 9%, in net loan balances, and foreclosed assets were also reduced by a net $5 million, or 19%, in 2010. Loan balances declined due to runoff in the normal course of business, transfers to OREO, and charge-offs, as well as loan payoffs and sales. Due to our current focus on credit issues and core deposit generation, and because of weak loan demand from creditworthy borrowers, we expect limited, if any, net growth in outstanding loan balances in 2011 and no assurance can be provided that loans will not continue to decline. |
| • | Our allowance for loan and lease losses was $21.1 million as of December 31, 2010, which represents a drop of $2.6 million relative to the balance at December 31, 2009. The net decline in the allowance is the result of charging off certain impaired, collateral-dependent loan balances that were determined to be uncollectible, against previously-established specific reserves. Even though the allowance for loan and lease losses declined during 2010, loan balances also fell, so our allowance as a percentage of total loans dropped by only 6 basis points, to 2.62% at December 31, 2010 from 2.68% at December 31, 2009. |
| • | Nonperforming assets declined by $6 million, or 8%, during 2010, ending the year at $67 million. The net decrease for the year is due to a $5 million reduction in foreclosed assets, and a $1 million reduction in non-accruing loans. Despite the decline in nonperforming balances, nonperforming assets increased slightly as a percentage of total loans plus OREO due to the declining balance of outstanding loans. |
| • | Total deposits declined by $73 million, or 7%, during 2010, although core non-maturity balances were up a combined $55 million, or 9%. Total deposits declined primarily because we have managed down balances from larger depositors to reduce our exposure to potential single-customer withdrawals, and have not aggressively pursued the renewal of certain other time deposits managed by our Treasury Department. We also let $28 million in wholesale-sourced brokered deposits roll off in 2010. Non-maturity deposits experienced significant growth due in part to our aggressive deposit acquisition programs. |
| • | Total shareholders’ equity increased by $25 million, or 19%, during the year, due in large part to our registered direct offering that closed in October and added a net $22 million to capital. Because capital increased by 19% while risk-adjusted assets declined, our capital ratios continued their upward trend during 2010. As of December 31, 2010, our consolidated total risk-based capital ratio was 20.33%, our Tier 1 risk-based capital ratio was 19.06%, and our Tier 1 leverage ratio was 13.84%. |
Results of Operations
The Company earns income from two primary sources. The first is net interest income, which is interest income generated by earning assets less interest expense on interest-bearing liabilities. The second is non-interest income, which primarily consists of customer service charges and fees but also comes from non-customer sources such as bank-owned life insurance. The majority of the Company’s non-interest expenses are operating costs that relate to providing a full range of banking services to our customers.
Net Interest Income and Net Interest Margin
Net interest income was $56.2 million in 2010, compared to $58.0 million in 2009 and $56.6 million in 2008. This represents a decline of 3% in 2010, and an increase of 2% for 2009. The level of net interest income depends on several factors in combination, including growth in earning assets, yields on earning assets, the cost of interest-bearing liabilities, the relative volumes of earning assets and interest-bearing liabilities, and the mix of products which comprise the Company’s earning assets, deposits, and other interest-bearing liabilities. Net interest income can also be impacted by the reversal of interest for loans placed on non-accrual, and by the recovery of interest on loans that have been on non-accrual and are either sold or returned to accrual status.
The following Distribution, Rate and Yield table shows, for each of the past three years, the average balance for each principal balance sheet category, and the amount of interest income or interest expense associated with that category.
31
Table of Contents
This table also shows the calculated yields on each major component of the Company’s investment and loan portfolio, the average rates paid on each key segment of the Company’s interest-bearing liabilities, and our net interest margin.
32
Table of Contents
Distribution, Rate & Yield
| Year Ended December 31, | ||||||||||||||||||||||||||||||||||||
| 2010(a) | 2009(a) | 2008(a) | ||||||||||||||||||||||||||||||||||
| (dollars in thousands) | Average Balance |
Income/ Expense |
Average Rate (b) |
Average Balance |
Income/ Expense |
Average Rate (b) |
Average Balance |
Income/ Expense |
Average Rate (b) |
|||||||||||||||||||||||||||
| ASSETS |
||||||||||||||||||||||||||||||||||||
| Investments: |
||||||||||||||||||||||||||||||||||||
| Federal Funds Sold/Due from Time |
$ | 14,066 | $ | 40 | 0.28 | % | $ | 10,620 | $ | 86 | 0.81 | % | $ | 2,835 | $ | 68 | 2.40 | % | ||||||||||||||||||
| Taxable |
241,399 | 8,025 | 3.32 | % | 188,810 | 8,300 | 4.40 | % | 171,017 | 7,942 | 4.64 | % | ||||||||||||||||||||||||
| Non-taxable |
68,858 | 2,709 | 6.05 | % | 61,274 | 2,476 | 6.22 | % | 58,171 | 2,368 | 6.26 | % | ||||||||||||||||||||||||
| Total Investments |
324,323 | 10,774 | 3.77 | % | 260,704 | 10,862 | 4.68 | % | 232,023 | 10,378 | 5.02 | % | ||||||||||||||||||||||||
| Loans and Leases:(c) |
||||||||||||||||||||||||||||||||||||
| Agricultural |
10,137 | 517 | 5.10 | % | 12,409 | 631 | 5.09 | % | 11,361 | 734 | 6.46 | % | ||||||||||||||||||||||||
| Commercial |
115,188 | 6,882 | 5.97 | % | 141,190 | 8,217 | 5.82 | % | 139,228 | 10,083 | 7.24 | % | ||||||||||||||||||||||||
| Real Estate |
612,001 | 40,669 | 6.65 | % | 647,099 | 44,294 | 6.85 | % | 688,364 | 49,843 | 7.24 | % | ||||||||||||||||||||||||
| Consumer |
50,522 | 4,377 | 8.66 | % | 61,726 | 5,265 | 8.53 | % | 61,147 | 5,682 | 9.29 | % | ||||||||||||||||||||||||
| Direct Financing Leases |
10,835 | 612 | 5.65 | % | 14,835 | 877 | 5.91 | % | 19,029 | 1,218 | 6.40 | % | ||||||||||||||||||||||||
| Other |
52,609 | — | 0.00 | % | 49,067 | — | 0.00 | % | 12,253 | — | 0.00 | % | ||||||||||||||||||||||||
| Total Loans and Leases |
851,292 | 53,057 | 6.23 | % | 926,326 | 59,284 | 6.40 | % | 931,382 | 67,560 | 7.25 | % | ||||||||||||||||||||||||
| Total Interest-Earning Assets(e) |
1,175,615 | $ | 63,831 | 5.55 | % | 1,187,030 | $ | 70,146 | 6.02 | % | 1,163,405 | $ | 77,938 | 6.81 | % | |||||||||||||||||||||
| Other Earning Assets |
8,984 | 9,361 | 9,838 | |||||||||||||||||||||||||||||||||
| Non-Earning Assets |
134,552 | 111,560 | 110,119 | |||||||||||||||||||||||||||||||||
| Total Assets |
$ | 1,319,151 | $ | 1,307,951 | $ | 1,283,362 | ||||||||||||||||||||||||||||||
| LIABILITIES AND |
|
|||||||||||||||||||||||||||||||||||
| Interest-Bearing Deposits: |
||||||||||||||||||||||||||||||||||||
| NOW |
$ | 178,345 | $ | 1,682 | 0.94 | % | $ | 116,112 | $ | 568 | 0.49 | % | $ | 95,461 | $ | 410 | 0.43 | % | ||||||||||||||||||
| Savings |
70,367 | 174 | 0.25 | % | 61,377 | 167 | 0.27 | % | 54,661 | 200 | 0.37 | % | ||||||||||||||||||||||||
| Money Market |
162,619 | 914 | 0.56 | % | 156,110 | 1,886 | 1.21 | % | 136,777 | 2,556 | 1.87 | % | ||||||||||||||||||||||||
| CDAR’s |
70,661 | 621 | 0.88 | % | 137,025 | 2,204 | 1.61 | % | 52,045 | 1,508 | 2.90 | % | ||||||||||||||||||||||||
| Certificates of Deposit < $100,000 |
162,418 | 1,283 | 0.79 | % | 121,644 | 1,844 | 1.52 | % | 123,318 | 3,663 | 2.97 | % | ||||||||||||||||||||||||
| Certificates of Deposit > $100,000 |
194,220 | 1,237 | 0.64 | % | 203,091 | 2,136 | 1.05 | % | 181,316 | 4,672 | 2.58 | % | ||||||||||||||||||||||||
| Brokered Deposits |
10,885 | 210 | 1.93 | % | 61,886 | 1,235 | 2.00 | % | 70,238 | 2,442 | 3.48 | % | ||||||||||||||||||||||||
| Total Interest-Bearing Deposits |
849,515 | 6,121 | 0.72 | % | 857,245 | 10,040 | 1.17 | % | 713,816 | 15,451 | 2.16 | % | ||||||||||||||||||||||||
| Borrowed Funds: |
||||||||||||||||||||||||||||||||||||
| Federal Funds Purchased |
3 | — | 0.32 | % | 295 | 1 | 0.34 | % | 16,657 | 342 | 2.05 | % | ||||||||||||||||||||||||
| Repurchase Agreements |
— | — | 0.00 | % | 14,909 | 35 | 0.23 | % | 25,935 | 94 | 0.36 | % | ||||||||||||||||||||||||
| Short Term Borrowings |
16,044 | 190 | 1.18 | % | 20,140 | 389 | 1.93 | % | 117,195 | 2,921 | 2.49 | % | ||||||||||||||||||||||||
| Long Term Borrowings |
16,041 | 604 | 3.77 | % | 22,000 | 798 | 3.63 | % | 25,506 | 877 | 3.44 | % | ||||||||||||||||||||||||
| TRUPS |
30,928 | 734 | 2.37 | % | 30,928 | 914 | 2.96 | % | 30,928 | 1,644 | 5.32 | % | ||||||||||||||||||||||||
| Total Borrowed Funds |
63,016 | 1,528 | 2.42 | % | 88,272 | 2,137 | 2.42 | % | 216,221 | 5,878 | 2.72 | % | ||||||||||||||||||||||||
| Total Interest Bearing Liabilities |
912,531 | $ | 7,649 | 0.84 | % | 945,517 | $ | 12,177 | 1.29 | % | 930,037 | $ | 21,329 | 2.29 | % | |||||||||||||||||||||
| Demand Deposits |
246,949 | 229,974 | 231,075 | |||||||||||||||||||||||||||||||||
| Other Liabilities |
16,917 | 14,301 | 17,981 | |||||||||||||||||||||||||||||||||
| Shareholders’ Equity |
142,754 | 118,159 | 104,269 | |||||||||||||||||||||||||||||||||
| Total Liab. and Shareholders’ Equity |
$ | 1,319,151 | $ | 1,307,951 | $ | 1,283,362 | ||||||||||||||||||||||||||||||
| Interest Income/Earning Assets |
5.55 | % | 6.02 | % | 6.81 | % | ||||||||||||||||||||||||||||||
| Interest Expense/Earning Assets |
0.65 | % | 1.03 | % | 1.83 | % | ||||||||||||||||||||||||||||||
| Net Interest Margin(d) |
$ | 56,182 | 4.90 | % | $ | 57,969 | 5.00 | % | $ | 56,609 | 4.98 | % | ||||||||||||||||||||||||
| (a) | Average balances are obtained from the best available daily or monthly data and are net of deferred fees and related direct costs. |
| (b) | Yields and net interest margin have been computed on a tax equivalent basis. |
| (c) | Net loan fees have been included in the calculation of interest income. Net loan Fees were $(491,045), $(109,217), and $851,355 for the years ended December 31, 2010, 2009, and 2008 respectively. Loans are gross of the allowance for possible loan losses. |
| (d) | Represents net interest income as a percentage of average interest-earning assets (tax-equivalent). |
| (e) | Non-accrual loans have been included in total loans for purposes of total interest earning assets. |
33
Table of Contents
The Volume and Rate Variances table below sets forth the dollar difference in interest earned or paid for each major category of interest-earning assets and interest-bearing liabilities for the noted periods, and the amount of such change attributable to changes in average balances (volume) or changes in average interest rates. Volume variances are equal to the increase or decrease in average balance multiplied by prior period rates, and rate variances are equal to the increase or decrease in rate times prior period average balances. Variances attributable to both rate and volume changes are calculated by multiplying the change in rate by the change in average balance, and have been allocated to the rate variance.
Volume & Rate Variances
| Years Ended December 31, | ||||||||||||||||||||||||
| 2010 over 2009 | 2009 over 2008 | |||||||||||||||||||||||
| Increase(decrease) due to | Increase(decrease) due to | |||||||||||||||||||||||
| (dollars in thousands) | Volume | Rate | Net | Volume | Rate | Net | ||||||||||||||||||
| Assets: |
||||||||||||||||||||||||
| Investments: |
||||||||||||||||||||||||
| Federal funds sold / Due from time |
$ | 28 | (74 | ) | $ | (46 | ) | $ | 187 | (169 | ) | $ | 18 | |||||||||||
| Taxable |
2,312 | (2,587 | ) | (275 | ) | 826 | (468 | ) | 358 | |||||||||||||||
| Non-taxable (1) |
306 | (73 | ) | 233 | 126 | (18 | ) | 108 | ||||||||||||||||
| Total Investments |
2,646 | (2,734 | ) | (88 | ) | 1,139 | (655 | ) | 484 | |||||||||||||||
| Loans: |
||||||||||||||||||||||||
| Agricultural |
(116 | ) | 2 | (114 | ) | 68 | (171 | ) | (103 | ) | ||||||||||||||
| Commercial |
(1,513 | ) | 178 | (1,335 | ) | 142 | (2,008 | ) | (1,866 | ) | ||||||||||||||
| Real Estate |
(2,402 | ) | (1,223 | ) | (3,625 | ) | (2,988 | ) | (2,561 | ) | (5,549 | ) | ||||||||||||
| Consumer |
(956 | ) | 68 | (888 | ) | 54 | (471 | ) | (417 | ) | ||||||||||||||
| Direct Financing Leases |
(236 | ) | (29 | ) | (265 | ) | (268 | ) | (73 | ) | (341 | ) | ||||||||||||
| Total Loans and Leases |
(5,223 | ) | (1,004 | ) | (6,227 | ) | (2,992 | ) | (5,284 | ) | (8,276 | ) | ||||||||||||
| Total Interest Earning Assets |
$ | (2,577 | ) | $ | (3,738 | ) | $ | (6,315 | ) | $ | (1,853 | ) | $ | (5,939 | ) | $ | (7,792 | ) | ||||||
| Liabilities |
||||||||||||||||||||||||
| Interest Bearing Deposits: |
||||||||||||||||||||||||
| NOW |
$ | 304 | 810 | $ | 1,114 | $ | 89 | 69 | $ | 158 | ||||||||||||||
| Savings Accounts |
24 | (17 | ) | 7 | 25 | (58 | ) | (33 | ) | |||||||||||||||
| Money Market |
79 | (1,051 | ) | (972 | ) | 361 | (1,031 | ) | (670 | ) | ||||||||||||||
| CDAR’S |
(1,067 | ) | (516 | ) | (1,583 | ) | 2,462 | (1,766 | ) | 696 | ||||||||||||||
| Certificates of Deposit < $100,000 |
618 | (1,179 | ) | (561 | ) | (50 | ) | (1,769 | ) | (1,819 | ) | |||||||||||||
| Certificates of Deposit > $100,000 |
(93 | ) | (806 | ) | (899 | ) | 561 | (3,097 | ) | (2,536 | ) | |||||||||||||
| Brokered Deposits |
(1,018 | ) | (7 | ) | (1,025 | ) | (290 | ) | (917 | ) | (1,207 | ) | ||||||||||||
| Total Interest Bearing Deposits |
(1,153 | ) | (2,766 | ) | (3,919 | ) | 3,158 | (8,569 | ) | (5,411 | ) | |||||||||||||
| Borrowed Funds: |
||||||||||||||||||||||||
| Federal Funds Purchased |
(1 | ) | — | (1 | ) | (336 | ) | (5 | ) | (341 | ) | |||||||||||||
| Repurchase Agreements |
(35 | ) | — | (35 | ) | (40 | ) | (19 | ) | (59 | ) | |||||||||||||
| Short Term Borrowings |
(79 | ) | (120 | ) | (199 | ) | (2,419 | ) | (113 | ) | (2,532 | ) | ||||||||||||
| Long Term Borrowings |
(216 | ) | 22 | (194 | ) | (121 | ) | 42 | (79 | ) | ||||||||||||||
| TRUPS |
— | (180 | ) | (180 | ) | — | (730 | ) | (730 | ) | ||||||||||||||
| Total Borrowed Funds |
(331 | ) | (278 | ) | (609 | ) | (2,916 | ) | (825 | ) | (3,741 | ) | ||||||||||||
| Total Interest Bearing Liabilities |
$ | (1,484 | ) | $ | (3,044 | ) | $ | (4,528 | ) | $ | 242 | $ | (9,394 | ) | $ | (9,152 | ) | |||||||
| Net Interest Income |
$ | (1,093 | ) | $ | (694 | ) | $ | (1,787 | ) | $ | (2,095 | ) | $ | 3,455 | $ | 1,360 | ||||||||
| (1) | Yields on tax exempt income have not been computed on a tax equivalent basis. |
For 2010 relative to 2009, the negative variance in the Company’s net interest income attributable purely to volume changes was $1.093 million, and there was also an unfavorable rate variance of $694,000. The negative volume variance was due in part to the fact that average interest-earning assets declined by $11 million, or 1%, for the comparative periods. Furthermore, the average balances of lower-yielding investments, OREO, and nonperforming loans increased while average performing loan balances declined, although that unfavorable shift was partially offset by relatively strong growth in the average balance of low-cost non-maturity deposits and equity.
While there was not a significant change in market interest rates during 2010, the weighted average yield on earning assets fell and average funding rates also declined, albeit to a lesser degree, and we experienced a negative rate variance. Our weighted average yield on interest-earning assets was 47 basis points lower in 2010 than in 2009,
34
Table of Contents
relative to a 45 basis point drop in our weighted average cost of interest-bearing liabilities. The lower yield on earning assets in 2010 is due primarily to the addition of investment securities in a relatively low-rate environment. The average cost of interest-bearing liabilities was lower due mainly to a shift away from higher-cost borrowed funds and an improving deposit mix, although we did see an increase in the cost of NOW deposits resulting from growth in our relatively high-rate Reward Checking product. Because the average balance of interest-earning assets was $242 million greater than the average balance of interest-bearing liabilities in 2009, the base period for the rate variance calculation, the yield decrease for interest-earning assets was applied to a much higher balance than the rate decrease for interest-bearing liabilities and thus had a greater impact on net interest income. Net interest reversals of $566,000 in 2010 and $148,000 in 2009 also impacted loan yields and the relative level of net interest income for the comparative years.
The Company’s net interest margin, which is tax-equivalent net interest income as a percentage of average interest-earning assets, is affected by the same factors discussed above relative to rate and volume variances. Our net interest margin was 4.90% in 2010, a decline of 10 basis points relative to 2009. The principal negative pressures on our net interest margin in 2010 came from the $418,000 increase in net interest reversals and the unfavorable shift in average asset balances. Having a positive impact for the year over year comparison were increases of $25 million in average equity and $17 million in average non-interest bearing demand deposit balances, which reduced our reliance on interest-bearing liabilities. Despite the recent steepening of the yield curve and reductions in nonperforming assets, which would typically be expected to have a favorable impact on our net interest margin, we expect that our margin could continue to experience slight contraction due to heightened competitive pressures on loan yields and the possibility that loan balances could continue to decline.
Changes in average balances in 2009 relative to 2008 created a negative $2.095 million volume variance in net interest income for the comparative periods. While average interest-earning assets grew $24 million, all of the growth was in investments which have a lower weighted average yield than loans and leases. Average loan balances fell by $5 million, and there was a major shift within that category to nonperforming loans as a large number of real estate loans were placed on non-accrual status in 2009. The average balance of foreclosed assets was also $11 million higher in 2009 than in 2008. Having a favorable impact on the volume variance in 2009, although not enough to offset the negatives noted above, was the runoff of borrowed funds and relatively strong growth in core deposits.
The favorable rate variance of $3.455 million in 2009 over 2008 was partly the result of a sharp decline in net interest reversals. The Company had net interest reversals of only $148,000 in 2009, relative to $1.958 million in 2008. Another $640,000 of the favorable rate variance in 2009 came from the allocation of the variance attributable to both rate and volume changes. The remainder is due simply to the fact that in a declining interest rate environment, our cost of interest-bearing liabilities fell by 100 basis points for the comparative periods while our yield on earning assets dropped only 95 basis points, excluding the impact of interest reversals. The relatively larger drop in the average rate paid on interest-bearing liabilities in 2009 was due in part to an easing of competitive pressures on deposits.
In 2009 our tax-equivalent net interest margin was 5.00%, relative to 4.98% in 2008. On the surface it would appear that our net interest margin was quite stable for the comparative periods, but if interest reversals are backed out it shows a 13 basis point decline. This is due to the fact that the unfavorable pressure created by an increase in average nonperforming loans wasn’t quite offset by the favorable effect of declining interest rates and the positive impact of a higher level of customer deposits.
Provision for Loan and Lease Losses
Credit risk is inherent in the business of making loans. The Company sets aside an allowance for loan and lease losses through periodic charges to earnings, which are reflected in the income statement as the provision for loan and lease losses. These charges are in amounts sufficient to achieve an allowance for loan and lease losses that, in management’s judgment, is adequate to absorb probable loan losses related to specifically-identified impaired loans, as well as probable incurred loan losses in the remaining loan portfolio. Specifically identifiable and quantifiable losses are immediately charged off against the allowance. This process can create a high degree of variability in the Company’s earnings. The Company’s policies for monitoring the adequacy of the allowance and determining loan
35
Table of Contents
amounts that should be charged off, and other detailed information with regard to changes in the allowance, are discussed below under “Allowance for Loan and Lease Losses.”
The Company’s provision for loan and lease losses was $16.680 million in 2010, $21.574 million in 2009, and $19.456 million in 2008. The severity of recent economic challenges has contributed to a much higher provision for the past three years than recorded in prior periods of strong economic growth, since the recession has had a material impact on many of our borrowers and led to credit deterioration in our loan portfolio. The loan loss provision is impacted by the level of loan charge-offs, since charge-offs affect historical loss factors used in determining general reserves and could necessitate reserve replenishment. Net loans charged off totaled $19.257 million in 2010, relative to $12.953 million in 2009 and $16.638 million in 2008. Charge-offs were relatively high in 2010 because reserves that had been established in previous periods for specifically-identified losses on certain impaired loans were determined to be uncollectible and written off. Charge-offs were also high in 2008, because they include write-downs on certain collateral-dependent nonperforming real estate loans with quantifiable losses that were identified as uncollectible.
The Company’s loan loss provision was reduced by $4.894 million, or 23%, in 2010 relative to 2009 despite a higher level of charge-offs, since the many of the charge-offs were against reserves that were already reflected in the allowance at the beginning of the year, as noted above. Our loan loss provision in 2010 was primarily utilized to build general reserves for performing loans due to higher historical loss factors, provide specific reserves for loans that migrated into impaired status, and replenish reserves subsequent to loan charge-offs. In 2009 the level of loan balances charged off was lower than in 2008, but the provision for loan and lease losses was $2.118 million higher due to a substantial increase in nonperforming loans and the higher loss allowance required for those loans pursuant to a detailed analysis conducted to determine probable losses.
Non-interest Revenue and Operating Expense
The following table sets forth the major components of the Company’s non-interest revenue and other operating expense, along with relevant ratios, for the years indicated:
36
Table of Contents
Non-Interest Revenue/Expense
| (dollars in thousands) | 2010 | % of Total |
2009 | % of Total |
2008 | % of Total |
||||||||||||||||||
| NON-INTEREST REVENUE |
||||||||||||||||||||||||
| Service charges on deposit accounts |
$ | 11,212 | 62.77 | % | $ | 11,552 | 66.86 | % | $ | 11,203 | 70.08 | % | ||||||||||||
| Credit card fees |
391 | 2.19 | % | 417 | 2.41 | % | 494 | 3.09 | % | |||||||||||||||
| Checkcard fees |
2,261 | 12.66 | % | 1,782 | 10.31 | % | 1,557 | 9.74 | % | |||||||||||||||
| Other service charges & fees |
2,260 | 12.65 | % | 2,198 | 12.72 | % | 3,066 | 19.18 | % | |||||||||||||||
| BOLI Income |
1,382 | 7.74 | % | 1,561 | 9.03 | % | 408 | 2.55 | % | |||||||||||||||
| Gains on sales of loans |
105 | 0.59 | % | 81 | 0.47 | % | 9 | 0.07 | % | |||||||||||||||
| Gains on sale of investment securities |
2,643 | 14.80 | % | 1,099 | 6.36 | % | 58 | 0.36 | % | |||||||||||||||
| (Loss) on tax credit investment |
(808 | ) | -4.52 | % | (1,443 | ) | -8.35 | % | (1,242 | ) | -7.77 | % | ||||||||||||
| Other |
(1,585 | ) | -8.87 | % | 32 | 0.19 | % | 434 | 2.71 | % | ||||||||||||||
| Total non-interest revenue |
$ | 17,861 | 100.00 | % | $ | 17,279 | 100.00 | % | $ | 15,987 | 100.00 | % | ||||||||||||
| As a % of average interest-earning assets |
1.52 | % | 1.46 | % | 1.37 | % | ||||||||||||||||||
| OTHER OPERATING EXPENSES |
||||||||||||||||||||||||
| Salaries and employee benefits |
$ | 20,869 | 41.54 | % | $ | 18,963 | 42.96 | % | $ | 16,666 | 46.48 | % | ||||||||||||
| Occupancy costs |
||||||||||||||||||||||||
| Furniture & Equipment |
2,406 | 4.79 | % | 2,639 | 5.98 | % | 2,700 | 7.53 | % | |||||||||||||||
| Premises |
4,634 | 9.22 | % | 4,311 | 9.77 | % | 3,807 | 10.62 | % | |||||||||||||||
| Advertising and Marketing Costs |
1,979 | 3.94 | % | 1,872 | 4.24 | % | 2,289 | 6.38 | % | |||||||||||||||
| Data Processing Costs |
1,737 | 3.46 | % | 1,406 | 3.19 | % | 1,311 | 3.65 | % | |||||||||||||||
| Deposit Services Costs |
2,708 | 5.39 | % | 2,188 | 4.96 | % | 1,759 | 4.90 | % | |||||||||||||||
| Loan Services Costs |
||||||||||||||||||||||||
| Loan Processing |
765 | 1.52 | % | 960 | 2.17 | % | 671 | 1.87 | % | |||||||||||||||
| ORE Owned |
6,168 | 12.28 | % | 1,827 | 4.14 | % | 579 | 1.61 | % | |||||||||||||||
| Credit Card |
— | 0.00 | % | — | 0.00 | % | 2 | 0.01 | % | |||||||||||||||
| Other Operating Costs |
||||||||||||||||||||||||
| Telephone & data communications |
1,156 | 2.30 | % | 1,107 | 2.51 | % | 968 | 2.70 | % | |||||||||||||||
| Postage & mail |
558 | 1.11 | % | 501 | 1.13 | % | 469 | 1.31 | % | |||||||||||||||
| Other |
1,059 | 2.11 | % | 1,040 | 2.36 | % | 1,109 | 3.09 | % | |||||||||||||||
| Professional Services Costs |
||||||||||||||||||||||||
| Legal & Accounting |
1,276 | 2.54 | % | 1,537 | 3.48 | % | 1,390 | 3.88 | % | |||||||||||||||
| Other professional service |
3,742 | 7.45 | % | 4,585 | 10.39 | % | 921 | 2.57 | % | |||||||||||||||
| Stationery & Supply Costs |
715 | 1.42 | % | 675 | 1.53 | % | 753 | 2.10 | % | |||||||||||||||
| Sundry & Tellers |
462 | 0.91 | % | 527 | 1.19 | % | 465 | 1.29 | % | |||||||||||||||
| Total other operating expense |
$ | 50,234 | 100.00 | % | $ | 44,138 | 100.00 | % | $ | 35,859 | 100.00 | % | ||||||||||||
| As a % of average interest-earning assets |
4.27 | % | 3.72 | % | 3.08 | % | ||||||||||||||||||
| Net non-interest income as a % of avg. interest-earning assets |
-2.75 | % | -2.26 | % | -1.71 | % | ||||||||||||||||||
| Efficiency Ratio (tax-equivalent) |
66.64 | % | 57.69 | % | 48.73 | % | ||||||||||||||||||
The overhead efficiency ratio in the table above represents total operating expense divided by the sum of fully tax-equivalent net interest and non-interest income, with the provision for loan losses, investment gains and losses, and other extraordinary gains and losses excluded from the equation. Since total other operating expense increased by 14% in 2010 relative to an increase of only 3% in non-interest revenue and a drop of 3% in net interest income, our efficiency ratio rose to 66.64% in 2010, from 57.69% in 2009. The jump in 2009 relative to 2008 is also due to a disproportionate increase in non-interest expense in 2009.
The Company’s results reflect an increase of $582,000, or 3%, in total non-interest income for 2010 relative to 2009, which follows on the heels of a $1.292 million increase in 2009 relative to 2008. While the primary reasons for these increases are discussed in greater detail below, several items of a non-recurring nature have impacted net interest income over the past few years. For 2010, those items include $2.643 million in gains on investment securities, net losses on the disposition of foreclosed assets totaling $1.536 million, and $238,000 in losses incurred upon the disposition of equipment that was acquired subsequent to the termination of operating leases. In 2009, non-recurring items include $1.099 million in gains on securities, $204,000 in losses on OREO sales, and a $66,000 recovery on a
37
Table of Contents
previously charged-off investment in a title insurance holding company, while in 2008 there were numerous non-recurring items netting out to $939,000 in additional non-interest income. Total non-interest revenue increased to 1.52% of average earning assets in 2010, from 1.46% in 2009 and 1.37% in 2008.
The principal component of non-interest income, service charges on deposit accounts, declined by $340,000, or 3%, in 2010 relative to 2009, despite a $51 million increase in transaction account balances and an increase of 8% in the number of transaction accounts during 2010. The drop in service charges is due in large part to the impact of new consumer legislation requiring customer opt-in for point-of-sale overdrafts, which became fully effective in mid-August 2010. Furthermore, in the fourth quarter of 2010, the Bank’s primary regulator issued guidance that limits our flexibility with regard to allowing and charging for consumer overdrafts. Operational changes made by the Bank pursuant to this guidance led to further declines in service charge income toward the end of 2010, and will continue to have an unfavorable effect on income going forward, although the full extent of that impact has not yet been determined. Deposit service charges increased by $349,000, or 3%, in 2009 over 2008, due to the fact that the number of transaction accounts (demand and interest-bearing NOW accounts) increased by over 5,000, or 11%, in 2009. Despite a fee increase that became effective mid-2008, the increase in total service charges is proportionately smaller than the increase in the number of accounts since each account, on average, generated a lower volume of returned item and overdraft charges in 2009. It is our assumption that consumers and businesses have learned to manage cash more carefully in this difficult economy. The Company’s ratio of service charge income to average transaction account balances was 2.6% in 2010, down from 3.3% in 2009 and 3.4% in 2008.
The next line item under non-interest revenue is credit card fees, which consist primarily of credit card interchange fees. Despite the sale of all credit card balances in 2007, we still receive a portion of the interchange and interest from credit cards issued in our name, and credit card fees totaled $391,000 in 2010, $417,000 in 2009, and $494,000 in 2008. Credit card fees fell by $26,000, or 6%, in 2010 relative to 2009, and also declined by $77,000, or 16%, in 2009 relative to 2008, due to declining consumer credit card usage in a difficult economic environment. These fees were only 2% of total non-interest income in 2010 and 2009, down from 3% in 2008.
Check card fees, which represent interchange fees from electronic funds transactions (EFT), increased by $479,000, or 27%, in 2010 relative to 2009, and by $225,000, or 14%, in 2009 over 2008. The increase is from fees earned on incremental cards issued in association with new retail deposit accounts, as well as increased usage per card. Check card fees have been increasing as a percentage of total non-interest revenue, and the rising popularity of point-of-sale transactions leads us to believe that this access channel will continue to grow in importance. The number of active check cards now in use by personal and business account holders is close to 45,000, up from approximately 40,000 at the end of 2009.
Other service charges and fees also constitute a large portion of non-interest income, with the principal components consisting of operating lease income, dividends received on restricted stock (primarily our equity investment in FHLB stock), currency order fees, and ATM fees from transactions not associated with deposit customers (also referred to as foreign ATM fees). This category is also where rental income on OREO properties is reflected. Other service charges, commissions, and fees totaled $2.260 million in 2010, $2.198 million in 2009, and $3.066 million in 2008. They increased by $62,000, or 3%, in 2010 relative to 2009, due to increases in OREO rental income and merchant fees. In contrast, they declined by $868,000, or 28%, in 2009 relative to 2008, in large part because of a $523,000 drop in dividends on restricted stock. The FHLB of San Francisco suspended dividend payments at the beginning of 2009 to preserve capital, but has currently reinstated dividends at a nominal level. Non-recurring income in 2008, including a $289,000 gain on VISA stock and a $75,000 contingent payment related to merchant services (both included in the total non-recurring number for 2008 noted above), also contributed to the decline in other service charges in 2009.
Bank-owned life insurance (BOLI) income was $1.382 million, relative to $1.561 million in 2009 and $408,000 in 2008. It fell by $179,000, or 11%, in 2010 relative to 2009, but increased by $1.153 million, or 283%, in 2009 relative to 2008. To understand the reason for these variances, one needs to distinguish between the two basic types of BOLI owned by the Company: “general account,” and “separate account.” At December 31, 2010, the Company had $28.9 million invested in single-premium general account BOLI. Income from our general account BOLI is used to fund expenses associated with executive salary continuation plans and director retirement plans, and is typically
38
Table of Contents
fairly consistent with interest credit rates that do not change frequently. The exchange of select general account policies in the third quarter of 2009 generated a one-time gain of approximately $72,000, however, which contributed to the overall decline in BOLI income in 2010 relative to 2009. In addition to general account BOLI, the Company had $2.7 million invested in separate account BOLI at December 31, 2010, the earnings on which help offset deferred compensation accruals for certain directors and senior officers. These deferred compensation accounts have returns pegged to participant-directed investment allocations which can include equity, bond, or real estate indices, and are thus subject to gains or losses. These plans are designed to be revenue-neutral to the Company: Participant gains are accounted for as expense accruals which, combined with their associated tax effect, generally counterbalance income on separate account BOLI, while participant losses result in expense accrual reversals that typically offset losses on separate account BOLI. The decline in aggregate BOLI income in 2010 includes a drop of $111,000 in separate account BOLI income. Total BOLI income increased in 2009 mainly because of gains on separate account BOLI in 2009 relative to a loss for 2008, resulting in a swing in separate account BOLI income of $1.078 million for the comparative periods. With the exception of a one-time gain of about $350,000 on separate account BOLI policy exchanges in the third quarter of 2008, which offset what otherwise would have been a loss for that period, these gains and losses are related to participant gains and losses on deferred compensation balances.
Gains on loan sales totaled $105,000 in 2010, $81,000 in 2009, and only $9,000 in 2008. Our affiliation with PHH Mortgage, the primary outlet for our mortgage loan sales, was terminated in early 2011 due to low loan sale volume and an expected increased compliance burden, thus our loan sale income is likely to diminish significantly in 2011.
In 2010 and 2009, gains on the sale of investments totaling $2.643 million and $1.099 million, respectively, represent significant additions to income. The investment gains in 2010 were taken pursuant to a portfolio restructuring in the third quarter that involved the sale of $64 million in mortgage-backed securities, with the proceeds reinvested in agency-issued mortgage-backed securities that have a slightly longer duration and slightly lower yield. Management estimates that as a result of the sale the overall tax-equivalent yield of the portfolio declined by 31 basis points, while the effective duration increased from 1.68 to 1.83. Furthermore, by selling bonds that had declined to relatively small balances due to prepayments, and reinvesting in securities with larger balances, the structure of the portfolio was improved and lends itself to more efficient management. For 2009, gains were taken on the sale of $30 million in mortgage-backed securities. As in 2010, we reinvested the proceeds in high-quality agency-issued mortgage-backed securities, with the overall transaction increasing the duration of our investment portfolio but slightly lowering the overall yield. The gain on investments in 2009 also includes small gains on bonds called prior to maturity, and a non-recurring $66,000 recovery on a previously charged-off investment in a title insurance holding company.
The next line item reflects pass-through losses associated with our partnership investments in low-income housing tax credit funds. These costs, which are accounted for as a reduction of income, totaled $808,000 in 2010, relative to $1.443 million in 2009 and $1.242 million in 2008. They declined by $635,000, or 44%, in 2010 relative to 2009, but increased by $201,000, or 16%, in 2009 relative to 2008. While these expenses are typically expected to be around $1.2 million per year, the fluctuations are due to expense accrual adjustments made subsequent to the receipt of updated partnership financial statements.
Other non-interest income includes gains and losses on the disposition of real properties and other assets, and rental income generated by the Company’s alliance with Investment Centers of America (ICA). Other non-interest income declined by $1.617 million in 2010 relative to 2009, and was $402,000 lower in 2009 than in 2008. The primary reason for the lower level in 2010 is $1.536 million in net losses on the sale of foreclosed assets, which is $1.332 million higher than in 2009. A non-recurring $238,000 loss on the disposition of equipment acquired upon the termination of operating leases in 2010 was also a factor in the decline. The drop in 2009 is due in part to a $266,000 increase in OREO losses and a $45,000 decline in ICA income. The 2009 over 2008 difference was also impacted by a non-recurring $82,000 gain on the sale of real property adjacent to one of our branches in 2008.
Total operating expense (non-interest expense) was $50.2 million for 2010, relative to $44.1 million in 2009 and $35.9 million in 2008. This represents an increase of $6.1 million, or 14%, for 2010 over 2009, with the majority of the increase coming in OREO write-downs and compensation expense, as discussed in greater detail below. The increase in 2009 over 2008 was $8.3 million, or 23%, and was primarily caused by higher employee compensation costs, a substantial increase in FDIC assessments, and a large jump up in credit-related costs.
39
Table of Contents
Non-interest expense includes the following significant non-recurring items, which net out to additional expense of $5.120 million in 2010, $1.857 million in 2009, and $337,000 in 2008: OREO write-downs totaling $5.045 million in 2010, $1.265 million in 2009 and $463,000 in 2008; the payment of $592,000 in 2009 for an industry-wide special FDIC assessment; a $75,000 legal settlement on an operations-related issue paid in 2010; a legal settlement and non-recurring operations-related loss totaling $191,000 in 2008; a $54,000 insurance recovery from a prior-year check fraud loss in 2008; expenses totaling $83,000 associated with the initiation of a mortgage lending platform in 2008; and, expense reductions totaling $346,000 in the form of incentive payments/expense reimbursements from certain vendors in 2008, in conjunction with our debit card and EFT processing conversions in the previous year. Total operating expense increased to 4.27% of average earning assets in 2010, from 3.72% in 2009 and 3.08% in 2008.
The largest component of operating expense, salaries and employee benefits, increased by $1.906 million, or 10%, in 2010 over 2009, and by $2.297 million, or 14%, in 2009 relative to 2008. The biggest contributing factor to the increase in 2010 was our accrual for incentive compensation, which was $1.343 million in 2010 relative to zero in 2009, when the Company’s net income did not reach the level necessary to trigger bonus payments. Adding to salaries and benefits in 2010 and 2009 were normal annual salary adjustments, staffing costs associated with recently-opened branches, and strategic staff additions to help address credit issues and position the Company for future growth opportunities. Compensation costs in 2010 also include severance costs associated with selective staff reductions. The increase in 2010 over 2009 was also supplemented by a lower level of salaries deferred and amortized as an adjustment to loan yields, pursuant to FASB guidelines on the recognition and measurement of nonrefundable fees and origination costs associated with lending activities. Salaries deferred for this purpose fell to $2.376 million in 2010, from $2.554 million in 2009 and $3.415 million for 2008, due to lower loan origination activity. Also contributing to fluctuations in salaries and benefits are accruals associated with employee deferred compensation plans. As noted above in our discussion of BOLI income, employee deferred compensation accruals are related to separate account BOLI income and losses, as are directors deferred compensation accruals that are included in “other professional services,” and the net income impact of all income/expense accruals related to deferred compensation is usually minimal. Gains on employee plans totaled $206,000 in 2010 and $237,000 in 2009, relative to a loss of $530,000 in 2008. In fact, the single largest contribution to the increase in compensation costs in 2009 came from the $767,000 swing in deferred compensation accruals. Partially offsetting the aforementioned increases in compensation-related costs in 2009 over 2008 was a $675,000 drop in incentive compensation costs, which were accrued at a reduced level in 2008 and, as noted above, were non-existent in 2009. Salaries and benefits were 41.54% of total operating expense in 2010, relative to 37.75% in 2009 and 46.48% in 2008. The large drop in the percentage in 2009 relative to 2008 came despite a substantial increase in actual expense, due to the relatively large increases in FDIC costs and credit-related costs in 2009. The number of full-time equivalent staff employed by the Company was 390 at the end of 2010, 402 at the end of 2009, and 388 at the end of 2008.
Total rent and occupancy costs, including furniture and equipment expenses, increased by $90,000, or 1%, in 2010 in comparison to 2009, and by $443,000, or 7%, in 2009 over 2008. Furniture and equipment expense was actually lower in both 2010 and in 2009 due to declining depreciation expense and lower maintenance and repair costs for furniture and equipment, but premises costs were higher. The increases in premises expense were primarily caused by costs associated with our new branches, annual rental increases for our other branches, and the rising cost of insurance and utilities.
Advertising and marketing costs were up by $107,000, or 6%, in 2010 compared to 2009, but fell by $417,000, or 18%, in 2009 relative to 2008. The increase in 2010 is mainly due to costs associated with our debit rewards program and an increase in radio advertising, while the decline in 2009 is mainly the result of streamlined marketing efforts. It should be noted that our highly successful direct-mail marketing campaign for deposits continues in full force.
Data processing costs increased $331,000, or 24% in 2010 relative to 2009, and by $95,000, or 7%, in 2009 relative to 2008. The increase in 2010 was centered in internet banking costs and software maintenance fees. The increase in 2009 is also the result of higher internet banking costs, which have risen as we have encouraged higher usage of this access channel to promote better customer retention.
40
Table of Contents
Deposit services costs increased by $520,000, or 24%, in 2010 relative to 2009, and by $429,000, or 24%, in 2009 over 2008. The increase in 2010 is due to higher expenses associated with our online checking product, ATM servicing, check card processing, and remote deposit capture. Operational costs associated with the launch and maintenance of our online deposit product, Reward Checking, totaled $98,000 in 2009 and contributed to the increase in deposit costs for that year. The variance for 2009 over 2008 was also impacted by non-recurring expense reductions of $346,000 in 2008 related to our EFT processing and debit card conversions, and a $54,000 insurance recovery in 2008.
Loan services costs, including expenses associated with foreclosed assets, credit card costs, and other loan processing costs, increased by $4.146 million, or 149%, in 2010 over 2009, and by $1.535 million, or 123%, in 2009 over 2008. For 2010, the increase is due to a $3.780 increase in write-downs on foreclosed assets (primarily OREO), as we adjusted carrying values pursuant to changing market conditions and updated appraisals, and a $560,000 increase in OREO operating expense. For 2009, the major cause of the increase was also an $801,000 increase in write-downs on foreclosed assets. Write-downs on foreclosed assets totaled $5.045 million in 2010, relative to $1.264 million in 2009 and $463,000 in 2008. Operating expenses associated with foreclosed assets totaled $1.123 million in 2010, in comparison to $563,000 in 2009 and $115,000 in 2008. Also contributing to the increase in loan costs in 2009 over 2008 were increases of $155,000 in foreclosure costs and $118,000 in appraisal costs.
The “other operating costs” category, including telecommunications expense, postage, and other miscellaneous costs, totaled $2.773 million in 2010, $2.648 million in 2009, and $2.546 million in 2008. Telecommunications expense increased by $49,000, or 4%, in 2010, and by $139,000, or 14%, in 2009. The relatively large increase in 2009 was due to network upgrades in early 2009, costs associated with new branches, and enhanced circuit redundancy. Postage expense increased by $57,000, or 11%, in 2010, and by $32,000, or 7%, in 2009. The increases in 2010 and 2009 include increases associated with a growing customer base, and postage in 2010 also includes additional mailings for newly-required regulatory compliance disclosures. Other miscellaneous costs did not reflect a material change in either 2010 or 2009.
Legal and accounting costs declined by $261,000, or 17%, in 2010 over 2009, but increased by $147,000, or 11%, in 2009 over 2008. Legal and accounting costs were lower in 2010 mainly because of enhanced staffing in the collections area which enabled a reduction in lending-related legal expense, but also due to a reduction in expenses associated with compliance and operations reviews. For 2009, the increase is attributable to legal costs associated with collections, which were up by $148,000, as well as higher operational, compliance and loan review costs, although those increases were partially offset by lower external audit costs and a drop in other legal costs.
Other professional service expense includes FDIC assessments and other regulatory costs, directors’ costs, certain insurance costs, and certain shareholder expenses. This category declined by $843,000, or 18%, in 2010 over 2009, but shows the largest increase of any non-interest expense category in 2009, rising by $3.7 million relative to 2008. The large fluctuations are centered on accruals for FDIC assessments, which totaled $2.214 million in 2010, $3.155 million in 2009 including the special FDIC assessment of $592,000, and only $323,000 in 2008. In addition to the special assessment, the increase in 2009 reflects an increase in our assessment base and rising regular assessment rates as the FDIC attempts to recapitalize the Deposit Insurance Fund. The variance in other professional service expense also includes an $86,000 reduction in directors’ deferred fee expense accruals in 2010 and a $796,000 increase in 2009. As with deferred compensation accruals for employees, directors’ deferred fee accruals are related to separate account BOLI income and losses, and the net income impact of all income/expense accruals related to deferred compensation is usually minimal.
Stationery and supply costs were up $40,000, or 6%, in 2010, but declined by $78,000, or 10%, in 2009. The increase in 2010 is primarily due to supplies purchased for recently-added branches, plus inflationary increases in the cost of supplies. The drop in 2009 is the result of an internal review conducted and subsequent changes implemented to increase efficiencies and lower costs with regard to forms, brochures, and other supplies. Sundry and teller costs fell by $65,000, or 12%, in 2010, but increased by $62,000, or 13%, in 2009. The decline in 2010 is from reductions in debit card losses due to enhanced anti-fraud efforts, and a lower level of other sundry losses despite a $75,000 non-recurring legal settlement paid in 2010. The increase in 2009 is from higher debit card losses, which were partially offset by declines related to a non-recurring legal settlement and a non-recurring operations-related loss in 2008.
41
Table of Contents
Income Taxes
The Company sets aside its provision for income taxes on a monthly basis. As indicated in Note 9 in the Notes to the Consolidated Financial Statements, the amount of such provision is determined by applying the Company’s statutory income tax rates to pre-tax book income as adjusted for permanent differences between book income and actual taxable income. These permanent differences include, but are not limited to, tax-exempt interest income, increases in the cash surrender value of BOLI (BOLI income), California Enterprise Zone deductions, and certain book expenses that are not allowed as tax deductions. Tax-exempt interest income is generated primarily by the Company’s investments in state, county and municipal bonds, which provided $2.7 million in federal tax-exempt income in 2010, $2.5 million in 2009, and $2.4 million in 2008. Tax credits, including hiring tax credits as well as those stemming from our investments in low-income housing tax credit funds, are applied as a direct reduction to our tax liability for both book and tax purposes. The company had investments totaling $10.3 million in low-income housing tax credit funds as of December 31, 2010. These investments, which are included in other assets rather than in our investment portfolio, have generated substantial tax credits over the past few years, with about $1.7 million in credits available for the 2010 tax year and $1.7 million in tax credits realized in 2009. The investments are expected to generate an additional $7.3 million in aggregate tax credits from 2011 through 2018. The credits are dependent upon the occupancy level of the housing projects and income of the tenants, however, and cannot be projected with complete certainty. Furthermore, our capacity to utilize them will continue to depend on our ability to generate sufficient pre-tax income.
A negative income tax provision of $234,000, resulting from a high level of tax credits relative to our pre-credit tax liability as calculated for book purposes, helped boost net income in 2010. While our level of tax credits did not change materially relative to the prior year, our tax liability declined due to a drop in pre-tax income, as adjusted for the permanent differences noted above. The Company’s provision for federal and state income taxes was $608,000 in 2009 and $3.868 million in 2008. This represents 6% of income before taxes in 2009, and 22% in 2008. The accrual rate declined significantly in 2009 relative to 2008, due to the relatively larger impact of tax credits and non-taxable income on a lower level of pre-tax income.
In addition to permanent differences, some income and expense items are recognized in different years for tax purposes than when applying generally accepted accounting principles, leading to timing differences between the Company’s actual tax liability and the amount accrued for this liability based on book income. These temporary differences comprise the “deferred” portion of the Company’s tax expense, which is accumulated on the Company’s books as a deferred tax asset or deferred tax liability until such time as it reverses. At the end of 2010, the Company had a net deferred tax asset of $13.5 million.
Financial Condition
Total assets of $1.287 billion at the end of 2010 reflect a drop of $49 million, or 4%, for the year, due primarily to declining loan balances partially offset by growth in investments. In 2009, we experienced a drop of $62 million in gross loan balances, as well. In addition to loan growth challenges for the past three years, we saw marked deterioration in asset quality in 2009 and 2008, coincidental with the decline in the economy. Despite growth challenges and relatively high levels of nonperforming assets, our capital position was greatly strengthened due to our registered direct offering in 2010 and private placement in 2009, as well as positive net income in both years. Furthermore, our liquidity position has significantly improved over the past couple of years due to strong growth in customer deposits and the runoff of a large volume of wholesale-sourced brokered deposits and other borrowings, as well as a drop in loan balances and substantial increase in unpledged investments. Our strong capital position and access to liquidity resources position us well to endure to the end of the current cycle and eventually return to previous levels of loan growth, although no assurance can be provided in that regard.
Significant changes in the relative size of balance sheet components in 2010 include net loans and leases, which fell to 61% of total assets at the end of 2010 from 64% at the end of 2009, and investment securities, which increased to 26% of total assets at the end of 2010 from 21% at the end of 2009. On the liability side, non-maturity deposits increased to 63% of total deposits at the end of 2010 from 54% at the end of 2009, while jumbo customer time deposits and CDARS dropped to 21% of total deposits at December 31, 2010 from 30% at December 31, 2009. Wholesale-
42
Table of Contents
sourced brokered deposits fell to zero by year-end 2010, from 2% of total deposits at the end of 2009. Because of the aforementioned capital raise, shareholders’ equity increased to 12% of total liabilities and shareholders’ equity at December 31, 2010, from 10% at December 31, 2009. The major components of the Company’s balance sheet are individually analyzed below, along with information on off-balance sheet activities and exposure.
Loan and Lease Portfolio
The Company’s loan and lease portfolio represents the single largest portion of invested assets, substantially greater than the investment portfolio or any other asset category, and the quality and diversification of the loan and lease portfolio are important considerations when reviewing the Company’s financial condition. The Company is not involved with chemicals or toxins that might have an adverse effect on the environment, thus its primary exposure to environmental legislation is through its lending activities. The Company’s lending procedures include steps to identify and monitor this exposure in an effort to avoid any related loss or liability. The Selected Financial Data table in Item 6 above reflects the amount of loans and leases outstanding at December 31st for each year from 2006 through 2010, net of deferred fees and origination costs and the allowance for loan and lease losses. The Loan and Lease Distribution table that follows sets forth by loan type the Company’s gross loans and leases outstanding, and the percentage distribution in each category at the dates indicated. The gross balances shown include nonperforming loans by type, but do not reflect any deferred or unamortized loan origination, extension, or commitment fees, or deferred loan origination costs.
Loan and Lease Distribution
| As of December 31, | ||||||||||||||||||||
| (dollars in thousands) | 2010 | 2009 | 2008 | 2007 | 2006 | |||||||||||||||
| Agricultural |
$ | 13,457 | $ | 9,865 | $ | 13,542 | $ | 13,103 | $ | 13,193 | ||||||||||
| Commercial and Industrial |
94,768 | 116,835 | 122,856 | 117,183 | 113,644 | |||||||||||||||
| Real Estate: |
||||||||||||||||||||
| Secured by Commercial/Professional Office |
||||||||||||||||||||
| Properties including const. and development |
308,470 | 421,114 | 456,932 | 457,236 | 420,973 | |||||||||||||||
| Secured by Residential Properties |
252,203 | 188,750 | 189,849 | 187,267 | 177,448 | |||||||||||||||
| Secured by Farmland |
61,293 | 56,654 | 57,808 | 51,607 | 53,668 | |||||||||||||||
| Held for Sale |
914 | 376 | 552 | — | — | |||||||||||||||
| Total Real Estate |
622,880 | 666,894 | 705,141 | 696,110 | 652,089 | |||||||||||||||
| Small Business Administration loans |
18,616 | 18,626 | 19,463 | 20,366 | 25,946 | |||||||||||||||
| Consumer Loans |
45,585 | 56,992 | 65,755 | 54,731 | 54,568 | |||||||||||||||
| Direct Financing Leases |
10,234 | 15,394 | 19,883 | 23,140 | 20,150 | |||||||||||||||
| Consumer Credit Cards |
— | — | — | — | 8,418 | |||||||||||||||
| Total Loans and Leases |
$ | 805,540 | $ | 884,606 | $ | 946,640 | $ | 924,633 | $ | 888,008 | ||||||||||
| Percentage of Total Loans and Leases |
||||||||||||||||||||
| Agricultural |
1.67 | % | 1.12 | % | 1.42 | % | 1.42 | % | 1.49 | % | ||||||||||
| Commercial and Industrial |
11.77 | % | 13.21 | % | 12.97 | % | 12.67 | % | 12.80 | % | ||||||||||
| Real Estate: |
||||||||||||||||||||
| Secured by Commercial/Professional Office |
||||||||||||||||||||
| Properties including const. and development |
38.29 | % | 47.60 | % | 48.27 | % | 49.45 | % | 47.41 | % | ||||||||||
| Secured by Residential Properties |
31.31 | % | 21.34 | % | 20.06 | % | 20.26 | % | 19.98 | % | ||||||||||
| Secured by Farmland |
7.61 | % | 6.40 | % | 6.11 | % | 5.58 | % | 6.04 | % | ||||||||||
| Held for Sale |
0.11 | % | 0.04 | % | 0.06 | % | 0.00 | % | 0.00 | % | ||||||||||
| Total Real Estate |
77.32 | % | 75.38 | % | 74.50 | % | 75.29 | % | 73.43 | % | ||||||||||
| Small Business Administration loans |
2.31 | % | 2.11 | % | 2.06 | % | 2.20 | % | 2.92 | % | ||||||||||
| Consumer Loans |
5.66 | % | 6.44 | % | 6.95 | % | 5.92 | % | 6.14 | % | ||||||||||
| Direct Financing Leases |
1.27 | % | 1.74 | % | 2.10 | % | 2.50 | % | 2.27 | % | ||||||||||
| Consumer Credit Cards |
0.00 | % | 0.00 | % | 0.00 | % | 0.00 | % | 0.95 | % | ||||||||||
| 100.00 | % | 100.00 | % | 100.00 | % | 100.00 | % | 100.00 | % | |||||||||||
The Company’s gross loans and leases totaled $806 million at the end of December 2010, a drop of $79 million, or 9%, since December 31, 2009. Loan balances have been declining because of runoff in the normal course of business
43
Table of Contents
(including prepayments), charge-offs, transfers to OREO, and the sale of certain substandard loans. Furthermore, loan origination activity in our branches has been light due to weak demand from creditworthy borrowers, tightened credit criteria for real estate loans, and increased attention devoted to monitoring and managing current loan relationships. Management has realigned branch objectives in order to place additional emphasis on high-quality loan growth, with a particular focus on commercial loans, but no assurance can be provided that loan balances will not continue to decline, especially in the near term.
Agricultural production loans reflect a timing-related increase of close to $4 million relative to their year-end 2009 balance, and SBA loans were about even, but balances declined in the real estate, commercial, direct finance lease, and consumer loan categories. While there was a decline in aggregate commercial real estate loan balances, within that category non-owner occupied commercial real estate loans increased by $15 million, or 14%, and multi-family residential loans increased by $3 million, or 34%, due to the completion of construction projects and the reclassification of associated loans as permanent loans. Construction and development loans were down by $48 million. Commercial loans and consumer loans also experienced fairly substantial drops during 2010, declining by $22 million, or 19%, and $11 million, or 20%, respectively. For both commercial and consumer loans the decline is primarily the result of flagging demand, but it also includes $5 million in commercial loan charge-offs and $4 million in consumer loan charge-offs. Direct finance lease balances dropped by over $5 million, or 34%, in 2010. As a result of these changes, real estate loans increased to 77% and commercial loans fell to 12% of total loans at the end of 2010, from 75% and 13%, respectively, at the end of 2009.
Our total investment in impaired loans was $71 million at December 31, 2010. Pursuant to FASB’s impairment accounting guidance, a loan is considered impaired when, based on current information and events, it is probable that the Company will be unable to collect all amounts due from the borrower in accordance with the contractual terms of the loan. Impaired loans include all nonperforming loans, as well as certain other loans that are still being maintained on accrual status including performing restructured troubled debt.
Although not reflected in the loan totals above, the Company occasionally originates and sells, or participates out portions of, certain commercial real estate loans, agricultural or residential mortgage loans, and other loans to non-affiliated investors, and we currently provide servicing for some of those loans including a small number of SBA loans. The balance of loans serviced for others fell to less than $5 million at December 31, 2010 from $8 million at December 31, 2009, with the decline resulting primarily from winding down servicing for agricultural mortgage loans that had been previously sold by the Company with servicing rights retained.
Loan and Lease Maturities
The following table shows the maturity distribution for total loans and leases outstanding as of December 31, 2010, including non-accruing loans, grouped by remaining scheduled principal payments.
Loan and Lease Maturity
| As of December 31, 2010 | ||||||||||||||||||||||||||||
| (dollars in thousands) | Three months or less |
Three months to twelve months |
One to five years |
Over five years |
Total | Floating rate: due after one year |
Fixed rate: due after one year |
|||||||||||||||||||||
| Agricultural |
$ | 2,664 | $ | 7,715 | $ | 2,583 | $ | 495 | $ | 13,457 | $ | 770 | $ | 1,263 | ||||||||||||||
| Commercial and Industrial (1) |
17,945 | 41,952 | 38,878 | 14,609 | 113,384 | 13,842 | 137,755 | |||||||||||||||||||||
| Real Estate |
27,160 | 35,356 | 151,418 | 408,946 | 622,880 | 336,585 | 130,175 | |||||||||||||||||||||
| Consumer Loans |
4,853 | 7,265 | 12,090 | 21,377 | 45,585 | 30,256 | 3,514 | |||||||||||||||||||||
| Direct Financing Leases |
375 | 513 | 5,623 | 3,723 | 10,234 | — | 9,346 | |||||||||||||||||||||
| TOTAL |
$ | 52,997 | $ | 92,801 | $ | 210,592 | $ | 449,150 | $ | 805,540 | $ | 381,453 | $ | 282,053 | ||||||||||||||
| (1) | Includes Small Business Administration Loans |
For a comprehensive discussion of the Company’s liquidity position, re-pricing characteristics of the balance sheet, and sensitivity to changes in interest rates, see the “Liquidity and Market Risk” section.
44
Table of Contents
Off-Balance Sheet Arrangements
In the normal course of business, the Company makes commitments to extend credit to its customers as long as there are no violations of conditions established in contractual arrangements. Total unused commitments to extend credit were $142 million at December 31, 2010, as compared to $162 million at December 31, 2009. These numbers include $33 million in home equity lines of credit at December 31, 2010, and $36 million at December 31, 2009. Unused commitments represented 18% of gross loans and leases outstanding at December 31, 2010 and 2009. The Company’s undrawn letters of credit totaled $17 million at December 31, 2010 and $21 million at December 31, 2009. These obligations represent potential credit risk to the Company, and a $160,000 reserve for unfunded commitments is reflected as a liability in our consolidated balance sheet at December 31, 2010.
The effect on the Company’s revenues, expenses, cash flows and liquidity from the unused portion of the commitments to provide credit cannot be reasonably predicted, because there is no certainty that lines of credit will ever be fully utilized. For more information regarding the Company’s off-balance sheet arrangements, see Note 11 to the financial statements in Item 8 herein.
Contractual Obligations
At the end of 2010, the Company had contractual obligations for the following payments, by type and period due:
Contractual Obligations
| Payments Due by Period | ||||||||||||||||||||
| (dollars in thousands) | Total | Less than 1 Year |
1-3 Years | 3-5 Years | More than 5 Years |
|||||||||||||||
| Long-term debt obligations |
$ | 45,928 | $ | — | $ | 15,000 | $ | — | $ | 30,928 | ||||||||||
| Operating lease obligations |
7,428 | 1,119 | 2,585 | 1,621 | 2,103 | |||||||||||||||
| Other long-term obligations |
417 | 206 | — | — | 211 | |||||||||||||||
| Total |
$ | 53,773 | $ | 1,325 | $ | 17,585 | $ | 1,621 | $ | 33,242 | ||||||||||
Nonperforming Assets
Nonperforming assets are comprised of loans for which the Company is no longer accruing interest, and foreclosed assets, including mobile homes and other real estate owned. OREO consists of properties acquired by foreclosure or similar means, which the Company is offering or will offer for sale. Nonperforming loans and leases result when reasonable doubt exists with regard to the ability of the Company to collect all principal and interest on a loan or lease. At that point, we stop accruing interest on the loan or lease in question, and reverse any previously-recognized interest to the extent that it is uncollected or associated with interest-reserve loans. Any asset for which principal or interest has been in default for a period of 90 days or more is also placed on non-accrual status, even if interest is still being received, unless the asset is both well secured and in the process of collection. Nonperforming assets are considered to be impaired, as explained above in the “Loan and Lease Portfolio” section. If the Bank grants a concession to a borrower in financial difficulty, the loan falls into the category of a troubled debt restructuring (TDR). TDR’s are also deemed to be impaired loans, and are further classified as either nonperforming or performing loans depending on their accrual status. The following table presents comparative data for the Company’s nonperforming assets and performing TDR’s:
45
Table of Contents
Nonperforming Assets
| As of December 31, | ||||||||||||||||||||
| (dollars in thousands) | 2010 | 2009 | 2008 | 2007 | 2006 | |||||||||||||||
| Nonaccrual Loans and Leases:(1) |
||||||||||||||||||||
| Agricultural |
$ | — | $ | — | $ | — | $ | — | $ | — | ||||||||||
| Commercial and Industrial |
2,005 | 3,559 | 771 | 75 | 370 | |||||||||||||||
| Real Estate |
||||||||||||||||||||
| Secured by Commercial/Professional Office |
— | — | 533 | — | — | |||||||||||||||
| Properties including const. and development |
32,222 | 31,842 | 23,899 | 6,976 | — | |||||||||||||||
| Secured by Residential Properties |
6,270 | 5,652 | 2,918 | 666 | — | |||||||||||||||
| Secured by Farmland |
404 | 429 | 42 | — | — | |||||||||||||||
| Subtotal Real Estate |
38,896 | 37,923 | 27,392 | 7,642 | — | |||||||||||||||
| Small Business Administration loans |
3,440 | 3,683 | 862 | 1,174 | 262 | |||||||||||||||
| Consumer Loans |
1,112 | 756 | 392 | 161 | 57 | |||||||||||||||
| Credit Cards |
— | — | — | — | — | |||||||||||||||
| Direct Financing Leases |
501 | 1,053 | 369 | — | — | |||||||||||||||
| Total Nonperforming Loans and Leases |
45,954 | 46,974 | 29,786 | 9,052 | 689 | |||||||||||||||
| Other Real Estate Owned |
20,691 | 25,654 | 7,127 | 556 | — | |||||||||||||||
| TOTAL NONPERFORMING ASSETS |
$ | 66,645 | $ | 72,628 | $ | 36,913 | $ | 9,608 | $ | 689 | ||||||||||
| Performing TDR’s (2) |
$ | 12,465 | $ | 28,024 | $ | 0 | $ | 0 | $ | 0 | ||||||||||
| Nonperforming loans and leases as % of total gross loans and leases |
5.70 | % | 5.31 | % | 3.15 | % | 0.98 | % | 0.08 | % | ||||||||||
| Nonperforming assets as a % of total gross loans and leases and other real estate owned |
8.07 | % | 7.98 | % | 3.87 | % | 1.04 | % | 0.08 | % | ||||||||||
| (1) | The gross interest income that would have been recorded in the period ending December 31, 2010 if all non-accrual loans had been paying pursuant to their original terms was $3,929,000, which includes $1,219,000 that was recorded and included in net income for the period. |
| (2) | A TDR, or troubled debt restructuring, is a loan or lease for which the terms were renegotiated to provide a reduction or deferral of interest or principal because of deterioration in the financial position of the borrower. |
Nonperforming assets were not at material levels in 2006, but have escalated dramatically since then due to deterioration in economic conditions and the associated negative impact on our borrowers. Total nonperforming assets declined $6.0 million, or 8%, during 2010, due to a drop of $1.0 million, or 2%, in nonperforming loans, and a net reduction of $5.0 million, or 19%, in foreclosed assets. The balance of nonperforming loans at December 31, 2010 includes a total of $16.6 million in TDR’s which were paying as agreed under modified terms or forbearance agreements but were still classified as nonperforming. As shown in the table, we also had $12.5 million in loans classified as performing TDR’s for which we were still accruing interest at December 31, 2010, a drop of $15.6 million relative to the balance at December 31, 2009. The decline in performing TDR’s is primarily the result of a single developer relationship of over $4 million in loans secured by residential properties, and a $7 million agricultural loan secured by real estate, which are paying interest at market rates and are now well-seasoned, and were thus removed from the TDR classification in the first quarter of 2010. Additionally, during the third quarter of 2010, we moved a $3 million loan from the performing TDR category to non-accrual status since the collection of a portion of the outstanding principal is in doubt, although the borrower is still paying interest as agreed.
Non-accruing loan balances secured by real estate comprised $38.9 million of total nonperforming loans at December 31, 2010, and reflect a net increase of $973,000, or 3%, during 2010. Gross additions to nonperforming real estate loans totaled $42.2 million for 2010, much of which was comprised of balances secured by commercial real estate but also including relatively large increases in the “other construction/land,” “1-4 family residential construction,” and other “1-4 family” loan categories. Offsetting some of the increase created by additional real estate loans placed on non-accrual status during 2010 were $11.9 million in transfers to OREO from nonperforming real estate loans, net pay-downs on nonperforming real estate loans of $13.1 million, $8.5 million in real estate loans that were returned to accrual status, and charge-offs of $7.7 million.
Nonperforming commercial and SBA loans declined by a combined $1.8 million, or 25%, during 2010, ending the period at $5.4 million. Gross additions to nonperforming commercial and SBA loans totaled $7.6 million for the
46
Table of Contents
year, but this was more than offset by net pay-downs of $1.8 million, the return to accrual status of $2.7 million in loans, the charge-off of $4.3 million in loan balances, and the transfer of a small amount to foreclosed assets. Non-accrual direct finance leases declined by $552,000, or 52%, in 2010, since balances charged off exceeded net additions. Nonperforming consumer loans, which are largely unsecured, increased by a net $356,000, or 47%, to a total of $1.1 million.
The balance of foreclosed assets at December 31, 2010 had an aggregate carrying value of $20.7 million, and was comprised of 79 parcels classified as OREO and 17 mobile homes. Much of our OREO consists of vacant lots or land, but there are also 20 residential properties totaling $2.6 million, six commercial buildings with a combined book balance of $3.5 million, and a mini-storage unit. At the end of 2009, foreclosed assets totaled $25.7 million, comprised of 85 properties in OREO, 13 mobile homes, and a small amount of commercial equipment acquired upon the default of a lease agreement. All foreclosed assets are periodically evaluated and written down to their fair value less expected disposition costs, if lower than the then-current carrying value.
Nonperforming assets were 8.07% of total gross loans and leases plus foreclosed assets at December 31, 2010, up slightly from 7.98% at December 31, 2009 despite the decline in nonperforming assets due to a larger relative drop in loan balances. An action plan is in place for each of our nonperforming and foreclosed assets and they are all being actively managed. Collection efforts are continuously pursued for all nonperforming loans, but we cannot provide assurance that all will be resolved in a timely manner or that nonperforming balances will not increase further.
Allowance for Loan and Lease Losses
The allowance for loan and lease losses, a contra-asset, is established through a provision for loan and lease losses based on management’s evaluation of probable loan losses related to certain specifically identified impaired loans, as well as probable incurred loan losses in the remaining loan portfolio. It is maintained at a level which is considered adequate to absorb the remaining probable losses inherent in our loan portfolio, after factoring in charge-offs taken against the allowance and recoveries credited back to the allowance. Specifically identifiable and quantifiable losses are immediately charged off against the allowance; recoveries are generally recorded only when cash payments are received subsequent to the charge off. At December 31, 2010, the allowance for loan and lease losses was $21.1 million, or 2.62% of gross loans and leases, an 11% decline from the $23.7 million allowance at December 31, 2009 which was 2.68% of gross loans and leases. The Company’s total allowance was 46.00% of nonperforming loans at December 31, 2010, relative to 50.49% at December 31, 2009. An allowance for potential losses inherent in unused commitments, totaling $160,000 at December 31, 2010, is included in other liabilities.
We employ a systematic methodology, consistent with FASB guidelines on loss contingencies and impaired loans, for determining the appropriate level of the allowance for loan and lease losses and adjusting it on at least a quarterly basis. Pursuant to that methodology, impaired loans and leases are individually analyzed and a criticized asset action plan is completed specifying the financial status of the borrower and, if applicable, the characteristics and condition of collateral and any associated liquidation plan. A specific loss allowance is created for each impaired loan, if necessary, representing the difference between the face value of the loan and either its current appraised value less estimated disposition costs, or its net present value as determined by a discounted cash flow analysis. While we had a total of $71.0 million in impaired loans on our books at December 31, 2010, impaired loans totaling approximately $32.0 million did not require any valuation allowance either because they have already been written down to their estimated fair values, or because the fair value of the collateral or the net present value of anticipated cash flows exceeded the carrying value of those loans. Thus, our total impaired loan valuation allowance of $8.0 million at December 31, 2010 is applicable to the remaining $39.0 million balance of impaired loans.
On impaired loans for which it is anticipated that repayment will be provided from cash flows other than those generated solely by the disposition of underlying collateral, impairment is measured using the net present value of expected cash flows relative to the loan’s remaining book balance. If a distressed borrower displays the desire and ability to continue paying on the loan, but is unable to do so except on a modified basis, an amended repayment plan may be negotiated. For these TDR’s, the act of modification in and of itself suggests that the Company believes the source of repayment will likely be from borrower cash flows, thus they are also typically evaluated for impairment by discounting projected cash flows.
47
Table of Contents
For loans where repayment is expected to be provided solely by the underlying collateral, impairment is measured using the fair value of the collateral. If the collateral value, net of the expected costs of disposition, is less than the loan balance, then a specific loss reserve is established for the amount of the collateral coverage shortfall. If the discounted collateral value is greater than or equal to the loan balance, no specific loss reserve is established. At the time a collateral-dependent loan is designated as nonperforming, a new appraisal is ordered and typically received within 30 to 60 days if a recent appraisal was not already available. We generally use external appraisals to determine the fair value of the underlying collateral for nonperforming real estate loans, although the Company’s licensed staff appraisers may update older appraisals based on current market conditions and property value trends. Until an updated appraisal is received, the Company uses the existing appraisal to determine the amount of the specific loss allowance that may be required, and adjusts the specific loss allowance, as necessary, once a new appraisal is received. Updated appraisals are generally ordered at least annually for collateral-dependent loans that remain impaired. Current appraisals were available for 67% of the Company’s impaired collateral-dependent loans at December 31, 2010, or 85% if appraisals ordered or received shortly after year-end are included. Furthermore, the Company analyzes collateral-dependent loans on at least a quarterly basis, to determine if any portion of the recorded investment in such loans can be identified as uncollectible and would therefore constitute a confirmed loss. All amounts deemed to be uncollectible are promptly charged off against the Company’s allowance for loan and lease losses, with the loan then carried at the fair value of the collateral, as appraised, less estimated costs of disposition if such costs were not reflected in appraised values. Once a charge-off or write-down is recorded, it will not be restored to the loan balance on the Company’s accounting books.
Based on our detailed evaluation of individual nonperforming real estate loans on our books at December 31, 2010, approximately $8.7 million in probable losses have been identified. An allowance was established for that amount, although losses totaling $4.3 million have been identified as uncollectible and were written off against that allowance. After the aforementioned write-downs there is a $4.4 million allowance remaining for $20.3 million in nonperforming real estate loans as of December 31, 2010, with another $18.6 million in nonperforming real estate loans requiring no allowance because the fair value of the collateral or net present value of expected cash flows exceeds the book value of the loans. The loss allowance established for specifically identified probable losses for other nonperforming loan categories, including commercial loans and leases, SBA loans, and consumer loans, totaled $2.7 million on loan balances of $7.1 million at December 31, 2010.
Our methodology also provides that an allowance be established for probable incurred losses inherent in performing loans and leases, which are segregated by loan grade and then evaluated either individually or in pools with common characteristics. At the present time, pools are based on the same segmentation of loan types presented in our regulatory filings. While this methodology utilizes historical data, projected cash flows and other objective information, the classification of loans and the establishment of the allowance for loan and lease losses are both to some extent based on management’s judgment and experience. Our methodology incorporates a variety of risk considerations, both quantitative and qualitative, in establishing an allowance for loan and lease losses that management believes is appropriate at each reporting date. Quantitative information includes our historical loss experience, delinquency and charge-off trends, current collateral values, and the anticipated timing of collection of principal for certain impaired loans. Qualitative factors include the general economic environment in our markets and, in particular, the state of the agricultural industry and other key industries in the Central San Joaquin Valley. Lending policies and procedures (including underwriting standards), the experience and abilities of lending staff, the quality of loan review, credit concentrations (by geography, loan type, industry and collateral type), the rate of loan portfolio growth, and changes in legal or regulatory requirements are additional factors that are considered. The allowance established for probable incurred losses for performing loans was $14.0 million at December 31, 2010.
There have been no recent material changes to the methodology used to determine our allowance for loan and lease losses, although historical loss rates have increased substantially over the past couple of years. As we add new products and expand our geographic coverage, and as the economic environment changes, we expect to enhance our methodology to keep pace with the size and complexity of the loan and lease portfolio and respond to external pressures. We engage outside firms on a regular basis to assess our methodology and perform independent credit reviews of our loan and lease portfolio. In addition, the Company’s external auditors, the FDIC, and the California DFI review the allowance for loan and lease losses as an integral part of their audit and examination processes.
48
Table of Contents
Management believes that the current methodology is appropriate given our size and level of complexity. The table that follows summarizes the activity in the allowance for loan and lease losses for the periods indicated:
49
Table of Contents
Allowance For Loan Losses and Leases
| As of and for the years ended December 31, | ||||||||||||||||||||
| (dollars in thousands) | 2010 | 2009 | 2008 | 2007 | 2006 | |||||||||||||||
| Balances: |
||||||||||||||||||||
| Avg. gross loans and leases outstanding during period |
$ | 851,292 | $ | 926,326 | $ | 931,382 | $ | 903,046 | $ | 824,041 | ||||||||||
| Gross loans and leases outstanding at end of period |
$ | 805,540 | $ | 884,606 | $ | 946,640 | $ | 924,633 | $ | 888,008 | ||||||||||
| Allowance for Loan and Lease Losses: |
||||||||||||||||||||
| Balance at beginning of period |
$ | 23,715 | $ | 15,094 | $ | 12,276 | $ | 11,579 | $ | 9,330 | ||||||||||
| Provision Charged to Expense |
16,680 | 21,574 | 19,456 | 3,252 | 3,851 | |||||||||||||||
| Charge-offs |
||||||||||||||||||||
| Real Estate |
||||||||||||||||||||
| 1-4 family residential construction |
1,706 | 536 | 1,375 | 148 | — | |||||||||||||||
| Other Construction/Land |
4,579 | 2,599 | 7,453 | 202 | — | |||||||||||||||
| 1-4 Family - closed-end |
1,400 | 1,649 | 459 | 17 | — | |||||||||||||||
| Equity Lines |
596 | 695 | 608 | 357 | — | |||||||||||||||
| Multi-Family residential |
97 | — | — | — | — | |||||||||||||||
| Commercial RE - owner occupied |
946 | 26 | 66 | — | — | |||||||||||||||
| Commercial RE - non-owner occupied |
1,358 | — | — | — | — | |||||||||||||||
| Farmland |
27 | — | 60 | — | — | |||||||||||||||
| Subtotal Real Estate |
10,709 | 5,505 | 10,021 | 724 | — | |||||||||||||||
| Agricultural products |
— | 524 | — | 15 | — | |||||||||||||||
| Commercial and Industrial |
4,998 | 3,508 | 2,438 | 632 | 1,240 | |||||||||||||||
| Small Business Administration Loans |
293 | 143 | 558 | 34 | 61 | |||||||||||||||
| Direct Finance Leases |
646 | 97 | 255 | — | 4 | |||||||||||||||
| Consumer Loans |
3,691 | 4,622 | 3,936 | 2,134 | 796 | |||||||||||||||
| Consumer Credit Cards |
— | 5 | 17 | 139 | 332 | |||||||||||||||
| Total Charge-Offs |
20,337 | 14,404 | 17,225 | 3,678 | 2,433 | |||||||||||||||
| Recoveries |
||||||||||||||||||||
| Real Estate |
||||||||||||||||||||
| 1-4 family residential construction |
25 | 270 | 32 | — | — | |||||||||||||||
| Other Construction/Land |
13 | 242 | — | — | — | |||||||||||||||
| 1-4 Family - closed-end |
41 | 10 | — | — | — | |||||||||||||||
| Equity Lines |
41 | 2 | 3 | 28 | — | |||||||||||||||
| Multi-Family residential |
— | — | — | 49 | — | |||||||||||||||
| Commercial RE - owner occupied |
— | — | — | — | — | |||||||||||||||
| Commercial RE - non-owner occupied |
— | — | — | — | — | |||||||||||||||
| Farmland |
— | — | — | — | — | |||||||||||||||
| Subtotal Real Estate |
120 | 524 | 35 | 77 | — | |||||||||||||||
| Agricultural products |
— | — | — | — | 5 | |||||||||||||||
| Commercial and Industrial |
462 | 474 | 82 | 826 | 397 | |||||||||||||||
| Small Business Administration Loans |
63 | 75 | 154 | 36 | 42 | |||||||||||||||
| Direct Finance Leases |
159 | 103 | 38 | — | — | |||||||||||||||
| Consumer Loans |
274 | 262 | 255 | 134 | 301 | |||||||||||||||
| Consumer Credit Cards |
2 | 13 | 23 | 50 | 86 | |||||||||||||||
| Total Principal Recoveries |
1,080 | 1,451 | 587 | 1,123 | 831 | |||||||||||||||
| Net Loan and Lease Charge-offs |
19,257 | 12,953 | 16,638 | 2,555 | 1,602 | |||||||||||||||
| Balance at end of period |
$ | 21,138 | $ | 23,715 | $ | 15,094 | $ | 12,276 | $ | 11,579 | ||||||||||
| Ratios: |
||||||||||||||||||||
| Net Loan and Lease Charge-offs to Average Loans and Leases |
2.26 | % | 1.40 | % | 1.79 | % | 0.28 | % | 0.19 | % | ||||||||||
| Allowance for Loan and Lease Losses to Gross Loans and Leases at End of Period |
2.62 | % | 2.68 | % | 1.59 | % | 1.33 | % | 1.30 | % | ||||||||||
| Allowance for Loan and Lease Losses to Non-Performing Loans and Leases |
46.00 | % | 50.49 | % | 50.67 | % | 135.62 | % | 1680.55 | % | ||||||||||
| Net Loan and Lease Charge-offs to Allowance for Loan and Lease Losses at End of Period |
91.10 | % | 54.62 | % | 110.23 | % | 20.81 | % |
|
13.84 |
% | |||||||||
| Net Loan and Lease Charge-offs to Provision for Loan and Lease Losses |
115.45 | % | 60.04 | % | 85.52 | % | 78.57 | % | 41.60 | % | ||||||||||
50
Table of Contents
The Company’s provision for loan and lease losses fell by $4.9 million, or 23%, in 2010 relative to 2009. On the surface, the decline in our loan loss provision appears directionally inconsistent with net charge-offs, which increased $6.3 million, or 49%, for the comparative periods. However, as previously discussed, many of the loan charge-offs were against specific reserves that had been established in prior periods and thus did not create the need for reserve replenishment. Real estate loan charge-offs experienced the largest increase among our principal loan categories, rising by $5.2 million, or 95%, for the comparative periods, due mainly to write-downs subsequent to the determination that certain balances had become uncollectible. As noted above, we have taken a total of $4.3 million in write-downs on collateral-dependent loans still on our books at December 31, 2010, most of which were on construction and land loans. Charge-offs in other categories were also up in 2010, including increases of $1.5 million, or 42%, for commercial loans, $150,000, or 105%, for SBA loans, and $549,000, or 566%, for direct finance leases. Consumer loan charge-offs, on the other hand, declined by $931,000, or 20%. Principal recoveries on real estate loans were down by $404,000, or 77%, in 2010 relative to 2009, but material changes in the level of principal recoveries are not evident in other loan categories. Since our allowance for loan and lease losses is maintained at a level to cover probable losses related to specifically identified loans as well as probable incurred losses in the remaining loan portfolio, any shortfall in the allowance created by loan charge-offs is typically covered by month-end, and always by quarter-end. Additional details on our provision for loan and lease losses, and its relationship to actual charge-offs, is contained above in the “Provision for Loan and Lease Losses” section.
Provided below is a summary of the allocation of the allowance for loan and lease losses for specific loan categories at the dates indicated. The allocation presented should not be viewed as an indication that charges to the allowance will be incurred in these amounts or proportions, or that the portion of the allowance allocated to each loan category represents the total amounts available for charge-offs that may occur within these categories.
Allocation of Loan and Lease Loss Allowance
| As of December 31, | ||||||||||||||||||||||||||||||||||||||||
| 2010 | 2009 | 2008 | 2007 | 2006 | ||||||||||||||||||||||||||||||||||||
| (dollars in thousands) | Amount | % Total
(1) Loans |
Amount | % Total
(1) Loans |
Amount | % Total
(1) Loans |
Amount | % Total
(1) Loans |
Amount | % Total
(1) Loans |
||||||||||||||||||||||||||||||
| Agricultural |
$ | 62 | 1.67 | % | $ | 10 | 1.12 | % | $ | 17 | 1.42 | % | $ | 911 | 1.42 | % | $ | 1,496 | 1.49 | % | ||||||||||||||||||||
| Comm’l and Industrial (2) |
7,653 | 14.08 | % | 7,006 | 15.32 | % | 4,922 | 15.03 | % | 1,808 | 14.88 | % | 1,470 | 15.71 | % | |||||||||||||||||||||||||
| Real Estate |
10,143 | 77.32 | % | 12,348 | 75.38 | % | 6,839 | 74.50 | % | 8,294 | 75.29 | % | 6,866 | 73.43 | % | |||||||||||||||||||||||||
| Consumer Loans |
2,996 | 5.66 | % | 3,752 | 6.44 | % | 3,129 | 6.95 | % | 1,018 | 5.92 | % | 1,077 | 6.14 | % | |||||||||||||||||||||||||
| Direct Financing Leases |
284 | 1.27 | % | 599 | 1.74 | % | 187 | 2.10 | % | 245 | 2.50 | % | 212 | 2.27 | % | |||||||||||||||||||||||||
| Consumer Credit Cards |
— | 0.00 | % | — | 0.00 | % | — | 0.00 | % | — | 0.00 | % | 458 | 0.95 | % | |||||||||||||||||||||||||
| TOTAL |
$ | 21,138 | 100.00 | % | $ | 23,715 | 100.00 | % | $ | 15,094 | 100.00 | % | $ | 12,276 | 100.00 | % | $ | 11,579 | 100.00 | % | ||||||||||||||||||||
| (1) | Represents percentage of loans in category to total loans. |
| (2) | Includes Small Business Administration loans. |
The Company’s allowance for loan and lease losses at December 31, 2010 represents management’s best estimate of probable loan losses related to specifically identified loans, as well as probable incurred loan losses in the remaining loan portfolio. Fluctuations in credit quality, changes in economic conditions, or other factors could induce us to augment the allowance, however, and no assurance can be given that the Company will not experience substantial losses relative to the size of the allowance.
Investments
The Company’s investments consist of debt and marketable equity securities (together, the “investment portfolio”), investments in the time deposits of other banks, and overnight fed funds sold. Fed funds sold represent the investment of temporary excess liquidity with one or more correspondent banks. The Company’s investments serve several purposes: 1) they provide liquidity to even out cash flows from the loan and deposit activities of customers; 2) they provide a source of pledged assets for securing public deposits, bankruptcy deposits and certain borrowed funds which require collateral; 3) they constitute a large base of assets with maturity and interest rate characteristics that can be changed more readily than the loan portfolio, to better match changes in the deposit base and other funding sources of the Company; 4) they are an alternative interest-earning use of funds when loan demand is light; and 5) certain types of bonds can provide tax-exempt income. Aggregate investments were 26% of total assets at December 31, 2010, and 23% at December 31, 2009.
51
Table of Contents
We had $210,000 in fed funds outstanding at December 31, 2010, and none at December 31, 2009. Furthermore, our interest-bearing balances at other banks totaled only $325,000 at December 31, 2010, down substantially from the $32 million balance at the end of 2009. The balance was relatively high at year-end 2009, because excess balance sheet liquidity was placed in our Federal Reserve Bank account at higher yields than could be realized by selling fed funds. The book balance of the Company’s investment portfolio increased by $54 million, or 19%, during 2010, as the excess liquidity that was parked in our Federal Reserve Bank account at year-end was redeployed into longer-term, higher-yielding investment securities and some of the cash inflow from our loan runoff was invested. Although the Company currently has the intent and the ability to hold the securities in its investment portfolio to maturity, the securities are all marketable and are classified as “available for sale” to allow maximum flexibility with regard to interest rate risk and liquidity management. Pursuant to FASB’s guidance on accounting for debt and equity securities, available for sale securities are carried on the Company’s financial statements at their estimated fair market value, with monthly tax-effected “mark-to-market” adjustments made vis-à-vis accumulated other comprehensive income in shareholders’ equity. The following Investment Portfolio table reflects the amortized cost and fair market values for the total portfolio for each primary category of investments for the past three years.
Investment Portfolio-Available for Sale
| As of December 31, | ||||||||||||||||||||||||
| 2010 | 2009 | 2008 | ||||||||||||||||||||||
| (dollars in thousands) | Amortized Cost |
Fair Market Value |
Amortized Cost |
Fair Market Value |
Amortized Cost |
Fair Market Value |
||||||||||||||||||
| US Treasury Securities |
$ | — | $ | — | $ | — | $ | — | $ | 500 | $ | 503 | ||||||||||||
| US Government Agencies & Corporations |
4,954 | 5,062 | 6,728 | 6,861 | 9,565 | 9,891 | ||||||||||||||||||
| Mortgage-backed securities |
252,320 | 255,143 | 201,534 | 206,801 | 170,604 | 173,820 | ||||||||||||||||||
| State & political subdivisions |
70,201 | 70,102 | 62,506 | 63,138 | 58,346 | 57,427 | ||||||||||||||||||
| Equity securities |
2,705 | 1,423 | 2,705 | 1,368 | 2,705 | 1,772 | ||||||||||||||||||
| Total Investment Securities |
$ | 330,180 | $ | 331,730 | $ | 273,473 | $ | 278,168 | $ | 241,720 | $ | 243,413 | ||||||||||||
Mortgage-backed securities were the principal investment vehicle for bond purchases in 2010, and thus increased by $48 million, or 23%, net of prepayments, during the year. As noted above, the Company sold $66 million in mortgage-backed securities in the third quarter of 2010, realizing $2.6 million in gains. We reinvested the proceeds in similar but larger-denominated agency-issued mortgage-backed securities, which have slightly lower yields and a slightly longer average duration. The balance of municipal bonds increased by $7 million, or 11%, as the Company has also taken advantage of relative value in that sector in 2010. It should be noted that all newly purchased municipal bonds have strong underlying ratings. US Government Agency securities fell by $2 million, because maturing balances were not replaced. No equity securities were bought or sold during 2010, although the market value of those securities declined slightly. Investment portfolio securities that were pledged as collateral for FHLB borrowings, repurchase agreements, public deposits and for other purposes as required or permitted by law totaled $146 million at December 31, 2010 and $213 million at December 31, 2009, leaving $185 million in unpledged debt securities at December 31, 2010 and $64 million at December 31, 2009. Securities pledged in excess of actual pledging needs, and thus available for liquidity purposes if needed, totaled $103 million at December 31, 2010 and $17 million at December 31, 2009. The large increase in our unpledged and excess pledged securities is the result of an FHLB letter of credit that was obtained in the second quarter of 2010 to satisfy certain pledging needs, freeing up investment securities that were previously used for that purpose.
The investment maturities table below summarizes contractual maturities for the Company’s investment securities and their weighted average yields at December 31, 2010. The actual timing of principal payments may differ from remaining contractual maturities, because obligors may have the right to repay certain obligations.
52
Table of Contents
Maturity and Yield of Available for Sale Investment Portfolio
| December 31, 2010 | ||||||||||||||||||||||||||||||||||||||||
| Within One Year |
After One But Within Five Years |
After Five Years But Within Ten Years |
After Ten Years |
Total | ||||||||||||||||||||||||||||||||||||
| (dollars in thousands) | Amount | Yield | Amount | Yield | Amount | Yield | Amount | Yield | Amount | Yield | ||||||||||||||||||||||||||||||
| US Gov’t agencies |
$ | 1,523 | 2.00 | % | $ | 3,539 | 3.31 | % | $ | — | — | $ | — | — | $ | 5,062 | 2.92 | % | ||||||||||||||||||||||
| Mortgage-backed securities |
1,809 | 1.90 | % | 245,457 | 3.33 | % | 7,877 | 3.65 | % | — | — | 255,143 | 3.33 | % | ||||||||||||||||||||||||||
| State & political subdivisions |
2,946 | 5.93 | % | 9,515 | 5.80 | % | 37,321 | 5.85 | % | 20,320 | 6.07 | % | 70,102 | 5.91 | % | |||||||||||||||||||||||||
| Other equity securities |
— | — | — | — | — | — | 1,423 | 0.64 | % | 1,423 | 0.64 | % | ||||||||||||||||||||||||||||
| Total Investment Securities |
$ | 6,278 | $ | 258,511 | $ | 45,198 | $ | 21,743 | $ | 331,730 | ||||||||||||||||||||||||||||||
Cash and Due from Banks
Cash on hand and non-interest bearing balances due from correspondent banks totaled $42 million at the end of 2010 and $34 million at the end of 2009, comprising 3% of total assets at December 31, 2010 and 2009. Since the actual balance of cash and due from banks depends on the timing of collection of outstanding cash items, it is subject to significant fluctuation in the normal course of business. While cash flows are normally predictable within limits, those limits are fairly broad and the Company manages its short-term cash position through the utilization of overnight loans to and borrowings from correspondent banks, including the Federal Reserve Bank and the Federal Home Loan Bank. Should a large “short” overnight position persist for any length of time, the Company typically raises money through focused retail deposit gathering efforts or by adding brokered time deposits. If a “long” position is prevalent, the Company will let brokered deposits or other wholesale borrowings roll off as they mature, or might invest excess liquidity in higher-yielding, longer-term bonds. Since cash balances fluctuate frequently and often by large amounts, period-end balances are not ideal indicators of trends in cash and due from banks. Annual average balances provide a much more appropriate gauge, and the average balance for 2010 was $33 million, up from $32 million in 2009 due primarily to cash for our new branches opened in the fourth quarter of 2009 and the first quarter of 2010. Our average cash balance is expected to continue to increase as we add more branches in the future.
Premises and Equipment
Premises and equipment are stated at cost, less accumulated depreciation and amortization. Depreciation is charged to income over the estimated useful lives of the assets, and leasehold improvements are amortized over the term of the related lease or the estimated useful life of the improvements, whichever is shorter. Depreciation and amortization included in occupancy and equipment expense was $2.5 million for the year ended December 31, 2010, as compared to $2.7 million in 2009 and $2.6 million in 2008. Depreciation on equipment leased to others is reflected in other operating costs. The following premises and equipment table reflects the balances of fixed assets by major category:
Premises and Equipment
| As of December 31, | ||||||||||||||||||||||||||||||||||||
| 2010 | 2009 | 2008 | ||||||||||||||||||||||||||||||||||
| (dollars in thousands) | Cost | Accum. Depr. & Amort. |
Net Book Value |
Cost | Accum. Depr. & Amort. |
Net Book Value |
Cost | Accum. Depr. & Amort. |
Net Book Value |
|||||||||||||||||||||||||||
| Land |
$ | 2,549 | $ | — | $ | 2,549 | $ | 2,549 | $ | — | $ | 2,549 | $ | 2,289 | $ | — | $ | 2,289 | ||||||||||||||||||
| Buildings |
12,322 | 5,548 | 6,774 | 11,720 | 5,111 | 6,609 | 11,358 | 4,717 | 6,641 | |||||||||||||||||||||||||||
| Leasehold improvements |
9,880 | 3,389 | 6,491 | 9,871 | 2,851 | 7,020 | 8,414 | 2,338 | 6,076 | |||||||||||||||||||||||||||
| Construction in progress |
1,033 | — | 1,033 | 84 | — | 84 | 120 | — | 120 | |||||||||||||||||||||||||||
| Furniture and equipment |
21,378 | 18,035 | 3,343 | 22,902 | 19,095 | 3,807 | 21,786 | 17,632 | 4,154 | |||||||||||||||||||||||||||
| Total |
$ | 47,162 | $ | 26,972 | $ | 20,190 | $ | 47,126 | $ | 27,057 | $ | 20,069 | $ | 43,967 | $ | 24,687 | $ | 19,280 | ||||||||||||||||||
Net premises and equipment increased by only $121,000, or less than 1%, during 2010, since additions related to improvements on our new Farmersville branch were largely offset by the increase in accumulated depreciation on other buildings and equipment. The net book value of the Company’s premises and equipment increased by
53
Table of Contents
$789,000 in 2009, due mainly to the purchase of equipment for, and the capitalization of construction and leasehold improvement costs associated with, our newer branches, net of the increase in accumulated depreciation on all other buildings and equipment. The net book value of the Company’s aggregate premises and equipment was 1.6% of total assets at the end of 2010, relative to 1.5% at the end of 2009 and 2008.
Other Assets
The Company’s intangible assets, shown as a separate line item on the balance sheet, totaled $5.5 million at December 31, 2010 and 2009 and consists solely of goodwill that was generated in connection with our acquisition of Sierra National Bank in 2000. We analyze that goodwill annually for potential impairment. The Company’s fair value was evaluated as of December 31, 2010, and because the estimated fair value of the Company exceeded its book value (including goodwill) as of the measurement date and no impairment was indicated, no further testing was deemed necessary and it was determined that no goodwill impairment exists. The line item for “other assets” on the Company’s balance sheet totaled over $80 million at December 31, 2010, and had as its largest components $8.4 million in restricted stock, $5.7 million in accrued interest receivable, a $13.5 million net deferred tax asset, a $10.3 million investment in low-income housing tax credit funds, $31.6 million in bank-owned life insurance (BOLI), and a $4.3 million prepaid asset for future FDIC assessments. Other assets increased by $2.4 million, or 3%, in 2010, and were about 6% of total assets at the end of 2010 and 2009. The largest changes in the items comprising other assets are explained below.
As noted above, the Company holds certain equity investments that are not readily marketable securities and thus are classified as restricted stock in “other assets” on the Company’s balance sheet. These include investments in Pacific Coast Bankers Bancshares, California Economic Development Lending Initiative, and the FHLB. The largest of the referenced investments is the Company’s $8.0 million investment in FHLB stock. FHLB stock typically experiences balance fluctuations in conjunction with our level of FHLB borrowings, but the FHLB of San Francisco temporarily suspended their stock repurchase activities for a period of time as part of a capital preservation policy and our investment remained in the $9 million range during 2008 and 2009 even though our borrowings declined. Since the FHLB reinstituted repurchases at reduced levels in 2010, our FHLB stock investment was reduced by $1.0 million during 2010. Since future repurchases are subject to the FHLB’s ability to maintain targeted capital levels, however, our FHLB stock investment could remain at current levels for an indeterminable period of time. This stock is not deemed to be marketable or liquid and is thus not grouped with the Company’s investments described above.
Low-income housing tax credit funds lower the Company’s tax liability through direct tax credits as well as partnership operating losses. Pass-through partnership losses from tax credit funds are charged against the Company’s investment in such funds, and a drop of $854,000 in fund balances in 2010 is the result of such charges. The investment has been written down from an aggregate original total of $18.4 million to $10.3 million at December 31, 2010. Even taking losses into consideration and assuming no gain upon disposition, the estimated tax-equivalent return on most of these investments over their expected 15-year life is around 11%, although no guarantee can be provided that this level of return will ultimately be realized.
BOLI balances increased by $1.5 million in 2010, due to gains recorded on BOLI “investments.” BOLI is an insurance policy with a single premium paid at policy commencement. Its initial net cash surrender value is equivalent to the premium paid, and it produces income through non-taxable increases in its cash surrender value, net of the cost of insurance, plus any death benefits ultimately received by the Company. The expenses of certain benefit plans are offset by BOLI income.
Our net deferred tax asset increased $4.2 million in 2010, due mainly to increases in deferred tax assets stemming from interim write-downs on OREO and impaired real estate loans, as well as deferred compensation. The Company’s net deferred tax asset is primarily due to temporary book/tax differences in the reported allowance for loan losses, interim write-downs on OREO and impaired real estate loans, and deferred compensation, which are reflected on our books net of deferred tax liabilities comprised mainly of fixed asset and true lease depreciation differences and deferred loan origination costs. Most of the Company’s temporary book/tax differences involve recognizing more expense in its financial statements than it has been allowed to deduct for current-period taxes; therefore, the Company’s deferred tax assets typically exceed its deferred tax liabilities. Management has evaluated all deferred
54
Table of Contents
tax assets, and concluded that neither the quality of the deferred tax assets nor the Company’s future taxable income potential would preclude full realization of all amounts in future years.
Deposits
Another key balance sheet component impacting the Company’s net interest margin is our deposit base. Deposits provide liquidity to fund growth in earning assets, and the Company’s net interest margin is improved to the extent that growth in deposits is concentrated in less volatile and typically less costly core deposits, which include demand deposit accounts, interest-bearing demand accounts (NOW accounts), savings accounts, money market demand accounts (MMDA’s), and non-brokered time deposits under $100,000. Information concerning average balances and rates paid on deposits by deposit type for the past three fiscal years is contained in the Distribution, Rate, and Yield table located in the previous section on Results of Operations–Net Interest Income and Net Interest Margin. A comparative distribution of the Company’s deposits at December 31st for each year from 2006 through 2010, by outstanding balance as well as by percentage of total deposits, is presented in the following table:
Deposit Distribution
| As of December 31, | ||||||||||||||||||||
| (dollars in thousands) | 2010 | 2009 | 2008 | 2007 | 2006 | |||||||||||||||
| Demand |
$ | 251,908 | $ | 233,204 | $ | 232,168 | $ | 243,764 | $ | 281,024 | ||||||||||
| NOW |
184,360 | 151,821 | 100,949 | 86,936 | 64,599 | |||||||||||||||
| Savings |
74,682 | 62,279 | 55,373 | 51,442 | 62,922 | |||||||||||||||
| Money Market |
156,170 | 165,097 | 146,896 | 126,347 | 115,266 | |||||||||||||||
| CDAR’s < $100,000 |
1,614 | 12,937 | 49,296 | 9,159 | 7,528 | |||||||||||||||
| CDAR’s ³ $100,000 |
31,652 | 129,194 | 63,364 | — | — | |||||||||||||||
| Time deposit < $100,000 |
164,223 | 147,390 | 115,303 | 128,933 | 121,095 | |||||||||||||||
| Time deposits ³ $100,000 |
187,665 | 195,510 | 182,649 | 148,566 | 136,011 | |||||||||||||||
| Brokered Deposits |
— | 28,000 | 115,500 | 55,000 | 80,000 | |||||||||||||||
| Total Deposits |
$ | 1,052,274 | $ | 1,125,432 | $ | 1,061,498 | $ | 850,147 | $ | 868,445 | ||||||||||
| Percentage of Total Deposits |
||||||||||||||||||||
| Demand |
23.94 | % | 20.72 | % | 21.87 | % | 28.67 | % | 32.36 | % | ||||||||||
| NOW |
17.52 | % | 13.49 | % | 9.51 | % | 10.22 | % | 7.44 | % | ||||||||||
| Savings |
7.10 | % | 5.53 | % | 5.22 | % | 6.05 | % | 7.25 | % | ||||||||||
| Money Market |
14.84 | % | 14.67 | % | 13.84 | % | 14.86 | % | 13.27 | % | ||||||||||
| CDAR’s < $100,000 |
0.15 | % | 1.15 | % | 4.64 | % | 1.08 | % | 0.87 | % | ||||||||||
| CDAR’s ³ $100,000 |
3.01 | % | 11.48 | % | 5.97 | % | 0.00 | % | 0.00 | % | ||||||||||
| Time deposit < $100,000 |
15.61 | % | 13.10 | % | 10.86 | % | 15.17 | % | 13.94 | % | ||||||||||
| Time deposits ³ $100,000 |
17.83 | % | 17.37 | % | 17.21 | % | 17.48 | % | 15.66 | % | ||||||||||
| Brokered Deposits |
0.00 | % | 2.49 | % | 10.88 | % | 6.47 | % | 9.21 | % | ||||||||||
| Total |
100.00 | % | 100.00 | % | 100.00 | % | 100.00 | % | 100.00 | % | ||||||||||
Furthermore, the scheduled maturity distribution of the Company’s time deposits at the end of 2010 was as follows:
Deposit Maturity Distribution
| As of December 31, 2010 | ||||||||||||||||||||||||
| (dollars in thousands) | Three months or less |
Three to six months |
Six to twelve months |
One to three years |
Over three Years |
Total | ||||||||||||||||||
| CDAR’s |
$ | 15,741 | $ | 1,483 | $ | 16,042 | $ | — | $ | — | $ | 33,266 | ||||||||||||
| Time Certificates of Deposit < $100,000 |
72,632 | 37,711 | 43,494 | 9,376 | 1,010 | 164,223 | ||||||||||||||||||
| Other Time Deposits ³ $100,000 |
148,931 | 18,068 | 17,188 | 3,332 | 146 | 187,665 | ||||||||||||||||||
| TOTAL |
$ | 237,304 | $ | 57,262 | $ | 76,724 | $ | 12,708 | $ | 1,156 | $ | 385,154 | ||||||||||||
Total deposit balances dropped by $73 million, or 7%, during 2010, but our deposit mix has substantially improved with migration out of brokered deposits and jumbo time deposits into core deposits. Core non-maturity deposits were up by $55 million, or 9%, due in part to our aggressive deposit acquisition programs: Direct mail initiatives continue to provide top-of-mind brand and product awareness for businesses and consumers who might be considering a
55
Table of Contents
transition in banking relationships; we have added, or have plans to add, deposit account features that provide value and convenience for our customers, such as mobile banking, e-statements, debit rewards and instant-issue debit cards; and, certain Bank personnel have been specifically assigned to focus on business deposits, which has favorably impacted growth in non-interest bearing demand accounts. During 2010, non-interest bearing demand deposits rose $19 million, or 8%, NOW deposits grew by $33 million, or 21%, savings deposits were up $12 million, or 20%, while money market deposit balances declined by $9 million, or 5%. Time deposits under $100,000, which are also classified as core deposits, increased by $17 million, or 11%. The increase in time deposits under $100,000 would have been greater, but due to the lack of balance sheet growth we have not had the need to renew certain time deposits managed by our Treasury Department.
Non-core deposits reflect significant reductions: Time deposits over $100,000 declined by $8 million, or 4%, and CDAR’s deposits, which are primarily sourced from customers in our market areas, declined by a combined total of almost $109 million, or 77%. The decline in jumbo time deposits and CDARS is due primarily to the fact that we have managed down balances from larger depositors, to help minimize our exposure to potential single-customer withdrawals and better control our liquidity position. Wholesale-sourced brokered deposits were also reduced by $28 million during 2010, to a balance of zero at December 31, 2010. Management has recently contemplated the addition of longer-term brokered deposits, however, to help extend the duration of interest-sensitive liabilities and better position our balance sheet for the possibility of rising rates.
Management recognizes that maintaining a high level of core customer deposits is one of the keys to sustaining a strong net interest margin, and as noted we continue to focus energy in that direction. Our deposit-centric marketing efforts appear to be having a positive impact, with an inflow of deposit dollars from current customers who are placing renewed value on the safety and security of insured deposits, as well as from new customers who have sought a more stable and secure option for their money. However, no assurance can be provided that these favorable trends will continue.
Other Borrowings
The Company’s other borrowings include long-term borrowings, which typically have a remaining maturity of one year or more, and short-term borrowings that reach maturity in less than one year. The aggregate balance of other borrowed money was almost the same at the end of 2010 as at the end of 2009, although there was net reduction in other borrowings in 2009 that was enabled by strong growth in customer deposits and an increase in shareholders’ equity.
Long-term borrowings consist of advances from the FHLB, and the junior subordinated debentures of trust subsidiaries that were formed specifically to issue trust-preferred securities (see the Capital Resources section for a more detailed explanation of trust-preferred securities). The Company had $15 million in long-term FHLB borrowings on its balance sheet at December 31, 2010, down from $20 million at December 31, 2009. The drop was due to $5 million in FHLB borrowings that moved into the short-term category, as their remaining term declined to less than one year. Junior subordinated debentures were unchanged during 2010, ending the year at $31 million.
Short-term borrowings are comprised of overnight borrowings from other banks (“fed funds purchased”), short-term and overnight advances from the FHLB, and securities sold under agreement to repurchase. The Company uses FHLB advances and overnight fed funds purchased from correspondent banks to support liquidity needs created by seasonal deposit flows, to temporarily satisfy funding needs from increased loan demand, and for other short-term purposes. Uncommitted lines are available from several correspondent banks. The FHLB line is committed, but the amount of available credit is dependent on the level of pledged collateral. The details of the Company’s short-term borrowings for the years 2010, 2009, and 2008 are presented below:
56
Table of Contents
Short-term Borrowings
| (dollars in thousands) | 2010 | 2009 | 2008 | |||||||||
| Repurchase Agreements |
||||||||||||
| Balance at December 31 |
$ | — | $ | — | $ | 24,419 | ||||||
| Average amount outstanding |
$ | — | $ | 14,909 | $ | 25,935 | ||||||
| Maximum amount outstanding at any month end |
$ | — | $ | 27,315 | $ | 29,445 | ||||||
| Average interest rate for the year |
0.00 | % | 0.23 | % | 0.36 | % | ||||||
| Fed funds purchased |
||||||||||||
| Balance at December 31 |
$ | — | $ | — | $ | — | ||||||
| Average amount outstanding |
$ | 3 | $ | 295 | $ | 16,657 | ||||||
| Maximum amount outstanding at any month end |
$ | — | $ | 35 | $ | 38,300 | ||||||
| Average interest rate for the year |
0.32 | % | 0.34 | % | 2.05 | % | ||||||
| FHLB advances |
||||||||||||
| Balance at December 31 |
$ | 14,650 | $ | 10,000 | $ | 59,500 | ||||||
| Average amount outstanding |
$ | 16,044 | $ | 20,127 | $ | 117,195 | ||||||
| Maximum amount outstanding at any month end |
$ | 44,900 | $ | 48,800 | $ | 201,700 | ||||||
| Average interest rate for the year |
1.18 | % | 1.93 | % | 2.49 | % | ||||||
| Fed Discount Window |
||||||||||||
| Balance at December 31 |
$ | — | $ | — | $ | — | ||||||
| Average amount outstanding |
$ | — | $ | 13 | $ | — | ||||||
| Maximum amount outstanding at any month end |
$ | — | $ | — | $ | — | ||||||
| Average interest rate for the year |
0.00 | % | 0.00 | % | 0.00 | % | ||||||
Repurchase agreements, which represent “sweep accounts”, or non-deposit investment accounts secured by pledged investment securities, had a balance of zero at the end of 2010 and 2009, down from a $24 million balance at the end of December 2008 due to the migration of the balance into a money market sweep account in 2009. There were no overnight fed funds purchased at the end of 2010, 2009 or 2008. Overnight FHLB advances totaled $10 million at the end 2010, up from a zero balance at the end of 2009, although other short-term FHLB advances declined by $5 million, to a balance of $5 million at the end of 2010.
Capital Resources
At December 31, 2010, the Company had total shareholders’ equity of $159.6 million, comprised of $63.5 million in common stock, $1.7 million in additional paid-in capital, $93.6 million in retained earnings, and $898,000 in accumulated other comprehensive income. Total shareholders’ equity at the end of 2009 was $134.5 million. The $25.1 million increase in shareholders’ equity during 2010 was due in large part to the addition of $22.0 million in capital from our registered direct offering of common stock in October 2010, as previously discussed, in addition to net earnings of $7.4 million less $2.9 million in dividends paid. Total capital was also supplemented by increases related to stock options. Accumulated other comprehensive income, representing the mark-to-market differential of our investment securities (net of the tax impact), was $1.8 million lower.
The Company uses a variety of measures to evaluate its capital adequacy, including risk-based capital and leverage ratios that are calculated separately for the Company and the Bank. Management reviews these capital measurements on a quarterly basis and takes appropriate action to ensure that they meet or surpass established internal and external guidelines. At December 31, 2010, the Company had a total capital to risk-weighted assets ratio of 20.33%, a Tier 1 risk based capital ratio of 19.06%, and a leverage ratio of 13.84%. Because of growth in capital, due in large part to the issuance of additional common stock, plus a drop in risk-adjusted assets, we saw a sizeable increase over the prior year-end ratios of 16.67% for total capital to risk-weighted assets, 15.41% for Tier 1 capital to risk-weighted assets, and 11.91% for the leverage ratio. Note 13, in the Notes to the Consolidated Financial Statements, provides additional information concerning the Company’s capital amounts and ratios. At December 31, 2010, on a stand-alone
57
Table of Contents
basis, the Bank had a total risk-based capital ratio of 19.31%, a Tier 1 risk-based capital ratio of 18.04%, and a leverage ratio of 13.07%.
As of the end of 2010, the Company and the Bank were both classified as “well capitalized,” the highest rating of the categories defined under the Bank Holding Company Act and the Federal Deposit Insurance Corporation Improvement Act (FDICIA) of 1991. We do not foresee any circumstances that would cause the Company or the Bank to be less than “well capitalized”, although no assurance can be given that this will not occur. For additional details on risk-based and leverage capital guidelines, requirements, and calculations, see “Item 1, Business – Supervision and Regulation – Capital Adequacy Requirements” and “Item 1, Business – Supervision and Regulation – Prompt Corrective Action Provisions” herein.
Liquidity and Market Risk Management
Liquidity
Liquidity refers to the Company’s ability to maintain cash flows that are adequate to fund operations and meet other obligations and commitments in a timely and cost-effective manner. The Company manages its liquidity in such a fashion as to be able to meet any unexpected changes in cash needs. Detailed cash flow projections are prepared on a monthly basis, with various scenarios applied to simulate our ability to meet liquidity needs under adverse conditions, and liquidity ratios are also calculated and reviewed on a regular basis. While these ratios are merely indicators and are not measures of actual liquidity, they are monitored closely and we are focused on maintaining adequate liquidity resources to draw upon should the need arise. The Company’s primary liquidity and average loans to assets ratios were 36% and 61%, respectively, at December 31, 2010, as compared to internal policy guidelines of “greater than 8%” and “less than 78%.” The liquidity ratio is calculated with the balance of cash and due from banks, plus available investment securities and committed available-for-sale loans as the numerator, and non-collateralized deposits and short-term liabilities as the denominator. Other liquidity ratios reviewed by management and the Board include average net loans to core deposits, net non-core funding dependence, and reliance on wholesale funding, all of which were well within policy guidelines at December 31, 2010.
The Company, on occasion, experiences short-term cash needs as the result of loan growth or deposit outflows, or other asset purchases or liability repayments. To meet short-term needs, the Company can borrow overnight funds from other financial institutions, or solicit brokered deposits if deposits are not immediately obtainable from local sources. Availability on lines of credit from correspondent banks, including the Federal Home Loan Bank, totaled $121 million at December 31, 2010. An additional $116 million in credit is available from the Federal Home Loan Bank if the Company pledges additional real-estate related collateral in a like amount and maintains the required amount of FHLB stock. The Company is also eligible to borrow approximately $69 million at the Federal Reserve Discount Window, if necessary, based on pledged assets at December 31, 2010. Further, funds can be obtained by drawing down the Company’s correspondent bank deposit accounts, or by liquidating unpledged investments or other readily saleable assets. In addition, the Company can raise immediate cash for temporary needs by selling under agreement to repurchase those investments in its portfolio which are not pledged as collateral. As of December 31, 2010, unpledged securities, plus pledged securities in excess of current pledging requirements, comprised $288 million of the Company’s investment portfolio balances. Other forms of balance sheet liquidity include but are not necessarily limited to fed funds sold and vault cash. The Company experienced a significant shift from contingent liquidity to actual balance sheet liquidity in 2010, due to the arrangement of a letter of credit from the FHLB for certain pledging requirements in place of investment securities. The FHLB letter of credit totaled $167 million at December 31, 2010. Strong growth in core deposits combined with loan runoff and growth in investments has also had a positive impact on our liquidity position in recent periods, although no assurance can be provided that this will continue to be the case. Management is of the opinion that its investments and other potentially liquid assets, along with other standby funding sources it has arranged, are more than sufficient to meet the Company’s current and anticipated liquidity needs.
58
Table of Contents
Interest Rate Risk Management
Market risk arises from changes in interest rates, exchange rates, commodity prices and equity prices. The Company does not engage in the trading of financial instruments, nor does it have exposure to currency exchange rates. Our market risk exposure is primarily that of interest rate risk, and we have established policies and procedures to monitor and limit our earnings and balance sheet exposure to changes in interest rates. The principal objective of interest rate risk management (sometimes referred to as “asset/liability management”) is to manage the financial components of the Company’s balance sheet in a manner that will optimize the risk/reward equation for earnings and capital in relation to changing interest rates. To identify areas of potential exposure to rate changes, the Company performs an earnings simulation analysis and a market value of portfolio equity calculation on a monthly basis.
The Company uses Sendero modeling software for asset/liability management in order to simulate the effects of potential interest rate changes on the Company’s net interest income, and to calculate the estimated fair values of the Company’s financial instruments under different interest rate scenarios. The program imports balances, interest rates, maturity dates and re-pricing information for individual financial instruments, and incorporates assumptions on the characteristics of embedded options along with pricing and duration for new volumes to project the effects of a given interest rate change on the Company’s interest income and interest expense. Rate scenarios consisting of key rate and yield curve projections are run against the Company’s investments, loans, deposits and borrowed funds. These rate projections can be shocked (an immediate and parallel change in all base rates, up or down), ramped (an incremental increase or decrease in rates over a specified time period), economic (based on current trends and econometric models) or stable (unchanged from current actual levels).
The Company uses seven standard interest rate scenarios in conducting its simulations: “stable,” upward shocks of 100, 200 and 300 basis points, and downward shocks of 100, 200, and 300 basis points. Our policy is to limit any projected decline in net interest income relative to the stable rate scenario for the next 12 months to less than 5% for a 100 basis point (b.p.) shock, 10% for a 200 b.p. shock, and 15% for a 300 b.p. shock in interest rates. Per updated regulatory guidance, we also apply an upward shock of 400 b.p. for net interest income simulations and include the results in internal management reports. As of December 31, 2010 the Company had the following estimated net interest income sensitivity profile, without factoring in any potential negative impact on spreads resulting from competitive pressures:
Immediate Change in Rate
| -300 b.p. | -200 b.p. | -100 b.p. | +100 b.p. | +200 b.p. | +300 b.p. | |||||||||||||||||||
| Change in Net Int. Inc. (in $000’s) |
-$ | 3,539 | -$ | -2,351 | -$ | 1,333 | -$ | 929 | -$ | 645 | +$ | 1,281 | ||||||||||||
| % Change |
-6.67 | % | -4.43 | % | -2.51 | % | -1.75 | % | -1.22 | % | +2.42 | % | ||||||||||||
Our current interest rate risk profile indicates that a drop in interest rates could have a negative impact on our net interest margin, although we consider the likelihood of further rate decreases to be minimal in the current environment. If there were an immediate and sustained downward adjustment of 100 basis points in interest rates, all else being equal, net interest income over the next twelve months would likely be $1.3 million lower, a drop of 2.51% compared to net interest income under a stable rate scenario. The unfavorable variance increases when rates drop 200 or 300 basis points, due to the fact that certain deposit rates which are already relatively low (on NOW accounts and savings accounts, for example), and rates on other low-cost interest-bearing liabilities, hit a natural floor of close to zero while variable-rate loan yields continue to drop. This effect is exacerbated by the fact that prepayments on fixed-rate loans tend to increase as rates decline, although our model assumptions include a presumed floor for our internal prime rate that partially offsets other negative pressures.
An increase in interest rates could also have an unfavorable effect on net interest income. However, if not for the fact that many of our variable-rate loans are currently at rate floors our balance sheet would be slightly asset-sensitive, meaning that, all else being equal, net interest income would increase as rates go up. Because of those rate floors, our model projects that if there were an immediate increase of up to 200 basis points in interest rates, the Company’s net interest income could be as much as $645,000 lower than in a flat rate scenario due to the re-pricing lag that occurs while variable rates are increasing to floored levels. As rates rise further and loan rates lift from their floors, net interest income will benefit.
59
Table of Contents
The economic (or “fair”) value of financial instruments on the Company’s balance sheet will also vary under the interest rate scenarios previously discussed. This variance is essentially a gauge of longer-term exposure to interest rate risk. It is measured by simulating changes in the Company’s economic value of equity (EVE), which is calculated by subtracting the fair value of liabilities from the fair value of assets. Fair values for financial instruments are estimated by discounting projected cash flows (principal and interest) at current replacement rates for each account type, while the fair value of non-financial accounts is assumed to equal book value for all rate scenarios. An economic value simulation is a static measure for balance sheet accounts at a given point in time, but this measurement can change substantially over time as the characteristics of the Company’s balance sheet evolve and as interest rate and yield curve assumptions are updated.
The amount of change in economic value under different interest rate scenarios depends on the characteristics of each class of financial instrument, including the stated interest rate or spread relative to current market rates or spreads, the likelihood of prepayment, whether the rate is fixed or floating, and the maturity date of the instrument. As a general rule, fixed-rate financial assets become more valuable in declining rate scenarios and less valuable in rising rate scenarios, while fixed-rate financial liabilities gain in value as interest rates rise and lose value as interest rates decline. The longer the duration of the financial instrument, the greater the impact a rate change will have on its value. In our economic value simulations, estimated prepayments are factored in for financial instruments with stated maturity dates, and decay rates for non-maturity deposits are projected based on historical patterns and management’s best estimates. We have found that model results are highly sensitive to changes in the assumed decay rate for non-maturity deposits, in particular. The table below shows estimated changes in the Company’s EVE as of December 31, 2010, under different interest rate scenarios relative to a base case of current interest rates:
Immediate Change in Rate
| -300 b.p. | -200 b.p. | -100 b.p. | +100 b.p. | +200 b.p. | +300 b.p. | |||||||||||||||||||
| Change in EVE (in $000’s) |
-$ | 52,379 | -$ | 57,507 | -$ | 27,937 | +$ | 6,054 | +$ | 28,364 | +$ | 13,429 | ||||||||||||
| % Change |
-16.72 | % | -18.36 | % | -8.92 | % | +1.93 | % | +9.05 | % | +4.29 | % | ||||||||||||
The table shows that our EVE will likely deteriorate in declining rate scenarios, but will generally benefit from rising rates. The changes in EVE are not symmetrical, however, due to the optionality inherent in certain financial instruments. Our EVE profile has changed substantially in recent months, moving from unfavorable exposure to a benefit under rising rates, due in part to recent model adjustments to non-maturity deposit decay rates in order to better reflect historical patterns. Effectively, lower decay rates mean that we have a longer period to benefit from these low-cost deposits, which are even more valuable when the cost of replacing them becomes greater, as would be the case in a rising rate environment. The updated EVE simulations also reflect greater exposure to declining rates, due in part to the acceleration of loan prepayments. In recent periods, we have intentionally focused on variable rate loans and longer-maturity funding in an attempt to benefit from the eventuality of rising rates, but this has also increased our exposure to declining rates.
ITEM 7A. QUANTITATIVE AND QUALITATIVE DISCLOSURES ABOUT MARKET RISK
The information concerning quantitative and qualitative disclosures of market risk called for by Item 305 of Regulation S-K is included as part of Item 7 above. See “Management’s Discussion and Analysis of Financial Condition and Results of Operations – Liquidity and Market Risk Management”.
60
Table of Contents
ITEM 8. FINANCIAL STATEMENTS AND SUPPLEMENTARY DATA
The following financial statements and independent auditors’ reports listed below are included herein:
61
Table of Contents
Report of Independent Registered Public Accounting Firm
Board of Directors
Sierra Bancorp and Subsidiary
Porterville, California
We have audited the accompanying consolidated balance sheets of Sierra Bancorp and Subsidiary (the “Company”) as of December 31, 2010 and 2009, and the related consolidated statements of income, changes in stockholders’ equity and cash flows for each of the three years in the period ended December 31, 2010. These consolidated financial statements are the responsibility of the Company’s management. Our responsibility is to express an opinion on these consolidated financial statements based on our audits.
We conducted our audits in accordance with the standards of the Public Company Accounting Oversight Board (United States). Those standards require that we plan and perform the audit to obtain reasonable assurance about whether the financial statements are free of material misstatement. An audit includes examining, on a test basis, evidence supporting the amounts and disclosures in the financial statements. An audit also includes assessing the accounting principles used and significant estimates made by management, as well as evaluating the overall financial statement presentation. We believe that our audits provide a reasonable basis for our opinion.
In our opinion, the consolidated financial statements referred to above present fairly, in all material respects, the financial position of Sierra Bancorp and Subsidiary as of December 31, 2010 and 2009, and the results of its operations, changes in its stockholders’ equity, and its cash flows for each of the three years in the period ended December 31, 2010, in conformity with U.S. generally accepted accounting principles.
We have also audited, in accordance with the standards of the Public Company Accounting Oversight Board (United States), the Company’s internal control over financial reporting as of December 31, 2010, based on criteria established in Internal Control – Integrated Framework issued by the Committee of Sponsoring Organizations of the Treadway Commission and our report dated March 10, 2011 expressed an unqualified opinion thereon.
| /s/ Vavrinek, Trine, Day & Co., LLP |
| Rancho Cucamonga, California |
| March 10, 2011 |
62
Table of Contents
CONSOLIDATED BALANCE SHEETS
December 31, 2010 and 2009
(Dollars in thousands)
| 2010 | 2009 | |||||||
| ASSETS | ||||||||
| Cash and due from banks |
$ | 42,110 | $ | 34,308 | ||||
| Federal funds sold |
210 | — | ||||||
| Interest-bearing deposits in banks |
325 | 31,926 | ||||||
| Cash and cash equivalents |
42,645 | 66,234 | ||||||
| Investment securities available-for-sale |
331,730 | 278,168 | ||||||
| Loans held-for-sale |
914 | 376 | ||||||
| Loans and leases, net of allowance for loan and lease losses of $21,138 in 2010 and $23,715 in 2009 |
783,601 | 859,875 | ||||||
| Premises and equipment, net |
20,190 | 20,069 | ||||||
| Operating leases, net |
904 | 1,680 | ||||||
| Foreclosed assets |
20,691 | 25,654 | ||||||
| Goodwill |
5,544 | 5,544 | ||||||
| Other assets |
80,352 | 77,949 | ||||||
| Total assets |
$ | 1,286,571 | $ | 1,335,549 | ||||
| LIABILITIES AND SHAREHOLDERS’ EQUITY |
||||||||
| Deposits: |
||||||||
| Non-interest bearing |
$ | 251,908 | $ | 233,204 | ||||
| Interest bearing |
800,366 | 892,228 | ||||||
| Total deposits |
1,052,274 | 1,125,432 | ||||||
| Short-term borrowings |
14,650 | 10,000 | ||||||
| Long-term borrowings |
15,000 | 20,000 | ||||||
| Subordinated debentures |
30,928 | 30,928 | ||||||
| Other liabilities |
14,122 | 14,709 | ||||||
| Total liabilities |
1,126,974 | 1,201,069 | ||||||
| Commitments and contingencies (Note 11) |
||||||||
| Shareholders’ equity |
||||||||
| Serial Preferred stock, no par value; 10,000,000 shares authorized; none issued Common stock, no par value; 24,000,000 shares authorized; 13,976,741 and 11,620,491 shares issued and outstanding in 2010 and 2009, respectively |
63,477 | 41,371 | ||||||
| Additional paid in capital |
1,652 | 1,248 | ||||||
| Retained earnings |
93,570 | 89,142 | ||||||
| Accumulated other comprehensive income, net of taxes of $650 in 2010 and $1,973 in 2009 |
898 | 2,719 | ||||||
| Total shareholders’ equity |
159,597 | 134,480 | ||||||
| Total liabilities and shareholders’ equity |
$ | 1,286,571 | $ | 1,335,549 | ||||
The accompanying notes are an integral part of these consolidated financial statements.
63
Table of Contents
CONSOLIDATED STATEMENTS OF INCOME
For the Years Ended December 31, 2010, 2009 and 2008
(Dollars in thousands, except per share data)
| 2010 | 2009 | 2008 | ||||||||||
| Interest income: |
||||||||||||
| Interest and fees on loans and leases |
$ | 53,057 | $ | 59,284 | $ | 67,560 | ||||||
| Interest on investment securities: |
||||||||||||
| Taxable |
8,025 | 8,300 | 7,942 | |||||||||
| Exempt from federal tax |
2,709 | 2,476 | 2,368 | |||||||||
| Interest on Federal funds sold and interest-bearing deposits |
40 | 86 | 68 | |||||||||
| Total interest income |
63,831 | 70,146 | 77,938 | |||||||||
| Interest expense: |
||||||||||||
| Interest on deposits |
6,121 | 10,040 | 15,451 | |||||||||
| Interest on borrowings |
794 | 1,223 | 4,234 | |||||||||
| Interest on subordinated debentures |
734 | 914 | 1,644 | |||||||||
| Total interest expense |
7,649 | 12,177 | 21,329 | |||||||||
| Net interest income |
56,182 | 57,969 | 56,609 | |||||||||
| Provision for loan and lease losses |
16,680 | 21,574 | 19,456 | |||||||||
| Net interest income after provision for loan and lease losses |
39,502 | 36,395 | 37,153 | |||||||||
| Non-interest revenue: |
||||||||||||
| Service charges on deposit accounts |
11,212 | 11,552 | 11,203 | |||||||||
| Gain on sale of loans |
105 | 81 | 9 | |||||||||
| Credit card fees |
391 | 417 | 494 | |||||||||
| Checkcard fees |
2,261 | 1,782 | 1,557 | |||||||||
| Gain on sales and calls of investment securities available-for-sale |
2,643 | 1,099 | 58 | |||||||||
| Increase in cash surrender value of life insurance |
1,382 | 1,561 | 408 | |||||||||
| Loss on sale of foreclosed assets |
(1,535 | ) | (204 | ) | (62 | ) | ||||||
| Other income |
1,402 | 991 | 2,320 | |||||||||
| Total non-interest income |
17,861 | 17,279 | 15,987 | |||||||||
| Other operating expense: |
||||||||||||
| Salaries and employee benefits |
20,869 | 18,963 | 16,666 | |||||||||
| Occupancy and equipment expense |
7,040 | 6,949 | 6,508 | |||||||||
| Other |
22,325 | 18,226 | 12,685 | |||||||||
| Total non-interest expense |
50,234 | 44,138 | 35,859 | |||||||||
| Income before income taxes |
7,129 | 9,536 | 17,281 | |||||||||
| Provision for income taxes |
(234 | ) | 608 | 3,868 | ||||||||
| Net income |
$ | 7,363 | $ | 8,928 | $ | 13,413 | ||||||
| Earnings per share |
||||||||||||
| Basic |
$ | .61 | $ | .86 | $ | 1.40 | ||||||
| Diluted |
$ | .60 | $ | .86 | $ | 1.37 | ||||||
The accompanying notes are an integral part of these consolidated financial statements.
64
Table of Contents
CONSOLIDATED STATEMENT OF CHANGES IN SHAREHOLDERS’ EQUITY
For three Years Ended December 31, 2010
(Dollars in thousands, except share data)
|
Common Stock |
Additional Paid In Capital |
Retained Earnings |
Accumulated Other Comprehensive (Loss)Income |
Shareholders’ Equity |
||||||||||||||||||||
| Shares | Amount | |||||||||||||||||||||||
| Balance, January 1, 2008 |
9,576,388 | $ | 18,757 | $ | 797 | $ | 80,125 | $ | (215 | ) | $ | 99,464 | ||||||||||||
| Comprehensive income: |
||||||||||||||||||||||||
| Net income |
13,413 | 13,413 | ||||||||||||||||||||||
| Net change in unrealized gain on investment securities available-for-sale, net of tax |
1,194 | 1,194 | ||||||||||||||||||||||
| Comprehensive income |
14,607 | |||||||||||||||||||||||
| Cumulative effect of change in accounting principle (EITF 06-4) |
(1,104 | ) | (1,104 | ) | ||||||||||||||||||||
| Exercise of stock options and related tax benefit |
186,303 | 2,248 | (8 | ) | 2,240 | |||||||||||||||||||
| Stock compensation costs |
209 | 209 | ||||||||||||||||||||||
| Stock repurchase |
(89,400 | ) | (114 | ) | (1,966 | ) | (2,080 | ) | ||||||||||||||||
| Cash dividends - $.68 per share |
(6,536 | ) | (6,536 | ) | ||||||||||||||||||||
| Balance, December 31, 2008 |
9,673,291 | 20,891 | 998 | 83,932 | 979 | 106,800 | ||||||||||||||||||
| Comprehensive income: |
||||||||||||||||||||||||
| Net income |
8,928 | 8,928 | ||||||||||||||||||||||
| Net change in unrealized gain on investment securities available-for-sale, net of tax |
1,740 | 1,740 | ||||||||||||||||||||||
| Comprehensive income |
10,668 | |||||||||||||||||||||||
| Issuance of Common stock |
1,935,000 | 20,375 | 20,375 | |||||||||||||||||||||
| Exercise of stock options and related tax benefit |
12,200 | 105 | 105 | |||||||||||||||||||||
| Stock compensation cost |
250 | 250 | ||||||||||||||||||||||
| Stock repurchase |
349 | 349 | ||||||||||||||||||||||
| Cash dividends - $.40 per share |
(4,067 | ) | (4,067 | ) | ||||||||||||||||||||
| Balance, December 31, 2009 |
11,620,491 | 41,371 | 1,248 | 89,142 | 2,719 | 134,480 | ||||||||||||||||||
| Comprehensive income: |
||||||||||||||||||||||||
| Net income |
7,363 | 7,363 | ||||||||||||||||||||||
| Net change in unrealized gain on investment securities available-for-sale, net of tax |
(1,821 | ) | (1,821 | ) | ||||||||||||||||||||
| Comprehensive income |
5,542 | |||||||||||||||||||||||
| Issuance of common stock |
2,325,000 | 21,864 | 21,864 | |||||||||||||||||||||
| Exercise of stock options and related tax benefit |
31,250 | 242 | 19 | 261 | ||||||||||||||||||||
| Stock compensation cost |
385 | 385 | ||||||||||||||||||||||
| Cash dividends - $.24 per share |
(2,935 | ) | (2,935 | ) | ||||||||||||||||||||
| Other, net |
||||||||||||||||||||||||
| Balance, December 31, 2010 |
13,976,741 | $ | 63,477 | $ | 1,652 | $ | 93,570 | $ | 898 | $ | 159,597 | |||||||||||||
The accompanying notes are an integral part of these consolidated financial statements.
65
Table of Contents
CONSOLIDATED STATEMENT OF CASH FLOWS
For the Years Ended December 31, 2010, 2009, and 2008
(Dollars in thousands)
| 2010 | 2009 | 2008 | ||||||||||
| Cash flows from operating activities: |
||||||||||||
| Net income |
$ | 7,363 | $ | 8,928 | $ | 13,413 | ||||||
| Adjustments to reconcile net income to net cash provided by operating activities: |
||||||||||||
| Gain on Investment of securities |
(2,643 | ) | (1,099 | ) | (58 | ) | ||||||
| Gain on sales of loans |
(105 | ) | (81 | ) | (9 | ) | ||||||
| Loss (gain) on disposal of fixed assets |
243 | 52 | (81 | ) | ||||||||
| Loss on sale on foreclosed assets |
1,536 | 204 | 62 | |||||||||
| Writedown on foreclosed assets |
5,045 | 1,265 | 1,828 | |||||||||
| Share-based compensation expense |
385 | 250 | 209 | |||||||||
| Provision for loan losses |
16,680 | 21,574 | 19,456 | |||||||||
| Depreciation and amortization |
2,890 | 3,103 | 2,984 | |||||||||
| Net amortization on securities premiums and discounts |
3,469 | 548 | 137 | |||||||||
| Increase in unearned net loan fees |
(752 | ) | (726 | ) | (1,678 | ) | ||||||
| Increase in cash surrender value of insurance policies |
(1,522 | ) | (1,561 | ) | (408 | ) | ||||||
| Proceeds from sales of loan portfolio |
2,705 | 7,393 | — | |||||||||
| Net increase in loans held-for-sale |
(538 | ) | (176 | ) | (552 | ) | ||||||
| Increase (decrease) in interest receivable and other assets |
2,365 | (1,506 | ) | 822 | ||||||||
| (Decrease) increase in other liabilities |
(568 | ) | 1,572 | (3,458 | ) | |||||||
| Net decrease in FHLB Stock |
1,000 | — | 1,200 | |||||||||
| Deferred income tax benefit |
(2,919 | ) | (8,745 | ) | (620 | ) | ||||||
| Excess tax benefit from equity based compensation |
(19 | ) | (11 | ) | (613 | ) | ||||||
| Net cash provided by operating activities |
34,615 | 30,984 | 32,634 | |||||||||
| Cash flows from investing activities: |
||||||||||||
| Maturities of securities available-for-sale |
6,787 | 8,737 | 3,665 | |||||||||
| Proceeds from sales/calls of securities available-for-sale |
75,319 | 30,197 | 9,733 | |||||||||
| Purchases of securities available-for-sale |
(208,477 | ) | (120,268 | ) | (100,617 | ) | ||||||
| Principal paydowns on securities available-for-sale |
68,838 | 50,133 | 30,707 | |||||||||
| Decrease (increase) in loans receivable, net |
46,330 | 20,347 | (49,123 | ) | ||||||||
| Purchases of premises and equipment, net |
(2,481 | ) | (3,437 | ) | (3,900 | ) | ||||||
| Proceeds from sale of foreclosed assets |
9,798 | 1,603 | 2,577 | |||||||||
| Net cash used in investing activities |
(3,886 | ) | (12,688 | ) | (106,958 | ) | ||||||
(Continued)
66
Table of Contents
SIERRA BANCORP AND SUBSIDIARY
CONSOLIDATED STATEMENTS OF CASH FLOWS
(Continued)
For the Years Ended December 31, 2010, 2009 and 2008
(Dollars in thousands)
| 2010 | 2009 | 2008 | ||||||||||
| Cash flows from financing activities: |
||||||||||||
| (Decrease) increase in Deposits |
$ | (73,158 | ) | $ | 63,934 | $ | 211,351 | |||||
| Decrease in borrowed funds |
(350 | ) | (59,500 | ) | (125,500 | ) | ||||||
| (Decrease) increase in repurchase agreement |
— | (24,419 | ) | 2,337 | ||||||||
| Cash dividends paid |
(2,935 | ) | (4,067 | ) | (6,536 | ) | ||||||
| Proceeds from issuance of common stock |
21,864 | 20,375 | — | |||||||||
| Repurchases of common stock |
— | — | (2,080 | ) | ||||||||
| Stock options exercised |
242 | 94 | 1,627 | |||||||||
| Excess tax benefit from equity based compensation |
19 | 11 | 613 | |||||||||
| Net cash (used in)/provided by financing activities |
(54,318 | ) | (3,572 | ) | 81,812 | |||||||
| Net (decrease) increase in cash and cash equivalents |
(23,589 | ) | 14,724 | 7,488 | ||||||||
| Cash and cash equivalents, beginning of year |
66,234 | 51,510 | 44,022 | |||||||||
| Cash and cash equivalents, end of year |
$ | 42,645 | $ | 66,234 | $ | 51,510 | ||||||
| Supplemental disclosure of cash flow information: |
||||||||||||
| Cash paid during the year for: |
||||||||||||
| Interest |
$ | 8,155 | $ | 12,512 | $ | 21,212 | ||||||
| Income taxes |
$ | 5,360 | $ | 4,830 | $ | 6,410 | ||||||
| Non-cash investing activities: |
||||||||||||
| Real estate acquired through foreclosure |
$ | 15,993 | $ | 24,653 | $ | 11,080 | ||||||
| Net change in unrealized gains on investment securities available-for-sale |
$ | (3,145 | ) | $ | 3,002 | $ | 2,063 | |||||
The accompanying notes are an integral part of these consolidated financial statements
67
Table of Contents
NOTES TO CONSOLIDATED FINANCIAL STATEMENTS
| 1. | THE BUSINESS OF SIERRA BANCORP |
Sierra Bancorp (the “Company”) is a California corporation registered as a bank holding company under the Bank Holding Company Act of 1956, as amended, and is headquartered in Porterville, California. The Company was incorporated in November 2000 and acquired all of the outstanding shares of Bank of the Sierra (the “Bank”) in August 2001. The Company’s principal subsidiary is the Bank, and the Company exists primarily for the purpose of holding the stock of the Bank and of such other subsidiaries it may acquire or establish. The Company’s only other direct subsidiaries are Sierra Statutory Trust II, which was formed in March 2004 solely to facilitate the issuance of capital trust pass-through securities, and Sierra Capital Trust III, which was formed in June 2006 also for the purpose of issuing capital trust pass-through securities.
The Bank operates twenty-five full service branch offices, one online “virtual” branch and two credit centers. The Bank’s deposits are insured by the Federal Deposit Insurance Corporation (FDIC) up to applicable legal limits. The Bank maintains a diversified loan portfolio comprised of agricultural, commercial, consumer, real estate construction and mortgage loans. Loans are made primarily within the market area of the South Central San Joaquin Valley of California, specifically, Tulare, Fresno, Kern, Kings, and Madera counties. These areas have diverse economies with principal industries being agriculture, real estate and light manufacturing.
| 2. | SUMMARY OF SIGNIFICANT ACCOUNTING POLICIES |
Consolidation and Basis of Presentation
The consolidated financial statements include the accounts of the Company and the consolidated accounts of its wholly-owned subsidiary, Bank of the Sierra. All significant intercompany balances and transactions have been eliminated. Certain reclassifications have been made to prior years’ balances to conform to classifications used in 2010. The accounting and reporting policies of the Company conform with accounting principles generally accepted in the United States of America (U.S. GAAP) and prevailing practices within the banking industry.
In accordance with U.S. GAAP, the Company’s investments in Sierra Statutory Trust II and Sierra Capital Trust III are not consolidated and are accounted for under the equity method and included in other assets on the consolidated balance sheet. The subordinated debentures issued and guaranteed by the Company and held by the trusts are reflected on the Company’s consolidated balance sheet.
Use of Estimates
The preparation of consolidated financial statements in conformity with U.S. GAAP requires management to make estimates and assumptions. These estimates and assumptions affect the reported amounts of assets and liabilities at the date of the consolidated financial statements and the reported amounts of revenues and expenses during the reporting period. Actual results could differ from these estimates.
Material estimates that are particularly susceptible to significant changes in the near-term relate to the determination of the allowance for loan and lease losses and the valuation of real estate acquired in connection with foreclosures or in satisfaction of loans. In connection with the determination of the allowances for loan and lease losses and other real estate, management obtains independent appraisals for significant properties, evaluates the overall loan portfolio characteristics and delinquencies and monitors economic conditions.
Cash Equivalents
For purposes of reporting cash flows, cash and cash equivalents include cash and balances due from banks, federal funds sold, and interest bearing deposits in banks.
68
Table of Contents
SIERRA BANCORP AND SUBSIDIARY
NOTES TO CONSOLIDATED FINANCIAL STATEMENTS
(Continued)
| 2. | SUMMARY OF SIGNIFICANT ACCOUNTING POLICIES (Continued) |
Investment Securities
Investments are classified into the following categories:
| • | Securities available-for-sale, reported at fair value, with unrealized gains and losses excluded from earnings and reflected, net of tax, as a separate component of shareholders’ equity in accumulated other comprehensive income. |
| • | Securities held-to-maturity, which the Company has the intent and has the ability to hold to maturity, are carried at cost, adjusted for amortization of premiums and the accretion of discounts. |
Management determines the appropriate classification of its investments at the time of purchase and may only change the classification in certain limited circumstances. All transfers between categories are accounted for at fair value.
Net gains or losses on the sale of investment securities are recorded on the trade date, computed on the specific identification method and shown separately in non-interest income in the consolidated statement of income. Interest earned on investment securities is included in interest income, net of applicable adjustments for accretion of discounts and amortization of premiums. Declines in the fair value of investment securities below their cost that are deemed to be other than temporary are reflected in earnings as realized losses. In estimating other-than-temporary impairment losses, Management considers: (1) the length of time the security has been in an unrealized loss position, (2) the extent to which the security’s fair value is less than its cost, (3) the financial condition of the issuer, (4) any adverse changes in ratings issued by various rating agencies, (5) the intent and ability of the Bank to hold such securities for a period of time sufficient to allow for any anticipated recovery in fair value and (6) in the case of mortgage related securities, credit enhancements, loan-to-values, credit scores, delinquency and default rates, cash flows and the extent to which those cash flows are within Management’s initial expectations based on pre-purchase analyses.
Loans and Leases
Loans and leases are reported at the principal amounts outstanding, adjusted for unearned income, deferred loan origination fees and costs, purchase premiums and discounts, write-downs, and the allowance for loan and lease losses. Loan and lease origination fees, net of certain deferred origination costs, and purchase premiums and discounts are recognized as an adjustment to yield of the related loans and leases over the contractual life of the loan using both the effective interest and straight line methods.
The accrual of interest on loans and leases is discontinued when, in the opinion of management, there is an indication that the borrower may be unable to meet payments as they become due. Upon such discontinuance, all unpaid accrued interest is reversed against current income unless the loan or lease is in the process of collection. For loans with an interest reserve, i.e., where loan proceeds are advanced to the borrower to make interest payments, all interest recognized from the inception of the loan is reversed when the loan is placed on non-accrual. Interest received on nonaccrual loans and leases generally is either applied against principal or reported as interest income, according to management’s judgment as to the collectability of principal. Generally, loans and leases are restored to accrual status when the obligation is brought current and has performed in accordance with the contractual terms for a reasonable period of time and the ultimate collectability of the total contractual principal and interest is no longer in doubt. Direct financing leases are carried net of unearned income. Income from leases is recognized by a method that approximates a level yield on the outstanding net investment in the lease.
69
Table of Contents
SIERRA BANCORP AND SUBSIDIARY
NOTES TO CONSOLIDATED FINANCIAL STATEMENTS
(Continued)
| 2. | SUMMARY OF SIGNIFICANT ACCOUNTING POLICIES (Continued) |
Loans Modified in a Troubled Debt Restructuring
Loans are considered to have been modified in a troubled debt restructuring (“TDR”) when due to a borrower’s financial difficulties, the Company makes certain concessions to the borrower that it would not otherwise consider. Modifications may include interest rate reductions, principal or interest forgiveness, forbearance, and other actions intended to minimize economic loss and to avoid foreclosure or repossession of collateral. Generally, a non-accrual loan that has been modified in a TDR remains on non-accrual status for a period of six months to demonstrate that the borrower is able to meet the terms of the modified loan. However, performance prior to the modification, or significant events that coincide with the modification, are included in assessing whether the borrower can meet the new terms and may result in the loan being returned to accrual status at the time of loan modification or after a shorter performance period. If the borrower’s ability to meet the revised payment schedule is uncertain, the loan remains on non-accrual status.
Allowance for Loan and Lease Losses
The allowance for loan and lease losses is maintained at a level which, in management’s judgment, is adequate to absorb loan and lease losses inherent in the loan and lease portfolio. The allowance for loan and lease losses is increased by a provision for loan and lease losses, which is charged to expense, and reduced by charge-offs, net of recoveries. The amount of the allowance is based on management’s evaluation of the collectability of the loan and lease portfolio, changes in its risk profile, credit concentrations, historical trends, and economic conditions. This evaluation also considers the balance of impaired loans and leases. A loan or lease is impaired when it is probable that the Bank will be unable to collect all contractual principal and interest payments due in accordance with terms of the loan or lease agreement. Losses on individually identified impaired loans or leases are measured based on the present value of expected future cash flows discounted at each loan or lease’s original effective interest rate. As a practical expedient, impairment may be measured based on the loan’s or lease’s observable market price or the fair value of the collateral if the loan or lease is collateral dependent. The amount of impairment, if any, is recorded through the provision for loan and lease losses and is added to the allowance for loan and lease losses. One-to-four family residential mortgages and consumer installment loans are subjected to a collective evaluation for impairment, considering delinquency and repossession statistics, historical loss experience, and other factors.
General reserves cover non-impaired loans and are based on historical migration net loss rates for each portfolio segment by call report code, adjusted for the effects of qualitative or environmental factors that are likely to cause estimated credit losses as of the evaluation date to differ from the portfolio segment’s historical loss experience. Qualitative factors include consideration of the following: changes in lending policies and procedures; changes in international, national, regional, and local economic and business conditions and developments; changes in nature and volume of the portfolio; changes in the experience, ability and depth of lending management and other relevant staff; changes in the volume and severity of past due, nonaccrual and other adversely graded loans; changes in quality of the loan review system; changes in the value of the underlying collateral for collateral-dependent loans; concentrations of credit and the effect of the other external factors such as competition and legal and regulatory requirements.
Most of the Company’s business activity is with customers located within the Central Valley of California; primarily Fresno, Kings, Tulare and Kern Counties. Therefore, the Company’s exposure to credit risk is significantly affected by changes in the economy in these counties. The Company considers this concentration of credit risk when assessing and assigning qualitative factors in the allowance for loan losses. Portfolio segments identified by the Company include Direct Financing leases, Agricultural, Commercial and Industrial, Real Estate, Small Business Administration, and Consumer loans. Relevant risk characteristics for these portfolio segments generally include debt service coverage, loan-to-value ratios and financial performance on non-consumer related loans and credit scores, debt-to-income ratios, collateral type and loan-to-value ratios for consumer related loans.
70
Table of Contents
SIERRA BANCORP AND SUBSIDIARY
NOTES TO CONSOLIDATED FINANCIAL STATEMENTS
(Continued)
| 2. | SUMMARY OF SIGNIFICANT ACCOUNTING POLICIES (Continued) |
Though management believes the allowance for loan and lease losses to be adequate, ultimate losses may vary from their estimates. However, estimates are reviewed periodically, and as adjustments become necessary, they are reported in earnings during periods they become known. In addition, the FDIC and the California Department of Financial Institutions, as an integral part of their examination process, review the allowance for loan and lease losses. These agencies may require additions to the allowance for loan and lease losses based on their judgment about information available at the time of their examinations.
Sale and Servicing of Loans
Gains and losses on sales of loans are recognized at the time of sale and are calculated based on the difference between the selling price and the allocated book value of loans sold. Book value allocations are determined in accordance with U.S. GAAP. Any inherent risk of loss on loans sold is transferred to the buyer at the date of sale.
The Company has issued various representations and warranties associated with the sale of loans. These representations and warranties may require the Company to repurchase loans with underwriting deficiencies as defined per the applicable sales agreements and certain past due loans within 90 days of the sale. The Company did not experience losses during the years ended December 31, 2010, 2009 and 2008 regarding these representations and warranties.
Premises and Equipment
Premises and equipment are stated at cost less accumulated depreciation. Depreciation is computed using the straight-line method over the estimated useful lives of the assets. The useful lives of premises are estimated to be thirty years. The useful lives of furniture, fixtures and equipment are estimated to be three to twenty years. Leasehold improvements are amortized over the life of the asset or the term of the related lease, whichever is shorter. When assets are sold or otherwise disposed of, the cost and related accumulated depreciation are removed from the accounts, and any resulting gain or loss is recognized in income for the period. The cost of maintenance and repairs is charged to expense as incurred.
Impairment of long-lived assets is evaluated by management based upon an event or changes in circumstances surrounding the underlying assets which indicate long-lived assets may be impaired.
Foreclosed Assets
Foreclosed assets include real estate, and other property acquired in full or partial settlement of loan obligations. When property is acquired, any excess of the recorded investment in the loan balance and accrued interest income over the appraised fair market value of the property, net of estimated selling costs, is charged against the allowance for loan and lease losses. A valuation allowance for losses on foreclosed assets is maintained to provide for temporary declines in value. The allowance is established through a provision for losses on foreclosed assets which is included in other non-interest expense. Subsequent gains or losses on sales or write-downs resulting from permanent impairments are recorded in other income or expense as incurred.
Goodwill
The Company acquired Sierra National Bank in 2000, and the acquisition was accounted for using the purchase method of accounting. The goodwill resulting from this transaction represents the amount by which the purchase price exceeded the fair value of the net assets. In accordance with U.S. GAAP the Company evaluates goodwill periodically for impairment. There was no impairment recognized for the years ended December 31, 2010, 2009, and 2008.
71
Table of Contents
SIERRA BANCORP AND SUBSIDIARY
NOTES TO CONSOLIDATED FINANCIAL STATEMENTS
(Continued)
| 2. | SUMMARY OF SIGNIFICANT ACCOUNTING POLICIES (Continued) |
Income Taxes
The Company files its income taxes on a consolidated basis with its subsidiary. The allocation of income tax expense represents each entity’s proportionate share of the consolidated provision for income taxes.
Income taxes are accounted for using the asset and liability method. Under the asset and liability method, deferred taxes are recognized for the tax consequences of temporary differences by applying enacted statutory tax rates applicable to future years to differences between the financial statement carrying amounts and the tax bases of existing assets and liabilities. The effect on deferred taxes of a change in tax rates would be recognized in income in the period that includes the enactment date. A valuation allowance, if needed, reduces deferred tax assets to the amount expected to be realized.
The Company adopted guidance issued by the FASB accounting for income taxes, effective January 1, 2007, which clarifies the accounting and disclosure for uncertainty in tax positions as defined. This guidance seeks to reduce the diversity in practice associated with certain aspects of the recognition and measurement related to accounting for income taxes. A tax position is recognized as a benefit only if it is “more likely than not” that the tax position would be sustained in a tax examination, with a tax examination being presumed to occur. The amount recognized is the largest amount of tax benefit that is greater than 50% likely to be realized on examination. For tax positions not meeting the “more likely than not” test, no tax benefit is recorded. We have determined that as of December 31, 2010 all tax positions taken to date are highly certain and, accordingly, no accounting adjustment has been made to the financial statements.
The Company recognizes interest and penalties related to uncertain tax positions as part of income tax expense.
Salary Continuation Agreements and Directors’ Retirement Plan
The Company has entered into agreements to provide members of the Board of Directors and certain key executives, or their designated beneficiaries, with annual benefits for up to fifteen years after retirement or death. The Company accrues for these future benefits from the effective date of the plan until the director’s or executive’s expected retirement date in a systematic and rational manner. At the consolidated balance sheet date, the amount of accrued benefits equals the then present value of the benefits expected to be provided to the director or employee, any beneficiaries, and covered dependents in exchange for the director’s or employee’s services to that date.
Comprehensive Income
Comprehensive income consists of net income and the net change in unrealized gains on securities available-for-sale, net of an adjustment for the effects of realized gains and losses and any applicable tax. Comprehensive income is a more inclusive financial reporting methodology that includes disclosure of other comprehensive income that historically has not been recognized in the calculation of net income. Unrealized gains and losses on the Company’s available-for-sale investment securities are included in other comprehensive income after the adjustment for the effects of realized gains and losses. Total comprehensive income and the components of accumulated other comprehensive income (loss) are presented in the consolidated statement of changes in shareholders’ equity.
72
Table of Contents
SIERRA BANCORP AND SUBSIDIARY
NOTES TO CONSOLIDATED FINANCIAL STATEMENTS
(Continued)
| 2. | SUMMARY OF SIGNIFICANT ACCOUNTING POLICIES (Continued) |
Stock-Based Compensation
At December 31, 2010, the Company had one stock-based compensation plan, the Sierra Bancorp 2007 Stock Incentive Plan (the “2007 Plan”), which was adopted by the Company’s Board of Directors on March 15, 2007 and approved by the Company’s shareholders on May 23, 2007. The 2007 Plan is for 1,500,000 shares of the Company’s authorized but unissued common stock, subject to adjustment for stock splits and dividends, and provides for the issuance of both “incentive” and “nonqualified” stock options to salaried officers and employees, and of “nonqualified” stock options to non-employee directors. The 2007 Plan also provides for the issuance of restricted stock awards to these same classes of eligible participants. We have not issued, nor do we currently have plans to issue, restricted stock awards. The 2007 plan supersedes the Company’s 1998 Stock Option plan (“1998 Plan”) which was terminated. The outstanding options issued under the 1998 Plan are not affected by this termination.
The Company is using the Black-Scholes model to value stock options. The “multiple option” approach is used to allocate the resulting valuation to actual expense for current period. Expected volatility is based on historical volatility of the Company’s common stock. The Company uses historical data to estimate option exercise and post-vesting termination behavior. The expected term of options granted is based on historical data and represents the period of time that options granted are expected to be outstanding, which takes into account that the options are not transferable. The risk-free interest rate for the expected term of the option is based on the U.S. Treasury yield curve in effect at the time of the grant. The fair value of each option is estimated on the date of grant using the following assumptions:
| 2010 | 2009 | 2008 | ||||||||||
| Dividend yield |
2.24 | % | 4.54 | % | 3.54 | % | ||||||
| Expected volatility |
54.22 | % | 52.17 | % | 26.93 | % | ||||||
| Risk-free interest rate |
1.18 | % | 2.33 | % | 2.73 | % | ||||||
| Expected option life |
5.8 years | 5.8 years | 5.8 years | |||||||||
Recent Accounting Pronouncements
In July 2010, the Financial Accounting Standards Board (the “FASB”) issued Accounting Standards Update (“ASU”) No. 2010-20, Disclosures about the Credit Quality of Financing Receivables and the Allowance for Credit Losses. ASU 2010-20 is intended to provide additional information to assist financial statement users in assessing an entity’s credit risk exposures and evaluating the adequacy of its allowance for credit losses. To achieve those objectives, ASU 2010-20 requires additional disclosures that facilitate the evaluation of the nature of credit risk inherent in the entity’s portfolio of financing receivables, enhance the understanding of how that risk is analyzed and assessed in arriving at the allowance for credit losses, and discuss the changes and reasons for those changes in the allowance for credit losses. A reporting entity should provide disclosures on a disaggregated basis, including portfolio segment and class of financing receivable. A portfolio segment is defined as the level at which an entity develops and documents a systematic method for determining its allowance for credit losses. Classes of financing receivables generally are a disaggregation of portfolio segment. For public entities, including the Company, the disclosures as of the end of a reporting period are effective for interim and annual reporting periods ending on or after December 15, 2010. The disclosures about activity that occurs during a reporting period are effective for interim and annual reporting periods beginning on or after December 15, 2010. Since ASU 2010-20 affects only disclosure requirements for credit quality and the allowance for loan and lease losses, the adoption of this update is not expected to have a material impact on the Company’s results of operations or financial position.
73
Table of Contents
SIERRA BANCORP AND SUBSIDIARY
NOTES TO CONSOLIDATED FINANCIAL STATEMENTS
(Continued)
| 2. | SUMMARY OF SIGNIFICANT ACCOUNTING POLICIES (Continued) |
In April 2010, the FASB issued ASU No. 2010-18, Effect of a Loan Modification When the Loan Is Part of a Pool That Is Accounted for as a Single Asset. ASU No. 2010-18 provides guidance on the accounting for loan modifications when the loan is part of a pool of loans accounted for as a single asset, such as acquired loans that have evidence of credit deterioration upon acquisition and are accounted for under the guidance in The FASB Accounting Standards Codification ™ ( “ASC”) 310-30. ASU No. 2010-18 addresses diversity in practice on whether a loan that is part of a pool of loans accounted for as a single asset should be removed from that pool upon a modification that would constitute a troubled debt restructuring, or should remain in the pool after modification. ASU No. 2010-18 clarifies that modifications of loans that are accounted for within a pool under ASC 310-30 do not result in the removal of those loans from the pool even if the modification of those loans would otherwise be considered a troubled debt restructuring. An entity will continue to be required to consider whether the pool of assets in which the loan is included is impaired if the expected cash flows for the pool change. The amendments in this update do not require any additional disclosures and are effective for modifications of loans accounted for within pools under ASC 310-30 occurring in the first interim or annual period ending on or after July 15, 2010. The adoption of ASU 2010-18 for the third
quarter of 2010 did not have a material impact on the Company’s results of operations, financial position or disclosures.
In February 2010, the FASB issued ASU No. 2010-09, Subsequent Events (Topic 855): Amendments to Certain Recognition and Disclosure Requirements. The amendments remove the requirement for an SEC registrant to disclose the date through which subsequent events were evaluated as this requirement would have potentially conflicted with SEC reporting requirements. Removal of the disclosure requirement is not expected to affect the nature or timing of subsequent events evaluations performed by the Company. This ASU became effective upon issuance.
In January 2010, the FASB issued ASU No. 2010-06, Fair Value Measurements and Disclosures (Topic 820): Improving Disclosures about Fair Value Measurements. This update added disclosure requirements for significant transfers into and out of Levels 1 and 2, clarified existing fair value disclosure requirements about the appropriate level of disaggregation, and clarified that a description of the valuation techniques was required for recurring and nonrecurring Level 2 and 3 fair value measurements. The Company adopted these provisions of the ASU in preparing the Consolidated Financial Statements for the period ended March 31, 2010. The adoption of these provisions only affected the disclosure requirements for fair value measurements and as a result had no impact on the Company’s statements of income and condition. An additional requirement of this ASU is that activity within Level 3, including purchases, sales, issuances, and settlements, be presented on a gross basis rather than as a net number as currently permitted. This provision of the ASU is effective for the Company’s reporting period ending March 31, 2011. As this provision amends only the disclosure requirements for fair value measurements, the adoption will have no impact on the Company’s statements of income and condition.
74
Table of Contents
SIERRA BANCORP AND SUBSIDIARY
NOTES TO CONSOLIDATED FINANCIAL STATEMENTS
(Continued)
| 3. | INVESTMENT SECURITIES AVAILABLE-FOR-SALE |
The amortized cost and estimated fair value of investment securities available-for-sale are as follows (dollars in thousands):
| December 31, 2010 | ||||||||||||||||
| Amortized Cost |
Gross Unrealized Gains |
Gross Unrealized Losses |
Estimated Fair Value |
|||||||||||||
| U.S. Government agencies |
$ | 4,954 | $ | 108 | $ | — | $ | 5,062 | ||||||||
| Obligations of states and political subdivisions |
70,201 | 1,069 | (1,168 | ) | 70,102 | |||||||||||
| U.S. Government agencies collateralized by mortgage obligations |
252,320 | 3,853 | (1,030 | ) | 255,143 | |||||||||||
| Other securities |
2,705 | 10 | (1,292 | ) | 1,423 | |||||||||||
| $ | 330,180 | $ | 5,040 | $ | (3,490 | ) | $ | 331,730 | ||||||||
| December 31, 2009 | ||||||||||||||||
| Amortized Cost |
Gross Unrealized Gains |
Gross Unrealized Losses |
Estimated Fair Value |
|||||||||||||
| U.S. Government agencies |
$ | 6,728 | $ | 133 | $ | — | $ | 6,861 | ||||||||
| Obligations of states and political subdivisions |
62,506 | 1,221 | (589 | ) | 63,138 | |||||||||||
| U.S. Government agencies collateralized by mortgage obligations |
201,534 | 5,470 | (203 | ) | 206,801 | |||||||||||
| Other securities |
2,705 | 4 | (1,341 | ) | 1,368 | |||||||||||
| $ | 273,473 | $ | 6,828 | $ | (2,133 | ) | $ | 278,168 | ||||||||
For the years ended December 31, 2010, 2009, and 2008, proceeds from sales of securities available-for-sale were $69.0 million, $30.2 and $0 respectively. Gains and losses on the sale of investment securities are recorded on the trade date and are determined using the specific identification method.
75
Table of Contents
SIERRA BANCORP AND SUBSIDIARY
NOTES TO CONSOLIDATED FINANCIAL STATEMENTS
(Continued)
| 3. | INVESTMENT SECURITIES AVAILABLE-FOR-SALE (Continued) |
At December 31, 2010 and 2009, the Company had 141 and 84 securities with unrealized gross losses, respectively. Information pertaining to these securities aggregated by investment category and length of time that individual securities have been in a continuous loss position, follows (dollars in thousands):
| December 31, 2010 | ||||||||||||||||
| Less Than Twelve Months | Over Twelve Months | |||||||||||||||
| Gross Unrealized Losses |
Fair Value |
Gross Unrealized Losses |
Fair Value |
|||||||||||||
| Obligations of states and political subdivisions |
$ | (884 | ) | $ | 24,728 | $ | (283 | ) | $ | 2,478 | ||||||
| U.S. Government agencies collateralized by mortgage obligations |
(1,009 | ) | 108,203 | (21 | ) | 558 | ||||||||||
| Other Securities |
— | — | (1,292 | ) | 1,408 | |||||||||||
| $ | (1,893 | ) | $ | 132,931 | $ | (1,596 | ) | $ | 4,444 | |||||||
| December 31, 2009 | ||||||||||||||||
| Less Than Twelve Months | Over Twelve Months | |||||||||||||||
| Gross Unrealized Losses |
Fair Value |
Gross Unrealized Losses |
Fair Value |
|||||||||||||
| Obligations of states and political subdivisions |
$ | (409 | ) | $ | 11,400 | $ | (180 | ) | $ | 2,807 | ||||||
| U.S. Government agencies collateralized by mortgage obligations |
(108 | ) | 25,288 | (95 | ) | 1,080 | ||||||||||
| Other Securities |
(1,341 | ) | 1,368 | — | — | |||||||||||
| $ | (1,858 | ) | $ | 38,056 | $ | (275 | ) | $ | 3,887 | |||||||
The Company has reviewed all sectors and securities in the investment portfolio for impairment. All securities are performing as expected. Therefore, the Company has concluded that as of December 31, 2010 any security that is currently at an unrealized loss, is NOT other-than-temporarily-impaired. This assessment was based on the following factors: 1) the Company has the ability to hold the security, 2) the Company does not intend to sell the security, 3) the Company does not anticipate it will be required to sell the security before recovery, 4) and the Company expects to eventually recover the entire amortized cost basis of the security.
76
Table of Contents
SIERRA BANCORP AND SUBSIDIARY
NOTES TO CONSOLIDATED FINANCIAL STATEMENTS
(Continued)
| 3. | INVESTMENT SECURITIES AVAILABLE-FOR-SALE (Continued) |
The amortized cost and estimated fair value of investment securities available-for-sale at December 31, 2010 by contractual maturity are shown below. Expected maturities will differ from contractual maturities because the issuers of the securities may have the right to call or prepay obligations with or without penalties.
| Amortized Cost |
Fair Value |
|||||||
| (Dollars in thousands) | ||||||||
| Maturing within one year |
$ | 4,431 | $ | 4,469 | ||||
| Maturing after one year through five years |
188,117 | 191,403 | ||||||
| Maturing after five years through ten years |
42,690 | 43,085 | ||||||
| Maturing after ten years |
21,012 | 20,320 | ||||||
| Investment securities not due at a single maturity date: |
||||||||
| U.S. Government agencies collateralized by mortgage obligations |
71,225 | 71,030 | ||||||
| Other securities |
2,705 | 1,423 | ||||||
| $ | 330,180 | $ | 331,730 | |||||
Investment securities available-for-sale with amortized costs totaling $142,700,000 and estimated fair values totaling $145,837,000 were pledged to secure other contractual obligations and short-term borrowing arrangements at December 31, 2010. (see Note 8)
Investment securities available-for-sale with amortized costs totaling $206,926,000 and estimated fair values totaling $212,803,000 were pledged to secure public deposits, other contractual obligations and short-term borrowing arrangements at December 31, 2009. (see Note 8)
Gross gains and losses from the sales and calls of investment securities for the years ended were as follows (dollars in thousands):
| 2010 | 2009 | 2008 | ||||||||||
| Gross Gains on Sales and Calls of Investment Securities |
$ | 2,643 | $ | 1,099 | $ | 58 | ||||||
| Gross Losses on Sales and Calls of Investment Securities |
— | — | — | |||||||||
| Net Gains on Sales and Calls of Investment Securities |
$ | 2,643 | $ | 1,099 | $ | 58 | ||||||
77
Table of Contents
SIERRA BANCORP AND SUBSIDIARY
NOTES TO CONSOLIDATED FINANCIAL STATEMENTS
(Continued)
| 4. | LOANS AND LEASES |
The composition of the loan and lease portfolio is as follows (dollars in thousands):
| December 31, | ||||||||
| 2010 | 2009 | |||||||
| Real estate: |
||||||||
| Secured by residential, commercial and professional office properties, including construction and development |
$ | 308,470 | $ | 421,114 | ||||
| Secured by residential properties |
252,203 | 188,750 | ||||||
| Secured by farm land |
61,293 | 56,654 | ||||||
| Held for sale |
914 | 376 | ||||||
| Total Real Estate |
622,880 | 666,894 | ||||||
| Commercial and industrial |
94,768 | 116,835 | ||||||
| Agricultural |
13,457 | 9,865 | ||||||
| Small Business Administration loans |
18,616 | 18,626 | ||||||
| Consumer |
45,585 | 56,992 | ||||||
| Direct financing leases |
10,234 | 15,394 | ||||||
| 805,540 | 884,606 | |||||||
| Deferred loan and lease origination cost, net |
113 | (640 | ) | |||||
| Allowance for loan and lease losses |
(21,138 | ) | (23,715 | ) | ||||
| $ | 784,515 | $ | 860,251 | |||||
78
Table of Contents
SIERRA BANCORP AND SUBSIDIARY
NOTES TO CONSOLIDATED FINANCIAL STATEMENTS
(Continued)
| 4. | LOANS AND LEASES (Continued) |
The Company monitors the credit quality of loans on a continuous basis using the regulatory and accounting classifications of pass, special mention, substandard and impaired to characterize and qualify the associated credit risk. Loans classified as “loss” are immediately charged-off. The Company uses the following definitions of risk classifications:
Pass – Loans listed as pass include larger non-homogeneous loans not meeting the risk rating definitions below and smaller, homogeneous loans not assessed on an individual basis.
Special Mention – Loans classified as special mention have the potential weakness that deserves management’s close attention. If left uncorrected, these potential weaknesses may result in deterioration of the repayment prospects for the loan or of the institution’s credit position and some future date.
Substandard – Loans classified as substandard are those loans with clear and at well-defined weaknesses such as a highly leveraged position, unfavorable financial operating results and/or trends, uncertain repayment sources or poor financial condition, which may jeopardize ultimate recoverability of the debt.
Impaired – A loan is considered impaired, when, based on current information and events, it is probable that the Company will be unable to collect all amounts due according to the contractual terms of the loan agreement. Additionally, all loans classified as troubled debt restructurings are considered impaired.
Credit quality classifications as of December 31, 2010 were as follows (dollars in thousands):
| Pass | Special Mention |
Substandard | Impaired | Total | ||||||||||||||||
| Real Estate: |
||||||||||||||||||||
| 1-4 Family residential construction |
$ | 4,309 | $ | 5,500 | $ | — | $ | 4,057 | $ | 13,866 | ||||||||||
| Other construction/Land |
24,988 | 17,979 | 1,411 | 7,669 | 52,047 | |||||||||||||||
| 1-4 Family – closed end |
83,543 | 6,345 | 2,326 | 12,331 | 104,545 | |||||||||||||||
| Equity Lines |
66,560 | 1,426 | 1,558 | 1,239 | 70,783 | |||||||||||||||
| Multi-family residential |
4,930 | 3,076 | — | 2,956 | 10,962 | |||||||||||||||
| Commercial real estate owner occupied |
149,451 | 18,892 | 11,936 | 7,691 | 187,970 | |||||||||||||||
| Commercial real estate Non-owner occupied |
79,842 | 7,498 | 6,051 | 27,109 | 120,500 | |||||||||||||||
| Farmland |
35,949 | 21,091 | 3,848 | 405 | 61,293 | |||||||||||||||
| Total Real Estate |
449,572 | 81,807 | 27,130 | 63,457 | 621,966 | |||||||||||||||
| Agricultural |
11,547 | 1,673 | 237 | — | 13,457 | |||||||||||||||
| Commercial and Industrial |
79,083 | 8,156 | 5,425 | 2,104 | 94,768 | |||||||||||||||
| Small Business Administration loans |
13,219 | 1,335 | 621 | 3,441 | 18,616 | |||||||||||||||
| Direct finance leases |
9,604 | 129 | — | 501 | 10,234 | |||||||||||||||
| Consumer loans |
42,436 | 830 | 775 | 1,544 | 45,585 | |||||||||||||||
| Total Gross Loans and Leases |
$ | 605,461 | $ | 93,930 | $ | 34,188 | $ | 71,047 | $ | 804,626 | ||||||||||
79
Table of Contents
SIERRA BANCORP AND SUBSIDIARY
NOTES TO CONSOLIDATED FINANCIAL STATEMENTS
(Continued)
| 4. | LOANS AND LEASES (Continued) |
A summary of the transactions in the allowance for loan and lease losses follows (dollars in thousands):
| Year Ended December 31, | ||||||||||||
| 2010 | 2009 | 2008 | ||||||||||
| Balance, beginning of year |
$ | 23,715 | $ | 15,094 | $ | 12,276 | ||||||
| Provision for loan and lease losses |
16,680 | 21,574 | 19,456 | |||||||||
| Losses charged to allowance |
(20,337 | ) | (14,404 | ) | (17,225 | ) | ||||||
| Recoveries |
1,080 | 1,451 | 587 | |||||||||
| Balance, end of year |
$ | 21,138 | $ | 23,715 | $ | 15,094 | ||||||
The allocation of the allowance for loan losses by portfolio segment at December 31, 2010 was as follows (dollars in thousands):
| Evaluated for Impairment | ||||||||||||
| Allowance for Loan Losses |
Individually | Collectively | Totals | |||||||||
| Real Estate: |
||||||||||||
| 1-4 Family residential construction |
$ | 1,198 | $ | 15 | $ | 1,213 | ||||||
| Other construction/land |
347 | 504 | 851 | |||||||||
| 1-4 Family – closed-end |
690 | 480 | 1,170 | |||||||||
| Equity lines |
378 | 895 | 1,273 | |||||||||
| Multi-family residential |
37 | 12 | 49 | |||||||||
| Commercial RE – owner occupied |
388 | 1,528 | 1,916 | |||||||||
| Commercial RE – non owner occupied |
2,192 | 1,410 | 3,602 | |||||||||
| Farmland |
— | 69 | 69 | |||||||||
| Total Real Estate |
5,230 | 4,913 | 10,143 | |||||||||
| Agricultural |
— | 62 | 62 | |||||||||
| Commercial and Industrial |
1,021 | 5,358 | 6,379 | |||||||||
| Small Business Administration Loans |
1,091 | 183 | 1,274 | |||||||||
| Direct finance leases |
123 | 161 | 284 | |||||||||
| Consumer loans |
564 | 2,432 | 2,996 | |||||||||
| Total Allowance for loan losses |
$ | 8,029 | $ | 13,109 | $ | 21,138 | ||||||
80
Table of Contents
SIERRA BANCORP AND SUBSIDIARY
NOTES TO CONSOLIDATED FINANCIAL STATEMENTS
(Continued)
| 4. | LOANS AND LEASES (Continued) |
The recorded investment in loans by impairment method as of December 31, 2010 was as follows (dollars in thousands):
| Evaluated for Impairment | ||||||||||||
| Loans |
Individually | Collectively | Totals | |||||||||
| Real Estate: |
||||||||||||
| 1-4 Family residential construction |
$ | 4,057 | $ | 9,809 | $ | 13,866 | ||||||
| Other construction/land |
7,669 | 44,378 | 52,047 | |||||||||
| 1-4 Family – closed-end |
12,331 | 92,214 | 104,545 | |||||||||
| Equity lines |
1,239 | 69,544 | 70,783 | |||||||||
| Multi-family residential |
2,956 | 8,006 | 10,962 | |||||||||
| Commercial RE – owner occupied |
7,691 | 180,279 | 187,970 | |||||||||
| Commercial RE – non owner occupied |
27,109 | 93,391 | 120,500 | |||||||||
| Farmland |
405 | 60,888 | 61,293 | |||||||||
| Total Real Estate |
63,457 | 558,509 | 621,966 | |||||||||
| Agricultural |
— | 13,457 | 13,457 | |||||||||
| Commercial and Industrial |
2,104 | 92,664 | 94,768 | |||||||||
| Small Business Administration Loans |
3,441 | 15,175 | 18,616 | |||||||||
| Direct finance leases |
501 | 9,733 | 10,234 | |||||||||
| Consumer loans |
1,544 | 44,041 | 45,585 | |||||||||
| Total Gross Loans and Leases |
$ | 71,047 | $ | 733,579 | $ | 804,626 | ||||||
Past due and nonaccrual loans as of December 31, 2010 were as follows (dollars in thousands):
| Still Accruing | Nonaccrual | |||||||||||
| 30-89 Days Past Due |
Over 90 Days Past Due |
|||||||||||
| Real Estate: |
||||||||||||
| Commercial and land development |
$ | 14,747 | $ | — | $ | 10,241 | ||||||
| 1-4 Family residential |
6,491 | — | 6,134 | |||||||||
| Multifamily residential |
2,634 | — | — | |||||||||
| Commercial real estate and other |
5,078 | — | 22,521 | |||||||||
| Commercial and industrial |
3,400 | — | 5,946 | |||||||||
| Consumer and other |
1,183 | — | 1,112 | |||||||||
| $ | 33,533 | $ | — | $ | 45,954 | |||||||
The loans may or may not be collateralized, and collection efforts are continuously pursued. Loans or leases may be restructured by management when a borrower has experienced some change in financial status causing an inability to meet the original repayment terms and where the Company believes the borrower will eventually overcome those circumstances and make full restitution. Loans and leases are charged off when they are deemed to be uncollectible, while recoveries are generally recorded only when cash payments are received subsequent to the charge-off.
81
Table of Contents
SIERRA BANCORP AND SUBSIDIARY
NOTES TO CONSOLIDATED FINANCIAL STATEMENTS
(Continued)
| 4. | LOANS AND LEASES (Continued) |
The following is a summary of information pertaining to impaired and non-accrual loans (dollars in thousands):
| December 31, | ||||||||
| 2010 | 2009 | |||||||
| Impaired loans without a valuation allowance |
$ | 32,035 | $ | 28,650 | ||||
| Impaired loans with a valuation allowance |
39,012 | 66,598 | ||||||
| Total impaired loans |
$ | 71,047 | $ | 95,248 | ||||
| Valuation allowance related to impaired loans |
$ | 8,029 | $ | 11,346 | ||||
| Total non-accrual loans |
$ | 45,954 | $ | 46,974 | ||||
| Total loans past-due ninety days or more and still accruing |
$ | — | $ | — | ||||
Individually impaired loans as of December 31, 2010 were as follows (dollars in thousands):
| Unpaid Principal Balance |
Recorded Investment |
Related Allowance |
Average Recorded Investment |
Interest Income Recognized |
||||||||||||||||
| With an Allowance Recorded |
||||||||||||||||||||
| Real Estate: |
||||||||||||||||||||
| Construction and land development |
$ | 6,493 | $ | 5,306 | $ | 1,544 | $ | 10,938 | $ | 43 | ||||||||||
| 1-4 Family residential |
8,047 | 8,208 | 1,068 | 8,279 | 181 | |||||||||||||||
| Multifamily residential |
2,956 | 2,963 | 37 | 2,966 | 212 | |||||||||||||||
| Commercial real estate and other |
15,749 | 16,216 | 2,580 | 18,203 | 155 | |||||||||||||||
| Commercial and industrial |
6,065 | 6,114 | 2,235 | 6,670 | 1 | |||||||||||||||
| Consumer and other |
1,170 | 1,205 | 565 | 1,227 | 18 | |||||||||||||||
| 40,480 | 40,012 | 8,029 | 48,283 | 610 | ||||||||||||||||
| With no Related |
||||||||||||||||||||
| Allowance Recorded |
||||||||||||||||||||
| Real Estate |
||||||||||||||||||||
| Construction and land development |
10,264 | 7,670 | — | 11,545 | 129 | |||||||||||||||
| 1-4 Family residential |
5,782 | 5,607 | — | 5,964 | 99 | |||||||||||||||
| Multifamily residential |
— | — | — | — | — | |||||||||||||||
| Commercial real estate and other |
19,456 | 19,920 | — | 20,140 | 736 | |||||||||||||||
| Commercial and industrial |
6 | 6 | — | 9 | — | |||||||||||||||
| Consumer and other |
374 | 377 | — | 395 | 1 | |||||||||||||||
| 35,882 | 33,580 | — | 38,053 | 965 | ||||||||||||||||
| Total |
$ | 76,362 | $ | 73,592 | $ | 8,029 | $ | 86,336 | $ | 1,575 | ||||||||||
| Years Ended December 31, | ||||||||||||
| 2010 | 2009 | 2008 | ||||||||||
| Average investment in impaired loans |
$ | 86,336 | $ | 62,101 | $ | 12,253 | ||||||
| Interest income recognized on impaired loans |
$ | 1,575 | $ | 1,325 | $ | — | ||||||
| Interest income recognized on a cash basis on impaired loans |
$ | — | $ | — | $ | — | ||||||
82
Table of Contents
SIERRA BANCORP AND SUBSIDIARY
NOTES TO CONSOLIDATED FINANCIAL STATEMENTS
(Continued)
| 4. | LOANS AND LEASES (Continued) |
Included in loans above are troubled debt restructurings that were classified as impaired. The Company had $24,000 and $0 commercial loans, $33,112,000 and $41,867,000 real estate secured
loans and $548,000 and $216,000 consumer loans that were modified in troubled debt restructurings and impaired at December 31, 2010 and 2009, respectively.
Additional commitments to existing customers with restructured loans totaled $221,000 and $396,000 with $119,000 and $182,000 outstanding at December 31, 2010 and 2009 respectively.
The following is a summary of interest income from non-accrual loans in the portfolio at year-end that was not recognized (dollars in thousands):
| Years Ended December 31, | ||||||||||||
| 2010 | 2009 | 2008 | ||||||||||
| Interest that would have been recorded under the loans’ original terms |
$ | 3,929 | $ | 3,485 | $ | 2,708 | ||||||
| Less gross interest recorded |
1,219 | 1,191 | 1,140 | |||||||||
| Foregone interest |
$ | 2,710 | $ | 2.294 | $ | 1,568 | ||||||
Certain loans have been pledged to secure short-term borrowing arrangements (see Note 8). These loans totaled $368,139,000 and $426,469,000 at December 31, 2010 and 2009, respectively.
Salaries and employee benefits totaling $2,376,000, $2,554,000, and $3,415,000 have been deferred as loan and lease origination costs to be amortized over the estimated lives of the related loans and leases for the years ended December 31, 2010, 2009 and 2008, respectively.
Loan Servicing
The Bank originates mortgage loans for sale to investors. During the years ended December 31, 2010, 2009, and 2008, mortgage loans were sold without retention of related servicing. The Bank’s servicing portfolio at December 31, 2010 and 2009 totaled $4,778,000 and $8,132,000, respectively. At December 31, 2010, loans were principally serviced for one investor.
| 5. | PREMISES AND EQUIPMENT |
Premises and equipment at cost, consisted of the following (dollars in thousands):
| December 31, | ||||||||
| 2010 | 2009 | |||||||
| Land |
$ | 2,549 | $ | 2,549 | ||||
| Buildings and improvements |
12,322 | 11,720 | ||||||
| Furniture, fixtures and equipment |
21,378 | 22,902 | ||||||
| Leasehold improvements |
9,880 | 9,871 | ||||||
| 46,129 | 47,042 | |||||||
| Less accumulated depreciation and amortization |
26,972 | 27,057 | ||||||
| Construction in progress |
1,033 | 84 | ||||||
| $ | 20,190 | $ | 20,069 | |||||
Depreciation and amortization included in occupancy and equipment expense totaled $2,496,000, $2,668,000, and $2,552,000, for the years ended December 31, 2010, 2009 and 2008, respectively.
83
Table of Contents
SIERRA BANCORP AND SUBSIDIARY
NOTES TO CONSOLIDATED FINANCIAL STATEMENTS
(Continued)
| 6. | OTHER ASSETS |
Other assets consisted of the following (dollars in thousands):
| December 31, | ||||||||
| 2010 | 2009 | |||||||
| Accrued interest receivable |
$ | 5,673 | $ | 5,977 | ||||
| Deferred tax assets |
13,506 | 9,264 | ||||||
| Prepaid taxes |
1,274 | 645 | ||||||
| Investment in limited partnerships |
10,899 | 11,960 | ||||||
| Federal Home Loan Bank stock, at cost |
7,985 | 8,985 | ||||||
| Cash surrender value of officer life insurance policies |
31,591 | 30,069 | ||||||
| Other |
9,424 | 11,049 | ||||||
| $ | 80,352 | $ | 77,949 | |||||
The Company has invested in limited partnerships that operate qualified affordable housing projects to receive tax benefits in the form of tax deductions from operating losses and tax credits. The Company accounts for these investments under the cost method and management analyzes these investments annually for potential impairment. The Company has remaining capital commitments to these partnerships at December 31, 2010 in the amount of approximately $417,000. Such amounts are included in other liabilities on the consolidated balance sheet.
The Company holds certain equity investments that are not readily marketable securities and thus are classified as “other assets” on the Company’s balance sheet. These include investments in Pacific Coast Bankers Bancshares, California Economic Development Lending Initiative, and the Federal Home Loan Bank (“FHLB”).
The largest of these is the Company’s $7,985,000 investment in FHLB stock. The FHLB requires an equity investment in an amount that is based on a percentage of the Company’s borrowing activity at the FHLB. The balance normally fluctuates with the Company’s level of borrowing; however, the FHLB had temporarily suspended their repurchase activities and did not repurchase excess stock in the 1st quarter of 2010 but did repurchase stock in the 2nd and 3rd quarter of 2010. The FHLB is monitoring its overall financial performance and level of capital to determine the status of capital stock repurchases in future quarters.
84
Table of Contents
SIERRA BANCORP AND SUBSIDIARY
NOTES TO CONSOLIDATED FINANCIAL STATEMENTS
(Continued)
| 7. | DEPOSITS |
Interest-bearing deposits consisted of the following (dollars in thousands):
| December 31, | ||||||||
| 2010 | 2009 | |||||||
| Savings |
$ | 74,682 | $ | 62,279 | ||||
| Money market |
156,170 | 165,097 | ||||||
| NOW accounts |
184,360 | 151,821 | ||||||
| CDAR’s, Under $100,000 |
1,614 | 12,937 | ||||||
| CDAR’s, $100,000 or more |
31,652 | 129,194 | ||||||
| Time, $100,000 or more |
187,665 | 195,510 | ||||||
| Time, Under $100,000 |
164,223 | 147,390 | ||||||
| Brokered Deposits |
— | 28,000 | ||||||
| $ | 800,366 | $ | 892,228 | |||||
Aggregate annual maturities of time deposits are as follows (dollars in thousands):
| Year Ending December 31, |
||||
| 2011 |
$ | 371,290 | ||
| 2012 |
10,574 | |||
| 2013 |
1,271 | |||
| 2014 |
862 | |||
| 2015 |
491 | |||
| Thereafter |
666 | |||
| $ | 385,154 | |||
Interest expense recognized on interest-bearing deposits consisted of the following (dollars in thousands):
| Year Ended December 31, | ||||||||||||
| 2010 | 2009 | 2008 | ||||||||||
| Savings |
$ | 174 | $ | 167 | $ | 200 | ||||||
| Money Market |
914 | 1,886 | 2,556 | |||||||||
| NOW accounts |
1,682 | 569 | 410 | |||||||||
| CDAR’s, under $100,000 |
48 | 363 | 3 | |||||||||
| CDAR’s, $100,000 or more |
573 | 1,841 | 1,505 | |||||||||
| Time, $100,000 or more |
1,283 | 2,136 | 4,672 | |||||||||
| Time, under $100,000 |
1,237 | 1,843 | 3,664 | |||||||||
| Brokered Deposits |
210 | 1,235 | 2,441 | |||||||||
| $ | 6,121 | $ | 10,040 | $ | 15,451 | |||||||
85
Table of Contents
SIERRA BANCORP AND SUBSIDIARY
NOTES TO CONSOLIDATED FINANCIAL STATEMENTS
(Continued)
| 8. | OTHER BORROWING ARRANGEMENTS |
Short-term borrowings consisted of the following (dollars in thousands).
| 2010 | 2009 | |||||||||||||||
| Amount | Rate | Amount | Fixed Rate | |||||||||||||
| As of December 31: |
||||||||||||||||
| Repurchase agreements |
$ | — | — | $ | — | — | ||||||||||
| Overnight Federal Home Loan |
||||||||||||||||
| Bank advances |
9,650 | .07 | % | — | — | |||||||||||
| Federal Home Loan Bank advances |
5,000 | 3.36 | % | 10,000 | 2.91 | % | ||||||||||
| $ | 14,650 | $ | 10,000 | |||||||||||||
The Company had fixed-rate, long-term debt of $15,000,000 with the Federal Home Loan Bank at December 31, 2010 which matures through 2013. The contractual maturities of long-term debt are as follows (dollars in thousands).
| Year Ending December 31, |
Amount | Weighted Average Rate |
||||||
| 2012 |
$ | 10,000 | 3.65 | % | ||||
| 2013 |
5,000 | 3.93 | % | |||||
The Company had unsecured lines of credit with its correspondent banks which, in the aggregate, amounted to $45,000,000 at December 31, 2010 and 2009, at interest rates which vary with market conditions. There was $0 outstanding under these lines of credit at December 31, 2010 and December 31, 2009, respectively.
At December 31, 2010, the Company had remaining borrowing capacity with the Federal Home Loan Bank of $66,724,000 secured by government agencies.
86
Table of Contents
SIERRA BANCORP AND SUBSIDIARY
NOTES TO CONSOLIDATED FINANCIAL STATEMENTS
(Continued)
| 9. | INCOME TAXES |
The provision for income taxes follows (dollars in thousands):
| Year Ended December 31, | ||||||||||||
| 2010 | 2009 | 2008 | ||||||||||
| Federal: |
||||||||||||
| Current |
$ | 1,354 | $ | 6,922 | $ | 3,180 | ||||||
| Deferred |
(1,974 | ) | (6,620 | ) | (684 | ) | ||||||
| (620 | ) | 302 | 2,496 | |||||||||
| State: |
||||||||||||
| Current |
1,331 | 2,431 | 1,308 | |||||||||
| Deferred |
(945 | ) | (2,125 | ) | 64 | |||||||
| 386 | 306 | 1,372 | ||||||||||
| $ | (234 | ) | $ | 608 | $ | 3,868 | ||||||
The components of the net deferred tax asset, included in other assets, are as follows (dollars in thousands):
| December 31, | ||||||||
| 2010 | 2009 | |||||||
| Deferred tax assets: |
||||||||
| Allowance for loan losses |
$ | 9,476 | $ | 9,971 | ||||
| Foreclosed assets |
3,331 | 868 | ||||||
| Deferred compensation |
3,223 | 2,748 | ||||||
| Accrued reserves |
910 | 327 | ||||||
| Other |
1,776 | 1,476 | ||||||
| Total deferred tax assets |
18,716 | 15,390 | ||||||
| Deferred tax liabilities: |
||||||||
| Premises and equipment |
(812 | ) | (1,478 | ) | ||||
| Deferred loan costs |
(2,128 | ) | (2,263 | ) | ||||
| Unrealized gain on securities available-for-sale |
(650 | ) | (1,973 | ) | ||||
| Other |
(1,620 | ) | (412 | ) | ||||
| Total deferred tax liabilities |
(5,210 | ) | (6,126 | ) | ||||
| Net deferred tax assets |
$ | 13,506 | $ | 9,264 | ||||
87
Table of Contents
SIERRA BANCORP AND SUBSIDIARY
NOTES TO CONSOLIDATED FINANCIAL STATEMENTS
(Continued)
| 9. | INCOME TAXES (Continued) |
The expense for income taxes differs from amounts computed by applying the statutory Federal income tax rates to income before income taxes. The significant items comprising these differences consisted of the following (dollars in thousands):
| Year Ended December 31, | ||||||||||||
| 2010 | 2009 | 2008 | ||||||||||
| Income tax expense at Federalstatutory rate |
$ | 2,779 | $ | 3,338 | $ | 6,048 | ||||||
| Increase (decrease) resulting from: |
||||||||||||
| State franchise tax expense, net of |
||||||||||||
| Federal tax effect |
282 | 505 | 1,122 | |||||||||
| Tax exempt income |
(923 | ) | (1,376 | ) | (767 | ) | ||||||
| Affordable housing tax credits |
(1,642 | ) | (1,674 | ) | (1,698 | ) | ||||||
| Other |
(730 | ) | (185 | ) | (837 | ) | ||||||
| $ | (234 | ) | $ | 608 | $ | 3,868 | ||||||
| Effective tax rate |
(3.3 | )% | 6.4 | % | 22.4 | % | ||||||
The Company is subject to federal income tax and income tax of the state of California. Our federal income tax returns for the years ended December 31, 2007, 2008 and 2009 are open to audit by the federal authorities and our California state tax returns for the years ended December 31, 2006, 2007, 2008 and 2009 are open to audit by the state authorities.
Recorded interest and penalties related to uncertain tax positions as part of income tax expense totaled $0, $0, and $(67) thousand for the years ended December 31, 2010, 2009, and 2008, respectively. We do not expect the total amount of unrecognized tax benefits to significantly increase or decrease within the next twelve months.
| 10. | SUBORDINATED DEBENTURES |
Sierra Statutory Trust II, (“Trust II”) and Sierra Capital Trust III (“Trust III”), (collectively, the “Trusts”) were formed by the Company for the sole purpose of issuing trust preferred securities fully and unconditionally guaranteed by the Company. For financial reporting purposes, the Trusts are not consolidated and the Floating Rate Junior Subordinated Deferrable Interest Debentures (the “Subordinated Debentures”) held by the Trusts and issued and guaranteed by the Company are reflected in the Company’s consolidated balance sheet in accordance with provisions of FIN 46. Under applicable regulatory guidance, the amount of trust preferred securities that is eligible as Tier 1 capital is limited to twenty-five percent of the company’s Tier 1 capital on a pro forma basis. At December 31, 2010, $30,000,000 of trust preferred securities qualified as Tier 1 capital.
During the first quarter of 2004, Sierra Statutory Trust II issued 15,000 Floating Rate Capital Trust Pass-Through Securities (TRUPS II), with a liquidation value of $1,000 per security, for gross proceeds of $15,000,000. The entire proceeds of the issuance were invested by Trust II in $15,464,000 of Subordinated Debentures issued by the Company, with identical maturity, re-pricing and payment terms as the TRUPS II. The Subordinated Debentures, purchased by Trust II, represent the sole assets of the Trust II. Those Subordinated Debentures mature on March 17, 2034, bear a current interest rate of 3.05% (based on 3-month LIBOR plus 2.75%), with re-pricing and payments due quarterly.
88
Table of Contents
SIERRA BANCORP AND SUBSIDIARY
NOTES TO CONSOLIDATED FINANCIAL STATEMENTS
(Continued)
| 10. | SUBORDINATED DEBENTURES (Continued) |
Those Subordinated Debentures are currently redeemable by the Company, subject to receipt by the Company of prior approval from the Federal Reserve Bank, on any March 17th, June 17th, September 17th, and December 17th. The redemption price is par plus accrued and unpaid interest, except in the case of redemption under a special event which is defined in the debenture.
The TRUPS II are subject to mandatory redemption to the extent of any early redemption of the related Subordinated Debentures and upon maturity of the Subordinated Debentures on March 17, 2034.
The Trust II has the option to defer payment of the distributions for a period of up to five years, as long as the Company is not in default on the payment of interest on the Subordinated Debentures. The TRUPS II issued in the offering were sold in private transactions pursuant to an exemption from registration under the Securities Act of 1933, as amended. The Company has guaranteed, on a subordinated basis, distributions and other payments due on the TRUPS II.
During the second quarter of 2006, Sierra Capital Trust III issued 15,000 Floating Rate Capital Trust Pass-Through Securities (TRUPS III), with a liquidation value of $1,000 per security, for gross proceeds of $15,000,000. The entire proceeds of the issuance were invested by Trust III in $15,464,000 of Subordinated Debentures issued by the Company, with identical maturity, repricing and payment terms as the TRUPS III. The Subordinated Debentures, purchased by Trust III, represent the sole assets of the Trust III. Those Subordinated Debentures mature on September 23, 2036, bear a current interest rate of 1.70% (based on 3-month LIBOR plus 1.40%), with repricing and payments due quarterly.
Those Subordinated Debentures are redeemable by the Company, subject to receipt by the Company of prior approval from the Federal Reserve Bank, on any March 23rd, June 23rd, September 23rd, and December 23rd after September 23, 2011. The redemption price is par plus accrued and unpaid interest, except in the case of redemption under a special event which is defined in the debenture. The TRUPS III are subject to mandatory redemption to the extent of any early redemption of the related Subordinated Debentures and upon maturity of the Subordinated Debentures on September 23, 2036.
The Trust III has the option to defer payment of the distributions for a period of up to five years, as long as the Company is not in default on the payment of interest on the Subordinated Debentures. The TRUPS III issued in the offering were sold in private transactions pursuant to an exemption from registration under the Securities Act of 1933, as amended. The Company has guaranteed, on a subordinated basis, distributions and other payments due on the TRUPS III.
89
Table of Contents
SIERRA BANCORP AND SUBSIDIARY
NOTES TO CONSOLIDATED FINANCIAL STATEMENTS
(Continued)
| 11. | COMMITMENTS AND CONTINGENCIES |
Leases
The Company leases certain of its branch facilities and administrative offices under non-cancelable operating leases. Rental expense included in occupancy and equipment and other expense totaled $1,343,000, $1,322,000 and $1,057,000 for the years ended December 31, 2010, 2009 and 2008, respectively.
Future minimum lease payments on non-cancelable operating leases are as follows:
| Year Ending December 31, |
||||
| 2011 |
$ | 1,120,000 | ||
| 2012 |
1,095,000 | |||
| 2013 |
859,000 | |||
| 2014 |
631,000 | |||
| 2015 |
630,000 | |||
| Thereafter |
3,093,000 | |||
| $ | 7,428,000 | |||
The Company has options to renew its branch facilities and administrative office after the initial leases expire. The renewal options range from one to ten years and are not included in the payments reflected above.
Federal Reserve Requirements
Banks are required to maintain reserves with the Federal Reserve Bank equal to a specified percentage of their reservable deposits less vault cash. The reserve balances maintained at the Federal Reserve Bank at December 31, 2010 and 2009 were $33,152,000 and $41,612,000, respectively.
Financial Instruments With Off-Balance-Sheet Risk
The Company is a party to financial instruments with off-balance-sheet risk in the normal course of business. These financial instruments consist of commitments to extend credit and standby letters of credit. These instruments involve, to varying degrees, elements of credit and interest rate risk in excess of the amount recognized in the consolidated balance sheet.
The Company’s exposure to credit loss in the event of nonperformance by the other party for commitments to extend credit and letters of credit is represented by the contractual amount of those instruments. The Bank uses the same credit policies in making commitments and letters of credit as it does for loans included on the balance sheet.
The following financial instruments represent off-balance-sheet credit risk (dollars in thousands):
| December 31, | ||||||||
| 2010 | 2009 | |||||||
| Commitments to extend credit |
$ | 142,309 | $ | 162,012 | ||||
| Standby letters of credit |
$ | 7,761 | $ | 10,071 | ||||
| Commercial and similar letter of credit |
$ | 9,435 | $ | 10,772 | ||||
90
Table of Contents
SIERRA BANCORP AND SUBSIDIARY
NOTES TO CONSOLIDATED FINANCIAL STATEMENTS
(Continued)
| 11. | COMMITMENTS AND CONTINGENCIES (Continued) |
Commitments to extend credit consist primarily of unfunded single-family residential and commercial real estate construction loans and commercial revolving lines of credit. Construction loans are established under standard underwriting guidelines and policies and are secured by deeds of trust, with disbursements made over the course of construction. Commercial revolving lines of credit have a high degree of industry diversification. Commitments generally have fixed expiration dates or other termination clauses and may require payment of a fee. Since many of the commitments are expected to expire without being drawn upon, the total commitment amounts do not necessarily represent future cash requirements. Commitments to extend credit are made at both fixed and variable rates of interest. At December 31, 2010, the Company had $10,869,000 in fixed rate commitments and $131,439,000 in variable rate commitments. Standby letters of credit are issued by the Company to guarantee the performance of a customer to a third party and are made at variable rates of interest. The credit risk involved in issuing letters of credit is essentially the same as that involved in extending loans to customers.
Concentration in Real Estate Lending
At December 31, 2010, in management’s judgment, a concentration of loans existed in real estate related loans. At that date, approximately 77% of the Company’s loans were real estate related. Balances secured by commercial buildings and construction and development loans represented 63% of all real estate loans, while loans secured by non-construction residential properties accounted for 28%, and loans secured by farmland were 9% of real estate loans. Although management believes the loans within these concentrations have no more than the normal risk of collectability, a substantial decline in the performance of the economy in general or a decline in real estate values in the Company’s primary market areas, in particular, could have an adverse impact on collectability.
Concentration by Geographic Location
The Company grants commercial, real estate mortgage, real estate construction and consumer loans to customers primarily in the South Central San Joaquin Valley of California, specifically Tulare, Fresno, Kern, Kings and Madera counties. The ability of a substantial portion of the Bank’s customers to honor their contracts is dependent on the economy in these areas. Although the Bank’s loan portfolio is diversified, there is a relationship in this region between the local agricultural economy and the economic performance of loans made to non-agricultural customers.
Contingencies
The Company is subject to legal proceedings and claims which arise in the ordinary course of business. In the opinion of management, the amount of ultimate liability with respect to such actions will not materially affect the consolidated financial position or results of operations of the Company.
| 12. | SHAREHOLDERS’ EQUITY |
Share Repurchase Plan
At December 31, 2010, the Company had a stock repurchase plan which was effective July 1, 2003 and has no expiration date. The repurchase program initially provided that up to 250,000 shares of Sierra Bancorp’s common stock could be repurchased by the Company from time to time. That amount was supplemented by 250,000 on May, 19, 2005, another 250,000 shares on March 16, 2006, and an additional 500,000 shares on April 19, 2007.
During the year ended December 31, 2010, the Company did not repurchase any shares, leaving 100,669 shares available for repurchase. Repurchases are generally made in the open market at market prices.
91
Table of Contents
SIERRA BANCORP AND SUBSIDIARY
NOTES TO CONSOLIDATED FINANCIAL STATEMENTS
(Continued)
| 12. | SHAREHOLDERS’ EQUITY (Continued) |
Earnings Per Share
A reconciliation of the numerators and denominators of the basic and diluted earnings per share computations is as follows:
| For the Year Ended December 31, | ||||||||||||
| 2010 | 2009 | 2008 | ||||||||||
| Basic Earnings Per Share |
||||||||||||
| Net income (dollars in thousands) |
$ | 7,363 | $ | 8,928 | $ | 13,413 | ||||||
| Weighted average shares outstanding |
12,109,717 | 10,343,502 | 9,607,184 | |||||||||
| Basic earnings per share |
$ | .61 | $ | .86 | $ | 1.40 | ||||||
| Diluted Earnings Per Share |
||||||||||||
| Net income (dollars in thousands) |
$ | 7,363 | $ | 8,928 | $ | 13,413 | ||||||
| Weighted average shares outstanding |
12,109,717 | 10,343,502 | 9,607,184 | |||||||||
| Effect of dilutive stock options |
82,628 | 71,582 | 172,473 | |||||||||
| Weighted average diluted shares outstanding |
12,192,345 | 10,415,084 | 9,779,657 | |||||||||
| Diluted earnings per share |
$ | .60 | $ | .86 | $ | 1.37 | ||||||
Stock Options
In June 1998, Bank of the Sierra adopted the 1998 Stock Option Plan (the “1998 Plan”) for which shares were reserved for issuance to employees and directors under incentive and non-statutory agreements. The 1998 Plan was assumed by the Company effective August 10, 2001. The 1998 Plan covered a total of 2,763,684 shares of the Bank’s authorized and unissued common stock, of which two-thirds were reserved for the grant of options to full-time salaried officers and employees of the Company. The remaining one-third of the shares were available for grant to anyone eligible to participate in the 1998 Plan, including directors, officers and employees. The 1998 Plan requires that the option price may not be less than the fair market value of the stock at the date the option is granted, and that the option price must be paid in full at exercise. The options under the 1998 Plan expire on dates determined by the Board of Directors, but not later than ten years from the date of grant. The vesting period is determined by the Board of Directors and is generally five years. For participants with 10 years of service at the date of grant, options vest immediately. Effective May 23, 2007, the 1998 Plan was terminated and no further options may be granted thereunder, but the options granted and outstanding under the 1998 Plan on the date of termination were not affected.
On March 15, 2007 the Board of Directors approved and adopted the Company’s 2007 Stock Incentive Plan (the “2007 Plan”), which was approved by the Company’s shareholders on May 23, 2007. The 2007 Plan provides for the issuance of both “incentive” and “nonqualified” stock options to officers and employees, and of “nonqualified” stock options to non-employee directors, of the Company and its subsidiaries. The 2007 Plan also provides for the issuance of restricted stock awards to these same classes of eligible participants, which awards may be granted on such terms and conditions as are established by the Board of Directors or the Compensation Committee in its discretion. We have not issued, nor do we currently have plans to issue, restricted stock awards.
92
Table of Contents
SIERRA BANCORP AND SUBSIDIARY
NOTES TO CONSOLIDATED FINANCIAL STATEMENTS
(Continued)
| 12. | SHAREHOLDERS’ EQUITY (Continued) |
The maximum number of shares to be issued under the 2007 Plan is 1,500,000 shares of the Company’s authorized but unissued common stock, subject to adjustment for stock splits and dividends. This maximum number covers both restricted stock awards and stock options to be granted under the 2007 Plan, and is in addition to options covering 358,858 shares currently outstanding under the 1998 Plan at December 31, 2010.
All options under the 2007 Plan must be granted at an exercise price of not less than 100% of the fair market value of the stock on the date of grant, and will be exercisable in installments as provided in individual stock option agreements. In the event of a “Change in Control” as defined in the 2007 Plan, all outstanding options thereunder shall become exercisable in full (subject to certain notification requirements), and shall terminate if not exercised within a specified period of time, unless such options are assumed by the successor corporation or substitute options are granted. Options will terminate in the event an optionee ceases to be employed by or to serve as a director of the Company or its subsidiaries, and the vested portion thereof must be exercised within 30 days after such cessation of employment or service.
A summary of the activity of the Plan follows (shares in thousands, except exercise price):
| 2010 | 2009 | 2008 | ||||||||||||||||||||||||||
| Shares | Weighted Average Exercise Price |
Aggregate Intrinsic Value (1) |
Shares | Weighted Average Exercise Price |
Shares | Weighted Average Exercise Price |
||||||||||||||||||||||
| Outstanding, beginning of year |
757 | $ | 15.11 | 592 | $ | 17.11 | 750 | $ | 14.61 | |||||||||||||||||||
| Exercised |
(31 | ) | $ | 7.69 | (12 | ) | $ | 7.69 | (186 | ) | $ | 8.74 | ||||||||||||||||
| Granted |
180 | $ | 10.73 | 194 | $ | 8.80 | 87 | $ | 19.29 | |||||||||||||||||||
| Canceled |
(71 | ) | $ | 17.48 | (17 | ) | $ | 18.21 | (59 | ) | $ | 14.98 | ||||||||||||||||
| Outstanding, end of year |
835 | $ | 14.24 | 1,029 | 757 | $ | 15.11 | 592 | $ | 17.11 | ||||||||||||||||||
| Exercisable, end of year(2) |
553 | $ | 14.97 | 839 | 492 | $ | 14.84 | 412 | $ | 14.32 | ||||||||||||||||||
| (1) | The aggregate intrinsic value of a stock option in the table above represents the total pre-tax intrinsic value (the amount by which the current market value of the underlying stock exceeds the exercise price of the option) that would have been received by the option holders had all option holders exercised their options on December 31, 2010. This amount changes based on changes in the market value of the Company’s stock. |
| (2) | The weighted average remaining contractual life of stock options outstanding and exercisable on December 31, 2010 was 6.3 years and 4.9 years, respectively. |
Information related to the stock option plan during each year follows (dollars in thousands):
| 2010 | 2009 | 2008 | ||||||||||
| Total fair value of stock options vested |
$ | 839 | $ | 216 | $ | 3,316 | ||||||
| Total intrinsic value of stock options exercised |
$ | 118 | $ | 55 | $ | 2,009 | ||||||
Cash received from the exercise of 31,250 shares was $242,000 for the period ended December 31, 2010 with a related tax benefit of $19,000.
93
Table of Contents
SIERRA BANCORP AND SUBSIDIARY
NOTES TO CONSOLIDATED FINANCIAL STATEMENTS
(Continued)
| 12. | SHAREHOLDERS’ EQUITY (Continued) |
The Company is using the Black-Scholes model to value stock options. According to U.S. GAAP a charge of $385,000 is reflected in the Company’s income statement at December 31, 2010, as a pre-tax compensation and directors’ expense related to outstanding and unvested stock options. The related tax benefit of these options is $159,000 for the year ended December 31, 2010.
Unamortized compensation, and directors expense on unvested stock options outstanding at December 31, 2010 was $534,000 and will be recognized in future periods over 4.9 years.
| 13. | REGULATORY MATTERS |
The Company and the Bank are subject to certain regulatory requirements administered by the Board of Governors of the Federal Reserve System and the FDIC. Failure to meet these minimum capital requirements can initiate certain mandatory and possibly additional discretionary, actions by regulators that, if undertaken, could have a direct material effect on the Company’s consolidated financial statements. Under capital adequacy guidelines and the regulatory framework for prompt corrective action, the Bank must meet specific capital guidelines that involve quantitative measures of the Bank’s assets, liabilities and certain off-balance-sheet items as calculated under regulatory accounting practices. The Company’s and the Bank’s capital amounts and classification are also subject to qualitative judgments by the regulators about components, risk weightings and other factors.
Quantitative measures established by regulation to ensure capital adequacy require the Company and the Bank to maintain minimum amounts and ratios of total and Tier 1 capital to risk-weighted assets and of Tier 1 capital to average assets. Each of these components is defined in the regulations. Management believes that the Company and the Bank meet all their capital adequacy requirements as of December 31, 2010 and 2009. In addition, as of December 31, 2010 and 2009, notification from the FDIC categorized the Bank as well capitalized under the regulatory framework for prompt corrective action. There are no conditions or events since that notification that management believes have changed the Bank’s category. To be categorized as well capitalized, the Bank must maintain minimum total risk-based, Tier 1 risk-based and leverage capital ratios as set forth below (dollars in thousands).
| 2010 | 2009 | |||||||||||||||
| Capital Amount |
Ratio | Capital Amount |
Ratio | |||||||||||||
| Leverage Ratio |
||||||||||||||||
| Sierra Bancorp and subsidiary |
$ | 179,771 | 13.84 | % | $ | 155,440 | 11.91 | % | ||||||||
| Minimum requirement for “Well-Capitalized” institution |
64,939 | 5.0 | % | 65,224 | 5.0 | % | ||||||||||
| Minimum regulatory requirement |
51,951 | 4.0 | % | 52,195 | 4.0 | % | ||||||||||
| Bank of the Sierra |
$ | 169,484 | 13.07 | % | $ | 148,952 | 11.44 | % | ||||||||
| Minimum requirement for “Well-Capitalized” institution |
64,821 | 5.0 | % | 65,127 | 5.0 | % | ||||||||||
| Minimum regulatory requirement |
51,857 | 4.0 | % | 52,101 | 4.0 | % | ||||||||||
| Tier 1 Risk-Based Capital Ratio |
||||||||||||||||
| Sierra Bancorp and subsidiary |
$ | 179,771 | 19.06 | % | $ | 155,440 | 15.41 | % | ||||||||
| Minimum requirement for “Well-Capitalized” institution |
56,581 | 6.0 | % | 60,529 | 6.0 | % | ||||||||||
| Minimum regulatory requirement |
37,720 | 4.0 | % | 40,352 | 4.0 | % | ||||||||||
| Bank of the Sierra |
$ | 169,484 | 18.04 | % | $ | 148,952 | 14.78 | % | ||||||||
| Minimum requirement for “Well-Capitalized” institution |
56,363 | 6.0 | % | 60,467 | 6.0 | % | ||||||||||
| Minimum regulatory requirement |
37,575 | 4.0 | % | 40,312 | 4.0 | % | ||||||||||
94
Table of Contents
SIERRA BANCORP AND SUBSIDIARY
NOTES TO CONSOLIDATED FINANCIAL STATEMENTS
(Continued)
| 13. | REGULATORY MATTERS (Continued) |
| Total Risk-Based Capital Ratio |
||||||||||||||||
| Sierra Bancorp and subsidiary |
$ | 191,676 | 20.33 | % | $ | 136,572 | 16.67 | % | ||||||||
| Minimum requirement for “Well-Capitalized” institution |
94,301 | 10.0 | % | 100,881 | 10.0 | % | ||||||||||
| Minimum regulatory requirement |
75,441 | 8.0 | % | 80,705 | 8.0 | % | ||||||||||
| Bank of the Sierra |
$ | 181,348 | 19.31 | % | $ | 161,689 | 16.04 | % | ||||||||
| Minimum requirement for “Well-Capitalized” institution |
93,938 | 10.0 | % | 100,779 | 10.0 | % | ||||||||||
| Minimum regulatory requirement |
75,150 | 8.0 | % | 80 623 | 8.0 | % | ||||||||||
In March 2005, the Board of Governors of the Federal Reserve System issued a final rule allowing bank holding companies to continue to include trust preferred securities in their Tier 1 capital for regulatory capital purposes. The amount that can be included is limited to 25% of all core capital elements, net of goodwill less any associated deferred tax liability. Amounts of restricted core capital elements in excess of these limits generally may be included in tier 2 capital. Since the Company had less than $15 billion in assets at December 31, 2010, under the Dodd-Frank Act, the Company will be able to continue to include its existing trust preferred securities in Tier 1 Capital to the extent permitted by FRB guidelines. There can be no assurance that the Federal Reserve will not impose further restrictions in the future on the inclusion of trust preferred securities in Tier 1 capital for regulatory capital purposes.
Dividend Restrictions
The Company’s ability to pay cash dividends is dependent on dividends paid to it by the Bank, and is also limited by state corporation law. The California General Corporation Law allows a California corporation to pay dividends if the Company’s retained earnings equal at least the amount of the proposed dividend. If the Company does not have sufficient retained earnings available for the proposed dividend, it may still pay a dividend to its shareholders if immediately after giving effect to the dividend the sum of the company’s assets (exclusive of goodwill and deferred charges) would be at least equal to 125% of its liabilities (not including deferred taxes, deferred income and other deferred liabilities) and the current assets of the company would be at least equal to its current liabilities, or, if the average of its earnings before taxes on income and before interest expense for the two preceding fiscal years was less than the average of its interest expense for the two preceding fiscal years, at least equal to 125% of its current liabilities.
Dividends from the Bank to the Company are restricted under California law to the lesser of the Bank’s retained earnings or the Bank’s net income for the latest three fiscal years, less dividends previously declared during that period, or, with the approval of the Department of Financial Institutions, to the greater of the retained earnings of the Bank, the net income of the Bank for its last fiscal year, or the net income of the Bank for its current fiscal year. As of December 31, 2010, the maximum amount available for dividend distribution under this restriction was approximately $13,563,000, less dividends actually paid by the Bank to the Company in 2010.
95
Table of Contents
SIERRA BANCORP AND SUBSIDIARY
NOTES TO CONSOLIDATED FINANCIAL STATEMENTS
(Continued)
| 14. | BENEFIT PLANS |
Salary Continuation Agreements, Directors’ Retirement and Officer Supplemental Life Insurance Plans
In 2002, the Company entered into salary continuation agreements with certain executive officers and also established a retirement plan for members of the Board of Directors. The plans provide for annual benefits for up to fifteen years after retirement or death. The benefit obligation under these plans totaled $4,218,000 and $3,791,000, and was fully accrued for the years ended December 31, 2010 and 2009, respectively. The expense recognized under these arrangements totaled $510,000, $514,000, and $518,000 for the years ended December 31, 2010, 2009 and 2008, respectively. There were no Death Benefits paid to Directors’ beneficiaries each of the years ended December 31, 2010 and 2009, respectively. Benefits paid to former executives of the Company totaled $49,000 for each of the years ended December 31, 2010, 2009 and 2008. The Company also provides benefits to former executives of Sierra National Bank under salary continuation plans that were in effect at the time Sierra National Bank was merged into Bank of the Sierra. The benefit obligation under these plans totaled $245,000, $288,000 and $329,000, and was fully accrued for the years ended December 31, 2010, 2009, and 2008, respectively. Benefits paid to former executives of SNB under this plan totaled $67,000, for each of the years ended December 31, 2010, 2009, and 2008, respectively. Certain officers of the Company have supplemental life insurance policies with death benefits available to the officers’ beneficiaries.
In connection with these plans, the Company purchased, or acquired through the merger, single premium life insurance policies with cash surrender values totaling $28,903,000 and $27,872,000 at December 31, 2010 and 2009, respectively. On the consolidated balance sheet, the cash surrender values are included in other assets.
Officer and Director Deferred Compensation Plan
The Company has established a deferred compensation plan for certain members of the management group and a deferred fee plan for directors for the purpose of providing the opportunity for participants to defer compensation. The Company bears the costs for the plan’s administration and the interest earned on participant deferrals. The related expense was not material for the years ended December 31, 2010, 2009 and 2008. In connection with this plan, life insurance policies with cash surrender values totaling $2,688,000 and $2,196,000 at December 31, 2010 and 2009, respectively, are included on the consolidated balance sheet in other assets.
401(k) Savings Plan
The 401(k) savings plan (the “Plan”) allows participants to defer, on a pre-tax basis, up to 15% of their salary (subject to Internal Revenue Service limitations) and accumulate tax-deferred earnings as a retirement fund. The Bank may make a discretionary contribution to match a specified percentage of the first 6% of the participants’ contributions annually. The amount of the matching contribution was 50% in 2010, 50% in 2009 and 50% in 2008, respectively. The matching contribution is discretionary, vests over a period of five years from the participants’ hire date and is subject to the approval of the Board of Directors. The Company contributed $286,000, $304,000 and $329,000 to the Plan in 2010, 2009 and 2008, respectively.
96
Table of Contents
SIERRA BANCORP AND SUBSIDIARY
NOTES TO CONSOLIDATED FINANCIAL STATEMENTS
(Continued)
| 15. | NON-INTEREST REVENUE |
The major grouping of non interest revenue on the consolidated income statements includes several specific items: service charges on deposit accounts, gain on sale of loans, credit card fees, check card fees, (loss) gain on sales and calls of investment securities available for sale, and increase in cash surrender value of life insurance.
Non-interest revenue also includes one general category of other income of which the following are major components (dollars in thousands):
| Year Ended December 31, | ||||||||||||
| 2010 | 2009 | 2008 | ||||||||||
| Included in other income: |
||||||||||||
| Loss on limited partnerships |
$ | (808 | ) | $ | (1,443 | ) | $ | (1,242 | ) | |||
| Gain on restricted stock |
— | — | 289 | |||||||||
| Dividends on Equity Investments |
52 | 61 | 584 | |||||||||
| Rental income on leases |
570 | 712 | 718 | |||||||||
| Other |
1,588 | 1,661 | 1,971 | |||||||||
| Total other non-interest revenue |
$ | 1,402 | $ | 991 | $ | 2,320 | ||||||
| 16. | OTHER OPERATING EXPENSE |
Other expense consisted of the following (dollars in thousands):
| Year Ended December 31, | ||||||||||||
| 2010 | 2009 | 2008 | ||||||||||
| Professional fees |
$ | 5,018 | $ | 6,122 | $ | 2,311 | ||||||
| Data processing |
1,737 | 1,406 | 1,311 | |||||||||
| Advertising and promotion |
1,979 | 1,872 | 2,289 | |||||||||
| Deposit services |
2,708 | 2,188 | 1,759 | |||||||||
| Stationery and supplies |
715 | 675 | 753 | |||||||||
| Telephone and data communication |
1,156 | 1,107 | 968 | |||||||||
| Loan and credit card processing |
765 | 960 | 673 | |||||||||
| Foreclosed assets expense |
6,168 | 1,827 | 579 | |||||||||
| Postage |
558 | 501 | 469 | |||||||||
| Other |
1,521 | 1,568 | 1,573 | |||||||||
| Total other non-interest expense |
$ | 22,325 | $ | 18,226 | $ | 12,685 | ||||||
97
Table of Contents
SIERRA BANCORP AND SUBSIDIARY
NOTES TO CONSOLIDATED FINANCIAL STATEMENTS
(Continued)
| 17. | RELATED PARTY TRANSACTIONS |
During the normal course of business, the Bank enters into loans with related parties, including executive officers and directors. These loans are made with substantially the same terms, including rates and collateral, as loans to unrelated parties. The following is a summary of the aggregate activity involving related party borrowers (dollars in thousands):
| Year Ended December 31, | ||||||||||||
| 2010 | 2009 | 2008 | ||||||||||
| Balance, beginning of year |
$ | 3,104 | $ | 3,477 | $ | 1,648 | ||||||
| Disbursements |
2,343 | 4,151 | 23,022 | |||||||||
| Amounts repaid |
(1,982 | ) | (4,127 | ) | (21,193 | ) | ||||||
| Decreased |
— | (397 | ) | — | ||||||||
| Balance, end of year |
$ | 3,465 | $ | 3,104 | $ | 3,477 | ||||||
| Undisbursed commitments to related parties |
$ | 1,433 | $ | 1,147 | $ | 841 | ||||||
Deposits from related parties held by the Bank at December 31, 2010 and 2009 amounted to $2,567,000 and $4,179,000 respectively.
98
Table of Contents
SIERRA BANCORP AND SUBSIDIARY
NOTES TO CONSOLIDATED FINANCIAL STATEMENTS
(Continued)
| 18. | OTHER COMPREHENSIVE INCOME |
Other comprehensive income consisted of the following (dollars in thousands):
| Before Tax |
Tax Benefit Expense |
After Tax |
||||||||||
| For the Year Ended December 31, 2010 |
||||||||||||
| Other comprehensive income: |
||||||||||||
| Unrealized holding losses |
$ | (501 | ) | $ | 235 | $ | (266 | ) | ||||
| Less: reclassification adjustment for net realized gains included in net income |
2,643 | (1,088 | ) | 1,555 | ||||||||
| Total other comprehensive expense |
$ | (3,144 | ) | $ | 1,323 | $ | (1,821 | ) | ||||
| For the Year Ended December 31, 2009 |
||||||||||||
| Other comprehensive income: |
||||||||||||
| Unrealized holding gains |
$ | 4,104 | $ | (1,726 | ) | $ | 2,378 | |||||
| Less: reclassification adjustment for net realized gains included in net income |
1,099 | (461 | ) | 638 | ||||||||
| Total other comprehensive income |
$ | 3,005 | $ | (1,265 | ) | $ | 1,740 | |||||
| For the Year Ended December 31, 2008 |
||||||||||||
| Other comprehensive income: |
||||||||||||
| Unrealized holding gains |
$ | 2,119 | $ | (891 | ) | $ | 1,228 | |||||
| Less: reclassification adjustment for net realized gains included in net income |
58 | (24 | ) | 34 | ||||||||
| Total other comprehensive income |
$ | 2,061 | $ | (867 | ) | $ | 1,194 | |||||
| 19. | FAIR VALUE |
Fair value is defined by U.S. GAAP as the exchange price that would be received for an asset or paid to transfer a liability (an exit price) in the principal or most advantageous market for the asset or liability in an orderly transaction between market participants on the measurement date. U.S. GAAP also establishes a fair value hierarchy which requires an entity to maximize the use of observable inputs and minimize the use of unobservable inputs when measuring fair value. The standard describes three levels of inputs that may be used to measure fair value:
| • | Level 1: Quoted prices (unadjusted) for identical assets or liabilities in active markets that the entity has the ability to access as of the measurement date. |
| • | Level 2: Significant observable inputs other than Level 1 prices, such as quoted prices for similar assets or liabilities, quoted prices in markets that are not active, and other inputs that are observable or can be corroborated by observable market data. |
| • | Level 3: Significant unobservable inputs that reflect a company’s own assumptions about the assumptions that market participants would use in pricing an asset or liability. |
99
Table of Contents
SIERRA BANCORP AND SUBSIDIARY
NOTES TO CONSOLIDATED FINANCIAL STATEMENTS
(Continued)
| 19. | FAIR VALUE (Continued) |
The Company used the following methods and significant assumptions to estimate fair values for each category of financial asset noted below:
| • | Securities: The fair values of securities available for sale are determined by obtaining quoted prices on nationally recognized securities exchanges or matrix pricing, which is a mathematical technique used widely in the industry to value debt securities without relying exclusively on quoted prices for the specific securities but rather by relying on the securities’ relationship to other benchmark quoted securities. |
| • | Loans held for sale: Since loans designated by the Company as available-for-sale are typically sold shortly after making the decision to sell them, realized gains or losses are usually recognized within the same period and fluctuations in fair values are thus not relevant for reporting purposes. If available for sale loans exist on our books as of a reporting date, the fair value of those loans is determined using quoted secondary-market prices. |
| • | Impaired loans: A specific loss allowance is created for impaired loans, representing the difference between the face value of the loan and either its current appraised value less estimated disposition costs, or its net present value as determined by a discounted cash flow analysis. |
| • | Foreclosed assets: Repossessed real estate (OREO) and other assets are acquired at fair value, which is the appraised value less expected selling costs for OREO and some other assets such as mobile homes, and estimated sales proceeds as determined by using reasonably available sources for all other assets. Foreclosed assets for which appraisals can be feasibly obtained are periodically measured for impairment using updated appraisals. Foreclosed assets are periodically re-evaluated by adjusting expected cash flows and timing of resolution, again using reasonably available sources. If impairment is determined to exist, the book value of a foreclosed asset is immediately written down to its estimated impaired value through the income statement, thus the carrying amount is equal to the fair value and there is no valuation allowance. |
100
Table of Contents
SIERRA BANCORP AND SUBSIDIARY
NOTES TO CONSOLIDATED FINANCIAL STATEMENTS
(Continued)
| 19. | FAIR VALUE (Continued) |
Assets and liabilities measured at fair value on a recurring basis, including financial liabilities for which the Company has elected the fair value option, are summarized below (dollars in thousands):
| December 31, 2010 | ||||||||||||||||
| Level 1 | Level 2 | Level 3 | Total | |||||||||||||
| Investment Securities |
||||||||||||||||
| U.S. Government agencies |
$ | — | $ | 5,062 | $ | — | $ | 5,062 | ||||||||
| Obligations of states and political subdivisions |
70,102 | — | 70,102 | |||||||||||||
| U.S. Government agencies collateralized by mortgage obligations |
255,143 | — | 255,143 | |||||||||||||
| Other Securities |
1,423 | — | — | 1,423 | ||||||||||||
| Total available-for-sale securities |
1,423 | 330,307 | — | 331,730 | ||||||||||||
| Loans Held for Sale |
914 | — | — | 914 | ||||||||||||
| Total |
$ | 2,337 | $ | 330,307 | $ | — | $ | 332,644 | ||||||||
| December 31, 2009 | ||||||||||||||||
| Level 1 | Level 2 | Level 3 | Total | |||||||||||||
| Investment Securities |
||||||||||||||||
| U.S. Government agencies |
$ | — | $ | 6,861 | $ | — | $ | 6,861 | ||||||||
| Obligations of states and political subdivisions |
— | 63,138 | — | 63,138 | ||||||||||||
| U.S. Government agencies collateralized by mortgage obligations |
— | 206,801 | — | 206,801 | ||||||||||||
| Other Securities |
1,361 | 7 | — | 1,368 | ||||||||||||
| Total available-for-sale securities |
1,361 | 276,807 | — | 278,168 | ||||||||||||
| Loans Held for Sale |
376 | — | — | 376 | ||||||||||||
| Total |
$ | 1,737 | $ | 276,807 | $ | — | $ | 278,544 | ||||||||
101
Table of Contents
SIERRA BANCORP AND SUBSIDIARY
NOTES TO CONSOLIDATED FINANCIAL STATEMENTS
(Continued)
| 19. | FAIR VALUE (Continued) |
Assets and liabilities measured at fair market value on a non-recurring basis are summarized below (dollars in thousands):
| December 31, 2010 | ||||||||||||||||
| Level 1 | Level 2 | Level 3 | Total | |||||||||||||
| Impaired Loans |
$ | — | $ | 29,482 | $ | 6,705 | $ | 36,187 | ||||||||
| Foreclosed Assets |
$ | — | $ | 3,123 | $ | 17,568 | $ | 20,691 | ||||||||
| December 31, 2009 | ||||||||||||||||
| Level 1 | Level 2 | Level 3 | Total | |||||||||||||
| Impaired Loans |
$ | — | $ | 46,852 | $ | 10,167 | $ | 57,019 | ||||||||
| Foreclosed Assets |
$ | — | $ | 25,594 | $ | 1,060 | $ | 26,654 | ||||||||
Impaired loans, which are measured for impairment using the fair value of the collateral for collateral dependent loans or discounted cash flows for non collateral dependent loans, had a carrying amount of $44,216,000 and $68,365,000, a valuation allowance of $8,029,000 and $11,346,000, resulting in additional provision for loan losses of $6,304,000 and $9,702,000 for the periods ending December 31, 2010, and 2009, respectively.
| 20. | DISCLOSURES ABOUT FAIR VALUE OF FINANCIAL INSTRUMENTS |
Disclosures include estimated fair values for financial instruments for which it is practicable to estimate fair value. These estimates are made at a specific point in time based on relevant market data and information about the financial instruments. These estimates do not reflect any premium or discount that could result from offering the Company’s entire holdings of a particular financial instrument for sale at one time, nor do they attempt to estimate the value of anticipated future business related to the instruments. In addition, the tax ramifications related to the realization of unrealized gains and losses can have a significant effect on fair value estimates and have not been considered in any of these estimates.
Because no market exists for a significant portion of the Company’s financial instruments, fair value estimates are based on judgments regarding current economic conditions, risk characteristics of various financial instruments and other factors. These estimates are subjective in nature and involve uncertainties and matters of significant judgment and therefore cannot be determined with precision. Changes in assumptions could significantly affect the fair values presented.
The following methods and assumptions were used by the Company to estimate the fair value of its financial instruments at December 31, 2010 and 2009:
Cash and cash equivalents and short-term borrowings: For cash and cash equivalents and short-term borrowings, the carrying amount is estimated to be fair value.
Investment securities: For investment securities, fair values are based on quoted market prices, where available. If quoted market prices are not available, fair values are estimated using quoted market prices for similar securities and indications of value provided by brokers.
Loans and leases: For variable-rate loans and leases that re-price frequently with no significant change in credit risk or interest rate spread, fair values are based on carrying values. Fair values for other loans and leases are estimated using discounted cash flow analyses, using interest rates being offered at each reporting date for loans and leases with similar terms to borrowers of comparable creditworthiness. Fair values of loans held for sale are estimated using quoted market prices for similar loans or the amount the purchasers have committed to purchase the loan. The carrying amount of accrued interest receivable approximates its fair value.
102
Table of Contents
SIERRA BANCORP AND SUBSIDIARY
NOTES TO CONSOLIDATED FINANCIAL STATEMENTS
(Continued)
| 20. | DISCLOSURES ABOUT FAIR VALUE OF FINANCIAL INSTRUMENTS (Continued) |
Cash surrender value of life insurance policies: The fair values are based on current cash surrender values at each reporting date provided by the insurers.
Investment in limited partnerships: The fair values of the investments in WNC Institutional Tax Credit Fund Limited Partnerships are estimated using quarterly indications of value provided by the general partner.
Other investments: Included in other assets are certain long-term investments carried at cost, which approximates estimated fair value.
Deposits: The fair values for demand deposits and other non-maturity deposits are, by definition, equal to the amount payable on demand at the reporting date represented by their carrying amount. Fair values for fixed-rate certificates of deposit are estimated using a discounted cash flow analysis using interest rates being offered at each reporting date by the Bank for certificates with similar remaining maturities. The carrying amount of accrued interest payable approximates its fair value.
Short-term borrowings: The carrying amounts of federal funds purchased, overnight FHLB advances, borrowings under repurchase agreements, and other short-term borrowings maturing within ninety days approximate their fair values. Fair values of other short-term borrowings are estimated using discounted cash flow analyses based on the Company’s current incremental borrowing rates for similar types of borrowing arrangements.
Long-term borrowings: The fair values of the Company’s long-term borrowings are estimated using discounted cash flow analyses based on the Company’s current incremental borrowing rates for similar types of borrowing arrangements.
Subordinated debentures: The fair value of subordinated debentures was determined based on the current market value for like kind instruments of a similar maturity and structure.
Limited partnership capital commitments: The fair value of the capital commitments to the WNC Institutional Tax Credit Fund Limited Partnerships are estimated using a discounted cash flow analysis using rates of return currently available for similar instruments.
Commitments to extend credit and letters of credit: Commitments to extend credit are primarily for adjustable rate loans. For these commitments, there are no differences between the committed amounts and their fair values. Commitments to fund fixed rate loans and letters of credit are at rates which approximate fair value at each reporting date.
103
Table of Contents
SIERRA BANCORP AND SUBSIDIARY
NOTES TO CONSOLIDATED FINANCIAL STATEMENTS
(Continued)
| 20. | DISCLOSURES ABOUT FAIR VALUE OF FINANCIAL INSTRUMENTS (Continued) |
Carrying amount and estimated fair values of financial instruments were as follows:
| December 31, 2010 | December 31, 2009 | |||||||||||||||
| (Dollars in thousands) | ||||||||||||||||
| Carrying Amount |
Fair Value | Carrying Amount |
Fair Value | |||||||||||||
| Financial assets: |
||||||||||||||||
| Cash and cash equivalents |
$ | 42,645 | $ | 42,645 | $ | 66,234 | $ | 66,234 | ||||||||
| Investment securities available for sale |
331,730 | 331,730 | 278,168 | 278,168 | ||||||||||||
| Loans and leases, net |
784,515 | 816,185 | 860,251 | 883,115 | ||||||||||||
| Cash surrender value of life insurance policies |
31,591 | 31,591 | 30,069 | 30,069 | ||||||||||||
| Other investments |
8,361 | 8,361 | 9,361 | 9,361 | ||||||||||||
| Investment in limited partnership |
10,899 | 10,899 | 11,960 | 11,960 | ||||||||||||
| Accrued interest receivable |
5,677 | 5,677 | 5,977 | 5,977 | ||||||||||||
| Financial liabilities: |
||||||||||||||||
| Deposits |
$ | 1,052,274 | $ | 1,052,085 | $ | 1,125,432 | $ | 1,125,917 | ||||||||
| Short-term borrowings |
14,650 | 14,650 | 10,000 | 0 | ||||||||||||
| Long-term borrowings |
15,000 | 15,736 | 20,000 | 30,947 | ||||||||||||
| Subordinated debentures |
30,928 | 11,610 | 30,928 | 15,310 | ||||||||||||
| Limited partnership capital commitment |
417 | 417 | 969 | 969 | ||||||||||||
| Accrued interest payable |
678 | 678 | 1,185 | 1,185 | ||||||||||||
| Off-balance-sheet financial instruments: |
||||||||||||||||
| Commitments to extend credit |
$ | 142,309 | $ | 142,309 | $ | 162,012 | $ | 162,012 | ||||||||
| Standby letters of credit |
7,761 | 7,761 | 10,071 | 10,071 | ||||||||||||
| Commercial lines of credit |
9,435 | 9,435 | 10,772 | 10,772 | ||||||||||||
104
Table of Contents
SIERRA BANCORP AND SUBSIDIARY
NOTES TO CONSOLIDATED FINANCIAL STATEMENTS
(Continued)
| 21. | PARENT ONLY CONDENSED FINANCIAL STATEMENTS |
BALANCE SHEETS
December 31, 2010 and 2009
(Dollars in thousands)
| 2010 | 2009 | |||||||
| ASSETS | ||||||||
| Cash and due from banks |
$ | 8,238 | $ | 4,622 | ||||
| Investment in bank subsidiary |
178,772 | 157,989 | ||||||
| Investment in Trust subsidiaries |
928 | 928 | ||||||
| Investment in other securities |
1,408 | 1,361 | ||||||
| Other assets |
1,250 | 686 | ||||||
| Total assets |
$ | 190,596 | $ | 165,586 | ||||
| LIABILITIES AND SHAREHOLDERS’ EQUITY | ||||||||
| Liabilities: |
||||||||
| Other liabilities |
$ | 70 | $ | 178 | ||||
| Subordinated debentures |
30,928 | 30,928 | ||||||
| Total liabilities |
30,998 | 31,106 | ||||||
| Shareholders’ equity: |
||||||||
| Common stock |
63,480 | 41,371 | ||||||
| Retained earnings |
95,220 | 90,390 | ||||||
| Accumulated other comprehensive income (loss), net of taxes |
898 | 2,719 | ||||||
| Total shareholders’ equity |
159,598 | 134,480 | ||||||
| Total liabilities and shareholders’ equity |
$ | 190,596 | $ | 165,586 | ||||
105
Table of Contents
SIERRA BANCORP AND SUBSIDIARY
NOTES TO CONSOLIDATED FINANCIAL STATEMENTS
(Continued)
| 21. | PARENT ONLY CONDENSED FINANCIAL STATEMENTS (Continued) |
STATEMENTS OF INCOME
For the Years Ended December 31, 2010, 2009 and 2008
(Dollars in thousands)
| 2010 | 2009 | 2008 | ||||||||||
| Income: |
||||||||||||
| Dividends declared by bank subsidiary – eliminated in consolidation |
$ | — | $ | 968 | $ | 18,517 | ||||||
| Other operating income |
— | 61 | 30 | |||||||||
| Total income |
— | 1,029 | 18,547 | |||||||||
| Expenses: |
||||||||||||
| Interest on subordinated debentures |
— | 915 | 1,644 | |||||||||
| Other expenses |
1,496 | 775 | 964 | |||||||||
| Total expenses |
1,496 | 1,690 | 2,608 | |||||||||
| Income before income taxes |
(1,496 | ) | (661 | ) | 15,939 | |||||||
| Income tax benefit |
(615 | ) | (670 | ) | (1,074 | ) | ||||||
| Income before equity in undistributed income of subsidiary |
(881 | ) | 9 | 17,013 | ||||||||
| Equity in (distributed) undistributed income of subsidiary |
8,244 | 8,919 | (3,600 | ) | ||||||||
| Net income |
$ | 7,363 | $ | 8,928 | $ | 13,413 | ||||||
106
Table of Contents
SIERRA BANCORP AND SUBSIDIARY
NOTES TO CONSOLIDATED FINANCIAL STATEMENTS
(Continued)
| 21. | PARENT ONLY CONDENSED FINANCIAL STATEMENTS (Continued) |
STATEMENTS OF CASH FLOWS
For the Years Ended December 31, 2010, 2009 and 2008
(Dollars in thousands)
| 2010 | 2009 | 2008 | ||||||||||
| Cash flows from operating activities: |
||||||||||||
| Net income |
$ | 7,363 | $ | 8,928 | $ | 13,413 | ||||||
| Adjustments to reconcile net income to net cash provided by operating activities: |
||||||||||||
| (Undistributed) distributed income of subsidiary |
(8,244 | ) | (8,919 | ) | 3,600 | |||||||
| (Increase)/decrease in other assets |
(565 | ) | (228 | ) | 184 | |||||||
| (Decrease)/increase in other liabilities |
(108 | ) | 184 | 59 | ||||||||
| Tax benefit from equity based compensation |
1 | 11 | 613 | |||||||||
| Net cash provided by/(used in) operating activities |
1,553 | (24 | ) | 17,869 | ||||||||
| Cash flows from investing activities: |
||||||||||||
| Purchases of investment securities available for sale |
— | — | (2,699 | ) | ||||||||
| Payments for investments in and advances to Subsidiaries |
(14,000 | ) | (20,434 | ) | — | |||||||
| Net cash used in investing activities |
(14,000 | ) | (20,434 | ) | (2,699 | ) | ||||||
| Cash flows from financing activities: |
||||||||||||
| Proceeds from exercise of stock options |
22,104 | 20,375 | — | |||||||||
| Common stock repurchase and retirement |
— | — | (2,080 | ) | ||||||||
| Stock options exercised |
— | 94 | 1,627 | |||||||||
| Dividends paid |
(2,935 | ) | (4,067 | ) | (6,536 | ) | ||||||
| Net cash provided by/(used in) financing activities |
19,169 | 16,402 | (6,989 | ) | ||||||||
| Net increase/(decrease) in cash and cash equivalents |
3,616 | (4,056 | ) | 8,181 | ||||||||
| Cash and cash equivalents, beginning of year |
4,622 | 8,678 | 497 | |||||||||
| Cash and cash equivalents, end of year |
$ | 8,238 | $ | 4,622 | $ | 8,678 | ||||||
107
Table of Contents
SIERRA BANCORP AND SUBSIDIARY
NOTES TO CONSOLIDATED FINANCIAL STATEMENTS
(Continued)
| 22. | CONDENSED QUARTERLY RESULTS OF OPERATIONS (UNAUDITED) |
The following table sets forth the Company’s results of operations for the four quarters of 2010 and 2009 and is unaudited. In management’s opinion, the results of operations reflect all adjustments (which include only recurring adjustments) necessary to present fairly the condensed results for such periods.
| 2010 Quarter Ended | ||||||||||||||||
| December 31, | September 30, | June 30, | March 31, | |||||||||||||
| Interest income |
$ | 15,360 | $ | 15,908 | $ | 16,216 | $ | 16,347 | ||||||||
| Interest expense |
1,668 | 1,886 | 2,048 | 2,047 | ||||||||||||
| Net interest income |
13,692 | 14,022 | 14,168 | 14,300 | ||||||||||||
| Provision for loan and lease losses |
3,400 | 6,380 | 3,500 | 3,400 | ||||||||||||
| Non-interest income |
2,958 | 7,053 | 3,989 | 3,861 | ||||||||||||
| Non-interest expense |
11,918 | 14,595 | 11,548 | 12,173 | ||||||||||||
| Net income before taxes |
1,333 | 100 | 3,109 | 2,588 | ||||||||||||
| Provision for taxes |
(261 | ) | (787 | ) | 565 | 249 | ||||||||||
| Net income |
$ | 1,594 | $ | 887 | $ | 2,544 | $ | 2,339 | ||||||||
| Diluted earnings per share |
$ | .11 | $ | .08 | $ | .22 | $ | .20 | ||||||||
| Cash dividend per share |
$ | .06 | $ | .06 | $ | .06 | $ | .06 | ||||||||
| 2009 Quarter Ended | ||||||||||||||||
| December 31, | September 30, | June 30, | March 31, | |||||||||||||
| Interest income |
$ | 17,552 | $ | 17,024 | $ | 17,869 | $ | 17,701 | ||||||||
| Interest expense |
2,305 | 2,703 | 3,269 | 3,900 | ||||||||||||
| Net interest income |
15,247 | 14,321 | 14,600 | 13,801 | ||||||||||||
| Provision for loan and lease losses |
3,598 | 10,473 | 3,902 | 3,601 | ||||||||||||
| Non-interest income |
4,043 | 5,558 | 4,238 | 3,440 | ||||||||||||
| Non-interest expense |
11,197 | 10,741 | 11,987 | 10,213 | ||||||||||||
| Net income before taxes |
4,495 | (1,335 | ) | 2,949 | 3,427 | |||||||||||
| Provision for taxes |
961 | (1,441 | ) | 356 | 732 | |||||||||||
| Net income |
$ | 3,534 | $ | 106 | $ | 2,593 | $ | 2,695 | ||||||||
| Diluted earnings per share |
$ | .30 | $ | .01 | $ | .27 | $ | .28 | ||||||||
| Cash dividend per share |
$ | .10 | $ | .10 | $ | .10 | $ | .10 | ||||||||
108
Table of Contents
ITEM 9. CHANGES IN AND DISAGREEMENTS WITH ACCOUNTANTS ON ACCOUNTING AND FINANCIAL DISCLOSURE
Not applicable.
| ITEM 9A. | CONTROLS AND PROCEDURES |
Evaluation of Disclosure Controls and Procedures
The Company’s Chief Executive Officer and its Chief Financial Officer, after evaluating the effectiveness of the Company’s disclosure controls and procedures (as defined in Exchange Act Rules 13(a)–15(e) as of the end of the period covered by this report (the “Evaluation Date”) have concluded that as of the Evaluation Date, the Company’s disclosure controls and procedures were adequate and effective to ensure that material information relating to the Company and its consolidated subsidiaries would be made known to them by others within those entities, particularly during the period in which this annual report was being prepared.
Disclosure controls and procedures are designed to ensure that information required to be disclosed by us in the reports that we file or submit under the Exchange Act is recorded, processed, summarized and reported, within the time periods specified in the Securities and Exchange Commission’s rules and forms. Disclosure controls and procedures include, without limitation, controls and procedures designed to ensure that information required to be disclosed by us in the reports that we file under the Exchange Act is accumulated and communicated to our management, including our Chief Executive Officer and Chief Financial Officer, as appropriate to allow timely decisions regarding required disclosure.
Management’s Report on Internal Control over Financial Reporting
Management of the Company is responsible for the preparation, integrity, and reliability of the consolidated financial statements and related financial information contained in this annual report. The consolidated financial statements of the Company have been prepared in accordance with accounting principles generally accepted in the United States of America and, as such, include some amounts that are based on judgments and estimates of management.
Management has established and is responsible for maintaining effective internal control over financial reporting. The Company’s internal control over financial reporting includes those policies and procedures that:
| (i) | pertain to the maintenance of records that, in reasonable detail, accurately and fairly reflect the transactions and dispositions of the assets of the Company; |
| (ii) | provide reasonable assurance that transactions are recorded as necessary to permit preparation of financial statements in accordance with generally accepted accounting principles, and that receipts and expenditures of the Company are being made only in accordance with authorizations of management and directors of the Company; and |
| (iii) | provide reasonable assurance regarding prevention or timely detection of unauthorized acquisition, use or disposition of the Company’s assets that could have a material effect on the financial statements. |
There are inherent limitations in the effectiveness of any internal control, including the possibility of human error and the circumvention or overriding of controls. Accordingly, even effective internal control can provide only reasonable assurance with respect to financial statement preparation. Further, because of changes in conditions, the effectiveness of internal control may vary over time. The system contains monitoring mechanisms, and actions are taken to correct deficiencies identified.
Management assessed the effectiveness of the Company’s internal control over financial reporting as of December 31, 2010. This assessment was based on criteria for effective internal control over financial reporting described in
109
Table of Contents
“Internal Control - Integrated Framework” published by the Committee of Sponsoring Organizations of the Treadway Commission. Based on this assessment, management believes that the Company maintained effective internal control over financial reporting as of December 31, 2010.
Management is responsible for compliance with the federal and state laws and regulations concerning dividend restrictions and federal laws and regulations concerning loans to insiders designated by the FDIC as safety and soundness laws and regulations. Management assessed compliance by the Company’s insured financial institution, Bank of the Sierra, with the designated laws and regulations relating to safety and soundness. Based on this assessment, management believes that Bank of the Sierra complied, in all significant respects, with the designated laws and regulations related to safety and soundness for the year ended December 31, 2010.
Our assessment of the effectiveness of the Company’s internal control over financial reporting as of December 31, 2010 has been audited by Vavrinek, Trine, Day & Co., LLP, an independent registered public accounting firm, as stated in their report appearing below.
Changes in Internal Controls
There were no significant changes in the Company’s internal controls over financial reporting or in other factors in the fourth quarter of 2010 that have materially affected, or are reasonably likely to materially affect, the Company’s internal controls over financial reporting.
Report of Independent Registered Public Accounting Firm
Board of Directors and Stockholders
Sierra Bancorp and Subsidiary
Porterville, California
We have audited Sierra Bancorp and Subsidiary’s (the Company’s) internal control over financial reporting as of December 31, 2010, based on criteria established in Internal Control – Integrated Framework issued by the Committee of Sponsoring Organizations of the Treadway Commission (COSO). The Company’s management is responsible for maintaining effective internal control over financial reporting and for its assessment of the effectiveness of internal control over financial reporting. Our responsibility is to express an opinion on the effectiveness of the Company’s internal control over financial reporting based on our audit.
We conducted our audit in accordance with the standards of the Public Company Accounting Oversight Board (United States). Those standards require that we plan and perform the audit to obtain reasonable assurance about whether effective internal control over financial reporting was maintained in all material respects. Our audit of internal control over financial reporting included obtaining an understanding of internal control over financial reporting, assessing the risk that a material weakness exists, and testing and evaluating the design and operating effectiveness of internal control based on the assessed risk. Our audit also included performing such other procedures as we considered necessary in the circumstances. We believe that our audit provides a reasonable basis for our opinion.
A company’s internal control over financial reporting is a process designed to provide reasonable assurance regarding the reliability of financial reporting and the preparation of financial statements for external purposes in conformity with U.S. generally accepted accounting principles. Because management’s assessment and our audit were conducted to also meet the reporting requirements of Section 112 of the Federal Deposit Insurance Corporation Improvement Act (FDICIA), management’s assessment and our audit of the Company’s internal control over financial reporting included controls over the preparation of financial statements in accordance with instructions to the Consolidated Financial Statements for Bank Holding Companies (Form FR Y-9C). A company’s internal control over financial reporting includes those policies and procedures that (1) pertain to the maintenance of records that, in reasonable detail, accurately and fairly reflect the transactions and dispositions of the assets of the company; (2) provide reasonable assurance that transactions are recorded as necessary to permit preparation of financial statements in accordance with U.S. generally accepted accounting principles, and the receipts and expenditures of the company are being made only in accordance with authorizations of management and directors of the company; and (3) provide
110
Table of Contents
reasonable assurance regarding prevention or timely detection of unauthorized acquisition, use, or disposition of the company’s assets that could have a material effect on the financial statements.
Because of its inherent limitations, internal control over financial reporting may not prevent or detect misstatements. Also, projections of any evaluation of effectiveness to future periods are subject to the risk that controls may become inadequate because of changes in conditions, or that the degree of compliance with the policies or procedures may deteriorate.
In our opinion, the Company maintained, in all material respects, effective internal control over financial reporting as of December 31, 2010, based on criteria established in Internal Control – Integrated Framework issued by the Committee of Sponsoring Organizations of the Treadway Commission (COSO).
We have also audited, in accordance with the standards of the Public Company Accounting Oversight Board, the consolidated balance sheets of the Company as of December 31, 2010 and 2009, and the related consolidated statements of operations, shareholders’ equity and comprehensive income and cash flows for the three years in the period ended December 31, 2010, and our report dated March 10, 2011 expressed an unqualified opinion on those financial statements.
/s/ Vavrinek, Trine, Day & Co., LLP
Rancho Cucamonga, California
March 10, 2011
None.
ITEM 10. DIRECTORS, EXECUTIVE OFFICERS AND CORPORATE GOVERNANCE
The information required to be furnished pursuant to this item with respect to Directors and Executive Officers of the Company will be set forth under the caption “Election of Directors” in the Company’s proxy statement for the 2011 Annual Meeting of Shareholders (the “Proxy Statement”), which the Company will file with the SEC within 120 days after the close of the Company’s 2010 fiscal year in accordance with SEC Regulation 14A under the Securities Exchange Act of 1934. Such information is hereby incorporated by reference.
The information required to be furnished pursuant to this item with respect to compliance with Section 16(a) of the Exchange Act will be set forth under the caption “Section 16(a) Beneficial Ownership Reporting Compliance” in the Proxy Statement, and is incorporated herein by reference.
The information required to be furnished pursuant to this item with respect to the Company’s Code of Ethics and corporate governance matters will be set forth under the caption “Corporate Governance” in the Proxy Statement, and is incorporated herein by reference.
ITEM 11. EXECUTIVE COMPENSATION
The information required to be furnished pursuant to this item will be set forth under the captions “Executive Officer and Director Compensation” and “Compensation Discussion and Analysis” in the Proxy Statement, and is incorporated herein by reference.
111
Table of Contents
ITEM 12. SECURITY OWNERSHIP OF CERTAIN BENEFICIAL OWNERS AND MANAGEMENT AND RELATED SHAREHOLDER MATTERS
Securities Authorized for Issuance under Equity Compensation Plans
The information required by Item 12 with respect to securities authorized for issuance under equity compensation plans is set forth under “Item 5 – Market for Registrant’s Common Equity and Issuer Repurchases of Equity Securities” above.
Other Information Concerning Security Ownership of Certain Beneficial Owners and Management
The remainder of the information required by Item 12 will be set forth under the captions “Security Ownership of Certain Beneficial Owners and Management” and “Election of Directors” in the Proxy Statement, and is incorporated herein by reference.
ITEM 13. CERTAIN RELATIONSHIPS AND RELATED TRANSACTIONS AND DIRECTOR INDEPENDENCE
The information required to be furnished pursuant to this item will be set forth under the captions “Related Party Transactions” and “Corporate Governance – Director Independence” in the Proxy Statement, and is incorporated herein by reference.
ITEM 14. PRINCIPAL ACCOUNTING FEES AND SERVICES
The information required to be furnished pursuant to this item will be set forth under the caption “Ratification of Appointment of Independent Registered Public Accounting Firm – Fees” in the Proxy Statement, and is incorporated herein by reference.
112
Table of Contents
ITEM 15. EXHIBITS, FINANCIAL STATEMENT SCHEDULES, AND REPORTS ON FORM 8-K
(a) Exhibits
| Exhibit # |
Description | |
| 3.1 | Restated Articles of Incorporation of Sierra Bancorp (1) | |
| 3.2 | Amended and Restated By-laws of Sierra Bancorp (2) | |
| 10.1 | 1998 Stock Option Plan (3) | |
| 10.2 | Salary Continuation Agreement for Kenneth R. Taylor (4) | |
| 10.3 | Salary Continuation Agreement for James C. Holly (4) | |
| 10.4 | Salary Continuation Agreement and Split Dollar Agreement for James F. Gardunio (5) | |
| 10.5 | Split Dollar Agreement for Kenneth R. Taylor (6) | |
| 10.6 | Split Dollar Agreement and Amendment thereto for James C. Holly (6) | |
| 10.7 | Director Retirement Agreement and Split dollar Agreement for Vincent Jurkovich (6) | |
| 10.8 | Director Retirement Agreement and Split dollar Agreement for Robert Fields (6) | |
| 10.9 | Director Retirement Agreement and Split dollar Agreement for Gordon Woods (6) | |
| 10.10 | Director Retirement Agreement and Split dollar Agreement for Morris Tharp (6) | |
| 10.11 | Director Retirement Agreement and Split dollar Agreement for Albert Berra (6) | |
| 10.12 | 401 Plus Non-Qualified Deferred Compensation Plan (6) | |
| 10.13 | Indenture dated as of March 17, 2004 between U.S. Bank N.A., as Trustee, and Sierra Bancorp, as Issuer (7) | |
| 10.14 | Amended and Restated Declaration of Trust of Sierra Statutory Trust II, dated as of March 17, 2004 (7) | |
| 10.15 | Guarantee Agreement between Sierra Bancorp and U.S. Bank National Association dated as of March 17, 2004 (7) | |
| 10.16 | Indenture dated as of June 15, 2006 between Wilmington Trust Co., as Trustee, and Sierra Bancorp, as Issuer (8) | |
| 10.17 | Amended and Restated Declaration of Trust of Sierra Capital Trust III, dated as of June 15, 2006 (8) | |
| 10.18 | Guarantee Agreement between Sierra Bancorp and Wilmington Trust Company dated as of June 15, 2006 (8) | |
| 10.19 | 2007 Stock Incentive Plan (9) | |
| 10.20 | Sample Retirement Agreement Entered into with Each Non-Employee Director Effective January 1, 2007 (10) | |
| 10.21 | Salary Continuation Agreement for Kevin J. McPhaill (10) | |
| 10.22 | First Amendment to the Salary Continuation Agreement for Kenneth R. Taylor (10) | |
| 10.23 | Placement Agency Agreement dated October 13, 2010, between Sierra Bancorp and Keefe, Bruyette & Woods (11) | |
| 10.24 | Form of Purchase Agreement relating to October 2010 Registered Direct Offering (11) | |
| 11 | Statement of Computation of Per Share Earnings (12) | |
| 21 | Subsidiaries of Sierra Bancorp (13) | |
| 23 | Consent of Vavrinek, Trine, Day & Co., LLP | |
| 31.1 | Certification of Chief Executive Officer (Section 302 Certification) | |
| 31.2 | Certification of Chief Financial Officer (Section 302 Certification) | |
| 32 | Certification of Periodic Financial Report (Section 906 Certification) |
| (1) | Filed as Exhibit 3.1 to the Form 10-Q filed with the SEC on August 7, 2009 and incorporated herein by reference. |
| (2) | Filed as an Exhibit to the Form 8-K filed with the SEC on February 21, 2007 and incorporated herein by reference. |
| (3) | Filed as an Exhibit to the Registration Statement of Sierra Bancorp on Form S-4 filed with the Securities and Exchange Commission (“SEC”) (Registration No. 333-53178) on January 4, 2001 and incorporated herein by reference. |
| (4) | Filed as Exhibits 10.5 and 10.7 to the Form 10-Q filed with the SEC on May 15, 2003 and incorporated herein by reference. |
| (5) | Filed as an Exhibit to the Form 8-K filed with the SEC on August 11, 2005 and incorporated herein by reference. |
| (6) | Filed as Exhibits 10.10, 10.12, and 10.15 through 10.20 to the Form 10-K filed with the SEC on March 15, 2006 and incorporated herein by reference. |
| (7) | Filed as Exhibits 10.9 through 10.11 to the Form 10-Q filed with the SEC on May 14, 2004 and incorporated herein by reference. |
| (8) | Filed as Exhibits 10.26 through 10.28 to the Form 10-Q filed with the SEC on August 9, 2006 and incorporated herein by reference. |
| (9) | Filed as Exhibit 10.20 to the Form 10-K filed with the SEC on March 15, 2007 and incorporated herein by reference. |
| (10) | Filed as an Exhibit to the Form 8-K filed with the SEC on January 8, 2007 and incorporated herein by reference. |
| (11) | Filed as Exhibits 1.1 and 10.1, respectively, to the Form 8-K filed with the SEC on October 14, 2010 and incorporated herein by reference. |
| (12) | Computation of earnings per share is incorporated by reference to Note 6 of the Financial Statements included herein. |
| (13) | Filed as Exhibit 21 to the Form 10-K filed with the SEC on March 15, 2007 and incorporated herein by reference |
113
Table of Contents
(b) Financial Statement Schedules
Schedules to the financial statements are omitted because the required information is not applicable or because the required information is presented in the Company’s Consolidated Financial Statements or related notes.
114
Table of Contents
Pursuant to the requirements of Section 13 or 15(d) of the Securities and Exchange Act of 1934, the Registrant has duly caused this report to be signed on its behalf by the undersigned, thereunto duly authorized.
| Dated: March 11, 2011 | SIERRA BANCORP, a California corporation | |||||
| By: | /s/ James C. Holly | |||||
| James C. Holly President & Chief Executive Officer (Principal Executive Officer) | ||||||
| By: | /s/ Kenneth R. Taylor | |||||
| Kenneth R. Taylor Executive Vice President & Chief Financial Officer (Principal Financial and Principal Accounting Officer) | ||||||
Pursuant to the requirements of the Securities Exchange Act of 1934, this report has been signed below by the following persons on behalf of the registrant and in the capacities and on the dates indicated.
| Signature |
Title |
Date | ||
| /s/ Albert L. Berra Albert L. Berra |
Director | March 11, 2011 | ||
| /s/ Robert L. Fields Robert L. Fields |
Director | March 11, 2011 | ||
| /s/ James C. Holly James C. Holly |
President, Chief Executive Officer, & Director (Principal Executive Officer) |
March 11, 2011 | ||
| /s/ Vincent L. Jurkovich Vincent L. Jurkovich |
Director | March 11, 2011 | ||
| /s/ Lynda B. Scearcy Lynda B. Scearcy |
Director | March 11, 2011 | ||
| /s/ Morris A. Tharp Morris A. Tharp |
Chairman of the Board | March 11, 2011 | ||
| /s/ Gordon T. Woods Gordon T. Woods |
Director | March 11, 2011 | ||
| /s/ Kenneth R. Taylor Kenneth R. Taylor |
Executive Vice President & Chief Financial Officer (Principal Financial and Principal Accounting Officer) |
March 11, 2011 | ||
115