Attached files
| file | filename |
|---|---|
| 8-K - FORM 8-K - Manitex International, Inc. | d8k.htm |
| EX-99.2 - PRESS RELEASE - Manitex International, Inc. | dex992.htm |
 Exhibit 99.1
Manitex International, Inc.
Corporate Presentation
(NASDAQ:MNTX)
March 2011 |
 “Focused
manufacturer of
engineered lifting
equipment “
Corporate Presentation
Forward Looking Statements and Non-
GAAP Measures
Safe
Harbor
Statement
under
the
U.S.
Private
Securities
Litigation
Reform
Act
of
1995:
This
presentation
contains
statements
that
are
forward-looking
in
nature
which
express
the
beliefs
and
expectations
of
management
including
statements
regarding
the
Company’s
expected
results
of
operations
or
liquidity;
statements
concerning
projections,
predictions,
expectations,
estimates
or
forecasts
as
to
our
business,
financial
and
operational
results
and
future
economic
performance;
and
statements
of
management’s
goals
and
objectives
and
other
similar
expressions
concerning
matters
that
are
not
historical
facts.
In
some
cases,
you
can
identify
forward-looking
statements
by
terminology
such
as
“anticipate,”“estimate,”
“plan,”
“project,”
“continuing,”
“ongoing,”
“expect,”
“we
believe,”
“we
intend,”
“may,”
“will,”
“should,”
“could,”
and
similar
expressions.
Such
statements
are
based
on
current
plans,
estimates
and
expectations
and
involve
a
number
of
known
and
unknown
risks,
uncertainties
and
other
factors
that
could
cause
the
Company's
future
results,
performance
or
achievements
to
differ
significantly
from
the
results,
performance
or
achievements
expressed
or
implied
by
such
forward
looking
statements.
These
factors
and
additional
information
are
discussed
in
the
Company's
filings
with
the
Securities
and
Exchange
Commission
and
statements
in
this
presentation
should
be
evaluated
in
light
of
these
important
factors.
Although
we
believe
that
these
statements
are
based
upon
reasonable
assumptions,
we
cannot
guarantee
future
results.
Forward
looking
statements
speak
only
as
of
the
date
on
which
they
are
made,
and
the
Company
undertakes
no
obligation
to
update
publicly
or
revise
any
forward-looking
statement,
whether
as
a
result
of
new
information,
future
developments
or
otherwise.
Non-GAAP
Measures:
Manitex
International
from
time
to
time
refers
to
various
non-GAAP
(generally
accepted
accounting
principles)
financial
measures
in
this
presentation.
Manitex
believes
that
this
information
is
useful
to
understanding
its
operating
results
without
the
impact
of
special
items.
See
Manitex’s
earnings
releases
on
the
Investor
Relations
section
of
our
website
www.manitexinternational.com
for
a
description
and/or
reconciliation of these measures.
2 |
 “Focused
manufacturer of
engineered lifting
equipment “
Corporate Presentation
Company Snapshot
3
LTM
Share
Price
Performance
(02/22/2010
–
02/22/2011)
Company Description
Manitex
International,
Inc.
provides
engineered
lifting
solutions.
The
company
operates
through
two
segments,
Lifting
Equipment
and
Equipment
Distribution.
The
Lifting
Equipment
segment
designs,
manufactures,
and
distributes
boom
trucks
and
crane
products.
The
Equipment
Distribution
segment
sells,
services
and
distributes
lifting
equipment
to
end
users.
The
company
was
formerly
known
as
Veri-Tek
International,
Corp.
and
changed
its
name
to
Manitex
International,
Inc.
in
May
2008.
Manitex
International
was
founded
in
1993
and
is
based
in
Bridgeview,
Illinois.
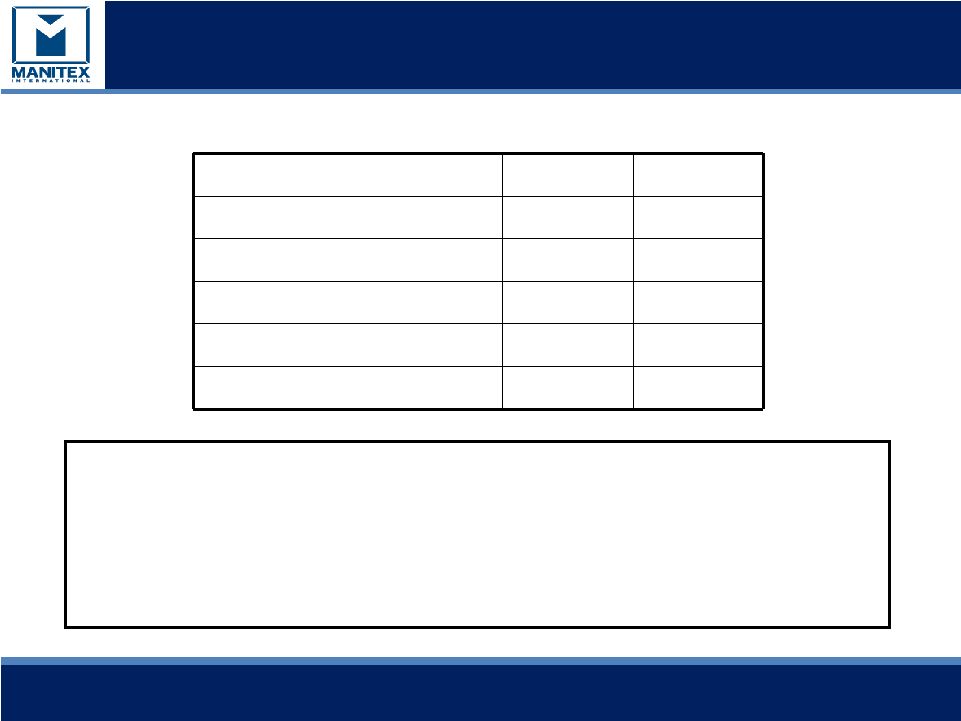
Financial Summary
Total Enterprise Value
(02/22/2011):
$92.7 million
Market Cap (02/22/2011):
$58.9 million
2010 est Total Revenue:
$91.2 million
2010 est Net Income:
$1.8 million
2010 est EBITDA:
$8.1 million
Stock Price (02/22/2011):
$5.18
Ticker / Exchange:
MNTX / NASDAQ
1.5
2
2.5
3
3.5
4
4.5
5
5.5
6
6.5
$5.18
Equity Capitalization
Diluted shares outstanding 02/22/2011):
11.4 million
Warrants outstanding (02/22/2011):
$4.4 million
Avg. warrant strike price
$4.59 |
 “Focused
manufacturer of
engineered lifting
equipment “
Corporate Presentation
•
Global provider of boom trucks, sign cranes, specialized
material handling equipment, and container handling
equipment primarily used in commercial, port, state, local
and international government, and military applications
•
Major industries served include energy (extraction and
processing), utilities, railroads, commercial building,
rental fleets, cargo transportation, infrastructure
development and port and inter-modal operations
•
Historically serving North American markets; recent
international diversification and growth
•
Business Model based in part on an aggressive program of
making accretive acquisitions of complementary
businesses
–
High margin niche markets
–
Including two in 2009 (Badger and Load King) and CVS
agreement in July 2010
–
Rely on seller financing (favorable terms, limited
covenants)
Corporate Overview
Manitex International
4
Manitex International
Businesses |
 “Focused
manufacturer of
engineered lifting
equipment “
Corporate Presentation
5
Product Overview
Manitex, Manitex Liftking, Badger, Load King
•
Badger Equipment has
manufactured specialized
earthmoving, railroad and
material handling
equipment since 1945 and
has built over 10,000 units
during its existence.
•
Manufacturer of a complete
line of RT Forklifts, Special
Mission Oriented Vehicles,
Carriers, Heavy Material
Handling Transporters and
Steel Mill Equipment
•
Manitex specializes in
engineered lifting
equipment and its
product family includes
Manitex Boom Trucks,
SkyCrane Aerial Platforms
and Sign Cranes
•
Manufacturer of container
handling equipment for the
global port and inter-modal
sectors. Products include reach
stackers, laden and unladen
container forklifts and straddle
carriers |
 “Focused
manufacturer of
engineered lifting
equipment “
Corporate Presentation
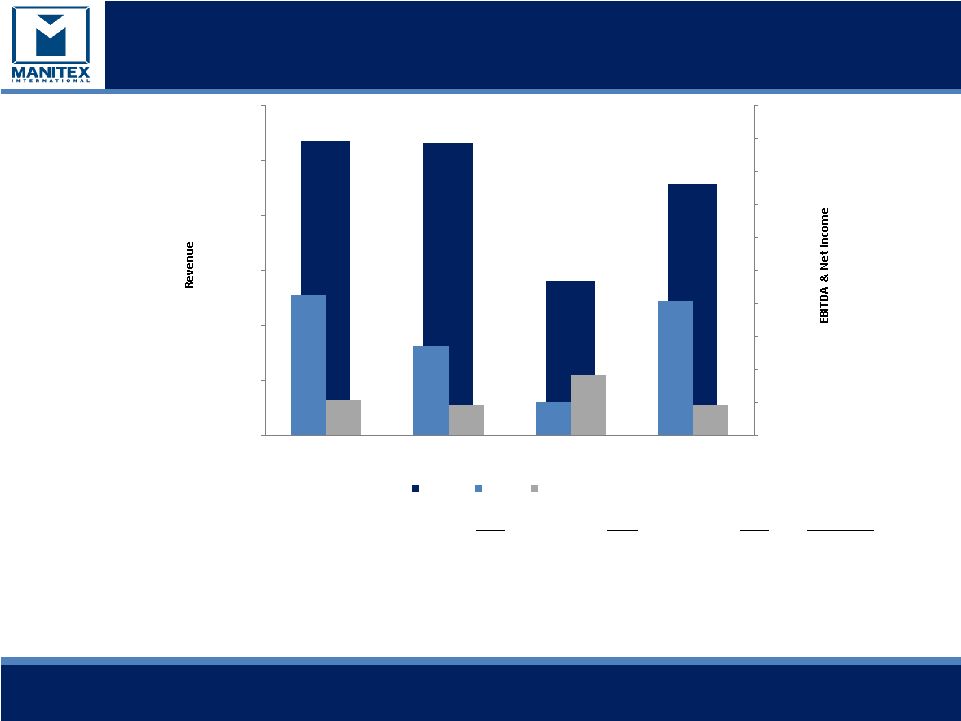
Select Financial Data
Note: Includes continuing operations only.
•Includes gain on bargain purchase of $3,815
•**2010 est, based on 2010 nine months ytd
plus estimated Q4 based on repeating Q3
revenue, gross profit, EBITDA and net income
6
(USD in thousands)
$ in thousands, except percentages
2007
2008
2009
2010 est**
Revenue
$ 106,946
$ 106,341
$ 55,887
$ 91,200
Gross Margin
18.6%
16.4%
20.0%
23.6%
EBITDA
8,461
5,416
1,982
8,100
EBITDA Margin (%)
7.9%
5.1%
3.5%
8.9%
Net Income
2126
1,799
3,639 *
1834
$106,946
$106,341
$55,887
$91,200
$8,461
$5,416
$1,982
$8,100
$1,799
$3,639
$1,834
$2,126
$0
$20,000
$40,000
$60,000
$80,000
$100,000
$120,000
2007
2008
2009
2010 est**
$0
$2,000
$4,000
$6,000
$8,000
$10,000
$12,000
$14,000
$16,000
$18,000
$20,000
Revenue
EBITDA
Net Income |
 “Focused
manufacturer of
engineered lifting
equipment “
Corporate Presentation
Key Management
Name & Title
Experience
David Langevin
Chairman & CEO
20+ years principally with Terex
Andrew Rooke
President &COO
20+ years principally with Rolls Royce, GKN Sinter Metals, Off-
Highway & Auto Divisions
David Gransee
CFO & Treasurer
Formerly with Arthur Andersen, 15+ years with Eon Labs
(formerly listed)
Robert Litchev
President –
Material Handling & SVP
International Distribution
10+ years principally with Terex
Scott Rolston
SVP Sales & Marketing –
Manitex
International
13+ years principally with Manitowoc
7 |
 “Focused
manufacturer of
engineered lifting
equipment “
Corporate Presentation
1)
2010 Solid return to Operating and Net profitability
–
Sales have rebounded approximately 63% in 2010
–
Backlog up 49% YTD to $32.8 million at 9/30/2010
–
Gross margin and EBITDA margin expansion continues as a result of continued emphasis on cost
control •
1
st
nine months 2010 gross margin 23.6%, $4.3m increase in EBITDA
•
1
st
nine months 2010 EBITDA margin of 8.8% was the highest since 2007
2)
Experienced senior management
–
Senior management has over 70 years of collective experience from well-known industrial
leaders such as Terex, Manitowoc, Rolls Royce, GKN Sinter Metals, Off-Highway and
Auto Divisions and Genie 3)
The Company has a global presence with more than 20,000 units operating
worldwide spanning equipment dealerships throughout the country
–
High recurring revenue stream: approximately 20% of total sales (average 40% margin)
4)
Growing market share
–
Increased penetration in oil and gas, power grid and rail
–
Rebounding commercial sales
–
Expanding international sales
5)
Focused on earnings, cash flow and working capital management
8
Investment Highlights |
 “Focused
manufacturer of
engineered lifting
equipment “
Corporate Presentation
9
Company Timeline
March 2002:
Manitowoc (NYSE:MTW)
acquires Grove.
January 2003:
Manitowoc divests
Manitex
December 2009:
Acquire Load King
Trailers
July 2009 Acquire Badger
Equipment Co
November 2006: Veri-
Tek Acquires LiftKing
July 2007: VCC
acquires Noble
forklift
August 2007: Sale of assets and
closure of legacy VCC business
May 2008: Name changed to Manitex International
and listed on Nasdaq (MNTX)
October 2008:
Crane &
Machinery and
Schaeff Forklift
acquired
July 2006: Manitex
merges into Veri-Tek,
Intl. (VCC)
2002
2003
2004
2005
2006
2007
2008
2009
2010
July 2010 :CVS Ferrari
Operating Agreement |
 “Focused
manufacturer of
engineered lifting
equipment “
Corporate Presentation
Recent Acquisitions (subject to approval)
CVS
10
•
June 30 2010 MNTX entered into an agreement to operate, on an
exclusive rental
basis,
the
business
of
CVS
SPA,
commencing
July
1
2010
•
CVS SPA is located near Milan Italy and designs and manufactures
a range
of reach stackers and associated lifting equipment for the global container
handling market
•
CVS had 2008 annual sales of $106 million prior to the global downturn
•
The rental agreement has been filed with the Italian Court and includes an
offer to purchase the business at the conclusion of the Italian insolvency
process (“Concordato Preventivo”) Rental period could extend for up to
two years
•
Sales and profits are consolidated into Manitex International from July
2010. No debt or liabilities of “old CVS”
were assumed. As at July 1, CVS
has a backlog of orders of approximately $10million
•
Acquisition is transformational:
•
Adds global product offering
•
European manufacturing and design
•
Adds scale
•
Above average growth profile sectors of containers / ports / inter-
modal |
 “Focused
manufacturer of
engineered lifting
equipment “
Corporate Presentation
Replacement Parts & Service
Consistent Recurring Revenue
•
Recurring revenue of approximately 20% of total sales
•
Spares relate to swing drives, rotating components, and booms among others, many of
which are proprietary
–
Serve additional brands
–
Service team for crane equipment
11 |
 “Focused
manufacturer of
engineered lifting
equipment “
Corporate Presentation
Pro-forma Revenues ($million)
•
Pro-forma revenues are based on 2007
revenue numbers for each respective
business, regardless of date of acquisition by
Manitex International
•
We believe Pro-forma revenues are more
representative of revenue opportunity than
revenues in the current phase of the
economic cycle
12
Manitex, $80.0
Liftking, $26.0
Crane & Machinery, $18.1
Schaeff, $3.3
Noble, $1.1
Badger, $8.0
LoadKing, $20.0
CVS Ferrari, $80.0
$0.0
$50.0
$100.0
$150.0
$200.0
$250.0
Pro-forma Annual Revenue |
 “Focused
manufacturer of
engineered lifting
equipment “
Corporate Presentation
13
Increased Market Share as Market Declined
Boom Truck Crane Market
23.4%
16.7%
20.8%
29.6%
36.1%
28.0%
76.6%
83.3%
79.2%
70.4%
63.9%
72.0%
0.0%
25.0%
50.0%
75.0%
100.0%
2005
2006
2007
2008
2009
2010
Market Share
0
500
1000
1500
2000
2500
3000
Units Shipped
MNTX
Others
Total Units Shipped |
 “Focused
manufacturer of
engineered lifting
equipment “
Corporate Presentation
Select Financial Data
Note: Includes continuing operations only.
•Includes gain on bargain purchase of $3,815
•**2010 est, based on 2010 nine months ytd
plus estimated Q4 based on repeating Q3
revenue, gross profit, EBITDA and net income
14
(USD in thousands)
$ in thousands, except percentages
2007
2008
2009
2010 est**
Revenue
$ 106,946
$ 106,341
$ 55,887
$ 91,200
Gross Margin
18.6%
16.4%
20.0%
23.6%
EBITDA
8,461
5,416
1,982
8,100
EBITDA Margin (%)
7.9%
5.1%
3.5%
8.9%
Net Income
2126
1,799
3,639 *
1834
$106,946
$106,341
$55,887
$91,200
$8,461
$5,416
$1,982
$8,100
$1,799
$3,639
$1,834
$2,126
$0
$20,000
$40,000
$60,000
$80,000
$100,000
$120,000
2007
2008
2009
2010 est**
$0
$2,000
$4,000
$6,000
$8,000
$10,000
$12,000
$14,000
$16,000
$18,000
$20,000
Revenue
EBITDA
Net Income |
 “Focused
manufacturer of
engineered lifting
equipment “
Corporate Presentation
Growth Drivers –
2010 and Beyond
•
World wide improvements in GDP, economic recovery
•
Increased market penetration with product developments and innovative
distribution
•
Leverage synergy with railroad industry
•
Developed products specifically for the following industries: Oil & Gas,
Railroads, Power Grid & Wind Power
•
Any significant governmental infrastructure spending will be a potential
spark to recovery for Manitex
•
International expansion
–
New
dealership
agreements
reached
in
Middle
East,
Russia,
&
with
Caterpillar
Global
Distribution Network
–
Achieved
European
CE
Certification
for
50
Ton
Cranes
in
2009
–
Manitex
International
made
its
first
international
sales
in
2008
and
has
identified
new
markets
to
accelerate
future
growth
(Russian
market
potential
is
estimated
to
be
double
that
of
North
America)
–
2010
non
-
US
sales
were
over
38%
of
revenue
•
CVS Ferrari is additive to the Company results
15 |
 “Focused
manufacturer of
engineered lifting
equipment “
Corporate Presentation
Summary
Delivering sound operational and financial performance despite the historic
economic and industry-specific challenges
Poised For Growth
•
Growing market share
•
Increased penetration in oil and gas, power grid and rail
•
Rebound in commercial sales
•
Coordinated distribution of our products worldwide
•
Continued expansion into international markets
•
In the recent past we have scaled our business to match demand and we now
look forward to long term growth
•
Focused on earnings, cash flow and working capital management
16 |
 “Focused
manufacturer of
engineered lifting
equipment “
Corporate Presentation
Appendix
17
Manitex International, Inc.
Corporate Presentation
March 2011 |
 “Focused
manufacturer of
engineered lifting
equipment “
Corporate Presentation
Key Figures -
Quarterly
18
USD thousands
Q3-2009
Q2-2010
Q3-2010
Net sales
$15,063
$19,502
$24,859
% change in Q3-2010 to
prior period
65%
27%
Gross profit
2,208
4,607
5,855
Gross margin %
14.7%
23.6%
23.6%
Operating expenses
2946*
3,658
4,365
Net (loss) Income
(147)
213
657
EBITDA
-80
1,732
2,271
EBITDA % of Sales
-0.5%
8.9%
9.1%
Backlog ($ million)
22.3
24.9
32.8
* excludes bargain purchase gain of $0.9m
$15,063
$19,502
$24,859
$1,732
$2,271
$0
$5,000
$10,000
$15,000
$20,000
$25,000
$30,000
Q3-2009
Q2-2010
Q3-2010
$0
$500
$1,000
$1,500
$2,000
$2,500
Net Sales
EBITDA |
 “Focused
manufacturer of
engineered lifting
equipment “
Corporate Presentation
Summarized Balance Sheet
19
Current assets
$47,496
$40,147
$40,685
Fixed assets
10,955
11,804
5,878
Other long term assets
41,198
42,734
39,665
Total Assets
$99,649
$94,685
$86,228
Current liabilities
17,875
14,569
17,062
Long term liabilities
39,749
39,688
34,152
Total Liabilities
$57,624
$54,257
$51,214
Shareholders equity
42,025
40,428
35,014
Total liabilities & Shareholders equity
$99,649
$94,685
$86,228
31-Dec-08
31-Dec-09
30-Sep-10
$000 |
 “Focused
manufacturer of
engineered lifting
equipment “
Corporate Presentation
Debt and Liquidity
$000
Q3-2010
Q4-2009
Total Cash
217
287
Total Debt
33,745
33,511
Total Equity
42,025
40,428
Net capitalization
75,553
73,652
Net debt / capitalization
44.4%
45.1%
Quarterly EBITDA
2,271
426
Quarterly EBITDA % of sales
9.1%
2.9%
•Ebitda for Q3-2010 at 9.1% of sales is best performance
by the Company •Debt reduction in Q3-2010 of
$1.2m: •Revolver facility, based on available collateral at
September 30, 2010 was $22.3m •Revolver availability at September 30,
2010 $3.2m •Net capitalization is the sum of debt plus equity minus
cash. •Net debt is total debt less cash |
 “Focused
manufacturer of
engineered lifting
equipment “
Corporate Presentation
Working Capital
$000
Q3 2010
Q4 2009
Working Capital
$29,621
$25,578
Days sales outstanding
62
67
Days payable outstanding
53
73
Inventory turns
2.7
1.7
Current ratio
2.7
2.8
•Increase in working capital Q3-2010 v Q4-2009 principally from
increased accounts receivable ($6.0m) and inventory ($1.2m) and offset by
increased accounts payable, accruals & other liabilities ($3.4)
•Inventory increase from new businesses of CVS and NAEE
•Continued strength of current ratio |