Attached files
Table of Contents
UNITED STATES
SECURITIES AND EXCHANGE COMMISSION
Washington, D.C. 20549
FORM 10-K
| x | Annual report pursuant to Section 13 or 15(d) of the Securities Exchange Act of 1934 |
For the fiscal year ended January 2, 2011
OR
| ¨ | Transition report pursuant to Section 13 or 15(d) of the Securities Exchange Act of 1934 |
Commission File Number: 0-51532
IKANOS COMMUNICATIONS, INC.
(Exact name of registrant as specified in its charter)
| Delaware | 73-1721486 | |
| (State or other jurisdiction of incorporation or organization) |
(I.R.S. Employer Identification No.) |
47669 Fremont Boulevard
Fremont, California 94538
(Address of principal executive offices) (Zip Code)
(510) 979-0400
(Registrant’s telephone number, including area code)
Securities registered pursuant to Section 12(b) of the Act:
| Title of each class |
Name of each exchange on which registered | |
| Common Stock, $0.001 par value | The NASDAQ Stock Market LLC |
Securities registered pursuant to Section 12(g) of the Act:
None
Indicate by check mark if the Registrant is a well-known seasoned issuer, as defined in Rule 405 of the Securities Act. Yes ¨ No x
Indicate by check mark if the Registrant is not required to file reports pursuant to Section 13 or Section 15(d) of the Act. Yes ¨ No x
Indicate by check mark whether the Registrant (1) has filed all reports required to be filed by Section 13 or 15(d) of the Securities Exchange Act of 1934 during the preceding 12 months (or for such shorter period that the Registrant was required to file such reports), and (2) has been subject to such filing requirements for the past 90 days. Yes x No ¨
Indicate by check mark whether the registrant has submitted electronically and posted on its corporate Web site, if any, every Interactive Data File required to be submitted and posted pursuant to Rule 405 of Regulation S-T (232.405 of this chapter) during the preceding 12 months (or for such shorter period that the registrant was required to submit and post such files). Yes ¨ No ¨
Indicate by check mark if disclosure of delinquent filers pursuant to Item 405 of Regulation S-K is not contained herein, and will not be contained, to the best of the Registrant’s knowledge, in definitive proxy or information statements incorporated by reference in Part III of this Form 10-K or any amendment to this Form 10-K. ¨
Indicate by check mark whether the Registrant is a large accelerated filer, an accelerated filer, or a non-accelerated filer. See definition of “accelerated filer and large accelerated filer” in Rule 12b-2 of the Exchange Act (check one):
| Large accelerated filer ¨ | Accelerated filer ¨ | Non-accelerated filer x | Smaller reporting company ¨ |
Indicate by check mark whether the Registrant is a shell company (as defined in Rule 12b-2 of the Exchange Act). Yes ¨ No x
The aggregate market value of the voting and non-voting common stock held by non-affiliates of the Registrant as of July 4, 2010 (the last day of Registrant’s second quarter of fiscal 2010), was approximately $48,241,671, based upon the July 2, 2010 closing price of the Common Stock as reported on the NASDAQ Global Market. Shares of Common Stock held by each executive officer and director and by each person who owns more than 5% of the outstanding Common Stock have been excluded in that such persons may be deemed affiliates. This determination of affiliate status is not necessarily a conclusive determination for other purposes.
As of March 4, 2011, there were 68,185,763 shares of the Registrant’s common stock, par value $ 0.001, outstanding.
DOCUMENTS INCORPORATED BY REFERENCE
The Registrant has incorporated by reference into Part III of this annual report on Form 10-K portions of its Proxy Statement to be filed with the Securities and Exchange Commission in connection with the Registrant’s 2011 Annual Meeting of Stockholders.
Table of Contents
IKANOS COMMUNICATIONS, INC.
Table of Contents
SPECIAL NOTE REGARDING FORWARD-LOOKING STATEMENTS
This annual report on Form 10-K, particularly in the sections entitled “Business,” “Risk Factors,” and “Management’s Discussion and Analysis of Financial Condition and Results of Operations” contains forward-looking statements within the meaning of Section 27A of the Securities Act of 1933, as amended (the “Securities Act”), and Section 21E of the Securities Exchange Act of 1934, as amended (the “Exchange Act”), that involve substantial risks and uncertainties. All statements other than statements of historical facts contained in this document, including statements regarding our future financial position, business strategy, plans and objectives of management for future operations, forecasts regarding the broadband market, market trends, our competitive status, benefits of our fabless strategy, our product development, our product marketing and inventory, technological developments, the features, benefits and performance of our current and future products, our compliance with governmental rules, our ability to adapt to industry standards, future price reductions, our future liquidity and cash needs, management of our expenses, anticipated demand for our products, customer relationships, the integration of our senior management, our dependence on our senior management and our ability to attract and retain key personnel, our ability to use of third party intellectual property, the effect of one large stockholder group on our common stock, qualification of foundries and our foundries’ capacities, our ability to deliver quality products with acceptable manufacturing yields, current and potential litigation, the expected benefits of our intellectual property and the potential outcomes of intellectual property disputes, our ability to protect our intellectual property our expected future operating costs and expenses, our internal controls, exchange rates and foreign currency exposure, potential new competitors, sources of revenue, our continued growth, dependency and concentration of customer base, future acquisitions, use of proceeds, the expected impact of various accounting policies and rules adopted by the Financial Accounting Standards Board, our future office space needs, and fluctuations in our stock price are forward-looking statements. In some cases, you can identify forward-looking statements by terminology such as “believe,” “may,” “estimate,” “continue,” “anticipate,” “intend,” “should,” “plan,” “expect,” “predict,” “potential,” or the negative of these terms or other similar expressions. We have based these forward-looking statements largely on our current expectations and projections about future events and financial trends that we believe may affect our financial condition, results of operations, business strategy and financial needs. These forward-looking statements are subject to a number of risks, uncertainties and assumptions described under the caption “Risk Factors” and elsewhere in this document, regarding, among other things:
| • | our history of losses; |
| • | our ability to integrate the technologies and employees from acquisitions into our existing business; |
| • | cyclical and unpredictable decreases in demand for our semiconductors; |
| • | our ability to adequately forecast demand for our products; |
| • | our ability to develop and achieve market acceptance of new products and technologies; |
| • | our sales cycle; |
| • | selling prices of products being subject to declines; |
| • | our dependence on a few customers; |
| • | our reliance on subcontractors to manufacture, test and assemble our products; |
| • | our dependence on and qualification of foundries to manufacture our products; |
| • | production capacity; |
| • | our customer relationships; |
| • | the development and future growth of the broadband digital subscriber line (DSL) and communications processing markets; |
| • | protection of our intellectual property; |
| • | currency fluctuations; |
| • | competition and competitive factors of the markets in which we compete; and |
| • | future costs and expenses and financing requirements. |
These risks are not exhaustive. Other sections of this annual report on Form 10-K include additional factors that could adversely impact our business and financial performance. Moreover, we operate in a very competitive and rapidly changing environment. New risk factors emerge from time to time and it is not possible for our management to predict all risk factors, nor can we assess the impact of all factors on our business or the extent to which any factor, or combination of factors, may cause actual results to differ materially from those contained in any forward-looking statements.
1
Table of Contents
You should not rely upon forward-looking statements as predictions of future events. We cannot assure you that the events and circumstances reflected in the forward-looking statements will be achieved or occur. Although we believe that the expectations reflected in the forward-looking statements are reasonable, we cannot guarantee future results, levels of activity, performance or achievements. Moreover, neither we, nor any other person, assume responsibility for the accuracy and completeness of the forward-looking statements. Except as required by law, we undertake no obligation to update publicly any forward-looking statements for any reason after the date of this annual report on Form 10-K to conform these statements to actual results or to changes in our expectations.
In this annual report on Form 10-K, references to “Ikanos,” “we,” “us,” “our” or the “Company” mean Ikanos Communications, Inc. and its subsidiaries, except where it is made clear that the term means only the parent company.
2
Table of Contents
| ITEM 1. | BUSINESS |
The following information should be read in conjunction with audited consolidated financial statements and the notes thereto included in Part II, Item 8 of this annual report on Form 10-K.
Overview
We are a leading provider of advanced broadband semiconductor and software products for the digital home. The Company’s broadband DSL, communications processors and other offerings power access infrastructure and customer premises equipment (CPE) for many of the world’s leading network equipment manufacturers and telecommunications service providers. Our products are at the core of digital subscriber line access multiplexers (DSLAMs), optical network terminals (ONTs), concentrators, modems, voice over Internet Protocol (VoIP) terminal adapters, integrated access devices (IADs) and residential gateways (RGs). Our products have been deployed by service providers in Asia, Europe and North America.
We believe that we can offer advanced products by continuing to push existing limits in silicon, systems and software. We have developed programmable, scalable chip architectures, which form the foundation for deploying and delivering multi-play services. Expertise in the creation and integration of unique digital signal processor (DSP) algorithms with advanced digital, analog and mixed signal semiconductors enables us to offer high performance, high-density and low-power asymmetric DSL (ADSL) and very-high-bit rate DSL (VDSL) products. In addition, flexible communications processor architectures with high-speed packet processing capabilities enable high-performance end-user devices for distributing advanced services in the home. These products support service providers’ multi-play deployment plans to the digital home while keeping their capital and operating expenditures low.
We outsource all of our semiconductor fabrication, assembly and test functions, which allows us to focus on the design, development, sales and marketing of our products and reduces the level of our capital investment. Our customers consist primarily of original design manufacturers (ODMs), contract manufacturers (CMs), network equipment manufacturers (NEMs) and original equipment manufacturers (OEMs), who in turn sell our semiconductors as part of their product-solutions to the service provider market.
We offer multiple product lines. Our standalone communications processors support a variety of wide area network (WAN) topologies including passive optical network (PON), DSL, wireless broadband and Ethernet; our broadband DSL products enable 100 megabits per second (Mbps) downstream and upstream broadband over copper.
Corporate Information
Our principal executive office is located at 47669 Fremont Boulevard, Fremont, CA 94538. Our telephone number at that location is (510) 979-0400. Our website address is www.ikanos.com. This is a textual reference only. We do not incorporate the information on our website into this annual report on Form 10-K, and you should not consider any information on, or that can be accessed through, our website as part of this annual report on Form 10-K. We were incorporated in 1999 as Velocity Communications and changed our name to Ikanos Communications in December 2000. When we reincorporated in Delaware in September 2005, our name changed to Ikanos Communications, Inc.
Demand for Broadband Services and Market Opportunities for Service Providers
The growth of the Internet, the proliferation of advanced digital video and multimedia, and the advancement of communications infrastructure have fundamentally changed the way people work, shop, entertain and communicate. According to researchers at iSuppli, the world’s broadband subscriber ranks will swell by an additional 360 million people from 2010 through 2014. To remain competitive, service providers must deliver more bandwidth and increasing speed to enable revenue-enhancing advanced services. Today, these services include access to advanced digital media, video, communications and interactive broadband applications, including, among others:
| • | Broadcast television; |
| • | High definition television (HDTV); |
| • | Internet protocol television (IPTV); |
3
Table of Contents
| • | Video on demand (VOD); |
| • | Distance learning |
| • | Telemedicine |
| • | Sending and receiving advanced digital media such as music, photos and video; |
| • | Video conferencing; |
| • | Video surveillance; |
| • | Smart energy and home automation, |
| • | Streaming video and audio; |
| • | Fixed mobile convergence/femtocell; |
| • | Online gaming and game hosting; and |
| • | VoIP. |
Additionally, users are increasingly creating, interacting with and transmitting advanced digital media. As a result, the ability to send information upstream has become as important as the ability to receive information downstream. For example, the sharing of user-created content including video and online gaming have high bandwidth requirements for both upstream and downstream transmissions. As data and media files increase in size, we believe users will become increasingly dissatisfied with their existing first generation broadband technology, which does not maintain sufficient transmission rates for satisfactory delivery of these advanced digital media, video, communications and interactive broadband applications. The table below compares broadband applications and their bandwidth requirements:
| Services |
Downstream (Mbps) | |
| HDTV (2-3 per household) |
18+ | |
| 3D HDTV |
9-12 | |
| High speed internet |
10+ | |
| Video conferencing |
3-5 | |
| VoIP |
0.5 | |
| On-line gaming |
1-2 | |
| Mobility |
5-7 | |
| Telemedicine |
2-6 | |
| Security |
2-6 | |
| Home automation |
2+ | |
| Total required |
50-100 |
Delivering video-intensive services requires increased bandwidth of at least 50 to 100 Mbps. Service providers can use a variety of network architectures to provide this increased demand for broadband. More often than not, service providers select a hybrid approach that combines fiber backbone networks with copper as the last mile. This architecture – referred to most commonly as fiber to the node (FTTN) – is chosen because replacing an existing network with fiber is costly and time-consuming. The cost associated with wholesale replacement of copper with fiber to the home (FTTH) ranged from $1,350 to $3,400 or more per household. The table below reflects estimated costs to install and deploy FTTH network in various geographic locations. These costs do not include the full cost of central office (CO) upgrades, and other fiber-related infrastructure improvements.
| Cost Per Household* |
||||
| Fiber – Europe |
$ | 2,156 | ||
| Fiber – United States |
$ | 2,900 | ||
| Fiber – Japan |
$ | 1,071 | ||
| * | Source: AT Kearney, ING, NTT, AT&T, Ikanos |
In contrast, the estimated cost per household using the hybrid approach, made possible by our products, is approximately $250. By using a combination of fiber and copper in the last mile service providers have a cost effective solution for delivering the needed 50 to 100 Mbps.
4
Table of Contents
The Ikanos Solution
We are a leading provider of advanced broadband semiconductor and software products for the digital home. We have developed these semiconductors using our proprietary semiconductor design techniques, specific purpose digital signal processor and advanced mixed-signal semiconductor design capabilities. Our communications processors are used in a range of devices in the digital home and offer high-performance, as well as the flexibility and programmability for advanced services such as security, firewall and routing.
Our products form the basis of communications systems that are deployed by service providers in their infrastructure, as well as in the home to enable subscribers to access data, voice and video. We offer highly programmable products that support the multiple international standards used in broadband deployments worldwide, including VDSL, VDSL2, ADSL, ADSL2 and ADSL2+. In addition, our processors are equipped to handle gigabit passive optical networks and Ethernet passive optical networks FTTH interfaces and provide wire speed switching performance for FTTH deployments.
We have incorporated features and functions into our products that previously had to be developed by our customers as part of their own systems. We refer to these features and functions as our systems-level capabilities, which enable our customers to reduce costs, accelerate time-to-market and enhance the flexibility of their systems.
We believe that our key competitive advantages include our system-level expertise, the programmability of our products, our ability to integrate complex analog hardware, digital hardware, algorithms, systems and software into a complete product, our distributed accelerator processor architecture and our technology leadership and experience working directly with service providers in mass deployment of this technology. Our products are being deployed by leading service providers around the world and also actively evaluated by other leading service providers for deployment in their networks.
Key Features of Our Technology
Integrated analog technology. One of the key technology differentiations of our semiconductors is our integrated analog technology. Our analog products perform the high-precision analog-to-digital and digital-to-analog conversion and the various analog functions necessary to interface between the digital signal processor and the physical transmission medium. Our integrated analog technology includes programmable transmit and receive filters, low-noise amplifiers, and a power-optimized line driver with synthesized impedance and hybrid cancellation. Our analog technology enables systems to increase performance, adapt to noisy signal conditions, reduce power consumption and be programmed for multiple international standards. Additionally, our analog technology eliminates the need for a large number of discrete components and hence reduces costs for our OEM customers and increases the number of connections, or ports, in OEM systems.
Highly programmable platform and software. We provide a highly programmable platform for the interactive broadband industry that enables significant customization of reach, transmission rates and other specifications to optimize transmission performance. Our software enables the programmability of our digital signal processor as well as provides an interface to an external processor for diagnostic testing and configuration of key functions. Our software can be remotely downloaded into our semiconductors for easy field upgrade and service expansion. This capability allows service providers to protect their investments and reduce costs. In addition, we provide application software that can be used by our customers to facilitate the incorporation of our semiconductors into their systems.
Quality of Service/Quality of Experience. Software is a key component of our products. Ikanos Quality Video (iQV™) software enables our chipsets to intelligently adjust its data rate instantly to provide optimal quality in any line condition. With iQV, IPTV services that may be severely degraded or even dropped by older/less sophisticated chipsets will not only stay connected, but will show no degradation in image quality, even in very noisy conditions. The enhanced capabilities of iQV enable service providers to utilize existing copper infrastructure to deliver bandwidth-intensive and quality sensitive applications, like multiple channels of HD-video, high quality VoIP and other revenue-enhancing advanced features.
High-performance DSP and advanced algorithms. Communications algorithms are special techniques used to transform between digital data streams and specially conditioned analog signals suitable for transmission over copper lines. In order to reliably transmit and receive signals at high-speed transmission rates, it is critical to execute advanced algorithms in real time. Algorithm processing is typically performed by the DSP. We have designed high-performance, low power usage DSPs for high transmission rate applications that utilize our proprietary software. Our processing algorithms enable reliable transmission and recovery of signals at high-speed transmission rates over the existing copper lines even under noisy signal conditions. We believe the combination of speed and programmability of our DSP and our advanced algorithms provides us a competitive advantage.
5
Table of Contents
Breakthrough NodeScale™ vectoring technology. One of the challenges in deploying very-high-speed Internet access over existing infrastructure is the degradation that occurs as a result of crosstalk between coincident copper wire pairs. Each wire can often and intermittently interfere with neighboring wires, thereby introducing noise, limiting line quality and reducing VDSL performance. Ikanos’ NodeScale Vectoring technology analyzes the crosstalk and interference environment in real time and creates a unique set of compensation signals that effectively eliminates both. Ikanos’ NodeScale Vectoring cancels noise across an entire network node from 192 ports or more, meeting the deployment requirements of the world’s leading service providers.
Advanced bonding capabilities. Service providers can utilize two pairs of twisted copper wires and offer their customers bonded DSL technology. Bonding technology leverages the existing copper infrastructure and allows for increased data rates, longer loop lengths and increased reliability. Our flexible xDSL DSP core architecture is available in 30MHz, 17MHz bandwidths and 2-pair bonded configurations that enable cost-optimized products for fiber-to-the-building (FTTB), FTTN or CO deployments, respectively.
Flexible network interfaces. Service providers globally use multiple communications protocols for transmitting data, voice and video over their networks. Such protocols include Asynchronous Transfer Mode (ATM) and IP. Our semiconductors have the capability to support multiple network protocols and interfaces, including ATM and IP, to a variety of different OEM systems. For example, service providers in Japan and Korea typically deploy IP-based line cards and platforms that use our semiconductors while service providers in Europe and North America have historically deployed ATM-based systems and are in the process of migrating to IP-based systems.
High-performance communications processing. The delivery of high-quality video and other services requires a high-performance processor to handle the digital data streams that travel in both the upstream and downstream directions from the subscriber’s home. Common data processing functions include routing of IP-based packets, providing voice, video and data streams with different classes of priority within the system and implementing VoIP, network security and wireless LAN functionality. Our products include high-performance semiconductors that are designed to perform functions at rates of up to 1Gbps, which addresses both the latest generation of LAN and WAN technologies. We believe the combination of our high-performance communications processing products and our broad range of VDSL and ADSL2+ PHY products provides us a competitive advantage.
Key Benefits of Our Technology for Our Customers
Enabling the delivery of advanced digital video, multimedia, communications and interactive broadband applications. Our products provide high-speed transmission rates of up to 100 Mbps and beyond downstream and upstream. These transmission rates enable service providers to deliver advanced digital media, video, communications and interactive broadband applications such as broadcast television, HDTV, IPTV, VOD, interactive television, peer-to-peer file sharing, sending and receiving advanced digital media, video conferencing, video surveillance, streaming audio and video, online gaming, game hosting and VoIP, as well as traditional telephony services.
Improving time-to-market with programmable systems-level products. Our products are programmable through our software, which enables our customers to provide a single line card or residential gateway implementation, , to support multiple international standards. Our systems-level capabilities enable us to design our semiconductors to accelerate our customers’ time-to-market. Because of the programmability of our products, service providers can deliver multiple service packages and charge different amounts for these packages.
Cost-effective, high-performance transmission over existing copper lines. Our semiconductors reduce service providers’ capital expenditures and costs, because they enable transmission of signals at high-speed rates over their existing copper lines. As a result, service providers can leverage their previous investments in their access network infrastructure to deliver advanced revenue-generating services to their customers. Our products are compatible with service providers’ existing systems, enabling these service providers to add line cards without having to replace existing systems, thus lowering upfront capital expenditures and reducing inventory costs. Moreover, we offer semiconductors for ADSL2 and ADSL2+ broadband products, as well as VDSL2 broadband products, thereby providing our customers with a convenient single source from which to purchase a wide range of broadband access semiconductors.
6
Table of Contents
End-to-end products. We offer semiconductors for both CO and CPE to deliver seamless interoperability.
Proven technology. To date, we have shipped more than 350 million ADSL and VDSL CPE and CO ports. Our products are deployed or in field testing at leading service providers worldwide such as AT&T, Belgacom, Bharat Sanchar Nigam Ltd. (BSNL), China Telecom, Chunghwa Telecom, France Telecom, KPN, Korea Telecom Corp., Nippon Telegraph And Telephone, Swisscom, Telecom Italia, Telefónica and Verizon. Our OEM customers and the service providers they serve conduct extensive system-level testing and field qualification of new semiconductors (generally over a six to eighteen month period) to ensure that it meets performance, standards compliance and stability requirements before that semiconductor is approved for mass deployment. Our semiconductors have been designed into systems offered by leading OEMs including: 2Wire, Alcatel-Lucent, AVM, Huawei, Motorola, Inc., NEC Corporation, Sagemcom, Sumitomo Electronic Industries, Ltd., Xavi Technologies Corp, ZTE Corporation and ZyXEL Communications, Inc.
Our Strategy
Our objective is to provide the leading semiconductor and software products for the universal delivery of new generations of broadband services that transform the way people work, live and play. We expect to continue to develop highly programmable semiconductors that deliver triple play and interactive services over broadband using fiber and telephone copper lines and that distribute these services to the digital home. In addition, we intend to further expand into new applications and adjacent markets that include the delivery of broadband within a home. The principal elements of our strategy are:
Continuous innovation. We believe we have achieved a leadership position in the high-speed broadband market as well as in the triple play residential gateway markets. We invented discrete multi-tone (DMT) based VDSL and have been a leader in the development of the standards for interactive broadband over copper lines and our products are compliant with those standards. We continue to develop new technologies, such as bonding and NodeScale Vectoring, to extend our customers current broadband infrastructure as well as offer new customers cost effective products to deliver high-speed broadband. We will continue to drive the development of new standards for FTTB, FTTN, FTTH and home networking initiatives through our involvement in a range of industry groups and develop innovative products for these markets.
Expand our product portfolio to pursue new market opportunities. Today, our product line includes devices for all manner of broadband DSL deployments including VDSL, VDSL2, ADSL, ADSL2 and ADSL2+. Our communications processors are used in the customer premises equipment that supports those technologies, as well as those that support other broadband access types including wireless broadband, PON and Ethernet. We also have a set of other products that complement these offerings and provide enhanced voice processing wireless networking and other capabilities. We expect to expand our product portfolio over time to include additional broadband technologies to address incremental market opportunities, as well as add new communications processors and broadband DSL devices to further strengthen our position in core markets.
Capitalize on our existing service provider and OEM relationships. We believe that our close relationships with service providers and OEMs provide us with a deep understanding of their needs and enable us to continue to develop customized technology to meet their requirements. Broadband technology requires customization for the specific needs of service providers. We intend to continue to capitalize on our close relationships with leading service providers and OEMs to facilitate the deployment of our products.
Our Target Markets
We address two primary markets with our products: the broadband DSL market and the communications processor market. In these markets, we sell our products primarily to service providers through the NEMs, OEMs, ODMs and CMs that supply them.
In the broadband DSL market, we are one of the leading technology providers. In fact, we are the number one supplier of VDSL in the world with a larger market share than all our competitors combined. Service providers use this technology to enable the cost-effective provisioning of advanced digital media, video, communications and interactive broadband applications including broadcast television, HDTV, IPTV, VOD, interactive television, peer-to-peer file sharing, sending and receiving advanced digital media, video conferencing, video surveillance, streaming video and audio, online gaming, game hosting and VoIP, as well as traditional telephony services.
7
Table of Contents
Our products comply with a broad range of international standards, support both Ethernet and asynchronous transfer mode (ATM) connectivity and complement service providers’ fiber deployments by leveraging existing copper infrastructure. We believe that our product line offers the industry’s best performance with the lowest power consumption.
Consumers demand a wide array of offerings from their service providers. They want VoIP telephony, IPTV, wireless connectivity, Personal Video Recorder (PVR) services, security, file and photo sharing, gaming and a host of other advanced offerings. But service providers face a significant challenge delivering those offerings. Not only is there a greater need for bandwidth, but service providers also need to provide an end-user device that has the processing power to handle new services while managing their operating expenses. That is where our communications processor products come into play.
Our communications processors are the heart of the residential gateways. And we believe that the residential gateway is poised to become the centerpiece of the digital home. Whether the access infrastructure is copper, fiber or wireless, the residential gateway – and the communications processor within it – must have adequate power to distribute bandwidth intensive services with appropriate security and other functionality.
Our Fusiv®, Capri™, Solos™ and other communications processors enable service providers to efficiently and cost-effectively deliver multi-play services to the residential, small office/home office and small to medium enterprise markets. These devices utilize our unique distributed architecture, which includes multiple accelerator processors (AP) that offload switching, routing and other tasks from the host central processing unit (CPU). As a result, we provide high levels of processing power for combined advanced services including but not limited to VoIP, PVR, multi-mode DSL and security, while supporting best-in-class quality of service (QoS) and wire speed performance across all LAN and WAN interfaces.
Over time, we will adapt our product lines to address new markets and develop additional products specifically for them.
Our Products
We offer multiple product lines that are designed to address different segments of the communications processor and the high-speed broadband DSL markets. Service providers and OEMs choose our semiconductors from these multiple product lines based on a variety of factors such as the design of their networks, the distance between the fiber termination point and the customer premises, the technology that they want to deploy, the services that they want to offer and system design constraints such as performance, density and power consumption. By choosing our products for their hybrid fiber/xDSL networks, service providers are able to utilize their existing broadband infrastructure and maximize the return on their capital investments.
Communications Processors for a Range of Customer Premises Equipment
Our family of communications processors complements our broadband DSL products and is designed for a range of devices that deliver high-speed access to the digital home. We offer processors that include integrated broadband as well as standalone products for a variety of applications.
Integrated Communication Processors:
| • | Fusiv Vx180 is an integrated communication processor that features a MIPS-based™ CPU core, VoIP capabilities, security, and best-in-class QoS. It includes a multi-mode VDSL2 data pump that is backward compatible to ADSL2+, ADSL2, and ADSL for flexibility across a range of service provider deployments. The product easily integrates with home networking technologies such as 802.11a/b/g/n,. And the Fusiv Vx180 employs a unique distributed architecture that incorporates AP engines for data path functions, ensuring that the maximum host CPU processing power is available for customer applications. Fusiv Vx180 offers two analog integrated front end (IFE) options. The IFE-5 supports up to the 30a profile with 100 Mbps upstream and 100 Mbps downstream performance. The IFE-6 (integrated front end and line driver) supports up to the 17a profile and fallback to ADSL, ADSL2 and ADSL2+. |
8
Table of Contents
| • | Capri CX96xxx family of VDSL2 chipsets are optimized to address a variety of triple play products ranging from voice-enabled gateways to basic network bridges. The Capri chipset integrates a power ARM® network processor enabling up to one Gigabit data throughput. It also has a flexible xDSL DSP core architecture supporting VDSL2 up to profile 17a, packet over DSL mode (PTM) bonding using two twisted pair wires for extended rate/reach applications and a field-proven voice DSP engine for VoIP. The chipsets are ideal for customer CPE systems such as VDSL bridges, wireless VDSL routers and VDSL VoIP IADs. The Capri product family includes the CX96629, CX96429 and CX96420 chipsets. |
| • | Fusiv Vx160 integrated processor is ideal for ADSL2+ routers, ADSL2+ residential gateways and other CPE. It combines a high-performance RISC processor and ADSL2+/ADSL2/ADSL PHY data pump into one compact package. The Vx160 employs a unique distributed architecture that incorporates AP engines for data path functions, ensuring that the host CPU processing power is available for customer applications. |
| • | Solos-W CX94610 is an ADSL+ chipset with integrated wireless LAN and includes a highly integrated analog front end (AFE) and a single-chip communications processor with 802.11a/b/g media access control (MAC) and baseband functionality. The Solos-W includes all the interfaces required to enable feature-rich DSL CPE platforms. The optimized Wi-Fi architecture reduces the number of components and improves manufacturing and quality with a repeatable and easily tunable Wi-Fi front end. At the center of the Solos-W chipset is a high performance ARM™-based RISC processor core, which supports industry standard operating systems such as Linux® as well as our full-featured, advanced Integrated Software on Silicon (ISOS®) software suite. To assist the processor, additional hardware engines, including a dedicated Wi-Fi processor and virtual private network (VPN) engine are integrated to support compute intensive tasks. |
| • | Vulcan™ GS8120xxxx is a full-rate, full bridging and routing performance ADSL Ethernet modem chipset. The digital device integrates a communication processor, 10/100 Ethernet MAC, USB 1.1 interface, xDSL DSP and Reed-Solomon memory. The analog device integrates an AFE, line driver, along with transmit and receive amplifiers. In addition, the Vulcan chipset supports small memory footprint designs for cost optimized ADSL to Ethernet bridge applications. |
Standalone Communication Processors:
| • | Fusiv Vx150 is a high-performance, cost-effective communications processor for building customer premises equipment that enables bundled voice and data services, and provides high-speed switching, routing, packet filtering, and firewall functions. It provides integration of full chain voice processing, signaling and network protocol processing and rich peripheral interface support. The Fusiv Vx150 employs a unique distributed architecture that incorporates AP engines for data path functions, ensuring that the host CPU processing power is available for customer applications. |
| • | Fusiv Vx155 processor delivers the processing power and capability to handle full voice chain, signaling and network protocol processing on a single chip. This makes it ideal for triple- and quadruple-play gateways. It supports a variety of WAN technologies including PON, DSL, WiMAX and Ethernet. The Fusiv Vx155 also employs a unique distributed architecture that incorporates AP engines for data path functions, ensuring that the host CPU processing power is available for customer applications. |
| • | Fusiv Vx170 processor was designed expressly for FTTH deployments. The product is a system-on-chip, which integrates a control processor, DSP subsystem, security engine, and two Gigabit Ethernet ports (GMII) for exceptional broadband connectivity. Its powerful MIPS-based™ core and integrated QoS capabilities make it ideal for deployments of new services such as IPTV, VOD and online gaming. In addition, the Vx170 employs a unique distributed architecture that incorporates AP engines for data path functions, ensuring that the maximum host CPU processing power is available for customer applications. |
Broadband DSL
We serve the dynamic broadband market with a extensive line of products for CO and CPE. These products are complemented by our communications processors. And together, these devices enable triple- and quadruple-play services around the world.
9
Table of Contents
We have a range of broadband DSL semiconductor and software products for VDSL and ADSL implementations. Our VDSL chipsets for DSLAMs and other CO equipment include Ikanos Velocity™, Accelity™-2+ AD11008, Fx™100100-5 and Fx10050-5. Our VDSL standalone chipsets for CPE like residential gateways include Accelity-DA87781, Fx100100S-5 and Fx10050S-5. Maxtane™-CX955xx is our ADSL chipset for CO equipment, and our SHDSL chipsets include Orion™-GS2237 CO and Orion-GS2237 CPE.
| • | The Ikanos Velocity family of low-power, full-featured A/VDSL access chipsets provide up to 100 Mbps symmetrical bandwidth and operate at a sub one watt per port power consumption. Both chipsets support 8a/b/c/d, 12a/b, 17a and 30a VDSL2 profiles as well as ADSL2+, ADSL2 and ADSL standards. Compliant with European Code of Conduct (CoC) power consumption standards, the Velocity chipsets utilize up to 30 MHz of spectrum. In addition, Velocity chipsets include iQV technology which enables exceptional delivery of data-intensive triple play applications, including multi-channel HD IPTV, high-speed data transmission, VoD and VoIP. |
| • | Accelity-2+ AD11008 is an 8-port VDSL2 CO chipsets that enables service providers to generate additional revenue by delivering triple play services – such as high quality video, voice and data - at a competitive price. The product is ideal for ATM and packet-based DSLAMs providing the density, performance, power and functionality necessary to support exchange (CO), remote unit (DSL/ONU) or multi-dwelling unit (MDU) deployments. The product also has integrated support for bonding or the G.998.2 standard. |
| • | Fx™100100-5 and Fx10050-high bandwidth multi-port A/VDSL CO chipsets enable service providers to deliver a full suite of revenue-generating interactive broadband services and features from a single platform. Utilizing up to 30 MHz of spectrum, our Fx100100-5 is the industry’s first chipset to be IPTV-optimized with 100 Mbps symmetrical performance and built-in QoS capabilities. And our IPTV-optimized Fx10050-5 chipset utilizes up to 17.6 MHz of spectrum, and enables 100 Mbps downstream and 50 Mbps upstream performance. Both products incorporate advanced QoS capabilities and are ideal for DSLAMs and ONUs providing the port density levels and low power consumption necessary to support MDUs. |
| • | Accelity DA87781 VDSL2 CPE chipset provides advantages in performance, functionality and cost and is targeted at Ethernet bridges/ routers, wireless local area network (WLAN) and broadband residential gateways, and IADs. The Accelity CPE chipset is fully programmable, high-performance solution for triple-play broadband service. The chipset includes a VDSL DSP and an AFE chip. The DSP integrates an Ethernet MAC with MII for LAN connectivity. The Accelity design capitalizes on our many years of successful real-world DSL field experience and comprehensive understanding of standards-based xDSL technology. |
| • | Fx100100S-5 and Fx10050S-5 high bandwidth A/VDSL CPE chipsets enable service providers to deliver a full suite of revenue-generating interactive broadband services and features from a single platform. Interoperable with deployed CO equipment and utilizing up to 30 MHz of spectrum, our Fx100100S-5 is the industry’s first chipset to be IPTV-optimized with 100 Mbps symmetrical performance. And our IPTV-optimized Fx10050S-5 chipset enables 100 Mbps downstream and 50 Mbps upstream performance. Both chipsets offer built-in QoS capabilities, have multi-mode support and are ideal for modems, residential gateways, optical network terminals and routers. |
| • | Maxtane CX955xx ADSL chipsets are ADSL/ADSL2/ADSL2+ CO transceivers enabling advanced triple play services. The chipsets offer features such as enhanced impulse noise protection (INP) and dual interleaving for simultaneous video, voice and data services with appropriate protection for each service. Advanced features of Maxtane enable better service levels for triple play services, including IPTV, high-speed Internet access, VOD, HDTV, VoIP, videoconferencing, remote office connectivity, and telecommuting. Maxtane devices enable feature rich IPTV line card solutions for next-generation exchange (CO), remote unit (DLC/ONU), or MDU applications. The Maxtane includes a 16-port DSP and two AFE chips while the Maxtane includes a DSP in a 24-port configuration and three AFEs. |
| • | Orion™-GS2237 CO and Orion-GS2237 CPE chipsets for symmetric high bit-rate digital subscriber line (SHDSL) offers unsurpassed functionality and density for SHDSL. It provides G.991.2 or G.shdsl compliance for both single and dual copper pair systems. Our SHDSL chipset provides value added features well beyond the scope of existing products, enabling system vendors to enter new markets and significantly differentiate their offerings. Examples of such features include provision for rates up to 4.6 Mbps for MDU applications, via SHDSL 4 wire support. |
Advanced Software for Enhanced Products
Software is a key component of our semiconductor products. In our central office and customer premises chipsets, we have advanced iQV software, a combination of technologies that enhances link robustness. Ikanos’ Programmable Operating
10
Table of Contents
System™ software (iPOS) facilitates the customization of Fx and FxS™ chipsets to specific applications. Our Integrated Software on Silicon® (ISOS) software accelerates development time for devices like the Solos and others. And our processor software—FusivWare™—allows for increased flexibility and reuse in the design of modems, gateways and other devices expediting time-to market for our customers’ new generations of products.
| • | iQV technology which enables exceptional delivery of data-intensive triple play applications, including multi-channel HD IPTV, high-speed data transmission, VoD and VoIP. Ikanos iQV protects against all noise types including dynamic, impulse, and repetitive impulse noise (REIN) by employing retransmission, Rapid Rate Adaptation™ (RRA) and other innovative technologies. |
| • | Key Features |
| • | Sustains link connectivity with large noise change |
| • | Fast rate adaptation to rapid noise changes less than 750ms |
| • | Erasure decoding providing twice the impulse protection without increasing delay |
| • | Retransmission technology |
| • | iPOS is an integrated real-time operating system (RTOS) kernel and set of management application programming interfaces (APIs) that enable equipment vendors to easily tailor Fx and FxS chipsets to specific applications. iPOS is highly configurable and controls the chipset’s Burst Mode Engine (BME). It’s based on a RTOS operating system and can be easily ported to other operating systems and host processors. |
| • | ISOS is a comprehensive suite of embedded broadband communications software that enables product customization and reduces first-time and subsequent design cycles. And, it allows for integration of new features to lower costs, streamline product development and speed time to market. ISOS includes all key communications protocol stacks along with integrated applications such as integrated firewall and network address translation (NAT) for secure LAN/WAN activities. It incorporates universal plug-n-play (UPnP) capabilities for home and office network connectivity and additional security features. |
| • | FusivWare is advanced Linux-based software that enables network equipment manufacturers to jump start their development processes. The software incorporates routing, bridging, a complete VoIP stack, packet classification, marking, bandwidth management, fast-path assisted QoS functions to ensure better performance, drivers and more. FusivWare enables manufacturers to reduce product development cycles, rapidly prototype and quickly enter production with everything from simple modems to sophisticated gateways. The FusivWare flexible software architecture provides customers with the ability to design this equipment with any transport methodology – or multiple methodologies – including Ethernet, xDSL and PON. This dramatically reduces time to market for subsequent generations of products. |
Customers and Service Providers
Customers
The markets for systems utilizing our products and services are mainly served by large NEMs, OEMs, ODMs and CMs. We market our products to service providers, but we primarily sell our products to equipment suppliers. We have in the past and expect in the future to derive a substantial portion of our revenue from sales to a relatively small number of customers. The loss of a significant customer would materially and adversely affect our financial condition and results of operations.
In 2010 Alcatel Lucent and Sagemcom accounted for 18% and 16% of revenue, respectively. In 2009, Sagemcom accounted for 19% of revenue, Paltek Corporation accounted for 12%, and NEC Corporation accounted for 11%. In 2008, NEC Corporation accounted for 25% of revenue, Sagemcom accounted for 21%, Paltek Corporation accounted for 23%, and Alcatel-Lucent accounted for 11%.
Historically, substantially all of our sales have been to customers outside the United States. Sales to customers in Asia accounted for 60% in 2010, 58% in 2009 and 59% in 2008. Sales to customers in Europe accounted for 37% of revenue in 2010, 34% in 2009 and 33% in 2008.
11
Table of Contents
Telecommunication Service Providers
We work directly with various major service providers and their OEMs worldwide in connection with the optimization of our technology for mass deployment or trials into the service providers’ networks. Our OEM customers have sold products that include our semiconductors to major service providers, including:
| AT&T (North America) |
Korea Telecom Corp. (Korea) | |
| Belgacom (Belgium) | KPN (The Netherlands) | |
| BSNL (India) | Nippon Telegraph & Telephone Corporation (Japan) | |
| China Telecom (China) | Swisscom (Switzerland) | |
| Chunghwa Telecom (Taiwan) | Telecom Italia (Italy) | |
| France Telecom (France) | Telefonica (Spain) | |
| Verizon |
Our Service and Support for Customers and Service Providers
To accelerate design and development of our customers’ systems and the qualification and mass deployment of our technology, we have a Product Applications Engineering (PAE) team and a Field Application Engineering (FAE) team. These teams work closely with the OEMs as well as directly with the service providers. Applications engineers have expertise in hardware, software and have access to the various expertise within our Company to ensure proper service and support for our OEM and service provider customers.
Our service and support involves multiple stages including working with the service providers’ evaluation of our technology through utilization of our reference platforms and optimizing our technology to meet the service providers’ performance and other requirements.
In parallel, our engineers help our customers with the design and review of their system designs. Our application engineers and field application engineers help the customers’ engineers design their systems by providing the necessary reference designs, gerber files, schematics, data sheets, sample software and other documentation. By doing this, we assist our customers and the service providers they serve in meeting their deployment requirements. Once the hardware incorporating our chipsets is built by our customers, we work closely with the customers’ engineers to integrate our software into systems through site visits and extensive field-testing with the service providers which may include inter-operation with legacy equipment already deployed in the service provider’s served area. This entire cycle may take six to eighteen months depending upon the region, service provider requirements and deployment plans.
Sales, Business Development and Product Marketing
Our sales and marketing strategy is to achieve design wins with leading suppliers and mass deployment with service providers worldwide. We consider a design win to occur when an OEM notifies us that it has selected our products to be incorporated into its system. We refer to our sales and marketing strategy as “direct touch” since we have significant contact directly with the customers of our OEMs, the telecommunication service providers. We believe that applications support at the early stages of design is critical to reducing time to deployment and minimizing costly redesigns for our customers and the service providers. By simultaneously working with our customers and the service providers, we are able to use the pull of service provider network compatibility and interoperability to push design wins with our customers, which is further augmented by our support and service capabilities.
We market and sell our products worldwide through a combination of direct sales and third-party sales representatives. We utilize sales representatives to expand the impact of our sales team. We have strategically located our sales, business development and marketing personnel, field applications engineers and sales representatives near our major customers in China, Europe, India, Japan, Korea, Taiwan, and the United States.
Our product marketing teams focus on our product strategy and management, product development road maps, product pricing and positioning, new product introduction and transition, demand assessment, competitive analysis and marketing communications and promotions. Our marketing teams are also responsible for ensuring that product development activities, product launches, channel marketing program activities and ongoing demand and supply planning occur on a well-managed, timely basis in coordination with our development, operations and sales groups, as well as our customers.
12
Table of Contents
Competition
The semiconductor industry and the broadband communications markets are intensely competitive. In the xDSL, PON and communications processing markets, we currently compete or expect to compete with, among others, Broadcom Corporation, BroadLight, Cavium Networks, Inc., Freescale Semiconductor, Inc., Lantiq Deutschland GmbH, Marvell Technology Group Ltd., PMC-Sierra, Inc., Realtek Semiconductor Corp. and Ralink Corp. We may not be able to compete effectively against current and potential competitors, especially those with significantly greater resources and market leverage. Our competitors may be able to adopt more aggressive pricing policies and devote greater resources to the development, promotion and sale of their products than we can. In addition, new competitors or alliances among existing competitors, could emerge. Competition has resulted, and may continue to result, in declining average selling prices for our products and market share. We believe that our products are not easily interchangeable with the products of our competitors, due to the level of collaboration in product design and development that is typically demanded by our customers from the earliest stages of development. But nevertheless, we must constantly maintain our technology developments in order to continue to achieve design wins with our customers.
We also consider other companies that have access to broadband or communications processing technology as potential future competitors. In addition, we may also face competition from newly established competitors, suppliers of products based on new or emerging technologies, and customers who choose to develop their own technology.
We believe that we are competing effectively with respect to the following factors:
| • | product performance; |
| • | compliance with industry standards; |
| • | differentiated and disruptive technology features; |
| • | price and cost effectiveness; |
| • | energy efficiency; |
| • | physical footprint; |
| • | functionality; |
| • | time-to-market; and |
| • | customer service and support. |
Research and Development
Our research and development efforts are focused on the development of advanced semiconductors and related software. We have experienced engineers who have significant expertise in interactive broadband and communications processing technologies. These areas of expertise include communication systems, system architecture, digital signal and communications processing, data networking, analog design, digital and mixed signal, very large scale integration development, software development, reference boards and system design. In addition, we work closely with the research and development teams of our OEM customers and service providers. Our research and development expense was $60.8 million in 2010, $49.8 million in 2009 and $43.2 million in 2008.
Operations
Semiconductor Fabrication
We do not own or operate a semiconductor fabrication, packaging or testing facility, except for some of the test equipment that we place at our subcontractors sites for our own usage. By owning some of the test equipment, we gain cost benefits and assurance of capacity. We depend upon third-party subcontractors to manufacture, package and test our products. By outsourcing manufacturing, we are able to substantially avoid the upfront capital and cost associated with owning and operating a captive manufacturing facility. This allows us to focus efforts on the design and marketing of the products.
We currently outsource all semiconductor wafer manufacturing. We work closely with the foundries to forecast our manufacturing capacity requirements on a monthly basis. Our semiconductors are currently fabricated in several advanced, sub-micron manufacturing processes. Because finer manufacturing processes lead to enhanced performance, smaller silicon
13
Table of Contents
chip size and lower power requirements, we continually evaluate the benefits and feasibility of migrating to smaller geometry process technologies in order to reduce cost and improve performance. We believe that the fabless manufacturing approach provides the benefits of superior manufacturing capability as well as flexibility to move the manufacturing, assembly and testing of the products to those subcontractors that offer the best capability at an attractive price. Nevertheless, because we do not have formal, long-term pricing agreements with any of the subcontracting partners, the wafer costs and services are subject to sudden price fluctuations based on the cyclical demand for semiconductors. Our engineers work closely with the foundries and other subcontractors to increase yields, lower manufacturing costs and improve quality.
Assembly and Test
Our products are generally shipped from the third-party foundries to third-party sort, assembly and test facilities where they are assembled into finished semiconductors and then tested. We outsource all product packaging and all testing requirements for these products to several assembly and test subcontractors. Our products are designed to use low cost, standard packages and to be tested with widely available test equipment. In addition, we specifically design our semiconductors for ease of testability, thereby further reducing production costs.
Quality Assurance
Our quality assurance program begins with the design and development processes both in hardware and software. Our hardware designs are subjected to extensive circuit simulation under extreme conditions of temperature, voltage and processing before being committed to be manufactured. Our software goes through testing per specified test plans and customer requirements. As defects are identified, engineers rewrite code to optimize performance before the software is released. We pre-qualify each of the subcontractors and conduct periodic quality audits. We monitor foundry production to ensure consistent overall quality, reliability and yield levels. All of the independent foundries and assembly and test subcontractors have been awarded ISO 9000 certification as well as other internationally accepted quality standards. In August 2006, we were certified to ISO9001 standards and passed an ISO 9001:2008 recertification audit in May 2009.
Environmental Regulation
We are also focusing on managing the environmental impact of our products. The manufacturing flows at all the subcontractors used by us are registered to ISO14000, the international standard related to environmental management. We believe that the products are compliant with the Restriction of Hazardous Substance (RoHS) directives and that materials are available to meet these emerging regulations.
Intellectual Property
Our success and future growth will depend on our ability to protect our intellectual property. We rely primarily on patent, copyright, trademark and trade secret laws, contractual provisions and licenses to protect our intellectual property. We also attempt to protect our trade secrets and other proprietary information through agreements with our customers, suppliers, employees and consultants and through other security measures.
As of January 2, 2011, we held a total of 283 issued patents in the United States and abroad; we also had a number of provisional patents and applications pending. Our patents and patent applications cover features, arts and methodology employed in each of our existing product families. The expiration dates range from 2015 through 2029. We continue to actively pursue the filing of additional patent applications.
We claim copyright protection for the proprietary documentation used in our products and for the firmware and software components of our products. Ikanos Communications, Ikanos, the Ikanos logo, the “Bandwidth without boundaries” tagline, Fusiv, Ikanos NodeScale Vectoring, Ikanos Velocity are among the trademarks or registered trademarks of Ikanos Communications.
Employees
As of January 2, 2011, we had a total of 386 full-time employees, of whom 247 were involved in research and development, 62 in operations, and 77 in sales, marketing, finance and administration. None of our employees are represented by a labor union. We have not experienced any work stoppages and believe that our relationships with our employees are good.
14
Table of Contents
Backlog
Our sales are made pursuant to short-term purchase orders. These purchase orders are made without deposits and may be rescheduled, canceled or modified on relatively short notice without substantial penalty in most cases. Therefore, we believe that the purchase orders may not a reliable indicator of future sales.
Executive Officers of the Registrant
The following table sets forth the names, ages and positions of our executive officers as of March 10, 2011:
| Name |
Age | Position | ||||
| John Quigley | 54 | President and Chief Executive Officer | ||||
| Dennis Bencala | 55 | Chief Financial Officer and Vice President of Finance | ||||
| Debajyoti Pal | 52 | Chief Technology Officer and Senior Vice President | ||||
| Jim Murphy | 56 | Vice President, Worldwide Human Resources | ||||
| Michael Kelly | 58 | Vice President, Worldwide Sales | ||||
There are no family relationships among any of our directors and executive officers.
John Quigley has been our President and Chief Executive Officer since August 2010. Mr. Quigley joined Ikanos in June 2010 as Vice President, Worldwide Engineering. Prior to Ikanos Mr. Quigley was Senior Vice President, Engineering at CSR plc from July 2009 until May 2010. He was Senior Vice President and General Manager at SiRF Technology (SiRF) from January 2007 until July 2009 when SiRF was acquired by CSR plc. From May 2004 until December 2006 Mr. Quigley was Vice President of Engineering at Airgo Networks. He was Global Director of Engineering at Motorola from August 1991 until May 2004. Mr. Quigley holds a B.S. and M.S. in Electrical Engineering from Colorado State University.
Dennis Bencala has served as our Chief Financial Officer (CFO) and Vice President of Finance since June 2010. Prior to joining Ikanos Mr. Bencala was CFO of the Renewable Energy Test Center from October 2009 to June 2010. Mr. Bencala held successive positions at SiRF beginning with Corporate Controller in January 2000 and becoming Senior Director, Investor Relations and Business Development, in August 2007. He became acting CFO at SiRF in August 2008 and CFO from Sept 2008 until October 2009. Prior to joining SiRF Mr. Bencala served as Corporate Controller at ScanVision, Inc., a developer of image sensing semiconductor products from June 1995 to December 1999. Mr. Bencala holds a B.S. in Finance from San Diego State University.
Debajyoti Pal has served as our Chief Technology Officer since August 2009. From April 2004 until August 2009. Dr. Pal was Chief Technology Officer and Executive in Residence at Tallwood Venture Capital. Prior to joining Tallwood. Dr. Pal founded Telicos Corporation in May 2002 and was President until April 2004. Dr Pal was Vice President of Technology & Product Development of Virata/Globespan Virata from August 2000 until April 2002. In May 1998 he founded Excess Bandwidth Corporation and was Vice President of Technology and Vice President engineering until August 2000 when it was acquired by Virata. Dr. Pal received a Bachelors degree in electronics and electrical communication engineering from the Indian Institute of Technology, a M.S.E.E. degree from Washington State University and a Ph.D. in electrical engineering from Stanford University. Dr. Pal is a Fellow of the Institute of Electrical and Electronics Engineers (IEEE).
Michael Kelly has served as Ikanos Vice President of Worldwide Sales since July 2010. He was Vice President, Sales at CSR plc from July 2009 until July 2010. He was Vice President of Worldwide Sales at SiRF from August 2008 until July 2009. Mr. Kelly joined SiRF in August 1998 as Director, North America Sales and became Senior Director, North America Sales, in August 2006. From June 1996 to July 1998, Mr. Kelly served as Director of Sales at Alliance Semiconductor.
15
Table of Contents
Jim Murphy has been our Vice President, Worldwide Human Resources since June 2010. Prior to joining Ikanos he served as Vice President, Human Resources for North America and Asia Pacific for CSR plc from August 2009 until May 2010. From March 2006 until August 2009, Mr. Murphy was Vice President, Human Resources for SiRF. Prior to joining SiRF, Mr. Murphy was Senior Human Resources Director for North America at LSI Logic from May 1994 through March 2006. Mr. Murphy holds a B.A. from Lawrence University and an M.B.A. from the University of Michigan.
Where Can You Find Additional Information
With respect to the statements contained in this annual report on Form 10-K regarding the contents of any agreement or any other document, in each instance, the statement is qualified in all respects by the complete text of the agreement or document, a copy of which has been filed as an exhibit to the registration statement. You may inspect a copy of the reports and other information we file without charge at the Public Reference Room of the Securities and Exchange Commission (SEC) at 100 F Street, N.E., Room 1580, Washington D.C. 20549. You may obtain copies of all or any part of this annual report on Form 10-K from such offices at prescribed rates. You may also obtain information on the operation of the Public Reference Room by calling the SEC at 1-800-SEC-0300. The SEC maintains an Internet site at www.sec.gov that contains reports, proxy and information statements and other information regarding issuers, including our information which we file electronically with the SEC.
We are subject to the information and periodic reporting requirements of the Securities Exchange Act of 1934, as amended, or the Exchange Act, and, in accordance therewith, file periodic reports, proxy statements and other information with the SEC. Such periodic reports, proxy statements and other information are available for inspection and copying at the Public Reference Room and web site of the SEC referred to above. We maintain a web site at www.ikanos.com. You may access our annual report on Form 10-K, quarterly reports on Form 10-Q, current reports on Form 8-K and amendments to those reports filed or furnished pursuant to Section 13(a) or 15(d) of the Exchange Act with the SEC, free of charge at our web site as soon as reasonably practicable after such material is electronically filed with, or furnished to, the SEC. The reference to our web address does not constitute incorporation by reference of the information contained at this site.
| Item 1A. | Risk Factors |
Investing in our common stock involves a high degree of risk. You should carefully consider the following risk factors, as well as the other information in this annual report on Form 10-K, and in our other filings with the Securities and Exchange Commission, or SEC, before deciding whether to invest in shares of our common stock. Additional risks and uncertainties not presently known to us may also affect our business. If any of these known or unknown risks or uncertainties actually occurs with material adverse effects on us, our business, financial condition and results of operations could be seriously harmed. In that event, the market price for our common stock will likely decline and you may lose all or part of your investment.
Risks Related to Our Customers and Markets
Our operating results have fluctuated significantly over time and are likely to continue to do so, and as a result, we may fail to meet or exceed our revenue forecasts or the expectations of securities analysts or investors, which could cause the market price of our common stock to decline.
Our industry is highly cyclical and is characterized by constant and rapid technological change, product obsolescence and price erosion, evolving standards, uncertain product life cycles and wide fluctuations in product supply and demand. The industry has, from time to time, experienced significant and sometimes prolonged, downturns, often connected with or in anticipation of, maturing product cycles and declines in general economic conditions. To respond to these downturns, we have experienced service providers slowing their capital expenditures, changing their purchasing practices to use refurbished rather than purchasing new equipment, canceling or delaying new developments, and taking a cautious approach to acquiring new equipment and technologies from OEMs, usually with very little notice. This, in turn, reduces demand for new semiconductors by our direct customers. We have a relatively small number of customers represent a significant percentage of our revenue and, given their buying patterns, we have experienced, and are likely to continue to experience, significant fluctuations of revenue as the economy changes.
Any future downturns may reduce our revenue and result in us having excess inventory. By contrast, any upturn in the semiconductor industry could result in increased demand and competition for limited production capacity which may affect our ability to ship products and prevent us from benefiting from such an upturn. Accordingly, our operating results may vary significantly as a result of the general conditions in the semiconductor or broadband communications industry, which could cause the market price of our common stock to decline.
16
Table of Contents
Fluctuations in our expenses could affect our operating results.
Our expenses are subject to fluctuations resulting from various factors, including, but not limited to, higher expenses associated with new product releases, costs for manufacturing or components increasing without notice because we do not have formal pricing arrangements with our subcontractors, costs of design tools and large up-front license fees to third parties for intellectual property integrated into our products, as well as other factors identified throughout these risk factors.
Because many of our expenses are relatively fixed in the short term, or are incurred in advance of anticipated sales, we may not be able to reduce our expenses sufficiently to mitigate any reductions in gross margins. In addition, the acquisition of other businesses can generate extraordinary expenses, such as our recent acquisition of the Broadband Access, or BBA, product line from Conexant Systems, Inc. in 2009. As a result, quarter to quarter comparisons of our operating expenses and results should not be relied on as an indicator of future performance. If our operating results do not meet the expectations of securities analysts or investors for any quarter or other reporting period, the market price of our common stock may decline.
General macroeconomic conditions could reduce demand for services based upon our products.
Our business is susceptible to macroeconomic and other market conditions. As an example, we believe that consumer-targeted broadband services, which are deployed using our technology, are part of most households’ discretionary spending. If individual consumers decide not to install—or decide to discontinue purchasing—broadband services in their homes in order to save money in an uncertain economy, the resulting drop in demand could cause telecommunications service providers to reduce or stop placing orders for OEM equipment containing our products. Accordingly, the OEMs’ demand for our products could drop further, potentially having a materially negative effect on our revenue.
We have had a history of losses, and future losses or the inability achieve or sustain profitability in the future may cause the market price of our common stock to decline.
Since our inception, we have only been profitable in the third and fourth quarter of 2005. Prior to the third quarter of 2005, we incurred significant net losses, and we incurred net losses in the past twenty quarters. We have an accumulated deficit of $270.6 million as of January 2, 2011. To achieve profitability again, we will need to generate and sustain higher revenue and to improve our gross margins while maintaining expense levels which are appropriate and necessary for our business. We may not be able to achieve profitability again and, even if it were able to attain profitability again, we may not be able to sustain profitability on an on-going quarterly or an annual basis in the future.
We may need additional capital, and the sale of additional common shares or other equity securities could result in additional dilution to our shareholders.
We believe that our current cash and cash equivalents, anticipated cash flow from operations and the net proceeds received by us from our public offering in 2010 will be sufficient to meet our anticipated cash needs for at least the next twelve months. We may, however, require additional cash resources due to changed business conditions or other future developments, including any investments or acquisitions we may decide to pursue. If our resources are insufficient to satisfy our cash requirements, we may seek to sell additional equity or debt securities or increase our credit facility. The sale of additional equity securities could result in additional dilution to our shareholders. The incurrence of indebtedness would result in increased debt service obligations and could result in operating and financing covenants that would restrict our operations. We cannot assure you that financing will be available in amounts or on terms acceptable to us, if at all.
Our success is dependent upon achieving new design wins into commercially successful systems sold by our OEM and ODM customers.
Our products are generally incorporated into our OEM and ODM customers’ systems at the design stage. As a result, we rely on OEMs and ODMs to select our products to be designed into their systems, which we refer to as a “design win.” At any given time, we are competing for one or more of these design wins and we often incur significant expenditures over multiple fiscal quarters without any assurance that we will achieve a design win. Furthermore, even if we achieve a design win, we cannot be assured that the OEM or ODM’s equipment that we are designed into will be marketed, sold or commercially successful and, accordingly, we may not generate revenue from the design win. In addition, our OEM and ODM customers can choose at any time to discontinue their systems which include our products or delay deployment, which has occurred in the past from time to time. If we are unable to achieve design wins or if our OEM customers’ systems incorporating our products are not commercially successful or deployed, our operating results would suffer.
17
Table of Contents
If we are unable to develop, introduce or to achieve market acceptance of our new semiconductor products, our operating results would be adversely affected.
Our industry is characterized by rapid technological innovation and intense competition. Our future success will depend on our ability to continue to predict what new products are needed to meet the demand of the broadband, communication processor or other markets addressable by our products and then introduce, develop and distribute such products in a timely and cost-effective manner. The development of new semiconductor products is complex, and from time to time we have experienced delays in completing the development and introduction of new products. We have in the past invested substantial resources in [developing and purchasing] emerging technologies that did not achieve the market acceptance that we had expected.
Our ability to develop and deliver new semiconductor products successfully will depend on various factors, including our ability to:
| • | successfully integrate certain technologies acquired in acquisitions into our product lines; |
| • | accurately predict market requirements and evolving industry standards; |
| • | accurately define new semiconductor products; |
| • | timely complete and introduce new product designs or features; |
| • | timely qualify and obtain industry interoperability certification of our products and the equipment into which our products will be incorporated; |
| • | ensure that our subcontractors have sufficient foundry capacity and packaging materials and achieve acceptable manufacturing yields; |
| • | shift our products to smaller geometry process technologies to achieve lower cost and higher levels of design integration; and |
| • | gain market acceptance of our products and our OEM customers’ products. |
If we are unable to develop and introduce new semiconductor products successfully and in a cost-effective and timely manner, we will not be able to attract new customers or retain our existing customers, which would harm our business.
If we do not successfully manage the transition process to next generation semiconductor products, our operating results may be harmed.
If we are successful in timely developing new semiconductor products ahead of competitors but do not cost-effectively manage our inventory levels of existing products when making the transition to the new semiconductor products, our financial results could be negatively affected by high levels of obsolete inventory and our operating results would be harmed.
The average selling prices and gross margins of our products are subject to declines, which may harm our revenue and profitability.
Our products are subject to rapid declines in average selling prices due to competitive pressures, including lowering average selling prices in order to maintain or increase market share. We have lowered our prices significantly at times to gain or maintain market share, and we expect to do so again in the future. In addition, we have not been able to reduce our costs of goods sold as rapidly as our prices have declined. Our financial results, in particular (but not limited to) our gross margins, will suffer if we are unable to maintain or increase pricing, or are unable to offset any future reductions in our average selling prices by increasing our sales volumes, reducing our manufacturing costs or developing new or enhanced products that command higher prices or better gross margins on a timely basis.
18
Table of Contents
Our product sales mix is subject to frequent changes, which may impact our revenue and margin.
Our product margins vary widely by product. As a result, a change in the sales mix of our products could have an impact on the forecasted revenue and margins for the quarter. For example, our Broadband DSL product family generally has higher margins as compared to our Communication Processor product family. Furthermore, the product margins within our Broadband DSL product line can vary based on the type and performance of deployment being used as customers typically pay higher selling prices for higher performance. While we forecast a quarter’s product mix, actual results can be materially different than our forecast which could negatively impact our revenue and margins.
Because we depend on a relatively small number of significant customers for a substantial portion of our revenue, the loss of any of our key customers, our inability to continue to sell existing and new products to our key customers in significant quantities or our failure to attract new significant customers could adversely impact our revenue and harm our business.
We have in the past and expect in the future to derive a substantial portion of our revenue from sales to a relatively small number of customers. The composition of these customers has varied in the past, and we expect that it will continue to vary over time. As a result, the loss of any significant customer or a decline in business with any significant customer would materially and adversely affect our financial condition and results of operations. The following customers accounted for more than 10% of our revenue in the periods indicated below.
| Direct Customer |
OEM Customer |
Year Ended January 2, 2011 |
January 3, 2010 |
December 28, 2008 | ||||
| Alcatel-Lucent and affiliated contract manufacturers | Alcatel-Lucent and affiliated contract manufacturers |
18% | *% | 11% | ||||
| Sagemcom | Sagemcom | 16 | 19 | 21 | ||||
| Paltek Corporation | Sumitomo Electric Industries | * | 12 | 23 | ||||
| NEC Corporation of America | NEC Corporation | * | 11 | 25 |
| * | Less than 10% |
Recent changes in our senior management positions could negatively affect our operations and relationships with our customers and employees.
Since April 2010, a majority of our senior management have resigned or been replaced. In April and June 2010, our President and Chief Executive Officer and Chief Financial Officer resigned, respectively, and our Chairman of the Board of Directors served as our interim President and Chief Executive Officer while we searched for a permanent replacement. Our Board of Directors appointed a new Chief Financial Officer in June 2010 and a new President and Chief Executive Officer in August 2010. Changes in our senior management or technical personnel could affect our customer relationships, employee morale, and our ability to operate in compliance with existing internal controls and regulations and harm our business. If we are unable to successfully integrate our new members of senior management into the Company, our business could be negatively affected.
Because competition for qualified personnel is intense in our industry, we may not be able to recruit and retain necessary personnel, which could impact our product development and sales.
Our future success depends on our ability to continue to attract, retain and motivate other senior management and qualified technical personnel, particularly software engineers, digital circuit designers, mixed-signal circuit designers and systems and algorithms engineers. Competition for these employees is intense. If we are unable to retain our existing personnel, or attract and train additional qualified personnel, our growth may be limited due to our lack of capacity to develop and market our products. All of our key employees are employed on an “at will” basis. The loss of any of these key employees could slow our product development processes and sales efforts or harm the perception of our business. We may also incur increased operating expenses and be required to divert the attention of other senior management to recruit replacements for key employees. Also, our depressed common stock price may result in difficulty attracting and retaining personnel as stock options and other forms of incentive equity grants generally comprise a significant portion of our compensation packages for all employees, which could harm our ability to provide technologically competitive products.
19
Table of Contents
In addition, in the third quarter of 2010 we implemented a corporate restructuring plan that included a reduction in work force of approximately 20% and the closure of three of our overseas offices. The changes in senior management and the multiple restructurings and reductions in force over the past year have had and may continue to have a negative effect on employee morale.
Risks Related to the Tallwood Investment
Tallwood Investors may exercise significant influence over us, including through their ability to elect three members of our Board of Directors.
In April 2009, we sold 24 million shares of our common stock and warrants to purchase up to an additional 7.8 million shares of our common stock (such common stock and warrants collectively referred to as the Securities) to Tallwood III, L.P., a Delaware limited partnership, Tallwood III Partners, L.P., a Delaware limited partnership, Tallwood III Associates, L.P., a Delaware limited partnership, and Tallwood III Annex, L.P., a Delaware limited partnership (collectively referred to as the Tallwood Investors). The funds raised for the sale of the Securities funded a portion of our acquisition of the Broadband Access product line from Conexant Systems, Inc. In addition, one of the Tallwood Investors participated in our public offering of our common stock in 2010. The common stock owned by Tallwood Investors represented approximately 43% of the outstanding shares of our common stock (excluding the exercise of warrants) as of March 10, 2011. Assuming the full exercise of the 7.8 million warrants, the common stock owned by the Tallwood Investors would represent 49% of the outstanding shares of our common stock. Until the third anniversary of the closing of the issuance of the Securities to the Tallwood Investors, the Tallwood Investors have agreed to vote all of their shares in excess of the shares constituting 35% of our outstanding common stock in the same proportion as the votes cast by all our other stockholders. We also entered into a stockholder agreement with the Tallwood Investors, which, among other things, contains certain governance arrangements and various provisions relating to board composition, stock ownership, transfers by the Tallwood Investors and their affiliates, voting and other matters. Subject to certain exceptions, the Tallwood Investors are permitted under the terms of the stockholder agreement to maintain their ownership interest in our company in subsequent equity offerings. As a result, the Tallwood Investors may have the ability to significantly influence the outcome of any matter submitted for the vote of our stockholders. The Tallwood Investors may have interests that diverge from, or even conflict with, our interests and those of our other stockholders. In addition, the Certificate of Designation of the Series A Preferred Stock provides that the Tallwood Investors have the right to designate three directors to our Board of Directors while the Tallwood Investors hold at least 35% of the outstanding our common stock, and a number of directors to our Board of Directors proportional to the Tallwood Investors’ ownership position in us after such time as the Tallwood Investors hold less than 35% of our outstanding common stock. As a result, the directors elected to our Board of Directors by the Tallwood Investors may exercise significant influence on matters considered by our Board of Directors.
The market price of our common stock may decline as a result of future sales of our common stock by the Tallwood Investors.
We are unable to predict the potential effects of the Tallwood Entities ownership of our outstanding common on the trading activity in and market price of our common stock. Pursuant to the stockholder agreement, we have granted the Tallwood Entities and their permitted transferees registration rights for the resale of the shares of our common stock and shares of our common stock underlying the warrants. Under the terms of the registration rights, we have filed a registration statement that permits the resale of such securities into the public market, and any such resale would increase the number of shares of our common stock available for public trading. Sales by the Tallwood Entities or their permitted transferees of a substantial number of shares of our common stock in the public market, or the perception that such sales might occur, could have a material adverse effect on the price of our common stock.
Holders of our common stock will not be entitled to elect a certain number of directors of our company while the Tallwood Entities control a voting share of our Series A Preferred Stock.
As the holder of the Series A Preferred Stock (Voting Share), Tallwood III Partners, L.P., has the right to designate three members out of seven members to our Board of Directors while the Tallwood Entities hold at least 35% of our outstanding common stock, and a number of directors to our Board of Directors proportional to the Tallwood Entities’ ownership position of our common stock after such time as the Tallwood Entities hold less than 35% of our outstanding common stock. During the time they control the Voting Share, the Tallwood Entities will be able to exert significant influence, and potentially control, over us and may have interests that diverge from, or even conflict with, our interests and those of our other stockholders.
20
Table of Contents
Risks Related to Our Operations and Technology
We rely on third-party technologies for the development of our products, and our inability to use such technologies in the future or the failure of such technology would harm our ability to remain competitive.
We rely on third parties for technologies that are integrated into some of our products, including the memory cells, input/output cells, hardware interfaces and core processor logic. If we are unable to continue to use or license these technologies on reasonable terms, or if these technologies fail to operate properly, we may not be able to secure alternatives in a timely manner and our ability to remain competitive would be harmed. In addition, the third party intellectual property could also expose us to liability and, while we have not experienced material warranty costs in any period as a result of third party intellectual property, there can be no assurance that will not in the future.
We are a fabless semiconductor company and failure to secure and maintain sufficient capacity with our subcontractors could significantly disrupt shipment of our products, impair our relationships with customers and decrease sales, which would negatively impact our market share and operating results.
We are a fabless semiconductor company and currently use nine wafer foundries and five outside factory subcontractors, located in Austria, China, Israel, Korea, Malaysia, Singapore, Taiwan, and the United States to manufacture, assemble and test all of our current semiconductor devices. While we work with multiple suppliers, generally each product is made by one foundry and one assembly and test subcontractor. Accordingly, we are greatly dependent on a limited number of suppliers to deliver quality products on time. In past periods of high demand in the semiconductor market, we have experienced delays in meeting our capacity demand and as a result were unable to deliver products to our customers on a timely basis. In addition, we have experienced similar delays due to technical and quality control problems.
If we were to need to qualify a new facility to meet our capacity, or if a foundry or subcontractor ceased working with us, as has happened in the past, or if production is disrupted, we may be unable to meet our customer demand on a timely basis, or at all. We may be required to incur additional costs and may need to successfully qualify an alternative facility in order to not disrupt our business.
In the event we seek to use new wafer foundries to manufacture a portion of our semiconductor products, we may not be able to bring the new foundries on-line rapidly enough and may not achieve anticipated cost reductions.
As indicated above, we use a limited number of independent wafer foundries to manufacture all of our semiconductor products which could expose us to risks of delay, increased costs and customer dissatisfaction in the event that any of these foundries are unable to meet our semiconductor requirements. We may seek to qualify additional wafer foundries to meet our future requirements but the qualification process typically requires several months or more. By the time a new foundry is qualified, the need for additional capacity may have passed or we may have lost the potential opportunity to a competitor. If we cannot accomplish this qualification in a timely manner, we would experience a significant interruption in supply of the affected products which could in turn cause our costs of revenue to increase and our overall revenue to decrease. This would harm our customer relationships and our market share and operating results would suffer as a result.
When demand for manufacturing capacity is high, we may take various actions to try to secure sufficient capacity, which could be costly and negatively impact our operating results.
Although we have purchase order commitments to supply specified levels of products to our OEM customers, we do not have a guaranteed level of production capacity from any of our subcontractors’ facilities that we depend upon to produce semiconductors. Facility capacity may not be available when we need it or at reasonable prices. We place our orders on the basis of our OEM customers’ purchase orders or our forecast of customer demand, and our subcontractors may not be able to meet our requirements in a timely manner, or at all.
In order to secure sufficient manufacturing facility capacity when demand is high and mitigate the risks described in the foregoing paragraphs, we may enter into various arrangements with subcontractors that could be costly and negatively affect our operating results, including:
| • | option payments or other prepayments to a subcontractor; |
| • | nonrefundable deposits with or loans to subcontractors in exchange for capacity commitments; |
| • | contracts that commit us to purchase specified quantities of components over extended periods; |
21
Table of Contents
| • | purchase of testing equipment for specific use at subcontractors’ facilities; |
| • | issuance of equity securities to a subcontractor; and |
| • | other contractual relationships with subcontractors. |
We may not be able to make any such arrangements in a timely fashion or at all, and any arrangements may be costly, reduce our financial flexibility, not be on terms favorable to us and may contain financial penalties if we do not use all of our allocated facility capacity. These penalties and obligations may be expensive and could harm our business.
Defects and poor performance in our products could result in loss of customers, decreased revenue, unexpected expenses and loss of market share, and we may face warranty and product liability claims arising from defective products.
We have in the past, and may in the future experience, defects (commonly referred to as “bugs”) in our products which may not always be detected by testing processes. Defects can result from a variety of causes, including but not limited to manufacturing problems or third party intellectual property incorporated into our products. If defects are discovered after our products have shipped, we have experienced, and could continue to experience, warranty and consequential damages claims from our customers. If we are unable to deliver quality products, our reputation would be harmed, which could result in the loss of, future orders and business with our customers. Further, we may experience difficulties in achieving acceptable yields on some of our products, which may result in higher per unit cost, shipment delays, and increased expenses associated with resolving yield problems. If any of these adverse risks are realized and we are not able to offset the lost opportunities, our revenue, margins and operating results would decline.
If our forecasts of our OEM customers’ demand are inaccurate, our financial condition and liquidity would suffer.
We place orders with our suppliers based on the forecasts of our OEM customers’ demand. Our forecasts are based on multiple assumptions, each of which may introduce errors into our estimates. If we do not accurately forecast customer demand, we may forego revenue opportunities, lose market share, damage customer relationships or allocate resources to manufacturing products that we may not be able to sell. As a result, as we experienced in the second and third quarters of fiscal 2010, we could have excess or obsolete inventory, resulting in a decline in the value of our inventory, which would increase our cost of revenue, negatively affect gross margins, and create a drain on our liquidity. Our failure to accurately manage inventory against demand would adversely affect our financial results.
To remain competitive, we need to continue to reduce the cost of our semiconductor chips, which includes migrating to smaller geometrical processes, and our failure to do so may harm our business.
We periodically evaluate the benefits, on a product-by-product basis, of migrating to smaller geometrical processes, which are measured in microns or nanometers. We have in the past, and may in the future, experience some difficulties in shifting to smaller geometry process technologies or new manufacturing processes, which resulted in reduced manufacturing yields, delays in product deliveries and increased product costs and expenses. Additionally, upfront expenses associated with smaller geometry process technologies such as for masks and tooling can be significantly higher than those for the processes that we currently use, and our migration to these newer process technologies can result in significantly higher research and development expenses.
Third-party claims of infringement or other claims against us could adversely affect our ability to market our products, require us to redesign our products or seek licenses from third parties, and harm our business. In addition, any litigation required to defend such claims could result in significant expenses and diversion of our resources.
Semiconductor industry companies and intellectual property holding companies often aggressively protect and pursue their intellectual property rights. From time to time, we receive, and we are likely to continue to receive in the future, notices that claim our products infringe upon other parties’ proprietary rights. We may in the future be engaged in litigation with parties who claim that we have infringed their patents or misappropriated or misused their trade secrets or who may seek to invalidate one or more of our patents, and it is possible that we would not prevail in any future lawsuits. An adverse determination in any of these types of claims could prevent us from manufacturing or selling some of our products, could increase our costs of products and could expose us to significant liability. In addition, a court could issue a preliminary or permanent injunction that would require us to withdraw or recall certain products from the market or redesign certain
22
Table of Contents
products offered for sale or that are under development. In addition, we may be liable for damages for past infringement and royalties for future use of the technology and we may be liable for treble damages if infringement is found to have been willful. Even if claims against us are not valid or successfully asserted, these claims could result in significant costs and a diversion of management and personnel resources to defend.
Any potential dispute involving our patents or other intellectual property could also include our customers which could trigger our indemnification obligations to one or more of them and result in substantial expense to us.
In any potential dispute or claim involving our patents or other intellectual property, our customers could also become the target of litigation. Because we may indemnify our customers for intellectual property claims made against them for products incorporating our technology, any litigation could trigger technical support and indemnification obligations in some of our license agreements, which could result in substantial expenses. While we have not incurred any indemnification expenses as a result of infringement notices to our customers, any future indemnity claim could adversely affect our relationships with our OEM customers and result in substantial costs to us.
We face intense competition in the semiconductor industry and the broadband communications markets, which could reduce our market share and negatively impact our revenue.
The semiconductor industry and the broadband communications markets are intensely competitive. In the VDSL or VDSL-like technology, PON and communications processing markets, we currently compete or expect to compete with, among others, Broadcom Corporation, BroadLight, Inc., Cavium Networks, Inc., Freescale Semiconductor, Inc., Lantiq Deutschland GmbH, Marvell Technology Group Ltd., PMC-Sierra, Inc., Realtek Semiconductor Corp and Ralink Corp.
Many of our competitors may have stronger manufacturing subcontractor relationships than us and longer operating histories, greater name recognition, larger customer bases, and significantly greater financial, sales and marketing, manufacturing, distribution, technical and other resources. In addition, many of our competitors have extensive technology libraries that could enable them to incorporate broadband or communications processing technologies into a system on a chip, creating a more attractive product line than ours. These competitors may be able to adapt more quickly to new or emerging technologies and changes in customer requirements. In addition, current and potential competitors have established or may establish financial or strategic relationships among themselves or with existing or potential customers, resellers or other third parties. Accordingly, new competitors or alliances among competitors could emerge and rapidly acquire significant market share. Existing or new competitors may also develop alternative technologies that more effectively address our markets with products that offer enhanced features and functionality, lower power requirements, greater levels of semiconductor integration or lower cost. We cannot assure that we will be able to compete successfully against current or new competitors, in which case we may lose market share in our existing markets and our revenue may fail to increase or may decline.
Other data transmission technologies and communications processing technologies may compete effectively with the service provider services addressed by our products, which could adversely affect our revenue and business.
Our revenue currently is dependent upon the increase in demand for service provider services that use broadband technology and integrated residential gateways. Besides xDSL and other DMT-based technologies, service providers can decide to deploy PON or fiber and there would be reduced need for our products. For example, a major service provider in Korea announced its intention to use more FTTH deployments in the future which could be in lieu of xDSL products. If more service providers decide to use FTTH deployments, it could harm our xDSL business if our products are not needed. Furthermore, residential gateways compete against a variety of different data distribution technologies, including Ethernet routers, set-top boxes provided by cable and satellite providers, wireless (WiFi and WiMax) and emerging power line and multimedia over coax alliance technologies. If any of these competing technologies proves to be more reliable, faster or less expensive than, or has any other advantages over the broadband technologies we provide, the demand for our products may decrease and our business would be harmed.
Rapidly changing standards and regulations could make our products obsolete, which would cause our revenue and operating results to suffer.
We design our products to conform to regulations established by governments and to standards set by industry standards bodies worldwide such as the Committee T1E1.4 (now known as NIPP-NAI) of the ATIS (accredited by ANSI), and worldwide by both the IEEE and the ITU-T. Because our products are designed to conform to current specific industry standards, if competing standards emerge that are preferred by our customers, we would have to make significant
23
Table of Contents
expenditures to develop new products. If our customers adopt new or competing industry standards with which our products are not compatible, or the industry groups adopt standards or governments issue regulations with which our products are not compatible, our existing products would become less desirable to our customers, and our revenue and operating results would suffer.
If we fail to secure or protect our intellectual property rights, competitors may be able to use our technologies, which could weaken our competitive position, reduce our revenue or increase our cost.
Our success will depend, in part, on our ability to protect our intellectual property. We rely on a combination of patent, copyright, trademark and trade secret laws, confidentiality procedures and licensing arrangements to establish and protect our proprietary rights. Our pending patent applications may not result in issued patents, and our existing and future patents may not be sufficiently broad to protect our proprietary technologies or may be held invalid or unenforceable in court. While we are not currently aware of misappropriation of our existing technology, policing unauthorized use of our technology is difficult and we cannot be certain that the steps we have taken will prevent the misappropriation or unauthorized use of our technologies, particularly in foreign countries where we have not applied for patent protections and, even if such protections were available, the laws may not protect our proprietary rights as fully as United States law. The patents we have obtained or licensed, or may obtain or license in the future, may not be adequate to protect our proprietary rights. Our competitors may independently develop or may have already developed technology similar to us, duplicate our products or design around any patents issued to us or our other intellectual property. In addition, we have been, and may be, required to license our patents as a result of our participation in various standards organizations. If competitors appropriate our technology and it is not adequately protected, our competitive position would be harmed, our legal costs would increase and our revenue would be harmed.
Changes in current or future laws or regulations or the imposition of new laws or regulations by federal or state agencies or foreign governments could impede the sale of our products or otherwise harm our business.
The effects of regulation on our customers or the industries in which they operate may materially and adversely impact our business. For example, India’s government is currently considering regulation that may limit or prohibit sales of certain telecommunications products manufactured in China. While the rule-making process is not final, if the rules apply to equipment containing our semiconductor products, such regulation could reduce sales of our products and have a negative effect on our operating results.
In addition, the Ministry of Internal Affairs and Communications in Japan, the Ministry of Communications and Information in Korea, various national regulatory agencies in Europe, the European Commission in the European Union, the U.S. Federal Communications Commission have broad jurisdiction over our target markets. Although the laws and regulations of these and other federal or state agencies may not be directly applicable to our products, they do apply to much of the equipment into which our products are incorporated. Governmental regulatory agencies worldwide may affect the ability of telephone companies to offer certain services to their customers or other aspects of their business, which may in turn impede sales of our products.
In addition to the laws and regulations specific to telecommunications equipment, other laws and regulations affect our business. For instance, changes in tax, employment and import/export laws and regulations, and their enforcement commonly occur in the various countries in which we operate. If changes in those laws and regulations, or in the enforcement of those laws and regulations, occur in a manner that we did not anticipate, those changes could cause us to have increased operating costs or to pay higher taxes, and thus have a negative effect on our operating results.
Failure to maintain adequate internal controls as required by Section 404 of the Sarbanes-Oxley Act, referred to as SOX, could harm our operating results, our ability to operate our business and our investors’ view of our company.
If we do not maintain the adequacy of our internal controls, we may not be able to ensure that we can conclude on an ongoing basis that we have effective internal control over financial reporting in accordance with Section 404 of SOX. Effective internal controls particularly those related to revenue recognition, valuation of inventory and warranty provisions, are necessary for us to produce reliable financial reports and are important in helping to prevent financial fraud. If we cannot provide reliable financial reports or prevent fraud, our business and operating results could be harmed, investors could lose confidence in our reported financial information, and the trading price of our common stock could drop significantly.
24
Table of Contents
Our international operations subject our company to risks not faced by companies without international operations.
We currently obtain substantially all of our manufacturing, assembly and testing services from suppliers and subcontractors located outside the United States, and have a significant portion of our research and development team located in China and India. In addition, 98% of our revenue for the year ended January 2, 2011 and 92% of our revenue for the year ended January 3, 2010 were derived from sales to customers outside the United States. We have expanded our international business activities and may open other design and operational centers abroad. International operations are subject to many other inherent risks, including but not limited to:
| • | political, social and economic instability, including war and terrorist acts; |
| • | exposure to different legal standards, particularly with respect to intellectual property; |
| • | trade and travel restrictions; |
| • | the imposition of governmental controls and restrictions or unexpected changes in regulatory requirements; |
| • | burdens of complying with a variety of foreign laws; |
| • | import and export license requirements and restrictions of the United States and each other country in which we operate; |
| • | foreign technical standards; |
| • | changes in tariffs; |
| • | difficulties in staffing and managing international operations; |
| • | foreign currency exposure and fluctuations in currency exchange rates; |
| • | difficulties in collecting receivables from foreign entities or delayed revenue recognition; and |
| • | potentially adverse tax consequences. |
Because we are currently substantially dependent on our foreign sales, research and development and operations, any of the factors described above could significantly harm our ability to produce quality products in a timely and cost effective manner, and increase or maintain our foreign sales.
Fluctuations in exchange rates between and among the U.S. dollar and other currencies in which we do business, may adversely affect our operating results.
We maintain extensive operations internationally. We have offices in China, India and other offices in France, Germany, Japan, Korea, Singapore and Taiwan. We incur a portion of our expenses in currencies other than the U.S. dollar, including the Chinese Yuan, the Euro, the Indian rupee, the Korean won, the Japanese yen, Singapore dollar and the Taiwanese dollar. As a result, we may experience foreign exchange gains or losses due to the volatility of these currencies compared to the U.S. dollar. Because we report our results in U.S. dollars, the difference in exchange rates in one period compared to another directly impacts period to period comparisons of our operating results. In addition, our sales have been historically denominated in U.S. dollars. Currency exchange rates have been especially volatile in the recent past and these currency fluctuations may make it difficult for us to predict and/or provide guidance on our results. Currently, we have not implemented any strategies to mitigate risks related to the impact of fluctuations in currency exchange rates and we cannot predict future currency exchange rate changes.
Several of the facilities that manufacture our products, most of our OEM customers and the service providers they serve, and our California facility are located in regions that are subject to earthquakes and other natural disasters.
Several of our subcontractors’ facilities that manufacture, assemble and test our products and four of our
25
Table of Contents
subcontractor’s wafer foundries are located in Malaysia, Singapore and Taiwan. Several large customers are located in Japan and Korea. The Asia-Pacific region has experienced significant earthquakes and other natural disasters in the past, including a recent major earthquake in Taiwan, and could be subject to additional seismic activities. Any earthquake or other natural disaster in these areas could significantly disrupt these manufacturing facilities’ production capabilities and could result in our experiencing a significant delay in delivery, or substantial shortage of wafers, in particular, and possibly in higher wafer prices, and our products in general. Our headquarters in California are also located near major earthquake fault lines. If there is a major earthquake or any other natural disaster in a region where one of our facilities is located, it could significantly disrupt our operations.
Changes in our tax rates could affect our future results.
Our future effective tax rates could be favorably or unfavorably affected by the absolute amount and future geographic distribution of our pre-tax income, our ability to successfully shift our operating activities to foreign operations and the amount and timing of inter-company payments from our foreign operations subject to U.S. income taxes related to the transfer of certain rights and functions.
Risks Related to Our Common Stock
The market price of our common stock has been and may continue to be volatile, and holders of our common stock may not be able to resell shares at or above the price paid, or at all.
The market price of our common stock has fluctuated substantially since our initial public offering and is likely to continue to be highly volatile and subject to wide fluctuations. Fluctuations have occurred and may continue to occur in response to various factors, many of which we cannot control, including:
| • | quarter-to-quarter variations in our operating results; |
| • | announcements of changes in our senior management; |
| • | the gain or loss of one or more significant customers or suppliers; |
| • | announcements of technological innovations or new products by our competitors, customers or our company; |
| • | the gain or loss of market share in any of our markets; |
| • | general economic and political conditions and specific conditions in the semiconductor industry and broadband technology markets, including seasonality in sales of consumer products into which our products are incorporated; |
| • | continuing international conflicts and acts of terrorism; |
| • | changes in earnings estimates or investment recommendations by analysts; |
| • | changes in investor perceptions; |
| • | changes in product mix; or |
| • | changes in expectations relating to our products, plans and strategic position or those of our competitors or customers. |
The closing sale price of our common stock on the NASDAQ Global Market for the period of January 1, 2007 to January 2, 2011 ranged from a low of $0.86 to a high of $9.34.
In addition, the market prices of securities of semiconductor and other technology companies have been volatile, particularly companies, like ours, with low trading volumes. This volatility has significantly affected the market prices of securities of many technology companies for reasons frequently unrelated to the operating performance of the specific companies. Accordingly, holders of our common stock may not be able to resell their shares at or above the price paid.
26
Table of Contents
If we fail to continue to meet all applicable NASDAQ Global Market requirements, our stock could be delisted from the NASDAQ Global Market. If delisting occurs, it would adversely affect the market liquidity of our common stock and harm our business.
Our common stock is currently traded on the NASDAQ Global Market under the symbol “IKAN.” If we fail to meet any of the continued listing standards of the NASDAQ Global Market, our common stock could be delisted from the NASDAQ Global Market. These continued listing standards include specifically enumerated criteria, including a $1.00 minimum closing bid price.
Our common stock has traded below $1.00 per share in the past. If our common stock trades below $1.00 per share for a period of 30 consecutive business days, there can be no assurance that NASDAQ will not take action to enforce its listing requirements. Any delisting could adversely affect the market price of and liquidity of the trading market for our common stock, our ability to obtain financing for the continuation of its operations and could result in the loss of confidence by investors, suppliers and employees.
The pending class action litigation could cause us to incur substantial costs and divert our management’s attention and resources.
In November 2006, three putative class action lawsuits were filed in the United States District Court for the Southern District of New York against us, our directors and two former executive officers, as well as the lead underwriters for its initial and secondary public offerings. The lawsuits were consolidated and an amended complaint was filed on April 24, 2007. The amended complaint sought unspecified damages for certain alleged misrepresentations and omissions made by us in connection with both our initial public offering in September 2005 and its follow-on offering in March 2006. On June 25, 2007, we filed motions to dismiss the amended complaint, and on March 10, 2008, the Court dismissed the case with prejudice. On March 25, 2008, plaintiffs filed a motion for reconsideration, and on June 12, 2008, the District Court denied the motion for reconsideration. On October 15, 2008, plaintiffs appealed the District Court’s dismissal of the amended complaint and denial of its motion for reconsideration to the United States Court of Appeals for the Second Circuit. On September 17, 2009, the Court of Appeals affirmed the District Court’s dismissal of the amended complaint, but vacated its judgment on the motion for reconsideration and remanded the case to the District Court for further proceedings. On May 13, 2010, the District Court granted plaintiffs leave to file a motion to amend the pleadings. Plaintiffs filed a motion for leave to amend the complaint on June 11, 2010. We opposed on July 11, 2010, and on November 23, 2010, the District Court denied the motion. On January 6, 2011, plaintiffs filed a notice of appeal with the United States Court of Appeals for the Second Circuit. A briefing schedule for the appeal has not yet been scheduled. We cannot predict the likely outcome of the appeal, and an adverse result in the litigation could have a material effect on its financial statements.
Additionally, from time to time, we are a party to various legal proceedings and claims arising from the normal course of business activities. Based on current available information, other than set forth above, we do not expect that the ultimate outcome of any currently pending unresolved matters, individually or in the aggregate, will have a material adverse effect on our results of operations, cash flows or financial position.
If the securities analyst who currently publishes reports on Ikanos does not continue to publish research or reports about our business, or if he issues an adverse opinion regarding our common stock, the market price of our common stock price and trading volume could decline.
The trading market for our common stock is influenced by the research and reports that industry or securities analysts publish about us or our business. We have lost all the securities research coverage with the exception of one analyst. If this analyst issues an adverse opinion regarding our common stock, the stock price would likely decline. If the analyst ceases coverage of our company or fails to regularly publish reports on us, we could lose further visibility to the financial markets, which in turn could cause the market price of our common stock or trading volume to decline.
Delaware law and our corporate charter and bylaws contain anti-takeover provisions that could delay or discourage takeover attempts that stockholders may consider favorable.
Provisions in our certificate of incorporation may have the effect of delaying or preventing a change of control or changes in our management. These provisions include the following:
| • | the right of our Board of Directors to elect a director to fill a vacancy created by the expansion of our Board of Directors; |
27
Table of Contents
| • | the establishment of a classified Board of Directors requiring that not all members of the board be elected at one time; |
| • | the prohibition of cumulative voting in the election of directors which would otherwise allow less than a majority of stockholders to elect director candidates; |
| • | the requirement for advance notice for nominations for election to the board of directors or for proposing matters that can be acted upon at a stockholders’ meeting; |
| • | the ability of our Board of Directors to alter our bylaws without obtaining stockholder approval; |
| • | the ability of our Board of Directors to issue, without stockholder approval, up to 1,000,000 shares of preferred stock with terms set by the Board of Directors, which rights could be senior to those of common stock; |
| • | the required approval of holders of at least two-thirds of the shares entitled to vote at an election of directors to adopt, amend or repeal our bylaws or amend or repeal the provisions of our certificate of incorporation regarding the election and removal of directors and the ability of stockholders to take action; |
| • | the required approval of holders of a majority of the shares entitled to vote at an election of directors to remove directors for cause; and |
| • | the elimination of the right of stockholders to call a special meeting of stockholders and to take action by written consent. |
In addition, because we are incorporated in Delaware, we are governed by the provisions of Section 203 of the Delaware General Corporation Law. These provisions may prohibit large stockholders, in particular those owning 15% or more of our outstanding voting stock, from merging or combining with us. These provisions in our certificate of incorporation, bylaws and under Delaware law could discourage potential takeover attempts and could reduce the price that investors might be willing to pay for shares of our common stock in the future and result in the market price being lower than it would without these provisions.
28
Table of Contents
| ITEM 1B. | UNRESOLVED STAFF COMMENTS |
None
| ITEM 2. | PROPERTIES |
Facilities
Our headquarters is located in Fremont, California, where we lease approximately 73,500 square feet of space under a lease agreement that expires in March 2016. The Fremont facility location is primarily utilized for research and development, sales and support, operations management, and general administrative functions. We also have other significant facility locations in the United States and throughout the world including a 100,000 square foot research and development facility in Red Bank, New Jersey whose lease expires on July 31, 2011 and is expected to be renewed or replaced with another location within the area upon expiration, and a 36,100 square foot research and development facility in Bangalore, India whose lease expires in October 21, 2014.
We believe that our facilities are adequate for the next 12 months and that, if required, suitable additional space will be available on commercially reasonable terms to accommodate our operations.
| Item 3. | Legal Proceedings |
In November 2006, three putative class action lawsuits were filed in the United States District Court for the Southern District of New York against us, our directors and two former executive officers, as well as the lead underwriters for its initial and secondary public offerings. The lawsuits were consolidated and an amended complaint was filed on April 24, 2007. The amended complaint sought unspecified damages for certain alleged misrepresentations and omissions made by us in connection with both our initial public offering in September 2005 and its follow-on offering in March 2006. On June 25, 2007, we filed motions to dismiss the amended complaint, and on March 10, 2008, the Court dismissed the case with prejudice. On March 25, 2008, plaintiffs filed a motion for reconsideration, and on June 12, 2008, the District Court denied the motion for reconsideration. On October 15, 2008, plaintiffs appealed the District Court’s dismissal of the amended complaint and denial of its motion for reconsideration to the United States Court of Appeals for the Second Circuit. On September 17, 2009, the Court of Appeals affirmed the District Court’s dismissal of the amended complaint, but vacated its judgment on the motion for reconsideration and remanded the case to the District Court for further proceedings. On May 13, 2010, the District Court granted plaintiffs leave to file a motion to amend the pleadings. Plaintiffs filed a motion for leave to amend the complaint on June 11, 2010. We opposed on July 11, 2010, and on November 23, 2010, the District Court denied the motion. On January 6, 2011, plaintiffs filed a notice of appeal with the United States Court of Appeals for the Second Circuit. A briefing schedule for the appeal has not yet been scheduled. We cannot predict the likely outcome of the appeal, and an adverse result in the litigation could have a material effect on its financial statements.
Additionally, from time to time, we are a party to various legal proceedings and claims arising from the normal course of business activities. Based on currently available information, other than as set forth above, we do not expect that the ultimate outcome of any currently pending unresolved matters, individually or in the aggregate, will have a material adverse effect on our results of operations, cash flows or financial position.
| ITEM 4. | RESERVED |
29
Table of Contents
PART II
| ITEM 5. | MARKET FOR REGISTRANT’S COMMON EQUITY, RELATED STOCKHOLDER MATTERS AND ISSUER PURCHASES OF EQUITY SECURITIES |
Price Range of Common Stock
Our common stock is quoted on the NASDAQ Global Market under the symbol “IKAN”. The following table sets forth the high and low sales prices of our common stock as reported on the NASDAQ Global Market for the periods indicated.
| High | Low | |||||||
| 2009 |
||||||||
| First quarter |
$ | 1.55 | $ | 1.05 | ||||
| Second quarter |
$ | 1.81 | $ | 1.29 | ||||
| Third quarter |
$ | 2.09 | $ | 1.44 | ||||
| Fourth quarter |
$ | 2.62 | $ | 1.58 | ||||
| 2010 |
||||||||
| First quarter |
$ | 3.20 | $ | 1.85 | ||||
| Second quarter |
$ | 3.50 | $ | 1.51 | ||||
| Third quarter |
$ | 2.00 | $ | 0.86 | ||||
| Fourth quarter |
$ | 1.45 | $ | 0.98 | ||||
As of March 2, 2011, there were approximately 375 holders of record of our common stock.
Dividend Policy
We have never declared or paid any cash dividends on our common stock or other securities. We currently anticipate that we will retain all of our future earnings for use in the expansion and operation of our business and do not anticipate paying any cash dividends in the foreseeable future. We also may incur indebtedness in the future that may prohibit or effectively restrict the payment of dividends on our common stock. Any future determination related to our dividend policy will be made at the discretion of our board of directors.
Equity Compensation Plan Information
The information required by this item regarding equity compensation plans is incorporated by reference to the information set forth in Part III, Item 12 of this annual report on Form 10-K.
Sale of Unregistered Securities
For the four years ended January 3, 2010, we issued 177,380 shares of unregistered common stock in connection with the acquisition of Doradus Technologies in July 2006. In addition, we issued 872,315 shares of unregistered common stock in connection with an asset purchase and an acquisition during 2009 through 2010.
We claimed exemption from registration under the Securities Act for the issuance of securities in the transaction described above by virtue of Section 4(2) and/or Regulation D promulgated thereunder as a transaction not involving any public offering. The purchaser of the unregistered securities for which we relied on Regulation D and/or Section 4(2) was an accredited investor as defined under the Securities Act. We claimed such exemption on the basis that (a) the purchaser represented that he intended to acquire the securities for investment only and not with a view to the distribution thereof and that he either received adequate information about us or had access, through employment or other relationships, to such information and (b) appropriate legends were affixed to the stock certificates issued in such transactions. The recipient either received adequate information about us or had adequate access, through their relationships with us, to information about us.
30
Table of Contents
We sold to the Tallwood Investors (i) 24 million shares of our common stock, par value $0.001 per share (the Common Stock) and (ii) warrants to purchase up to 7.8 million shares of Common Stock (the Warrants) for $42.0 million. The transaction was completed on August 24, 2009, and the purchase price of each share of Common Stock and the exercise price of each warrant to purchase a share of Common Stock under the securities purchase agreement is $1.75. In addition, we issued to the Tallwood Investors one share (the Voting Share) of Series A Preferred Stock, which provides the Tallwood Investors certain voting rights solely with respect to election of a minority of the members of the Board of Directors but does not share in the economics of our Company. The Common Stock, Warrants and the Voting Share collectively are referred to as the Tallwood Investment. The transaction was undertaken without an underwriter. The securities were registered on Form S-3 during January of 2010. We used the proceeds from the Tallwood Investment to fund the purchase of the BBA product line from Conexant.
Performance Graph
The performance graph below is required by the SEC and shall not be deemed to be incorporated by reference by any general statement incorporating by reference this annual report on Form 10-K into any filing under the Securities Act or the Securities Exchange Act except to the extent we specifically incorporate this information by reference and shall not otherwise be deemed soliciting material or filed under such acts.
The following graph shows a comparison of cumulative total stockholder return, calculated as of the end of each six month period on a dividend-reinvested basis, for Ikanos Communications, the NASDAQ Stock Market (U.S.) Index and the Philadelphia Semiconductor Index. The graph assumes that $100 was invested in Ikanos Communications common stock, the NASDAQ Stock Market (U.S.) Index and the Philadelphia Semiconductor Index for five years from December 31, 2005 through January 2, 2011. Note that historic stock price performance is not necessarily indicative of future stock price performance.
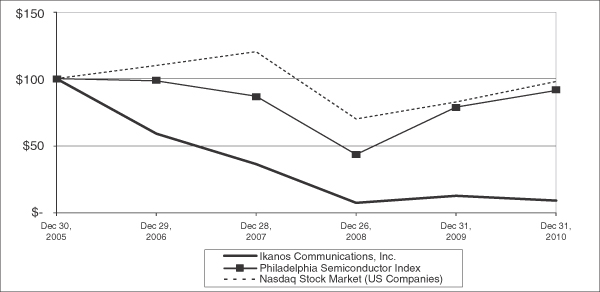
| 12/30/2005 | 12/29/2006 | 12/28/2007 | 12/26/2008 | 12/31/2009 | 12/31/2010 | |||||||||||||||||||
| Ikanos Communications, Inc. |
100.00 | 58.95 | 36.29 | 7.33 | 12.69 | 9.09 | ||||||||||||||||||
| Philadelphia Semiconductor Index |
100.00 | 98.26 | 86.88 | 43.45 | 78.73 | 91.26 | ||||||||||||||||||
| NASDAQ Stock Market (US Companies) |
100.00 | 109.84 | 120.12 | 69.92 | 82.53 | 97.95 | ||||||||||||||||||
31
Table of Contents
| ITEM 6. | SELECTED FINANCIAL DATA |
The following selected consolidated financial data should be read in conjunction with “Management’s Discussion and Analysis of Financial Condition and Results of Operations” and our consolidated financial statements and related notes included elsewhere in this annual report on Form 10-K. Our fiscal years are the 52 or 53 week periods ended on the Sunday nearest the end of December. Historical results are not necessarily indicative of the results to be expected in the future.
| Year Ended | ||||||||||||||||||||
| 2006 | 2007 | 2008 | 2009 | 2010 | ||||||||||||||||
| (In thousands, except per share data) | ||||||||||||||||||||
| Consolidated Statements of Operations |
||||||||||||||||||||
| Revenue |
$ | 134,685 | $ | 107,467 | $ | 106,505 | $ | 130,688 | $ | 191,677 | ||||||||||
| Cost of revenue(1) |
81,352 | 63,264 | 61,827 | 85,019 | 126,692 | |||||||||||||||
| Gross profit |
53,333 | 44,203 | 44,678 | 45,669 | 64,985 | |||||||||||||||
| Operating expenses: |
||||||||||||||||||||
| Research and development(1) |
53,733 | 51,056 | 43,231 | 49,805 | 60,769 | |||||||||||||||
| Selling, general and administrative(1) |
25,082 | 27,398 | 25,823 | 30,974 | 27,239 | |||||||||||||||
| Asset impairments |
— | — | 12,496 | 2,460 | 21,378 | |||||||||||||||
| Restructuring charges |
1,691 | 3,661 | — | 1,338 | 5,794 | |||||||||||||||
| Common stock offering expenses |
954 | — | — | — | — | |||||||||||||||
| Total operating expenses |
81,460 | 82,115 | 81,550 | 84,577 | 115,180 | |||||||||||||||
| Loss from operations |
(28,127 | ) | (37,912 | ) | (36,872 | ) | (38,908 | ) | (50,195 | ) | ||||||||||
| Investment gain (impairment) |
— | — | (6,166 | ) | 1,238 | — | ||||||||||||||
| Interest income and other, net |
4,970 | 4,942 | 2,145 | 727 | 51 | |||||||||||||||
| Loss before income taxes |
(23,157 | ) | (32,970 | ) | (40,893 | ) | (36,943 | ) | (50,144 | ) | ||||||||||
| Provision (benefit) for income taxes |
280 | 294 | 220 | 158 | (381 | ) | ||||||||||||||
| Loss before cumulative change in accounting principle |
(23,437 | ) | (33,264 | ) | (41,113 | ) | (37,101 | ) | (49,763 | ) | ||||||||||
| Cumulative effect of change in accounting principle, net of tax(2) |
638 | — | — | — | — | |||||||||||||||
| Net loss(3)(4) |
$ | (22,799 | ) | $ | (33,264 | ) | $ | (41,113 | ) | $ | (37,101 | ) | $ | (49,763 | ) | |||||
| Basic and diluted net loss per share: |
||||||||||||||||||||
| Prior to cumulative effect of change in accounting principle, net of tax |
$ | (0.88 | ) | $ | (1.16 | ) | $ | (1.41 | ) | $ | (0.97 | ) | $ | (0.88 | ) | |||||
| Cumulative effect of change in accounting principle, net of tax |
0.02 | — | — | — | — | |||||||||||||||
| Basic and diluted net loss per share |
$ | (0.86 | ) | $ | (1.16 | ) | $ | (1.41 | ) | $ | (0.97 | ) | $ | (0.88 | ) | |||||
| Weighted average number of shares |
26,627 | 28,626 | 29,084 | 38,098 | 56,713 | |||||||||||||||
| Diluted net income (loss) per share:(5) |
||||||||||||||||||||
| Prior to cumulative effect of change in accounting principle, net of tax |
$ | (0.88 | ) | $ | (1.16 | ) | $ | (1.41 | ) | $ | (0.97 | ) | $ | (0.88 | ) | |||||
| Cumulative effect of change in accounting principle, net of tax |
0.02 | — | — | — | — | |||||||||||||||
| Net income (loss) per share |
$ | (0.86 | ) | $ | (1.16 | ) | $ | (1.41 | ) | $ | (0.97 | ) | $ | (0.88 | ) | |||||
| Weighted average number of shares—basic and diluted |
26,627 | 28,626 | 29,084 | 38,098 | 56,713 | |||||||||||||||
32
Table of Contents
| (1) | Amounts include stock-based compensation as follows: |
| Fiscal Year Ended | ||||||||||||||||||||||||
| 2006 | 2007 | 2008 | 2009 | 2010 | ||||||||||||||||||||
| Cost of revenue |
$ | 267 | $ | 271 | $ | 305 | $ | 313 | $ | 106 | ||||||||||||||
| Research and development |
4,920 | 7,917 | 5,258 | 3,261 | 1,684 | |||||||||||||||||||
| Selling, general and administrative |
4,471 | 5,686 | 4,923 | 2,346 | 1,480 | |||||||||||||||||||
| (2) | The cumulative effect of the change in accounting principle arises from the adoption of authoritative guidance related to stock compensation. |
| (3) | Net loss for the fiscal years 2006, 2007, 2008, 2009 and 2010 included stock-based compensation expense of $9.7 million, $13.9 million, $10.5 million, $5.9 million and $3.3 million, respectively. In accordance with authoritative guidance related to stock compensation we used the modified prospective transition method. Therefore, prior periods do not reflect stock-based compensation expense related to this new accounting standard. See “Note 12. Equity Plans and Related Equity Activity” to the consolidated financial statements included in this report. |
| (4) | Net losses for the fiscal years 2006, 2008, and 2009 include acquired company results of operations beginning on the date of acquisition. See “Note 2. Business Combinations” to the consolidated financial statements included in this report for a summary of recent significant acquisitions. |
| (5) | The basic and diluted net loss computations exclude potential shares of common stock issuable upon the exercise of options and warrants to purchase common stock when their effect would be anti-dilutive. See “Note 1. Ikanos and Summary of Significant Accounting Policies” to the consolidated financial statements included in this report. |
| Fiscal Year Ended | ||||||||||||||||||||
| 2006 | 2007 | 2008 | 2009 | 2010 | ||||||||||||||||
| Consolidated Balance Sheet Data (in thousands): |
||||||||||||||||||||
| Cash, cash equivalents and short-term investments |
$ | 109,638 | $ | 83,972 | $ | 63,339 | $ | 27,540 | $ | 30,950 | ||||||||||
| Working capital |
108,685 | 89,047 | 72,015 | 56,049 | 50,541 | |||||||||||||||
| Total assets |
175,857 | 153,156 | 107,433 | 143,000 | 89,697 | |||||||||||||||
| Total stockholders’ equity |
142,890 | 124,933 | 89,516 | 97,116 | 65,521 | |||||||||||||||
33
Table of Contents
| ITEM 7. | MANAGEMENT’S DISCUSSION AND ANALYSIS OF FINANCIAL CONDITION AND RESULTS OF OPERATIONS |
The following discussion and analysis should be read in conjunction with the consolidated financial statements and related notes that are included elsewhere in this annual report on Form 10-K.
Overview
Ikanos Communications, Inc. (Ikanos) is a leading provider of advanced broadband semiconductor and software products for the digital home. Our broadband DSL, communications processors and other offerings power access infrastructure and customer premises equipment (CPE) for many of the world’s leading network equipment manufacturers and telecommunications service providers. Our products are at the core of digital subscriber line access multiplexers (DSLAMs), optical network terminals (ONTs), concentrators, modems, voice over Internet Protocol (VoIP) terminal adapters, integrated access devices (IADs) and residential gateways (RGs). Our products have been deployed by service providers in Asia, Europe and North America.
We believe that we can offer advanced products by continuing to push existing limits in silicon, systems and software. We have developed programmable, scalable chip architectures, which form the foundation for deploying and delivering multi-play services. Expertise in the creation and integration of digital signal processor (DSP) algorithms with advanced digital, analog and mixed signal semiconductors enables us to offer high performance, high-density and low-power asymmetric DSL (ADSL) and very-high-bit rate DSL (VDSL) products. In addition, flexible communications processor architectures with wirespeed packet processing capabilities enable high-performance end-user devices for distributing advanced services in the home. These products thus support service providers’ multi-play deployment plans to the digital home while keeping their capital and operating expenditures low.
We outsource all of our semiconductor fabrication, assembly and test functions, which allows us to focus on the design, development, sales and marketing of our products and reduces the level of our capital investment. Our direct customers consist primarily of original design manufacturers (ODMs), contract manufacturers (CMs), network equipment manufacturers (NEMs) and original equipment manufacturers (OEMs), who in turn sell our semiconductors as part of their product-solutions to the service provider market.
Since our inception, we have only been profitable in the third and fourth quarters of 2005. We incurred a net loss of $49.8 million for the year ended January 2, 2011and had an accumulated deficit of $270.6 million as of January 2, 2011. To achieve consistent profitability, we will need to generate and sustain higher revenue, while maintaining cost and expense levels appropriate and necessary for our business. While we believe that we have the cash necessary to fund our operations for the next twelve months, we may also seek additional financing as deemed appropriate to support future company needs and investments. We filed a shelf registration statement with the SEC on October 25, 2010 (declared effective on November 1, 2010) under which we might offer and sell up to $30.0 million of common stock and warrants. On November 11, 2010 and December 7, 2010 Ikanos sold a total of 12.8 million shares of stock in an underwritten offering for $13.5 million. After deducting underwriting fees, legal, accounting and other costs, we realized proceeds of $12.5 million.
We were incorporated in April 1999, and through December 31, 2001, we were engaged principally in research and development. We began commercial shipment of our products in the fourth quarter of 2002. Over the last three years, our revenue was $106.5 million in 2008, $130.7 million in 2009 and $191.7 million in 2010.
Quarterly revenue fluctuations are characteristic of our industry and affect our business, especially due to the concentration of our revenue among a few customers. These quarterly fluctuations can result from a mismatch of supply and demand. Specifically, service providers purchase equipment based on planned deployment. However, service providers may deploy equipment more slowly than initially planned, while OEMs continue for a time to manufacture equipment at rates higher than the rate at which equipment is deployed. As a result, periodically and usually without significant notice, service providers will reduce orders with OEMs for new equipment, and OEMs, in turn, will reduce orders for our products, which will adversely impact the quarterly demand for our products, even when deployment rates may be increasing.
Furthermore, our future revenue growth depends upon new service providers’ beginning to deploy new platforms with our products, among other factors. It is inherently difficult to predict if and when platforms will pass qualification, when service providers will begin to deploy the equipment and at what rate, because we do not control the qualification criteria or
34
Table of Contents
process, and the systems manufacturers and service providers do not always share all of the information available to them regarding qualification and deployment decisions. The team of engineers, DSL products, technology, patents and other intellectual property allow us to extend our market leadership as well as accelerate our digital home initiatives and next generation VDSL2 development.
On August 24, 2009, we acquired from Conexant Systems, Inc., its Broadband Access product line (BBA), which includes the backlog, customer relationships, product-related intellectual property, patents, fixed assets and inventory of the product line, for a total purchase price of $53.1 million in cash and the assumption of approximately $6.4 million in employee and lease related liabilities. Adding the BBA products and engineers to Ikanos’ existing portfolio of VDSL solutions has more than doubled our size, expanded our reach into new geographic and product markets and added new research and development capabilities to the existing engineering team. The addition of the BBA products is expected to allow us to develop semiconductor and software products for new markets within the digital home in addition to serving our Broadband DSL and Communications Processors businesses and to reduce costs through economies of scale.
On April 27, 2010, Michael Gulett resigned as our Chief Executive Officer and President and as a member of our Board of Directors. Diosdado P. Banatao, the chairman of our Board of Directors, was appointed executive chairman and assumed the role of interim President and Chief Executive Officer while we began our search for a new Chief Executive Officer and President. On June 14, 2010, Cory Sindelar resigned as Chief Financial Officer. Dennis Bencala was appointed Chief Financial Officer and Vice President of Finance in June 2010. On June 30, 2010, Paul Hansen resigned from our Board of Directors. James Smaha, a current director, replaced Mr. Hansen on the Audit Committee of our Board of Directors and Fred Lax, also a current director, was appointed chairman of the Audit Committee. On August 3, 2010, Mr. Banatao resigned as our interim President and Chief Executive Officer. Mr. Banatao will continue to serve as chairman of our Board of Directors. On August 3, 2010, our Board of Directors appointed John Quigley, our Senior Vice President, Global Engineering, as our Chief Executive Officer and President effective August 3, 2010 and also elected him to the Board of Directors. On January 7, 2011, R. Douglas Norby was appointed to our Board of Directors and Nominating and Governance Committee and also Chairman of our Audit Committee.
Critical Accounting Policies and Estimates
Our discussion and analysis of our financial condition and the results of operations are based on our consolidated financial statements that have been prepared in accordance with accounting principles generally accepted in the United States, or GAAP. In preparing our consolidated financial statements, we make assumptions, judgments and estimates that can have a significant impact on amounts reported in our consolidated financial statements. We base our assumptions, judgments and estimates on historical experience and various other factors that we believe to be reasonable under the circumstances. Actual results could differ materially from these estimates under different assumptions or conditions. On a regular basis, we evaluate our assumptions, judgments and estimates and make changes accordingly. We also discuss our critical accounting estimates with the Audit Committee of the Board of Directors. We believe that the assumptions, judgments and estimates involved in the accounting for revenue, cost of revenue, marketable securities, accounts receivable, inventories, warranty, income taxes, impairment of goodwill and related intangibles, acquisitions and stock-based compensation expense have the greatest potential impact on our consolidated financial statements, so we consider these to be our critical accounting policies. We discuss below the critical accounting estimates associated with these policies. Historically, our assumptions, judgments and estimates relative to our critical accounting policies have not differed materially from actual results.
Revenue Recognition
The performance of the Company’s semiconductor products is reliant upon firmware. Accordingly, revenue from the sale of semiconductors is recognized in accordance with the authoritative guidance regarding non-software deliverables in an arrangement containing more-than-incidental software. Revenue from sales of semiconductors is recognized upon shipment when persuasive evidence of an arrangement exists, the required firmware is delivered, legal title and risk of ownership has transferred, the price is fixed or determinable and collection of the resulting receivable is reasonably assured. In instances where semiconductors are shipped prior to the release of the related production level firmware, revenue is deferred as we have not established vendor-specific objective evidence of fair value for the undelivered firmware. Revenue related to these products is recognized when the firmware is delivered or otherwise made available to the customer.
35
Table of Contents
Revenue from sales of semiconductors is recognized upon shipment when persuasive evidence of an arrangement exists, legal title and risk of ownership has transferred, the price is fixed or determinable and collection of the resulting receivable is reasonably assured. In addition, we record reductions to revenue for estimated product returns and pricing adjustments, such as volume purchase incentives, in the same period that the related revenue is recorded. The amount of these reductions is based on historical sales returns, analysis of credit memo data, specific criteria included in volume purchase incentives agreements, and other factors known at the time. Additional reductions to revenue would result if actual product returns exceed our estimates or if we settle any claims brought by our customers that are in excess of our standard warranty terms for cash payments. Revenue from product sales to distributors is recognized when the distributor has sold through to the end customer.
Marketable Securities
We classify our marketable securities as available-for-sale at the time of purchase and re-evaluate such designation as of each consolidated balance sheet date. Our marketable securities include commercial paper, corporate bond and government securities and auction rate securities. Our marketable securities are reported at fair value with the related unrealized gains and losses included in accumulated other comprehensive loss, a component of stockholders’ equity. Realized gains or losses on the sale of marketable securities are determined using the specific-identification method. For all investments in debt and equity securities, unrealized losses are evaluated to determine if they are other than temporary. For investments in equity securities, unrealized losses that are considered to be other than temporary are considered impairment losses and recognized as a component of interest income and other, net, in the statements of operations. For investments in debt securities, if the fair value of a debt security is less than its amortized cost basis, we assess whether the impairment is other than temporary. An impairment is considered other than temporary if (i) we have the intent to sell the security, (ii) it is more likely than not that we will be required to sell the security before recovery of its entire amortized cost basis, or (iii) we do not expect to recover the entire amortized cost of the security. If an impairment is considered other than temporary based on conditions (i) and (ii), the entire difference between the amortized cost and the fair value of the security is recognized in earnings. If an impairment is considered other than temporary based on condition (iii), the amount representing credit losses, defined as the difference between the present value of the cash flows expected to be collected and the amortized cost basis of the debt security, will be recognized in earnings and the amount relating to all other factors will be recognized in other comprehensive income. We evaluate both qualitative and quantitative factors such as duration and severity of the unrealized loss, credit ratings, prepayment speeds, defaults and loss rates of the underlying collateral, structure and credit enhancements to determine if a credit loss may exist.
During 2008, upon determining that the decline in market value of our investment in auction rate securities was other-than-temporary, we wrote down the investments to their estimated realizable fair value of $1.0 million and recorded an investment impairment charge of $6.2 million. During 2009, auction rate securities with a face value of $2.2 million and a book value of $0.3 million were sold for $1.5 million. The gain of $1.2 million was included in Investment gain (impairment). There has been no further decline in the market value of our auction rate securities.
As of January 2, 2011, the Company found a market outside the auction process for its auction rate securities. The auction rate securities have a book value of $0.7 million and face value of $5.0 million. The Company reviewed the marketability of its auction rate securities and received a quoted price of $2.0 million. Accordingly, as of January 2, 2011 the Company classified the auction rate securities as short-term investments on the balance sheet and assigned a fair market value of $2.0 million. Previously the securities were recorded at their book value of $0.7 million in other assets. The Company recorded the $1.3 million difference between its book value of $0.7 million and the market value of $2.0 million as accumulated other comprehensive income on the Balance Sheet. On January 31, 2011 the auction rate securities were sold for $2.0 million. The Company will recognize $1.3 million as investment income in the first quarter of 2011.
Accounts Receivable Allowance
We perform ongoing credit evaluations of our customers and adjust credit limits, as determined by our review of current credit information. We continuously monitor collections and payments from our customers and maintain an allowance for doubtful accounts based upon our historical experience, our anticipation of uncollectible accounts receivable and any specific customer collection issues that we have identified. While our credit losses have historically been low and within our expectations, we may not continue to experience the same credit loss rates that we have in the past. Our receivables are concentrated in a relatively small number of customers. Therefore, a significant change in the liquidity, financial position or willingness to pay timely, or at all, of any one of our significant customers would have a significant impact on our results of operations and cash flows.
36
Table of Contents
Inventory
We value our inventory at the lower of cost or estimated market value. Cost is determined by the first-in, first-out method and market represents the estimated net realizable value. We estimate market value based on our current pricing, market conditions and specific customer information. We write down inventory for estimated obsolescence of unmarketable inventory and quantities on hand in excess of estimated near-term demand and market conditions. If actual shipments are less favorable than expected, additional charges may be required. Additionally, we specifically reduce inventory to the lower of cost or market if pricing trends or forecasts indicate that the carrying value of inventory exceeds its estimated selling price. Once inventory is written down, a new accounting basis is established, and it is not written back up in future periods.
Warranty
We provide for the estimated cost of product warranties at the time revenue is recognized based on our historical experience of similar products. While we engage in product quality programs and processes, including monitoring and evaluating the quality of our suppliers, our warranty accrual is affected by our contractual obligations, product failure rates, the estimated and actual cost incurred by us and our customers for replacing defective parts. Costs may include replacement parts, labor to rework and freight charges. We monitor product returns for warranty and maintain an accrual for the related warranty expenses. Should actual failure rates, cost of product replacement and inbound and outbound freight costs differ from our estimates, revisions to the estimated warranty reserve would be required.
Acquisitions
We allocate the purchase price of acquired companies to the tangible and intangible assets acquired, liabilities assumed, as well as purchased in-process research and development (IPR&D) based on the estimated fair values. We use various models to determine the fair values of the assets acquired and liabilities assumed. These models include the discounted cash flow (DCF), the royalty savings method and the cost savings approach. The valuation requires management to make significant estimates and assumptions, especially with respect to long-lived and intangible assets.
Critical estimates in valuing certain of the intangible assets include, but are not limited to, future expected cash flows from customer contracts, customer lists, distribution agreements and acquired developed technologies and patents; expected costs to develop the IPR&D into commercially viable products and estimating cash flows from the projects when completed; the acquired company’s brand awareness and market position as well as assumptions about the period of time the brand will continue to be used in the combined company’s product portfolio and discount rates. We derive our discount rates from our internal rate of return based on our internal forecasts and we may adjust the discount rate giving consideration to specific risk factors of each asset. Management’s estimates of fair value are based upon assumptions believed to be reasonable but which are inherently uncertain and unpredictable. Assumptions may be incomplete or inaccurate, and unanticipated events and circumstances may occur.
Accounting for Impairment of Goodwill
The process of evaluating the potential impairment of goodwill is highly subjective and requires significant management judgment to forecast future operating results, projected cash flows and current period market capitalization levels. In estimating the fair value of the business, we make estimates and judgments about the future cash flows. Although our cash flow forecasts are based on assumptions that are consistent with the plans and estimates we are using to manage our business, there is significant judgment in determining such future cash flows. We also consider market capitalization on the date we perform the analysis. During the quarter ended October 3, 2010, we experienced a significant decline in market capitalization. Based on this and other indicators of potential impairment, we completed an impairment analysis and recorded impairment charges of $21.4 million of which $8.6 million and $12.8 million related to goodwill and intangibles, respectively. During the fourth quarter of 2009, based on our annual impairment test, we concluded that there was no impairment of goodwill. Due to economic events that occurred during the third quarter of 2008, the Company performed an assessment for impairment and wrote down goodwill and intangibles by $7.4 million and $1.1 million, respectively.
37
Table of Contents
Accounting for Income Taxes
We record the estimated future tax effects of temporary differences between the tax basis of assets and liabilities and amounts reported in the balance sheets, as well as operating loss and tax credit carry forwards. We have recorded a full valuation allowance against our deferred tax asset. Based on our historical losses and other available objective evidence, we determined it is more likely than not that the deferred tax asset will not be realized. While we have considered potential future taxable income and ongoing prudent and feasible tax planning strategies in assessing the need for the full valuation allowance, in the event that we were to determine that we would be able to realize our deferred tax assets in the future, an adjustment to the deferred tax asset would increase net income in the period such determination was made. In addition, the calculation of our tax liabilities involves dealing with uncertainties in the application of complex tax regulations. In addition, in accordance with authoritative guidance, we recognize liabilities for uncertain tax positions based on the two-step process prescribed within the interpretation. The first step is to evaluate the tax position for recognition by determining if the weight of available evidence indicates that it is more likely than not that the position will be sustained on audit, including resolution of related appeals or litigation processes, if any. The second step is to measure the tax benefit as the largest amount that is more than 50% likely of being realized upon ultimate settlement.
Stock-Based Compensation Expense
We account for share-based compensation related to share-based transactions in accordance with authoritative guidance. Under the fair value recognition provisions, share-based payment expense is estimated at the grant date based on the fair value of the award and is recognized as expense ratably over the requisite service period of the award. Determining the appropriate fair value model and calculating the fair value of stock-based awards requires judgment, including estimating stock price volatility and expected life. We have estimated the expected volatility as an input into the Black-Scholes valuation formula when assessing the fair value of options granted. Our current estimate of volatility was based upon a blend of average historical volatilities of our stock price and that of our peer group. To the extent volatility of our stock price increases in the future, our estimates of the fair value of options granted in the future could increase, thereby increasing share-based payment expense in future periods. In addition, we apply an expected forfeiture rate when amortizing share-based payment expense. Our estimate of the forfeiture rate was based primarily upon historical experience of employee turnover. To the extent we revise this estimate in the future, our share-based payment expense could be materially impacted in the quarter of revision, as well as in following quarters. Our expected term of options granted was derived from the average midpoint between vesting and the contractual term. In the future, as empirical evidence regarding these input estimates is able to provide more directionally predictive results, we may change or refine our approach of deriving these input estimates. These changes could impact our fair value of options granted in the future.
The above items are not a comprehensive list of all of our accounting policies. In many cases, the accounting treatment of a particular transaction is specifically dictated by authoritative guidance with no need for our management’s judgment in its application. There are also areas in which our management’s judgment in selecting any available alternative would not produce a materially different result. See our consolidated financial statements and related notes thereto included elsewhere in this annual report on Form 10-K that contain accounting policies and other disclosures in accordance with authoritative guidance.
Results of Operations
Revenue
Our revenue is derived from sales of our semiconductor products. Revenue from product sales is generally recognized upon shipment, net of sales returns, rebates and allowances. Revenue from product sales to distributors is recognized when the distributor has sold through to the end customer. As is typical in our industry, the selling prices of our products generally decline over time. Therefore, our ability to increase revenue is dependent upon our ability to increase unit sales volumes of existing products and to introduce and sell new products in greater quantities. Our ability to increase unit sales volume is dependent primarily upon our ability to increase and fulfill current customer demand and obtain new customers. The continuing effects of the worldwide recession have adversely affected the businesses of service providers around the world, causing them to re-evaluate how they employ capital. Consequently the rate at which broadband infrastructure is upgraded may slow or new broadband programs could be delayed.
Revenue increased by $61.0 million, or 47%, to $191.7 million in 2010 from $130.7 million in 2009. The increase was directly attributable to revenue realized from the full year effect of our 2009 acquisition of the BBA product line which has enabled us to grow and diversify our revenue base across multiple regions, customers and product lines. Reflecting this,
38
Table of Contents
Asian and European revenue as a percent of total sales remained relatively constant, but increased substantially on a revenue dollar basis. Asian sales increased 53% from $75.6 million in 2009 to $115.4 million in 2010. Sales into greater China (including the Peoples Republic of China and Hong Kong) more than doubled in 2010 versus 2009. Sales to Japan were marginally lower in 2010 compared to 2009. Asian sales volume, especially to China, increased substantially while average Asian selling price, including the effects of changes in mix, increased slightly. European revenue increased by 62% from $43.9 million to $70.9 million as sales into France and the Netherlands were somewhat offset by lower sales into Italy and Belgium. Revenue declined from $55.6 million in the second quarter of 2010 to $41.5 million and $37.1 million in the third and fourth quarters of 2010 due both to sustained declines in our ADSL products and our moving away from lower margin business. We have no assurances that this decline will not continue into and through at least the first quarter of 2011.
Revenue increased by $24.2 million, or 23%, to $130.7 million in 2009 from $106.5 million in 2008. The increase was directly attributable to the BBA product line revenue of $36.1 million. The acquisition of the BBA product line has enabled us to grow and diversify our revenue base across multiple regions, customers and product lines. Asian sales improved by 21% from $62.3 million in 2008 to $75.6 million in 2009. While Korean revenue remained flat and Japanese revenue was off from 2008, revenue in greater China showed significant gains more than offsetting the Japanese decline. Sales to greater China were driven by ADSL shipments to China Telecom and China Unicom. European revenue improved by 24% and reached $43.9 million in 2009 versus $35.5 million in 2008. The significant increase in Europe was broad-based to the major European service providers. North American revenue improved 27% to $11.1 million in 2009 from $8.7 million in 2008, reflecting shipments to AT&T.
We generally sell our products to OEMs through a combination of our direct sales force, third-party sales representatives and distributors. Sales are generally made under short-term, non-cancelable purchase orders. We also have volume purchase agreements with certain customers who provide us with non-binding forecasts. Although certain OEM customers may provide us with rolling forecasts, our ability to predict future sales in any given period is limited and subject to change based on demand for our OEM customers’ systems and their supply chain decisions. Historically, a small number of OEM customers, the composition of which has varied over time, have accounted for a substantial portion of our revenue, and we expect that significant customer concentration will continue for the foreseeable future, but it may diversify across more carrier customers as we expect more service providers world-wide to begin deployments of our broadband solutions. The following direct customers accounted for more than 10% of our revenue for the years indicated. Sales made to OEMs are based on information that we receive at the time of ordering.
| Our Direct Customer |
OEM Customer |
2010 | 2009 | 2008 | ||||||||||||
| Alcatel-Lucent and its CMs |
Alcatel-Lucent | 18 | % | * | % | 11 | % | |||||||||
| Sagemcom |
Sagemcom | 16 | 19 | 21 | ||||||||||||
| Paltek Corporation |
Sumitomo Electric Industries | * | 12 | 23 | ||||||||||||
| NEC Corporation |
NEC Corporation | * | 11 | 25 | ||||||||||||
| * | Less than 10% |
39
Table of Contents
Revenue by Region as a Percentage of Total Revenue
| 2010 | 2009 | 2008 | ||||||||||
| China |
28 | % | 15 | % | 1 | % | ||||||
| Japan |
16 | 23 | 48 | |||||||||
| France |
24 | 21 | 24 | |||||||||
| United States |
2 | 8 | 8 | |||||||||
| Other |
30 | 33 | 19 | |||||||||
The table above reflects sales to our direct customers based on where they are headquartered. It does not necessarily reflect carrier deployment of our products as we do not sell directly to them. Comparing 2010 to 2009 as a percent of total revenue, our China revenue continued to increase as a result of our BBA product line acquisition in 2009. China revenue in dollars more than doubled. Japanese revenue decline as a percentage of total revenue while revenue in dollars was unchanged. French revenue remained relatively constant as a percent of revenue, but actually increase on a revenue dollar basis by 68%. North American revenue declined both in dollars and as a percent of total revenue. While there was some organic growth, the increases are generally reflective of the BBA acquisition.
Comparing 2009 to 2008 as a percent of total revenue, our revenue by country reflected somewhat the results of the BBA acquisition, particularly in China. The Japanese market declined by 41%.
Revenue by Product Family as a Percentage of Total Revenue
| 2010 | 2009 | 2008 | ||||||||||
| Broadband DSL |
60 | % | 66 | % | 84 | % | ||||||
| Communications Processors |
26 | 27 | 16 | |||||||||
| Other |
14 | 7 | — | |||||||||
We divide our products into the following markets: Broadband DSL, Communications Processors and Other. Broadband DSL consists of our central office products, DSL modem-only customer premise equipment products and the DSL value of our integrated devices. Communications Processors includes our stand alone processors and the processor-only value of our integrated devices. Other includes products that do not fall into the other two segments. Although the Broadband DSL product family declined as a percent of total revenue, the dollar revenue decline was minimal as demand remained relatively strong in all regions for our broadband ADSL and VDSL central office products. Our Communications Processor product family showed strong growth primarily due to new deployments in India for our Solos® brand of communications processors follow-on shipments or our latest Vx180 platform and an increase in Vx160 shipments for Europe’s Sagemcom and other OEMs. The Other category relates to miscellaneous technology that we acquired from our BBA acquisition including WiFi and Ethernet among other products.
Cost and Operating Expenses
| 2010 | 2009 | 2008 | 2010/2009 | 2009/2008 | ||||||||||||||||
| (In millions) | ||||||||||||||||||||
| Cost of revenue |
$ | 126.7 | $ | 85.0 | $ | 61.8 | 49 | % | 38 | % | ||||||||||
| Research and development |
60.8 | 49.8 | 43.2 | 22 | 15 | |||||||||||||||
| Sales, general and administrative |
27.2 | 31.0 | 25.8 | (12 | ) | 20 | ||||||||||||||
| Operating asset impairments |
21.4 | 2.5 | 12.5 | nm | nm | |||||||||||||||
| Restructuring charges |
5.8 | 1.3 | — | nm | nm | |||||||||||||||
nm—not meaningful
Operating Expenses as a Percent of Total Revenue:
| 2010 | 2009 | 2008 | ||||||||||
| Cost of revenue |
66 | % | 65 | % | 58 | % | ||||||
| Research and development |
32 | 38 | 41 | |||||||||
| Sales, general and administrative |
14 | 24 | 24 | |||||||||
Cost of revenue. Our cost of revenue consists primarily of cost of silicon wafers purchased from third-party foundries and third-party costs associated with assembling, testing and shipping of our semiconductors. Because we do not have formal, long-term pricing agreements with our outsourcing partners, our wafer costs and services are subject to price fluctuations
40
Table of Contents
based on the cyclical demand for semiconductors among other factors. In addition, after we purchase wafers from foundries, we also incur yield loss related to manufacturing these wafers into usable die. Manufacturing yield is the percentage of acceptable product resulting from the manufacturing process, as identified when the product is tested. When our manufacturing yields decrease, our cost per unit increases. This could have a significant adverse impact on our cost of revenue. Cost of revenue also includes accruals for actual and estimated warranty obligations and write-downs of excess and obsolete inventories, payroll and related personnel costs, licensed third-party intellectual property, depreciation of equipment and amortization of acquisition-related intangibles.
Cost of revenue increased $41.7 million, or 49%, to $126.7 million for 2010 from $85.0 million for 2009. The increase in cost of revenue is most directly attributable to our increased sales volume which is directly related to the full year effect of our acquisition of the BBA product line in the third quarter of 2009. The net write down of inventory during the year increased our cost of revenue by $16.8 million in 2010. In 2009 we recovered and sold $1.6 million of inventory previously written down in 2008. The amortization of the fair market value adjustment of inventory acquired in the BBA transaction was $1.5 million in 2010 versus $7.5 million in 2009. Our gross margin was 34% in 2010 compared to 35% in 2009.
Cost of revenue increased $23.2 million, or 38%, to $85.0 million for 2009 compared to $61.8 million for 2008. Our gross margin was 35% in 2009 compared to 42% in 2008. The decrease is gross margin is attributable to the incremental amortization of intangibles and the adjustment of the fair value of inventory acquired of $5.7 million related to the BBA acquisition and a greater portion of ADSL product revenue, which typically has a lower gross margin.
Research and development expenses. All research and development (R&D) expenses are expensed as incurred and generally consist of compensation and associated expenses of employees engaged in research and development; contractors; tape-out expenses; reference board development; development testing, evaluation kits and tools; stock based compensation; amortization of acquisition-related intangibles; and depreciation expense. Before releasing new products, we incur charges for mask sets, prototype wafers, mask set revisions, bring-up boards and other qualification materials, which we refer to as tape-out expenses. These tape-out expenses may cause our R&D expenses to fluctuate because they are not incurred uniformly every quarter.
During 2010, R&D expenses were $60.8 million, an increase of $11.0 million, or 22%, from $49.8 million in 2009. The increase in expenses is primarily due to payroll and related costs of $9.0 million, of which the majority relates to the BBA acquisition, and an increases manufacturing costs, supplies and backend outsourcing of $7.2 million. These increases were partially offset by declines in stock-based compensation of $1.6 million, depreciation of $0.8 million, lower outside service costs of $1.0 million and a 2010 credit of $1.3 million related to qualified research and development expenditures made by a subsidiary. Although R&D personnel declined from 2009 to 2010 due to reductions in force in the first and third quarters of 2010, payroll and related costs increased due to location mix related to the BBA acquisition.
During 2009, R&D expenses were $49.8 million, an increase of $6.6 million, or 15%, from $43.2 million in 2008. The increase in expenses is primarily due to payroll and related costs of $7.8 million, of which the majority relates to the BBA acquisition, and an increase in software licensing of $2.3 million. These increases were partially offset by declines in stock-based compensation of $2.0 million, depreciation of $1.1 million and the amortization of intangibles of $0.7 million.
Our R&D personnel are located primarily in the United States and India. As of January 3, 2010, we had 247 engineers engaged in R&D of which 85 were located in India, 156 were located in the United States. This compares to 412 at the end of 2009 and 194 at the end of 2008.
Selling, general and administrative expenses. Selling, general and administrative (SG&A) expenses generally consist of compensation and related expenses for personnel; public company expenses; legal, recruiting and auditing fees; and deprecation. For 2010, SG&A expenses were $27.2 million, an decrease of $3.8 million, or 12%, from $31.0 million in 2009. The decrease in SG&A is attributable to lower stock based compensation costs of $0.9 million, lower bonus costs of $1.8 million, lower amortization of intangibles of $1.4 million, and lower acquisition costs (business development, accounting and legal) incurred in 2009, but not in 2010 of $3.5 million. These reductions were primarily offset by higher severance costs of $1.2 million and higher facilities costs of $1.7 million.
For 2009, SG&A expenses were $31.0 million, an increase of $5.2 million, or 20%, from $25.8 million in 2008. SG&A expenses increased generally as a result of transaction related expenses associated with the BBA acquisition of $3.4 million, amortization of intangible assets of $1.6 million, salary and related personnel expenses of $1.6 million and facility related expenses of $1.1 million. These increases were partially offset by a decrease in stock based compensation of $2.6 million.
41
Table of Contents
As of January 2, 2011 SG&A headcount was 77, which compares to 127 at the end of 2009 and 89 at the end of 2008.
Asset impairments. In October 2010, we recorded impairment charges totaling $21.4 million of which $8.6 million related to goodwill, $12.8 million related to intangibles.
We test goodwill for impairment on an annual basis and between annual tests if an event occurs or circumstances change that would more likely than not reduce the fair value of the our single reporting unit below its carrying value. We issued financial guidance for the third quarter 2010 period and announced a Company-wide restructuring to better align our overhead structure with lower expected revenues and subsequently experienced a sustained decline during the quarter ended October 3, 2010 in market capitalization. Based on these indicators of potential impairment, we completed an impairment analysis of our goodwill as of October 3, 2010, the end of our third quarter.
We performed the first step of the two-step impairment test and compared the fair value of the Company as a single reporting unit to its carrying value. Consistent with the our approach in our annual impairment testing, in assessing the fair value of the reporting unit, we considered both the market approach and income approach. Under the market approach, the fair value of the reporting unit is based on quoted stock price on the NASDAQ, the number of shares outstanding for the our common stock and an estimated control premium. Under the income approach, the fair value of the reporting unit is based on the present value of estimated future cash flows. The income approach is dependent on a number of significant management assumptions including estimates of revenue and operating expenses, product penetration, growth and discount rates. Due to current market conditions and the number of significant assumptions required, we used the market approach. The market approach was lower, but both valuation approaches determined that the fair value was less than the carrying value of the net assets and, therefore, we performed step two of the impairment test.
In step two of the impairment test, we determined the implied fair value of the goodwill and compared it to the carrying value of the goodwill. We allocated the fair value of the reporting unit to all of its assets and liabilities as if the reporting unit had been acquired in a business combination and the fair value of the mainline reporting unit was the price paid to acquire the reporting unit. We determined the fair value of the single reporting unit using discounted cash flows. The weighted average cost of capital used in the impairment was 25.4% with perpetual growth rate of 3%. The excess of the fair value of the reporting unit over the amounts assigned to its assets and liabilities is the implied fair value of goodwill. Our step two analysis resulted in no implied fair value of goodwill, and therefore, we recognized an impairment charge of $8.6 million, representing a write off of the entire amount of the Company’s previously recorded goodwill (in thousands):
| Goodwill as of January 3, 2010 |
$ | 8,633 | ||
| Impairment |
(8,633 | ) | ||
| Goodwill as of October 3, 2010 |
$ | — | ||
In addition, as part of and in conjunction with the impairment test, we determined that the carrying values of certain intangible assets were less than their fair values. Accordingly, we recorded a non-cash intangible asset impairment charge of $12.8 million as of October 3, 2010. The fair value calculation that lead to the impairment of the existing technology and customer relationship intangibles of $10.3 million was determined using a discounted cash flow method. The weighted average cost of capital used in the impairment was 25.4% with no perpetual growth rate. We also impaired the remaining $2.5 million of IPR&D related to the gateway line of business under the Conexant BBA product line that was acquired in August 2009, since it was determined to have no alternative use and was therefore abandoned.
When we acquired the Conexant BBA product line in August 2009, we assigned a value of $4.9 million to in-process research and development. IPR&D was comprised mainly of two projects in process as of the acquisition date. The two projects were next generation VDSL solutions, one for the access line of business and the other for the gateway line. After reviewing the two projects, it was determined that further development of the access project was not necessary for product development, had no alternative use and was abandoned. Accordingly, in 2009 we recorded an asset impairment charge of $2.5 million.
42
Table of Contents
During the third quarter of 2008, as a result of our market capitalization being significantly lower than the carrying value of our net assets, we recorded a goodwill impairment charge of $7.4 million. Also during the third quarter of 2008, we recorded asset impairment charges related to prepaid license fees of $4.0 million and acquisition related intangible assets of $1.1 million. The prepaid license fees originated from a vendor that provided memory and input/output interfaces to facilitate the design of semiconductors at a particular third-party wafer foundry. Payments to this vendor were capitalized until a semiconductor mask set was created at this foundry. Based on our planned tape-out decisions for 2009 and the foreseeable future, we concluded that there was no future economic benefit to the intellectual property and impaired the related prepaid license fees. The impaired intangible assets related to trademarks and patents from our 2006 acquisition of the network processing and ADSL assets and the 2008 purchase of the DSL technology and assets. Based on our review of our business, we concluded that these intangible assets had no future economic benefit. The total combination of the asset impairments during the third quarter of 2008 totaled $12.5 million.
Restructuring charges. During the first quarter of 2010, we implemented a plan to restructure our work force and reduce our cost structure after our acquisition of the BBA product line. Subsequently, during the third quarter of 2010, we implemented a restructuring plan in order to better align our operating expenses with our revised revenue forecast and to reallocate sufficient engineering resources to the continued development of our broadband technology and products. In addition, we closed three overseas offices. In addition, we closed three overseas offices. Total restructuring costs for 2010 amounted to $5.8 million of which $4.7 million related to severance costs, $0.4 million to facilities and $0.7 million to software tools. As of January 2, 2011, we have substantially completed our restructuring activities and expect to pay out all remaining liabilities during 2011.
During 2009, we implemented restructuring plans to combine design centers in India and to reduce its expense structure in North America. We incurred restructuring charges of $1.3 million related to the termination of 67 employees. In addition, we relocated the remaining personnel and equipment from Hyderabad and Pune, India to Bangalore, India.
Investment Gain (Impairment)
In the fourth quarter of 2009, we sold auction rate securities with a face value of $2.2 million and a basis of $0.3 million for $1.5 million and recognized a gain of $1.2 million from the proceeds. We originally recorded an impairment charge related to our auction rate securities totaling $6.2 million in 2008 as we determined that the decrease in value was “other-than-temporary.” We considered a number of factors in making this determination, including the duration of the failed auctions, the worsening financial condition of the underlying issuers and the related insurance agencies and the general worsening of the global credit markets. The write-down of $6.2 million represented approximately 85% of the face value of the securities and was determined using a DCF model as described in Note 4 – Investments and Fair Value Measurements of our consolidated financial statements.
Interest Income and Other, Net
Interest income and other, net consists primarily of interest income earned on our cash, cash equivalents and investments, which are partially offset other non-operating expenses. Interest income and other, net was $0.1 million in 2010 as compared to $0.7 million in 2009 and $2.1 million in 2008. The decline in interest income over the three-year period reflects a decline in our cash and investment balances as well as lower interest rates.
Provision for Income Taxes
Income taxes are comprised mostly of foreign income taxes and state minimum taxes. During 2010 we recognized a net income tax benefit of $0.4 million due to changes in foreign deferred tax assets and liabilities. This compared to provisions for income taxes of $0.2 million in 2009 and $0.2 million in 2008, primarily relating to foreign income taxes.
Federal income taxes have not been provided for on a portion of the unremitted earnings of foreign subsidiaries because such earnings are intended to be permanently reinvested. The amount of unremitted earnings as of January 2, 2011 is approximately $7.0 million.
We are in the process of expanding our international operations and staff to better support our expansion into international markets. This expansion includes the implementation of an international structure that includes, among other things, certain licenses and other contractual arrangements between us and our wholly-owned foreign subsidiaries. Our foreign subsidiaries have acquired certain rights to sell the existing intellectual property and intellectual property that will be
43
Table of Contents
developed or licensed in the future. The existing rights were transferred for an initial payment. As a result of these changes and an expanding customer base in Asia, we expect that an increasing percentage of our consolidated pre-tax income will be derived from, and reinvested in, our Asian operations. We anticipate that this pre-tax income will be subject to foreign tax at relatively lower tax rates when compared to the United States federal statutory tax rate and as a consequence, our effective income tax rate is expected to be lower than the United States federal statutory rate.
During 2009, we experienced a change in ownership within the meaning of Internal Revenue Code Section 382. As a result, all unutilized net operating loss carryforwards from prior years expired.
Net Loss
As a result of the above factors, we reported a net loss of $49.8 million in 2010 compared to net losses of $37.1 million in 2009 and $41.1 million in 2008. We have incurred net losses throughout most of our history. Over the past several years, we have taken actions to reduce our operating expense structure such as consolidating locations, reducing capital expenditures, outsourcing our back-end physical design, reducing the number of development projects and reducing overall headcount. In addition, we are taking steps to reduce unit manufacturing costs by working to achieve better wafer pricing based on larger volume of purchases, consolidating business with vendors and reducing other input costs. Over the long term it is our expectation that these steps will result in operating income, excluding stock-based compensation and amortization of intangibles.
Liquidity and Capital Resources
Cash and investments increased by $2.7 million to $30.9 million as of January 2, 2011 compared to $28.2 million as of January 3, 2010. We have funded our operations primarily through cash from private and public offerings of our common stock, cash generated from the sale of our products and proceeds from the exercise of stock options and stock purchased under our employee stock purchase plan. Our uses of cash include payroll and payroll-related expenses, manufacturing costs, purchases of equipment, tools and software and operating expenses, such as tape outs, marketing programs, travel, professional services and facilities and other costs. We believe there will be additional working capital requirements needed to fund and operate our business. In the near future we expect to finance our operations primarily through existing cash and investment balances. If we should need additional funds, we believe that we will secure such funds either through our line of credit or by issuing additional equity.
The following table summarizes our statement of cash flows (in millions):
| 2010 | 2009 | 2008 | ||||||||||
| Statements of Cash Flows Data: |
||||||||||||
| Cash and cash equivalents—beginning of year |
$ | 13.3 | $ | 27.2 | $ | 65.1 | ||||||
| Net cash used in operating activities |
(7.9 | ) | (21.0 | ) | (3.0 | ) | ||||||
| Net cash provided (used) by investing activities |
9.8 | (32.2 | ) | (30.6 | ) | |||||||
| Net cash provided (used) by financing activities |
13.7 | 39.3 | (4.3 | ) | ||||||||
| Cash and cash equivalents—end of year |
$ | 28.9 | $ | 13.3 | $ | 27.2 | ||||||
Operating Activities
During 2010, we used $7.9 million in net cash from operating activities while incurring a loss of $49.8 million. Included in the net loss were non-cash charges amounting to $35.7 million that resulted from amortization of intangibles and acquired technology of $6.5 million, stock-based compensation of $3.3 million, depreciation and amortization of $4.2 million and asset impairments of $21.4 million, and loss on property and equipment included in restructuring of $0.4 million. Cash flow from reductions in accounts receivable of $10.8 million and inventory of $18.0 million were partially offset by a reductions in accounts payable and accrued liabilities of $22.6 million. The decrease in inventory includes a net write-down of $16.8 million, the majority of which was purchased in 2010. The decrease in accounts receivable and inventory reflect a reduction in 2010 fourth quarter sales to $37.1 million versus $58.2 million in the comparable 2009 period.
During 2009, we used $21.0 million in net cash from operating activities while incurring a loss of $37.1 million. Included in the net loss were non-cash charges amounting to $21.7 million that resulted from amortization of intangibles and acquired technology of $8.2 million, stock-based compensation of $5.9 million, depreciation and amortization of $5.1 million
44
Table of Contents
and asset impairments of $2.5 million. These charges were partially offset by a $1.2 million gain on the sale of auction rate securities. Increases in accounts receivable of $22.6 million and inventory of $2.0 million were nearly offset by an increase in accounts payable and accrued liabilities of $21.2 million. The increases in accounts receivable, accounts payable and accrued liabilities were directly related to the increased working capital requirements associated with more than doubling our business as a result of the BBA acquisition.
During 2008, we used $3.0 million in net cash from operating activities while incurring a loss of $41.1 million. Included in the net loss were non-cash charges amounting to $42.3 million that resulted from asset impairments of $12.5 million, stock-based compensation of $10.5 million, depreciation and amortization of $6.7 million, amortization of intangibles and acquired technology of $6.2 million and an investment impairment of $6.1 million. Reductions in accounts receivable of $4.7 million and inventory of $3.4 million were not enough to offset the decrease in accounts payable and accrued liabilities of $12.4 million. The reductions in inventory, accounts receivable and accounts payable and accrued liabilities were directly related to decline in business activity beginning in the third quarter and continuing through the fourth quarter of 2008. Fourth quarter revenue in 2008 was $22.8 million compared to $29.9 million in the comparable 2007 period.
Investing Activities
In 2010 net investing activities provided $9.8 million primarily the result of sales and maturities of investments of $14.1 million offset by fixed asset purchases of $4.3 million. We used net cash of $32.2 million in investing activities in 2009 primarily as a result of our purchase of Conexant’s BBA product line for $53.1 million, which was partially offset by the net sales and maturities of our investments of $23.3 million. During the year, we also had capital expenditures of $1.1 million. We used net cash of $30.6 million in investing activities in 2008 primarily from the net purchases of short-term investments of $17.1 million, our acquisition of Centillium Communications, Inc.’s DSL technology and assets for $11.9 million and capital expenditures of $1.6 million.
We have classified our investment portfolio as “available for sale,” and our investment objectives are to preserve principal and provide liquidity, while maximizing yields without significantly increasing risk. We may sell an investment at any time if the quality rating of the investment declines; the yield on the investment is no longer attractive or we are in need of cash. We have used cash to acquire businesses and technologies that enhance and expand our product offering, and we anticipate that we will continue to do so in the future. The nature of these transactions makes it difficult to predict the amount and timing of such cash requirements. We also anticipate that we will continue to purchase necessary property and equipment in the normal course of our business. The amount and timing of these purchases and the related cash outflows in future periods depend on a number of factors, including the hiring of employees, the rate of change of computer hardware and software used in our business and our business outlook.
Financing Activities
On October 25, 2010, we filed with the SEC a shelf registration statement on Form S-3 which was declared effective on November 1, 2010. Under this registration statement the Company may offer and sell from time to time in one or more public offerings up to $30.0 million of common stock and warrants or any combination thereof. In November and December 2010, we sold a total of 12.8 million shares of our common stock resulting in net proceeds of $12.5 million after deducting underwriting discount and offering expenses of $1.0 million. We also received $0.3 million from the issuance of common stock on the exercise of stock options and $0.9 million from the issuance of common stock under our employee stock purchase plan.
Additionally, on February 11, 2011, we completed a loan and security agreement which provides for a $15.0 million senior secured revolving credit facility under which we may borrow or have the bank issue letters of credit up to 80% of eligible accounts receivable at any time until February 11, 2013. Loans made under the Agreement will bear interest either at the bank prime plus 150 basis points or LIBOR plus 350 basis points, subject to certain adjustments. We have paid a non-refundable commitment fee of $0.1 million and have agreed to pay a fee in an amount equal to 0.5% per year of the average unused portion of the line of credit. Our obligations under the Loan Agreement will be secured by a lien on substantially all the Company’s tangible and intangible assets, subject to certain exceptions.
In connection with our acquisition of the BBA product line, we raised $39.3 million in acquisition financing from the Tallwood Investors. Specifically, on August 24, 2009, we sold 24.0 million shares of our common stock and 7.8 million warrants to purchase our common stock in the future at a share price of $1.75 to Tallwood Investors for $42.0 million. After reimbursing Tallwood for certain banking, accounting and legal fees amounting of $3.2 million, we received $38.8 million.
45
Table of Contents
In 2008, we used $4.3 million in financing activities to repurchase 1.6 million shares of our common stock for $5.2 million. We have retired 1.0 million shares of that stock and are holding 0.6 million shares as treasury stock. This use of cash was partially offset by $0.9 million received from employees exercising stock options. We have used, and continue to intend to use, the net proceeds for working capital and general corporate purposes, which may include the acquisition of businesses, products, product rights or technologies, strategic investments or purchases of common stock.
We believe that our existing cash, cash equivalents and short-term investments will be sufficient to meet our anticipated cash needs for at least the next twelve months. Our future capital requirements will depend on many factors including our rate of revenue growth, our ability to develop future revenue streams, the timing and extent of spending to support development efforts, the expansion of sales and marketing activities, the timing of introductions of new products and enhancements to existing products, the costs to ensure access to adequate manufacturing capacity and the continuing market acceptance of our products. Additionally in the future, we may become party to agreements with respect to potential investments in, or acquisitions of, complementary businesses, products or technologies, which could also require us to seek additional equity or debt financing. The sale of additional equity securities or convertible debt securities would result in additional dilution to our stockholders. Additional debt would result in increased interest expenses and could result in covenants that would restrict our operations. We have not made arrangements to obtain additional financing, and there is no assurance that such financing, if required, will be available in amounts or on terms acceptable to us, if at all.
Contractual Commitments and Off Balance Sheet Arrangements
We do not use off balance sheet arrangements with unconsolidated entities or related parties, nor do we use other forms of off balance sheet arrangements such as special purpose entities and research and development arrangements. Accordingly, our liquidity and capital resources are not subject to off balance sheet risks from unconsolidated entities.
We lease certain office facilities, equipment and software under non-cancelable operating leases. The lease on our Red Bank, N.J. facility expires on July 31, 2011. The lease will either be renewed or replaced with another location. The following table summarizes our contractual obligations as of January 2, 2011 and the effect those obligations are expected to have on our liquidity and cash flow in future periods (in millions):
| Total | 2011 | 2012 and 2013 |
2014 and 2015 |
|||||||||||||
| Operating lease payments |
$ | 6.8 | $ | 2.7 | $ | 2.5 | $ | 1.6 | ||||||||
| CAD software tools |
4.0 | 2.6 | 1.4 | — | ||||||||||||
| Technology license agreement |
1.0 | 1.0 | — | — | ||||||||||||
| Inventory purchase obligations |
2.8 | 2.8 | — | — | ||||||||||||
| $ | 14.6 | $ | 9.1 | $ | 3.9 | $ | 1.6 | |||||||||
For the purpose of this table, purchase obligations for the purchase of goods or services are defined as agreements that are enforceable and legally binding and that specify all significant terms, including: fixed or minimum quantities to be purchased; fixed, minimum or variable price provisions; and the approximate timing of the transaction. Our purchase orders are based on our current manufacturing needs and are fulfilled by our vendors within short time horizons. In addition, we have purchase orders that represent authorizations to purchase rather than binding agreements. We do not have significant agreements for the purchase of raw materials or other goods specifying minimum quantities or set prices that exceed our expected requirements.
In the normal course of business, we provide indemnifications of varying scope to customers against claims of intellectual property infringement made by third parties arising from the use of our products. Historically, costs related to these indemnification provisions have not been significant, and we are unable to estimate the maximum potential impact of these indemnification provisions on our future consolidated results of operations.
Recent Accounting Pronouncements
In September 2006, the Financial Accounting Standards Board (FASB) issued guidance related to fair value measurement that defines fair value, provides a framework for measuring fair value and expands the disclosures required for fair value measurements. We were required to apply this guidance beginning in 2008. In February 2008, the FASB delayed
46
Table of Contents
the effect of this guidance for all non-financial liabilities, except those that are recognized or disclosed at fair value in the financial statements on a recurring basis (at least annually) to fiscal years beginning after November 15, 2008. The adoption of this guidance for financial assets and liabilities did not have a material impact on our consolidated financial position, results of operations or cash flows.
In December 2007, the FASB issued guidance on Business Combinations, which establishes principles and requirements for how an acquirer recognizes and measures in its financial statements the identifiable assets acquired, the liabilities assumed, and any non-controlling interest in the acquiree in a business combination. This guidance also establishes principles around how goodwill acquired in a business combination or a gain from a bargain purchase should be recognized and measured, as well as provides guidelines on the disclosure requirements on the nature and financial impact of the business combination. The guidance applies prospectively to business combinations for which the acquisition date is on or after the beginning of the first annual reporting period beginning on or after December 15, 2008. The adoption of these standards did not have a material effect on our consolidated statements of financial position, operations or cash flows.
In December 2007, the FASB issued guidance related to noncontrolling interests in consolidated financial statements. This statement amends Accounting Research Bulletin 51 and establishes accounting and reporting standards for the noncontrolling interest in a subsidiary and for the deconsolidation of a subsidiary. It clarifies that a noncontrolling interest in a subsidiary is an ownership interest in the consolidated entity that should be reported as equity in the consolidated financial statements. It requires consolidated net income to be reported at amounts that include the amounts attributable to both the parent and the noncontrolling interest. This guidance establishes a single method of accounting for changes in a parent’s ownership interest in a subsidiary that do not result in deconsolidation. The guidance, which was effective for us beginning in 2009, did not have a material effect on our consolidated statements of financial position, operations or cash flows.
In April 2008, the FASB issued a staff position related to the determination of the useful life of intangible assets and amended the factors that should be considered in developing renewal or extension assumptions used to determine the useful life of a recognized intangible asset. This FASB staff position is effective for intangible assets acquired on or after July 1, 2009. The adoption of this guidance did not have a material effect on our consolidated statements of financial position, operations or cash flows.
In April 2009, the FASB provided guidelines for making fair value measurements more consistent with the principles already in effect. The guidance relates to determining fair values when there is no active market or where the price inputs being used represent distressed sales. It reaffirms that the objective of fair value measurement is to reflect how much an asset would be sold for in an orderly transaction (as opposed to a distressed or forced transaction) at the date of the financial statements under current market conditions. Specifically, it reaffirms the need to use judgment to ascertain if a formerly active market has become inactive and in determining fair values when markets have become inactive. The authoritative guidance, effective beginning with our interim reporting period ended on June 28, 2009, had no impact on our consolidated financial position, results of operations or cash flows.
In April 2009, the FASB issued authoritative guidance to enhance consistency in financial reporting by increasing the frequency of fair value disclosures. The authoritative guidance relates to fair value disclosures for any financial instruments that are not currently reflected in a company’s balance sheet at fair value. Prior to this guidance, fair values for these assets and liabilities have only been disclosed once a year. The authoritative guidance requires these disclosures on a quarterly basis, thereby providing qualitative and quantitative information about fair value estimates for all those financial instruments not measured on the balance sheet at fair value. The disclosure requirement was effective for our interim reporting period ended on June 28, 2009. The implementation of this guidance had no impact on our consolidated financial position, results of operations or cash flows.
In April 2009, the FASB provided additional guidance designed to create greater clarity and consistency in accounting and presenting impairment losses on securities. The guidance brought greater consistency to the timing of impairment recognition, and provided greater clarity to investors about the credit and noncredit components of impaired debt securities that are not expected to be sold. The measure of impairment in comprehensive income remains fair value. This authoritative guidance also requires increased and more timely disclosures regarding expected cash flows, credit losses and an aging of securities with unrealized losses. The guidance was effective beginning with our interim reporting period ended on June 28, 2009. The implementation had no impact on our consolidated financial position, results of operations or cash flows.
47
Table of Contents
In June 2009, the FASB issued The FASB Accounting Standards Codification and the Hierarchy of Generally Accepted Accounting Principles, a replacement of prior guidance. The FASB ASC became the source of authoritative U.S. GAAP recognized by the FASB to be applied by nongovernmental entities. Rules and interpretive releases of the SEC under authority of federal securities laws are also sources of authoritative GAAP for SEC registrants. On the effective date of this statement, the codification superseded all then-existing non-SEC accounting and reporting standards. All other non-grandfathered non-SEC accounting literature not included in the codification became non-authoritative. This guidance became effective for our financial statements issued for interim periods ended September 27, 2009. The adoption of the codification did not have a material effect on our consolidated results of operations or financial condition.
In September 2009, the FASB issued authoritative guidance related to revenue recognition for certain revenue arrangements that include software elements. Previously, companies that sold tangible products with “more than incidental” software were required to apply software revenue recognition guidance. This guidance often delayed revenue recognition for the delivery of the tangible product. Under the new guidance, tangible products that have software components that are “essential to the functionality” of the tangible product will be excluded from the software revenue recognition guidance. The new guidance is to be applied on a prospective basis for revenue arrangements entered into or materially modified in fiscal years beginning on or after June 15, 2010, with earlier application permitted. The authoritative guidance is not expected to have an effect on our consolidated financial position, results of operations or cash flows.
In January 2010, the FASB issued updated guidance related to fair value measurements and disclosures, which requires a reporting entity to disclose separately the amounts of significant transfers in and out of Level 1 and Level 2 fair value measurements and to describe the reasons for the transfers. In addition, in the reconciliation for fair value measurements using significant unobservable inputs, or Level 3, a reporting entity should disclose separately information about purchases, sales, issuances and settlements (that is, on a gross basis rather than one net number). The updated guidance also requires that an entity should provide fair value measurement disclosures for each class of assets and liabilities and disclosures about the valuation techniques and inputs used to measure fair value for both recurring and non-recurring fair value measurements for Level 2 and Level 3 fair value measurements. The updated guidance is effective for interim or annual financial reporting periods beginning after December 15, 2009, except for the disclosures about purchases, sales, issuances and settlements in the roll forward activity in Level 3 fair value measurements, which are effective for fiscal years beginning after December 15, 2010 and for interim periods within those fiscal years. We do not expect adoption of the updated guidance to have a material impact on our consolidated financial position, results of operations or cash flows.
| ITEM 7A. | QUANTITATIVE AND QUALITATIVE DISCLOSURES ABOUT MARKET RISK |
Interest Rate Risk
Our exposure to market risk for changes in interest rates relates primarily to our investment portfolio. We do not use derivative financial instruments in our investment portfolio. The primary objective of our investment activities is to preserve principal and meet liquidity needs, while maximizing yields and without significantly increasing risk. Our investment policy specifies credit quality standards for our investments and limits the amount of credit exposure to any single issue, issuer or type of investment. As of January 2, 2011 our investments consist of auction rate securities and are carried at market value.
As of January 2, 2011, we had cash, cash equivalents and short-term investments totaling $30.9 million. These amounts were invested primarily in money market funds and short-term investments that are held for working capital purposes. We do not enter into investments for trading or speculative purposes. If the return on our cash equivalents and investments were to change by one hundred basis points, the effect would be de minimis.
Investment Risk
Our marketable securities portfolio as of January 2, 2011 was $2.0 million consisting entirely of auction rate securities. The auction rate securities, which have a book value of $0.7 million and face value of $5.0 million, have failed at auction for over a year. We received a quoted price of $2.0 million for our auction rate securities. Accordingly, as of January 2, 2011 we reclassified the securities from other assets to short-term investments on the balance sheet with a fair market value of $2.0 million. We recorded the $1.3 million difference between our book value of $0.7 million and the market value of $2.0 million as accumulated other comprehensive income on the Balance Sheet. On January 31, 2011 the auction rate securities were sold for $2.0 million. The income of $1.3 million will be recognized in the first quarter of 2011.
48
Table of Contents
Foreign Currency Risk
Our revenue and cost of revenue are predominately denominated in U.S. dollars. An increase of the U.S. dollar relative to the currencies of the countries in which our customers operate would make our products more expensive to them and increase pricing pressure or reduce demand for our products. We also incur a portion of our expenses in currencies other than the U.S. dollar, including the Euro, the Japanese yen, Korean won, Indian rupee, Singapore dollar, the Chinese Yuan and the Taiwanese dollar. We do not currently enter into forward exchange contracts to hedge exposure denominated in foreign currencies or any other derivative financial instruments for trading or speculative purposes. We expect that our foreign currency exposure will increase as our operations in India and other countries expand. If exchange rates were to change by ten percent, the effect would be to increase/decrease income by approximately $1.0 million.
49
Table of Contents
| ITEM 8. | FINANCIAL STATEMENTS AND SUPPLEMENTARY DATA |
IKANOS COMMUNICATIONS, INC.
| Page No. | ||||
| Consolidated Financial Statements for the Years Ended January 2, 2011, January 3, 2010 and December 28, 2008 |
||||
| 51 | ||||
| 52 | ||||
| 53 | ||||
| Consolidated Statements of Stockholders’ Equity and Comprehensive Loss |
54 | |||
| 55 | ||||
| 56 | ||||
50
Table of Contents
Report of Independent Registered Public Accounting Firm
To the Board of Directors and Stockholders of Ikanos Communications, Inc.:
In our opinion, the accompanying consolidated balance sheets and the related consolidated statements of operations, stockholders’ equity, comprehensive loss and cash flows present fairly, in all material respects, the financial position of Ikanos Communications, Inc. and its subsidiaries at January 2, 2011 and January 3, 2010, and the results of their operations and their cash flows for each of the three years in the period ended January 2, 2011 in conformity with accounting principles generally accepted in the United States of America. Also in our opinion, the Company maintained, in all material respects, effective internal control over financial reporting as of January 2, 2011, based on criteria established in Internal Control—Integrated Framework issued by the Committee of Sponsoring Organizations of the Treadway Commission (COSO). The Company’s management is responsible for these financial statements, for maintaining effective internal control over financial reporting and for its assessment of the effectiveness of internal control over financial reporting, included in Management’s Report on Internal Control over Financial Reporting appearing under Item 9A. Our responsibility is to express opinions on these financial statements and on the Company’s internal control over financial reporting based on our integrated audits. We conducted our audits in accordance with the standards of the Public Company Accounting Oversight Board (United States). Those standards require that we plan and perform the audits to obtain reasonable assurance about whether the financial statements are free of material misstatement and whether effective internal control over financial reporting was maintained in all material respects. Our audits of the financial statements included examining, on a test basis, evidence supporting the amounts and disclosures in the financial statements, assessing the accounting principles used and significant estimates made by management, and evaluating the overall financial statement presentation. Our audit of internal control over financial reporting included obtaining an understanding of internal control over financial reporting, assessing the risk that a material weakness exists, and testing and evaluating the design and operating effectiveness of internal control based on the assessed risk. Our audits also included performing such other procedures as we considered necessary in the circumstances. We believe that our audits provide a reasonable basis for our opinions.
A company’s internal control over financial reporting is a process designed to provide reasonable assurance regarding the reliability of financial reporting and the preparation of financial statements for external purposes in accordance with generally accepted accounting principles. A company’s internal control over financial reporting includes those policies and procedures that (i) pertain to the maintenance of records that, in reasonable detail, accurately and fairly reflect the transactions and dispositions of the assets of the company; (ii) provide reasonable assurance that transactions are recorded as necessary to permit preparation of financial statements in accordance with generally accepted accounting principles, and that receipts and expenditures of the company are being made only in accordance with authorizations of management and directors of the company; and (iii) provide reasonable assurance regarding prevention or timely detection of unauthorized acquisition, use, or disposition of the company’s assets that could have a material effect on the financial statements.
Because of its inherent limitations, internal control over financial reporting may not prevent or detect misstatements. Also, projections of any evaluation of effectiveness to future periods are subject to the risk that controls may become inadequate because of changes in conditions, or that the degree of compliance with the policies or procedures may deteriorate.
| /s/ PricewaterhouseCoopers LLP |
| San Jose, California |
| March 10, 2011 |
51
Table of Contents
CONSOLIDATED BALANCE SHEETS
(In thousands, except per share data)
| January 2, 2011 |
January 3, 2010 |
|||||||
| Assets | ||||||||
| Current assets: |
||||||||
| Cash and cash equivalents |
$ | 28,950 | $ | 13,317 | ||||
| Short-term investments |
2,000 | 14,223 | ||||||
| Accounts receivable, net of allowances of $72 and $10, respectively |
24,147 | 34,995 | ||||||
| Inventory |
17,046 | 35,050 | ||||||
| Prepaid expenses and other current assets |
2,096 | 2,155 | ||||||
| Total current assets |
74,239 | 99,740 | ||||||
| Property and equipment, net |
8,214 | 7,502 | ||||||
| Intangible assets, net |
6,102 | 25,359 | ||||||
| Goodwill |
— | 8,633 | ||||||
| Other assets |
1,142 | 1,766 | ||||||
| $ | 89,697 | $ | 143,000 | |||||
| Liabilities and Stockholders’ Equity | ||||||||
| Current liabilities: |
||||||||
| Accounts payable |
$ | 10,401 | $ | 26,641 | ||||
| Accrued liabilities |
13,297 | 17,050 | ||||||
| Total current liabilities |
23,698 | 43,691 | ||||||
| Long-term liabilities |
478 | 2,193 | ||||||
| Total liabilities |
24,176 | 45,884 | ||||||
| Commitments and contingencies (Note 14) |
||||||||
| Stockholders’ equity: |
||||||||
| Preferred stock; $0.001 par value; 1,000 and 1,000 shares authorized, respectively; 0.001 and 0.001 share issued and outstanding, respectively |
— | — | ||||||
| Common stock: $0.001 par value; 99,000 and 50,000 shares authorized, respectively; 68,835 and 54,575 issued, respectively, and 68,111 and 54,002 outstanding, respectively |
68 | 54 | ||||||
| Additional paid-in capital |
327,208 | 310,265 | ||||||
| Warrants |
7,567 | 7,567 | ||||||
| Accumulated other comprehensive income |
1,295 | 84 | ||||||
| Accumulated deficit |
(270,617 | ) | (220,854 | ) | ||||
| Total stockholders’ equity |
65,521 | 97,116 | ||||||
| $ | 89,697 | $ | 143,000 | |||||
The accompanying notes are an integral part of these consolidated financial statements.
52
Table of Contents
CONSOLIDATED STATEMENTS OF OPERATIONS
(In thousands, except per share data)
| Year Ended | ||||||||||||
| January 2, 2011 |
January 3, 2010 |
December 28, 2008 |
||||||||||
| Revenue |
$ | 191,677 | $ | 130,688 | $ | 106,505 | ||||||
| Cost of revenue(1) |
126,692 | 85,019 | 61,827 | |||||||||
| Gross profit |
64,985 | 45,669 | 44,678 | |||||||||
| Operating expenses: |
||||||||||||
| Research and development(2) |
60,769 | 49,805 | 43,231 | |||||||||
| Selling, general and administrative(3) |
27,239 | 30,974 | 25,823 | |||||||||
| Operating asset and goodwill impairments |
21,378 | 2,460 | 12,496 | |||||||||
| Restructuring charges(4) |
5,794 | 1,338 | — | |||||||||
| Total operating expenses |
115,180 | 84,577 | 81,550 | |||||||||
| Loss from operations |
(50,195 | ) | (38,908 | ) | (36,872 | ) | ||||||
| Investment gain (impairment) |
— | 1,238 | (6,166 | ) | ||||||||
| Interest income and other, net |
51 | 727 | 2,145 | |||||||||
| Loss before provision for income taxes |
(50,144 | ) | (36,943 | ) | (40,893 | ) | ||||||
| Provision for (benefit from) income taxes |
(381 | ) | 158 | 220 | ||||||||
| Net loss |
$ | (49,763 | ) | $ | (37,101 | ) | $ | (41,113 | ) | |||
| Basic and diluted net loss per share |
$ | (0.88 | ) | $ | (0.97 | ) | $ | (1.41 | ) | |||
| Weighted average number of shares (basic and diluted) |
56,713 | 38,098 | 29,084 | |||||||||
|
Includes stock-based compensation expense as follows:
|
||||||||||||
| (1) Cost of revenue |
$ | 106 | $ | 313 | $ | 305 | ||||||
| (2) Research and development |
1,684 | 3,261 | 5,258 | |||||||||
| (3) Selling, general and administrative |
1,480 | 2,346 | 4,923 | |||||||||
| (4) Restructuring charges |
111 | — | — | |||||||||
The accompanying notes are an integral part of these consolidated financial statements.
53
Table of Contents
CONSOLIDATED STATEMENTS OF STOCKHOLDERS’ EQUITY AND COMPREHENSIVE LOSS
(In thousands)
| Common Stock | Additional Paid in Capital |
Warrants | Accumulated Other Comprehensive Gain (Loss) |
Accumulated Deficit |
Total Stockholders’ Equity |
Comprehensive Income (Loss) |
||||||||||||||||||||||||||
| Shares | Amount | |||||||||||||||||||||||||||||||
| Balance at December 30, 2007 |
29,412 | $ | 29 | $ | 267,662 | $ | — | $ | (118 | ) | $ | (142,640 | ) | $ | 124,933 | |||||||||||||||||
| Net loss |
— | — | — | — | — | (41,113 | ) | (41,113 | ) | $ | (41,113 | ) | ||||||||||||||||||||
| Unrealized gain on marketable securities |
— | — | — | — | 410 | — | 410 | 410 | ||||||||||||||||||||||||
| Comprehensive loss |
$ | (40,703 | ) | |||||||||||||||||||||||||||||
| Stock-based compensation |
— | — | 10,486 | — | — | — | 10,486 | |||||||||||||||||||||||||
| Net issuance of common stock under stock option plans |
1,182 | 1 | 4 | — | — | — | 5 | |||||||||||||||||||||||||
| Repurchase of common stock & held in treasury |
(573 | ) | — | (2,055 | ) | — | — | — | (2,055 | ) | ||||||||||||||||||||||
| Repurchase of common stock & retired |
(1,000 | ) | (1 | ) | (3,149 | ) | — | — | — | (3,150 | ) | |||||||||||||||||||||
| Balance at December 28, 2008 |
29,021 | 29 | 272,948 | — | 292 | (183,753 | ) | 89,516 | ||||||||||||||||||||||||
| Net loss |
— | — | — | — | — | (37,101 | ) | (37,101 | ) | $ | (37,101 | ) | ||||||||||||||||||||
| Unrealized gain on marketable securities |
— | — | — | — | (208 | ) | — | (208 | ) | (208 | ) | |||||||||||||||||||||
| Comprehensive loss |
$ | (37,309 | ) | |||||||||||||||||||||||||||||
| Tallwood Investment, net of issuance costs |
24,000 | 24 | 31,191 | 7,567 | — | — | 38,782 | |||||||||||||||||||||||||
| Stock-based compensation |
— | — | 5,920 | — | — | — | 5,920 | |||||||||||||||||||||||||
| Net issuance of common stock under stock option plans |
901 | 1 | 144 | — | — | — | 145 | |||||||||||||||||||||||||
| Vesting of restricted stock |
80 | — | 62 | — | — | — | 62 | |||||||||||||||||||||||||
| Balance at January 3, 2010 |
54,002 | 54 | 310,265 | 7,567 | 84 | (220,854 | ) | 97,116 | ||||||||||||||||||||||||
| Net loss |
— | — | — | — | — | (49,763 | ) | (49,763 | ) | $ | (49,763 | ) | ||||||||||||||||||||
| Unrealized gain on marketable securities |
— | — | — | — | 1,211 | — | 1,211 | 1,211 | ||||||||||||||||||||||||
| Comprehensive loss |
$ | (48,552 | ) | |||||||||||||||||||||||||||||
| Stock-based compensation |
— | — | 3,381 | — | — | — | 3,381 | |||||||||||||||||||||||||
| Net issuance of common stock from public offering |
12,815 | 13 | 12,451 | — | — | — | 12,464 | |||||||||||||||||||||||||
| Net issuance of common stock under stock option plans |
1,125 | 1 | 1,111 | — | — | — | 1,112 | |||||||||||||||||||||||||
| Vesting of restricted stock |
169 | — | — | — | — | — | — | |||||||||||||||||||||||||
| Balance at January 2, 2011 |
68,111 | $ | 68 | $ | 327,208 | $ | 7,567 | $ | 1,295 | $ | (270,617 | ) | $ | 65,521 | ||||||||||||||||||
The accompanying notes are an integral part of these consolidated financial statements.
54
Table of Contents
CONSOLIDATED STATEMENTS OF CASH FLOWS
(In thousands)
| Year Ended | ||||||||||||
| January 2, 2011 |
January 3, 2010 |
December 28, 2008 |
||||||||||
| Cash flows from operating activities: |
||||||||||||
| Net loss |
$ | (49,763 | ) | $ | (37,101 | ) | $ | (41,113 | ) | |||
| Adjustments to reconcile net loss to net cash used by operating activities: |
||||||||||||
| Depreciation and amortization |
4,207 | 5,135 | 6,735 | |||||||||
| Loss on property and equipment included in restructuring charges |
314 | — | — | |||||||||
| Stock-based compensation expense |
3,270 | 5,920 | 10,486 | |||||||||
| Operating asset and goodwill impairments |
21,378 | 2,460 | 18,972 | |||||||||
| Amortization of intangible assets and acquired technology |
6,512 | 8,208 | 6,154 | |||||||||
| Gain on sale of auction rate securities |
— | (1,238 | ) | — | ||||||||
| Changes in assets and liabilities, net of the effect of acquisitions: |
||||||||||||
| Accounts receivable, net |
10,848 | (22,635 | ) | 4,721 | ||||||||
| Inventory |
18,004 | (2,016 | ) | 3,387 | ||||||||
| Prepaid expenses and other assets |
(22 | ) | (892 | ) | 36 | |||||||
| Accounts payable and accrued liabilities |
(22,544 | ) | 21,210 | (12,368 | ) | |||||||
| Net cash used by operating activities |
(7,796 | ) | (20,949 | ) | (2,990 | ) | ||||||
| Cash flows from investing activities: |
||||||||||||
| Purchases of property and equipment |
(4,421 | ) | (1,058 | ) | (1,624 | ) | ||||||
| Purchases of investments |
— | (6,610 | ) | (283,596 | ) | |||||||
| Maturities and sales of investments |
14,139 | 29,866 | 266,533 | |||||||||
| Acquisitions |
— | (54,440 | ) | (11,918 | ) | |||||||
| Net cash provided (used) by investing activities |
9,718 | (32,242 | ) | (30,605 | ) | |||||||
| Cash flows from financing activities: |
||||||||||||
| Net proceeds from issuances of common stock and exercise of stock options |
— | 507 | — | |||||||||
| Net proceeds from private stock offering |
13,711 | 38,782 | 893 | |||||||||
| Repurchases of common stock |
— | — | (5,205 | ) | ||||||||
| Net cash provided (used) by financing activities |
13,711 | 39,289 | (4,312 | ) | ||||||||
| Net increase (decrease) in cash and cash equivalents |
15,633 | (13,902 | ) | (37,907 | ) | |||||||
| Cash and cash equivalents at beginning of year |
13,317 | 27,219 | 65,126 | |||||||||
| Cash and cash equivalents at end of year |
$ | 28,950 | $ | 13,317 | $ | 27,219 | ||||||
| Supplemental disclosure of cash flow information: |
||||||||||||
| Cash paid for income taxes |
339 | 188 | 199 | |||||||||
| Purchases of equipment included in Accounts payable and accrued liabilities |
701 | — | — | |||||||||
The accompanying notes are an integral part of these consolidated financial statements.
55
Table of Contents
NOTES TO CONSOLIDATED FINANCIAL STATEMENTS
Note 1 – Ikanos and Summary of Significant Accounting Policies
The Company
Ikanos Communications, Inc. (Ikanos or the Company) was incorporated in the State of California in April 1999 and reincorporated in the State of Delaware in September 2005. The Company is a provider of silicon and software for interactive triple-play broadband. The Company develops and markets end-to-end products for the last mile and the digital home, which enable carriers to offer enhanced triple play services, including voice, video and data. The Company has developed programmable, scalable chip architectures, which form the foundation for deploying and delivering triple play services. Flexible communication processor architecture with wire-speed packet processing capabilities enables high-performance residential gateways for distributing advanced services in the home. These products thereby support telecommunications services providers’ triple play deployment plans to the digital home and have been deployed by service providers in Asia, Europe and North America.
Since its inception, the Company has only been profitable in the third and fourth quarters of 2005. The Company incurred a net loss of $49.8 million for the year ended January 2, 2011 and had an accumulated deficit of $270.6 million as of January 2, 2011. To achieve consistent profitability, the Company will need to generate and sustain higher revenue, while maintaining cost and expense levels appropriate and necessary for its business. Existing cash, cash equivalents and short-term investments are expected to be sufficient to meet anticipated cash needs for at least the next twelve months.
The Company’s fiscal year ends on the Sunday closest to December 31. The Company’s fiscal quarters end on the Sunday closest to the end of the applicable calendar quarter, except in a 53-week fiscal year, in which case the additional week falls into the fourth quarter of that fiscal year. There were 53 weeks in fiscal year 2010.
Basis of Presentation
The accompanying consolidated financial statements include the accounts of the Company and all of its wholly-owned subsidiaries. All intercompany transactions and balances have been eliminated in consolidation.
References in this Annual Report on Form 10-K to “authoritative guidance” are to the Accounting Standards Codification (ASC) issued by the Financial Accounting Standards Board (FASB) in June 2009.
Use of Estimates
The preparation of the Company’s consolidated financial statements in conformity with generally accepted accounting principles (GAAP) requires management to make certain estimates, judgments and assumptions for example relating to bad debt expense impairments . The Company believes that the estimates, judgments and assumptions upon which it relies are reasonable based upon information available to it at the time that these estimates, judgments and assumptions are made. These estimates, judgments and assumptions can affect the reported amounts of assets and liabilities as of the date of the financial statements as well as the reported amounts of revenue and expenses during the periods presented. To the extent there are material differences between these estimates and actual results, the Company’s financial statements would have been affected. In many cases, the accounting treatment of a particular transaction is specifically dictated by GAAP and does not require management’s judgment in its application. There are also areas in which management’s judgment in selecting any available alternative would not produce a materially different result.
Recent Accounting Pronouncements
In September 2006, the Financial Accounting Standards Board (FASB) issued guidance related to fair value measurement that defines fair value, provides a framework for measuring fair value and expands the disclosures required for fair value measurements. The Company was required to apply this guidance beginning in 2008. In February 2008, the FASB delayed the effect of this guidance for all non-financial liabilities, except those that are recognized or disclosed at fair value in the financial statements on a recurring basis (at least annually) to fiscal years beginning after November 15, 2008. The adoption of this guidance for financial assets and liabilities did not have a material impact on our consolidated financial position, results of operations or cash flows.
56
Table of Contents
In December 2007, the FASB issued guidance on business combinations, which establishes principles and requirements for how an acquirer recognizes and measures in its financial statements the identifiable assets acquired, the liabilities assumed, and any non-controlling interest in the acquiree in a business combination. This guidance also establishes principles around how goodwill acquired in a business combination or a gain from a bargain purchase should be recognized and measured, as well as provides guidelines on the disclosure requirements on the nature and financial impact of the business combination. The guidance applies prospectively to business combinations for which the acquisition date is on or after the beginning of the first annual reporting period beginning on or after December 15, 2008. The adoption of these standards did not have a material effect on our consolidated statements of financial position, operations or cash flows.
In December 2007, the FASB issued guidance related to noncontrolling interests in consolidated financial statements. This statement amends Accounting Research Bulletin (ARB) 51 and establishes accounting and reporting standards for the noncontrolling interest in a subsidiary and for the deconsolidation of a subsidiary. It clarifies that a noncontrolling interest in a subsidiary is an ownership interest in the consolidated entity that should be reported as equity in the consolidated financial statements. It requires consolidated net income to be reported at amounts that include the amounts attributable to both the parent and the noncontrolling interest. This guidance establishes a single method of accounting for changes in a parent’s ownership interest in a subsidiary that do not result in deconsolidation. The guidance, which was effective for the Company beginning in 2009, did not have a material effect on the Company’s consolidated statements of financial position, operations or cash flows.
In April 2008, the FASB issued a staff position related to the determination of the useful life of intangible assets and amended the factors that should be considered in developing renewal or extension assumptions used to determine the useful life of a recognized intangible asset. This FASB Staff Position is effective for intangible assets acquired on or after July 1, 2009. The adoption of this guidance did not have a material effect on our consolidated statements of financial position, operations or cash flows.
In April 2009, the FASB provided guidelines for making fair value measurements more consistent with the principles already in effect. The guidance relates to determining fair values when there is no active market or where the price inputs being used represent distressed sales. It reaffirms that the objective of fair value measurement is to reflect how much an asset would be sold for in an orderly transaction (as opposed to a distressed or forced transaction) at the date of the financial statements under current market conditions. Specifically, it reaffirms the need to use judgment to ascertain if a formerly active market has become inactive and in determining fair values when markets have become inactive. The authoritative guidance, effective beginning with the Company’s interim reporting period ended on June 28, 2009, had no impact on the Company’s consolidated financial position, results of operations or cash flows.
In April 2009, the FASB issued authoritative guidance to enhance consistency in financial reporting by increasing the frequency of fair value disclosures. The authoritative guidance relates to fair value disclosures for any financial instruments that are not currently reflected in a company’s balance sheet at fair value. Prior to this guidance, fair values for these assets and liabilities have only been disclosed once a year. The authoritative guidance requires these disclosures on a quarterly basis, thereby providing qualitative and quantitative information about fair value estimates for all those financial instruments not measured on the balance sheet at fair value. The disclosure requirement was effective for the Company’s interim reporting period ended on June 28, 2009. The implementation of this guidance had no impact on the Company’s consolidated financial position, results of operations or cash flows.
In April 2009, the FASB provided additional guidance designed to create greater clarity and consistency in accounting and presenting impairment losses on securities. The guidance brought greater consistency to the timing of impairment recognition, and provided greater clarity to investors about the credit and noncredit components of impaired debt securities that are not expected to be sold. The measure of impairment in comprehensive income remains fair value. This authoritative guidance also requires increased and more timely disclosures regarding expected cash flows, credit losses, and an aging of securities with unrealized losses. The guidance was effective beginning with the Company’s interim reporting period ended on June 28, 2009. The implementation had no impact on the Company’s consolidated financial position, results of operations or cash flows.
57
Table of Contents
In June 2009, the FASB issued “The FASB Accounting Standards Codification and the Hierarchy of Generally Accepted Accounting Principles”, a replacement of prior guidance. The FASB Accounting Standards Codification will become the source of authoritative U.S. GAAP recognized by the FASB to be applied by nongovernmental entities. Rules and interpretive releases of the SEC under authority of federal securities laws are also sources of authoritative GAAP for SEC registrants. On the effective date of this Statement, the Codification will supersede all then-existing non-SEC accounting and reporting standards. All other non-grandfathered non-SEC accounting literature not included in the Codification will become non-authoritative. This guidance became effective for the Company’s financial statements issued for interim periods ended September 27, 2009. The adoption of the codification did not have a material effect on the Company’s consolidated results of operations or financial condition.
In September 2009, the FASB issued authoritative guidance related to revenue recognition for certain revenue arrangements that include software elements. Previously, companies that sold tangible products with “more than incidental” software were required to apply software revenue recognition guidance. This guidance often delayed revenue recognition for the delivery of the tangible product. Under the new guidance, tangible products that have software components that are “essential to the functionality” of the tangible product will be excluded from the software revenue recognition guidance. The new guidance is to be applied on a prospective basis for revenue arrangements entered into or materially modified in fiscal years beginning on or after June 15, 2010, with earlier application permitted. The authoritative guidance is not expected to have an effect on our consolidated financial position, results of operations or cash flows.
In January 2010, the FASB issued updated guidance related to fair value measurements and disclosures, which requires a reporting entity to disclose separately the amounts of significant transfers in and out of Level 1 and Level 2 fair value measurements and to describe the reasons for the transfers. In addition, in the reconciliation for fair value measurements using significant unobservable inputs, or Level 3, a reporting entity should disclose separately information about purchases, sales, issuances and settlements (that is, on a gross basis rather than one net number). The updated guidance also requires that an entity should provide fair value measurement disclosures for each class of assets and liabilities and disclosures about the valuation techniques and inputs used to measure fair value for both recurring and non-recurring fair value measurements for Level 2 and Level 3 fair value measurements. The updated guidance is effective for interim or annual financial reporting periods beginning after December 15, 2009, except for the disclosures about purchases, sales, issuances and settlements in the roll forward activity in Level 3 fair value measurements, which are effective for fiscal years beginning after December 15, 2010 and for interim periods within those fiscal years. The adoption of the updated guidance is not expected to have a material impact on our consolidated financial position, results of operations or cash flows.
Summary of Significant Accounting Policies
Revenue Recognition
In accordance with authoritative guidance revenue from sales of semiconductors is recognized upon shipment when persuasive evidence of an arrangement exists, the required firmware is delivered, legal title and risk of ownership has transferred, the price is fixed or determinable and collection of the resulting receivable is reasonably assured.
The Company records reductions to revenue for estimated product returns and pricing adjustments, such as competitive pricing programs and volume purchase incentives, in the same period that the related revenue is recorded. The amount of these reductions is based on historical sales returns, analysis of credit memo data, specific criteria included in volume purchase incentives agreements, and other factors known at the time. Additional reductions to revenue would result if actual product returns or pricing adjustments exceed our estimates.
Cash, Cash Equivalents and Investments
The Company considers all highly liquid investments with an original maturity of 90 days or less at the date of purchase to be cash equivalents. Short-term investments consist of highly liquid securities with original maturities in excess of 90 days. Non-liquid investments with original maturities in excess of one year are classified as long term.
The Company accounts for its marketable securities in accordance with ASC 820 and classifies the marketable securities as available-for-sale at the time of purchase and re-evaluates such designation as of each consolidated balance sheet date. The marketable securities include commercial paper, corporate bonds, government securities and auction rate securities. The
58
Table of Contents
Company’s marketable securities are reported at fair value with the related unrealized gains and losses included in accumulated other comprehensive income (loss), a component of stockholders’ equity. Realized gains or losses on the sale of marketable securities are determined using the specific-identification method. For all investments in debt and equity securities, unrealized losses are evaluated to determine if they are other than temporary. For investments in equity securities, unrealized losses that are considered to be other than temporary are considered impairment losses and recognized as a component of interest income and other, net, in the statements of operations. For investments in debt securities, if the fair value of a debt security is less than its amortized cost basis, the Company assesses whether the impairment is other than temporary. An impairment is considered other than temporary if (i) the Company has the intent to sell the security, (ii) it is more likely than not that the Company will be required to sell the security before recovery of its entire amortized cost basis, or (iii) the Company does not expect to recover the entire amortized cost of the security. If an impairment is considered other than temporary based on conditions (i) and (ii), the entire difference between the amortized cost and the fair value of the security is recognized in earnings. If an impairment is considered other than temporary based on condition (iii), the amount representing credit losses, defined as the difference between the present value of the cash flows expected to be collected and the amortized cost basis of the debt security, will be recognized in earnings and the amount relating to all other factors will be recognized in other comprehensive income. The Company evaluates both qualitative and quantitative factors such as duration and severity of the unrealized loss, credit ratings, prepayment speeds, defaults and loss rates of the underlying collateral, structure and credit enhancements to determine if a credit loss may exist.
Fair Value of Financial Instruments
The carrying amounts of certain of the Company’s financial instruments including, cash and cash equivalents, accounts receivables, accounts payable and accrued liabilities, approximate fair value due to the relatively short maturity periods.
Inventory
Inventory is stated at the lower of cost or market. Cost is determined by the first-in, first-out method and market represents the estimated net realizable value. The Company records inventory write-downs for estimated obsolescence of unmarketable inventory based upon assumptions about future demand and market conditions. Additionally, the Company specifically reduces inventory to the lower of cost or market if pricing trends or forecasts indicate that the carrying value of inventory exceeds its estimated selling price. Once inventory is written down, a new accounting basis is established and accordingly, it is not written back up in future periods.
Property and Equipment
Property and equipment are stated at cost less accumulated depreciation and amortization. Depreciation is computed using the straight-line method over the estimated useful lives of the assets. Leasehold improvements are amortized over the shorter of the estimated useful life of the asset or the term of the lease. All repairs and maintenance costs are expensed as incurred.
The depreciation and amortization periods for property and equipment categories are as follows:
| Computer equipment |
2 to 3 years | |||
| Furniture and fixtures |
4 years | |||
| Machinery and equipment |
3 to 7 years | |||
| Software |
3 to 7 years |
Goodwill and Intangible Assets
Goodwill represents the excess of the purchase price over the fair value of the net tangible and identifiable intangible assets acquired in a business combination. Intangible assets resulting from the acquisitions of entities accounted for using the purchase method of accounting are estimated by management based on the fair value of assets received. Identifiable intangible assets are comprised of existing and core technology, patents, order backlog, customer relationships, trademarks and other intangible assets. Identifiable intangible assets that have finite useful lives are being amortized over their useful lives. In accordance with authoritative guidance, goodwill is not amortized. Rather, goodwill is subject to at least an annual assessment for impairment (more frequently if certain indicators are present) by applying a fair-value based test. In the event that management determines that the value of goodwill has become impaired, the Company will incur an accounting charge
59
Table of Contents
for the amount of impairment during the period in which the determination is made. Due to economic events that occurred during the third quarter of 2010, the Company performed an assessment for impairment and wrote down goodwill and intangibles by $8.6 million and $12.8 million, respectively. During the fourth quarter of 2010 the Company performed its annual review of intangible assets. There was no further impairment. During the fourth quarter of 2009, the Company performed its annual goodwill assessment. There was no impairment of goodwill. Due to economic events that occurred during the third quarter of 2008, the Company performed an assessment for impairment and wrote down goodwill and intangibles by $7.4 million and $1.1 million, respectively. See Note 3 – Asset Impairments.
Impairment of Long-Lived Assets
In accordance with authoritative guidance, the Company evaluates long-lived assets, other than goodwill, for impairment whenever events or changes in circumstances indicate that the carrying value of an asset may not be recoverable based on expected undiscounted cash flows attributable to that asset. The amount of any impairment is measured as the difference between the carrying value and the fair value of the impaired asset. There was no impairment in 2010 or 2009. During the third quarter of 2008, the Company performed an evaluation of its long-lived assets and recorded an impairment charge of $4.0 million. See Note 3 – Asset Impairments.
Software Development Costs
In accordance with authoritative guidance, software development costs are capitalized beginning when technological feasibility has been established and ending when a product is available for general release to customers. To date, the period between achieving technological feasibility and the issuing of such software has been short and software development costs qualifying for capitalization have been insignificant.
Research and Development
Research and development costs consist primarily of compensation and related costs for personnel as well as costs related to software tools, mask tooling expenses, materials, supplies and equipment depreciation. All research and development costs are expensed as incurred.
Advertising Costs
Advertising costs are expensed as incurred. To date, advertising costs have been insignificant.
Concentration of Credit Risk
Financial instruments that potentially subject the Company to significant concentrations of credit risk consist of cash, cash equivalents, investments and accounts receivable. Cash and cash equivalents are held with a limited number of financial institutions. Deposits held with these financial institutions may exceed the amount of insurance provided on such deposits. Management believes that the financial institutions that hold the Company’s deposits are credit worthy and, accordingly, minimal credit risk exists with respect to those deposits. Short-term investments include a diversified portfolio of commercial paper and government agency bonds. Long-term investments are comprised of auction rate securities and are included in other assets. All investments are classified as available-for-sale. The Company does not hold or issue financial instruments for trading purposes.
Credit risk with respect to accounts receivable is concentrated due to the number of large orders recorded in any particular reporting period. Three customers represented 20%, 16% and 14% of accounts receivable at January 2, 2011. Four customers represented 18%, 15%, 10% and 10% of accounts receivable at January 3, 2010. Two customers represented 18% and 16% of revenue for the year ended January 2, 2011. Three customers accounted for 19%, 12%, and 11% of revenue for the year ended January 3, 2010. Four customers accounted for 25%, 23%, 21% and 11% of revenue for the year ended December 28, 2008.
Concentration of Suppliers
The Company subcontracts all of the manufacture, assembly and tests of its products to third-parties located primarily in Asia. As a result of this geographic concentration, a disruption in the manufacturing process resulting from a natural
60
Table of Contents
disaster or other unforeseen events could have a material adverse effect on the Company’s financial position and results of operations. Additionally, a small number of sources manufacture, assemble and test the Company’s products, with which the Company has no long-term contracts. Also, each product generally has only one foundry and one assembly and test provider. An inability to obtain these products and services in the amounts needed and on a timely basis or at commercially reasonable prices could result in delays in product introductions, interruptions in product shipments or increases in product costs, which could have a material adverse effect on the Company’s financial position and result of operations.
Concentration of Other Risk
The semiconductor industry is characterized by rapid technological change, competitive pricing pressures and cyclical market patterns. The Company’s results of operations are affected by a wide variety of factors, including general economic conditions; economic conditions specific to the semiconductor industry; demand for the Company’s products; the timely introduction of new products; implementation of new manufacturing technologies; manufacturing capacity; the availability of materials and supplies; competition; the ability to safeguard patents and intellectual property in a rapidly evolving market; and reliance on assembly and wafer fabrication subcontractors and on independent distributors and sales representatives. As a result, the Company may experience substantial period-to-period fluctuations in future periods due to the factors mentioned above or other factors.
Warranty
The Company generally warrants its products against defects in materials and workmanship and non-conformance to its specifications for varying lengths of time, generally one year. If there is a material increase in customer claims compared with historical experience, or if costs of servicing warranty claims are greater than expected, the Company may record additional charges against cost of revenue.
Net Loss Per Share
In accordance with ASC 260-10-55, basic net loss per share is computed using the weighted-average number of common shares outstanding during the period. The calculation of basic and diluted net loss per common share is as follows (in thousands, except per share amounts):
| Year Ended | ||||||||||||
| January 2, 2011 |
January 3, 2010 |
December 28, 2008 |
||||||||||
| Net loss |
$ | (49,763 | ) | $ | (37,101 | ) | $ | (41,113 | ) | |||
| Weighted average shares outstanding |
56,713 | 38,098 | 29,084 | |||||||||
| Basic and diluted net loss per share |
$ | (0.88 | ) | $ | (0.97 | ) | $ | (1.41 | ) | |||
The following potential common shares have been excluded from the calculation of diluted net loss per share as their effect would have been anti-dilutive (in thousands):
| Year Ended | ||||||||||||
| January 2, 2011 |
January 3, 2010 |
December 28, 2008 |
||||||||||
| Anti-dilutive securities: |
||||||||||||
| Warrants to purchase common stock |
341 | 800 | — | |||||||||
| Weighted average restricted stock and restricted stock units |
1,064 | 1,422 | 1,479 | |||||||||
| Weighted average options to purchase common stock |
8,590 | 2,303 | 2,362 | |||||||||
| 9,995 | 4,525 | 3,841 | ||||||||||
Income Taxes
The Company accounts for income taxes under the liability method, whereby deferred tax assets and liabilities are determined based on the difference between the financial statement and tax bases of assets and liabilities using enacted tax rates in effect for the year in which the differences are expected to affect taxable income. Valuation allowances are established when necessary to reduce deferred tax assets to the amounts expected to be realized. In addition, the calculation of the Company’s tax liabilities involves dealing with uncertainties in the application of complex tax regulations. In accordance with authoritative guidance, the Company recognizes liabilities for uncertain tax positions based on the two-step process prescribed within the interpretation. The first step is to evaluate the tax position for recognition by determining if the weight of available evidence indicates that it is more likely than not that the position will be sustained on audit, including resolution of related appeals or litigation processes, if any. The second step is to measure the tax benefit as the largest amount that is more than 50% likely of being realized upon ultimate settlement.
61
Table of Contents
Note 2 – Business Combinations
Acquisition of the Broadband Access Product Line of Conexant
On August 24, 2009, the Company acquired the Broadband Access (BBA) product line of Conexant Systems, Inc. (Conexant), which includes the product-related intellectual property, patents, fixed assets and inventory of the product line for a total purchase price of $53.1 million in cash and the assumption of approximately $6.4 million in employee and lease related liabilities. Adding the BBA products and engineers to Ikanos’ existing portfolio of VDSL solutions has more than doubled the size the Company, expanded its reach into new geographic and product markets and added new research and development capabilities to the existing engineering team. The addition of the BBA is expected to allow the Company to develop semiconductor and software products for new markets within the digital home in addition to serving the Company’s Broadband DSL and Communications Processors businesses.
The following is a summary of the assets acquired and liabilities assumed by Ikanos as of August 24, 2009 (acquisition date) reconciled to the consideration paid (in thousands):
| Inventory |
$ | 20,545 | ||
| Property and equipment, net |
1,982 | |||
| Intangible assets |
28,302 | |||
| Total identifiable assets acquired |
50,829 | |||
| Employee related liabilities |
(3,293 | ) | ||
| Real estate lease liabilities |
(3,102 | ) | ||
| Total liabilities assumed |
(6,395 | ) | ||
| Net identifiable assets acquired |
44,434 | |||
| Goodwill |
8,633 | |||
| Net assets acquired |
$ | 53,067 | ||
Tangible assets acquired consisted of inventory of $20.5 million and property and equipment of $2.0 million and were assigned a fair value as of the date of acquisition based on the expected selling price and replacement value, respectively. The identifiable intangible assets acquired have no residual value and are as follows (in thousands):
| Estimated Fair Value |
Expected Useful Life |
|||||||
| Existing technologies |
$ | 13,390 | 3 years | |||||
| In-process research and development (IPR&D) |
4,935 | * | ||||||
| Customer relationships |
8,216 | 4 years | ||||||
| Order backlog |
1,761 | 0.5 year | ||||||
| $ | 28,302 | |||||||
| * | Technical feasibility of the IPR&D has not been reached and, therefore, a useful life has not been determined |
Existing Technology: The existing technology comprises products that have reached technological feasibility and consists primarily of the BBA’s SHDSL, ADSL and VDSL products. The Company valued the existing technology using the income approach and a discounted cash flow (DCF) model, which uses forecasts of future revenue and expense related to the intangible asset. The Company utilized a discount rate of 22% for existing technology and is amortizing the intangible assets on a straight-line basis over their estimated useful life of three years.
Acquired IPR&D: Acquired IPR&D relates to projects that, as of the acquisition date, have not been completed. IPR&D assets are initially recognized at fair value and have indefinite useful lives until the successful completion or abandonment of the associated research and development efforts. Accordingly, during the development period after the acquisition date, these assets will not be amortized into results of operations; instead these assets will be subject to periodic impairment testing. Upon successful completion of the development process for an IPR&D project, determination as to the useful life of the asset will be made; at that point in time, the asset would then be considered as having a finite-life and Ikanos would begin to amortize the asset into earnings. The Company valued the IPR&D using a combination of the income approach and a DCF model with a discount rate of 22%.
62
Table of Contents
IPR&D comprised mainly of two projects in process as of the acquisition date. The two projects were next generation VDSL solutions, one for the access line of business and the other for the gateway line. After reviewing the two projects, it was determined that further development of the access project was not necessary for product development, had no alternative use and was abandoned. Accordingly, in 2009, the Company recorded an operating asset impairment charge of $2.5 million leaving a balance of $2.5 million of IPR&D. In 2010 the remaining IPR&D was written off as part of the Company’s impairment of certain operating assets. (See Note 3.)
Customer Relationships: The customer-relationships asset relates to the ability to sell existing and future versions of products to existing customers and has been estimated using the income method. The Company valued customer relationships utilizing a DCF model and a discount rate of 20% and is amortizing this intangible asset on a straight-line basis over its estimated useful life of four years.
Order Backlog: The order backlog asset represents the value of the sales and marketing costs required to establish the order backlog and was valued using the income approach and a DCF model with a discount rate of 8%. The order backlog has an estimated useful life of six months.
Goodwill represents the excess of the purchase price over the fair value of the identifiable intangible assets and fixed assets acquired. Goodwill of $8.6 million was assigned to Ikanos’ single segment reporting structure. Goodwill of approximately $4.9 million is expected to be deductible for income tax purposes.
The liabilities assumed of $6.4 million comprised of personnel liabilities totaling $3.3 million, excess lease liabilities of $2.9 million and other liabilities totaling $0.2 million. Personnel liabilities are comprised of assumed vacation and foreign statutory pension costs as well as reimbursement to Conexant of severance costs for former Conexant employees associated with the BBA, but who were terminated on Day 1 of the acquisition. The excess lease liability is a combination of unfavorable rent rates and excess space at several assumed leased properties. The liability will be amortized over the remaining lease term of up two years.
The amount of the BBA’s revenue included in Ikanos’ consolidated income statement for the year ended January 3, 2010 was $36.1 million. Disclosure of losses related to the acquisition of the BBA business is impracticable to determine because the business, departments and personnel have been integrated into the comparable departments of Ikanos Communications and is, therefore, omitted.
The unaudited pro forma revenue, net loss and net loss per share give effect to the BBA acquisition as if it occurred at the beginning of each of the periods presented below. Adjustments were made for the amortization of BBA acquisition related intangible assets and for excess lease costs as if the BBA acquisition had occurred at the beginning of each period reported.
Pro forma consolidated results for the year ended 2009 and 2008 are as follows (in thousands, except per share data):
| Year Ended | ||||||||
| January 3, 2010 |
December 28, 2008 |
|||||||
| Pro forma revenue |
$ | 215,290 | $ | 277,661 | ||||
| Pro forma net loss |
$ | (50,273 | ) | $ | (194,977 | ) | ||
| Pro forma basic and diluted net loss per share |
$ | (0.94 | ) | $ | (3.67 | ) | ||
| Pro forma weighted average basic and diluted outstanding shares |
53,494 | 53,084 | ||||||
63
Table of Contents
The following is a reconciliation of reported weighted average basic and diluted outstanding shares to pro forma weighted average basic and diluted outstanding shares (thousands):
| Year Ended | ||||||||
| January 3, 2010 |
December 28, 2008 |
|||||||
| Weighted average basic and diluted outstanding shares as reported |
38,098 | 29,084 | ||||||
| Excluding effect of Tallwood Investment on reported weighted average shares (see Note 11) |
(8,604 | ) | — | |||||
| Weighted average number of shares issued to Tallwood Investors as if issued at the beginning of the reporting period |
24,000 | 24,000 | ||||||
| Pro forma weighted average basic and diluted shares |
53,494 | 53,084 | ||||||
Acquisition of Centillium DSL Assets
In February 2008, the Company purchased certain DSL technology and related assets from Centillium Communications, Inc. for $11.9 million in cash, including $0.1 million in transaction costs and the assumption of liabilities of $0.2 million. The results of operations from the assets acquired in the Centillium DSL acquisition have been included in the Company’s consolidated statement of operations from the date of the acquisition.
The acquisition was accounted for as a purchase business combination. Under the purchase method of accounting, the total estimated purchase price as shown in the table has been allocated to the net tangible and intangible assets acquired based on their estimated fair values as of the date of the acquisition. Subsequent to the acquisition, certain adjustments were made to the carrying value of certain tangible and intangible assets. Specifically, acquired inventory was reduced in value with a corresponding increase in goodwill and subsequently our goodwill was impaired as described in Note 3 – Asset Impairments. The allocation of the purchase price for this acquisition as of the date of closing was as follows (in thousands):
| As of Date
of Acquisition |
Adjustments | December 28, 2008 |
||||||||||
| Acquired intangible assets: |
||||||||||||
| Existing technology |
$ | 3,650 | $ | — | $ | 3,650 | ||||||
| Customer relationships |
2,660 | — | 2,660 | |||||||||
| Order backlog |
710 | — | 710 | |||||||||
| Goodwill |
273 | 877 | 1,150 | |||||||||
| Purchased in-process research and development (IPR&D) |
310 | — | 310 | |||||||||
| Total acquired intangible assets |
7,603 | 877 | 8,480 | |||||||||
| Tangible assets acquired |
4,520 | (877 | ) | 3,643 | ||||||||
| Assumed liabilities |
(205 | ) | — | (205 | ) | |||||||
| $ | 11,918 | $ | — | $ | 11,918 | |||||||
Tangible assets acquired of $3.6 million consisted primarily of inventory and fixed assets and were assigned a fair value as of the date of acquisition based on the expected selling price and replacement value, respectively. As discussed further below, the identified intangible assets acquired were assigned fair values in accordance with authoritative guidance. The Company believes that these identified intangible assets have no residual value.
Acquired Intangible Assets
Existing technology: Existing technology comprises products that have reached technological feasibility. The Company valued the existing technology using the income approach and a discounted cash flow (DCF) model, which uses forecasts of future revenue and expense related to the intangible asset. The Company utilized a discount rate of 28% for existing technology and is amortizing the intangible assets on a straight-line basis over its estimated useful life of two years.
Customer Relationships: The customer relationships asset relates to the ability to sell existing and future versions of products to existing customers and has been estimated using the income method. The Company valued customer relationships utilizing a DCF model and a discount rate of 30% and is amortizing this intangible asset on a straight-line basis over its estimated useful life of three years.
Order Backlog: The order backlog asset represents the value of the sales and marketing costs required to establish the order backlog and was valued using the income approach and a DCF model with a discount rate of 26%. The order backlog has an estimated useful life of six months.
64
Table of Contents
Purchased IPR&D: IPR&D of $0.3 million was recorded as research and development expense in accordance with FIN 4. Projects that qualify as IPR&D represent those that have not yet reached technological feasibility and which have no alternative future use. Technological feasibility is established when an enterprise has completed all planning, designing, coding, and testing activities that are necessary to establish that a product can be produced to meet its design specifications including functions, features and technical performance requirements. There was one IPR&D project as of the acquisition date, and it was discontinued as of March 30, 2008. The Company valued the IPR&D using a combination of the income approach and a DCF model with a discount rate of 32%.
Pro forma Financial Information (Unaudited)
The following unaudited pro forma financial information presents the combined results of operations of the Company and the stand alone DSL business of Centillium had the acquisition occurred as of the beginning of fiscal 2007, after giving effect to certain adjustments, including amortization of Centillium DSL acquisition-related intangibles. The operating results for the period from January 1, 2008 to February 13, 2008 (date of close) related to the Centillium DSL business were not readily available and were not considered practical to obtain. The unaudited pro forma financial information does not necessarily reflect the results of operations that would have occurred had the combined businesses constituted a single entity during such period, and is not necessarily indicative of results which may be obtained in the future (in thousands, except per share amounts):
| Year
Ended December 30, 2007 |
||||
| Pro forma total revenue |
$ | 131,467 | ||
| Pro forma net loss |
$ | (39,464 | ) | |
| Pro forma net loss per share—basic and diluted |
$ | (1.38 | ) | |
| Pro forma weighted average basic and diluted shares |
28,626 | |||
Note 3 – Operating Asset Impairments
For the quarter ended October 3, 2010, the Company recorded impairment charges totaling $21.4 million of which $8.6 million related to goodwill and $12.8 million related to other intangible assets.
The Company tests goodwill for impairment on an annual basis and between annual tests if an event occurs or circumstances change that would more likely than not reduce the fair value of the Company’s single reporting unit below its carrying value. The Company issued financial guidance for the third quarter 2010 period and announced a company-wide restructuring to better align the Company’s overhead structure with lower expected revenues and subsequently experienced a sustained decline during the quarter ended October 3, 2010 in market capitalization. Based on these indicators of potential impairment, the Company completed an impairment analysis of its goodwill as of October 3, 2010.
The Company performed the first step of the two-step impairment test and compared the fair value of the Company as a single reporting unit to its carrying value. Consistent with the Company’s approach in its annual impairment testing, in assessing the fair value of the reporting unit, the Company considered both the market approach and income approach. Under the market approach, the fair value of the reporting unit is based on quoted stock price on the NASDAQ, the number of shares outstanding for the Company’s common stock and an estimated control premium. Under the income approach, the fair value of the reporting unit is based on the present value of estimated future cash flows. The income approach is dependent on a number of significant management assumptions including estimates of revenue and operating expenses, product penetration, growth and discount rates. Due to current market conditions and the number of significant assumptions required, the Company used the market approach. The market approach was lower, but both valuation approaches determined that the fair value was less than the carrying value of the net assets and, therefore, the Company performed step two of the impairment test.
In step two of the impairment test, the Company determined the implied fair value of the goodwill and compared it to the carrying value of the goodwill. The Company allocated the fair value of the reporting unit to all of its assets and liabilities as if the reporting unit had been acquired in a business combination and the fair value of the mainline reporting unit was the price paid to acquire the reporting unit. The Company determined fair value of the single reporting unit using discounted cash flows. The weighted average cost of capital used in the impairment was 25.4% with perpetual growth rate of 3%. The excess of the fair value of the reporting unit over the amounts assigned to its assets and liabilities is the implied fair value of goodwill. The Company’s step two analysis resulted in no implied fair value of goodwill, and therefore, the Company recognized an impairment charge of $8.6 million, representing a write off of the entire amount of the Company’s previously recorded goodwill.
65
Table of Contents
In addition, as part of and in conjunction with the impairment test, the Company determined that the carrying values of certain intangible assets were less than their fair values. Accordingly, the Company recorded a non-cash intangible asset impairment charge of $12.8 million as of October 3, 2010. The fair value calculation that leads to the impairment of the existing technology and customer relationship intangibles of $10.3 million was determined using a discounted cash flow method. The weighted average cost of capital used in the impairment was 25.4% with no perpetual growth rate. The Company also impaired the remaining $2.5 million of IPR&D related to the gateway line of business under the Conexant BBA product line that was acquired in August 2009, since it was determined to have no alternative use and was therefore abandoned.
Information regarding the nonrecurring fair value measurements completed during the quarter ended October 3, 2010 was (in thousands):
| Fair Value Measurement Using* | ||||||||||||||||||||
| Fair Value as of Measurement Date |
Level 1 | Level 2 | Level 3 | Impairment Charge |
||||||||||||||||
| Goodwill |
$ | — | $ | — | $ | — | $ | — | $ | 8,633 | ||||||||||
| Existing technology |
$ | $3,834 | $ | — | $ | — | $ | 3,834 | $ | 4,927 | ||||||||||
| Customer relationships |
1,458 | — | — | 1,458 | 5,343 | |||||||||||||||
| In-process research and development |
1,435 | — | — | 1,435 | 2,475 | |||||||||||||||
| $ | 6,727 | $ | — | $ | — | $ | 6,727 | $ | 12,745 | |||||||||||
| * | Note 2 – See Investments and Fair Value Measurements for explanation of Levels 1, 2, and 3. |
In 2009 when the Company acquired the Conexant BBA product line in August 2009, it assigned a value of $4.9 million to IPR&D. IPR&D comprised effectively two projects that were in process as of the acquisition date. The two projects were next generation VDSL solutions, one for the access line of business and the other for the gateway line. After reviewing the two projects, it was determined that further development of the access project was not necessary for product development, had no alternative use and was abandoned. Accordingly, the Company recorded an operating asset impairment charge of $2.5 million for the year ended January 3, 2010.
For the year ended December 28, 2008, the Company recorded impairment charges totaling $12.5 million of which $7.4 million related to goodwill, $1.1 million related to intangibles and $4.0 million related to prepaid license fees. The Company also determined that its investment in auction rate securities was impaired (see Note 4), resulting in an additional charge of $6.2 million included in investment gain (impairment) on the Consolidated Statements of Operations.
During the third quarter of 2008, due to a low market capitalization, the Company performed a goodwill impairment test. The fair value of the Company’s single reporting unit was determined based on its quoted stock price on the NASDAQ stock exchange plus an estimated control premium. This test resulted in an impairment charge of $7.4 million because the Company’s market capitalization was significantly lower than the carrying value of its assets for an extended period.
66
Table of Contents
The changes in the carrying value of goodwill were as follows (in thousands):
| Goodwill as of December 30, 2007 |
$ | 6,247 | ||
| Additions in 2008 |
1,150 | |||
| Impairment |
(7,397 | ) | ||
| Goodwill as of December 28, 2008 |
— | |||
| Acquisition of BBA Product Line |
8,633 | |||
| Goodwill as of January 3, 2010 |
8,633 | |||
| Impairment |
(8,633 | ) | ||
| Goodwill as of January 2, 2011 |
$ | — | ||
Note 4 – Investments and Fair Value Measurements
The following is a summary of the Company’s investments (in thousands):
| January 2, 2011 | ||||||||||||
| Cost | Gross Unrealized Gain |
Estimated Fair Value |
||||||||||
| Total short-term investments—auction rate securities |
$ | 705 | $ | 1,295 | $ | 2,000 | ||||||
| January 3, 2010 | ||||||||||||
| Cost | Gross Unrealized Gain |
Estimated Fair Value |
||||||||||
| U.S. government agencies |
$ | 11,988 | $ | 82 | $ | 12,070 | ||||||
| Corporate bonds and notes |
2,151 | 2 | 2,153 | |||||||||
| Total short-term investments |
$ | 14,139 | $ | 84 | $ | 14,223 | ||||||
| Long-term investments—auction rate securities* |
$ | 705 | $ | — | $ | 705 | ||||||
| * | Included in Other assets on the Balance Sheet |
The contractual maturities of investments held at January 2, 2011 are as follows (in thousands):
| January 2, 2011 | ||||||||
| Cost | Estimated Fair Value |
|||||||
| Due within one year |
$ | 705 | $ | 2,000 | ||||
There were no unrealized losses on investments aggregated by category as of January 2, 2011 and as of January 3, 2010.
Marketable securities are classified as available-for-sale as of the balance sheet date and are reported at fair value with unrealized gains and losses reported as a separate component of accumulated other comprehensive income (loss) in stockholders’ equity, net of tax. Realized gains and losses and other-than-temporary declines in value, if any, on available-for-sale securities are reported in other income or expense as incurred. Estimated fair values were determined for each individual security in the investment portfolio. The declines in value of these investments are primarily related to changes in interest rates and are considered to be temporary in nature.
A portion of the Company’s available-for-sale portfolio is composed of auction rate securities. Beginning in the third quarter of 2007, auction rate securities of $7.2 million failed to sell at auction. During 2008, upon determining that the decline in market value was other-than-temporary, the Company wrote down the investments in auction rate securities to their estimated realizable fair value of $1.0 million and recorded an investment impairment charge of $6.2 million. During 2009 the Company sold auction rate securities with a face value of $2.2 million and with a cost basis of $0.3 million for $1.5 million, realizing a gain of $1.2 million.
As of January 2, 2011, the Company found a market outside the auction process for its auction rate securities. The auction rate securities have a book value of $0.7 million and face value of $5.0 million. The Company reviewed the marketability of its auction rate securities and received a quoted price of $2.0 million. Accordingly, as of January 2, 2011 the Company reclassified the securities from other assets to short-term investments on the balance sheet and assigned a fair
67
Table of Contents
market value of $2.0 million. The Company recorded the $1.3 million difference between its book value of $0.7 million and the market value of $2.0 million as accumulated other comprehensive income on the Balance Sheet. On January 31, 2011 the auction rate securities were sold for $2.0 million. The Company will recognize $1.3 million as investment income in the first quarter of 2011.
Fair Value Measurements
ASC 820-20 clarifies that fair value is an exit price, representing the amount that would be received to sell an asset or paid to transfer a liability in an orderly transaction between market participants. As such, fair value is a market-based measurement that should be determined based on assumptions that market participants would use in pricing an asset or liability. As a basis for considering such assumptions, the authoritative guidance establishes a three-tier value hierarchy, which prioritizes the inputs used in measuring fair value as follows: observable inputs such as quoted prices in active markets (Level 1); inputs other than the quoted prices in active markets that are observable either directly or indirectly (Level 2); and unobservable inputs in which there is little or no market data, which require the Company to develop its own assumptions (Level 3). This hierarchy requires the Company to use observable market data, when available, and to minimize the use of unobservable inputs when determining fair value. On a recurring basis, the Company measures certain financial assets, mainly comprised of marketable securities, at fair value.
The Company’s cash and investment instruments are classified within all three levels of the fair value hierarchy. The types of Level 1 instruments, valued based on quoted market prices in active markets, include money market securities. Level 2 types of instruments, valued based on other observable inputs include investment-grade U.S. government agencies, commercial paper and corporate bonds and notes. Level 3 types of instruments, valued based on unobservable inputs in which there is little or no market data, which require the Company to develop its own assumptions, include auction rate securities. The fair value hierarchy of our marketable securities as of as of January 2, 2011 and January 3, 2010 is as follows (in thousands):
| January 2, 2011 | ||||||||||||||||
| Level 1 | Level 2 | Level 3 | Total | |||||||||||||
| Auction rate securities |
$ | — | $ | 2,000 | $ | — | $ | 2,000 | ||||||||
| January 3, 2010 | ||||||||||||||||
| Level 1 | Level 2 | Level 3 | Total | |||||||||||||
| Money market funds (1) |
$ | 43 | $ | — | $ | — | $ | 43 | ||||||||
| U.S. government agencies |
— | 12,070 | — | 12,070 | ||||||||||||
| Corporate bonds and notes |
— | 2,153 | — | 2,153 | ||||||||||||
| Auction rate securities |
— | — | 705 | 705 | ||||||||||||
| $ | 43 | $ | 14,223 | $ | 705 | $ | 14,971 | |||||||||
| (1) | Commercial paper and money market funds are classified as cash equivalents |
In 2008 and 2009, the Company valued the auction rate securities using a DCF model. Assumptions used in valuing each of the auction rate securities include the stated maturity dates between the years 2025 and 2050, the stated coupon rate and an estimated discount rate. The discount rate is an estimate of what the Company believes the security must be discounted to in order to sell today. It is based on a number of factors, including the credit rating of the issuer and the insurance provider for the security. During the year ended December 28, 2008, the Company recorded a charge of $6.2 million as a result of the DCF analysis.
During 2010 there has been a market for auction rate securities outside the auction rate process. Based on quotation received , the Company reclassified the auction rate securities from Level 3 to Level 2. (See discussion above.)
Changes in our Level 3 securities for the year ended January 2, 2011 and January 3, 2010 are as follows (in thousands):
| Year Ended | ||||||||
| January 2, 2011 |
January 3, 2010 |
|||||||
| Beginning balance |
$ | 705 | $ | 1,034 | ||||
| Book value of securities sold |
— | (329 | ) | |||||
| Increase in market value based on quoted prices |
1,295 | — | ||||||
| Reclassified to Level 2 |
(2,000 | ) | ||||||
| Ending balance |
$ |
— |
|
$ | 705 | |||
68
Table of Contents
Note 5 – Allowance for Doubtful Accounts
The following table summarizes the activity related to the allowance for doubtful accounts (in thousands):
| Balance at Beginning of Year |
Charged (Released) to Expenses |
Write-Offs | Balance at End of Year |
|||||||||||||
| 2010 |
$ | 10 | $ | 354 | $ | (292 | ) | $ | 72 | |||||||
| 2009 |
7 | 3 | — | 10 | ||||||||||||
| 2008 |
64 | (38 | ) | (19 | ) | 7 | ||||||||||
Note 6 – Inventory
Inventory consisted of the following (in thousands):
| January 2, 2011 |
January 3, 2010 |
|||||||
| Finished goods |
$ | 11,629 | $ | 11,015 | ||||
| Work-in-process |
4,758 | 22,470 | ||||||
| Purchased parts and raw materials |
659 | 1,565 | ||||||
| $ | 17,046 | $ | 35,050 | |||||
As a result of reductions in the Company’s revenue forecast, the Company wrote down inventory by $16.8 million during the year ended January 2, 2011. During the year ended January 3, 2010, we recovered and sold $1.6 million of inventory previously written down during the year ended December 28, 2008.
Note 7 – Property and Equipment
Property and equipment consisted of the following (in thousands):
| January 2, 2011 |
January 3, 2010 |
|||||||
| Machinery and equipment |
$ | 17,968 | $ | 19,386 | ||||
| Software |
6,294 | 4,161 | ||||||
| Computer equipment |
4,777 | 4,483 | ||||||
| Furniture and fixtures |
870 | 888 | ||||||
| Leasehold improvements |
960 | 677 | ||||||
| Construction in progress |
994 | 137 | ||||||
| 31,863 | 29,732 | |||||||
| Less: Accumulated depreciation and amortization |
(23,649 | ) | (22,230 | ) | ||||
| $ | 8,214 | $ | 7,502 | |||||
Depreciation expense for property and equipment was $4.2 million, $5.1 million and $6.7 million for the years ended January 2, 2011, January 3, 2010, and December 28, 2008, respectively.
69
Table of Contents
Note 8 – Purchased Intangible Assets
The carrying amount of intangible assets is as follows (in thousands):
| January 2, 2011 | Useful Life (Years) |
|||||||||||||||
| Gross
Carrying Amount |
Accumulated Amortization |
Net Amount |
||||||||||||||
| Existing technology |
$ | 13,390 | $ | (10,056 | ) | $ | 3,334 | 3 | ||||||||
| Customer relationships |
8,216 | (6,883 | ) | 1,333 | 4 | |||||||||||
| In-process research and development |
1,435 | — | 1,435 | * | ||||||||||||
| $ | 23,041 | $ | (16,939 | ) | $ | 6,102 | ||||||||||
| January 3, 2010 | Useful Life (Years) |
|||||||||||||||
| Gross
Carrying Amount |
Accumulated Amortization |
Net Amount |
||||||||||||||
| Existing technology |
$ | 23,184 | $ | (10,938 | ) | $ | 12,246 | 3 | ||||||||
| Customer relationships |
13,946 | (4,743 | ) | 9,203 | 4 | |||||||||||
| In-process research and development |
3,910 | — | 3,910 | * | ||||||||||||
| $ | 41,040 | $ | (15,681 | ) | $ | 25,359 | ||||||||||
| * | Technical feasibility of the IPR&D has not been reached and, therefore, a useful life has not been determined. |
The amortization of technology is charged to cost of revenue and the amortization of customer relationships is charged to selling, general and administrative. For the years ended January 2, 2011, January 3, 2010 and December 28, 2008, the amortization of intangible assets was $6.5 million, $8.2 million and $6.2 million, respectively. During the years ended January 2, 2011, January 3, 2010 and December 28, 2008 there were an intangible asset impairment charges of $12.8 million, $2.5 million and $1.1 million, respectively. The estimated future amortization of purchased intangible assets as of January 2, 2011 is $2.5 million in 2011, $1.8 million in 2012 and $0.4 million in 2013.
Note 9 – Accrued Liabilities
Accrued liabilities consisted of the following (in thousands):
| January 2, 2011 |
January 3, 2010 |
|||||||
| Accrued compensation and related benefits |
$ | 3,289 | $ | 6,344 | ||||
| Accrued royalties |
2,236 | 1,200 | ||||||
| Accrued rebates |
2,216 | 1,983 | ||||||
| Restructuring |
1,041 | 298 | ||||||
| Excess lease liability |
873 | 1,496 | ||||||
| Warranty accrual |
895 | 660 | ||||||
| Other accrued liabilities |
2,747 | 5,069 | ||||||
| $ | 13,297 | $ | 17,050 | |||||
The following table summarizes the activity related to the warranty accrual (in thousands):
| January 2, 2011 |
January 3, 2010 |
|||||||
| Balance, beginning of year |
$ | 660 | $ | 745 | ||||
| Provision |
324 | 437 | ||||||
| Usage |
(89 | ) | (522 | ) | ||||
| Balance, end of year |
$ | 895 | $ | 660 | ||||
70
Table of Contents
Note 10 – Restructuring Charges
During the first quarter of 2010, the Company implemented a plan to restructure its work force and reduce its cost structure after its acquisition of the BBA product line. Subsequently, during the third quarter of 2010, the Company implemented a restructuring plan in order to better align its operating expenses with its revised revenue forecast and to reallocate sufficient engineering resources to the continued development of its broadband technology and products. In addition, the Company closed three overseas offices. Total restructuring costs for 2010 amounted to $5.8 million of which $4.7 million related to severance costs, $0.4 million to facilities and $0.7 million to software tools. As of January 2, 2011, the Company has substantially completed its restructuring activities and expects to pay out all remaining liabilities during 2011.
During 2009, the Company implemented a restructuring plan to combine design centers in India and to reduce its cost structure in North America. Restructuring charges of $1.3 million related to the termination of 67 persons, 46 of whom were located in India and 21 in the United States. In addition, the Company relocated the remaining personnel and equipment from Hyderabad, India to Bangalore, India. During 2007, the Company implemented a restructuring program. The restructuring plan involved outsourcing the back-end physical semiconductor design process and terminating approximately 15 employees, including four members of senior management. A summary of the Company’s restructuring activities is as follows (in thousands):
| Severance
and Benefits |
Excess Facilities |
Software Tools |
Total | |||||||||||||
| Balance as of December 30, 2007 |
$ | 132 | $ | — | $ | 1,528 | $ | 1,660 | ||||||||
| Cash payments |
(132 | ) | — | (1,338 | ) | (1,470 | ) | |||||||||
| Balance as of December 28, 2008 |
— | — | 190 | 190 | ||||||||||||
| Restructuring charges |
1,338 | — | — | 1,338 | ||||||||||||
| Cash payments |
(1,040 | ) | — | (190 | ) | (1,230 | ) | |||||||||
| Balance as of January 3, 2010 |
298 | — | — | 298 | ||||||||||||
| Restructuring charges |
4,652 | 449 | 693 | 5,794 | ||||||||||||
| Cash payments |
(4,386 | ) | (95 | ) | (256 | ) | (4,737 | ) | ||||||||
| Other non-cash adjustments * |
(111 | ) | (203 | ) | — | (314 | ) | |||||||||
| Balance as of January 2, 2011 |
$ | 453 | $ | 151 | $ | 437 | $ | 1,041 | ||||||||
| * | Non-cash adjustments relate to stock-based compensation expense and fixed asset dispositions. |
Note 11 – Tallwood Investment
In order to facilitate the BBA acquisition, the Company negotiated a $42.0 million cash investment by Tallwood III, L.P. Tallwood III Annex, L.P. and certain of their affiliates (collectively, the Tallwood Investors) pursuant to which the Company sold to the Tallwood Investors (i) 24.0 million shares of Ikanos common stock, par value $0.001 per share (the Common Stock), and (ii) warrants to purchase up to 7.8 million shares of Common Stock (the Warrants). The transaction was completed on August 24, 2009, and the purchase price of each share of Common Stock and the exercise price of each warrant to purchase a share of Common Stock under the securities purchase agreement was $1.75. In addition, the Company issued to the Tallwood Investors one share (the “Voting Share”) of Series A Preferred Stock, which provides the Tallwood Investors certain voting rights solely with respect to election of a minority of the members of the Board of Directors but does not share in the economics of Ikanos. The 24.0 million shares of Common Stock, Warrants and the Voting Share collectively are referred to as the Tallwood Investment.
The net proceeds for the Tallwood Investment were $38.8 million after capitalizing transaction-related costs of $3.2 million. The $3.2 million in transaction related costs consisted of investment banker, legal and accounting fees.
The value attributed to the Warrants was $7.6 million and was estimated as of August 24, 2009 using the Black-Scholes option pricing model with the assumptions of an expected volatility of 62.5%, expected term of five years, no expected dividends and a risk free interest rate of 2.5%. The expected volatility is based on a blend of the volatility of the Company’s peer group in the industry in which it does business and the Company’s historical volatility. The expected term is five years which is equal to the life of the Warrants. The risk free interest rate is the yield on zero-coupon U.S. treasury securities for a period that is commensurate with the expected term assumption.
71
Table of Contents
Assuming the exercise of the Warrants and the shares outstanding as of January 3, 2010, the Tallwood Investors would own 51% of the Company’s outstanding common stock post closing. However, through the Stockholder Agreement between the Company and the Tallwood Investors dated April 21, 2009, the Tallwood Investors have agreed (a) to vote for all non-Tallwood directors in the same proportion as other stockholders of the Company; (b) that to the extent they hold shares in excess of 35% of the total outstanding common stock, they will vote the excess shares in the same proportion as shares voted by non-Tallwood stockholders; and (c) for certain matters requiring a separate vote of the stockholders who control the single Series A Preferred share issued to the Tallwood Investors, they will delegate their proxy to vote those shares to the non-Tallwood directors.
In November 2010 Tallwood participated in the Company’s stock issuance (see Note 12 below) and purchased an additional 5.6 million shares. Assuming the exercise of the Warrants and the shares outstanding as of January 2, 2011, the Tallwood Investors would own 49% of the Company’s outstanding common stock post closing. Subsequent to this purchase, the voting restrictions discussed in the prior paragraph still remain in effect.
Note 12 – Equity Plans and Related Equity Activity
Common Stock Issuance
On October 25, 2010, the Company filed with the SEC a shelf registration statement on Form S-3 which was declared effective on November 1, 2010. Under this registration statement the Company may offer and sell from time to time in one or more public offerings up to $30.0 million of common stock and warrants or any combination thereof. In November and December 2010, we sold a total of 12.8 million shares of our common stock resulting in net proceeds of $12.5 million after deducting underwriting discount and offering expenses of $1.0 million.
Common Stock Reserved
As of January 2, 2011, the Company has reserved 18.4 million shares of common stock for future issuance under its various stock plans.
1999 Stock Plan
In September 1999, the Company adopted the 1999 Stock Plan (1999 Plan). Options under the 1999 Plan were granted at a price equal to the fair market value of the stock at the date of grant, as determined by the Board of Directors and terminate ten years after the date of grant. Upon completion of the Company’s initial public offering, the 1999 Plan was terminated and no shares are available for future issuance under the 1999 Plan. As of January 2, 2011, the Company had 0.2 million options outstanding under the 1999 Plan.
2004 Equity Incentive Plan
In September 2005, the Company adopted the 2004 Equity Incentive Plan (2004 Plan) upon the closing of its initial public offering. The 2004 Plan allows for the issuance of incentive and nonqualified stock options, restricted stock, restricted stock units, stock appreciation rights, deferred stock units, performance units and performance shares to the Company’s employees, directors and consultants. Options generally vest over four years at a rate of 25% on the first anniversary of the grant date and 6.25% quarterly thereafter. Generally, options terminate seven years after the date of grant and are non-statutory stock options. Restricted stock units represent the right to receive shares of common stock in the future, with the right to future delivery of the shares subject to a risk of forfeiture or other restrictions that will lapse upon satisfaction of specified conditions. Awards of restricted stock units general vest over a four year period.
The 2004 Plan provides for the automatic grant of non-statutory stock options to our non-employee directors. Each non-employee director appointed to the board will receive an initial option to purchase 45,000 shares upon such appointment except for those directors who become non-employee directors by ceasing to be employee directors. Initial option grants shall vest at the rate of one third of the shares on the first anniversary of the date of grant and as to 1/12th of the shares each quarter thereafter, subject to the director continuing to serve as a director on each vesting date. In addition, non-employee directors will receive a subsequent option to purchase shares on the date of each annual meeting of our stockholders at the following rate: 10,000 shares for Board members with one year of service; 15,000 shares for Board members with two years of service; 20,000 shares for board members with three years of service; and 25,000 shares for board members with four or more years of service. These subsequent option grants shall vest as to 1/12th of the shares each month following the date of grant, subject to the director continuing to serve as a director on each vesting date. All options granted under these automatic grant provisions have a term of seven years and an exercise price equal to the fair market value of our common stock on the date of grant.
72
Table of Contents
The 2004 Plan provides for an annual increase to the shares authorized under the plan on the first day of the Company’s fiscal year beginning in 2006, equal to the least of (i) 4.4% of the Company’s outstanding shares of common stock on such date, (ii) 3.0 million shares or (iii) an amount determined by the Board of the Directors. The shares may be authorized, but unissued or reacquired common stock. In addition, in August 2009, our stockholders approved an amendment and restatement of the 2004 Plan and increased the number of shares reserved for issuance under the 2004 Plan by 5.5 million shares in connection with the BBA acquisition. As of January 2, 2011, the Company had 10.8 million options and awards outstanding and 4.7 million options and awards available for future grant under the 2004 plan.
2004 Employee Stock Purchase Plan
In September 2005, the Company adopted the 2004 Employee Stock Purchase Plan (ESPP), upon the closing of its initial public offering. As of January 2, 2011, the Company had 2.6 million shares available for grant under the ESPP. All of the Company’s employees, with the exception of employees located in China, are eligible to participate if they are employed by Ikanos or any participating subsidiary for at least 20 hours per week. The Company’s 2004 ESPP is intended to qualify under Section 423 of the Internal Revenue Code and provides for consecutive, overlapping 24-month offering periods. Each offering period includes four 6-month purchase periods. The offering periods generally start on the first trading day on or after May 1 and November 1 of each year. On the first day of the Company’s fiscal year starting in 2005 and ending in 2014, the number of authorized shares under the ESPP will be increased by the lesser of (i) 2.5% of the Company’s outstanding shares of common stock on such date, (ii) 1.5 million shares or (iii) an amount determined by the Board of the Directors.
Doradus 2004 Amended and Restated Stock Option Plan
In August 2006, in connection with Doradus acquisition, the Company assumed Doradus’ 2004 Amended and Restated Stock Option Plan (Doradus Plan). Each unvested option to acquire shares of Doradus common stock outstanding under the Doradus Plan immediately prior to the closing date was converted into the right to acquire 0.079365 shares of Ikanos common stock. As of January 2, 2011, the Company has reserved no shares of its common stock for options outstanding and approximately 0.1 million shares for future issuance. Options granted under the Doradus Plan may be incentive stock options or non-statutory stock options. Options generally vest at a rate of 25% on the first anniversary of the grant date and 1/12th per quarter thereafter and terminate ten years after the date of grant.
Performance Stock Option Agreement for John H. Quigley
In addition to the 600,000 stock options previously granted to Mr. Quigley, in October 2010 the Company granted him an additional 300,000 stock options in connection with his promotion to Chief Executive Officer,. The grant will have a one year vesting schedule that begins upon exceeding certain stock price goals for a period of twenty consecutive days: 100,000 shares begin vesting at a $3.00 average closing price; 100,000 shares begin vesting at a $4.00 average closing stock price and 100,000 shares begin vesting at a $5.00 average closing stock price. The shares will vest in equal quarterly installments over the one year vesting period. The strike price is $1.21 per share, the fair market value of the stock price at the grant date. The term of the grant is ten years. Vesting and price targets are subject to change of control conditions. Mr. Quigley’s options were valued using the Monte Carlo model to simulate future stock price movements in order to determine the fair values of a performance option grant. The simulations account for the vesting and exercise provisions of the grant.
Stock-Based Compensation
Stock-based compensation expense related to all stock-based compensation awards was $3.4 million, $5.9 million, and $10.5 million for the years ended January 2, 2011, January 3, 2010, and December 28, 2008, respectively.
As of January 2, 2011, there was $8.4 million of total unrecognized stock-based compensation expense related to unvested share-based compensation arrangements. That expense is expected to be recognized over a weighted-average period of 3.2 years
73
Table of Contents
Summary of Assumptions for Stock Options and ESPP
The fair value of each option award is estimated on the date of grant using the Black-Scholes option pricing model that uses the assumptions noted in the following table.
| 2010 | 2009 | 2008 | ||||||||||
| Option Grants: |
||||||||||||
| Expected volatility |
62-66 | % | 61-70 | % | 61-65 | % | ||||||
| Expected dividends |
— | — | — | |||||||||
| Expected term of options (in years) |
3.3-4.6 | 4.3-5.3 | 4.5-6.1 | |||||||||
| Risk-free interest rate |
1.0-2.4 | % | 2.0-2.3 | % | 2.7-3.8 | % | ||||||
| ESPP: |
||||||||||||
| Expected volatility |
60-85 | % | 62-85 | % | 42-75 | % | ||||||
| Expected dividends |
— | — | — | |||||||||
| Expected term of ESPP (in years) |
0.5-2.0 | 0.5-2.0 | 0.5-2.0 | |||||||||
| Risk-free interest rate |
0.2-1.1 | % | 0.2-1.5 | % | 1.1-3.9 | % | ||||||
Expected volatility: The expected volatility is based on a blend of the volatility of the Company’s peer group in the industry in which it does business and the Company’s historical volatility.
Expected term: The expected term is based on several factors including historical observations of employee exercise patterns during the Company’s history, peer company employee exercise behavior and expectations of employee exercise behavior in the future giving consideration to the contractual terms of the stock-based awards. The expected term of options granted is derived from the average midpoint between vesting and the contractual term.
Risk-free interest rate: The yield on zero-coupon U.S. treasury securities for a period that is commensurate with the expected term assumption for each group of employees is used as the risk-free interest rate.
Pre-vesting forfeitures: Estimates of pre-vesting option forfeitures are based on Company experience and industry trends. The Company will adjust its estimate of forfeitures over the requisite service period based on the extent to which actual forfeitures differ.
Equity Plan Activity
A summary of option activity is presented below (in thousands, except per share):
| Shares | Weighted- Average Exercise Price |
Weighted- Average Remaining Contractual Term (Years) |
Aggregate Intrinsic Value |
|||||||||||||
| Outstanding at January 3, 2010 |
1,095 | $ | 5.30 | |||||||||||||
| Granted |
7,476 | 1.60 | ||||||||||||||
| Exercised |
(238 | ) | 1.38 | |||||||||||||
| Forfeited or expired |
(5,139 | ) | 2.34 | |||||||||||||
| Outstanding at January 2, 2011 |
10,869 | $ | 1.83 | 5.86 | $ | 777 | ||||||||||
| Exercisable at January 2, 2011 |
2,093 | $ | 2.93 | 3.54 | $ | 60 | ||||||||||
The weighted average grant date fair value of options granted during the years ended January 2, 2011, January 3, 2010, and December 28, 2008 was $0.85, $0.86, and $1.68, respectively. The total intrinsic value of options exercised during the years ended January 2, 2011, January 3, 2010, and December 28, 2008 was $0.3 million, insignificant and $0.6 million, respectively.
74
Table of Contents
The following table summarizes information about stock options as of January 2, 2011 (in thousands, except per share):
| Options Outstanding | Options Exercisable | |||||||||||||||||||
| Range of Exercise Prices |
Number of Options |
Weighted- Average Remaining Contractual Term (Years) |
Weighted Average Exercise Price per Share |
Number of Options |
Weighted Average Exercise Price per Share |
|||||||||||||||
| $0.48 to $1.16 |
396 | 5.5 | $ | 0.95 | 71 | $ | 0.48 | |||||||||||||
| $1.18 to $1.18 |
3,514 | 6.7 | 1.18 | — | — | |||||||||||||||
| $1.19 to $1.74 |
1,337 | 6.8 | 1.51 | 57 | 1.64 | |||||||||||||||
| $1.77 to $18.36 |
5,622 | 5.2 | 2.38 | 1,965 | 3.05 | |||||||||||||||
| 10,869 | 5.9 | 1.83 | 2,093 | 2.93 | ||||||||||||||||
Restricted Stock Units
A summary of our restricted stock unit activity is presented below (in thousands):
| Shares | Weighted- Average Grant Date Fair Value Per Share |
|||||||
| Restricted stock units outstanding at January 3, 2010 |
499 | $ | 2.73 | |||||
| Granted |
7 | 2.54 | ||||||
| Vested |
(185 | ) | 4.88 | |||||
| Forfeited |
(206 | ) | 1.98 | |||||
| Restricted stock units outstanding at January 2, 2011 |
115 | 1.82 | ||||||
The weighted average grant date fair value per restricted stock units granted was $2.54, $1.71, and $4.23 during the years ended January 2, 2011, January 3, 2010, and December 28, 2008, respectively. The total fair values of restricted stock units that vested were $0.9 million, $4.0 million, and $7.1 million during the years ended January 2, 2011, January 3, 2010, and December 28, 2008, respectively. The restricted stock units have one to four years vesting terms and are scheduled to vest through 2014. Tax related withholdings of restricted stock units totaled $0.1 million, $1.1 million, and $0.9 million during the years ended January 2, 2011, January 3, 2010, and December 28, 2008, respectively.
Restricted Stock
A summary of restricted stock activity is presented below (in thousands):
| Shares | Weighted- Average Grant Date Fair Value Per Share |
|||||||
| Restricted stock outstanding at January 3, 2010 |
833 | $ | 1.68 | |||||
| Granted |
60 | 1.50 | ||||||
| Vested |
(169 | ) | 1.63 | |||||
| Restricted stock outstanding at January 2, 2011 |
724 | 1.67 | ||||||
The total fair value of restricted stock that vested was $0.3 million, $0.5 million and $0.6 million during the years ended January 2, 2011, January 3, 2010, and December 28, 2008, respectively. The restricted stock has three years vesting terms and is scheduled to vest through 2013.
Stock Appreciation Rights
In September 2009, the Company granted 400,000 stock appreciation rights (SARs) to Michael Gulett, the Company’s President and Chief Executive Officer. This is the first instance in which the Company has granted SARs to an officer of the Company.
The SAR grant to Mr. Gulett will have a one year vesting schedule that begins when the Company’s common stock exceeds certain stock price goals for a period of 20 consecutive trading days. Specifically, 25% will begin vesting at each of the 20-day average closing price of $3.54, $5.31, $7.08 and $8.85. The SARs that begin vesting upon the triggering of each stock price goal will vest in equal quarterly installments over the one year after that stock price goal is achieved.
75
Table of Contents
The exercise price is $1.77 per share, which was the closing price of Ikanos Common Stock on August 24, 2009, the closing date of the transaction in which the Company completed the acquisition of the BBA product line. The closing price of Ikanos Common Stock on September 11, 2009, the last trading day before the date of the SARs grant, was $1.70 per share.
The fair value of the SARs was estimated on the date of grant using the Monte-Carlo Simulation model with the assumptions of an expected volatility of 64.3%, expected term of seven years, no expected dividends, a risk free interest rate of 2.9%, that exercise of vested SARs occur uniformly on the interval of the vesting date and that the future stock price paths has been simulated by pulling a “Random Draw” from a uniform distribution on the interval of [0, 1]. The weighted average grant date fair value of the SARS was $0.90. No SARs vested during fiscal 2009 or 2010. The grant was cancelled in fiscal 2010 due to his termination.
Disclosures Pertaining to All Stock-Based Award Plans
Cash received from option exercises and ESPP contributions under all share-based payment arrangements was $1.2 million, $0.5 million and $0.5 million for the years ended January 2, 2011, January 3, 2010, and December 28, 2008, respectively. The Company has maintained a full valuation allowance on its deferred tax assets since inception and has not been recognizing excess tax benefits from share-based awards. The Company does not anticipate recognizing excess tax benefits from stock-based payments for the foreseeable future, and the Company believes it would be reasonable to exclude such benefits from deferred tax assets and net loss per common share calculations. Accordingly, the Company did not realize any tax benefits from tax deductions related to share-based payment awards during the years ended January 2, 2011, January 3, 2010, and December 28, 2008.
Note 13 – Employee Benefit Plans
The Company has a retirement savings plan, which qualifies as a deferred savings plan under section 401(k) of the Internal Revenue Code. All U.S employees are eligible to participate in the savings plan and allowed to contribute up to 60% of their total compensation, not to exceed the maximum amount allowed by the applicable statutory prescribed limit. The Company is not required to contribute, nor has it contributed, to the savings plan for any of the periods presented.
Note 14 – Commitments and Contingencies
Lease Obligations
The Company leases office facilities, equipment and software under non-cancelable operating leases with various expiration dates through 2014. Rent expense for the years ended January 2, 2011, January 3, 2010 and December 28, 2008 was $2.9 million, $2.0 million, and $1.4 million, respectively. The terms of the facility leases provide for rental payments on a graduated scale. The Company recognizes rent expense on a straight-line basis over the lease period, and has accrued for rent expense incurred, but not paid.
Future minimum lease payments as of January 3, 2010 under non-cancelable leases with original terms in excess of one year are $2.7 million in 2011; $1.3 million in 2012; $1.2 million in 2013; $1.0 million in 2014 and $0.6 million in 2015 and thereafter.
Indemnities, Commitments and Guarantees
During its normal course of business, the Company has made certain indemnities, commitments and guarantees under which it may be required to make payments in relation to certain transactions. These indemnities include intellectual property indemnities to the Company’s customers in connection with the sales of its products, indemnities for liabilities associated with the infringement of other parties’ technology based upon the Company’s products, and indemnities to various lessors in connection with facility leases for certain claims arising from such facility or lease. The duration of these indemnities, commitments and guarantees varies, and in certain cases, is indefinite. The majority of these indemnities, commitments and guarantees do not provide for any limitation of the maximum potential future payments that the Company could be obligated to make. The Company believes its internal development processes and other policies and practices limit its exposure related to the indemnification provisions of the various agreements that include indemnity provisions. In addition, the Company requires its employees to sign a proprietary information and inventions agreement, which assigns the rights to its employees’ development work to the Company. The Company has not recorded any liability for these indemnities, commitments and
76
Table of Contents
guarantees in the accompanying consolidated balance sheets. The Company does, however, accrue for losses for any known contingent liability, including those that may arise from indemnification provisions, when future payment is probable and the amount of the loss can be reasonably estimated, in accordance with authoritative guidance.
In addition, the Company indemnifies its officers and directors under the terms of indemnity agreements entered into with them, as well as pursuant to its certificate of incorporation, bylaws and applicable Delaware law. To date, the Company has not incurred any expenses related to these indemnifications.
Litigation
In November 2006, three putative class action lawsuits were filed in the United States District Court for the Southern District of New York against the Company, its directors and two former executive officers, as well as the lead underwriters for its initial and secondary public offerings. The lawsuits were consolidated and an amended complaint was filed on April 24, 2007. The amended complaint sought unspecified damages for certain alleged misrepresentations and omissions made by the Company in connection with both its initial public offering in September 2005 and its follow-on offering in March 2006. On June 25, 2007, the Company filed motions to dismiss the amended complaint, and on March 10, 2008, the Court dismissed the case with prejudice. On March 25, 2008, plaintiffs filed a motion for reconsideration, and on June 12, 2008, the District Court denied the motion for reconsideration. On October 15, 2008, plaintiffs appealed the District Court’s dismissal of the amended complaint and denial of its motion for reconsideration to the United States Court of Appeals for the Second Circuit. On September 17, 2009, the Court of Appeals affirmed the District Court’s dismissal of the amended complaint, but vacated its judgment on the motion for reconsideration and remanded the case to the District Court for further proceedings. On May 13, 2010, the District Court granted plaintiffs leave to file a motion to amend the pleadings. Plaintiffs filed a motion for leave to amend the complaint on June 11, 2010. We opposed on July 11, 2010, and on November 23, 2010, the District Court denied the motion. On January 6, 2011, plaintiffs filed a notice of appeal with the United States Court of Appeals for the Second Circuit. A briefing schedule for the appeal has not yet been scheduled. The Company cannot predict the likely outcome of the appeal, and an adverse result in the litigation could have a material effect on its financial statements.
Additionally, from time to time, the Company is a party to various legal proceedings and claims arising from the normal course of business activities. Based on current available information, the Company does not expect that the ultimate outcome of any currently pending unresolved matters, individually or in the aggregate, will have a material adverse effect on its financial position, results of operations or cash flows.
Note 15 – Income Taxes
The components of loss before provisions for income taxes are as follows (in thousands):
| Year Ended | ||||||||||||
| January 2, 2011 |
January 3, 2010 |
December 28, 2008 |
||||||||||
| United States |
$ | (10,853 | ) | $ | (5,480 | ) | $ | (41,701) | ||||
| Foreign |
(39,291 | ) | (31,463 | ) | 808 | |||||||
| $ | (50,144 | ) | $ | (36,943 | ) | $ | (40,893 | ) | ||||
The provision for income taxes consists of Federal, state minimum taxes and foreign taxes as follows (in thousands):
| Year Ended | ||||||||||||
| January 2, 2011 |
January 3, 2010 |
December 28, 2008 |
||||||||||
| Current : |
||||||||||||
| Federal |
$ | (11 | ) | $ | (57 | ) | $ | 48 | ||||
| State and local |
5 | 2 | 2 | |||||||||
| Foreign |
(116 | ) | 639 | 170 | ||||||||
| (122 | ) | 584 | 220 | |||||||||
| Deferred—Foreign |
(259 | ) | (426 | ) | — | |||||||
| $ | (381 | ) | $ | 158 | $ | 220 | ||||||
77
Table of Contents
The reconciliation between the provision for (benefit from) income taxes computed by applying the US federal tax rate to income (loss) before income taxes and the actual provision for income taxes is as follows:
| Year Ended | ||||||||||||
| January 2, 2011 |
January 3, 2010 |
December 28, 2008 |
||||||||||
| Provision (benefit) at statutory rate |
(35 | )% | (35 | )% | (35 | )% | ||||||
| Difference between statutory rate and foreign effective rate |
27 | 30 | — | |||||||||
| Change in valuation allowance |
8 | 17 | 34 | |||||||||
| Gain from sale of inventory to foreign subsidiaries |
2 | (7 | ) | — | ||||||||
| Licensing technology to foreign subsidiaries |
— | (6 | ) | — | ||||||||
| Stock-based compensation |
1 | 6 | 2 | |||||||||
| Tax credits |
(2 | ) | — | — | ||||||||
| Non-deductible expenses |
— | (4 | ) | — | ||||||||
| 1 | % | 1 | % | 1 | % | |||||||
Deferred income taxes reflect the effects of temporary differences between the carrying value of assets and liabilities for financial reporting purposes and the amounts for income tax purposes. Significant components of our deferred tax assets are as follows (in thousands):
| Year Ended | ||||||||
| January 2, 2011 |
January 3, 2010 |
|||||||
| Deferred tax assets : |
||||||||
| Net operating loss carry forwards |
$ | 2,556 | $ | 346 | ||||
| Depreciation and amortization |
649 | 336 | ||||||
| Research and development and other credits |
1,261 | 226 | ||||||
| Accrued reserves and other |
2,816 | 3,673 | ||||||
| Stock-based compensation |
2,533 | 2,724 | ||||||
| Acquired intangibles |
5,808 | 4,312 | ||||||
| 15,623 | 11,617 | |||||||
| Valuation allowance |
(14,937 | ) | (11,191 | ) | ||||
| $ | 686 | $ | 426 | |||||
Realization of deferred tax assets is dependent upon future taxable earnings, the timing and amount of which are uncertain. Due to cumulative losses in earlier years and continued significant amount of loss in most recent year, management believes that it is more likely than not that the deferred tax assets will not be realizable in future periods. The valuation allowance for deferred tax assets increased marginally by $3.7 million as of January 2, 2011 versus an increase of $0.4 million as of January 3, 2010.
As of January 2, 2011, the Company had net operating loss carryforwards for federal and state of California tax purposes of $4.7 million and $15.0 million respectively. The net operating loss carryforwards will begin to expire beginning in 2030 for federal and 2032 for California, if not utilized. The Company has research and development tax credits of approximately $1.1 million and $0.2 million for federal and California income tax purposes, respectively. If not utilized, the federal credit carry forward will begin to expire in 2030. The California credit can be carried forward indefinitely.
The Company has elected to track the portion of its federal and state net operating loss carry forwards attributable to stock option benefits, in a separate memo account pursuant to ASC 718. Therefore, these amounts are no longer included in the Company gross or net deferred tax assets. Pursuant to ASC 718, the benefit of these net operating loss carryforwards will only be recorded to equity when they reduce cash taxes payable. The cumulative amounts recorded in the memorandum account as of January 2, 2011 are not material for both federal and state tax purposes.
Federal income taxes have not been provided for on a portion of the unremitted earnings of foreign subsidiaries because such earnings are intended to be permanently reinvested. The amount of unremitted earnings as of January 2, 2011 is approximately $7.0 million.
The Company’s Indian subsidiary operates in two locations, one in Bangalore and the other in Noida. The Bangalore unit enjoys a special tax holiday under provisions of Section 10A of the Indian Income Tax Act, 1961; and this tax exemption is available until March 31, 2011 under the existing provisions of the Act. The Noida unit does not enjoy this tax exemption and its net income will be taxed at the current rate of 33.22%
78
Table of Contents
The Company adopted the provisions of ASC 740 as of January 1, 2007. A reconciliation of the beginning and ending amount of unrecognized tax benefits is as follows (in thousands):
| 2010 | 2009 | 2008 | ||||||||||
| Balance at beginning of year |
$ | 109 | $ | 3,900 | $ | 3,800 | ||||||
| Changes for tax positions of prior years |
65 | (3,800 | ) | 100 | ||||||||
| Additions for tax positions of prior years |
4 | 9 | — | |||||||||
| Balance at end of year |
$ | 178 | $ | 109 | $ | 3,900 | ||||||
The Company has adopted the accounting policy that interest and penalties will be classified within the provision for income taxes. Amounts of accrued interest and penalty recorded were not material as of January 2, 2011.
The Company does not anticipate any significant changes to the liability for unrecognized tax benefits within twelve months of this reporting date of its unrecognized tax benefits.
The Company’s operations are subject to income and transaction taxes in the United States and in multiple foreign jurisdictions. Significant estimates and judgments are required in determining the Company’s worldwide provision for income taxes. Some of these estimates are based on interpretations of existing tax laws or regulations. The ultimate amount of tax liability may be uncertain as a result. All of the unrecognized tax benefit is related to gross deferred tax assets, and accordingly, if and when recognized, would not result in a change in Company’s effective tax rate due to the existence of a full valuation allowance.
The Company is subject to taxation in the US and various states and foreign jurisdictions. There are no ongoing examinations by income taxing authorities at this time. The Company’s tax years starting from 1999 to 2010 remain open in various tax jurisdictions.
The Company is in the process of expanding its international operations and staff to better support its expansion into international markets. This expansion includes the implementation of an international structure that includes, among other things, certain licenses and other contractual arrangements between the Company and its wholly-owned foreign subsidiaries. Its foreign subsidiaries have acquired certain rights to sell the existing intellectual property and intellectual property that will be developed or licensed in the future. The existing rights were transferred for an initial payment. As a result of these changes and an expanding customer base in Asia, the Company expects that an increasing percentage of its consolidated pre-tax income will be derived from, and reinvested in, its Asian operations. The Company anticipates that this pre-tax income will be subject to foreign tax at relatively lower tax rates when compared to the United States federal statutory tax rate and as a consequence, its effective income tax rate is expected to be lower than the United States federal statutory rate.
Note 16 – Significant Customer Information and Segment Reporting
In ASC 280, the FASB establishes standards for the manner in which public companies report information about operating segments in annual and interim financial statements. It also establishes standards for related disclosures about products and services, geographic areas and major customers. The method for determining the information to report is based on the way management organizes the operating segments within the Company for making operating decisions and assessing financial performance.
The Company’s chief operating decision-maker is considered to be the Chief Executive Officer. The Chief Executive Officer reviews financial information presented on a consolidated basis, accompanied by disaggregated information about revenue by geographic region for purposes of making operating decisions and assessing financial performance. On this basis, the Company is organized and operates in a single segment: the design, development, marketing and sale of semiconductors.
79
Table of Contents
The following table summarizes revenue by geographic region, based on the country in which the customer headquarters office is located (in thousands):
| January 2, 2011 |
January 3, 2010 |
December28, 2008 |
||||||||||||||||||||||
| China |
$ | 53,560 | 28 | % | $ | 20,165 | 15 | % | $ | 1,149 | 1 | % | ||||||||||||
| Japan |
29,833 | 16 | 30,328 | 23 | 51,361 | 48 | ||||||||||||||||||
| France |
46,442 | 24 | 27,625 | 21 | 25,239 | 24 | ||||||||||||||||||
| United States |
4,672 | 2 | 10,740 | 8 | 8,420 | 8 | ||||||||||||||||||
| Other |
57,170 | 30 | 41,830 | 33 | 20,336 | 19 | ||||||||||||||||||
| $ | 191,677 | 100 | % | $ | 130,688 | 100 | % | $ | 106,505 | 100 | % | |||||||||||||
The Company divides its products into three product families: Broadband DSL, Communications Processors and Other. Broadband DSL consists of the Company’s central office products, DSL modem-only customer premise equipment products and the DSL value of the Company’s integrated devices. Communications Processors includes the Company’s stand alone processors and the processor-only value of the Company’s integrated devices. Other includes products that do not fall into the other two segments. Revenue by product family is as follows (in thousands):
| January 2, 2011 |
January 3, 2010 |
December 28, 2008 |
||||||||||||||||||||||
| Broadband DSL |
$ | 115,723 | 60 | % | $ | 86,126 | 66 | % | $ | 89,374 | 84 | % | ||||||||||||
| Communication Processors |
45,129 | 24 | 35,701 | 27 | 17,131 | 16 | ||||||||||||||||||
| Other |
30,825 | 16 | 8,861 | 7 | — | — | ||||||||||||||||||
| $ | 191,677 | 100 | % | $ | 130,688 | 100 | % | $ | 106,505 | 100 | % | |||||||||||||
The distribution of long-lived assets (excluding goodwill, intangible assets and other assets) was as follows (in thousands):
| January 2, 2011 |
January 3, 2010 |
|||||||
| United States |
$ | 6,295 | $ | 4,881 | ||||
| Asia, predominantly India |
1,914 | 2,531 | ||||||
| Other |
5 | 90 | ||||||
| $ | 8,214 | $ | 7,502 | |||||
Note 17 – Subsequent Event
On February 11, 2011, the Company completed a loan and security agreement which provides for a $15.0 million senior secured revolving credit facility under which the Company may borrow or have the bank issue letters of credit up to 80% of eligible accounts receivable at any time until February 11, 2013. Loans made under the Agreement will bear interest either at the bank prime plus 150 basis points or LIBOR plus 350 basis points, subject to certain adjustments. The Company has paid a non-refundable commitment fee of $75 thousand and has agreed to pay a fee in an amount equal to 0.5% per year of the average unused portion of the line of credit. The Company’s obligations under the Loan Agreement will be secured by a lien on substantially all the company’s tangible and intangible assets, subject to certain exceptions.
80
Table of Contents
SUPPLEMENTARY FINANCIAL DATA
Quarterly Financial Information (Unaudited)
(In thousands)
| Three Months Ended | ||||||||||||||||||||||||||||||||
| March 29, 2009 |
June 28, 2009 |
Sept. 27, 2009 |
Jan. 3, 2010 |
April 4 2010 |
July 4, 2010 |
October 3, 2010 |
Jan. 2, 2011 |
|||||||||||||||||||||||||
| Revenue |
$ | 20,734 | $ | 22,429 | $ | 29,334 | $ | 58,191 | $ | 57,383 | $ | 55,615 | $ | 41,536 | $ | 37,143 | ||||||||||||||||
| Cost of revenue (a) |
12,254 | 13,139 | 19,036 | 40,590 | 35,438 | 42,456 | 28,575 | 20,223 | ||||||||||||||||||||||||
| Gross margin |
8,480 | 9,290 | 10,298 | 17,601 | 21,945 | 13,159 | 12,961 | 16,920 | ||||||||||||||||||||||||
| Operating expenses: |
||||||||||||||||||||||||||||||||
| Research and development |
8,863 | 9,591 | 13,290 | 18,061 | 17,072 | 16,144 | 14,757 | 12,796 | ||||||||||||||||||||||||
| Selling, general and administrative |
5,638 | 6,042 | 9,615 | 9,679 | 7,787 | 7,691 | 6,467 | 5,294 | ||||||||||||||||||||||||
| Asset impairments |
— | — | 2,460 | — | — | — | 21,378 | — | ||||||||||||||||||||||||
| Restructuring charges |
267 | 279 | 502 | 290 | 1,483 | — | 3,757 | 554 | ||||||||||||||||||||||||
| Total operating expenses |
14,768 | 15,912 | 25,867 | 28,030 | 26,342 | 23,835 | 46,359 | 18,644 | ||||||||||||||||||||||||
| Loss from operations |
(6,288 | ) | (6,622 | ) | (15,569 | ) | (10,429 | ) | (4,397 | ) | (10,676 | ) | (33,398 | ) | (1,724 | ) | ||||||||||||||||
| Investment gain |
— | — | — | 1,238 | — | — | — | — | ||||||||||||||||||||||||
| Interest income, net |
237 | 220 | 146 | 124 | 62 | (7 | ) | 8 | (12 | ) | ||||||||||||||||||||||
| Loss before provision for income taxes |
(6,051 | ) | (6,402 | ) | (15,423 | ) | (9,067 | ) | (4,335 | ) | (10,683 | ) | (33,390 | ) | (1,736 | ) | ||||||||||||||||
| Provision for (benefit from) income taxes |
37 | 43 | 31 | 47 | 68 | 42 | (129 | ) | (362 | ) | ||||||||||||||||||||||
| Net loss |
$ | (6,088 | ) | $ | (6,445 | ) | $ | (15,454 | ) | $ | (9,114 | ) | $ | (4,403 | ) | $ | (10,725 | ) | $ | (33,261 | ) | $ | (1,374 | ) | ||||||||
| Basic and diluted net loss per share: |
$ | (0.21 | ) | $ | (0.22 | ) | $ | (0.40 | ) | $ | (0.17 | ) | $ | (0.08 | ) | $ | (0.20 | ) | $ | (0.61 | ) | $ | (0.02 | ) | ||||||||
| Weighted average number of shares (basic and diluted) |
29,094 | 29,397 | 38,802 | 53,883 | 54,063 | 54,511 | 54,904 | 63,025 | ||||||||||||||||||||||||
| (a) | The cost of revenue for the quarter ended January 2, 2011 includes a net adjustment of $0.8 million primarily related to certain overhead charges that were not expensed in the associated 2010 quarters when their related capitalized inventory was written down. The net adjustment was not material to our consolidated financial statements as issued on our previously filed quarterly reports on Form 10-Q and had no impact on our fiscal 2010 annual results. |
81
Table of Contents
| ITEM 9. | CHANGES IN AND DISAGREEMENTS WITH ACCOUNTANTS ON ACCOUNTING AND FINANCIAL DISCLOSURE |
None.
| ITEM 9A. | CONTROLS AND PROCEDURES |
Evaluation of Disclosure Controls and Procedures
Under the supervision and with the participation of our management, including our Chief Executive Officer and Chief Financial Officer, we have evaluated the effectiveness of the design and operation of our disclosure controls and procedures (as defined in Exchange Act Rule 13a-15(e)) as of the end of the period covered by this annual report on Form 10-K. Based on this evaluation, our Chief Executive Officer and Chief Financial Officer concluded these disclosure controls and procedures are effective to ensure that information we are required to disclose in reports that we file or submit under the Exchange Act (i) is recorded, processed, summarized and reported within the time periods specified in SEC rules and forms, and (ii) is accumulated and communicated to our management, including our Chief Executive Officer and our Chief Financial Officer, as appropriate to allow timely decisions regarding required disclosure.
Management’s Report on Internal Control Over Financial Reporting
Our management is responsible for establishing and maintaining adequate internal control over financial reporting for Ikanos. Ikanos’ internal control over financial reporting is designed to provide reasonable assurance regarding the reliability of financial reporting and the fair presentation of published financial statements for external purposes in accordance with GAAP. There are inherent limitations in the effectiveness of any internal control, including the possibility of human error and the circumvention or overriding of controls. Accordingly, even effective internal controls can provide only reasonable assurances with respect to financial statement preparation. Further, because of changes in conditions, or that the degree of compliance with policies or procedures may deteriorate, the effectiveness of internal controls may vary over time.
Our management assessed the effectiveness of our internal control over financial reporting as of January 2, 2011. In making this assessment we used the criteria set forth by the Committee of Sponsoring Organizations of the Treadway Commission (COSO) in Internal Control—Integrated Framework. Based on our assessment using those criteria, we concluded that, as of January 2, 2011, our internal control over financial reporting is effective.
The Company’s independent registered public accounting firm, PricewaterhouseCoopers LLP, has issued an attestation report on the Company’s internal control over financial reporting. The report on the audit of internal control over financial reporting appears in Part II, Item 8 of this Form 10-K.
Changes in Internal Control over Financial Reporting
There was no change in our internal control over financial reporting during the fourth quarter ended January 2, 2011 that has materially affected, or is reasonably likely to materially affect, our internal control over financial reporting.
| ITEM 9B. | OTHER INFORMATION |
None.
82
Table of Contents
PART III
Certain information required by Part III is omitted from this annual report on Form 10-K but will be included in the definitive proxy statement that we will file within 120 days after the end of our fiscal year pursuant to Regulation 14A (the Proxy Statement) for our 2011 Annual Meeting of Stockholders, and certain of the information to be included therein is incorporated by reference herein.
| ITEM 10. | DIRECTORS, EXECUTIVE OFFICERS AND CORPORATE GOVERNANCE |
The information regarding our executive officers required by this Item is incorporated by reference from the section entitled “Executive Officers of Registrant” in Part I of this annual report on Form 10-K.
The information regarding our directors, the identification of audit committee members and the audit committee financial expert is incorporated by reference from “Proposal One—Election of Directors” in our Proxy Statement.
The information concerning Section 16(a) reporting is incorporated by reference from “Other Information—Section 16(a) Beneficial Ownership Reporting Compliance” in our Proxy Statement.
Information regarding material changes, if any, to the procedures by which security holders may recommend nominees to our board of directors is incorporated by reference from “Consideration of Stockholder Recommendations and Nominations” in our Proxy Statement.
We have adopted a Code of Business Conduct and Ethics applicable to all our employees. Our Code of Business Conduct and Ethics is available at our investor relations website at www.ikanos.com/investor. Any waiver or amendment to our Code of Business Conduct and Ethics that applies to our Chief Executive Officer, President or Chief Financial Officer and other officers providing financial information, will be disclosed on our website at www.ikanos.com or in a report on Form 8-K filed with the SEC.
| ITEM 11. | EXECUTIVE COMPENSATION |
The information included under the following captions in our Proxy Statement is incorporated herein by reference: Compensation Discussion and Analysis, Summary Compensation Table, Grants of Plan-Based Awards in 2010, Outstanding Equity Awards at 2010 Year End, Option Exercises and Stock Vested in 2010, Nonqualified Deferred Compensation, Potential Payments upon Termination or Change in Control, Director Compensation and Compensation Committee Interlocks and Insider Participation. The information included under the heading Compensation Committee Report in our Proxy Statement is incorporated herein by reference; however, this information shall not be deemed to be “soliciting material” or to be “filed” with the Commission or subject to Regulation 14A or 14C, or to the liabilities of Section 18 of the Exchange Act.
| ITEM 12. | SECURITY OWNERSHIP OF CERTAIN BENEFICIAL OWNERS AND MANAGEMENT AND RELATED STOCKHOLDER MATTERS |
The information regarding stock ownership by principal stockholders and management required by this Item is incorporated by reference from Share Ownership by Principal Stockholders and Management in our Proxy Statement.
Equity Compensation Plan Information
The following table provides information as of January 2, 2011 with respect to common stock that may be issued upon the exercise of equity awards under our Amended and Restated 1999 Stock Option Plan (1999 Plan), Amended and Restated 2004 Equity Incentive Plan (2004 Plan), 2004 Employee Stock Purchase Plan (2004 ESPP) and the Doradus Technologies, Inc. 2004 Amended and Restated Stock Option Plan (Doradus Plan).
83
Table of Contents
| Plan category |
Number of securities to be issued upon exercise of outstanding options, warrants and rights |
Weighted- average exercise price per share of outstanding options, warrants and rights |
Number of securities remaining available for future issuance under equity compensation plans |
|||||||||
| Equity compensation plans approved by security holders (1)(2)(3) |
10,983,785 | $ | 1.83 | 7,262,894 | (4) | |||||||
| Equity compensation plans not approved by security holders |
— | — | 149,215 | (5) | ||||||||
| Total |
10,983,785 | 1.83 | 7,412,109 | |||||||||
| (1) | Includes: (i) shares of common stock issuable upon the exercise of outstanding options grants (subject to vesting) for 10,869,052 shares (ii) shares of common stock issuable upon the vesting of restricted stock units for 114,733 shares. |
| (2) | No further equity awards may be granted under the 1999 Plan, which terminated at the time our initial public offering in September 2005. |
| (3) | The 2004 Plan provides for an annual increase to the shares authorized under the plan on the first day of our fiscal year beginning in 2006, equal to the least of (i) 4.4% of our outstanding shares common stock on such date, (ii) 3.0 million shares, or (iii) an amount determined by the Board of the Directors. |
| The 2004 ESPP provides for an annual increase of the shares authorized under the plan on the first day of our fiscal year starting in 2005 and ending in 2014, the number of authorized shares under the ESPP will be increased by the lesser of (i) 2.5 % of our outstanding shares of common stock on such date, (ii) 1.5 million shares, or (iii) an amount determined by the Board of the Directors. |
| (4) | Includes 4,655,836 shares available for future issuance under the 2004 Plan and 2,607,058 shares available for future issuance under the 2004 ESPP. |
| (5) | Shares available for future issuance under the Doradus Plan. |
Doradus 2004 Amended and Restated Stock Option Plan
Options granted under the Doradus Plan may be incentive stock options or non-statutory stock options. Options generally vest at a rate of 25% on the first anniversary of the grant date and 1/12th per quarter thereafter and terminate ten years after the date of grant. The Doradus Plan will have a term of ten years from the date of adoption, which was in 2004.
| ITEM 13. | CERTAIN RELATIONSHIPS AND RELATED TRANSACTIONS AND DIRECTOR INDEPENDENCE |
The information required by this Item is incorporated by reference to Certain Relationships and Related Transactions in our Proxy Statement. The information regarding director independence is incorporated herein by reference from the subsection entitled Board Independence in the section entitled Proposal 1– Election of Directors in our Proxy Statement.
| ITEM 14. | PRINCIPAL ACCOUNTING FEES AND SERVICES |
The information regarding principal accounting fees and services is incorporated herein by reference from the section entitled Proposal 2—Ratification of Appointment of Independent Registered Public Accounting Firm in our Proxy Statement.
84
Table of Contents
PART IV
| ITEM 15. | EXHIBITS AND FINANCIAL STATEMENT SCHEDULES |
1. Financial Statements: The financial statements are set forth under Part II, Item 8 of this annual report on Form 10-K.
2. Financial statement schedules have been omitted since they are either not required, not applicable, or the information is otherwise included.
The following documents are filed as part of this Report:
3. Exhibits:
| Exhibit Number |
Description | |
| 3.1 | Form of Certificate of Incorporation, as amended, June 16, 2008. Incorporated by reference to Exhibit 3.1 of the Registrant’s Annual Report on Form 10-K filed with the SEC on March 11, 2009 . | |
| 3.2 | Form of Bylaws. Incorporated by reference to Exhibit 3.3 to Amendment No. 1 of the Registrant’s registration statement on Form S-1 dated August 6, 2004 (Registration No. 333-116880). | |
| 4.1 | Form of Registrant’s Common Stock Certificate. Incorporated by reference to Exhibit 4.1 to Amendment No. 1 of the Registrant’s registration statement on Form S-1 dated August 6, 2004 (Registration No. 333-116880). | |
| 10.1* | Form of Indemnification Agreement entered into by Registrant with each of its directors and executive officers. Incorporated by reference to Exhibit 10.1 of the Registrant’s registration statement on Form S-1 dated June 25, 2004 (Registration No. 333-116880). | |
| 10.2* | Amended and Restated 1999 Stock Option Plan and related form agreements there under. Incorporated by reference to Exhibit 10.1 of the Registrant’s Quarterly Report on Form 10-Q filed with the SEC on August 16, 2006. | |
| 10.3* | Amended and Restated 2004 Equity Incentive Plan. Incorporated by reference to the Registrant’s Statement on Form 10-K filed with the SEC on November 11, 2009. | |
| 10.3.1 | Form of Restricted Stock Unit Agreement. Incorporated by reference to Exhibit 10.1 of the Registrant’s current report on Form 8-K filed with the SEC on July 11, 2006. | |
| 10.3.2 | Form of Amended and Restated Stock Option Agreement. Incorporated by reference to Exhibit 10.2 of the Registrant’s current report on Form 8-K filed with the SEC on July 11, 2006. | |
| 10.3.3 | French Sub-Plan for the Grant of Restricted Stock Units. Incorporated by reference to Exhibit 10.3 of the Registrant’s current report on Form 8-K filed with the SEC on July 11, 2006. | |
| 10.3.4 | Form of Restricted Stock Unit Agreement for Employees in France. Incorporated by reference to Exhibit 10.3.1 of the Registrant’s current report on Form 8-K filed with the SEC on July 11, 2006. | |
| 10.3.5 | French Sub-Plan for the Grant of Stock Options. Incorporated by reference to Exhibit 10.4 of the Registrant’s current report on Form 8-K filed with the SEC on July 11, 2006. . | |
| 10.3.6 | Form of Stock Option Agreement for Employees in France. Incorporated by reference to Exhibit 10.4.1 of the Registrant’s current report on Form 8-K filed with the SEC on July 11, 2006. | |
| 10.3.7 | India Sub-Plan. Incorporated by reference to Exhibit 10.5 of the Registrant’s current report on Form 8-K filed with the SEC on July 11, 2006. | |
| 10.3.8 | Form of Restricted Stock Unit Agreement For Employees in India. Incorporated by reference to Exhibit 10.5.1 of the Registrant’s current report on Form 8-K filed with the SEC on July 11, 2006. | |
| 10.3.9 | Form of Stock Option Agreement for Employees in India. Incorporated by reference to Exhibit 10.5.2 of the Registrant’s current report on Form 8-K filed with the SEC on July 11, 2006. | |
| 10.4* | Amended and Restated 2004 Employee Stock Purchase Plan. Incorporated by reference to Exhibit 10.4 to Amendment No. 6 of the Registrant’s registration statement on Form S-1 dated September 1, 2005 (Registration No. 333-116880). | |
85
Table of Contents
| 10.4.1* | 2004 Employee Stock Purchase Plan as amended dated as of October 22, 2008. Incorporated by reference to Exhibit 10.5 of the Registrant’s Quarterly Report on 10-Q filed with the SEC on November 6, 2008. | |
| 10.5 | Lease Agreement, dated as of February 7, 2006, between Registrant and ProLogis, and addendums thereto. Incorporated by reference to Exhibit 10.5 of the Registrant’s annual report on Form 10-K filed with the SEC on February 27, 2006. | |
| 10.7 | Asset Purchase Agreement by and between Ikanos Communications, Inc. and Conexant Systems, Inc. dated as of April 21, 2009. Incorporated by reference to Exhibit 10.1 of the Registrant’s Current Report on Form 8-K filed with the SEC on April 24, 2009. | |
| 10.8 | Entry into a Securities Purchase Agreement by and between Ikanos Communications, Inc. and Tallwood III, L.P., Tallwood III Associates, L.P., Tallwood III Partners, L.P., and Tallwood III Annex, L.P. (collectively, “Tallwood”) dated as of April 21, 2009. Incorporated by reference to Exhibit 10.2 of the Registrant’s Current Report on Form 8-K filed with the SEC on April 24, 2009. | |
| 10.9 | Entry into a Stockholder Agreement by and between Ikanos Communications, Inc. and Tallwood dated as of April 21, 2009. Incorporated by reference to Exhibit 10.3 of the Registrant’s Current Report on Form 8-K filed with the SEC on April 24, 2009. | |
| 10.10* | Separation and Release Agreement with Michael Gulett dated as of April 30, 2010. Incorporated by reference to Exhibit 10.6 of the Registrant’s Quarterly Report on Form 10-Q filed with the SEC on August 11, 2010. | |
| 10.11* | Separation and Release Agreement with Craig Garen dated as of April 1, 2010. Incorporated by reference to Exhibit 10.1 of the Registrant’s Current Report on Form 8-K filed with the SEC on April 2, 2010. | |
| 10.12* | Separation and Release Agreement with Cory J. Sindelar. Incorporated by reference to Exhibit 10.7 of the Registrant’s Quarterly Report on Form 10-Q filed with the SEC on August 11, 2010. | |
| 10.13* | Offer letter with Dennis Bencala dated as of August 2, 2010. Incorporated by reference to Exhibit 10.8 of the Registrant’s Quarterly Report on Form 10-Q filed with the SEC on August 11, 2010. | |
| 10.14* | Offer letter with John Quigley dated as of August 3, 2010. Incorporated by reference to Exhibit 10.9 of the Registrant’s Quarterly Report on Form 10-Q filed with the SEC on August 11, 2010. | |
| 21.1 | Subsidiaries of the Registrant. | |
| 23.1 | Consent of PricewaterhouseCoopers LLP, Independent Registered Public Accounting Firm. | |
| 24.1 | Power of Attorney is herein referenced to the signature page of this annual report on Form 10-K. | |
| 31.1 | Certification of Chief Executive Officer pursuant to Securities Exchange Act Rules 13a-14(a) and 15d-14(a), as adopted pursuant to Section 302 of the Sarbanes-Oxley Act of 2002. | |
| 31.2 | Certification of Chief Financial Officer pursuant to Securities Exchange Act Rules 13a-14(a) and 15d-14(a), as adopted pursuant to Section 302 of the Sarbanes-Oxley Act of 2002. | |
| 32.1 | Certification of Chief Executive Officer and Chief Financial Officer pursuant to 18 U.S.C. Section 1350, as adopted pursuant to Section 906 of the Sarbanes-Oxley Act of 2002. | |
| 32.1 | Certification of Principal Executive Officer and Principal Financial Officer pursuant to 18 U.S.C. Section 1350, as adopted pursuant to Section 906 of the Sarbanes-Oxley Act of 2002. | |
| * | Indicates a management contract or compensatory plan or arrangement. |
TRADEMARKS
Ikanos Communications, Ikanos, the Ikanos logo, the “Bandwidth without boundaries” tagline, Fusiv, Ikanos NodeScale Vectoring, Ikanos Velocity are among the trademarks or registered trademarks of Ikanos Communications, Inc..
86
Table of Contents
Pursuant to the requirements of Section 13 or 15(d) of the Securities Exchange Act of 1934, the registrant has duly caused this report to be signed on its behalf by the undersigned, thereunto duly authorized.
| IKANOS COMMUNICATIONS, INC. | ||||
| March 10, 2011 |
/S/ JOHN H. QUIGLEY | |||
| John H. Quigley President and Chief Executive Officer | ||||
POWER OF ATTORNEY
KNOW ALL PERSONS BY THESE PRESENTS, that each person whose signature appears below constitutes and appoints John H. Quigley and Dennis Bencala, and each of them, his true and lawful attorneys-in-fact and agents, with full power of substitution and resubstitution, to sign any and all amendments (including post-effective amendments) to this annual report on Form 10-K and to file the same, with all exhibits thereto and other documents in connection therewith, with the Securities and Exchange Commission, granting unto each of said attorneys-in-fact and agents, full power and authority to do and perform each and every act and thing requisite and necessary to be done in connection therewith, as fully to all intents and purposes as he or she might or could do in person, hereby ratifying and confirming all that each of said attorneys-in-facts and agents, or his substitute or substitutes, or any of them, shall do or cause to be done by virtue hereof.
Pursuant to the requirements of the Securities Exchange Act of 1934, this report has been signed below by the following persons on behalf of the registrant and in the capacities and on the date indicated.
| Signature |
Title |
Date | ||
| /S/ JOHN H. QUIGLEY John H. Quigley |
President and Chief Executive Officer |
March 10, 2011 | ||
| /S/ DENNIS BENCALA Dennis Bencala |
Chief Financial Officer and Vice President of Finance (Principal Financial and Accounting Officer) |
March 10, 2011 | ||
| /S/ DIOSDADO BANATAO Diosdado Banatao |
Chairman of the Board and Director | March 10, 2011 | ||
| /S/ DANIAL FAIZULLABHOY Danial Faizullabhoy |
Director | March 10, 2011 | ||
| /S/ FREDERICK M. LAX Frederick M. Lax |
Director | March 10, 2011 | ||
| /S/ R. DOUGLAS NORBY R. Douglas Norby |
Director | March 10, 2011 | ||
| /S/ GEORGE PAVLOV George Pavlov |
Director | March 10, 2011 | ||
| /S/ JAMES SMAHA James Smaha |
Director | March 10, 2011 | ||
87
Table of Contents
Exhibit Index
| Exhibit Number |
Description | |
| 3.1 | Form of Certificate of Incorporation, as amended, June 16, 2008. Incorporated by reference to Exhibit 3.1 of the Registrant’s Annual Report on Form 10-K filed with the SEC on March 11, 2009 . | |
| 3.2 | Form of Bylaws. Incorporated by reference to Exhibit 3.3 to Amendment No. 1 of the Registrant’s registration statement on Form S-1 dated August 6, 2004 (Registration No. 333-116880). | |
| 4.1 | Form of Registrant’s Common Stock Certificate. Incorporated by reference to Exhibit 4.1 to Amendment No. 1 of the Registrant’s registration statement on Form S-1 dated August 6, 2004 (Registration No. 333-116880). | |
| 10.1* | Form of Indemnification Agreement entered into by Registrant with each of its directors and executive officers. Incorporated by reference to Exhibit 10.1 of the Registrant’s registration statement on Form S-1 dated June 25, 2004 (Registration No. 333-116880). | |
| 10.2* | Amended and Restated 1999 Stock Option Plan and related form agreements there under. Incorporated by reference to Exhibit 10.1 of the Registrant’s Quarterly Report on Form 10-Q filed with the SEC on August 16, 2006. | |
| 10.3* | Amended and Restated 2004 Equity Incentive Plan. Incorporated by reference to the Registrant’s Statement on Form 10-K filed with the SEC on November 11, 2009. | |
| 10.3.1 | Form of Restricted Stock Unit Agreement. Incorporated by reference to Exhibit 10.1 of the Registrant’s current report on Form 8-K filed with the SEC on July 11, 2006. | |
| 10.3.2 | Form of Amended and Restated Stock Option Agreement. Incorporated by reference to Exhibit 10.2 of the Registrant’s current report on Form 8-K filed with the SEC on July 11, 2006. | |
| 10.3.3 | French Sub-Plan for the Grant of Restricted Stock Units. Incorporated by reference to Exhibit 10.3 of the Registrant’s current report on Form 8-K filed with the SEC on July 11, 2006. | |
| 10.3.4 | Form of Restricted Stock Unit Agreement for Employees in France. Incorporated by reference to Exhibit 10.3.1 of the Registrant’s current report on Form 8-K filed with the SEC on July 11, 2006. | |
| 10.3.5 | French Sub-Plan for the Grant of Stock Options. Incorporated by reference to Exhibit 10.4 of the Registrant’s current report on Form 8-K filed with the SEC on July 11, 2006. . | |
| 10.3.6 | Form of Stock Option Agreement for Employees in France. Incorporated by reference to Exhibit 10.4.1 of the Registrant’s current report on Form 8-K filed with the SEC on July 11, 2006. | |
| 10.3.7 | India Sub-Plan. Incorporated by reference to Exhibit 10.5 of the Registrant’s current report on Form 8-K filed with the SEC on July 11, 2006. | |
| 10.3.8 | Form of Restricted Stock Unit Agreement For Employees in India. Incorporated by reference to Exhibit 10.5.1 of the Registrant’s current report on Form 8-K filed with the SEC on July 11, 2006. | |
| 10.3.9 | Form of Stock Option Agreement for Employees in India. Incorporated by reference to Exhibit 10.5.2 of the Registrant’s current report on Form 8-K filed with the SEC on July 11, 2006. | |
| 10.4* | Amended and Restated 2004 Employee Stock Purchase Plan. Incorporated by reference to Exhibit 10.4 to Amendment No. 6 of the Registrant’s registration statement on Form S-1 dated September 1, 2005 (Registration No. 333-116880). | |
| 10.4.1* | 2004 Employee Stock Purchase Plan as amended dated as of October 22, 2008. Incorporated by reference to Exhibit 10.5 of the Registrant’s Quarterly Report on 10-Q filed with the SEC on November 6, 2008. | |
| 10.5 | Lease Agreement, dated as of February 7, 2006, between Registrant and ProLogis, and addendums thereto. Incorporated by reference to Exhibit 10.5 of the Registrant’s annual report on Form 10-K filed with the SEC on February 27, 2006. | |
| 10.7 | Asset Purchase Agreement by and between Ikanos Communications, Inc. and Conexant Systems, Inc. dated as of April 21, 2009. Incorporated by reference to Exhibit 10.1 of the Registrant’s Current Report on Form 8-K filed with the SEC on April 24, 2009. | |
Table of Contents
| 10.8 | Entry into a Securities Purchase Agreement by and between Ikanos Communications, Inc. and Tallwood III, L.P., Tallwood III Associates, L.P., Tallwood III Partners, L.P., and Tallwood III Annex, L.P. (collectively, “Tallwood”) dated as of April 21, 2009. Incorporated by reference to Exhibit 10.2 of the Registrant’s Current Report on Form 8-K filed with the SEC on April 24, 2009. | |
| 10.9 | Entry into a Stockholder Agreement by and between Ikanos Communications, Inc. and Tallwood dated as of April 21, 2009. Incorporated by reference to Exhibit 10.3 of the Registrant’s Current Report on Form 8-K filed with the SEC on April 24, 2009. | |
| 10.10* | Separation and Release Agreement with Michael Gulett dated as of April 30, 2010. Incorporated by reference to Exhibit 10.6 of the Registrant’s Quarterly Report on Form 10-Q filed with the SEC on August 11, 2010. | |
| 10.11* | Separation and Release Agreement with Craig Garen dated as of April 1, 2010. Incorporated by reference to Exhibit 10.1 of the Registrant’s Current Report on Form 8-K filed with the SEC on April 2, 2010. | |
| 10.12* | Separation and Release Agreement with Cory J. Sindelar. Incorporated by reference to Exhibit 10.7 of the Registrant’s Quarterly Report on Form 10-Q filed with the SEC on August 11, 2010. | |
| 10.13* | Offer letter with Dennis Bencala dated as of August 2, 2010. Incorporated by reference to Exhibit 10.8 of the Registrant’s Quarterly Report on Form 10-Q filed with the SEC on August 11, 2010. | |
| 10.14* | Offer letter with John Quigley dated as of August 3, 2010. Incorporated by reference to Exhibit 10.9 of the Registrant’s Quarterly Report on Form 10-Q filed with the SEC on August 11, 2010. | |
| 21.1 | Subsidiaries of the Registrant. | |
| 23.1 | Consent of PricewaterhouseCoopers LLP, Independent Registered Public Accounting Firm. | |
| 24.1 | Power of Attorney is herein referenced to the signature page of this annual report on Form 10-K. | |
| 31.1 | Certification of Chief Executive Officer pursuant to Securities Exchange Act Rules 13a-14(a) and 15d-14(a), as adopted pursuant to Section 302 of the Sarbanes-Oxley Act of 2002. | |
| 31.2 | Certification of Chief Financial Officer pursuant to Securities Exchange Act Rules 13a-14(a) and 15d-14(a), as adopted pursuant to Section 302 of the Sarbanes-Oxley Act of 2002. | |
| 32.1 | Certification of Principal Executive Officer and Principal Financial Officer pursuant to 18 U.S.C. Section 1350, as adopted pursuant to Section 906 of the Sarbanes-Oxley Act of 2002. | |
| * | Indicates a management contract or compensatory plan or arrangement. |