Attached files
| file | filename |
|---|---|
| 8-K - 8-K - CBRE GROUP, INC. | a11-7437_18k.htm |
Exhibit 99.1
|
|
CB Richard Ellis Group, Inc. Investor Presentation March 2011 |

|
|
Forward Looking Statements This presentation contains statements that are forward looking within the meaning of the Private Securities Litigation Reform Act of 1995, including statements regarding our future growth momentum, operations, financial performance, business outlook and ability to consummate our acquisition of substantially all of ING’s real estate investment management business. These statements should be considered as estimates only and actual results may ultimately differ from these estimates. Except to the extent required by applicable securities laws, we undertake no obligation to update or publicly revise any of the forward-looking statements that you may hear today. Please refer to our fourth quarter earnings report, filed on Form 8-K, and our current annual report on Form 10-K, in particular any discussion of risk factors or forward-looking statements, which are filed with the SEC and available at the SEC’s website (http://www.sec.gov), for a full discussion of the risks and other factors that may impact any estimates that you may hear today. We may make certain statements during the course of this presentation which include references to “non-GAAP financial measures,” as defined by SEC regulations. As required by these regulations, we have provided reconciliations of these measures to what we believe are the most directly comparable GAAP measures, which are attached hereto within the appendix. |
|
|
Overview |

|
|
The Global Market Leader Includes affiliate offices. On a combined basis assuming the acquisition of ING’s Real Estate Investment Management business (ING REIM), which is expected to close in the second half of 2011. As of December 31, 2010. Based on 2010 revenues versus Jones Lang LaSalle. Scale and Diversity 1.7x nearest competitor4 Thousands of clients; nearly 80% of the Fortune 100 $130.7 billion of transaction activity in 2010 Broad Capabilities #1 leasing #1 investment sales #1 outsourcing #1 appraisal and valuation #1 commercial mortgage brokerage #1 commercial real estate investment management2 $6.1 billion of development projects in process/pipeline3 Leading Global Brand 100+ years 400+ offices in over 60 countries1 #1 in virtually every major global business center Recognized Leadership S&P 500 Only commercial real estate services company in the S&P 500 FORTUNE Only commercial real estate services company in the Fortune 500 The Lipsey Company #1 brand for ten consecutive years Euromoney Top Global Real Estate Advisor for 2010 Financial Times Best Property Investment Advisor for 2010 Newsweek #30 (of 500) greenest company in the U.S. and #1 in financial services 1. 2. 3. 4. |
|
|
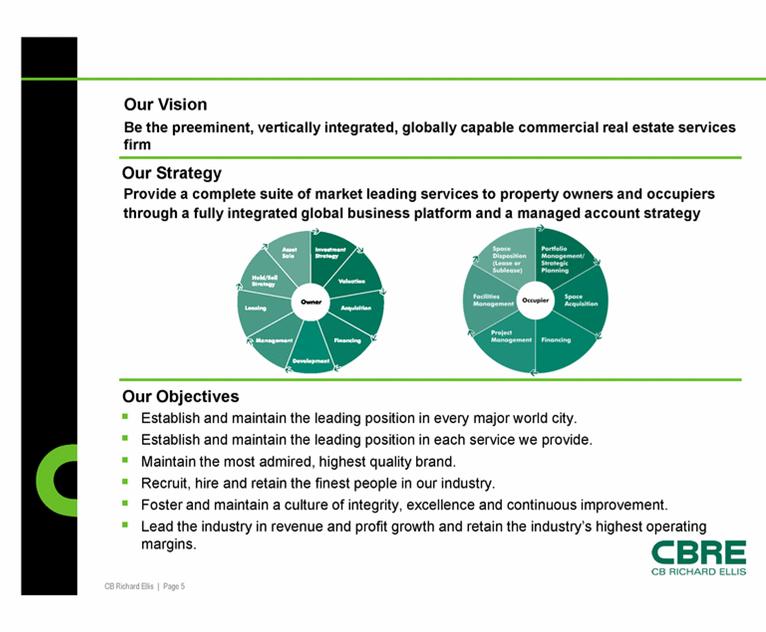
Our Objectives Provide a complete suite of market leading services to property owners and occupiers through a fully integrated global business platform and a managed account strategy Our Strategy Establish and maintain the leading position in every major world city. Establish and maintain the leading position in each service we provide. Maintain the most admired, highest quality brand. Recruit, hire and retain the finest people in our industry. Foster and maintain a culture of integrity, excellence and continuous improvement. Lead the industry in revenue and profit growth and retain the industry’s highest operating margins. Our Vision Be the preeminent, vertically integrated, globally capable commercial real estate services firm |
|
|
Diversified revenue spread across broad base of clients Diverse Client Base 2010 Revenue by Client Type |
|
|
Geographic Diversification #1 commercial real estate services firm in each of the major regions of the world 2010 revenue includes $3.9 million of revenue related to discontinued operations. 2010 Revenue1 |
|
|
Revenue Diversification 1. Contractual revenue includes: Property & Facilities Management (14% in 2006 and 35% in 2010), Appraisal & Valuation (7% in both 2006 and 2010), Investment Management (6% in 2006 and 3% in 2010), Development Services (1% in both 2006 and 2010) and Other (1% in 2006 and 2% in 2010). Non-contractual revenue includes: Sales (31% in 2006 and 15% in 2010), Leasing (37% in 2006 and 34% in 2010) and Commercial Mortgage Brokerage (3% in both 2006 and 2010). 2. Reflects Trammell Crow Company’s revenue contributions beginning on December 20, 2006. 3. 2010 revenue includes $3.9 million of revenues related to discontinued operations. Contractual revenues1 represented 48% of 2010 revenue, up from 29% in 2006 2010 Revenue3 2006 Revenue2 |
|
|
Key Service Lines & Market Environment |
|
|
Revenue Breakdown Full Year 2010 1. Includes revenue from discontinued operations, which totaled $2.2 million and $3.9 million for the three and twelve months ended December 31, 2010, respectively. 35% 34% 15% 7% 3% 3% 1% 2% ($ in millions) 2010 1 2009 % Change 2010 1 2009 % Change Property & Facilities Management 473.4 428.6 10 1,772.1 1,633.3 8 Leasing 614.1 455.8 35 1,743.6 1,348.2 29 Sales 285.3 203.8 40 768.8 507.4 52 Appraisal & Valuation 110.2 92.6 19 329.9 300.9 10 Investment Management 67.2 36.0 87 171.0 132.0 30 Commercial Mortgage Brokerage 58.0 17.4 233 164.2 62.4 163 Development Services 16.4 21.4 -23 72.1 82.0 -12 Other 28.9 40.9 -29 97.5 99.6 -2 Total 1,653.5 1,296.5 28 5,119.2 4,165.8 23 Three months ended December 31, Twelve months ended December 31, |
|
|
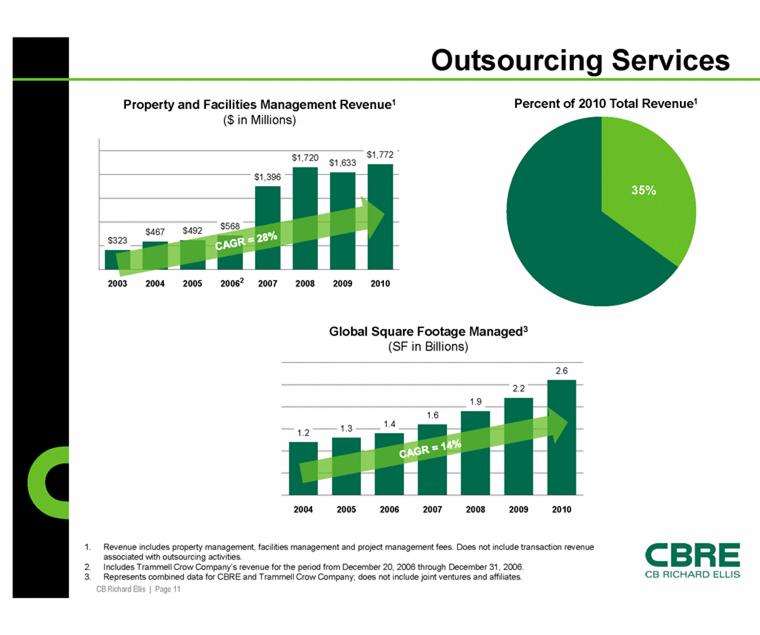
Property and Facilities Management Revenue1 ($ in Millions) CAGR = 28% Outsourcing Services 1. Revenue includes property management, facilities management and project management fees. Does not include transaction revenue associated with outsourcing activities. 2. Includes Trammell Crow Company’s revenue for the period from December 20, 2006 through December 31, 2006. 3. Represents combined data for CBRE and Trammell Crow Company; does not include joint ventures and affiliates. Global Square Footage Managed3 (SF in Billions) CAGR = 14% |
|
|
#1 Provider of Every Outsourced Real Estate Service Consulting Property/Facilities Management Project Management Transaction Management Global execution of transactions with a portfolio-wide focus Optimize portfolio Lease administration services Multiple-transaction focus Full service outsourcing Program management One-off integrated transaction management/ project management Moves, adds, changes Sourcing and procurement Operations and maintenance Energy services Health, safety and security Environmental sustainability Client accounting Organizational design Portfolio optimization Workplace strategy Land use analysis and strategy Fiscal and economic impact analysis |
|
|
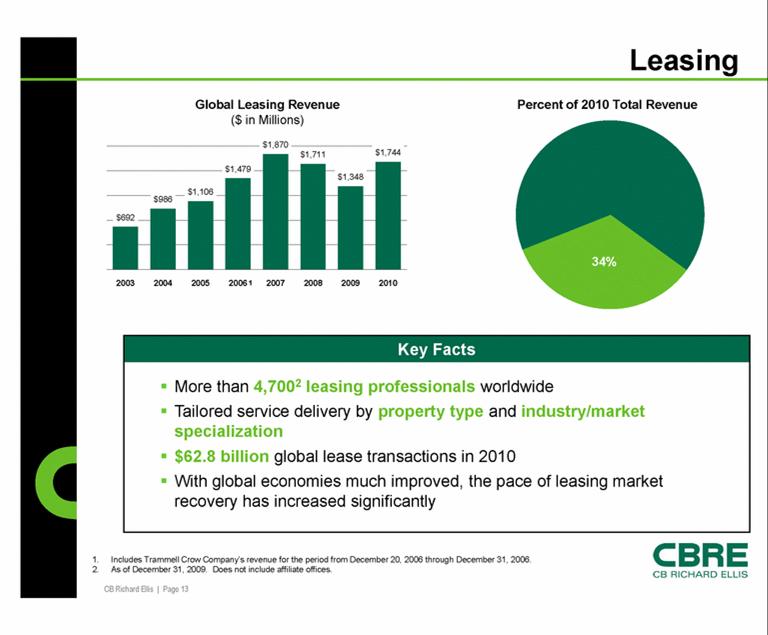
Leasing Global Leasing Revenue ($ in Millions) 1. Includes Trammell Crow Company’s revenue for the period from December 20, 2006 through December 31, 2006. 2. As of December 31, 2009. Does not include affiliate offices. 1 More than 4,7002 leasing professionals worldwide Tailored service delivery by property type and industry/market specialization $62.8 billion global lease transactions in 2010 With global economies much improved, the pace of leasing market recovery has increased significantly Key Facts |
|
|
Leasing Market Outlook forecast CBRE EA Office Rent Index; % change versus a year ago Office Vacancy rate; % U.S. Office Rent Forecast and Vacancy |
|
|
Sales Global Sales Revenue ($ in Millions) 1. Includes Trammell Crow Company’s revenue for the period from December 20, 2006 through December 31, 2006. 2. As of December 31, 2009. Does not include affiliate offices. Key Facts More than 1,3002 investment sales specialists worldwide Specialization across all major property types $67.9 billion global sales in 2010 Recovery of transaction activity continuing to broaden across markets as capital returns to commercial real estate |
|
|
Global Investment Management: CBRE Investors GIM Revenue ($ in Millions) CAGR =18% Assets Under Management ($ in Billions) CAGR =15% Key Facts1 $37.6 billion in assets under management $99.0 million of co-investments As of December 31, 2010. |
|
|
Global Investment Management – Impact of ING REIM Significantly enhances depth and breadth of Investment Management platform Combined Normalized EBITDA Margin of 31% with acquisition (26% without) for 2010 Expected to produce modest future net positive run rate cost synergies Combined Platform Summary (As of 12/31/10) Funds Direct Separate Accounts Employees AUM ($ Billions) Blended AUM Leverage Equity Raised ($ Billions) CBRE Investors 21 36 406 37.6 2 38% 3 5 ING REIM 81 23 760 59.8 2 25% 4 7 Based on 2010 preliminary results as calculated by ING REIM management. Assets under management (AUM) generally refers to the properties and other assets with respect to which an asset manager provides (or participates in) oversight, investment management services and other advice, and which generally consist of real estate properties or loans, securities portfolios and investments in operating companies and joint ventures. The methodologies used by the ING REIM business units and CBRE Investors to determine their respective AUM are not the same and, accordingly, the reported AUM of ING REIM would be different if calculated using a methodology consistent with that of CBRE Investors’ methodology. To the extent applicable, ING REIM’s reported AUM was converted from Euros to U.S. dollars using an exchange rate of $1.3379 per €1. Preliminary as of December 31, 2010. As of September 30, 2010 (average of all business lines: ING REIM Europe, ING REIM Asia, and U.S. based Real Estate Securities business). 1 |
|
|
Highly Complementary Product Offerings ING REIM 2 CBRE Investors 1 Note: For purposes of comparison all figures are as of 9/30/10. Minimal Overlap and Integration Based on CBRE Investors AUM calculation methodology. Based on ING REIM’s AUM calculation methodology. Euro/Dollar exchange rate of $1.3644 |
|
|
Combined 1 Based on 2010 preliminary results as calculated by ING REIM management. Total Company 2010 Results - Stand Alone & Combined with ING REIM 13.3% Margin 14.5% Margin $ in Billions $5.1 $0.7 $5.1 $0.7 $0.3 $0.1 Revenue Normalized EBITDA Revenue Normalized EBITDA CBRE ING REIM |
|
|
Development Services: Trammell Crow Company Revenue1 ($ in Millions) Includes Trammell Crow Company’s operations prior to the acquisition of Trammell Crow Company on December 20, 2006. Also includes revenue from discontinued operations. In Process figures contain Long-Term Operating Assets (LTOA), including $1.6 billion for 4Q 10, $1.4 billion for 4Q 09 and $0.4 billion for both 4Q 08 and 4Q 07. LTOA are projects that have achieved a stabilized level of occupancy or have been held 18-24 months following shell completion or acquisition. As of December 31, 2010. CAGR =4% $6.1 billion in process/pipeline $62.0 million co-investments Only $6.7 million in recourse debt to CBRE and repayment guarantees Projects In Process/Pipeline ($ in Billions) Key Facts3 |
|
|
Financial Performance |
|
|
($ in Millions) No reimbursements are included for the period 1992 through 1996, as amounts were immaterial. Reimbursements for 1997 through 2001 have been estimated. For 2002 and forward, reimbursements are included. Includes Trammell Crow Company activity for the period December 20, 2006 through December 31, 2006. Includes revenue from discontinued operations, which totaled $2.1 million for the year ended December 31, 2007, $1.3 million for the year ended December 31, 2008, and $3.9 million for the year ended December 31, 2010. Normalized EBITDA excludes merger-related and other non-recurring costs, integration and other costs related to acquisitions, cost containment expenses, one-time IPO-related compensation expense, gains/losses on trading securities acquired in the Trammell Crow Company acquisition and the write-down of impaired assets. Includes EBITDA related to discontinued operations of $6.5 million for the year ended December 31, 2007, $16.9 million for the year ended December 31, 2008, and $16.4 million for the year ended December 31, 2010. ($ in Millions) 1992 – 2010 CAGR = 16% Average Annual Organic Growth of 9% Revenue 1 Normalized EBITDA and Margin 4 1992 – 2010 CAGR = 22% Historical Performance 5 5 5 3 3 3 2 2 360 392 429 469 583 759 1,187 1,403 1,518 1,362 1,362 1,810 2,647 3,194 4,032 6,036 5,130 4,166 5,119 1992 1993 1994 1995 1996 1997 1998 1999 2000 2001 2002 2003 2004 2005 2006 2007 2008 2009 2010 Organic Revenue Revenue From Acquisitions 20 26 34 42 62 90 127 117 151 115 131 183 300 461 653 970 601 454 681 5.6% 6.6% 7.9% 8.9% 10.6% 11.9% 10.7% 8.4% 9.9% 8.4% 9.6% 10.1% 11.3% 14.4% 16.2% 16.1% 11.7% 10.9% 13.3% 1992 1993 1994 1995 1996 1997 1998 1999 2000 2001 2002 2003 2004 2005 2006 2007 2008 2009 2010 Normalized EBITDA Normalized EBITDA Margin |
|
|
Debt Highlights Normalized EBITDA excludes merger-related and other non-recurring costs, integration and other costs related to acquisitions, cost containment expenses, one-time IPO related compensation expense, gains/losses on trading securities acquired in the Trammell Crow Company acquisition and the write-down of impaired assets. 2006 normalized EBITDA excludes $106.8 million for Trammell Crow Company for the period January 1, 2006 through December 20, 2006. 2007 normalized EBITDA excludes $61.6 million of Development Services gains, which could not be recognized under purchase accounting rules. Total debt excludes non-recourse debt. ($ in millions) 2 3 4 $486 $450 $635 $378 $128 $1,874 $1,693 $1,950 $1,404 $943 $544 $530 $798 $635 $577 $2,118 $2,036 $2,109 $2,146 $1,450 4.23x 3.44x 3.46x 1.26x 0.28x 2.87x 1.74x 3.25x 3.09x 1.38x 2001 2002 2003 2004 2005 2006 2007 2008 2009 2010 Net Debt Total Debt Net Debt to Normalized EBITDA Normalized 1 EBITDA: $115 $131 $183 $300 $461 $653 $970 $601 $454 $681 |
|
|
Mandatory Amortization and Maturity Schedule As of September 30, 2010 As of December 31, 20101 $ millions $700 million revolver facility matures in May 2015. As of December 31, 2010 the outstanding revolver balance was $17.5 million. |
|
|
Capitalization Net of original issue discount of $12.3 million and $13.5 million at December 31, 2010 and 2009, respectively. Represents notes payable on real estate in Development Services that are recourse to the Company. Excludes non-recourse notes payable on real estate of $623.8 million and $547.8 million at December 31, 2010 and 2009, respectively. Excludes $453.8 million and $312.9 million of non-recourse warehouse facility at December 31, 2010 and 2009, respectively, as well as $5.5 million of non-recourse revolving credit facility in Development Services at December 31, 2009. ($ in millions) 12/31/2010 12/31/2009 Variance Cash 506.6 741.6 (235.0) Revolving credit facility 17.5 21.1 (3.6) Senior secured term loan A - 326.3 (326.3) Senior secured term loan A-1 - 48.6 (48.6) Senior secured term loan A-2 - 203.2 (203.2) Senior secured term loan A-3 - 167.5 (167.5) Senior secured term loan B - 642.8 (642.8) Senior secured term loan B-1 - 295.2 (295.2) Senior secured term loan A (new) 341.3 - 341.3 Senior secured term loan B (new) 299.2 - 299.2 Senior subordinated notes 1 437.7 436.5 1.2 Senior unsecured notes 350.0 - 350.0 Notes payable on real estate 2 3.7 3.5 0.2 Other debt 3 0.2 1.0 (0.8) Total debt 1,449.6 2,145.7 (696.1) Stockholders' equity 908.2 629.1 279.1 Total capitalization 2,357.8 2,774.8 (417.0) Total net debt 943.0 1,404.1 (461.1) As of 1. 2. 3. |
|
|
Business Outlook We are still in the early stages of a commercial real estate recovery – although 2011 growth rates are not likely to match robust 2010 rates Investment sales and leasing should continue to lead with solid growth, albeit with tougher comparisons Acceleration in outsourcing growth rates leaves us optimistic for its prospects in 2011 Expense growth expected to be slower in 2011 versus 2010 Expect full year 2011 earnings to be in the range of $0.95 to $1.05 per share Expect the ING REIM acquisition to close in the second half of 2011 with neutral impact on 2011 earnings per share and accretive to earnings in 2012 |
|
|
Appendix |
|
|
Reconciliation of Normalized EBITDA to EBITDA to Net Income CBRE Investors ($ in millions) 2010 Normalized EBITDA 55.9 $ Adjustments: Integration and other costs related to acquisitions - Cost containment expenses 0.4 Write-down of impaired assets 6.9 EBITDA 48.6 Add: Interest income 0.2 Less: Depreciation and amortization 14.0 Interest expense 22.2 Royalty and management service expense 0.8 Write-off of financing costs - Provision for income taxes 2.7 Net income attributable to CB Richard Ellis Group, Inc. 9.1 Revenue 215.6 $ Normalized EBITDA Margin 25.9% Year Ended December 31, |
|
|
Reconciliation of Normalized EBITDA to EBITDA to Net Income (Loss) Notes: Includes EBITDA related to discontinued operations of $16.4 million for the year ended December 31, 2010, $16.9 million for the year ended December 31, 2008 and $6.5 million for the year ended December 31, 2007. Includes interest income related to discontinued operations of $0.1 million for the year ended December 31, 2008 and $0.01 million for the year ended December 31, 2007. Includes depreciation and amortization related to discontinued operations of $0.6 million for the year ended December 31, 2010, $0.1 million for the year ended December 31, 2008 and $0.4 million for the year ended December 31, 2007. Includes interest expense related to discontinued operations of $1.6 million for the year ended December 31, 2010, $0.6 million for the year ended December 31, 2008 and $1.8 million for the year ended December 31, 2007. Includes provision for income taxes related to discontinued operations of $5.4 million for the year ended December 31, 2010, $6.0 million for the year ended December 31, 2008 and $1.6 million for the year ended December 31, 2007. Includes revenue related to discontinued operations of $3.9 million for the year ended December 31, 2010, $1.3 million for the year ended December 31, 2008 and $2.1 million for the year ended December 31, 2007. ($ in millions) 2010 2009 2008 2007 2006 Normalized EBITDA 1 681.3 $ 453.9 $ 601.2 $ 970.1 $ 652.5 $ Less: Write-down of impaired assets 11.3 32.5 100.4 - - Cost containment expenses 15.3 43.6 27.4 - - Integration and other costs related to acquisitions 7.2 5.7 16.4 45.2 7.6 Merger-related charges - - - 56.9 - Loss (gain) on trading securities acquired in the Trammell Crow Company acquisition - - - 33.7 (8.6) EBITDA 1 647.5 372.1 457.0 834.3 653.5 Add: Interest income 2 8.4 6.1 17.9 29.0 9.8 Less: Depreciation and amortization 3 109.0 99.5 102.9 113.7 67.6 Interest expense 4 192.7 189.1 167.8 164.8 45.0 Write-off of financing costs 18.1 29.3 - - 33.8 Goodwill and other non-amortizable intangible asset impairments - - 1,159.4 - - Provision for income taxes 5 135.8 27.0 56.9 194.3 198.3 Net income (loss) attributable to CB Richard Ellis Group, Inc. 200.3 $ 33.3 $ (1,012.1) $ 390.5 $ 318.6 $ Revenue 6 5,119.2 4,165.8 5,130.1 6,036.3 4,032.0 Normalized EBITDA Margin 13.3% 10.9% 11.7% 16.1% 16.2% Year Ended December 31, 1. 2. 3. 4. 5. 6. |