Attached files
| file | filename |
|---|---|
| 8-K - RAMCO-GERSHENSON PROPERTIES TRUST 8-K - RPT Realty | a6636278.htm |
Exhibit 99.1
Ramco Gershenson Properties Trust Investor Presentation March/April 2011
Company Overview Listed on the NYSE in 1996 Properties located primarily in the Eastern and Midwestern United States 89 retail shopping centers predominantly anchored by supermarket and/or national chain stores Over $2.0 billion in assets under management in twelve states. $1.1 billion total capitalization. 2
Operating Strategy and Fundamentals
Operating Strategy -Core Portfolio Centers primarily located in metropolitan markets with strong demographics. Market saturation in leading sub-markets. Resilient shopping center type, primarily grocery and value retail. Multi-anchor format with strong regional and national destination retailers promoting stability. Commitment to value-added portfolio improvement. 4
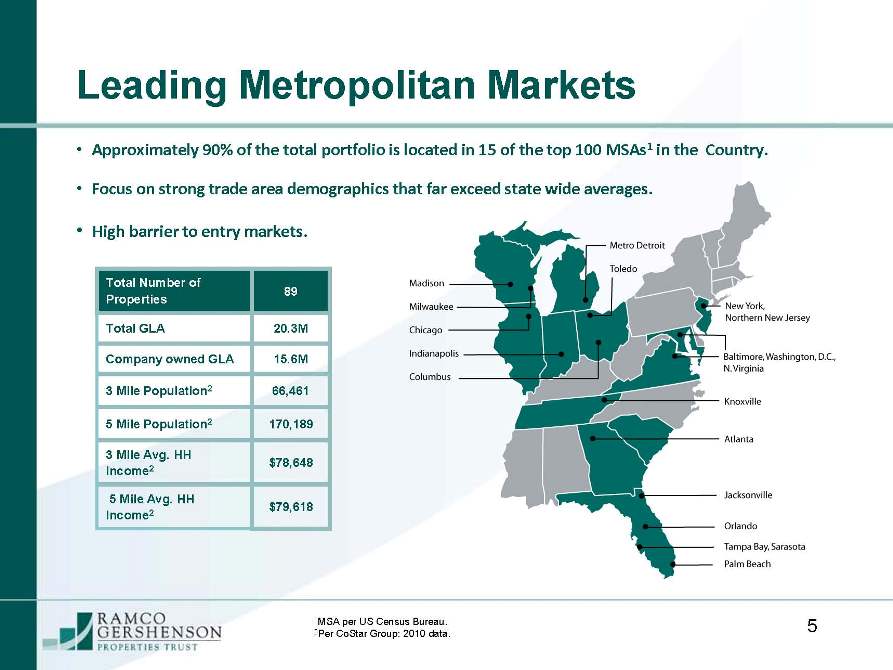
Leading Metropolitan Markets Approximately 90% of the total portfolio is located in 15 of the top 100 MSAs1in the Country. Focus on strong trade area demographics that far exceed state wide averages. High barrier to entry markets. Total GLA 20.3M Company owned GLA 15.6M 3 Mile Population 256,425 5 Mile Population 2139,2023 Mile Avg. HH Income 2 $92,2995 Mile Avg. HH Income 2 $91,165 5 1MSA per US Census Bureau. 2 Per CoStar Group: 2010 data. 5
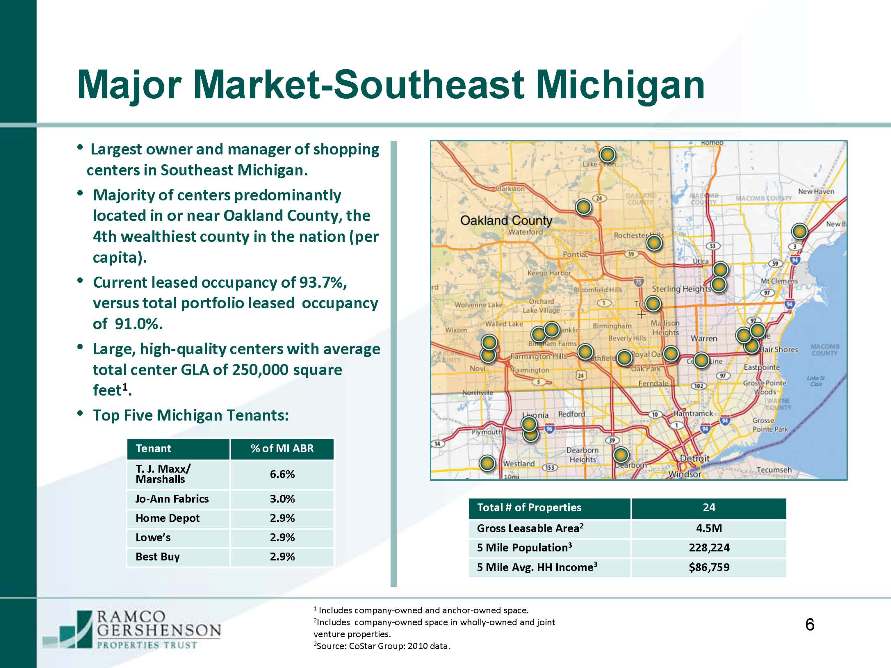
Major Market-Southeast Michigan Largest owner and manager of shopping centers in Southeast Michigan.Majority of centers predominantly located in or near Oakland County, the 4th wealthiest county in the nation (per capita). Current leased occupancy of 93.7%, versus total portfolio leased occupancy of 91.0%. Large, high-quality centers with average total center GLA of 250,000 square feet1.•Top Five Michigan Tenants: 6 Total # of Properties 24 Gross Leasable Area 2 4.5M 5 Mile Population 3 228,224 5 Mile Avg. HH Income 3 $86,7591 Includes company-owned and anchor-owned space. 2 Includes company-owned space in wholly-owned and joint venture properties.
2 Source: CoStar Group: 2010 data. Tenant% of MI ABRT. J. Maxx/ Marshalls 6.6% Jo-Ann Fabrics 3.0% Home Depot 2.9% Lowe’s 2.9% Best Buy 2.9%
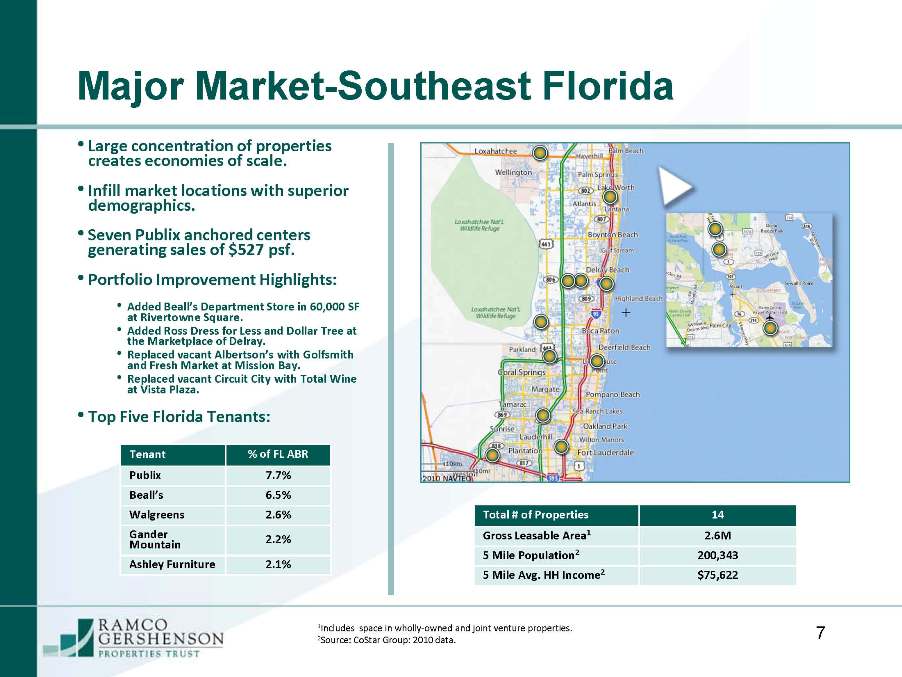
Major Market-Southeast Florida 7 1Includes space in wholly-owned and joint venture properties. 2 Source: CoStar Group: 2010 data. Total # of Properties 14 Gross Leasable Area12.6M 5 Mile Population 2 200,343 5 Mile Avg. HH Income 2 $75,622 Large concentration of properties creates economies of scale. Infill market locations with superior demographics. Seven Publix anchored centers generating sales of $527 psf. Portfolio Improvement Highlights: Added Beall’s Department Store in 60,000 SF at Rivertowne Square. Added Ross Dress for Less and Dollar Tree at the Marketplace of Delray. Replaced vacant Albertson’s with Golfsmith and Fresh Market at Mission Bay. Replaced vacant Circuit City with Total Wine at Vista Plaza. Top Five Florida Tenants:Tenant % of FL ABR Publix 7.7% Beall’s 6.5% Walgreens 2.6% Gander Mount ain 2.2% Ashley Furniture 2.1%
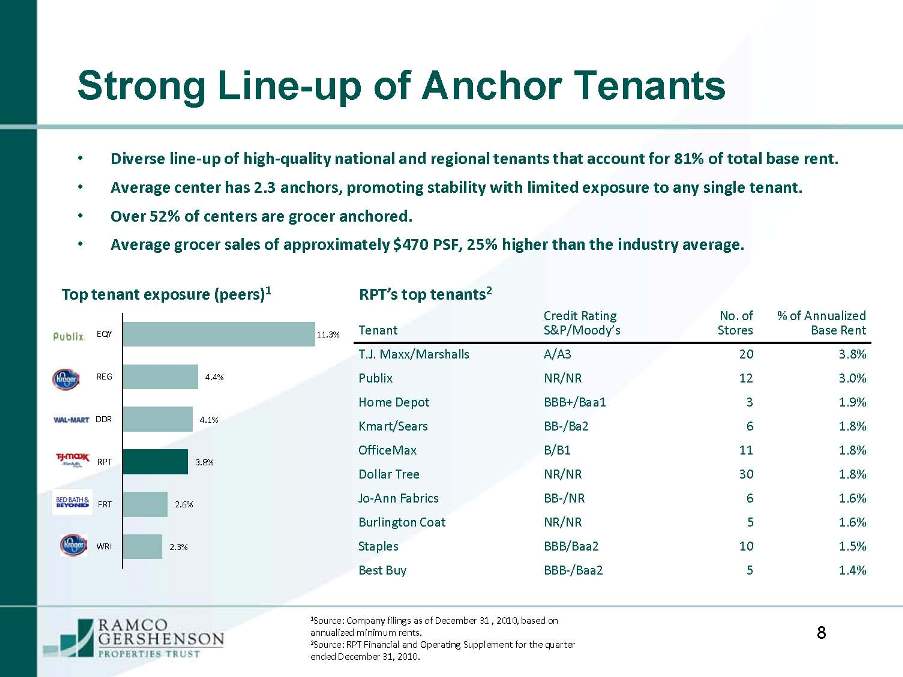
Strong Line-up of Anchor Tenants 8 2.3% 2.6% 3.8% 4.1% 4.4% 11.3% Diverse line-up of high-quality national and regional tenants that account for 81% of total base rent. Average center has 2.3 anchors, promoting stability with limited exposure to any single tenant. Over 52% of centers are grocer anchored. Average grocer sales of approximately $470 PSF, 25% higher than the industry average. 1Source: Company filings as of December 31 , 2010, based on annualized minimum rents. 2 Source: RPT Financial and Operating Supplement for the quarter ended December 31, 2010. TenantCredit Rating S&P/Moody’s No. of Stores% of Annualized Base Rent T.J. Maxx/Marshall s A/A3 20 3.8% Publix NR/NR 12 3.0% Home Depot BBB+/Baa131.9% Kmart/Sears BB-/Ba26 1.8% OfficeMax B/B1111.8% Dollar Tree NR/NR 301.8% Jo-Ann Fabrics BB-/NR 61.6%Burlington Coat NR/NR 5 1.6% Staples BBB/Baa2 101.5% Best Buy BBB-/Baa2 5 1.4% RPT’s top tenants 2 Top tenant exposure (peers) 1
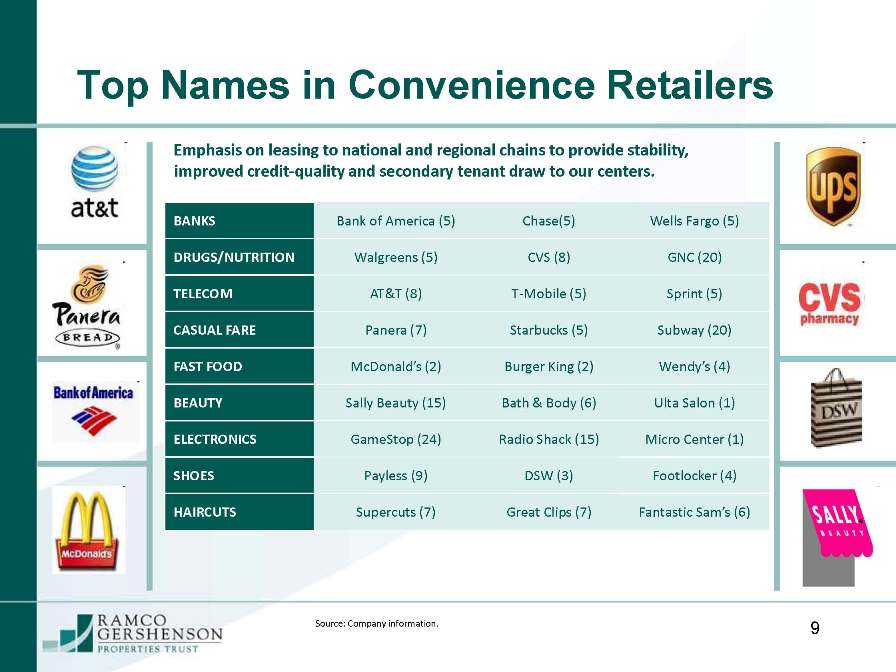
Top Names in Convenience Retailers 9 BANKS Bank of America (5) Chase (5) Wells Fargo (5) DRUGS/NUTRITION Walgreens (5) CVS (8) GNC (20) TELECOM AT&T (8) T-Mobile (5) Sprint (5) CASUAL FARE Panera (7) Starbucks (5) Subway (20) FAST FOOD McDonald’s (2) Burger King (2)Wendy’s (4) BEAUTY Sally Beauty (15) Bath & Body (6) UltaSalon (1) ELECTRONICS GameStop (24) Radio Shack (15) Micro Center (1) SHOES Payless (9) DSW (3) Footlocker (4) HAIRCUTS Supercuts (7) Great Clips (7) Fantastic Sam’s (6) Emphasis on leasing to national and regional chains to provide stability, improved credit-quality and secondary tenant draw to our centers. Source: Company information.
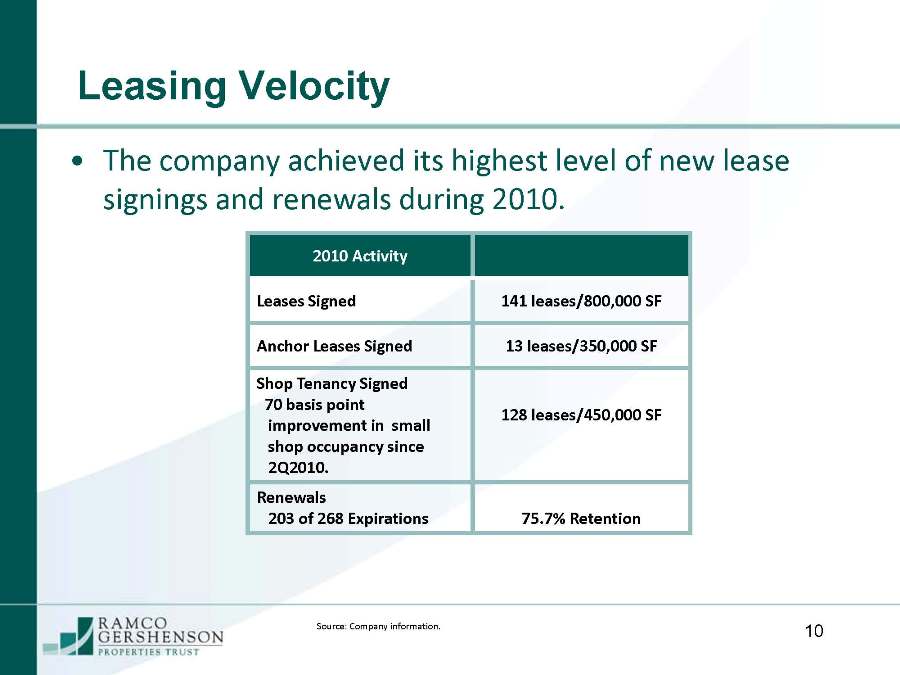
Leasing Velocity The company achieved its highest level of new lease signings and renewals during 2010. 10 2010 Activity Leases Signed 141 leases/800,000 SF Anchor Leases Signed 13 leases/350,000 SF Shop TenancySigned 70 basis point improvement in small shop occupancy since 2Q 2010. 128 leases/450,000 SF Renewals 203 of 268 Expirations 75.7% Retention Source: Company information.
Operating Strategy-Development Pipeline Currently the company has four development projects in the pre-development phase. Construction will commence after meeting certain criteria including substantial leasing commitments, secured construction financing and in some cases joint venture participation. Land held for development/sale of $93 million is approximately 9.0% of the company’s total assets. Approximately 50% of land held for development or sale is slated to be sold over a number of years to anchors, out parcel retailers, or non-retail developers in conjunction with RPT’s development of the projects, reducing land holdings to approximately 4.0% of total assets as of December 31, 2010. Will re-evaluate alternatives of proceeding with each project or selling the fully entitled land with tenants commi tments. 11
Balance Sheet and Maturities
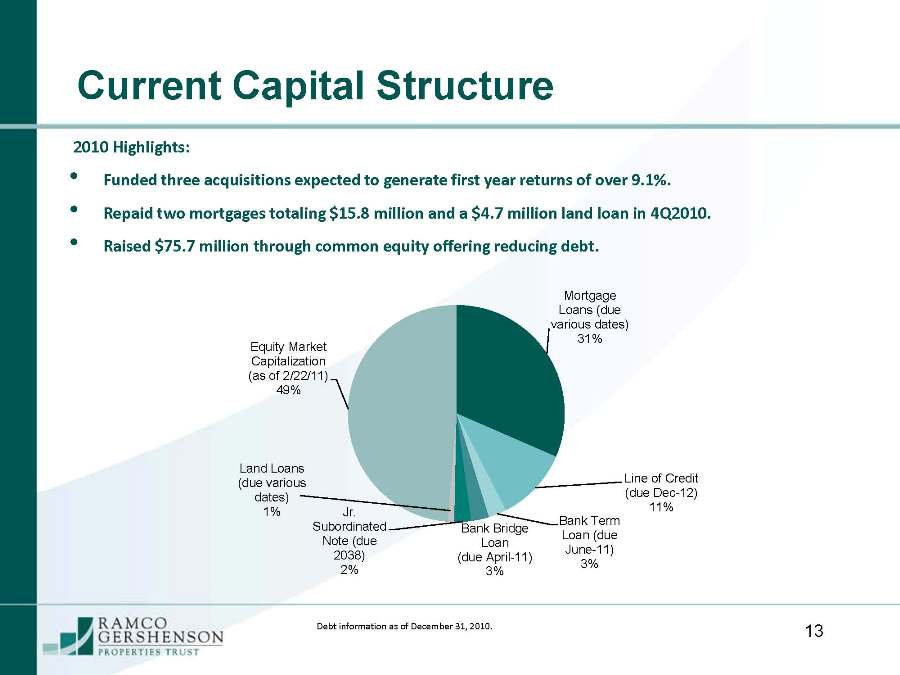
Current Capital Structure 13 2010 Highlights: Funded three acquisitions expected to generate first year returns of over 9.1%. Repaid two mortgages totaling $15.8 million and a $4.7 million land loan in 4Q 2010. Raised $75.7 million through common equity offering reducing debt. Mortgage Loans (due various dates) 31% Line of Credit (due Dec-12) 11% Bank Term Loan (due June-11) 3% Bank Bridge Loan (due April-11) 3% Jr. Subordinated Note (due 2038) 2% Land Loans (due various dates) 1% Equity Market Capitalization (as of 2/22/11) 49% Debt information as of December 31, 2010.
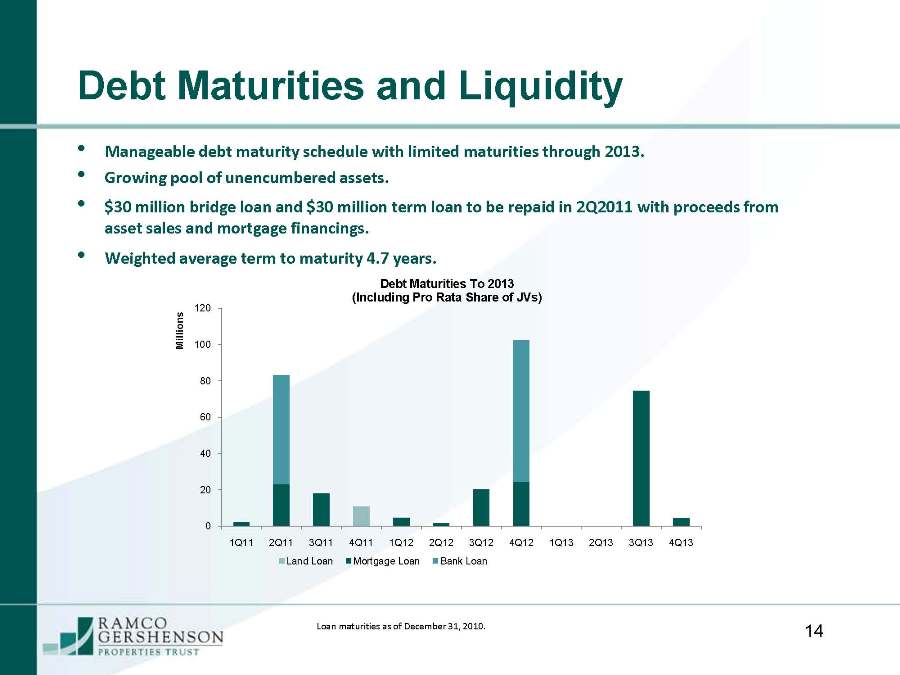
Debt Maturities and Liquidity 14 Manageable debt maturity schedule with limited maturities through 2013. Growing pool of unencumbered assets. $30 million bridge loan and $30 million term loan to be repaid in 2Q 2011 with proceeds from asset sales and mortgage financings. Weighted average term to maturity 4.7 years. Loan maturities as of December 31, 2010. 0 20 40 60 80 100 120 1Q 11 2Q 11 3Q 11 4Q 11 1Q 12 2Q 12 3Q 12 4Q 12 1Q 13 2Q 13 3Q 13 4Q13 Millions Debt Maturities To 2013 (Including Pro Rata Share of JVs)Land LoanMortgage LoanBank Loan
Ramco’s Strategy for the Future
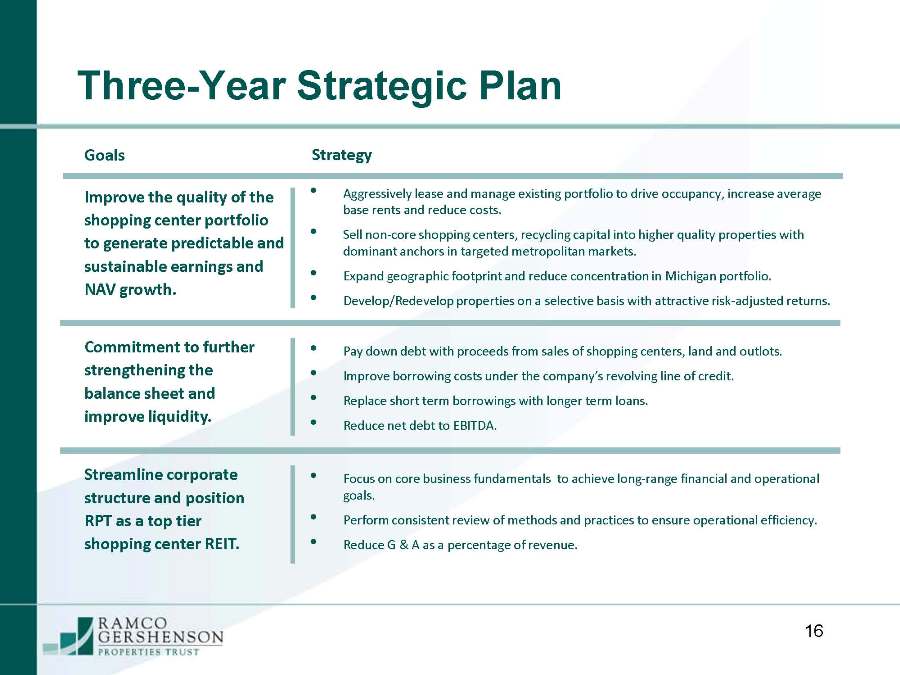
Three-Year Strategic PlanCommitment to further strengthening the balance sheet and improve liquidity. 16 Aggressively lease and manage existing portfolio to drive occupancy, increase average base rents and reduce costs. Sell non-core shopping centers, recycling capital into higher quality properties with dominant anchors in targeted metropolitan markets. Expand geographic footprint and reduce concentration in Michigan portfolio. Develop/Redevelop properties on a selective basis with attractive risk-adjusted returns. Pay down debt with proceeds from sales of shopping centers, land and outlots. Improve borrowing costs under the company’s revolving line of credit. Replace short term borrowings with longer term loans. Reduce net debt to EBITDA. Improve the quality of the shopping center portfolio to generate predictable and sustainable earnings and NAV growth. Goals Strategy Streamline corporate structure and position RPT as a top tier shopping center REIT. Focus on core business fundamentals to achieve long-range financial and operational goals. Perform consistent review of methods and practices to ensure operational efficiency. Reduce G & A as a percentage of revenue.
Goal-Improve the Quality of the Portfolio Strategy: Aggressively lease the shopping center portfolio to achieve positive same-center NOI each year and increase occupancy to 94%. Our Plan: Fortify regional leasing teams with additional agents and canvassers. Institute new short-form lease reducing cost and time spent on new leasing activities. Retain >75% of expiring tenants. Increase new lease signings each year by 10-15%. Drive average base rents through leasing and acquisitions. 17
Goal-Improve the Quality of the Portfolio Strategy: Sell underperforming or non-strategic shopping centers and recycle capital into higher quality properties in diversified markets. Our Plan: Completed thorough review of existing portfolio identifying shopping centers and out parcels for potential sale. Leverage relationships with brokerage community to expedite strategy. Goal for 2011 is to acquire $50 million to $75 million above asset dispositions with the following characteristics:•Metro markets in identified growth areas promoting diversification. Strong demographics. Market dominant community centers with grocery or discount component. Cap rates above 7.5%, with upside potential. 18
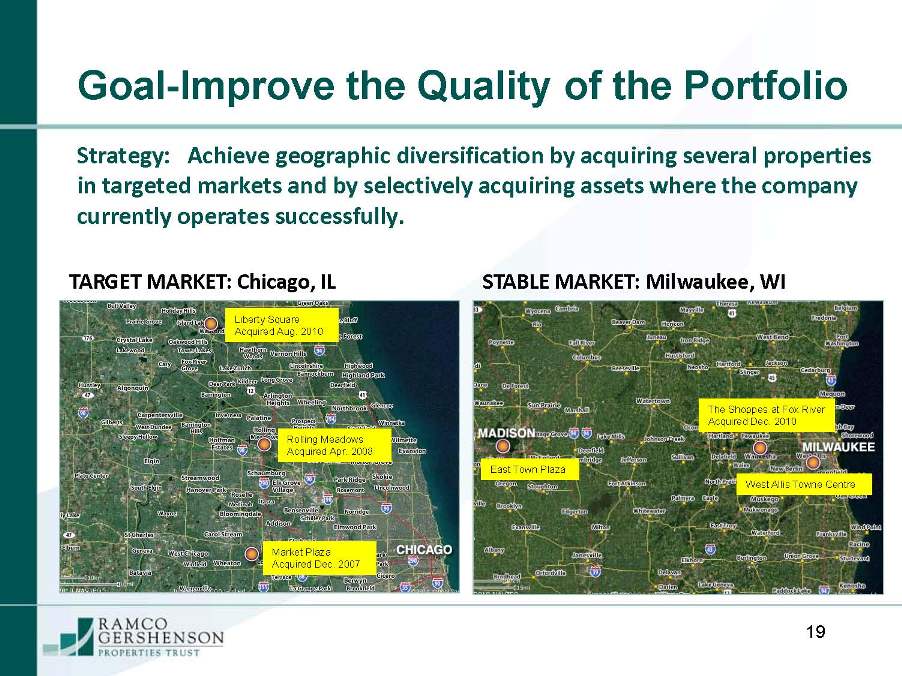
Goal-Improve the Quality of the Portfolio 19 Strategy: Achieve geographic diversification by acquiring several properties in targeted markets and by selectively acquiring assets where the company currently operates successfully. TARGET MARKET: Chicago, IL STABLE MARKET: Milwaukee, WI Rolling Meadows Acquired Apr. 2008 Market Plaza Acquired Dec. 2007 Liberty Square Acquired Aug. 2010 East Town Plaza The Shoppes at Fox River Acquired Dec. 2010West Allis Towne Centre
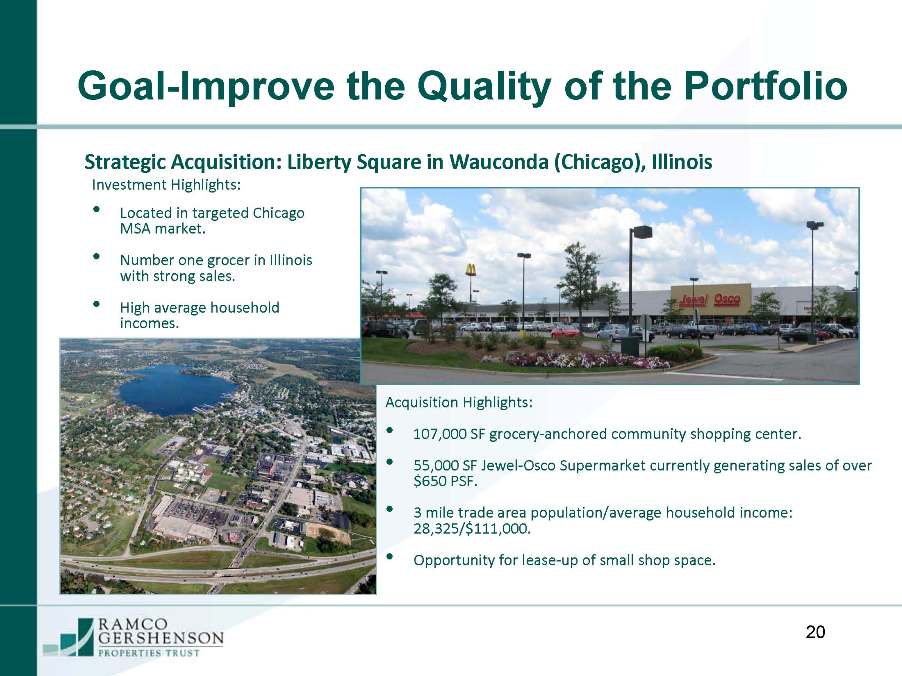
Goal-Improve the Quality of the Portfolio 20 Acquisition Highlights: 107,000 SF grocery-anchored community shopping center. 55,000 SF Jewel-Osco Supermarket currently generating sales of over $650 PSF. 3 mile trade area population/average household income: 28,325/$111,000.•Opportunity for lease-up of small shop space. Strategic Acquisition: Liberty Square in Wauconda (Chicago), Illinois Investment Highlights: Located in targeted Chicago MSA market. Number one grocer in Illinois with strong sales. High average household incomes.
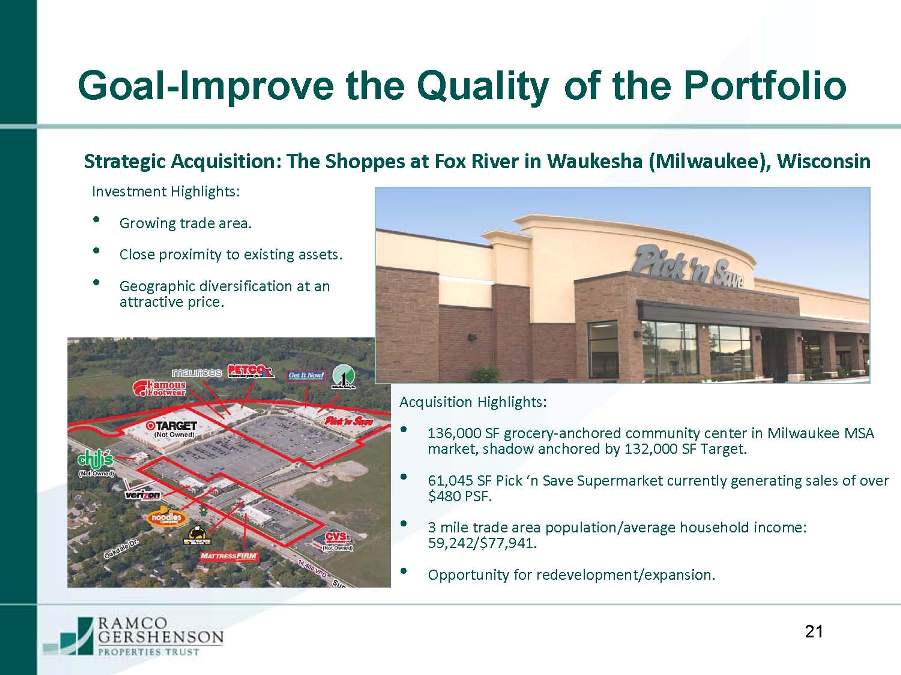
Goal-Improve the Quality of the Portfolio 21 Strategic Acquisition: The Shoppes at Fox River in Waukesha (Milwaukee), Wisconsin Acquisition Highlights: 136,000SF grocery-anchored community center in Milwaukee MSA market, shadow anchored by 132,000 SF Target. 61,045 SF Pick ‘n Save Supermarket currently generating sales of over $480 PSF. 3 mile trade area population/average household income:59,242/$77,941. Opportunityfor redevelopment/expansion. Investment Highlights: Growing trade area. Close proximity to existing assets. Geographic diversification at an attractive price.
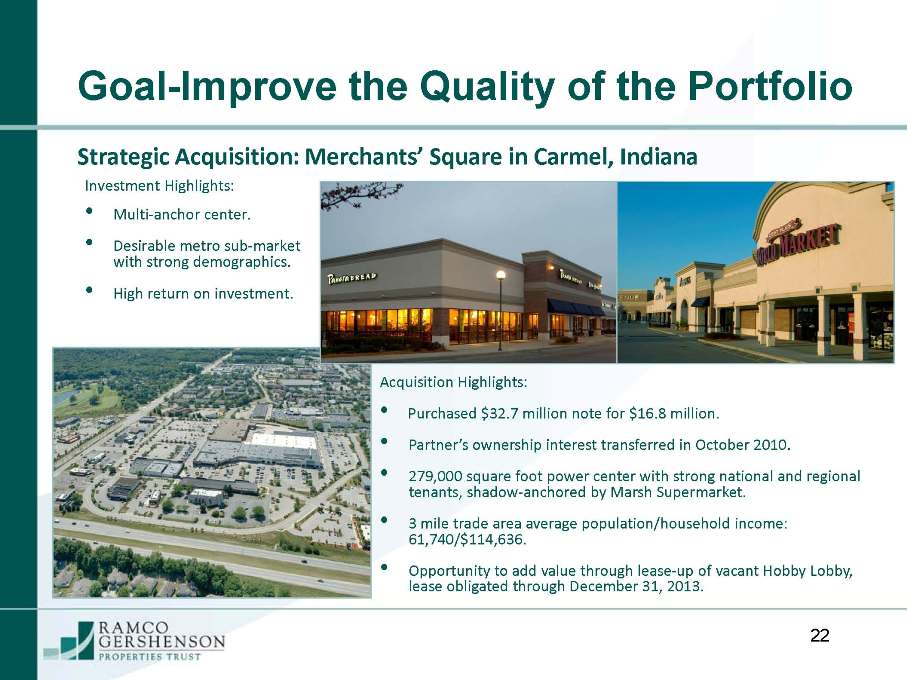
Goal-Improve the Quality of the Portfolio 22 Strategic Acquisition: Merchants’ Square in Carmel, Indiana Acquisition Highlights: Purchased $32.7 million note for $16.8 million. Partner’s ownership interest transferred in October 2010. 279,000 square foot power center with strong national and regional tenants, shadow-anchored by Marsh Supermarket. 3 mile trade area average population/household income: 61,740/$114,636. Opportunity to add value through lease-up of vacant Hobby Lobby, lease obligated through December 31, 2013. Investment Highlights: Multi-anchor center. Desirable metro sub-market with strong demographics. High return on investment.
Goal-Improve the Quality of the Portfolio 23 Strategy: Redevelop/Develop properties with attractive risk adjusted returns. Our Plan: Proactively respond to increasing tenant sales, changing consumer tastes and opportunities to expand, retenant or redevelop the core portfolio. Pursue a conservative approach to existing pipeline of potential development projects including land sales and partner participation. Developments will only be considered upon achieving certain, specific criteria: Critical mass of signed anchor leases. Demonstrated demand for small shop space. Firm construction costs. Secured joint venture partner. Construction financing in place.
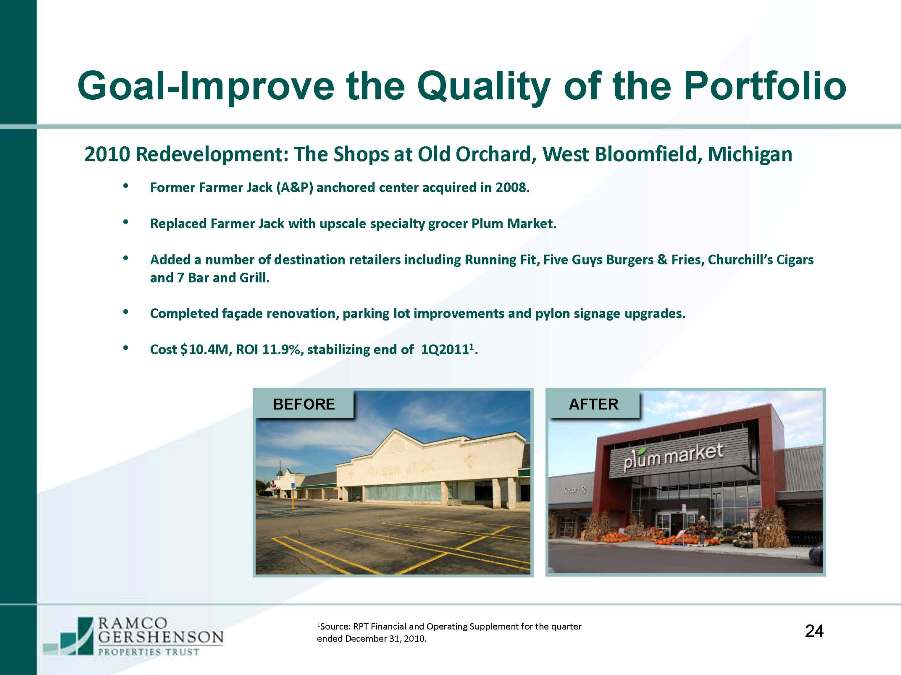
Goal-Improve the Quality of the Portfolio 24 Former Farmer Jack (A&P) anchored center acquired in 2008. Replaced Farmer Jack with upscale specialty grocer Plum Market. Added a number of destination retailers including Running Fit, Five Guys Burgers & Fries, Churchill’s Cigars and 7 Bar and Grill. Completed façade renovation, parking lot improvements and pylon signage upgrades. Cost $10.4M, ROI 11.9%, stabilizing end of 1Q20111. BEFORE AFTER 2010 Redevelopment: The Shops at Old Orchard, West Bloomfield, Michigan 1Source: RPT Financial and Operating Supplement for the quarter ended December 31, 2010.
Goal-Strengthen the Balance Sheet 25 Strategy: Reduce cost of capital, limit risk and maintain a balanced capital structure to position the company to take advantage of future opportunities. Our Plan: Reduce overall leverage utilizing proceeds from asset sales. Renegotiate existing line of credit at favorable terms with expanded borrowing power. Finance a limited number of larger assets and utilize proceeds to produce a greater pool of unencumbered assets. Improve debt metrics: Net Debt to EBITDA goal of 6.5x to 7.0x Fixed charge coverage of 2.0x to 2.5x. Overall leverage of less than 50%
Goal-Position RPT as a Top Tier REIT 26 Strategy: Improve processes and consolidate functions to reduce costs and increase efficiency. Our Plan: Implement cost-effective technology solutions to facilitate productivity. Realign responsibilities under appropriate reporting lines to increase efficiency. Restructure vendor services to eliminate redundancies and waste. Take advantage of current staffing levels to achieve economies of scale as the company grows.
Results of a Well-Executed Strategy Increased shareholder value. Competitive, high-quality portfolio. Stronger balance sheet with greater financial flexibility. Consistent, sustainable earnings and NAV growth. Highly successful company. 27
Safe Harbor Statement 28 Ramco-Gershenson PropertiesTrust considers portions of this information to be forward-looking statements within the meaning of Section27A of the Securities Act of 1933 and Section 21E of the Securities Exchange Act of 1934, both as amended, with respect to the Company’s expectation for future periods. Although the Company believes that the expectations reflected in such forward-looking statements are based upon reasonable assumptions, it can give no assurance that its expectations will be achieved. For this purpose, any statements contained herein that are not historical fact may be deemed to be forward-looking statements. Certain factors could occur that might cause actual results to vary. These include our success or failure in implementing our business strategy, economic conditions generally and in the commercial real estate and finance markets specifically, our cost of capital, which depends in part on our asset quality, our relationships with lenders and other capital providers, our business prospects and outlook, changes in governmental regulations, tax rates and similar matters, and our continuing to qualify as a REIT, and other factors discussed in the Company’s reports filed with the Securities and Exchange Commission.