Attached files
| file | filename |
|---|---|
| EX-10.8 - EXHIBIT 10.8 - RPT Realty | rpt-12312015_ex108.htm |
| EX-32.1 - EXHIBIT 32.1 - RPT Realty | rpt-12312015_ex321.htm |
| EX-21.1 - EXHIBIT 21.1 - RPT Realty | rpt-12312015_ex211.htm |
| EX-31.2 - EXHIBIT 31.2 - RPT Realty | rpt-12312015_ex312.htm |
| EX-3.1 - EXHIBIT 3.1 - RPT Realty | rpt-12312015_ex31.htm |
| EX-32.2 - EXHIBIT 32.2 - RPT Realty | rpt_12312015xex322.htm |
| EX-12.1 - EXHIBIT 12.1 - RPT Realty | rpt-12312015_ex121.htm |
| EX-31.1 - EXHIBIT 31.1 - RPT Realty | rpt-12312015_ex311.htm |
| EX-23.1 - EXHIBIT 23.1 - RPT Realty | rpt-12312015_ex231.htm |
UNITED STATES SECURITIES AND EXCHANGE COMMISSION
Washington, D.C. 20549
________________
Form 10-K
[X] ANNUAL REPORT PURSUANT TO SECTION 13 OR 15(d) OF THE SECURITIES EXCHANGE ACT OF 1934
For the fiscal year ended December 31, 2015
OR
[ ] TRANSITION REPORT PURSUANT TO SECTION 13 OR 15(d) OF THE SECURITIES EXCHANGE ACT OF 1934
For the transition period from to
Commission file number 1-10093
RAMCO-GERSHENSON PROPERTIES TRUST
(Exact Name of Registrant as Specified in its Charter)
Maryland | 13-6908486 |
(State or Other Jurisdiction of | (I.R.S. Employer Identification No.) |
Incorporation or Organization) | |
31500 Northwestern Highway, Suite 300 | 48334 |
Farmington Hills, Michigan | (Zip Code) |
(Address of Principal Executive Offices) | |
Registrant’s Telephone Number, Including Area Code: 248-350-9900
Securities Registered Pursuant to Section 12(b) of the Act:
Title of Each Class | Name of Each Exchange On Which Registered | |
Common Shares of Beneficial Interest, | New York Stock Exchange | |
($0.01 Par Value Per Share) | ||
Securities Registered Pursuant to Section 12(g) of the Act: None
Indicate by check mark if the registrant is a well-known seasoned issuer, as defined in Rule 405 of the Securities Act. Yes [X] No [ ]
Indicate by check mark if the registrant is not required to file reports pursuant to Section 13 or Section 15(d) of the Act. Yes [ ] No [X]
Indicate by check mark whether the registrant (1) has filed all reports required to be filed by Section 13 or 15(d) of the Securities Exchange Act of 1934 during the preceding 12 months (or for such shorter period that the registrant was required to file such reports), and (2) has been subject to such filing requirements for the past 90 days. Yes [X] No [ ]
Indicate by check mark whether the registrant has submitted electronically and posted on its corporate Web site, if any, every Interactive Data File required to be submitted and posted pursuant to Rule 405 of Regulation S-T during the preceding 12 months (or for such shorter period that the registrant was required to submit and post such files). Yes [X ] No [ ]
Indicate by check mark if disclosure of delinquent filers pursuant to Item 405 of Regulation S-K is not contained herein, and will not be contained, to the best of the registrant’s knowledge, in definitive proxy or information statements incorporated by reference in Part III of this Form 10-K or any amendment to this Form 10-K. [ X ]
Indicate by check mark whether the registrant is a large accelerated filer, an accelerated filer, a non-accelerated filer, or a smaller reporting company. See definition of “large accelerated filer,” “accelerated filer" and “smaller reporting company” in Rule 12b-2 of the Exchange Act.
Large Accelerated Filer [X] | Accelerated Filer [ ] | Non-Accelerated Filer [ ] | Small Reporting Company [ ] |
(Do not check if small reporting company) | |||
Indicate by check mark whether the registrant is a shell company (as defined in Rule 12b-2 of the Exchange Act). Yes [ ] No [X]
The aggregate market value of the common equity held by non-affiliates of the registrant as of the last business day of the registrant’s most recently completed second fiscal quarter (June 30, 2015) was $1,267,495,868. As of February 16, 2016 there were outstanding 79,178,042 shares of Common Stock.
DOCUMENTS INCORPORATED BY REFERENCE
Portions of the proxy statement for the annual meeting of shareholders to be held May 11, 2016 are in incorporated by reference into Part III.
TABLE OF CONTENTS
Item | PART I | Page |
1. | ||
1A. | ||
1B. | ||
2. | ||
3. | ||
4. | ||
PART II | ||
5. | ||
6. | ||
7. | ||
7A. | ||
8. | ||
9. | ||
9A. | ||
9B. | ||
PART III | ||
10. | ||
11. | ||
12. | ||
13. | ||
14. | ||
PART IV | ||
15. | ||
Forward-Looking Statements
This document contains forward-looking statements within the meaning of Section 27A of the Securities Act of 1933, as amended, and Section 21E of the Securities Exchange Act of 1934, as amended. These forward-looking statements represent our expectations, plans or beliefs concerning future events and may be identified by terminology such as “may,” “will,” “should,” “believe,” “expect,” “estimate,” “anticipate,” “continue,” “predict” or similar terms. Although the forward-looking statements made in this document are based on our good-faith beliefs, reasonable assumptions and our best judgment based upon current information, certain factors could cause actual results to differ materially from those in the forward-looking statements, including: our success or failure in implementing our business strategy; economic conditions generally and in the commercial real estate and finance markets specifically; the cost and availability of capital, which depends in part on our asset quality and our relationships with lenders and other capital providers; our business prospects and outlook; changes in governmental regulations, tax rates and similar matters; our continuing to qualify as a real estate investment trust (“REIT”); and other factors discussed elsewhere in this document and our other filings with the Securities and Exchange Commission (the “SEC”). Given these uncertainties, you should not place undue reliance on any forward-looking statements. Except as required by law, we assume no obligation to update these forward-looking statements, even if new information becomes available in the future.
PART I
Item 1. Business
The terms “Company,” “we,” “our” or “us” refer to Ramco-Gershenson Properties Trust, Ramco-Gershenson Properties, L.P., and/or its subsidiaries, as the context may require.
General
Ramco-Gershenson Properties Trust is a fully integrated, self-administered, publicly-traded equity real estate investment trust (“REIT”) organized in Maryland. Our primary business is the ownership and management of large multi-anchored shopping centers primarily in twelve of the largest metropolitan markets in the United States. We aim to own multiple properties in each of these metropolitan areas to leverage our management platform and to operate our centers efficiently in these markets. Our target submarkets are affluent communities where our centers can offer value, convenience and a sense of place to the residents of the trade area.
As of December 31, 2015, our property portfolio consisted of 70 wholly owned shopping centers and one office building comprising approximately 15.3 million square feet. We also have ownership interests, ranging from 7% to 30%, in four joint ventures, three of which own a single shopping center. Our joint ventures are reported using equity method accounting. We earn fees from the joint ventures for managing, leasing, and redeveloping the shopping centers they own. In addition, we own various parcels of land available for development or for sale, the majority of which are adjacent to certain of our existing developed properties.
We conduct substantially all of our business through our operating partnership, Ramco-Gershenson Properties, L.P. (the “Operating Partnership”), a Delaware limited partnership. The Operating Partnership, either directly or indirectly through partnerships or limited liability companies, holds fee title to all owned properties. As general partner of the Operating Partnership, we have the exclusive power to manage and conduct the business of the Operating Partnership. As of December 31, 2015, we owned approximately 97.6% of the interests in the Operating Partnership. The limited partners are reflected as noncontrolling interests in our financial statements and are generally individuals or entities that contributed interests in certain assets or entities to the Operating Partnership in exchange for units of limited partnership interest (“OP Units”). The holders of OP units are entitled to exchange them for our common shares on a 1:1 basis or for cash. The form of payment is at our election.
We operate in a manner intended to qualify as a REIT pursuant to the provisions of the Internal Revenue Code of 1986, as amended (the “Code”). Certain of our operations, including property and asset management, as well as ownership of certain land parcels, are conducted through taxable REIT subsidiaries, (“TRSs”), which are subject to federal and state income taxes.
1
Business Objectives, Strategies and Significant Transactions
Our business objective is to own and manage high quality shopping centers that generate cash flow for distribution to our shareholders and that have the potential for capital appreciation. To achieve this objective, we seek to acquire, develop, or redevelop shopping centers that meet our investment criteria. We also seek to recycle capital through the sale of land or shopping centers that we deem to be fully valued or that no longer meet our investment criteria. We use debt to finance our activities and focus on managing the amount, structure, and terms of our debt to limit the risks inherent in debt financing. From time to time, we enter into joint venture arrangements where we believe we can benefit by owning a partial interest in shopping centers and by earning fees for managing the centers for our partners.
We invest primarily in large, multi-anchored shopping centers that include national chain store tenants and market dominant supermarket tenants. National chain anchor tenants in our centers include, among others, TJ Maxx/Marshalls, Bed Bath and Beyond, Home Depot and Dick's Sporting Goods. Supermarket anchor tenants in our centers include, among others, Publix Super Market, Whole Foods, Kroger and Sprouts. Our shopping centers are primarily located in metropolitan markets such as Metro Detroit, Southeast Florida, Greater Denver, Cincinnati, St. Louis, Jacksonville, Tampa/Lakeland, Milwaukee, Chicago and Atlanta.
We also own land which is available for development or sale. At December 31, 2015, we had one project in pre-development and two projects where Phase I of the development was completed. The remaining future phases at those projects are in pre-development. We estimate that if we proceed with the development of the projects, up to approximately 750,000 square feet of gross leasable area ("GLA") could be developed, excluding various outparcels of land. It is our policy to start vertical construction on new development projects only after the project has received entitlements, significant anchor commitments and construction financing, if appropriate.
Our development and construction activities are subject to risks and uncertainties such as our inability to obtain the necessary governmental approvals for a project, our determination that the expected return on a project is not sufficient to warrant continuation of the planned development, or our change in plan or scope for the development. If any of these events occur, we may record an impairment provision.
Operating Strategies and Significant Transactions
Our operating objective is to maximize the risk-adjusted return on invested capital at our shopping centers. We seek to do so by increasing the property operating income of our centers, controlling our capital expenditures, monitoring our tenants’ credit risk and taking actions to mitigate our exposure to that tenant credit risk.
During 2015, our consolidated properties reported the following leasing activity:
Leasing Transactions | Square Footage | Base Rent/SF (1) | Prior Rent/SF | Tenant Improvements/SF | Leasing Commissions/SF | |||||||||||
Renewals | 202 | 1,321,966 | $ | 13.51 | $ | 12.47 | $ | 0.10 | $ | 0.13 | ||||||
New Leases - Comparable | 29 | 101,669 | 17.72 | 15.11 | 5.79 | 4.08 | ||||||||||
New Leases - Non-Comparable (2) | 55 | 371,416 | 17.05 | N/A | 36.21 | 3.66 | ||||||||||
Total | 286 | 1,795,051 | $ | 14.48 | N/A | $ | 7.89 | $ | 1.09 | |||||||
(1) Base rent represents contractual minimum rent under the new lease for the first 12 months of the term.
(2) Non-comparable lease transactions include leases for space vacant for greater than 12 months, leases for space which has been combined from smaller spaces or demised from larger spaces, and leases structured differently from the prior lease. As a result, there is no comparable prior rent per square foot to compare to the base rent per square foot of the new lease.
Investing Strategies and Significant Transactions
Our investing objective is to generate an attractive risk-adjusted return on capital invested in acquisitions and developments. In addition, we seek to sell land or shopping centers that we deem to be fully valued or that no longer meet our investment criteria. We underwrite acquisitions based upon current cash flow, projections of future cash flow, and scenario analyses that take into account the risks and opportunities of ownership. We underwrite development of new shopping centers on the same basis, but also take into account the unique risks of entitling land, constructing buildings, and leasing newly built space.
At December 31, 2015, we had ten redevelopment, expansion or re-anchoring projects in process with an anticipated cost of $76.8 million, of which $51.5 million remained to be invested. Completion dates are anticipated during 2016 and early 2017.
2
In July 2015, we acquired our partner's 80% interest in six properties held in the Ramco 450 Venture LLC ("Ramco 450") and subsequently own 100% of the related properties. We consolidated the six properties based upon a value of approximately $191.1 million, together with the assumption of three mortgage loans with unpaid principal balances totaling approximately $60.1 million, plus any related assets and liabilities. Total consideration paid for the properties was approximately $105.8 million, including closing costs. As part of the same transaction, we sold our 20% interest in one property owned by the same joint venture to our partner, which generated net cash proceeds to us of $10.6 million. The remaining property in the joint venture was sold to a third party in October 2015, generating net proceeds to us of $5.9 million.
In August 2015, we acquired our partner's 70% interest in one property held in the Ramco/Lion Venture L.P. ("RLV"). We consolidated the property based upon a value of approximately $47.0 million, with total consideration paid of $41.6 million, including approximately $8.7 million of our proportionate share of $29.8 million debt repaid at closing.
As a result of the above transactions, we gained control of the properties and recognized a gain on remeasurement of unconsolidated joint ventures of $7.9 million which represents the difference between the carrying value and the fair value of our previously held equity investment in the properties. Refer to Note 7 for additional information regarding our joint venture activity.
In addition to the above, we completed $16.1 million of acquisitions and $49.8 million of dispositions in 2015. Refer to Note 4 for additional information related to acquisitions and dispositions.
Financing Strategies and Significant Transactions
Our financing objective is to maintain a strong and flexible balance sheet in order to ensure access to capital at a competitive cost. In general, we seek to increase our financial flexibility by increasing our pool of unencumbered properties and borrowing on an unsecured basis. In keeping with our objective, we routinely benchmark our balance sheet on a variety of measures to our peers in the shopping center sector and to REITs in general.
Specifically, we completed the following financing transactions:
Debt
During 2015, we issued $150.0 million in senior unsecured notes, repaid $86.5 million in mortgage notes and assumed $60.1 million in mortgage notes related to our acquisitions. Refer to Note 9 for additional information related to our debt.
Equity
Through our controlled equity offering we issued 0.9 million common shares at an average share price of $19.28 and received approximately $17.1 million in net proceeds during the twelve months ended December 31, 2015. As of December 31, 2015, there were 3.1 million shares remaining under this program.
In April 2015, we converted preferred shares with a liquidation preference of $7.6 million into 532,628 common shares pursuant to the terms set forth in the convertible preferred shares prospectus supplement dated April 27, 2011 and incurred conversion costs of approximately $0.5 million.
As of December 31, 2015 we had net debt to total market capitalization of 42.3% as compared to 35.7%, at December 31, 2014. At December 31, 2015 and 2014 we had $286.5 million and $335.9 million, respectively, available to draw under our unsecured revolving line of credit.
Competition
See page 6 of Item 1A. “Risk Factors” for a description of competitive conditions in our business.
Environmental Matters
See page 12 of Item 1A. "Risk Factors" for a description of environmental risks for our business.
3
Employment
As of December 31, 2015, we had 120 full-time employees. None of our employees are represented by a collective bargaining unit. We believe that our relations with our employees are good.
Available Information
All reports we electronically file with, or furnish to, the SEC, including our Annual Report on Form 10-K, Quarterly Reports on Form 10-Q, Current Reports on Form 8-K and amendments to such reports, are available, free of charge, on our website at www.rgpt.com, as soon as reasonably practicable after we electronically file such reports with, or furnish those reports to, the SEC. Our Corporate Governance Guidelines, Code of Business Conduct and Ethics and Board of Trustees’ committee charters also are available on our website.
Shareholders may request free copies of these documents from:
Ramco-Gershenson Properties Trust
Attention: Investor Relations
31500 Northwestern Highway, Suite 300
Farmington Hills, MI 48334
4
Item 1A. Risk Factors
You should carefully consider each of the risks and uncertainties described below and elsewhere in this Annual Report on Form 10-K, as well as any amendments or updates reflected in subsequent filings with the SEC. We believe these risks and uncertainties, individually or in the aggregate, could cause our actual results to differ materially from expected and historical results and could materially and adversely affect our business operations, results of operations and financial condition. Further, additional risks and uncertainties not presently known to us or that we currently deem immaterial may also impair our results and business operations.
Operating Risks
National economic conditions and retail sales trends may adversely affect the performance of our properties.
Demand to lease space in our shopping centers generally fluctuates with the overall economy. Economic downturns often result in a lower rate of retail sales growth, or even declines in retail sales. In response, retailers that lease space in shopping centers typically reduce their demand for retail space during such downturns. As a result, economic downturns and unfavorable retail sales trends may diminish the income, cash flow, and value of our properties.
Our concentration of properties in Michigan and Florida makes us more susceptible to adverse market conditions in these states.
Our performance depends on the economic conditions in the markets in which we operate. In 2015, our wholly-owned properties located in Michigan and Florida accounted for approximately 29%, and 21%, respectively, of our annualized base rent. In 2014 Michigan and Florida accounted for approximately 29% and 23%, respectively. To the extent that market conditions in these or other states in which we operate deteriorate, the performance or value of our properties may be adversely affected.
Changes in the supply and demand for the type of space we lease to our tenants could affect the income, cash flow, and value of our properties.
Our shopping centers generally compete for tenants with similar properties located in the same neighborhood, community, or region. Although we believe we own high quality centers, competing centers may be newer, better located, or have a better tenant mix. In addition, new centers or retail stores may be developed, increasing the supply of retail space competing with our centers or taking retail sales from our tenants. Our tenants also compete with alternate forms of retailing, including on-line shopping, home shopping networks, and mail order catalogs. Alternate forms of retailing may reduce the demand for space in our shopping centers.
As a result, we may not be able to renew leases or attract replacement tenants as leases expire. When we do renew tenants or attract replacement tenants, the terms of renewals or new leases may be less favorable to us than current lease terms. In order to lease our vacancies, we often incur costs to reconfigure or modernize our properties to suit the needs of a particular tenant. Under competitive circumstances, such costs may exceed our budgets. If we are unable to lease vacant space promptly, if the rental rates upon a renewal or new lease are lower than expected, or if the costs incurred to lease space exceed our expectations, then the income and cash flow of our properties will decrease.
Our reliance on key tenants for significant portions of our revenues exposes us to increased risk of tenant bankruptcies that could adversely affect our income and cash flow.
As of December 31, 2015, we received 39.5% of our combined annualized base rents from our top 25 tenants, including our top four tenants: TJ Maxx/Marshalls (4.1%), Bed Bath & Beyond (2.8%), LA Fitness (2.4%) and Dick's Sporting Goods (2.0%). No other tenant represented more than 2.0% of our total annualized base rent. The credit risk posed by our major tenants varies.
If any of our major tenants experiences financial difficulties or files for bankruptcy protection, our operating results could be adversely affected. Bankruptcy filings by our tenants or lease guarantors generally delay our efforts to collect pre-bankruptcy receivables and could ultimately preclude full collection of these sums. If a tenant rejects a lease, we would have only a general unsecured claim for damages, which may be collectible only to the extent that funds are available and only in the same percentage as is paid to all other holders of unsecured claims. In 2015, no key tenant of ours filed for bankruptcy protection.
5
Our properties generally rely on anchor tenants to attract customers. The loss of anchor tenants may adversely impact the performance of our properties.
If any of our anchor tenants becomes insolvent, suffers a downturn in business, abandons occupancy, or decides not to renew its lease, such event would adversely impact the performance of the affected center. An abandonment or lease termination by an anchor tenant may give other tenants in the same shopping center the right to terminate their leases or pay less rent pursuant to the terms of their leases. Our leases with anchor tenants may, in certain circumstances, permit them to transfer their leases to other retailers. The transfer to a new anchor tenant could result in lower customer traffic to the center, which would affect our other tenants. In addition, a transfer of a lease to a new anchor tenant could give other tenants the right to make reduced rental payments or to terminate their leases.
We may be restricted from leasing vacant space based on existing exclusivity lease provisions with some of our tenants.
In a number of cases, our leases give a tenant the exclusive right to sell clearly identified types of merchandise or provide specific types of services at a particular shopping center. In other cases, leases with a tenant may limit the ability of other tenants to sell similar merchandise or provide similar services to that tenant. When leasing a vacant space, these restrictions may limit the number and types of prospective tenants suitable for that space. If we are unable to lease space on satisfactory terms, our operating results would be adversely impacted.
Increases in operating expenses could adversely affect our operating results.
Our operating expenses include, among other items, property taxes, insurance, utilities, repairs, and the maintenance of the common areas of our shopping centers. We may experience increases in our operating expenses, some or all of which may be out of our control. Most of our leases require that tenants pay for a share of property taxes, insurance and common area maintenance costs. However, if any property is not fully occupied or if recovery income from tenants is not sufficient to cover operating expenses, then we could be required to expend our own funds for operating expenses. In addition, we may be unable to renew leases or negotiate new leases with terms requiring our tenants to pay all the property tax, insurance, and common area maintenance costs that tenants currently pay, which would adversely affect our operating results.
If we suffer losses that are uninsured or in excess of our insurance coverage limits, we could lose invested capital and anticipated profits.
Catastrophic losses, such as losses resulting from wars, acts of terrorism, earthquakes, floods, hurricanes, and tornadoes or other natural disasters, pollution or environmental matters, generally are either uninsurable or not economically insurable, or may be subject to insurance coverage limitations, such as large deductibles or co-payments. Although we currently maintain “all risk” replacement cost insurance for our buildings, rents and personal property, commercial general liability insurance, and pollution and environmental liability insurance, our insurance coverage may be inadequate if any of the events described above occurs to, or causes the destruction of, one or more of our properties. Under that scenario, we could lose both our invested capital and anticipated profits from that property.
Our real estate assets may be subject to additional impairment provisions based on market and economic conditions.
On a periodic basis, we assess whether there are any indicators that the value of our real estate properties and other investments may be impaired. Under generally accepted accounting principles (“GAAP”) a property’s value is impaired only if the estimate of the aggregate future cash flows (undiscounted and without interest charges) to be generated by the property is less than the carrying value of the property. In our estimate of cash flows, we consider factors such as expected future operating income, trends and prospects, the effects of demand, competition and other factors. We are required to make subjective assessments as to whether there are impairments in the value of our real estate properties and other investments.
No assurance can be given that we will be able to recover the current carrying amount of all of our properties and those of our unconsolidated joint ventures. There can be no assurance that we will not take charges in the future related to the impairment of our assets. Any future impairment could have a material adverse effect on our results of operations in the period in which the charge is taken. We recorded an impairment provision of $2.5 million in 2015 related to our real estate properties. Refer to Note 1 Organization and Summary of Significant Accounting Policies - Accounting for the Impairment of Long-Lived Assets of the notes to the consolidated financial statements for a further information related to impairment provisions.
6
We do not control all decisions related to the activities of joint ventures in which we are invested, and we may have conflicts of interest with our joint venture partners.
As of December 31, 2015, we had interests in unconsolidated joint ventures that collectively own three shopping centers. Although we manage the properties owned by these joint ventures, we do not control the decisions for the joint ventures. Accordingly, we may not be able to resolve in our favor any issues which arise, or we may have to provide financial or other inducements to our joint venture partners to obtain such favorable resolution.
Various restrictive provisions and rights govern sales or transfers of interests in our joint ventures. We may be required to make decisions as to the purchase or sale of interests in our joint ventures at a time that is disadvantageous to us. In addition, a bankruptcy filing of one of our joint venture partners could adversely affect us because we may make commitments that rely on our partners to fund capital from time to time. The profitability of shopping centers held in a joint venture could also be adversely affected by the bankruptcy of one of our joint venture partners if, because of certain provisions of the bankruptcy laws, we were unable to make important decisions in a timely fashion or were to became subject to additional liabilities.
We may invest in additional joint ventures, the terms of which may differ from our existing joint ventures. In general, we would expect to share the rights and obligations to make major decisions regarding the venture with our partners, which would expose us to the risks identified above.
Our equity investment in each of our unconsolidated joint ventures is subject to impairment testing in the event of certain triggering events, such as a change in market conditions or events at properties held by those joint ventures. If the fair value of our equity investment is less than our net book value on an other than temporary basis, an impairment charge is required to be recognized under generally accepted accounting principles. Refer to Note 7 of the notes to the consolidated financial statements for further information related to our equity investments.
Market and economic conditions may impact our partners’ ability to perform in accordance with our real estate joint venture and partnership agreements resulting in a change in control.
Changes in control of our investments could result from events such as amendments to our real estate joint venture and partnership agreements, changes in debt guarantees or changes in ownership due to required capital contributions. Any changes in control will result in the revaluation of our investments to fair value, which could lead to impairment. We are unable to predict whether, or to what extent, a change in control may occur or what the impact of adverse market and economic conditions might be to our partners.
Our redevelopment projects may not yield anticipated returns, which would adversely affect our operating results.
Our redevelopment activities generally call for a capital commitment and project scope greater than that required to lease vacant space. To the extent a significant amount of construction is required, we are susceptible to risks such as permitting, cost overruns and timing delays as a result of the lack of availability of materials and labor, the failure of tenants to commit or fulfill their commitments, weather conditions, and other factors outside of our control. Any substantial unanticipated delays or expenses would adversely affect the investment returns from these redevelopment projects and adversely impact our operating results.
Investing Risks
We face competition for the acquisition and development of real estate properties, which may impede our ability to grow our operations or may increase the cost of these activities.
We compete with many other entities for the acquisition of shopping centers and land suitable for new developments, including other REITs, private institutional investors and other owner-operators of shopping centers. In particular, larger REITs may enjoy competitive advantages that result from, among other things, a lower cost of capital. These competitors may increase the market prices we would have to pay in order to acquire properties. If we are unable to acquire properties that meet our criteria at prices we deem reasonable, our ability to grow will be adversely affected.
Commercial real estate investments are relatively illiquid, which could hamper our ability to dispose of properties that no longer meet our investment criteria or respond to adverse changes in the performance of our properties.
Because real estate investments are relatively illiquid, our ability to promptly sell one or more properties in our portfolio in response to changing economic, financial and investment conditions is limited. The real estate market is affected by many factors, such as general economic conditions, supply and demand, availability of financing, interest rates and other factors that are beyond our
7
control. We cannot be certain that we will be able to sell any property for the price and other terms we seek, or that any price or other terms offered by a prospective purchaser would be acceptable to us. We also cannot estimate with certainty the length of time needed to find a willing purchaser and to complete the sale of a property. We may be required to expend funds to correct defects or to make improvements before a property can be sold. Factors that impede our ability to dispose of properties could adversely affect our financial condition and operating results.
We are seeking to develop new properties, an activity that has inherent risks including cost overruns related to entitling land, improving the site, constructing buildings, and leasing new space.
We are seeking to develop and construct retail properties at several land parcels we own. Our development and construction activities are subject to the following risks:
• | The pre-construction phase for a development project typically extends over several years, and the time to obtain anchor commitments, zoning and regulatory approvals, and financing can vary significantly from project to project; |
• | We may not be able to obtain the necessary zoning or other governmental approvals for a project, or we may determine that the expected return on a project is not sufficient. If we abandon our development activities with respect to a particular project, we may incur an impairment loss on our investment; |
• | Construction and other project costs may exceed our original estimates because of increases in material and labor costs, delays and costs to obtain anchor and other tenant commitments; |
• | We may not be able to obtain financing for construction; |
• | Occupancy rates and rents at a completed project may not meet our projections; and |
• | The time frame required for development, construction and lease-up of these properties means that we may have to wait years for a significant cash return. |
If any of these events occur, our development activities may have an adverse effect on our results of operations, including additional impairment provisions. For a detailed discussion of development projects, refer to Notes 3 and 6 of the notes to the consolidated financial statements.
Financing Risks
We have no corporate debt limitations.
Our management and Board of Trustees (“Board”) have discretion to increase the amount of our outstanding debt at any time. Subject to existing financial covenants, we could become more highly leveraged, resulting in an increase in debt service costs that could adversely affect our cash flow and the amount available for distribution to our shareholders. If we increase our debt, we may also increase the risk of default on our debt.
Our debt must be refinanced upon maturity, which makes us reliant on the capital markets on an ongoing basis.
We are not structured in a manner to generate and retain sufficient cash flow from operations to repay our debt at maturity. Instead, we expect to refinance our debt by raising equity, debt, or other capital prior to the time that it matures. As of December 31, 2015, we had $1.1 billion of outstanding indebtedness, net of deferred financing costs, including $1.1 million of capital lease obligations. The availability and price of capital can vary significantly. If we seek to refinance maturing debt when capital market conditions are restrictive, we may find capital scarce, costly, or unavailable. Refinancing debt at a higher cost would affect our operating results and cash available for distribution. The failure to refinance our debt at maturity would result in default and the exercise by our lenders of the remedies available to them, including foreclosure and, in the case of recourse debt, liability for unpaid amounts.
Increases in interest rates may affect the cost of our variable-rate borrowings, our ability to refinance maturing debt, and the cost of any such refinancings.
As of December 31, 2015, we had seven interest rate swap agreements in effect for an aggregate notional amount of $210.0 million converting our floating rate corporate debt to fixed rate debt. In addition we have entered into three forward starting interest rate swap agreements for an aggregate notional amount of $75.0 million. After accounting for these interest rate swap agreements, we had $87.4 million of variable rate debt outstanding, net of deferred financing costs. Increases in interest rates on our existing
8
indebtedness would increase our interest expense, which would adversely affect our cash flow and our ability to distribute cash to our shareholders. For example, if market rates of interest on our variable rate debt outstanding as of December 31, 2015 increased by 1.0%, the increase in interest expense on our existing variable rate debt would decrease future earnings and cash flows by approximately $0.9 million annually. Interest rate increases could also constrain our ability to refinance maturing debt because lenders may reduce their advance rates in order to maintain debt service coverage ratios.
Our mortgage debt exposes us to the risk of loss of property, which could adversely affect our financial condition.
As of December 31, 2015, we had $322.5 million of mortgage debt, net of unamortized deferred financing costs, encumbering our properties. A default on any of our mortgage debt may result in foreclosure actions by lenders and ultimately our loss of the mortgaged property. We have entered into mortgage loans which are secured by multiple properties and contain cross-collateralization and cross-default provisions. Cross-collateralization provisions allow a lender to foreclose on multiple properties in the event that we default under the loan. Cross-default provisions allow a lender to foreclose on the related property in the event a default is declared under another loan. For federal income tax purposes, a foreclosure of any of our properties would be treated as a sale of the property for a purchase price equal to the outstanding balance of the debt secured by the mortgage. If the outstanding balance of the debt secured by the mortgage exceeds our tax basis in the property, we would recognize taxable income on foreclosure but would not receive any cash proceeds.
Financial covenants may restrict our operating, investing, or financing activities, which may adversely impact our financial condition and operating results.
The financial covenants contained in our mortgages and debt agreements reduce our flexibility in conducting our operations and create a risk of default on our debt if we cannot continue to satisfy them. The mortgages on our properties contain customary negative covenants such as those that limit our ability, without the prior consent of the lender, to further mortgage the applicable property or to discontinue insurance coverage. In addition, if we breach covenants in our debt agreements, the lender can declare a default and require us to repay the debt immediately and, if the debt is secured, can ultimately take possession of the property securing the loan.
Our outstanding line of credit contains customary restrictions, requirements and other limitations on our ability to incur indebtedness, including limitations on the maximum ratio of total liabilities to assets, the minimum fixed charge coverage, and the minimum tangible net worth. Our ability to borrow under our line of credit is subject to compliance with these financial and other covenants. We rely on our ability to borrow under our line of credit to finance acquisition, development, and redevelopment activities and for working capital. If we are unable to borrow under our line of credit, our financial condition and results of operations would be adversely impacted.
Because we must distribute a substantial portion of our income annually in order to maintain our REIT status, we may not retain sufficient cash from operations to fund our investing needs.
As a REIT, we are subject to annual distribution requirements under the Code. In general, we must distribute at least 90% of our REIT taxable income annually, excluding net capital gains, to our shareholders to maintain our REIT status. We intend to make distributions to our shareholders to comply with the requirements of the Code.
Differences in timing between the recognition of taxable income and the actual receipt of cash could require us to sell assets or borrow funds on a short-term or long-term basis to meet the 90% distribution requirement. In addition, the distribution requirement reduces the amount of cash we retain for use in funding our capital requirements and our growth. As a result, we have historically funded our acquisition, development and redevelopment activities by any of the following: selling assets that no longer meet our investment criteria; selling common shares and preferred shares; borrowing from financial institutions; and entering into joint venture transactions with third parties. Our failure to obtain funds from these sources could limit our ability to grow, which could have a material adverse effect on the value of our securities.
9
There may be future dilution of our common shares
Our Declaration of Trust authorizes our Board to, among other things, issue additional common or preferred shares, or securities convertible or exchangeable into equity securities, without shareholder approval. We may issue such additional equity or convertible securities to raise additional capital. The issuance of any additional common or preferred shares or convertible securities could be dilutive to holders of our common shares. Moreover, to the extent that we issue restricted shares, options or warrants to purchase our common shares in the future and those options or warrants are exercised or the restricted shares vest, our shareholders may experience further dilution. Holders of our common shares have no preemptive rights that entitle them to purchase a pro rata share of any offering of shares of any class or series and, therefore, such sales or offerings could result in increased dilution to our shareholders.
We may issue debt and equity securities or securities convertible into equity securities, any of which may be senior to our common shares as to distributions and in liquidation, which could negatively affect the value of our common shares.
During 2015 we issued 0.9 million common shares through our controlled equity offering. In addition, there were 327,732 shares of unvested restricted common shares and options to purchase 107,165 common shares outstanding at December 31, 2015.
Corporate Risks
The price of our common shares may fluctuate significantly.
The market price of our common shares fluctuates based upon numerous factors, many of which are outside of our control. A decline in our share price, whether related to our operating results or not, may constrain our ability to raise equity in pursuit of our business objectives. In addition, a decline in price may affect the perceptions of lenders, tenants, or others with whom we transact. Such parties may withdraw from doing business with us as a result. An inability to raise capital at a suitable cost or at any cost, or to do business with certain tenants or other parties, would affect our operations and financial condition.
Our failure to qualify as a REIT would result in higher taxes and reduced cash available for distribution to our shareholders.
We intend to operate in a manner so as to qualify as a REIT for federal income tax purposes. Our continued qualification as a REIT will depend on our satisfaction of certain asset, income, investment, organizational, distribution, shareholder ownership and other requirements on a continuing basis. Our ability to satisfy the asset requirements depends upon our analysis of the fair market values of our assets, some of which are not susceptible to a precise determination, and for which we will not obtain independent appraisals. In addition, our compliance with the REIT income and asset requirements depends upon our ability to manage successfully the composition of our income and assets on an ongoing basis. Moreover, the proper classification of an instrument as debt or equity for federal income tax purposes may be uncertain in some circumstances, which could affect the application of the REIT qualification requirements. Accordingly, there can be no assurance that the Internal Revenue Service (“IRS”) will not contend that our interests in subsidiaries or other issuers constitute a violation of the REIT requirements. Moreover, future economic, market, legal, tax or other considerations may cause us to fail to qualify as a REIT.
If we were to fail to qualify as a REIT in any taxable year, we would be subject to federal income tax, including any applicable alternative minimum tax, on our taxable income at regular corporate rates, and distributions to shareholders would not be deductible by us in computing our taxable income. Any such corporate tax liability could be substantial and would reduce the amount of cash available for distribution to our shareholders, which in turn could have an adverse impact on the value of, and trading prices for, our common shares. Unless entitled to relief under certain Code provisions, we also would be disqualified from taxation as a REIT for the four taxable years following the year during which we ceased to qualify as a REIT.
Even as a REIT, we may be subject to various federal income and excise taxes, as well as state and local taxes.
Even as a REIT, we may be subject to federal income and excise taxes in various situations, such as if we fail to distribute all of our REIT taxable income. We also will be required to pay a 100% tax on non-arm’s length transactions between us and our TRSs and on any net income from sales of property that the IRS successfully asserts was property held for sale to customers in the ordinary course of business. Additionally, we may be subject to state or local taxation in various state or local jurisdictions, including those in which we transact business. The state and local tax laws may not conform to the federal income tax treatment. Any taxes imposed on us would reduce our operating cash flow and net income.
The rules dealing with federal income taxation are constantly under review by persons involved in the legislative process and by the IRS and the United States Treasury Department. Changes to tax laws, which may have retroactive application, could adversely affect our shareholders or us. We cannot predict how changes in tax laws might affect our shareholders or us.
10
We are party to litigation in the ordinary course of business, and an unfavorable court ruling could have a negative effect on us.
We are the defendant in a number of claims brought by various parties against us. Although we intend to exercise due care and consideration in all aspects of our business, it is possible additional claims could be made against us. We maintain insurance coverage including general liability coverage to help protect us in the event a claim is awarded; however, some claims may be uninsured. In the event that claims against us are successful and uninsured or underinsured, or we elect to settle claims that we determine are in our interest to settle, our operating results and cash flow could be adversely impacted. In addition, an increase in claims and/or payments could result in higher insurance premiums, which could also adversely affect our operating results and cash flow.
We are subject to various environmental laws and regulations which govern our operations and which may result in potential liability.
Under various federal, state and local laws, ordinances and regulations relating to the protection of the environment, a current or previous owner or operator of real estate may be liable for the costs of removal or remediation of certain hazardous or toxic substances disposed, stored, released, generated, manufactured or discharged from, on, at, onto, under or in such property. Environmental laws often impose such liability without regard to whether the owner or operator knew of, or was responsible for, the presence or release of such hazardous or toxic substance. The presence of such substances, or the failure to properly remediate such substances when present, released or discharged, may adversely affect the owner’s ability to sell or rent such property or to borrow using such property as collateral. The cost of any required remediation and the liability of the owner or operator therefore as to any property is generally not limited under such environmental laws and could exceed the value of the property and/or the aggregate assets of the owner or operator. Persons who arrange for the disposal or treatment of hazardous or toxic substances may also be liable for the cost of removal or remediation of such substances at a disposal or treatment facility, whether or not such facility is owned or operated by such persons. In addition to any action required by federal, state or local authorities, the presence or release of hazardous or toxic substances on or from any property could result in private plaintiffs bringing claims for personal injury or other causes of action.
In connection with ownership (direct or indirect), operation, management and development of real properties, we have the potential to be liable for remediation, releases or injury. In addition, environmental laws impose on owners or operators the requirement of ongoing compliance with rules and regulations regarding business-related activities that may affect the environment. Such activities include, for example, the ownership or use of transformers or underground tanks, the treatment or discharge of waste waters or other materials, the removal or abatement of asbestos-containing materials (“ACMs”) or lead-containing paint during renovations or otherwise, or notification to various parties concerning the potential presence of regulated matters, including ACMs. Failure to comply with such requirements could result in difficulty in the lease or sale of any affected property and/or the imposition of monetary penalties, fines or other sanctions in addition to the costs required to attain compliance. Several of our properties have or may contain ACMs or underground storage tanks; however, we are not aware of any potential environmental liability which could reasonably be expected to have a material impact on our financial position or results of operations. No assurance can be given that future laws, ordinances or regulations will not impose any material environmental requirement or liability, or that a material adverse environmental condition does not otherwise exist.
Our business and operations would suffer in the event of system failures or cyber security attacks.
We rely upon information technology network and systems, some of which are managed by third parties, to process, transmit and store electronic information, and to manage and support a variety of business processes and activities. Despite the implementation of security measures and the existence of a Disaster Recovery Plan for our internal information technology systems, our systems are vulnerable to damages from any number of sources, including energy blackouts, natural disasters, terrorism, war, telecommunication failures and cyber security attacks, such as computer viruses or unauthorized access. Any system failure or accident that causes interruptions in our operations could result in a material disruption to our business. We may also incur additional costs to remedy damages caused by such disruptions. Risks that could result from a cyber incident include operational interruption, damage to our relationships with tenants and private data disclosures including, personally identifiable, confidential or proprietary information. Any compromise of our security could result in a violation of applicable privacy and other laws, significant legal and financial exposure, damage to our reputation, loss or misuse of the information and a loss of confidence in our security measures, which could harm our business.
Restrictions on the ownership of our common shares are in place to preserve our REIT status.
Our Declaration of Trust restricts ownership by any one shareholder to no more than 9.8% of our outstanding common shares, subject to certain exceptions granted by our Board. The ownership limit is intended to ensure that we maintain our REIT status
11
given that the Code imposes certain limitations on the ownership of the stock of a REIT. Not more than 50% in value of our outstanding shares of beneficial interest may be owned, directly or indirectly by five or fewer individuals (as defined in the Code) during the last half of any taxable year. If an individual or entity were found to own constructively more than 9.8% in value of our outstanding shares, then any excess shares would be transferred by operation of our Declaration of Trust to a charitable trust, which would sell such shares for the benefit of the shareholder in accordance with procedures specified in our Declaration of Trust.
The ownership limit may discourage a change in control, may discourage tender offers for our common shares, and may limit the opportunities for our shareholders to receive a premium for their shares. Upon due consideration, our Board previously has granted limited exceptions to this restriction for certain shareholders who requested an increase in their ownership limit. However, the Board has no obligation to grant such limited exceptions in the future.
Certain anti-takeover provisions of our Declaration of Trust and Bylaws may inhibit a change of our control.
Certain provisions contained in our Declaration of Trust and Bylaws and the Maryland General Corporation Law, as applicable to Maryland REITs, may discourage a third party from making a tender offer or acquisition proposal to us. These provisions and actions may delay, deter or prevent a change in control or the removal of existing management. These provisions and actions also may delay or prevent the shareholders from receiving a premium for their common shares of beneficial interest over then-prevailing market prices.
These provisions and actions include:
• | the REIT ownership limit described above; |
• | authorization of the issuance of our preferred shares of beneficial interest with powers, preferences or rights to be determined by our Board; |
• | special meetings of our shareholders may be called only by the chairman of our Board, the president, one-third of the Trustees, or the secretary upon the written request of the holders of shares entitled to cast not less than a majority of all the votes entitled to be cast at such meeting; |
• | a two-thirds shareholder vote is required to approve some amendments to our Declaration of Trust; |
• | our Bylaws contain advance-notice requirements for proposals to be presented at shareholder meetings; and |
• | our Board, without the approval of our shareholders, may from time to time (i) amend our Declaration of Trust to increase or decrease the aggregate number of shares of beneficial interest, or the number of shares of beneficial interest of any class, that we have authority to issue, and (ii) reclassify any unissued shares of beneficial interest into one or more classes or series of shares of beneficial interest. |
In addition, the Trust, by Board action, may elect to be subject to certain provisions of the Maryland General Corporation Law that inhibit takeovers such as the provision that permits the Board by way of resolution to classify itself, notwithstanding any provision our Declaration of Trust or Bylaws.
Certain officers and trustees may have potential conflicts of interests with respect to properties contributed to the Operating Partnership in exchange for OP Units.
Certain of our officers and members of our Board of Trustees own OP Units obtained in exchange for contributions of their partnership interests in properties to the Operating Partnership. By virtue of this exchange, these individuals may have been able to defer some, if not all, of the income tax liability they could have incurred if they sold the properties for cash. As a result, these individuals may have potential conflicts of interest with respect to these properties, such as sales or refinancings that might result in federal income tax consequences.
Our success depends on key personnel whose continued service is not guaranteed.
We depend on the efforts and expertise of our senior management team to manage our day-to-day operations and strategic business direction. While we have retention and severance agreements with certain members of our executive management team that provide for certain payments in the event of a change of control or termination without cause, we do not have employment agreements with all of the members of our executive management team. Therefore, we cannot guarantee their continued service. The loss of their services, and our inability to find suitable replacements, could have an adverse effect on our operations.
12
Changes in accounting standards may adversely impact our financial results.
The Financial Accounting Standards Board, in conjunction with the SEC, has several key projects on its agenda that could impact how we currently account for material transactions, including lease accounting and other convergence projects with the International Accounting Standards Board. At this time, we are unable to predict with certainty which, if any, proposals may be passed or what level of impact any such proposal could have on the presentation of our consolidated financial statements, results of operations and financial ratios required by our debt covenants.
Item 1B. Unresolved Staff Comments.
None.
13
Item 2. Properties
As of December 31, 2015, we owned and managed a portfolio of 73 shopping centers and one office building with approximately 15.9 million square feet ("SF") of GLA. Our wholly-owned properties consist of 70 shopping centers and one office building comprising approximately 15.3 million SF.
Property Name | Location City | State | Ownership % | Year Built / Acquired / Redeveloped | Total GLA | % Leased | Average base rent per leased SF (1) | Anchor Tenants (2) | ||||||||||||
Colorado (3) | ||||||||||||||||||||
Front Range Village | Fort Collins | CO | 100 | % | 2008/2014/NA | 459,307 | 95.1 | % | $ | 19.56 | CA Technologies, Inc., Charming Charlie, Cost Plus World Markets, DSW Shoe Warehouse, Microsoft Corporation, Party City, Sports Authority, Sprouts Farmers Market, Staples, Toys "R" Us, Ulta Beauty, (Fort Collins Library), (Lowes), (Target) | |||||||||
Harvest Junction North | Longmont | CO | 100 | % | 2006/2012/NA | 183,155 | 100 | % | 16.88 | Best Buy, Dick's Sporting Goods, Dollar Tree, DSW Shoe Warehouse, Staples | ||||||||||
Harvest Junction South | Longmont | CO | 100 | % | 2006/2012/NA | 176,960 | 97.2 | % | 14.79 | Bed Bath & Beyond, Marshalls, Michaels, Petco, Ross Dress for Less, (Lowe's) | ||||||||||
Florida (16) | ||||||||||||||||||||
Coral Creek Shops | Coconut Creek | FL | 100 | % | 1992/2002/NA | 109,312 | 92.7 | % | 17.90 | Publix | ||||||||||
Cypress Point | Clearwater | FL | 100 | % | 1983/2007/NA | 167,280 | 95.3 | % | 12.27 | Burlington Coat Factory, Chuck E. Cheese's, The Fresh Market | ||||||||||
Lakeland Park Center | Lakeland | FL | 100 | % | 2014 | 210,422 | 98.1 | % | 13.63 | Dick's Sporting Goods, Floor & Décor, Old Navy, PetSmart, Ross Dress for Less, Shoe Carnival, Ulta Beauty | ||||||||||
Marketplace of Delray | Delray Beach | FL | 100 | % | 1981/2005/2010 | 241,715 | 95.8 | % | 13.80 | Beall's Outlet, Dollar Tree, Office Depot, Ross Dress for Less, Winn-Dixie | ||||||||||
Mission Bay Plaza | Boca Raton | FL | 100 | % | 1989/2004/NA | 264,704 | 97.5 | % | 21.27 | The Fresh Market, Golfsmith, LA Fitness, OfficeMax, Toys "R" Us | ||||||||||
Parkway Shops | Jacksonville | FL | 100 | % | 2013/2011/NA | 144,114 | 100 | % | 11.15 | Dick's Sporting Goods, Marshalls | ||||||||||
River City Marketplace | Jacksonville | FL | 100 | % | 2005/2005/NA | 557,087 | 99.1 | % | 17.19 | Ashley Furniture HomeStore, Bed Bath & Beyond, Best Buy, Cracker Barrel, Gander Mountain, Michaels, OfficeMax, Old Navy, PetSmart, Ross Dress for Less, Hollywood Theaters, (Lowe's), (Wal-Mart Supercenter) | ||||||||||
River Crossing Centre | New Port Richey | FL | 100 | % | 1998/2003/NA | 62,038 | 98.5 | % | 12.69 | Publix | ||||||||||
Rivertowne Square | Deerfield Beach | FL | 100 | % | 1980/1998/2010 | 150,321 | 88.6 | % | 9.97 | Beall's, Winn-Dixie | ||||||||||
14
Property Name | Location City | State | Ownership % | Year Built /Acquired / Redeveloped | Total GLA | % Leased | Average base rent per leased SF (1) | Anchor Tenants (2) | ||||||||||||
Shoppes of Lakeland | Lakeland | FL | 100 | % | 1985/1996/NA | 183,842 | 93.3 | % | $ | 12.34 | Ashley Furniture HomeStore, Dollar Tree, Michaels, Petco, Staples, T.J. Maxx, (Target) | |||||||||
The Crossroads | Royal Palm Beach | FL | 100 | % | 1988/2002/NA | 121,509 | 97.2 | % | 15.98 | Dollar Tree, Publix, Walgreens | ||||||||||
Treasure Coast Commons | Jensen Beach | FL | 100 | % | 1996/2004/NA | 92,979 | 100 | % | 12.26 | Barnes & Noble, OfficeMax, Sports Authority | ||||||||||
Village Lakes Shopping Center | Land O' Lakes | FL | 100 | % | 1987/1997/NA | 168,751 | 83.1 | % | 8.64 | Beall's Outlet, Dollar Tree, Marshalls, Ross Dress for Less, You Fit Health Club | ||||||||||
Village Plaza | Lakeland | FL | 100 | % | 1989/2004/NA | 158,956 | 95.1 | % | 11.62 | Big Lots, Hobby Lobby, Party City | ||||||||||
Vista Plaza | Jensen Beach | FL | 100 | % | 1998/2004/NA | 109,761 | 100 | % | 13.59 | Bed Bath & Beyond, Michaels, Total Wine & More | ||||||||||
West Broward Shopping Center | Plantation | FL | 100 | % | 1965/2005/NA | 152,973 | 100 | % | 11.33 | Badcock, DD's Discounts, Dollar Tree, Save-A-Lot, US Postal Service, Walgreens | ||||||||||
Georgia (4) | ||||||||||||||||||||
Centre at Woodstock | Woodstock | GA | 100 | % | 1997/2004/NA | 86,748 | 98.6 | % | 12.04 | Publix | ||||||||||
Holcomb Center | Roswell | GA | 100 | % | 1986/1996/2010 | 106,003 | 71.5 | % | 12.58 | Studio Movie Grill | ||||||||||
Peachtree Hill | Duluth | GA | 100 | % | 1986/2007/NA | 154,700 | 98.8 | % | 13.34 | Kroger, LA Fitness | ||||||||||
Promenade at Pleasant Hill | Duluth | GA | 100 | % | 1993/2004/NA | 261,808 | 95.0 | % | 9.67 | Farmers Home Furniture, K1 Speed, LA Fitness, Publix | ||||||||||
Illinois (5) | ||||||||||||||||||||
Deer Grove Centre | Palatine | IL | 100 | % | 1997/2013/2013 | 237,876 | 88.1 | % | 8.46 | Petco, Ross Dress for Less (4),T.J. Maxx, (Target), Hobby Lobby(4) | ||||||||||
Liberty Square | Wauconda | IL | 100 | % | 1987/2010/2008 | 107,427 | 83.3 | % | 13.70 | Jewel-Osco | ||||||||||
Market Plaza | Glen Ellyn | IL | 100 | % | 1965/2007/2009 | 163,054 | 95.1 | % | 15.53 | Jewel-Osco, Ross Dress for Less, Staples | ||||||||||
Mount Prospect Plaza | Mount Prospect | IL | 100 | % | 1962/2013/2013 | 300,682 | 89.5 | % | 12.05 | Aldi, Dollar Tree, LA Fitness, Marshalls, Petco, Ross Dress for Less, Walgreens | ||||||||||
Rolling Meadows Shopping Center | Rolling Meadows | IL | 100 | % | 1956/2008/1995 | 134,012 | 90.7 | % | 11.50 | Dollar Tree, Jewel-Osco, Northwest Community Hospital | ||||||||||
Indiana (1) | ||||||||||||||||||||
Merchants' Square | Carmel | IN | 100 | % | 1970/2010/2014 | 248,369 | 78.6 | % | 12.91 | Bang Fitness, Cost Plus, Flix Brewhouse, Hancock Fabrics, Petco, Tuesday Morning, (Marsh Supermarket) | ||||||||||
Kentucky (1) | ||||||||||||||||||||
Buttermilk Towne Center | Crescent Springs | KY | 100 | % | 2005/2014/NA | 277,533 | 100 | % | 9.22 | Field & Stream, Home Depot, LA Fitness, Remke Market | ||||||||||
Maryland (1) | ||||||||||||||||||||
Crofton Centre | Crofton | MD | 100 | % | 1974/1996/NA | 252,230 | 97.3 | % | 8.29 | Gold's Gym, Goodwill, Hibachi Grill & Supreme Buffet, Kmart, Shoppers Food Warehouse, United Tile and Granite | ||||||||||
Michigan (22) | ||||||||||||||||||||
Clinton Pointe | Clinton Township | MI | 100 | % | 1992/2003/NA | 135,330 | 97.6 | % | 9.66 | Famous Footwear, OfficeMax, Planet Fitness, Sports Authority, (Target) | ||||||||||
Clinton Valley | Sterling Heights | MI | 100 | % | 1977/1996/2009 | 205,435 | 98.2 | % | 12.04 | DSW Shoe Warehouse, Famous Furniture, Hobby Lobby, Office Depot, OptimEyes | ||||||||||
15
Property Name | Location City | State | Ownership % | Year Built /Acquired / Redeveloped | Total GLA | % Leased | Average base rent per leased SF (1) | Anchor Tenants (2) | ||||||||||||
Gaines Marketplace | Gaines Township | MI | 100 | % | 2004/2004/NA | 60,576 | 100 | % | $ | 15.94 | Staples, (Target), (Meijer) | |||||||||
Hoover Eleven | Warren | MI | 100 | % | 1989/2003/NA | 280,719 | 84.5 | % | 11.61 | CVS, Dollar Tree, Dress Barn/Dress Barn Woman, Dunham's, Kroger, Marshalls | ||||||||||
Hunter's Square | Farmington Hills | MI | 100 | % | 1988/2005/NA | 353,951 | 99.1 | % | 16.60 | Bed Bath & Beyond, buybuy Baby, Marshalls, Old Navy, T.J. Maxx, Saks Fifth Avenue(4) | ||||||||||
Jackson Crossing | Jackson | MI | 100 | % | 1967/1996/2002 | 420,530 | 92.6 | % | 11.39 | Bed Bath & Beyond, Best Buy, Citi Trends, Dollar Tree, Jackson 10 Theater, Kohl's, MC Sporting Goods, T.J. Maxx, Toys "R" Us, Ulta Beauty, (Sears), (Target) | ||||||||||
Jackson West | Jackson | MI | 100 | % | 1996/1996/1999 | 209,800 | 97.7 | % | 7.41 | GFS Marketplace, Lowe's, Michaels, OfficeMax, PetSmart | ||||||||||
Lakeshore Marketplace | Norton Shores | MI | 100 | % | 1996/2003/NA | 342,991 | 96.0 | % | 8.75 | Barnes & Noble, Dollar Tree, DSW Shoe Warehouse, Dunham's, Gordmans, Hobby Lobby, Old Navy, Petco, T.J. Maxx, Toys "R" Us, (Target) | ||||||||||
Livonia Plaza | Livonia | MI | 100 | % | 1988/2003/NA | 137,391 | 98.6 | % | 11.29 | Kroger, T.J. Maxx | ||||||||||
Millennium Park | Livonia | MI | 100 | % | 2000/2005/NA | 272,568 | 100 | % | 14.44 | Five Below, Home Depot, Marshalls, Michaels, PetSmart, Ulta Beauty, (Costco), (Meijer) | ||||||||||
New Towne Plaza | Canton Township | MI | 100 | % | 1975/1996/2005 | 192,587 | 99.0 | % | 10.93 | DSW Shoe Warehouse, Jo-Ann, Kohl's | ||||||||||
Oak Brook Square | Flint | MI | 100 | % | 1982/1996/2008 | 152,073 | 96.5 | % | 9.57 | Dollar Tree, Hobby Lobby, T.J. Maxx | ||||||||||
Roseville Towne Center | Roseville | MI | 100 | % | 1963/1996/2004 | 76,998 | 100 | % | 12.05 | CVS, Dollar Tree, Five Below, Marshalls, (Wal-Mart) | ||||||||||
Shoppes at Fairlane Meadows | Dearborn | MI | 100 | % | 1987/2003/2007 | 157,225 | 100 | % | 13.53 | Best Buy, Citi Trends, David's Bridal, Dollar Tree, (Burlington Coat Factory), (Target) | ||||||||||
Southfield Plaza | Southfield | MI | 100 | % | 1969/1996/2003 | 190,099 | 100 | % | 8.87 | Big Lots, Burlington Coat Factory, Forman Mills | ||||||||||
Tel-Twelve | Southfield | MI | 100 | % | 1968/1996/2005 | 523,411 | 100 | % | 11.27 | Best Buy, DSW Shoe Warehouse, Lowe's, Meijer, Michaels, Office Depot, PetSmart, Pier1 Imports | ||||||||||
The Auburn Mile 1 | Auburn Hills | MI | 100 | % | 2000/1999/NA | 90,553 | 100 | % | 11.05 | Jo-Ann, Staples, (Best Buy), (Costco), (Meijer), (Target) | ||||||||||
The Shops at Old Orchard | West Bloomfield | MI | 100 | % | 1972/2007/2011 | 96,768 | 100 | % | 18.04 | Plum Market, Witbeck Home Appliance | ||||||||||
Troy Marketplace | Troy | MI | 100 | % | 2000/2005/2010 | 217,754 | 100 | % | 17.10 | Airtime, Golfsmith, LA Fitness, Nordstrom Rack, PetSmart, Total Hockey, (REI) | ||||||||||
West Oaks I | Novi | MI | 100 | % | 1979/1996/2004 | 252,170 | 95.3 | % | 12.65 | Big Lots, David's Bridal, DSW Shoe Warehouse, Gander Mountain, Home Goods & Michaels-Sublease of JLPK-Novi LLC, Old Navy, Party City | ||||||||||
West Oaks II | Novi | MI | 100 | % | 1986/1996/2000 | 167,954 | 97.1 | % | 17.79 | Jo-Ann, Marshalls, (Bed Bath & Beyond), (Kohl's), (Toys "R" Us), (Value City Furniture) | ||||||||||
16
Property Name | Location City | State | Ownership % | Year Built /Acquired / Redeveloped | Total GLA | % Leased | Average base rent per leased SF (1) | Anchor Tenants (2) | ||||||||||||
Winchester Center | Rochester Hills | MI | 100 | % | 1980/2005/NA | 320,121 | 95.5 | % | $ | 10.47 | Bed Bath & Beyond, Dick's Sporting Goods, Famous Furniture, Legacy Volleyball Club, Marshalls, Michaels, Party City, PetSmart, Pier 1 Imports, Stein Mart | |||||||||
Minnesota (1) | ||||||||||||||||||||
Woodbury Lakes | Woodbury | MN | 100 | % | 2005/2014/NA | 305,086 | 89.7 | % | 22.31 | buybuy Baby, Charming Charlie, DSW Shoe Warehouse, Gap, H & M, Michaels, Victoria's Secret (Trader Joe's) | ||||||||||
Missouri (4) | ||||||||||||||||||||
Central Plaza | Ballwin | MO | 100 | % | 1970/2012/2012 | 166,431 | 100 | % | 11.60 | buybuy Baby, Five Below, Jo-Ann, OfficeMax, Ross Dress for Less, Tuesday Morning | ||||||||||
Deer Creek Shopping Center | Maplewood | MO | 100 | % | 1975/2013/2013 | 208,144 | 93.6 | % | 10.38 | buybuy Baby, GFS Marketplace, Jo-Ann, Marshalls, Ross Dress for Less, Shoe Carnival | ||||||||||
Heritage Place | Creve Coeur (St Louis) | MO | 100 | % | 1989/2011/2005 | 269,105 | 92.5 | % | 13.50 | Dierbergs Markets, Marshalls, Office Depot, Petco, T.J. Maxx | ||||||||||
Town & Country Crossing | Town & Country | MO | 100 | % | 2008/2011/2011 | 145,830 | 87.1 | % | 26.25 | Whole Foods Market, (Target) | ||||||||||
Ohio (8) | ||||||||||||||||||||
Bridgewater Falls | Hamilton | OH | 100 | % | 503,502 | 93.7 | % | 14.07 | Bed Bath & Beyond, Best Buy, Dick's Sporting Goods, J.C. Penney, Michaels, Old Navy, Party City, PetSmart, Staples, T.J. Maxx, Ulta Beauty, (Target) | |||||||||||
Crossroads Centre 1 | Rossford | OH | 100 | % | 2001/2001/NA | 344,045 | 98.6 | % | 8.83 | Giant Eagle(3), Home Depot, Michaels, T.J. Maxx, Tuesday Morning, (Target) | ||||||||||
Deerfield Towne Center | Mason | OH | 100 | % | 2004/2013/2013 | 462,396 | 91.8 | % | 19.29 | Ashley Furniture HomeStore, Bed Bath & Beyond, buybuy Baby, Charming Charlie's, Dick's Sporting Goods, Regal Cinemas, Ulta Beauty, Whole Foods Market, Crunch Fitness | ||||||||||
Olentangy Plaza | Columbus | OH | 100 | % | 1981/2007/1997 | 253,204 | 94.9 | % | 11.25 | Eurolife Furniture, Marshalls, Metro Fitness, Micro Center, Columbus Asia Market-Sublease of SuperValu, Tuesday Morning | ||||||||||
Rossford Pointe | Rossford | OH | 100 | % | 2006/2005/NA | 47,477 | 100 | % | 10.20 | MC Sporting Goods, PetSmart | ||||||||||
Spring Meadows Place | Holland | OH | 100 | % | 1987/1996/2005 | 311,396 | 81.9 | % | 10.79 | Ashley Furniture HomeStore, Big Lots, Dollar Tree, Guitar Center, OfficeMax, Party City, PetSmart, T.J. Maxx, (Best Buy), (Dick's Sporting Goods), (Sam's Club), (Target) | ||||||||||
The Shops on Lane Avenue | Upper Arlington | OH | 100 | % | 1952/2007/2004 | 169,035 | 92.3 | % | 22.00 | Bed Bath & Beyond, Pier 1 Imports, Ulta, Whole Foods Market | ||||||||||
Troy Towne Center (5) | Troy | OH | 100 | % | 1990/1996/2003 | 144,485 | 96.5 | % | 7.23 | Kohl's, Petco, (Wal-Mart Supercenter) | ||||||||||
17
Property Name | Location City | State | Ownership % | Year Built /Acquired / Redeveloped | Total GLA | % Leased | Average base rent per leased SF (1) | Anchor Tenants (2) | ||||||||||||
Wisconsin (4) | ||||||||||||||||||||
East Town Plaza | Madison | WI | 100 | % | 1992/2000/2000 | 208,472 | 82.3 | % | $ | 9.79 | Burlington Coat Factory, DSW Shoe Warehouse, Jo-Ann, Kirkland's Home, Marshalls, Party City, Ulta Beauty, (Shopko), (Babies "R" Us) | |||||||||
Nagawaukee Center | Delafield | WI | 100 | % | 1994/2012-13/NA | 219,538 | 97.4 | % | 14.15 | Kohl's, Marshalls, Sports Authority, (Sentry Foods) | ||||||||||
The Shoppes at Fox River | Waukesha | WI | 100 | % | 2009/2010/2011 | 237,392 | 100 | % | 14.48 | Hobby Lobby, Petco, Pick 'n Save, T.J. Maxx, Ulta Beauty, (Target) | ||||||||||
West Allis Towne Centre | West Allis | WI | 100 | % | 1987/1996/2011 | 326,265 | 92.6 | % | 8.93 | Burlington Coat Factory, Citi Trends, Dollar Tree, Harbor Freight Tools, Kmart, Lumber Liquidators, Party City, Ross Dress for Less, Xperience Fitness | ||||||||||
WHOLLY OWNED SHOPPING CENTERS TOTAL/AVERAGE | 15,224,435 | 94.7 | % | $ | 13.22 | |||||||||||||||
Virginia (1) | ||||||||||||||||||||
The Town Center at Aquia Office | Stafford | VA | 100 | % | 1989/1998/2009 | 99,393 | 65.0 | % | 26.34 | Cask Technologies, Davis Defense Group | ||||||||||
CONSOLIDATED PORTFOLIO / AVERAGE | 15,323,828 | 94.6 | % | $13.28 | ||||||||||||||||
JOINT VENTURE PORTFOLIO | ||||||||||||||||||||
Kissimmee West | Osceola | FL | 7 | % | 2005/2005/NA | 115,586 | 97.2 | % | $ | 12.69 | Jo-Ann, Marshalls, (Super Target) | |||||||||
Nora Plaza | Marion | IN | 7 | % | 1958/2007/2002 | 139,753 | 94.3 | % | 13.92 | Firestone, Marshalls, Whole Foods Market, (Target) | ||||||||||
Martin Square | Martin | FL | 30 | % | 1981/2005/NA | 330,134 | 85.6 | % | 6.64 | Home Depot, Old Time Pottery, Paradise Home & Patio, Staples, Walgreens | ||||||||||
Total/Average | 585,473 | 90.0 | % | $ | 9.75 | |||||||||||||||
CONSOLIDATED AND JV PORTFOLIO TOTAL / AVERAGE | 15,909,301 | 94.4 | % | $13.16 | ||||||||||||||||
Footnotes
(1) Average base rent per leased SF is calculated based on annual minimum contractual base rent pursuant to the tenant lease, excluding percentage rent, recovery income from tenants, and is net of tenant concessions. Percentage rent and recovery income from tenants is presented separately in our consolidated statements of operations and comprehensive income (loss) statement.
(2) Anchor tenant is defined as any tenant leasing 10,000 square feet or more. Tenants in parenthesis represent non-company owned GLA.
(3) Tenant closed - lease obligated.
(4) Space delivered to tenant.
(5) Center sold subsequent to December 31, 2015 in February 2016.
Our leases for tenant space under 10,000 square feet generally have terms ranging from three to five years. Tenant leases greater than or equal to 10,000 square feet generally have lease terms of five years or longer, and are considered anchor leases. Many of the anchor leases contain provisions allowing the tenant the option of extending the lease term at expiration at contracted rental rates that often include fixed rent increases, consumer price index adjustments or other market rate adjustments from the prior base rent. The majority of our leases provide for monthly payment of base rent in advance, percentage rent based on the tenant’s sales volume, reimbursement of the tenant’s allocable real estate taxes, insurance and common area maintenance (“CAM”) expenses and reimbursement for utility costs if not directly metered.
18
Major Tenants
The following table sets forth as of December 31, 2015 the GLA, of our existing properties leased to tenants for our wholly owned properties portfolio:
Type of Tenant | Annualized Base Rent | % of Total Annualized Base Rent | GLA (2) | % of Total GLA (2) | |||||||||
Anchor (1) | $ | 110,167,972 | 57.6 | % | 10,807,484 | 70.5 | % | ||||||
Retail (non-anchor) | 81,085,431 | 42.4 | % | 4,516,344 | 29.5 | % | |||||||
Total | $ | 191,253,403 | 100 | % | 15,323,828 | 100 | % | ||||||
(1) Anchor tenant is defined as any tenant leasing 10,000 square feet or more.
(2) GLA owned directly by us or our unconsolidated joint ventures.
19
The following table depicts, as of December 31, 2015, information regarding leases with the 25 largest retail tenants (in terms of annualized base rent) for our wholly owned properties portfolio:
Tenant Name | Credit Rating S&P/Moody's (1) | Number of Leases | GLA | % of Total GLA | Total Annualized Base Rent | Annualized Base Rent PSF | % of Annualized Base Rent | ||||||||||||||||
TJX Companies (2) | A+/A2 | 27 | 836,570 | 5.5 | % | $ | 7,909,159 | $ | 9.45 | 4.1 | % | ||||||||||||
Bed Bath & Beyond (3) | BBB+/Baa1 | 16 | 466,700 | 3.1 | % | 5,273,035 | 11.30 | 2.8 | % | ||||||||||||||
LA Fitness | B/B2 | 6 | 252,000 | 1.6 | % | 4,501,820 | 17.86 | 2.4 | % | ||||||||||||||
Dick's Sporting Goods (4) | --/-- | 7 | 353,764 | 2.3 | % | 3,825,418 | 10.81 | 2.0 | % | ||||||||||||||
Office Depot (5) | B-/B2 | 11 | 262,801 | 1.7 | % | 3,287,371 | 12.51 | 1.7 | % | ||||||||||||||
Ascena Retail (6) | BB/Ba2 | 29 | 162,384 | 1.1 | % | 3,197,068 | 19.69 | 1.7 | % | ||||||||||||||
Home Depot | A/A2 | 3 | 354,295 | 2.3 | % | 3,047,250 | 8.60 | 1.6 | % | ||||||||||||||
Petsmart | B+/-- | 10 | 208,863 | 1.4 | % | 3,040,114 | 14.56 | 1.6 | % | ||||||||||||||
Michaels Stores | -/B2 | 11 | 250,321 | 1.6 | % | 2,871,807 | 11.47 | 1.5 | % | ||||||||||||||
ULTA Salon | --/-- | 12 | 125,025 | 0.8 | % | 2,829,856 | 22.63 | 1.5 | % | ||||||||||||||
DSW Designer Shoe Warehouse | --/-- | 9 | 169,773 | 1.1 | % | 2,814,845 | 16.58 | 1.5 | % | ||||||||||||||
Dollar Tree | BB/Ba2 | 28 | 292,943 | 1.9 | % | 2,814,369 | 9.61 | 1.5 | % | ||||||||||||||
Best Buy | BB+/Baa1 | 6 | 201,895 | 1.3 | % | 2,758,634 | 13.66 | 1.4 | % | ||||||||||||||
Hobby Lobby | --/-- | 7 | 395,310 | 2.6 | % | 2,716,021 | 6.87 | 1.4 | % | ||||||||||||||
Regal Cinemas | B+/B1 | 2 | 119,080 | 0.8 | % | 2,468,623 | 20.73 | 1.3 | % | ||||||||||||||
Jo-Ann Fabric and Craft Stores | B/B3 | 6 | 198,947 | 1.3 | % | 2,429,479 | 12.21 | 1.3 | % | ||||||||||||||
Ross Stores (7) | A-/A3 | 12 | 307,232 | 2.0 | % | 2,428,890 | 7.91 | 1.3 | % | ||||||||||||||
Petco (8) | B/B3 | 11 | 160,366 | 1.0 | % | 2,368,568 | 14.77 | 1.2 | % | ||||||||||||||
Whole Foods | BBB-/Baa3 | 3 | 118,879 | 0.8 | % | 2,342,617 | 19.71 | 1.2 | % | ||||||||||||||
Kohl's | BBB/Baa1 | 6 | 363,081 | 2.4 | % | 2,292,253 | 6.31 | 1.2 | % | ||||||||||||||
Burlington Coat Factory | BB-/-- | 4 | 277,315 | 1.8 | % | 2,285,421 | 8.24 | 1.2 | % | ||||||||||||||
Gap, Inc.(9) | BBB-/Baa2 | 9 | 131,575 | 0.9 | % | 2,080,859 | 15.82 | 1.1 | % | ||||||||||||||
Gander Mountain | --/-- | 2 | 142,354 | 0.9 | % | 1,994,898 | 14.01 | 1.0 | % | ||||||||||||||
Sports Authority | --/Caa3 | 4 | 172,705 | 1.1 | % | 1,989,264 | 11.52 | 1.0 | % | ||||||||||||||
Lowe's Home Centers | A-/A3 | 2 | 270,394 | 1.8 | % | 1,919,646 | 7.10 | 1.0 | % | ||||||||||||||
Sub-Total top 25 tenants | 243 | 6,594,572 | 43.1 | % | $ | 75,487,285 | $ | 11.45 | 39.5 | % | |||||||||||||
Remaining tenants | 1,358 | 7,806,691 | 50.9 | % | 115,766,119 | 14.83 | 60.5 | % | |||||||||||||||
Sub-Total all tenants | 1,601 | 14,401,263 | 94.0 | % | $ | 191,253,404 | $ | 13.28 | 100 | % | |||||||||||||
Leased / Vacant | 240 | 922,565 | 6.0 | % | N/A | N/A | N/A | ||||||||||||||||
Total including vacant | 1,841 | 15,323,828 | 100 | % | $ | 191,253,404 | N/A | 100 | % | ||||||||||||||
(1) Source: Latest Company filings, as of December 31, 2015, per CreditRiskMonitor. | ||||||
(2) Marshalls (15) / TJ Maxx (12) | ||||||
(3) Bed Bath & Beyond (9) / Buy Buy Baby (5) / Cost Plus World Market (2) | ||||||
(4) Dick's Sporting Goods (6) / Field & Stream (1) | ||||||
(5) OfficeMax (7) / Office Depot (4) | ||||||
(6) Ann Taylor (3) / Catherine's (3) / Dress Barn (6) / Justice (5) / Lane Bryant (6) / Maurice's (6) | ||||||
(7) Ross Dress for Less (11) / DD's Discounts (1) | ||||||
(8) Petco (10) / Unleashed (1) | ||||||
(9) Old Navy (6) / Gap (2) / Banana Republic / (1) | ||||||
20
Lease Expirations
The following tables set forth a schedule of lease expirations, for our wholly owned portfolio, for the next ten years and thereafter, assuming that no renewal options are exercised:
ALL TENANTS
Expiring Leases As of December 31, 2015 | |||||||||||||||||
Year | Number of Leases | GLA (1) | Average Annualized Base Rent | Total Annualized Base Rent (2) | % of Total Annualized Base Rent | ||||||||||||
(per square foot) | |||||||||||||||||
(3) | 46 | 148,856 | $ | 10.01 | $ | 1,490,750 | 0.7 | % | |||||||||
2016 | 236 | 1,164,981 | 14.40 | 16,780,738 | 6.7 | % | |||||||||||
2017 | 258 | 1,590,652 | 14.81 | 23,565,221 | 14.6 | % | |||||||||||
2018 | 258 | 1,420,174 | 15.58 | 22,126,998 | 12.9 | % | |||||||||||
2019 | 191 | 1,424,017 | 13.99 | 19,924,036 | 10.3 | % | |||||||||||
2020 | 184 | 1,556,763 | 12.67 | 19,724,988 | 9.7 | % | |||||||||||
2021 | 122 | 1,552,029 | 12.31 | 19,098,606 | 7.9 | % | |||||||||||
2022 | 58 | 880,516 | 12.07 | 10,626,087 | 5.8 | % | |||||||||||
2023 | 73 | 1,168,594 | 12.60 | 14,724,454 | 5.8 | % | |||||||||||
2024 | 52 | 768,750 | 11.40 | 8,761,993 | 7.8 | % | |||||||||||
2025 | 50 | 805,162 | 13.41 | 10,795,112 | 4.6 | % | |||||||||||
2026 | 28 | 727,642 | 12.27 | 8,926,361 | 4.0 | % | |||||||||||
2027+ | 45 | 1,193,127 | 12.33 | 14,708,059 | 9.2 | % | |||||||||||
Sub-Total | 1,601 | 14,401,263 | $ | 13.28 | $ | 191,253,403 | 100 | % | |||||||||
Leased (4) | 9 | 87,985 | N/A | N/A | N/A | ||||||||||||
Vacant | 231 | 834,580 | N/A | N/A | N/A | ||||||||||||
Total | 1,841 | 15,323,828 | $ | 13.28 | $ | 191,253,403 | 100 | % | |||||||||
ANCHOR TENANTS (greater than or equal to 10,000 square feet)
Expiring Anchor Leases As of December 31, 2015 | |||||||||||||||||
Year | Number of Leases | GLA (1) | Average Annualized Base Rent | Total Annualized Base Rent (2) | % of Total Annualized Base Rent | ||||||||||||
(per square foot) | |||||||||||||||||
(3) | 3 | 47,010 | $ | 6.23 | $ | 293,000 | 0.3 | % | |||||||||
2016 | 22 | 604,072 | 9.41 | 5,683,463 | 5.2 | % | |||||||||||
2017 | 41 | 977,791 | 11.24 | 10,988,911 | 10.0 | % | |||||||||||
2018 | 34 | 824,684 | 11.56 | 9,530,471 | 8.7 | % | |||||||||||
2019 | 31 | 890,899 | 10.09 | 8,991,994 | 8.2 | % | |||||||||||
2020 | 35 | 1,093,586 | 9.35 | 10,220,929 | 9.3 | % | |||||||||||
2021 | 47 | 1,302,629 | 10.68 | 13,916,454 | 12.6 | % | |||||||||||
2022 | 24 | 755,265 | 10.42 | 7,873,216 | 7.1 | % | |||||||||||
2023 | 28 | 924,225 | 10.46 | 9,665,271 | 8.8 | % | |||||||||||
2024 | 20 | 640,133 | 9.77 | 6,252,221 | 5.7 | % | |||||||||||
2025 | 20 | 647,675 | 11.46 | 7,424,425 | 6.6 | % | |||||||||||
2026 | 13 | 668,377 | 11.02 | 7,366,643 | 6.7 | % | |||||||||||
2027+ | 21 | 1,095,603 | 10.92 | 11,960,974 | 10.8 | % | |||||||||||
Sub-Total | 339 | 10,471,949 | $ | 10.52 | $ | 110,167,972 | 100 | % | |||||||||
Leased (4) | 3 | 63,934 | N/A | N/A | N/A | ||||||||||||
Vacant | 16 | 271,601 | N/A | N/A | N/A | ||||||||||||
Total | 358 | 10,807,484 | $ | 10.52 | $ | 110,167,972 | 100 | % | |||||||||
(1) GLA owned directly by us or our unconsolidated joint ventures.
(2) Annualized Base Rent is based upon rents currently in place.
(3) Tenants currently under month to month lease or in the process of renewal.
(4) Lease has been executed, but space has not yet been delivered.
21
NON-ANCHOR TENANTS (less than 10,000 square feet)
Expiring Non-Anchor Leases As of December 31, 2015 | |||||||||||||||||||
Year | Number of Leases | GLA (2) | Average Annualized Base Rent | Total Annualized Base Rent (1) | % of Total Annualized Base Rent | ||||||||||||||
(per square foot) | |||||||||||||||||||
(3) | 43 | 101,846 | $ | 11.76 | $ | 1,197,750 | 1.5 | % | |||||||||||
2016 | 214 | 560,909 | 19.78 | 11,097,275 | 13.7 | % | |||||||||||||
2017 | 217 | 612,861 | 20.52 | 12,576,310 | 15.5 | % | |||||||||||||
2018 | 224 | 595,490 | 21.15 | 12,596,527 | 15.5 | % | |||||||||||||
2019 | 160 | 533,118 | 20.51 | 10,932,042 | 13.5 | % | |||||||||||||
2020 | 149 | 463,177 | 20.52 | 9,504,059 | 11.7 | % | |||||||||||||
2021 | 75 | 249,400 | 20.78 | 5,182,152 | 6.4 | % | |||||||||||||
2022 | 34 | 125,251 | 21.98 | 2,752,871 | 3.4 | % | |||||||||||||
2023 | 45 | 244,369 | 20.70 | 5,059,183 | 6.2 | % | |||||||||||||
2024 | 32 | 128,617 | 19.51 | 2,509,772 | 3.1 | % | |||||||||||||
2025 | 30 | 157,487 | 21.40 | 3,370,687 | 4.2 | % | |||||||||||||
2026 | 15 | 59,265 | 26.32 | 1,559,718 | 1.9 | % | |||||||||||||
2027+ | 24 | 97,524 | 28.17 | 2,747,085 | 3.4 | % | |||||||||||||
Sub-Total | 1,262 | 3,929,314 | $ | 20.64 | $ | 81,085,431 | 100 | % | |||||||||||
Leased (4) | 6 | 24,051 | N/A | N/A | N/A | ||||||||||||||
Vacant | 215 | 562,979 | N/A | N/A | N/A | ||||||||||||||
Total | 1,483 | 4,516,344 | $ | 20.64 | $ | 81,085,431 | 100 | % | |||||||||||
(1) GLA owned directly by us or our unconsolidated joint ventures.
(2) Annualized Base Rent is based upon rents currently in place.
(3) Tenants currently under month to month lease or in the process of renewal.
(4) Lease has been executed, but space has not yet been delivered.
Land Available for Development and/or Sale
At December 31, 2015, we had one project in pre-development and two projects where Phase I of the development was completed. The remaining future phases at those projects are in pre-development. We estimate that if we proceed with the development of the projects, up to approximately 750,000 square feet of GLA could be developed, excluding various outparcels of land. It is our policy to start vertical construction on new development projects only after the project has received entitlements, significant anchor commitments and construction financing, if appropriate.
Our development and construction activities are subject to risks and uncertainties such as our inability to obtain the necessary governmental approvals for a project, our determination that the expected return on a project is not sufficient to warrant continuation of the planned development, or our change in plan or scope for the development. If any of these events occur, we may record an impairment provision.
During 2015, we recorded an impairment provision of $2.5 million. We recorded impairment provisions of $23.3 million and $0.3 million in 2014 and 2013, respectively, related to developable land that we decided to market for sale. Refer to Note 1 Organization and Summary of Significant Accounting Policies - Accounting for the Impairment of Long-Lived Assets of the notes to the consolidated financial statements for a further information related to impairment provisions.
Insurance
Our tenants are generally responsible under their leases for providing adequate insurance on the spaces they lease. In addition we believe our our properties are adequately covered by commercial general liability, fire, flood, terrorism, environmental, and where necessary, hurricane and windstorm insurance coverages, which are all provided by reputable companies, with commercially reasonable exclusions, deductibles and limits.
22
Item 3. Legal Proceedings
We are currently involved in certain litigation arising in the ordinary course of business.
Item 4. Mine Safety Disclosures
Not Applicable
23
PART II
Item 5. Market for Registrant’s Common Equity, Related Stockholder Matters and Issuer Purchases of Equity Securities
Market Information
Our common shares are currently listed and traded on the New York Stock Exchange (“NYSE”) under the symbol “RPT”. On February 16, 2016, the closing price of our common shares on the NYSE was $16.85.
Shareholder Return Performance Graph
The following line graph sets forth the cumulative total return on a $100 investment (assuming the reinvestment of dividends) in each of our common shares, the NAREIT Equity Index, and the S&P 500 Index for the period December 31, 2010 through December 31, 2015. The stock price performance shown is not necessarily indicative of future price performance.
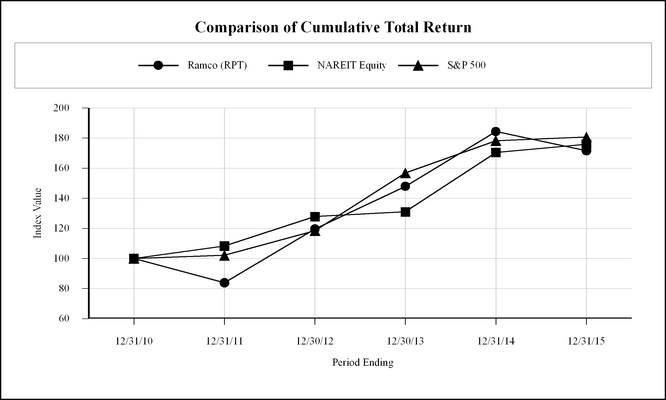
The following table depicts high/low closing prices and dividends declared per share for each quarter in 2015 and 2014:
(1) Paid on January 4, 2016
Stock Price | ||||||||||||
Quarter Ended | High | Low | Dividends | |||||||||
December 31, 2015 | $ | 16.80 | $ | 16.61 | $ | 0.21000 | (1) | |||||
September 30, 2015 | $ | 15.15 | $ | 14.92 | $ | 0.21000 | ||||||
June 30, 2015 | $ | 16.44 | $ | 16.19 | $ | 0.20000 | ||||||
March 31, 2015 | $ | 18.85 | $ | 18.57 | $ | 0.20000 | ||||||
December 31, 2014 | $ | 18.99 | $ | 15.86 | $ | 0.20000 | (2) | |||||
September 30, 2014 | $ | 17.35 | $ | 16.25 | $ | 0.20000 | ||||||
June 30, 2014 | $ | 17.03 | $ | 15.94 | $ | 0.18750 | ||||||
March 31, 2014 | $ | 16.76 | $ | 15.35 | $ | 0.18750 | ||||||
(2) Paid on January 2, 2015
24
Holders
The number of holders of record of our common shares was 1,395 at February 16, 2016. A substantially greater number of holders are beneficial owners whose shares of record are held by banks, brokers and other financial institutions.
Dividends
Under the Code, a REIT must meet requirements, including a requirement that it distribute to its shareholders at least 90% of its REIT taxable income annually, excluding net capital gain. Distributions paid by us are at the discretion of our Board and depend on our actual net income available to common shareholders, cash flow, financial condition, capital requirements, the annual distribution requirements under REIT provisions of the Code and such other factors as the Board deems relevant.
Distributions on our 7.25% Series D Cumulative Convertible Perpetual Preferred Shares declared in 2015 totaled $3.625 per share. We do not believe that the preferential rights available to the holders of our preferred shares or the financial covenants contained in our debt agreements had or will have an adverse effect on our ability to pay dividends in the normal course of business to our common shareholders or to distribute amounts necessary to maintain our qualification as a REIT.
For information on our equity compensation plans as of December 31, 2015, refer to Item 12 of Part III of this report and Note 16 of the notes to the consolidated financial statements for further information regarding our share-based compensation and other benefit plans.
25
Item 6. Selected Financial Data
The following table sets forth our selected consolidated financial data and should be read in conjunction with the consolidated financial statements and notes to the consolidated financial statements and Management’s Discussion and Analysis of Financial Condition and Results of Operations (“MD&A”) included elsewhere in this report.
Year Ended December 31, | |||||||||||||||||||
2015 | 2014 | 2013 | 2012 | 2011 | |||||||||||||||
(In thousands, except per share) | |||||||||||||||||||
Operating Data: | |||||||||||||||||||
Total revenue | $ | 251,790 | $ | 218,363 | $ | 170,068 | $ | 125,225 | $ | 114,386 | |||||||||
Operating income | 65,497 | 23,330 | 35,460 | 30,385 | 942 | ||||||||||||||
Income (loss) from continuing operations | 66,895 | (2,412 | ) | 8,371 | 7,171 | (29,418 | ) | ||||||||||||
Gain on sale of depreciable real estate | 13,529 | 10,022 | 2,120 | 336 | 7,197 | ||||||||||||||
Gain on sale of land | 4,041 | 835 | 4,279 | 69 | 2,440 | ||||||||||||||
Net income (loss) | 66,895 | (2,412 | ) | 11,462 | 7,092 | (28,500 | ) | ||||||||||||
Net (income) loss attributable to noncontrolling partner interest | (1,786 | ) | 48 | (465 | ) | 112 | 1,742 | ||||||||||||
Preferred share dividends | (6,838 | ) | (7,250 | ) | (7,250 | ) | (7,250 | ) | (5,244 | ) | |||||||||
Net income (loss) available to common shareholders | 57,771 | (9,614 | ) | 3,747 | (46 | ) | (32,002 | ) | |||||||||||
Earnings (loss) per common share, basic | |||||||||||||||||||
Continuing operations | $ | 0.73 | $ | (0.14 | ) | $ | 0.01 | $ | — | $ | (0.85 | ) | |||||||
Discontinued operations | — | — | 0.05 | — | 0.01 | ||||||||||||||
Basic Earnings (loss) | $ | 0.73 | $ | (0.14 | ) | $ | 0.06 | $ | — | $ | (0.84 | ) | |||||||
Earnings (loss) per common share, diluted | |||||||||||||||||||
Continuing operations | $ | 0.73 | $ | (0.14 | ) | $ | 0.01 | $ | — | $ | (0.85 | ) | |||||||
Discontinued operations | — | — | 0.05 | — | 0.01 | ||||||||||||||
Diluted earnings (loss) | $ | 0.73 | $ | (0.14 | ) | $ | 0.06 | $ | — | $ | (0.84 | ) | |||||||
Weighted average shares outstanding: | |||||||||||||||||||
Basic | 78,848 | 72,118 | 59,336 | 44,101 | 38,466 | ||||||||||||||
Diluted | 79,035 | 72,118 | 59,728 | 44,101 | 38,466 | ||||||||||||||
Cash dividends declared per RPT preferred share | $ | 0.004 | $ | 0.004 | $ | 0.004 | $ | 0.004 | $ | — | |||||||||
Cash dividends declared per RPT common share | $ | 0.8200 | $ | 0.7750 | $ | 0.7115 | $ | 0.6600 | $ | 0.6530 | |||||||||
Cash distributions to RPT preferred shareholders | $ | 6,977 | $ | 7,250 | $ | 7,250 | $ | 7,250 | $ | 3,432 | |||||||||
Cash distributions to RPT common shareholders | $ | 63,972 | $ | 54,149 | $ | 40,108 | $ | 28,333 | $ | 25,203 | |||||||||
Balance Sheet Data (at December 31): | |||||||||||||||||||
Investment in real estate (before accumulated depreciation) | 2,184,481 | 1,934,032 | 1,625,217 | 1,119,171 | 996,908 | ||||||||||||||
Total assets | 2,128,671 | 1,944,332 | 1,645,735 | 1,159,218 | 1,043,258 | ||||||||||||||
Total notes payable, net | 1,083,711 | 917,658 | 746,661 | 535,208 | 512,947 | ||||||||||||||
Total liabilities | 1,222,334 | 1,046,053 | 847,775 | 599,386 | 562,084 | ||||||||||||||
Total RPT shareholders' equity | 884,223 | 872,357 | 770,097 | 529,783 | 449,075 | ||||||||||||||
Noncontrolling interest | 22,114 | 25,922 | 27,863 | 30,049 | 32,099 | ||||||||||||||
Total shareholders' equity | 906,337 | 898,279 | 797,960 | 559,832 | 481,174 | ||||||||||||||
Other Data: | |||||||||||||||||||
Funds from operations ("FFO") available to common shareholders (1) | $ | 119,556 | $ | 70,324 | $ | 79,861 | $ | 47,816 | $ | 29,509 | |||||||||
Net cash provided by operating activities | 105,158 | 110,592 | 85,583 | 62,194 | 44,703 | ||||||||||||||
Net cash used in investing activities | (154,333 | ) | (315,723 | ) | (355,752 | ) | (173,210 | ) | (79,747 | ) | |||||||||
Net cash provided by financing activities | 46,484 | 208,671 | 271,731 | 103,094 | 37,024 | ||||||||||||||
(1) Under the NAREIT definition, FFO represents net income available to common shareholders (computed in accordance with accounting principles generally accepted in the United States of America (“GAAP”), excluding gains (losses) from sales of depreciable property and impairment provisions on depreciable property or on equity investments in depreciable property plus real estate related depreciation and amortization (excluding amortization of financing costs), and adjustments for unconsolidated partnerships and joint ventures. See “Funds From Operations” in Item 7 for a discussion of FFO and a reconciliation of FFO to net income. | |||||||||||||||||||
26
Item 7. Management’s Discussion and Analysis of Financial Condition and Results of Operations
The following discussion should be read in conjunction with the consolidated financial statements, the notes thereto, and the comparative summary of selected financial data appearing elsewhere in this report. Discontinued operations are discussed in Note 5 of the notes to the consolidated financial statements in Item 8. The financial information in this MD&A is based on results from continuing operations.
Overview
We are a fully integrated, self-administered, publicly-traded REIT specializing in the ownership, management, development and redevelopment of community shopping centers. Most of our properties are multi-anchored by supermarkets and/or national chain stores. Our primary business is managing and leasing space to tenants in the shopping centers we own. We also manage centers for our unconsolidated joint ventures for which we charge fees. Our credit risk, therefore, is concentrated in the retail industry.
At December 31, 2015, we owned and managed, either directly or through our interest in real estate joint ventures, a total of 73 shopping centers and one office building, with approximately 15.9 million square feet of gross leasable area owned by us and our joint ventures. We also own various parcels of land available for development or for sale, the majority of which are adjacent to certain of our existing developed properties.
We are predominantly a community shopping center company with a focus on managing and adding value to our portfolio of centers that are primarily multi-anchored by grocery stores and/or nationally recognized discount department stores. We believe that centers with a grocery and/or discount component attract consumers seeking value-priced products. Since these products are required to satisfy everyday needs, customers often visit the centers on a weekly basis. Over half of our shopping centers are anchored by tenants that sell groceries. Supermarket anchor tenants in our centers include, among others, Publix Super Market, Whole Foods, Kroger and Sprouts. National chain anchor tenants in our centers include, among others, TJ Maxx/Marshalls, Bed Bath and Beyond, Home Depot and Dick's Sporting Goods.
Our shopping centers are primarily located in a number of the largest metropolitan markets in the central United States. Our focus on these markets has enabled us to develop a thorough understanding of their unique characteristics. Throughout our primary regions, we have concentrated a number of centers in reasonable proximity to each other in order to achieve efficiencies in management, leasing and acquiring new properties.
Critical Accounting Policies
Management’s Discussion and Analysis of Financial Condition and Results of Operations is based on our consolidated financial statements, which have been prepared in accordance with GAAP. The preparation of these financial statements requires us to make estimates and assumptions that affect the reported amounts of assets, liabilities, revenue and expenses, and related disclosure of contingent assets and liabilities. Our estimates are based on historical experience and on various other assumptions that are believed to be reasonable under the circumstances. Actual results could differ from these estimates under different assumptions or conditions.
We believe the following critical accounting policies require our most subjective judgment and use of estimates in the preparation of our consolidated financial statements.
Revenue Recognition and Accounts Receivable
Most of our leases contain non-contingent rent escalations for which we recognize income on a straight-line basis over the non-cancelable lease term. This method results in rental income in the early years of a lease being higher than actual cash received, creating a straight-line rent receivable asset which is included in the “Other Assets” line item in our consolidated balance sheets. We review our unbilled straight-line rent receivable balance to determine the future collectability of revenue that will not be billed to or collected from tenants due to early lease terminations, lease modifications, bankruptcies and other factors. An allowance to write down the straight-line receivable balance is taken in the period that future collectability is uncertain.
27
Additionally, we provide for bad debt expense based upon the allowance method of accounting. We continuously monitor the collectability of our accounts receivable from specific tenants, analyze historical bad debts, customer creditworthiness, current economic trends and changes in tenant payment terms when evaluating the adequacy of the allowance for bad debts. Allowances are taken for those balances that we have reason to believe will be uncollectible.
For more information refer to Note 1 Organization and Summary of Significant Accounting Policies, Revenue Recognition and Accounts Receivable subtopics of the notes to the consolidated financial statements.
Acquisitions
Acquisitions of properties are accounted for utilizing the acquisition method and, accordingly, the results of operations of an acquired property are included in our results of operations from the date of acquisition. Estimates of fair values are based upon future cash flows and other valuation techniques in accordance with our fair value measurements policy, which are used to allocate the purchase price of acquired property among land, buildings on an “as if vacant” basis, tenant improvements, identifiable intangibles and any gain on purchase. Identifiable intangible assets and liabilities include the effect of above-and below-market leases, the value of having leases in place (“as-is” versus “as if vacant” and absorption costs), other intangible assets such as assumed tax increment revenue bonds and out-of-market assumed mortgages. Depreciation and amortization are computed using the straight-line method over the estimated useful lives of 40 years for buildings, and over the remaining terms of any intangible asset contracts and the respective tenant leases, which may include bargain review options. The impact of these estimates, including incorrect estimates in connection with acquisition values and estimated useful lives, could result in significant differences related to the purchased assets, liabilities and subsequent depreciation or amortization expense. For more information, refer to Note 1, Organization and Summary of Significant Accounting Policies - Real Estate of the notes to the consolidated financial statements.
Impairment
We review our investment in real estate, including any related intangible assets, for impairment on a property-by-property basis whenever events or changes in circumstances indicate that the carrying value of the property may not be recoverable. These changes in circumstances include, but are not limited to, changes in occupancy, rental rates, tenant sales, net operating income, geographic location, real estate values and expected holding period. The viability of all projects under construction or development, including those owned by unconsolidated joint ventures, is regularly evaluated under applicable accounting requirements, including requirements relating to abandonment of assets or changes in use. To the extent a project, or individual components of the project, are no longer considered to have value, the related capitalized costs are charged against operations.
Impairment provisions resulting from any event or change in circumstances, including changes in our intentions or our analysis of varying scenarios, could be material to our consolidated financial statements.
We recognize an impairment of an investment in real estate when the estimated discounted or undiscounted cash flow is less than the net carrying value of the property. If it is determined that an investment in real estate is impaired, then the carrying value is reduced to the estimated fair value as determined by cash flow models and discount rates or comparable sales in accordance with our fair value measurement policy. Refer to Note 1 Organization and Summary of Significant Accounting Policies - Accounting for the Impairment of Long-Lived Assets for further information regarding impairment provisions.
28
Results of Operations
Comparison of the Year Ended December 31, 2015 to the Year Ended December 31, 2014
The following summarizes certain line items from our audited statements of operations which we believe are important in understanding our operations and/or those items that have significantly changed during the year ended December 31, 2015 as compared to 2014:
Year Ended December 31, | |||||||||||||||
2015 | 2014 | Dollar Change | Percent Change | ||||||||||||
(In thousands) | |||||||||||||||
Total revenue | $ | 251,790 | $ | 218,363 | $ | 33,427 | 15.3 | % | |||||||
Operating expenses | 34,875 | 30,952 | 3,923 | 12.7 | % | ||||||||||
Real estate taxes | 38,737 | 31,474 | 7,263 | 23.1 | % | ||||||||||
Depreciation and amortization | 89,439 | 81,182 | 8,257 | 10.2 | % | ||||||||||
General and administrative expense | 20,077 | 21,670 | (1,593 | ) | (7.4 | )% | |||||||||
Provision for impairment | 2,521 | 27,865 | (25,344 | ) | (91.0 | )% | |||||||||
Gain on sale of real estate | 17,570 | 10,857 | 6,713 | 61.8 | % | ||||||||||
Earnings from unconsolidated joint ventures | 17,696 | 75 | 17,621 | NM | |||||||||||
Interest expense and amortization of deferred financing fees | 42,211 | 35,188 | 7,023 | 20.0 | % | ||||||||||
Gain on remeasurement of unconsolidated joint ventures | 7,892 | 117 | 7,775 | NM | |||||||||||
Gain (loss) on extinguishment of debt | 1,414 | (860 | ) | 2,274 | NM | ||||||||||
NM - Not Meaningful
Total revenue in 2015 increased $33.4 million, or 15.3% from 2014. The increase is primarily due to the following:
• | $32.3 million increase related to acquisitions completed in 2015 and 2014; |
• | $2.9 million increase due to the completion of Phase I of Lakeland Park Center; |
• | $4.0 million increase at existing centers primarily related to redevelopment and re-tenanting activities; offset by |
• | $5.8 million decrease related to properties sold in 2014 and reduced management fee income and lower office tenant revenue in 2015. |
Operating expense in 2015 increased $3.9 million, or 12.7%, from 2014 primarily due to our 2015 and 2014 acquisitions.
Real estate tax expense in 2015 increased $7.3 million, or 23.1%, from 2014, primarily due to our 2015 and 2014 acquisitions.
Depreciation and amortization expense in 2015 increased $8.3 million, or 10.2%, from 2014. The increase was primarily related to a $14.8 million increase from our acquisitions in 2015 and 2014, new development completion and other capital activities offset by a decrease of $6.5 million related to sold properties and accelerated depreciation for demolition of certain centers undergoing redevelopment in 2014.
General and administrative expense in 2015 decreased $1.6 million, or 7.4%, from 2014. The decrease was primarily due to lower costs associated with our long-term incentive plans which are based on our stock price performance relative to a group of our peers. The reversal of share based and long-term compensation expense related to the previous Chief Financial Officer offset in part by a bonus payment for a new Chief Financial Officer.
Impairment provisions of $2.5 million, recorded in 2015, related to developable land that was subsequently sold in the second quarter of 2015. The adjustment was triggered by unforeseen increases in development costs and changes in the associated sales price assumptions. In 2014 our impairment provisions totaled $27.9 million related to our plan to sell certain land parcels that we had previously intended to develop. Refer to Note 1 Organization and Summary of Significant Accounting Policies - Accounting for the Impairment of Long-Lived Assets of the notes to the consolidated financial statements for further information related to impairment provisions.
Gain on sale of real estate was $17.6 million in 2015. In the comparable period in 2014 we had a gain of $10.9 million. Refer to Note 4 of the notes to the consolidated financial statements for further detail on dispositions.
29
Earnings from unconsolidated joint ventures in 2015 increased $17.6 million from 2014. The increase was primarily related to our proportionate share of gains totaling $16.5 million generated by the sale of ten properties owned by two of our joint ventures. In addition, in 2014, we recorded accelerated depreciation expense as a result of the demolition of a portion of centers for redevelopment and additional proceeds related to the 2011 sale of a joint venture property. Refer to Note 7 of the notes to the consolidated financial statements for additional information regarding our unconsolidated joint venture sales activity.
Interest expense and amortization of deferred financing fees increased in 2015 by $7.0 million, or 20.0% from 2014, primarily due to the issuance of new senior unsecured notes and higher average loan balances on our credit facility.
Gain on remeasurement of unconsolidated joint ventures in 2015 was $7.9 million, triggered by our acquisition of our partner's equity interest in seven properties. The gain on remeasurement represents the difference between the carrying value and the fair value of our previously held equity investment in the properties. In 2014 we recognized a similar gain of $0.1 million.
Gain on extinguishment of debt of approximately $1.4 million in 2015 was related to the write-off of debt premiums associated with two mortgages that were repaid compared to a loss of $0.9 million in 2014 related to the write-off of deferred financing costs associated with the early payoff of unsecured term loan debt.
Comparison of the Year Ended December 31, 2014 to the Year Ended December 31, 2013
The following summarizes certain line items from our audited statements of operations which we believe are important in understanding our operations and/or those items which have significantly changed during the year ended December 31, 2014 as compared to 2013:
Year Ended December 31, | |||||||||||||||
2014 | 2013 | Dollar Change | Percent Change | ||||||||||||
(In thousands) | |||||||||||||||
Total revenue | $ | 218,363 | $ | 170,068 | $ | 48,295 | 28.4 | % | |||||||
Operating expense | 30,952 | 23,200 | 7,752 | 33.4 | % | ||||||||||
Real Estate Tax | 31,474 | 23,161 | 8,313 | 35.9 | % | ||||||||||
Depreciation and amortization | 81,182 | 56,305 | 24,877 | 44.2 | % | ||||||||||
General and administrative expense | 21,670 | 20,951 | 719 | 3.4 | % | ||||||||||
Provision for impairment | 27,865 | 9,669 | 18,196 | 188.2 | % | ||||||||||
Gain on sale of real estate | 10,857 | 4,279 | 6,578 | 153.7 | % | ||||||||||
Earnings (loss) from unconsolidated joint ventures | 75 | (4,759 | ) | 4,834 | 101.6 | % | |||||||||
Interest expense and amortization of deferred financing fees | 35,188 | 30,522 | 4,666 | 15.3 | % | ||||||||||
Gain on remeasurement of unconsolidated joint ventures | 117 | 5,282 | (5,165 | ) | NM | ||||||||||
Loss on extinguishment of debt | (860 | ) | (340 | ) | (520 | ) | NM | ||||||||
NM - Not meaningful | |||||||||||||||
Total revenue in 2014 increased $48.3 million, or 28.4%, from 2013. The increase is primarily due to the following:
• | $43.7 million increase related to acquisitions completed in 2014 and 2013; |
• | $4.6 million increase at existing centers; and |
• | $1.8 million increase in lease termination income primarily due to the early departure of an office tenant at our office building; offset by |
• | $1.8 million decrease related to properties sold in 2014, reduced management fee income and properties in redevelopment. |
Operating expense in 2014 increased $7.8 million, or 33.4%, from 2013. The increase is primarily due to the following:
• | $5.7 million related to increases in recoverable operating expenses due to our 2014 and 2013 acquisitions; and |
• | $1.5 million related to increase in recoverable operating expenses at existing centers. |
Real estate tax expense in 2014 increased $8.3 million, or 35.9%, from 2013, primarily due to our 2014 and 2013 acquisitions.
Depreciation and amortization expense in 2014 increased $24.9 million, or 44.2%, from 2013. The increase was primarily due to our acquisitions in 2014 and 2013, new development completion and other capital activities.
30
General and administrative expense in 2014 increased $0.7 million, or 3.4%, from 2013. The increase was primarily due to:
• | $0.9 million related to an increase in costs associated with our long-term incentive plans which are based on our stock price performance relative to a group of our peers (see Note 16 of the notes to the consolidated financial statements for additional information); offset in part by |
• | higher capitalization of development and leasing salaries and related costs in 2014. Salaries capitalized in 2014 and 2013 represented approximately 19% and 18%, respectively, of total salaries. |
Impairment provisions of $27.9 million recorded in 2014 related to the decision to market certain income-producing properties for sale that we had previously planned to develop and adjustments to the sales price assumptions for certain undeveloped land parcels available for sale at several of our development properties. In 2013 our impairment provisions totaled $9.7 million. Refer to Note 1 Organization and Summary of Significant Accounting Policies - Accounting for the Impairment of Long-Lived Assets of the notes to the consolidated financial statements for further information related to impairment provisions.
Gain on sale of real estate was $10.9 million in 2014 primarily due to the sale of five income-producing properties and four individual outparcel sales. In the comparable period in 2013 we had a gain of $4.3 million. Refer to Note 4 of the notes to the consolidated financial statements for further detail on dispositions.
Earnings from unconsolidated joint ventures in 2014 increased $4.8 million from 2013. In 2013 we acquired our partner's 70% interest in 12 shopping centers held in the Ramco/Lion Venture LP. The sale resulted in a loss of $21.5 million to the joint venture of which our share was $6.4 million.
Interest expense and amortization of deferred financing fees increased in 2014 by $4.7 million, or 15.3% from 2013, primarily due to the following:
• | $6.1 million increase in loan interest due to the issuance of $200.0 million in senior unsecured notes in the second half of 2014; offset in part by |
• | $0.6 million increase in the amortization of mortgage premiums; and |
• | $0.7 million increase in capitalized interest due to our development/redevelopment projects. |
In 2014 we recorded a deferred gain of $0.1 million which related to a property sold in 2007 to a joint venture in which we had a 20% non-controlling interest. Due to our continuing involvement we deferred the portion of the gain related to our 20% interest. The property was conveyed to the lender in 2014 and we recognized the previously deferred gain. In 2013, we recorded a deferred gain of $5.3 million.
Loss on extinguishment of debt of approximately $0.9 million in 2014 related to the write-off of unamortized deferred financing costs associated with the early payoff of $120.0 million in unsecured term loan debt. In 2013 we recorded a loss of $0.3 million related to a prepayment penalty incurred to repay two mortgages.
Liquidity and Capital Resources
The majority of our cash is generated from operations and is dependent on the rents that we are able to charge and collect from our tenants. The principal uses of our liquidity and capital resources are for operations, developments, redevelopments, including expansion and renovation programs, acquisitions, and debt repayment. In addition, we make quarterly dividend payments in accordance with REIT requirements for distributing the substantial majority of our taxable income on an annual basis. We anticipate that the combination of cash on hand, cash from operations, availability under our credit facilities, additional financings, equity offerings, and the sale of existing properties will satisfy our expected working capital requirements through at least the next 12 months. Although we believe that the combination of factors discussed above will provide sufficient liquidity, no such assurance can be given.
At December 31, 2015 and 2014, we had $15.4 million and $17.5 million, respectively, in cash and cash equivalents and restricted cash. Restricted cash was comprised primarily of funds held in escrow by lenders to pay real estate taxes, insurance premiums, and certain capital expenditures.
Short-Term Liquidity Requirements
Our short-term liquidity needs are met primarily from rental income and recoveries and consist primarily of funds necessary to pay operating expenses associated with our operating properties, interest and scheduled principal payments on our debt, quarterly dividend payments (including distributions to OP unit holders) and capital expenditures related to tenant improvements and
31
redevelopment activities. We believe that our retained cash flow from operations along with availability under our revolving credit facility is sufficient to meet these obligations.
We have two mortgages maturing in June 2016 totaling $35.8 million, which includes scheduled amortization payments. As opportunities arise and market conditions permit, we will look to repay these mortgages by issuing unsecured debt, utilizing cash flow from operating activities or funding from availability under our credit facility. As of December 31, 2015 we had $286.5 million available to be drawn on our $350.0 million unsecured revolving credit facility subject to our compliance with certain covenants.
We will continue to pursue the strategy of selling mature properties or non-core assets that no longer meet our investment criteria. Our ability to obtain acceptable selling prices and satisfactory terms and financing will impact the timing of future sales. We anticipate using net proceeds from the sale of properties to reduce outstanding debt and support current and future growth initiatives.
We continually search for investment opportunities that may require additional capital and/or liquidity. As of December 31, 2015, we had no proposed property acquisitions under contract and one property disposition under contract, subject to due diligence contingencies.
Long-Term Liquidity Requirements
Our long-term liquidity needs consist primarily of funds necessary to pay indebtedness at maturity, potential acquisitions of properties, redevelopment of existing properties, the development of land and non-recurring capital expenditures.
The following is a summary of our cash flow activities:
Year Ended December 31, | |||||||||||
2015 | 2014 | 2013 | |||||||||
(In thousands) | |||||||||||
Cash provided by operating activities | $ | 105,158 | $ | 110,592 | $ | 85,583 | |||||
Cash used in investing activities | (154,333 | ) | (315,723 | ) | (355,752 | ) | |||||
Cash provided by financing activities | 46,484 | 208,671 | 271,731 | ||||||||
Operating Activities
We anticipate that cash on hand, operating cash flows, borrowings under our revolving credit facility, issuance of equity, as well as other debt and equity alternatives, will provide the necessary capital that we require to operate. Net cash flow provided by operating activities decreased $5.4 million in 2015 compared to 2014 primarily due to:
• | Operating income, adjusted for non-cash activity, increased $17.4 million as a result of our acquisitions (net of dispositions), redevelopment and leasing activities at our shopping centers; |
• | net accounts receivable increased $4.4 million; |
• | accounts payable and other liabilities decreased approximately $8.5 million; |
• | long-term and share-based compensation expense decreased $3.0 million; and |
• | net interest expense increased approximately $7.0 million primarily due to higher average loan balances as a result of acquisitions. |
Investing Activities
Net cash used for investing activities decreased $161.4 million compared to 2014 primarily due to:
• | Acquisitions of real estate decreased $111.5 million; |
• | Additions to real estate decreased $19.8 million due to lower new construction activity; |
• | Net proceeds from the sale of real estate increased $11.8 million; and |
• | Distributions from sales of joint venture properties increased $14.1 million; and |
• | Restricted cash decreased $4.2 million. |
32
Financing Activities
Cash flows provided by financing activities were $46.5 million as compared to $208.7 million in 2014. This difference of $162.2 million is primarily explained by:
• | net proceeds from common share issuances decreased $153.3 million; |
• | an increase in cash dividends to common shareholders of $9.8 million due to additional shares issued as well as an increase in our per share quarterly dividend payment; and |
• | an increase in cash paid for OP unit conversions of $3.7 million; offset in part by |
• | an increase in net borrowings of $5.3 million. |
As of December 31, 2015, $286.5 million was available to be drawn on our $350.0 million unsecured revolving credit facility subject to our compliance with certain covenants. It is anticipated that additional funds borrowed under our credit facilities will be used for general corporate purposes, including working capital, capital expenditures, the repayment of indebtedness or other corporate activities. For further information on the credit facilities and other debt, refer to Note 9 of notes to the consolidated financial statements for further information regarding debt.
Dividends and Equity
We currently qualify, and intend to continue to qualify in the future, as a REIT under the Code. As a REIT, we must distribute to our shareholders at least 90% of our REIT taxable income annually, excluding net capital gain. Distributions paid are at the discretion of our Board and depend on our actual net income available to common shareholders, cash flow, financial condition, capital requirements, restrictions in financing arrangements, the annual distribution requirements under REIT provisions of the Code and such other factors as our Board deems relevant.
We paid cash dividends of $0.81 per common share to shareholders in 2015. In the third quarter we increased our quarterly dividend 5.0% to $0.21 per share, or an annualized amount of $0.84 per share. Cash dividends for 2014 and 2013 were $0.7625 and $0.6923 per common share, respectively. Our dividend policy is to make distributions to shareholders of at least 90% of our REIT taxable income, excluding net capital gain, in order to maintain qualification as a REIT. On an annualized basis, our current dividend is above our estimated minimum required distribution. Distributions paid by us are funded from cash flows from operating activities. To the extent that cash flows from operating activities were insufficient to pay total distributions for any period, alternative funding sources would be used. Examples of alternative funding sources may include proceeds from sales of real estate and bank borrowings. Although we may use alternative sources of cash to fund distributions in a given period, we expect that distribution requirements for an entire year will be met with cash flows from operating activities.
Year Ended December 31, | |||||||||||
2015 | 2014 | 2013 | |||||||||
(In thousands) | |||||||||||
Cash provided by operating activities | $ | 105,158 | $ | 110,592 | $ | 85,583 | |||||
Cash distributions to preferred shareholders | (6,977 | ) | (7,250 | ) | (7,250 | ) | |||||
Cash distributions to common shareholders | (63,972 | ) | (54,149 | ) | (40,108 | ) | |||||
Cash distributions to operating partnership unit holders | (1,804 | ) | (1,716 | ) | (1,580 | ) | |||||
Total distributions | $ | (72,753 | ) | $ | (63,115 | ) | $ | (48,938 | ) | ||
Surplus | $ | 32,405 | $ | 47,477 | $ | 36,645 | |||||
In addition, during 2015, we issued 0.9 million common shares through our controlled equity offering generating $17.2 million in net proceeds, after sales commissions and fees of $0.3 million. We used the net proceeds for general corporate purposes including the repayment of debt. We have registered up to 8.0 million common shares for issuance from time to time, at our sole discretion, through our controlled equity offering sales agreement, of which 3.1 million shares remained unsold as of December 31, 2015. The shares issued in the controlled equity offering are registered with the Securities and Exchange Commission (“SEC”) on our registration statement on Form S-3.
33
Off Balance Sheet Arrangements
Real Estate Joint Ventures
We consolidate entities in which we own less than 100% equity interest if we have a controlling interest or are the primary beneficiary in a variable interest entity, as defined in the Consolidation Topic of FASB ASC 810. From time to time, we enter into joint venture arrangements from which we believe we can benefit by owning a partial interest in one or more properties.
As of December 31, 2015, our investments in unconsolidated joint ventures were approximately $4.3 million representing our ownership interest in three shopping centers. We accounted for these entities under the equity method. Refer to Note 7 of the notes to the consolidated financial statements for further information regarding our equity investments in unconsolidated joint ventures.
We are engaged by our joint ventures to provide asset management, property management, leasing and investing services for such ventures' respective properties. We receive fees for our services, including a property management fee calculated as a percentage of gross revenues received.
Contractual Obligations
The following are our contractual cash obligations as of December 31, 2015:
Payments due by period | |||||||||||||||||||
Contractual Obligations | Total | Less than 1 year | 1-3 years | 3-5 years | More than 5 years | ||||||||||||||
(In thousands) | |||||||||||||||||||
Mortgages and notes payable: | |||||||||||||||||||
Scheduled amortization | $ | 21,942 | $ | 3,396 | $ | 8,747 | $ | 5,060 | $ | 4,739 | |||||||||
Payments due at maturity | 1,058,640 | 32,449 | 285,341 | 211,717 | 529,133 | ||||||||||||||
Total mortgages and notes payable (1) | 1,080,582 | 35,845 | 294,088 | 216,777 | 533,872 | ||||||||||||||
Interest expense (2) | 292,365 | 45,911 | 101,730 | 49,828 | 94,896 | ||||||||||||||
Employment contracts | 2,677 | 1,244 | 1,433 | — | — | ||||||||||||||
Capital lease | 1,700 | 100 | 300 | 200 | 1,100 | ||||||||||||||
Operating leases | 2,316 | 620 | 1,696 | — | — | ||||||||||||||
Construction commitments | 10,602 | 10,602 | — | — | — | ||||||||||||||
Total contractual obligations | $ | 1,390,242 | $ | 94,322 | $ | 399,247 | $ | 266,805 | $ | 629,868 | |||||||||
(1) | Excludes $6.9 million of unamortized mortgage debt premium and $3.8 million in deferred financing costs. |
(2) | Variable rate debt interest is calculated using rates at December 31, 2015. |
We anticipate that the combination of cash on hand, cash provided from operating activities, the availability under our credit facility ($286.5 million at December 31, 2015 subject to our compliance with certain covenants), our access to the capital markets and the sale of existing properties will satisfy our expected working capital requirements through at least the next 12 months.
At December 31, 2015, we did not have any contractual obligations that required or allowed settlement, in whole or in part, with consideration other than cash.
Mortgages and notes payable
See the analysis of our debt included in “Liquidity and Capital Resources” above.
Employment Contracts
At December 31, 2015, we had employment contracts with our Chief Executive, Chief Financial and Chief Operating Officers, that contain minimum guaranteed compensation. All other employees are subject to at-will employment.
34
Operating and Capital Leases
We lease office space for our corporate headquarters under an operating lease that expires in August 2019.
We have a capital lease at our Buttermilk Towne Center with the City of Crescent Springs, Kentucky. The lease provides for fixed annual payments of $0.1 million through maturity in December 2032, at which time we can acquire the center for one dollar.
Construction Costs
In connection with the development and expansion of various shopping centers as of December 31, 2015, we have entered into agreements for construction activities with an aggregate cost of approximately $10.6 million.
Planned Capital Spending
We are focused on our core strength of enhancing the value of our existing portfolio of shopping centers through successful leasing efforts and the completion of our redevelopment projects currently in process.
For 2016, we anticipate spending approximately $62.5 million for capital expenditures, of which $10.6 million is reflected in the construction commitments in the above contractual obligations table. The total anticipated spending relates to redevelopment projects, tenant improvements, and leasing costs. Estimates for future spending will change as new projects are approved.
Capitalization
At December 31, 2015 our total market capitalization was $2.5 billion and is detailed below:
(In thousands) | |||
Net debt (including property-specific mortgages, unsecured revolving credit facility, term loans and capital lease obligation net of $6.6 million in cash) | $ | 1,075,046 | |
Common shares, OP units, and dilutive securities based on market price of $16.61 at December 31, 2015 | 1,351,224 | ||
Convertible perpetual preferred shares based on market price of $61.15 at December 31, 2015 | 113,066 | ||
Total market capitalization | $ | 2,539,336 | |
Net debt to total market capitalization | 42.3 | % | |
At December 31, 2015, noncontrolling interests represented a 2.4% ownership in the Operating Partnership. The OP Units may, under certain circumstances, be exchanged for our common shares of beneficial interest on a one-for-one basis. We, as sole general partner of the Operating Partnership, have the option, but not the obligation, to settle exchanged OP Units held by others in cash. Assuming the exchange of all OP Units, there would have been 81,163,819 of our common shares of beneficial interest outstanding at December 31, 2015, with a market value of approximately $1.3 billion.
35
Non-GAAP Financial Measures
Certain of our key performance indicators are considered non-GAAP financial measures. Management uses these measures along with our GAAP financial statements in order to evaluate our operations results. We believe these additional measures provide users of our financial information additional comparable indicators of our industry, as well as our performance.
Funds From Operations
We consider funds from operations, also known as “FFO”, to be an appropriate supplemental measure of the financial performance of an equity REIT. Under the NAREIT definition, FFO represents net income (computed in accordance with generally accepted accounting principles), excluding gains (or losses) from sales of depreciable property and impairment provisions on depreciable real estate or on investments in non-consolidated investees that are driven by measurable decreases in the fair value of depreciable real estate held by the investee, plus depreciation and amortization, (excluding amortization of financing costs). Adjustments for unconsolidated partnerships and joint ventures are calculated to reflect funds from operations on the same basis.
In addition to FFO available to common shareholders, we include Operating FFO available to common shareholders as an additional measure of our financial and operating performance. Operating FFO excludes acquisition costs and periodic items such as impairment provisions on land available for development or sale, bargain purchase gains, and gains or losses on extinguishment of debt that are not adjusted under the current NAREIT definition of FFO. We provide a reconciliation of FFO to Operating FFO. FFO and Operating FFO should not be considered alternatives to GAAP net income available to common shareholders or as alternatives to cash flow as measures of liquidity.
While we consider FFO available to common shareholders and Operating FFO available to common shareholders useful measures for reviewing our comparative operating and financial performance between periods or to compare our performance to different REITs, our computations of FFO and Operating FFO may differ from the computations utilized by other real estate companies, and therefore, may not be comparable.
36
We recognize the limitations of FFO and Operating FFO when compared to GAAP net income available to common shareholders. FFO and Operating FFO available to common shareholders do not represent amounts available for needed capital replacement or expansion, debt service obligations, or other commitments and uncertainties. In addition, FFO and Operating FFO do not represent cash generated from operating activities in accordance with GAAP and are not necessarily indicative of cash available to fund cash needs, including the payment of dividends. FFO and Operating FFO are simply used as additional indicators of our operating performance. The following table illustrates the calculations of FFO and Operating FFO:
Years Ended December 31, | |||||||||||
2015 | 2014 | 2013 | |||||||||
(In thousands, except per share data) | |||||||||||
Net income (loss) available to common shareholders | $ | 57,771 | $ | (9,614 | ) | $ | 3,747 | ||||
Adjustments: | |||||||||||
Rental property depreciation and amortization expense | 89,289 | 80,826 | 56,316 | ||||||||
Pro-rata share of real estate depreciation from unconsolidated joint ventures | 1,782 | 4,719 | 3,689 | ||||||||
Gain on sale of depreciable real estate | (13,529 | ) | (10,022 | ) | (2,120 | ) | |||||
(Gain) loss on sale of joint venture depreciable real estate (1) | (16,489 | ) | — | 6,454 | |||||||
Provision for impairment on income-producing properties | — | 4,580 | 9,342 | ||||||||
Gain on remeasurement of unconsolidated joint ventures (2) | (7,892 | ) | (117 | ) | (5,282 | ) | |||||
Noncontrolling interest in Operating Partnership (3) | 1,786 | (48 | ) | 465 | |||||||
FFO | $ | 112,718 | $ | 70,324 | $ | 72,611 | |||||
Preferred share dividends (assuming conversion) (4) | 6,838 | — | 7,250 | ||||||||
FFO available to common shareholders | 119,556 | 70,324 | 79,861 | ||||||||
Provision for impairment for land available for development or sale | 2,521 | 23,285 | 327 | ||||||||
(Gain) loss on extinguishment of debt | (1,414 | ) | 860 | 340 | |||||||
Gain on extinguishment of joint venture debt, net of RPT expenses (1) | — | (106 | ) | — | |||||||
Acquisition costs | 644 | 1,890 | 1,322 | ||||||||
Preferred share dividends (assuming conversion) and conversion costs (5) | 500 | 7,250 | — | ||||||||
Operating FFO available to common shareholders | $ | 121,807 | $ | 103,503 | $ | 81,850 | |||||
Weighted average common shares | 78,848 | 72,118 | 59,336 | ||||||||
Shares issuable upon conversion of Operating Partnership Units (3) | 2,187 | 2,250 | 2,257 | ||||||||
Dilutive effect of securities | 187 | 217 | 392 | ||||||||
81,222 | 74,585 | 61,985 | |||||||||
Shares issuable upon conversion of preferred shares (4) (5) | 6,692 | 7,019 | 6,940 | ||||||||
Weighted average equivalent shares outstanding, diluted | 87,914 | 81,604 | 68,925 | ||||||||
Diluted earnings per share (6) | $ | 0.73 | $ | (0.14 | ) | $ | 0.06 | ||||
FFO per share adjustments to net income available to common shareholders including preferred share dividends | 0.63 | 1.08 | 1.10 | ||||||||
FFO per share, diluted (7) | $ | 1.36 | $ | 0.94 | $ | 1.16 | |||||
Per share adjustments to FFO | 0.03 | 0.33 | 0.03 | ||||||||
Operating FFO per share, diluted | $ | 1.39 | $ | 1.27 | $ | 1.19 | |||||
(1) | Amount included in earnings (loss) from unconsolidated joint ventures. |
(2) | During the third quarter 2015, we purchased our partner's interest in six properties owned by Ramco 450 Venture LLC and one property owned by Ramco/Lion Venture L.P. The total gain of $7.9 million represents the difference between the carrying value and the fair value of our previously held equity investment in the properties. |
(3) | The total noncontrolling interest reflects OP units convertible 1:1 into common shares. |
(4) | Series D convertible preferred shares were dilutive for FFO for the years ended December 31, 2015 and 2013 and were anti-dilutive for the comparable period in 2014. In 2015, our Series D convertible preferred shares paid annual dividends of $6.7 million and are currently convertible into approximately 6.7 million shares of common stock. They are dilutive only when earnings or FFO exceed approximately $1.04 per diluted share per year The conversion ratio is subject to adjustment based upon a number of factors, and such adjustment could affect the dilutive impact of the Series D convertible preferred shares on FFO and earnings per share in future periods. |
(5) | Series D convertible preferred shares were dilutive for Operating FFO for year ended December 31, 2014. |
(6) | The denominator to calculate diluted earnings per share excludes shares issuable upon conversion of Operating Partnership Units and preferred shares for all periods reported. |
(7) | The year ended December 31, 2015 includes $0.04 per share primarily attributable to gain on sale of land at Gaines Marketplace. |
37
Same Property Operating Income
Same Property Operating Income ("Same Property NOI") is a supplemental non-GAAP financial measure of real estate companies' operating performance. Same Property NOI is considered by management to be a relevant performance measure of our operations because it includes only the NOI of comparable properties for the reporting period. Same Property NOI is calculated using consolidated operating income as defined by GAAP adjusted to exclude management and other fee income, depreciation and amortization, acquisition costs, general and administrative expense, provision for impairment, GAAP income adjustments such as straight-line rents, net of reserves, above/below market rents, other non-comparable operating income/expense adjustments, and the effect of lease termination income/expense.
Same Property NOI should not be considered an alternative to net income in accordance with GAAP or as a measure of liquidity. Our method of calculating Same Property NOI may differ from methods used by other REITs and, accordingly, may not be comparable to such other REITs.
The following is a summary of our wholly owned properties by classification:
Three Months Ended December 31, 2015 | Twelve Months Ended December 31, 2015 | ||||
Property Designation | |||||
Same property | 57 | 52 | |||
Acquisitions (1) | 7 | 11 | |||
Completed developments (1) | 1 | 1 | |||
Non-retail properties (2) | 1 | 1 | |||
Redevelopment (3) | 5 | 6 | |||
Total wholly owned properties | 71 | 71 | |||
(1) Properties were not owned in both comparable periods. | |||||
(2) Office building. | |||||
(3) Properties under construction primarily related to re-tenanting resulting in reduced rental income. | |||||
Acquisition and redevelopment/development properties removed from the pool will not be added until owned and operated or construction is complete for the entirety of both periods being compared.
The following is a reconciliation of our Operating Income to Same Property NOI:
Three Months Ended December 31, | Twelve Months Ended December 31, | ||||||||||||||
2015 | 2014 | 2015 | 2014 | ||||||||||||
(in thousands) | |||||||||||||||
Operating income (loss) | $ | 16,102 | $ | (10,587 | ) | $ | 65,497 | $ | 23,330 | ||||||
Adjustments: | |||||||||||||||
Management and other fee income | (331 | ) | (531 | ) | (1,753 | ) | (2,059 | ) | |||||||
Depreciation and amortization | 25,042 | 20,605 | 89,439 | 81,182 | |||||||||||
Acquisition costs | 70 | 168 | 644 | 1,890 | |||||||||||
General and administrative expenses | 5,709 | 5,575 | 20,077 | 21,670 | |||||||||||
Provision for impairment | — | 27,865 | 2,521 | 27,865 | |||||||||||
Properties excluded from pool - Acquisitions | (4,370 | ) | — | (29,760 | ) | (8,108 | ) | ||||||||
Properties excluded from pool - Development/Redevelopment | (5,038 | ) | (4,845 | ) | (21,136 | ) | (18,453 | ) | |||||||
Properties excluded from pool - All others | (550 | ) | (819 | ) | (2,920 | ) | (6,502 | ) | |||||||
Non-comparable income/expense adjustments (1) | (2,167 | ) | (3,225 | ) | (7,273 | ) | (7,939 | ) | |||||||
Pro-rata share of joint venture properties NOI | 956 | 838 | 3,634 | 3,473 | |||||||||||
Same Property NOI | $ | 35,423 | $ | 35,044 | $ | 118,970 | $ | 116,349 | |||||||
(1) | Includes adjustments for items that affect the comparability of the same center NOI results. Such items include straight-line rents, net of reserves, above/below market rents, other non-comparable operating income/expense adjustments, and the effect of lease termination income/expense. |
38
Inflation
Inflation has been relatively low in recent years and has not had a significant detrimental impact on the results of our operations. Should inflation rates increase in the future, substantially all of our tenant leases contain provisions designed to partially mitigate the negative impact of inflation in the near term. Such lease provisions include clauses that require our tenants to reimburse us for real estate taxes and many of the operating expenses we incur. Also, many of our leases provide for periodic increases in base rent which are either of a fixed amount or based on changes in the consumer price index and/or percentage rents (where the tenant pays us rent based on a percentage of its sales). Significant inflation rate increases over a prolonged period of time may have a material adverse impact on our business.
Recent Accounting Pronouncements
Refer to Note 2 of the notes to the consolidated financial statements for a discussion of Recent Accounting Pronouncements.
Item 7A. Quantitative and Qualitative Disclosures About Market Risk
We have exposure to interest rate risk on our variable rate debt obligations. Based on market conditions, we may manage our exposure to interest rate risk by entering into interest rate swap agreements to hedge our variable rate debt. We are not subject to any foreign currency exchange rate risk or commodity price risk, or other material rate or price risks. Based on our debt and interest rates and interest rate swap agreements in effect at December 31, 2015, a 100 basis point change in interest rates would impact our future earnings and cash flows by approximately $0.9 million annually. We believe that a 100 basis point increase in interest rates would decrease the fair value of our total outstanding debt by approximately $7.4 million at December 31, 2015.
We had interest rate swap agreements with an aggregate notional amount of $285.0 million as of December 31, 2015. The agreements provided for fixed rates ranging from 1.2% to 2.2% and had expirations ranging from April 2016 to May 2021.
The following table sets forth information as of December 31, 2015 concerning our long-term debt obligations, including principal cash flows by scheduled maturity, weighted average interest rates of maturing amounts and fair market value. Net debt premium and unamortized deferred financing costs of approximately $3.1 million are excluded:
2016 | 2017 | 2018 | 2019 | 2020 | Thereafter | Total | Fair Value | ||||||||||||||||||||||||
(In thousands) | |||||||||||||||||||||||||||||||
Fixed-rate debt | $ | 35,845 | $ | 129,096 | $ | 99,132 | $ | 5,860 | $ | 102,269 | $ | 620,255 | $ | 992,457 | $ | 1,010,980 | |||||||||||||||
Average interest rate | 5.8 | % | 5.5 | % | 3.9 | % | 6.8 | % | 3.9 | % | 4.2 | % | 4.4 | % | 4.1 | % | |||||||||||||||
Variable-rate debt | $ | — | $ | — | $ | 60,000 | $ | — | $ | — | $ | 28,125 | $ | 88,125 | $ | 88,125 | |||||||||||||||
Average interest rate | — | % | — | % | 1.6 | % | — | % | — | % | 3.6 | % | 2.3 | % | 2.3 | % | |||||||||||||||
We estimated the fair value of our fixed rate mortgages using a discounted cash flow analysis, based on borrowing rates for similar types of borrowing arrangements with the same remaining maturity. Considerable judgment is required to develop estimated fair values of financial instruments. The table incorporates only those exposures that exist at December 31, 2015 and does not consider those exposures or positions which could arise after that date or firm commitments as of such date. Therefore, the information presented therein has limited predictive value. Our actual interest rate fluctuations will depend on the exposures that arise during the period and on market interest rates at that time.
Item 8. Financial Statements and Supplementary Data
Our consolidated financial statements and supplementary data are included as a separate section in this Annual Report on Form 10-K commencing on page F-1 and are incorporated herein by reference.
39
Item 9. Changes in and Disagreements with Accountants on Accounting and Financial Disclosure
None.
Item 9A. Controls and Procedures
Disclosure Controls and Procedures
We maintain disclosure controls and procedures designed to ensure that information required to be disclosed in our reports under the Securities Exchange Act of 1934, as amended (“Exchange Act”), such as this report on Form 10-K, is recorded, processed, summarized and reported within the time periods specified in the SEC rules and forms, and that such information is accumulated and communicated to our management, including our Chief Executive Officer and Chief Financial Officer, as appropriate, to allow timely decisions regarding required disclosure. In designing and evaluating the disclosure controls and procedures, management recognizes that any controls and procedures, no matter how well designed and operated, can provide only reasonable assurance of achieving the design control objectives, and management was required to apply its judgment in evaluating the cost-benefit relationship of possible controls and procedures.
We carried out an assessment as of December 31, 2015 of the effectiveness of the design and operation of our disclosure controls and procedures. This assessment was done under the supervision and with the participation of management, including our Chief Executive Officer and Chief Financial Officer. Based on such evaluation, our management, including our Chief Executive Officer and Chief Financial Officer, concluded that such disclosure controls and procedures were effective at the reasonable assurance level as of December 31, 2015.
Statement of Our Management
Our management has issued a report on its assessment of the Trust’s internal control over financial reporting, which appears on page F-2 of this Annual Report on Form 10-K.
Statement of Our Independent Registered Public Accounting Firm
Grant Thornton LLP, our independent registered public accounting firm that audited the financial statements included in this Annual Report on Form 10-K, has issued an attestation report on the Trust’s internal control over financial reporting, which appears on page F-3 of this Annual Report on Form 10-K.
Changes in Internal Control over Financial Reporting
There have been no changes in our internal control over financial reporting during the most recently completed fiscal quarter that have materially affected, or are reasonably likely to materially affect, our internal control over financial reporting.
Item 9B. Other Information
None.
40
PART III
Item 10. Directors, Executive Officers and Corporate Governance
Incorporated by reference from our definitive proxy statement to be filed within 120 days after the end of our fiscal year covered by this Form 10-K.
Item 11. Executive Compensation
Incorporated by reference from our definitive proxy statement to be filed within 120 days after the end of our fiscal year covered by this Form 10-K.
Item 12. Security Ownership of Certain Beneficial Owners and Management and Related Stockholder Matters
The following table sets forth information regarding our equity compensations plans as of December 31, 2015:
(A) | (B) | (C) | ||||
Plan Category | Number of securities to be issued upon exercise of outstanding options, warrants and rights | Weighted-average exercise price of outstanding options, warrants and rights | Number of securities remaining available for future issuances under equity compensation plans (excluding securities reflected in column (A)) | |||
Equity compensation plans approved by security holders | 121,098 | $32.13 | 1,559,160 | |||
Equity compensation plans not approved by security holders | — | — | — | |||
Total | 121,098 | $32.13 | 1,559,160 | |||
The total in Column (A) above consisted of options to purchase 107,165 common shares and 13,933 deferred common shares (see Note 16 of the notes to the consolidated financial statements for further information regarding options).
Additional information required by this Item is incorporated by reference from our definitive proxy statement to be filed within 120 days after the end of our fiscal year covered by this Form 10-K.
Item 13. Certain Relationships and Related Transactions, and Director Independence
Incorporated by reference from our definitive proxy statement to be filed within 120 days after the end of our fiscal year covered by this Form 10-K.
Item 14. Principal Accountant Fees and Services
Incorporated by reference from our definitive proxy statement to be filed within 120 days after the end of our fiscal year covered by this Form 10-K.
41
PART IV
Item 15. Exhibits and Financial Statement Schedules
(a)(1) | Consolidated financial statements. See “Item 8 – Financial Statements and Supplementary Data.” |
(2) | Financial statement schedule. See “Item 8 – Financial Statements and Supplementary Data.” |
(3) | Exhibits |
3.1 | Articles of Restatement of Declaration of Trust of the Company, effective June 8, 2010, incorporated by reference Appendix A to the Company's 2010 Proxy dated April 30, 2010. |
3.2* | Amended and Restated Bylaws of the Company, effective February 23, 2012. |
3.3 | Articles of Amendment, as filed with the State Department of Assessments and Taxation of Maryland on April 5, 2011, incorporated by reference to Exhibit 3.1 to the Company’s Form 8-K dated April 6, 2011. |
3.4 | Articles Supplementary, as filed with the State Department of Assessments and Taxation of Maryland on April 5, 2011, incorporated by reference to Exhibit 3.2 to the Company’s Form 8-K dated April 6, 2011. |
3.5 | Articles Supplementary, as filed with the State Department of Assessments and Taxation of Maryland on April 28, 2011, incorporated by reference to Exhibit 3.1 to the Company’s Form 8-K dated April 28, 2011. |
3.6 | Articles of Amendment, as filed with the State Department of Assessments and Taxation of Maryland on July 31, 2013, incorporated by reference to Exhibit 3.1 to the Company’s Form 8-K dated July 31, 2013. |
4.1 | Amended and Restated Fixed Rate Note ($110 million), dated March 30, 2007, by and between Ramco Jacksonville LLC and JPMorgan Chase Bank, N.A., incorporated by reference to Exhibit 4.1 to Registrant’s Form 8-K dated April 16, 2007. |
4.2 | Amended and Restated Mortgage, Assignment of Leases and Rents, Security Agreement and Fixture Filing, dated March 30, 2007, by and between Ramco Jacksonville LLC and JPMorgan Chase Bank, N.A., incorporated by reference to Exhibit 4.2 to Registrant’s Form 8-K dated April 16, 2007. |
4.3 | Assignment of Leases and Rents, dated March 30, 2007, by and between Ramco Jacksonville LLC and JPMorgan Chase Bank, N.A., incorporated by reference to Exhibit 4.3 to Registrant’s Form 8-K dated April 16, 2007. |
4.4 | Environmental Liabilities Agreement, dated March 30, 2007, by and between Ramco Jacksonville LLC and JPMorgan Chase Bank, N.A., incorporated by reference to Exhibit 4.4 to Registrant’s Form 8-K dated April 16, 2007. |
4.5 | Acknowledgment of Property Manager, dated March 30, 2007 by and between Ramco-Gershenson, Inc. and JPMorgan Chase Bank, N.A., incorporated by reference to Exhibit 4.6 to Registrant’s Form 8-K dated April 16, 2007. |
10.1 | Registration Rights Agreement, dated as of May 10, 1996, among the Company, Dennis Gershenson, Joel Gershenson, Bruce Gershenson, Richard Gershenson, Michael A. Ward U/T/A dated 2/22/77, as amended, and each of the Persons set forth on Exhibit A attached thereto, incorporated by reference to Exhibit 10.2 to the Company’s Quarterly Report on Form 10-Q for the period ended June 30, 1996. |
10.2 | Exchange Rights Agreement, dated as of May 10, 1996, by and among the Company and each of the Persons whose names are set forth on Exhibit A attached thereto, incorporated by reference to Exhibit 10.3 to the Company’s Quarterly Report on Form 10-Q for the period ended June 30, 1996. |
42
10.3 | Amended and Restated Limited Partnership Agreement of Ramco/Lion Venture LP, dated as of December 29, 2004, by Ramco-Gershenson Properties, L.P., as a limited partner, Ramco Lion LLC, as a general partner, CLPF-Ramco, L.P. as a limited partner, and CLPF-Ramco GP, LLC as a general partner, incorporated by reference Exhibit 10.62 to the Registrant’s Annual Report on Form 10-K for the year ended December 31, 2004. |
10.4 | Second Amended and Restated Limited Liability Company Agreement of Ramco Jacksonville LLC, dated March 1, 2005, by Ramco-Gershenson Properties , L.P. and SGC Equities LLC., incorporated by reference Exhibit 10.65 to the Registrant’s Quarterly Report on Form 10-Q for the period ended March 31, 2005. |
10.5 | Employment Agreement, dated as of August 1, 2007, between the Company and Dennis Gershenson, incorporated by reference to Exhibit 10.1 to the Company’s Quarterly Report on Form 10-Q for the period ended June 30, 2007.** |
10.6 | Restricted Share Award Agreement Under 2008 Restricted Share Plan for Non-Employee Trustee, incorporated by reference to Exhibit 10.1 to the Company’s Quarterly Report on Form 10-Q for the period ended June 30, 2008.** |
10.7 | Restricted Share Plan for Non-Employee Trustees, incorporated by reference to Appendix A of the Company’s 2008 Proxy Statement filed on April 30, 2008.** |
10.8* | Summary of Trustee Compensation Program.** |
10.9 | Ramco-Gershenson Properties Trust 2012 Omnibus Long-Term Incentive Plan, incorporated by reference to Exhibit 10.1 to Registrant’s Form 8-K, dated June 12, 2012. ** |
10.10 | Change in Control Policy, dated May 14, 2013, incorporated by reference to Exhibit 10.1 to Registrant’s Form 8-K dated May 16, 2013. |
10.11 | Form of Non-Qualified Option Agreement Under 2012 Omnibus Long-Term Incentive Plan, incorporated by reference to Exhibit 10.1 to Registrant’s Form 8-K dated June 12, 2012** |
10.12 | Form of Restricted Stock Award Agreement Under 2012 Omnibus Long-Term Incentive Plan, incorporated by reference to Exhibit 10.1 to Registrant’s Form 8-K dated June 6, 2012** |
10.13 | Unsecured Term Loan Agreement, dated as of September 30, 2011 among Ramco-Gershenson Properties, L.P., as Borrower, Ramco-Gershenson Properties Trust, as Guarantor, KeyBank National Association, The Huntington National Bank, PNC Bank, National Association, KeyBank National Association, as Agent, and KeyBanc Capital Markets, as Sole Lead Manager and Arranger incorporated by reference to Exhibit 10.1 to the Company’s Quarterly Report on Form 10-Q for the period ended September 30, 2011. |
10.14 | Unconditional Guaranty of Payment and Performance, dated as of September 30, 2011, by Ramco-Gershenson Properties Trust, in favor of KeyBank National Association and the other lenders under the Unsecured Term Loan Agreement incorporated by reference to Exhibit 10.2 to the Company’s Quarterly Report on Form 10-Q for the period ended September 30, 2011. |
10.15 | 2015 Executive Incentive Plan, dated February 23, 2015, incorporated by reference to Exhibit 10.1 to the Company’s Current Report on Form 8-K dated February 27, 2015. |
10.16 | Third Amended and Restated Unsecured Master Loan Agreement dated as of July 19, 2012 among Ramco-Gershenson Properties, L.P., as Borrower, Ramco-Gershenson Properties Trust, as a Guarantor, KeyBank National Association, as a Bank, the Other Banks which are a Party to this Agreement, the Other Banks which may become Parties to this Agreement, KeyBank National Association, as Agent, KeyBanc Capital Markets, as Sole Lead Manager and Arranger, JPMorgan Chase Bank, N.A. and Bank of America, N.A. as Co-Syndication Agents, and Deutsche Bank Securities Inc. and PNC Bank, National Association, as Co Documentation Agents incorporated by reference to Exhibit 10.1 to the Company’s Quarterly Report on Form 10-Q ended June 30, 2012. |
10.17 | Third Amended and Restated Unconditional Guaranty of Payment and Performance, dated as of July 19, 2012 by Ramco-Gershenson Properties Trust, as Guarantor, in favor of KeyBank National Association and certain other lenders incorporated by reference to Exhibit 10.2 to the Company’s Quarterly Report on Form 10-Q ended June 30, 2012. |
43
10.18 | $110 Million Note Purchase Agreement, by Ramco-Gershenson Properties, L.P. incorporated by reference to Exhibit 10.1 to the Company's Current Report on Form 8-K dated July 2, 2013. |
10.18 | Agreement for the Acquisition of Partnership and Limited Liability Company Interests, dated March 5, 2013, between CLPF-Ramco, LLC, CLPF-Ramco L.P., Ramco Lion, LLC, Ramco-Gershenson Properties, L.P. and Ramco GP incorporated by reference to Exhibit 10.1 to the Company's Quarterly Report on Form 10-Q ended March 31, 2013. |
10.20 | Unsecured Term Loan Agreement, dated May 16, 2013 among Ramco-Gershenson Properties, L.P., as borrower, Ramco-Gershenson Properties Trust, as Guarantor, Capital One, National Association, as bank, The Other Banks Which Are A Party To this Agreement, The Other Banks Which May Become Parties To This Agreement, Capital One, National Association, as Agent and Capital One, National Association, as Sole Lead Manager and Arranger incorporated by reference to Exhibit 10.2 to the Company's Quarterly Report on Form 10-Q ended June 30, 2013. |
10.21 | First Amendment To Third Amended And Restated Unsecured Master Loan Agreement, dated March 29, 2013 by and among Ramco-Gershenson Properties, L.P. and KeyBank National Association incorporated by reference to Exhibit 10.3 to the Company's Quarterly Report on Form 10-Q ended June 30, 2013. |
10.22 | Third Amendment To Unsecured Term Loan Agreement by and among Ramco-Gershenson Properties, L.P. and KeyBank National Association incorporated by reference to Exhibit 10.4 to the Company's Quarterly Report on Form 10-Q ended June 30, 2013. |
10.23 | Second Amendment To Third Amended And Restated Unsecured Master Loan Agreement, dated June 26, 2013 by and among Ramco-Gershenson Properties, L.P. and KeyBank National Association incorporated by reference to Exhibit 10.1 to the Company's Quarterly Report on Form 10-Q ended September 30, 2013. |
10.24 | Third Amendment To Third Amended And Restated Unsecured Master Loan Agreement, dated August 27, 2013 by and among Ramco-Gershenson Properties, L.P. and KeyBank National Association incorporated by reference to Exhibit 10.2 to the Company's Quarterly Report on Form 10-Q ended September 30, 2013. |
10.25 | $100 Million Note Purchase Agreement, by Ramco-Gershenon Properties, L.P. dated May 28, 2014 incorporated by reference to Exhibit 10.1 to the Company's Quarterly Report on Form 10-Q ended June 30, 2014. |
10.26 | Unsecured Term Loan Agreement, dated May 29, 2014 among Ramco-Gershenson Properties, L.P., as borrower, Ramco-Gershenson Properties Trust, as a Guarantor, Capital One, National Association, as a Bank, The Other Banks Which Are A Party To This Agreement, The Other Banks Which May Become Parties To This Agreement, Capital One, National Association, as Administrative Agent, and Capital One, National Association, as Sole Lead Arranger and Sole Bookrunner incorporated by reference to Exhibit 10.2 to the Company's Quarterly Report on Form 10-Q ended June 30, 2014. |
10.27 | $100 Million Note Purchase Agreement, by Ramco-Gershenson Properties, L.P. dated September 8, 2014 incorporated by reference to Exhibit 10.1 to the Company's Quarterly Report on Form 10-Q ended September 30, 2014. |
10.28 | Fourth Amendment to Third Amended and Restated Unsecured Master Loan Agreement, dated October 10, 2014 by and among Ramco-Gershenson Properties, L.P. and KeyBank National Association incorporated by reference to Exhibit 10.2 to the Company's Quarterly Report on Form 10-Q ended September 30, 2014. |
10.29 | Employment Agreement dated April 20, 2015, between Ramco-Gershenson Properties Trust and John Hendrickson incorporated by reference to Exhibit 10.1 to the Company's Current Report on Form 8-K dated April 23, 2015. |
10.30 | Agreement for Partial Liquidation of Joint Venture between Ramco HMW LLC, Ramco Gershenson Properties, L.P., Ramco 450 Venture LLC and the State Board of Administration of Florida dated June 29, 2015 incorporated by reference to Exhibit 10.1 to the Company's Quarterly Report on Form 10-Q ended June 30, 2015. |
44
10.31 | $100 Million Note Purchase Agreement, by Ramco-Gershenson Properties, L.P. dated September 30, 2015 incorporated by reference to Exhibit 10.1 to the Company's Quarterly Report on Form 10-Q ended September 30, 2015. |
10.32 | Employment Agreement, dated December 16, 2015, between Ramco-Gershenson Properties Trust and Geoffrey Bedrosian incorporated by reference to Exhibit 10.1 to the Company's Current Report on Form 8-K dated December 18, 2015. |
12.1* | Computation of Ratio of Earnings to Combined Fixed Charges and Preferred Share Dividends. |
21.1* | Subsidiaries |
23.1* | Consent of Grant Thornton LLP. |
31.1* | Certification of Chief Executive Officer pursuant to Section 302 of the Sarbanes-Oxley Act of 2002. |
31.2* | Certification of Chief Financial Officer pursuant to Section 302 of the Sarbanes-Oxley Act of 2002. |
32.2* | Certification of Chief Financial Officer pursuant to Section 906 of the Sarbanes-Oxley Act of 2002. |
101.INS(1) | XBRL Instance Document |
101.SCH(1) | XBRL Taxonomy Extension Schema |
101.CAL(1) | XBRL Extension Calculation |
101.DEF(1) | XBRL Extension Definition |
101.LAB(1) | XBRL Taxonomy Extension Label |
101.PRE(1) | XBRL Taxonomy Extension Presentation |
* Filed herewith
** Management contract or compensatory plan or arrangement
(1) Pursuant to Rule 406T of Regulations S-T, these interactive data files are deemed not filed or part of a registration statement or prospectus for purposes of Sections 11 or 12 of the Securities Act of 1933, are deemed not filed for purposes of Sections 18 of the Securities Exchange Act of 1924 and otherwise are not subject to liability thereunder.
15(b) The exhibits listed at item 15(a)(3) that are noted ‘filed herewith’ are hereby filed with this report.
15(c) The financial statement schedules listed at Item 15(a)(2) are hereby filed with this report.
45
SIGNATURES
Pursuant to the requirements of Section 13 or 15 (d) of the Securities Exchange Act of 1934, the registrant has duly caused this report to be signed on its behalf by the undersigned, thereunto duly authorized.
Ramco-Gershenson Properties Trust | |||
Dated: | February 29, 2016 | By: /s/ Dennis E. Gershenson | |
Dennis E. Gershenson, | |||
President and Chief Executive Officer | |||
Pursuant to the requirements of the Securities Exchange Act of 1934, this report has been signed by the following persons on behalf of registrant and in the capacities and on the dates indicated.
Dated: | February 29, 2016 | By: /s/ Stephen R. Blank | |
Stephen R. Blank, | |||
Chairman | |||
Dated: | February 29, 2016 | By: /s/ Dennis E. Gershenson | |
Dennis E. Gershenson, | |||
Trustee, President and Chief Executive Officer | |||
(Principal Executive Officer) | |||
Dated: | February 29, 2016 | By: /s/ Alice M. Connell | |
Alice M. Connell | |||
Trustee | |||
Dated: | February 29, 2016 | By: /s/ Arthur H. Goldberg | |
Arthur H. Goldberg, | |||
Trustee | |||
Dated: | February 29, 2016 | By: /s/ David J. Nettina | |
David J. Nettina, | |||
Trustee | |||
Dated: | February 29, 2016 | By: /s/ Joel M. Pashcow | |
Joel M. Pashcow, | |||
Trustee | |||
Dated: | February 29, 2016 | By: /s/ Mark K. Rosenfeld | |
Mark K. Rosenfeld, | |||
Trustee | |||
Dated: | February 29, 2016 | By: /s/ Laurie M. Shahon | |
Laurie M. Shahon, | |||
Trustee | |||
Dated: | February 29, 2016 | By: /s/ Michael A. Ward | |
Michael A. Ward, | |||
Trustee | |||
Dated: | February 29, 2016 | By: /s/ Geoffrey Bedrosian | |
Geoffrey Bedrosian, | |||
Chief Financial Officer and Secretary | |||
(Principal Financial Officer) | |||
Dated: | February 29, 2016 | By: /s/ Deborah R. Cheek | |
Deborah R. Cheek | |||
Chief Accounting Officer | |||
(Principal Accounting Officer) | |||
46
RAMCO-GERSHENSON PROPERTIES TRUST
Index to Consolidated Financial Statements
Page | |
Consolidated Financial Statements: | |
F-1
Management’s Report on Internal Control Over Financial Reporting
Management is responsible for establishing and maintaining effective internal control over financial reporting as such term is defined under Rule 13a-15(f) promulgated under the Securities Exchange Act of 1934, as amended.
Internal control over financial reporting is a process designed to provide reasonable assurance regarding the reliability of financial reporting and preparation of our consolidated financial statements for external purposes in accordance with generally accepted accounting principles.
Internal control over financial reporting includes those policies and procedures that pertain to our ability to record, process, summarize and report reliable financial data. Management recognizes that there are inherent limitations in the effectiveness of any internal control and effective internal control over financial reporting can provide only reasonable assurance with respect to financial statement preparation. Additionally, because of changes in conditions, the effectiveness of internal control over financial reporting may vary over time.
Because of its inherent limitations, internal control over financial reporting may not prevent or detect misstatements. Also, projections of any evaluation of effectiveness to future periods are subject to the risk that controls may become inadequate because of changes in conditions, or that the degree of compliance with the policies or procedures may deteriorate.
Our management conducted an assessment of our internal controls over financial reporting as of December 31, 2015 using the framework established in 2013 by the Committee of Sponsoring Organizations of the Treadway Commission in Internal Control – Integrated Framework. Based on this assessment, management has concluded that our internal control over financial reporting was effective as of December 31, 2015.
Our independent registered public accounting firm, Grant Thornton LLP, has issued an attestation report on our internal control over financial reporting. Their report appears on page F-3 of this Annual Report on Form 10-K.
F-2
REPORT OF INDEPENDENT REGISTERED PUBLIC ACCOUNTING FIRM
Board of Trustees and Shareholders
Ramco-Gershenson Properties Trust
We have audited the internal control over financial reporting of Ramco-Gershenson Properties Trust (a Maryland corporation) and subsidiaries (the “Company”) as of December 31, 2015, based on criteria established in the 2013 Internal Control-Integrated Framework issued by the Committee of Sponsoring Organizations of the Treadway Commission (COSO). The Company’s management is responsible for maintaining effective internal control over financial reporting and for its assessment of the effectiveness of internal control over financial reporting, included in the accompanying Management’s Report on Internal Control Over Financial Reporting. Our responsibility is to express an opinion on the Company’s internal control over financial reporting based on our audit.
We conducted our audit in accordance with the standards of the Public Company Accounting Oversight Board (United States). Those standards require that we plan and perform the audit to obtain reasonable assurance about whether effective internal control over financial reporting was maintained in all material respects. Our audit included obtaining an understanding of internal control over financial reporting, assessing the risk that a material weakness exists, testing and evaluating the design and operating effectiveness of internal control based on the assessed risk, and performing such other procedures as we considered necessary in the circumstances. We believe that our audit provides a reasonable basis for our opinion.
A company’s internal control over financial reporting is a process designed to provide reasonable assurance regarding the reliability of financial reporting and the preparation of financial statements for external purposes in accordance with generally accepted accounting principles. A company’s internal control over financial reporting includes those policies and procedures that (1) pertain to the maintenance of records that, in reasonable detail, accurately and fairly reflect the transactions and dispositions of the assets of the company; (2) provide reasonable assurance that transactions are recorded as necessary to permit preparation of financial statements in accordance with generally accepted accounting principles, and that receipts and expenditures of the company are being made only in accordance with authorizations of management and directors of the company; and (3) provide reasonable assurance regarding prevention or timely detection of unauthorized acquisition, use, or disposition of the company’s assets that could have a material effect on the financial statements.
Because of its inherent limitations, internal control over financial reporting may not prevent or detect misstatements. Also, projections of any evaluation of effectiveness to future periods are subject to the risk that controls may become inadequate because of changes in conditions, or that the degree of compliance with the policies or procedures may deteriorate.
In our opinion, the Company maintained, in all material respects, effective internal control over financial reporting as of December 31, 2015, based on criteria established in the 2013 Internal Control-Integrated Framework issued by COSO.
We also have audited, in accordance with the standards of the Public Company Accounting Oversight Board (United States), the consolidated financial statements of the Company as of and for the year ended December 31, 2015, and our report dated February 29, 2016 expressed an unqualified opinion on those financial statements.
/s/ GRANT THORNTON LLP
Southfield, Michigan
February 29, 2016
F-3
REPORT OF INDEPENDENT REGISTERED PUBLIC ACCOUNTING FIRM
Board of Trustees and Shareholders
Ramco-Gershenson Properties Trust
We have audited the accompanying consolidated balance sheets of Ramco-Gershenson Properties Trust (a Maryland corporation) and subsidiaries (the “Company”) as of December 31, 2015 and 2014, and the related consolidated statements of operations and comprehensive income (loss), shareholders’ equity, and cash flows for each of the three years in the period ended December 31, 2015. Our audits of the basic consolidated financial statements included the financial statement schedule listed in the index appearing under Item 15. These financial statements and financial statement schedule are the responsibility of the Company’s management. Our responsibility is to express an opinion on these financial statements and financial statement schedule based on our audits.
We conducted our audits in accordance with the standards of the Public Company Accounting Oversight Board (United States). Those standards require that we plan and perform the audit to obtain reasonable assurance about whether the financial statements are free of material misstatement. An audit includes examining, on a test basis, evidence supporting the amounts and disclosures in the financial statements. An audit also includes assessing the accounting principles used and significant estimates made by management, as well as evaluating the overall financial statement presentation. We believe that our audits provide a reasonable basis for our opinion.
In our opinion, the consolidated financial statements referred to above present fairly, in all material respects, the financial position of Ramco-Gershenson Properties Trust and subsidiaries as of December 31, 2015 and 2014, and the results of their operations and their cash flows for each of the three years in the period ended December 31, 2015 in conformity with accounting principles generally accepted in the United States of America. Also in our opinion, the related financial statement schedule, when considered in relation to the basic consolidated financial statements taken as a whole, presents fairly, in all material respects, the information set forth therein.
We also have audited, in accordance with the standards of the Public Company Accounting Oversight Board (United States), the Company’s internal control over financial reporting as of December 31, 2015, based on criteria established in the 2013 Internal Control-Integrated Framework issued by the Committee of Sponsoring Organizations of the Treadway Commission (COSO), and our report dated February 29, 2016 expressed an unqualified opinion.
As discussed in Note 2 to the consolidated financial statements, the Company adopted new accounting guidance in 2015 and 2014, related to the presentation of deferred financing costs.
/s/GRANT THORNTON LLP
Southfield, Michigan
February 29, 2016
F-4
RAMCO-GERSHENSON PROPERTIES TRUST
CONSOLIDATED BALANCE SHEETS
(In thousands, except per share amounts)
December 31, | |||||||
2015 | 2014 | ||||||
ASSETS | |||||||
Income producing properties, at cost: | |||||||
Land | $ | 392,352 | $ | 341,388 | |||
Buildings and improvements | 1,792,129 | 1,592,644 | |||||
Less accumulated depreciation and amortization | (331,520 | ) | (287,177 | ) | |||
Income producing properties, net | 1,852,961 | 1,646,855 | |||||
Construction in progress and land available for development or sale | 60,166 | 74,655 | |||||
Real estate held for sale | 453 | — | |||||
Net real estate | 1,913,580 | 1,721,510 | |||||
Equity investments in unconsolidated joint ventures | 4,325 | 28,733 | |||||
Cash and cash equivalents | 6,644 | 9,335 | |||||
Restricted cash | 8,708 | 8,163 | |||||
Accounts receivable, net | 18,705 | 11,997 | |||||
Acquired lease intangibles, net | 88,819 | 77,045 | |||||
Other assets, net | 87,890 | 87,549 | |||||
TOTAL ASSETS | $ | 2,128,671 | $ | 1,944,332 | |||
LIABILITIES AND SHAREHOLDERS' EQUITY | |||||||
Notes payable, net | $ | 1,083,711 | $ | 917,658 | |||
Capital lease obligation | 1,108 | 1,828 | |||||
Accounts payable and accrued expenses | 44,480 | 44,232 | |||||
Acquired lease intangibles, net | 64,193 | 54,278 | |||||
Other liabilities | 10,035 | 10,106 | |||||
Distributions payable | 18,807 | 17,951 | |||||
TOTAL LIABILITIES | 1,222,334 | 1,046,053 | |||||
Commitments and Contingencies | |||||||
Ramco-Gershenson Properties Trust ("RPT") Shareholders' Equity: | |||||||
Preferred shares, $0.01 par, 2,000 shares authorized: 7.25% Series D Cumulative Convertible Perpetual Preferred Shares, (stated at liquidation preference $50 per share), 1,849 and 2,000 shares issued and outstanding as of December 31, 2015 and 2014, respectively | 92,427 | 100,000 | |||||
Common shares of beneficial interest, $0.01 par, 120,000 shares authorized, 79,162 and 77,573 shares issued and outstanding as of December 31, 2015 and 2014, respectively | 792 | 776 | |||||
Additional paid-in capital | 1,156,345 | 1,130,262 | |||||
Accumulated distributions in excess of net income | (363,937 | ) | (356,715 | ) | |||
Accumulated other comprehensive loss | (1,404 | ) | (1,966 | ) | |||
TOTAL SHAREHOLDERS' EQUITY ATTRIBUTABLE TO RPT | 884,223 | 872,357 | |||||
Noncontrolling interest | 22,114 | 25,922 | |||||
TOTAL SHAREHOLDERS' EQUITY | 906,337 | 898,279 | |||||
TOTAL LIABILITIES AND SHAREHOLDERS' EQUITY | $ | 2,128,671 | $ | 1,944,332 | |||
The accompanying notes are an integral part of these consolidated financial statements.
F-5
RAMCO-GERSHENSON PROPERTIES TRUST
CONSOLIDATED STATEMENTS OF OPERATIONS AND COMPREHENSIVE INCOME (LOSS)
(In thousands, except per share amounts)
Year Ended December 31, | |||||||||||
2015 | 2014 | 2013 | |||||||||
REVENUE | |||||||||||
Minimum rent | $ | 183,198 | $ | 157,691 | $ | 124,169 | |||||
Percentage rent | 539 | 264 | 209 | ||||||||
Recovery income from tenants | 61,561 | 52,828 | 40,018 | ||||||||
Other property income | 4,739 | 5,521 | 3,337 | ||||||||
Management and other fee income | 1,753 | 2,059 | 2,335 | ||||||||
TOTAL REVENUE | 251,790 | 218,363 | 170,068 | ||||||||
EXPENSES | |||||||||||
Real estate taxes | 38,737 | 31,474 | 23,161 | ||||||||
Recoverable operating expense | 30,604 | 27,319 | 20,194 | ||||||||
Other non-recoverable operating expense | 4,271 | 3,633 | 3,006 | ||||||||
Depreciation and amortization | 89,439 | 81,182 | 56,305 | ||||||||
Acquisitions costs | 644 | 1,890 | 1,322 | ||||||||
General and administrative expense | 20,077 | 21,670 | 20,951 | ||||||||
Provision for impairment | 2,521 | 27,865 | 9,669 | ||||||||
TOTAL EXPENSES | 186,293 | 195,033 | 134,608 | ||||||||
OPERATING INCOME | 65,497 | 23,330 | 35,460 | ||||||||
OTHER INCOME AND EXPENSES | |||||||||||
Other expense, net | (624 | ) | (689 | ) | (965 | ) | |||||
Gain on sale of real estate | 17,570 | 10,857 | 4,279 | ||||||||
Earnings (loss) from unconsolidated joint ventures | 17,696 | 75 | (4,759 | ) | |||||||
Interest expense | (40,778 | ) | (33,742 | ) | (29,075 | ) | |||||
Amortization of deferred financing fees | (1,433 | ) | (1,446 | ) | (1,447 | ) | |||||
Gain on remeasurement of unconsolidated joint ventures | 7,892 | 117 | 5,282 | ||||||||
Gain (loss) on extinguishment of debt | 1,414 | (860 | ) | (340 | ) | ||||||
INCOME (LOSS) FROM CONTINUING OPERATIONS BEFORE TAX | 67,234 | (2,358 | ) | 8,435 | |||||||
Income tax provision | (339 | ) | (54 | ) | (64 | ) | |||||
INCOME (LOSS) FROM CONTINUING OPERATIONS | 66,895 | (2,412 | ) | 8,371 | |||||||
DISCONTINUED OPERATIONS | |||||||||||
Gain on sale of real estate | — | — | 2,120 | ||||||||
Income from discontinued operations | — | — | 971 | ||||||||
INCOME FROM DISCONTINUED OPERATIONS | — | — | 3,091 | ||||||||
NET INCOME (LOSS) | 66,895 | (2,412 | ) | 11,462 | |||||||
Net (income) loss attributable to noncontrolling partner interest | (1,786 | ) | 48 | (465 | ) | ||||||
NET INCOME (LOSS) ATTRIBUTABLE TO RPT | 65,109 | (2,364 | ) | 10,997 | |||||||
Preferred share dividends | (6,838 | ) | (7,250 | ) | (7,250 | ) | |||||
Preferred share conversion costs | (500 | ) | — | — | |||||||
NET INCOME (LOSS) AVAILABLE TO COMMON SHAREHOLDERS | $ | 57,771 | $ | (9,614 | ) | $ | 3,747 | ||||
EARNINGS (LOSS) PER COMMON SHARE, BASIC | |||||||||||
Continuing operations | $ | 0.73 | $ | (0.14 | ) | $ | 0.01 | ||||
Discontinued operations | — | — | 0.05 | ||||||||
$ | 0.73 | $ | (0.14 | ) | $ | 0.06 | |||||
EARNINGS (LOSS) PER COMMON SHARE, DILUTED | |||||||||||
Continuing operations | $ | 0.73 | $ | (0.14 | ) | $ | 0.01 | ||||
Discontinued operations | — | — | 0.05 | ||||||||
$ | 0.73 | $ | (0.14 | ) | $ | 0.06 | |||||
WEIGHTED AVERAGE COMMON SHARES OUTSTANDING | |||||||||||
Basic | 78,848 | 72,118 | 59,336 | ||||||||
Diluted | 79,035 | 72,118 | 59,728 | ||||||||
OTHER COMPREHENSIVE INCOME (LOSS) | |||||||||||
Net income (loss) | $ | 66,895 | $ | (2,412 | ) | $ | 11,462 | ||||
Other comprehensive income (loss): | |||||||||||
Gain (loss) on interest rate swaps | 570 | (2,115 | ) | 5,520 | |||||||
Comprehensive income (loss) | 67,465 | (4,527 | ) | 16,982 | |||||||
Comprehensive (income) loss attributable to noncontrolling interest | (1,794 | ) | 113 | (660 | ) | ||||||
COMPREHENSIVE INCOME (LOSS) ATTRIBUTABLE TO RPT | $ | 65,671 | $ | (4,414 | ) | $ | 16,322 | ||||
The accompanying notes are an integral part of these consolidated financial statements.
F-6
RAMCO-GERSHENSON PROPERTIES TRUST
CONSOLIDATED STATEMENTS OF SHAREHOLDERS' EQUITY
(In thousands, except share amounts)
Shareholders' Equity of Ramco-Gershenson Properties Trust | |||||||||||||||||||||||||||
Preferred Shares | Common Shares | Additional Paid-in Capital | Accumulated Distributions in Excess of Net Income | Accumulated Other Comprehensive (Loss) Income | Noncontrolling Interest | Total Shareholders’ Equity | |||||||||||||||||||||
Balance, December 31, 2012 | $ | 100,000 | $ | 485 | $ | 683,609 | $ | (249,070 | ) | $ | (5,241 | ) | $ | 30,049 | $ | 559,832 | |||||||||||
Issuance of common shares | — | 181 | 273,568 | — | — | — | 273,749 | ||||||||||||||||||||
Conversion and redemption of OP unit holders | — | — | — | — | — | (1,243 | ) | (1,243 | ) | ||||||||||||||||||
Share-based compensation and other expense, net of shares withheld for employee taxes | — | 1 | 2,006 | — | — | — | 2,007 | ||||||||||||||||||||
Dividends declared to common shareholders | — | — | — | (44,172 | ) | — | — | (44,172 | ) | ||||||||||||||||||
Dividends declared to preferred shareholders | — | — | — | (7,250 | ) | — | — | (7,250 | ) | ||||||||||||||||||
Distributions declared to noncontrolling interests | — | — | — | — | — | (1,603 | ) | (1,603 | ) | ||||||||||||||||||
Dividends paid on restricted shares | — | — | — | (342 | ) | — | — | (342 | ) | ||||||||||||||||||
Other comprehensive income adjustment | — | — | — | — | 5,325 | 195 | 5,520 | ||||||||||||||||||||
Net income | — | — | — | 10,997 | — | 465 | 11,462 | ||||||||||||||||||||
Balance, December 31, 2013 | 100,000 | 667 | 959,183 | (289,837 | ) | 84 | 27,863 | 797,960 | |||||||||||||||||||
Issuance of common shares | — | 107 | 170,265 | — | — | — | 170,372 | ||||||||||||||||||||
Conversion and redemption of OP unit holders | — | — | — | — | — | (84 | ) | (84 | ) | ||||||||||||||||||
Share-based compensation and other expense, net of shares withheld for employee taxes | — | 2 | 814 | — | — | — | 816 | ||||||||||||||||||||
Dividends declared to common shareholders | — | — | — | (56,905 | ) | — | — | (56,905 | ) | ||||||||||||||||||
Dividends declared to preferred shareholders | — | — | — | (7,250 | ) | — | — | (7,250 | ) | ||||||||||||||||||
Distributions declared to noncontrolling interests | — | — | — | — | — | (1,744 | ) | (1,744 | ) | ||||||||||||||||||
Dividends declared to deferred shares | — | — | — | (359 | ) | — | — | (359 | ) | ||||||||||||||||||
Other comprehensive loss adjustment | — | — | — | — | (2,050 | ) | (65 | ) | (2,115 | ) | |||||||||||||||||
Net loss | — | — | — | (2,364 | ) | — | (48 | ) | (2,412 | ) | |||||||||||||||||
Balance, December 31, 2014 | 100,000 | 776 | 1,130,262 | (356,715 | ) | (1,966 | ) | 25,922 | 898,279 | ||||||||||||||||||
Issuance of common shares | — | 9 | 17,101 | — | — | — | 17,110 | ||||||||||||||||||||
Conversion and redemption of OP unit holders | — | — | — | — | — | (3,826 | ) | (3,826 | ) | ||||||||||||||||||
Conversion of preferred shares | (7,573 | ) | 5 | 7,568 | (500 | ) | — | — | (500 | ) | |||||||||||||||||
Share-based compensation and other expense, net of shares withheld for employee taxes | — | 2 | 1,414 | — | — | — | 1,416 | ||||||||||||||||||||
Dividends declared to common shareholders | — | — | — | (64,656 | ) | — | — | (64,656 | ) | ||||||||||||||||||
Dividends declared to preferred shareholders | — | — | — | (6,838 | ) | — | — | (6,838 | ) | ||||||||||||||||||
Distributions declared to noncontrolling interests | — | — | — | — | — | (1,776 | ) | (1,776 | ) | ||||||||||||||||||
Dividends declared to deferred shares | — | — | — | (337 | ) | — | — | (337 | ) | ||||||||||||||||||
Other comprehensive income adjustment | — | — | — | — | 562 | 8 | 570 | ||||||||||||||||||||
Net income | — | — | — | 65,109 | — | 1,786 | 66,895 | ||||||||||||||||||||
Balance, December 31, 2015 | $ | 92,427 | $ | 792 | $ | 1,156,345 | $ | (363,937 | ) | $ | (1,404 | ) | $ | 22,114 | $ | 906,337 | |||||||||||
The accompanying notes are an integral part of these consolidated financial statements.
F-7
RAMCO-GERSHENSON PROPERTIES TRUST
CONSOLIDATED STATEMENTS OF CASH FLOWS
(In thousands)
Year Ended December 31, | |||||||||||
2015 | 2014 | 2013 | |||||||||
OPERATING ACTIVITIES | |||||||||||
Net income (loss) | $ | 66,895 | $ | (2,412 | ) | $ | 11,462 | ||||
Adjustments to reconcile net income (loss) to net cash provided by operating activities: | |||||||||||
Depreciation and amortization, including discontinued operations | 89,439 | 81,182 | 56,841 | ||||||||
Amortization of deferred financing fees, including discontinued operations | 1,433 | 1,446 | 1,447 | ||||||||
Income tax provision | 339 | 54 | 64 | ||||||||
(Earnings) loss from unconsolidated joint ventures | (17,696 | ) | (75 | ) | 4,759 | ||||||
Distributions received from operations of unconsolidated joint ventures | 1,744 | 1,881 | 3,232 | ||||||||
Provision for impairment, including discontinued operations | 2,521 | 27,865 | 9,669 | ||||||||
(Gain) loss on extinguishment of debt, including discontinued operations | (1,414 | ) | 860 | — | |||||||
Gain on remeasurement of unconsolidated joint ventures | (7,892 | ) | (117 | ) | (5,282 | ) | |||||
Gain on sale of real estate, including discontinued operations | (17,570 | ) | (10,857 | ) | (6,399 | ) | |||||
Amortization of premium on mortgages and notes payable, net | (1,687 | ) | (1,138 | ) | (541 | ) | |||||
Share-based compensation expense | 1,888 | 2,093 | 2,151 | ||||||||
Long-term incentive cash compensation (benefit) expense | (271 | ) | 2,527 | 1,498 | |||||||
Changes in assets and liabilities: | |||||||||||
Accounts receivable, net | (6,708 | ) | (2,349 | ) | (1,672 | ) | |||||
Other assets, net | 4,529 | 5,420 | (689 | ) | |||||||
Accounts payable, accrued expenses and other liabilities | (10,392 | ) | 4,212 | 9,043 | |||||||
Net cash provided by operating activities | 105,158 | 110,592 | 85,583 | ||||||||
INVESTING ACTIVITIES | |||||||||||
Acquisitions of real estate, net of assumed debt | $ | (152,923 | ) | $ | (264,414 | ) | $ | (342,189 | ) | ||
Development and capital improvements | (60,923 | ) | (80,742 | ) | (44,625 | ) | |||||
Net proceeds from sales of real estate | 45,960 | 34,156 | 33,916 | ||||||||
Distributions from sale of joint venture property | 14,098 | — | 1,687 | ||||||||
(Increase) decrease in restricted cash | (545 | ) | (4,709 | ) | 438 | ||||||
Investment in unconsolidated joint ventures | — | (14 | ) | (4,979 | ) | ||||||
Net cash used in investing activities | (154,333 | ) | (315,723 | ) | (355,752 | ) | |||||
FINANCING ACTIVITIES | |||||||||||
Proceeds on mortgages and notes payable | $ | 150,000 | $ | 275,000 | $ | 185,000 | |||||
Repayment of mortgages and notes payable | (92,305 | ) | (153,795 | ) | (121,817 | ) | |||||
Net proceeds (repayments) on revolving credit facility | 50,000 | (17,000 | ) | (13,000 | ) | ||||||
Payment of debt extinguishment costs | — | — | (340 | ) | |||||||
Payment of deferred financing costs | (522 | ) | (2,379 | ) | (1,889 | ) | |||||
Proceeds from issuance of common shares | 17,110 | 170,372 | 274,295 | ||||||||
Repayment of capitalized lease obligation | (720 | ) | (328 | ) | (337 | ) | |||||
Conversion of operating partnership units for cash | (3,826 | ) | (84 | ) | (1,243 | ) | |||||
Conversion of preferred shares | (500 | ) | — | — | |||||||
Dividends paid to preferred shareholders | (6,977 | ) | (7,250 | ) | (7,250 | ) | |||||
Dividends paid to common shareholders | (63,972 | ) | (54,149 | ) | (40,108 | ) | |||||
Distributions paid to operating partnership unit holders | (1,804 | ) | (1,716 | ) | (1,580 | ) | |||||
Net cash provided by financing activities | 46,484 | 208,671 | 271,731 | ||||||||
Net change in cash and cash equivalents | (2,691 | ) | 3,540 | 1,562 | |||||||
Cash and cash equivalents at beginning of period | 9,335 | 5,795 | 4,233 | ||||||||
Cash and cash equivalents at end of period | $ | 6,644 | $ | 9,335 | $ | 5,795 | |||||
SUPPLEMENTAL DISCLOSURE OF NON-CASH ACTIVITY | |||||||||||
Assumption of debt related to acquisitions | $ | 60,048 | $ | 58,634 | $ | 158,767 | |||||
SUPPLEMENTAL DISCLOSURE OF CASH FLOW INFORMATION | |||||||||||
Cash paid for interest (net of capitalized interest of $1,613, $1,862 and $1,161 in 2015, 2014 and 2013, respectively) | $ | 42,898 | $ | 35,507 | $ | 30,631 | |||||
Cash paid for federal income taxes | — | — | — | ||||||||
The accompanying notes are an integral part of these consolidated financial statements.
F-8
RAMCO-GERSHENSON PROPERTIES TRUST
NOTES TO CONSOLIDATED FINANCIAL STATEMENTS
Years Ended December 31, 2015, 2014 and 2013
1. Organization and Summary of Significant Accounting Policies
Ramco-Gershenson Properties Trust, together with our subsidiaries (the “Company”), is a real estate investment trust (“REIT”) engaged in the business of owning, developing, redeveloping, acquiring, managing and leasing large multi-anchored shopping centers primarily in a dozen of the largest metropolitan markets in the United States. Our property portfolio consists of 70 wholly owned shopping centers and one office building comprising approximately 15.3 million square feet. We also have ownership interests ranging from 7% to 30% in four joint ventures, three of which own a single shopping center. Our joint ventures are reported using equity method accounting. We earn fees from the joint ventures for managing, leasing and redeveloping the shopping centers they own. We also own interests in several land parcels that are available for development or sale. Most of our properties are anchored by supermarkets and/or national chain stores. The Company's credit risk, therefore, is concentrated in the retail industry.
We made an election to qualify as a REIT for federal income tax purposes. Accordingly, we generally will not be subject to federal income tax, provided that we annually distribute at least 90% of our taxable income to our shareholders and meet other conditions.
Principles of Consolidation and Estimates
The consolidated financial statements include the accounts of us and our majority owned subsidiary, the Operating Partnership, Ramco-Gershenson Properties, L.P. (97.6%, 97.2% and 96.8% owned by us at December 31, 2015, 2014 and 2013, respectively), and all wholly-owned subsidiaries, including entities in which we have a controlling interest or have been determined to be the primary beneficiary of a variable interest entity (“VIE”). The presentation of consolidated financial statements does not itself imply that assets of any consolidated entity (including any special-purpose entity formed for a particular project) are available to pay the liabilities of any other consolidated entity, or that the liabilities of any other consolidated entity (including any special-purpose entity formed for a particular project) are obligations of any other consolidated entity. Investments in real estate joint ventures over which we have the ability to exercise significant influence, but for which we do not have financial or operating control, are accounted for using the equity method of accounting. Accordingly, our share of the earnings (loss) of these joint ventures is included in consolidated net income (loss). All intercompany transactions and balances are eliminated in consolidation.
We own 100% of the non-voting and voting common stock of Ramco-Gershenson, Inc. (“Ramco”), and therefore it is included in the consolidated financial statements. Ramco has elected to be a taxable REIT subsidiary for federal income tax purposes. Ramco provides property management services to us and to other entities, including our real estate joint venture partners.
The preparation of financial statements in conformity with accounting principles generally accepted in the United States of America (“GAAP”) requires our management to make estimates and assumptions that affect the reported amounts of assets and liabilities and disclosure of contingent assets and liabilities at the date of the financial statements and the reported amounts of revenues and expenses during the reporting period. We base our estimates on historical experience and on various other assumptions that we believe to be reasonable under the circumstances, the results of which form the basis for making judgments about the carrying values of assets and liabilities and reported amounts that are not readily apparent from other sources. Actual results could differ from those estimates.
Reclassifications and Revisions
Certain reclassifications of prior period amounts have been made in the consolidated financial statements and footnotes in order to conform to the current presentation.
In previously filed quarterly reports, the Company erroneously calculated comprehensive income attributable to noncontrolling interest. Accordingly, the Consolidated Statements of Comprehensive Income have been revised. The revision resulted in a decrease to previously reported comprehensive income attributable to RPT as follows:
F-9
Year Ended December 31, | Year Ended December 31, | ||||||
2014 | 2013 | ||||||
(in thousands) | |||||||
Comprehensive loss (income) attributable to non controlling interest as previously reported | $ | 65 | $ | (195 | ) | ||
Comprehensive loss (income) attributable to non controlling interest as revised | $ | 113 | $ | (660 | ) | ||
Comprehensive (loss) income attributable to RPT as previously reported | $ | (4,462 | ) | $ | 16,787 | ||
Comprehensive (loss) income attributable to RPT as revised | $ | (4,414 | ) | $ | 16,322 | ||
There was no impact to the Consolidated Balance Sheets, Consolidated Statements of Operations and Consolidated Statements of Shareholders’ Equity or to the Company’s cash position.
Revenue Recognition and Accounts Receivable
Our shopping center space is generally leased to retail tenants under leases that are classified as operating leases. We recognize minimum rents using the straight-line method over the terms of the leases commencing when the tenant takes possession of the space or when construction of landlord funded improvements is substantially complete. Certain of the leases also provide for contingent percentage rental income which is recorded on an accrual basis once the specified target that triggers this type of income is achieved. The leases also provide for reimbursement from tenants for common area maintenance (“CAM”), insurance, real estate taxes and other operating expenses ("Recovery Income"). The majority of our Recovery Income is estimated and recognized as revenue in the period the recoverable costs are incurred or accrued. Revenues from management, leasing, and other fees are recognized in the period in which the services have been provided and the earnings process is complete. Lease termination income is recognized when a lease termination agreement is executed by the parties and the tenant vacates the space. When a lease is terminated early but the tenant continues to control the space under a modified lease agreement, the lease termination fee is generally recognized evenly over the remaining term of the modified lease agreement.
Current accounts receivable from tenants primarily relate to contractual minimum rent, percentage rent and Recovery Income.
We provide for bad debt expense based upon the allowance method of accounting. We monitor the collectability of our accounts receivable from specific tenants on an ongoing basis, analyze historical bad debts, customer creditworthiness, current economic trends and changes in tenant payment terms when evaluating the adequacy of the allowance for bad debts. Allowances are taken for those balances that we have reason to believe may be uncollectible. When tenants are in bankruptcy, we make estimates of the expected recovery of pre-petition and post-petition claims. The period to resolve these claims can exceed one year. Management believes the allowance for doubtful accounts is adequate to absorb currently estimated bad debts. However, if we experience bad debts in excess of the allowance we have established, our operating income would be reduced. At December 31, 2015 and 2014, our accounts receivable were $18.7 million and $12.0 million, respectively, net of allowances for doubtful accounts of $2.8 million and $2.3 million, respectively.
In addition, many of our leases contain non-contingent rent escalations for which we recognize income on a straight-line basis over the non-cancelable lease term. This method results in rental income in the early years of a lease being higher than actual cash received, creating a straight-line rent receivable asset which is included in the “Other assets, net” line item in our consolidated balance sheets. We review our unbilled straight-line rent receivable balance to determine the future collectability of revenue that will not be billed to or collected from tenants due to early lease terminations, lease modifications, bankruptcies and other factors. Our evaluation is based on our assessment of tenant credit risk changes indicating that expected future straight-line rent may not be realized. Depending on circumstances, we may provide a reserve against the previously recognized straight-line rent receivable asset for a portion, up to its full value, that we estimate may not be received. The balance of straight-line rent receivable at December 31, 2015 and 2014, net of allowances was $17.4 million and $15.8 million, respectively. To the extent any of the tenants under these leases become unable to pay their contractual cash rents, we may be required to write down the straight-line rent receivable from those tenants, which would reduce our operating income.
F-10
Real Estate
Real estate assets that we own directly are stated at cost less accumulated depreciation. Depreciation is computed using the straight-line method. The estimated useful lives for computing depreciation are generally 10 – 40 years for buildings and improvements and 5 – 30 years for parking lot surfacing and equipment. We capitalize all capital improvement expenditures associated with replacements and improvements to real property that extend its useful life and depreciate them over their estimated useful lives ranging from 15 – 25 years. In addition, we capitalize qualifying tenant leasehold improvements and depreciate them over the lesser of the useful life of the improvements or the term of the related tenant lease. We also capitalize direct internal and external costs of procuring leases and amortize them over the base term of the lease. If a tenant vacates before the expiration of its lease, we charge unamortized leasing costs and undepreciated tenant leasehold improvements of no future value to expense. We charge maintenance and repair costs that do not extend an asset’s life to expense as incurred.
Sale of a real estate asset is recognized when it is determined that the sale has been consummated, the buyer’s initial and continuing investment is adequate, our receivable, if any, is not subject to future subordination, and the buyer has assumed the usual risks and rewards of ownership of the asset. We will classify properties as held for sale when executed purchase and sales agreement contingencies have been satisfied thereby signifying that the sale is guaranteed and legally binding.
We allocate the costs of acquisitions to assets acquired and liabilities assumed based on estimated fair values, replacement costs and appraised values. The purchase price of the acquired property is allocated to land, building, improvements and identifiable intangibles such as in-place leases, above/below market leases, out-of-market assumed mortgages, and gain on purchase, if any. The value allocated to above/below market leases is amortized over the related lease term and included in rental income in our consolidated statements of operations. Should a tenant terminate its lease prior to its stated expiration, all unamortized amounts relating to that lease would be written off.
Real estate also includes costs incurred in the development of new operating properties and the redevelopment of existing operating properties. These properties are carried at cost and no depreciation is recorded on these assets until the commencement of rental revenue or no later than one year from the completion of major construction. These costs include pre-development costs directly identifiable with the specific project, development and construction costs, interest, real estate taxes and insurance. Interest is capitalized on land under development and buildings under construction based on the weighted average rate applicable to our borrowings outstanding during the period and the weighted average balance of qualified assets under development/redevelopment during the period. Indirect project costs associated with development or construction of a real estate project are capitalized until the earlier of one year following substantial completion of construction or when the property becomes available for occupancy.
The capitalized costs associated with development and redevelopment projects are depreciated over the useful life of the improvements. If we determine a development or redevelopment project is no longer probable, we expense all capitalized costs which are not recoverable.
It is our policy to start vertical construction on new development projects only after the project has received entitlements, significant anchor leasing commitments, construction financing and joint venture partner commitments, if appropriate. We are in the entitlement and pre-leasing phases at our development projects.
Accounting for the Impairment of Long-Lived Assets
We review our investment in real estate, including any related intangible assets, for impairment on a property-by-property basis whenever events or changes in circumstances indicate that the carrying value of the property may not be recoverable. These changes in circumstances include, but are not limited to, changes in occupancy, rental rates, tenant sales, net operating income, real estate values and expected holding period. The viability of all projects under construction or development, including those owned by unconsolidated joint ventures, are regularly evaluated under applicable accounting requirements, including requirements relating to abandonment of assets or changes in use. To the extent a project, or individual components of the project, are no longer considered to have value, the related capitalized costs are charged against operations.
Impairment provisions resulting from any event or change in circumstances, including changes in management’s intentions or management’s analysis of varying scenarios, could be material to our consolidated financial statements.
We recognize an impairment of an investment in real estate when the estimated undiscounted cash flow is less than the net carrying value of the property. If it is determined that an investment in real estate is impaired, then the carrying value is reduced to the estimated fair value as determined by cash flow models and discount rates or comparable sales in accordance with our fair value measurement policy.
F-11
In the first quarter 2015, we recorded an impairment provision totaling $2.5 million related to developable land that was subsequently sold in the second quarter of 2015. The adjustment was triggered by an unforeseen increase in development costs and changes in the associated sales price assumptions.
Investments in Real Estate Joint Ventures
We have four equity investments in unconsolidated joint venture entities in which we own 30% or less of the total ownership interest. Because we can influence but not make significant decisions without our partners' approval, these investments are accounted for under the equity method of accounting. We provide leasing, development, asset and property management services to these joint ventures for which we are paid fees. Refer to Note 7 of the notes to the consolidated financial statements for further information regarding our equity investments in unconsolidated joint ventures.
We review our equity investments in unconsolidated entities for impairment on a venture-by-venture basis whenever events or changes in circumstances indicate that the carrying value of the equity investment may not be recoverable. In testing for impairment of these equity investments, we primarily use cash flow models, discount rates, and capitalization rates to estimate the fair value of properties held in joint ventures, and mark the debt of the joint ventures to market. Considerable judgment by management is applied when determining whether an equity investment in an unconsolidated entity is impaired and, if so, the amount of the impairment. Changes to assumptions regarding cash flows, discount rates, or capitalization rates could be material to our consolidated financial statements.
There were no impairment provisions on our equity investments in joint ventures recorded in 2015.
Other Assets, net
Other assets consist primarily of acquired lease intangibles, straight-line rent receivable, deferred leasing costs, deferred financing costs related to our credit facility and prepaid expenses. Other assets also include the fair value of in-place public improvement fee income and real estate tax exemption agreements associated with two properties acquired in 2014. Deferred financing and leasing costs are amortized using the straight-line method over the terms of the respective agreements. Should a tenant terminate its lease, the unamortized portion of the leasing cost is expensed. Unamortized financing costs are expensed when the related agreements are terminated before their scheduled maturity dates. We review our unbilled straight-line rent receivable balance to determine the future collectability of revenue that will not be billed to or collected from tenants due to early lease terminations, lease modifications, bankruptcies and other factors. Our evaluation is based on our assessment of tenant credit risk changes indicating that expected future straight-line rent may not be realized. Depending on circumstances, we may provide a reserve against the previously recognized straight-line rent receivable asset for a portion, up to its full value, that we estimate may not be received.
Cash and Cash Equivalents
We consider all highly liquid investments with an original maturity of three months or less to be cash equivalents. Cash balances in individual banks may exceed the federally insured limit by the Federal Deposit Insurance Corporation (the “FDIC”). As of December 31, 2015, we had $11.2 million in excess of the FDIC insured limit.
Recognition of Share-based Compensation Expense
We grant share-based compensation awards to employees and trustees in the form of restricted common shares and in the past we have granted stock options to employees and trustees. Our share-based award costs are equal to each grant date fair value and are recognized over the service periods of the awards using the graded vesting method. See Note 16 of the notes to the consolidated financial statements for further information regarding our share based compensation.
Income Tax Status
We made an election to qualify, and believe our operating activities permit us to qualify as a REIT for federal income tax purposes. Accordingly, we generally will not be subject to federal income tax, provided that we distribute at least 90% of our taxable income annually to our shareholders and meet other conditions. We are obligated to pay state taxes, generally consisting of franchise or gross receipts taxes in certain states which are not material to our consolidated financial statements.
Certain of our operations, including property and asset management, as well as ownership of certain land parcels, are conducted through taxable REIT subsidiaries, (“TRSs”) which are subject to federal and state income taxes. During the years ended
F-12
December 31, 2015, 2014, and 2013, we sold various properties and land parcels at a gain, resulting in both a federal and state tax liability. See Note 17 of the notes to the consolidated financial statements for further information regarding income taxes.
Variable Interest Entities
Certain entities that do not have sufficient equity at risk for the entity to finance its activities without additional subordinated financial support from other parties or in which equity investors do not have the characteristics of a controlling financial interest qualify as VIEs. VIEs are required to be consolidated by their primary beneficiary. The primary beneficiary of a VIE has both (i) the power to direct the activities that most significantly impact economic performance of the VIE, and (ii) the obligation to absorb losses or the right to receive benefits that could potentially be significant to the VIE.
We have evaluated our investments in joint ventures and determined that the joint ventures do not meet the requirements of a VIE and, therefore, consolidation of these ventures is not required. Accordingly, these investments are accounted for using the equity method.
Noncontrolling Interest in Subsidiaries
There are third parties who have certain noncontrolling interests in the Operating Partnership that are exchangeable for our common shares on a 1:1 basis or cash, at our election. Noncontrolling interest is classified as a separate component of equity outside of the permanent equity section of our consolidated balance sheets. Consolidated net income and comprehensive income includes the noncontrolling interest’s share. The calculation of earnings per share is based on income available to common shareholders.
Segment Information
Our primary business is the ownership, management, redevelopment, development and operation of retail shopping centers. We do not distinguish our primary business or group our operations on a geographical basis for purposes of measuring performance. We review operating and financial data for each property on an individual basis and define an operating segment as an individual property. The individual properties have been aggregated into one reportable segment based upon their similarities with regard to both the nature and economics of the centers, tenants and operational processes, as well as long-term financial performance. No one individual property constitutes more than 10% of our revenue or property operating income and none of our shopping centers are located outside the United States. Accordingly, we have a single reportable segment for disclosure purposes.
2. Recent Accounting Pronouncements
In April 2015, the Financial Accounting Standards Board ("FASB") updated Accounting Standards Codification ("ASC") Topic 835 "Interest" with Accounting Standards Update ("ASU") No. 2015-03, "Interest - Imputation of Interest - Simplifying the Presentation of Debt Issuance Costs." ASU 2015-03 modifies the treatment of debt issuance costs from a deferred charge to a deduction of the carrying value of the financial liability. ASU 2015-03 is effective for periods beginning after December 15, 2015, with early adoption permitted and retrospective application. In August 2015, the FASB issued an amendment to ASU 2015-03 pursuant to an SEC staff announcement which addresses the presentation and subsequent measurement of debt issuance costs associated with line of credit arrangements. We early adopted the provisions of ASU 2015-03 beginning with the period ended December 31, 2015, and have applied the provisions retrospectively. See Note 9 of the notes to the consolidated financial statements for further information related to the adoption this standard.
In February 2015, the FASB updated ASC Topic 810 "Consolidation" with ASU 2015-02, "Amendments to the Consolidation Analysis." ASU 2015-02 affects reporting entities that are required to evaluate whether they should consolidate certain legal entities. ASU 2015-02 modifies the evaluation of whether limited partnerships and similar legal entities are Variable Interest Entities ("VIEs") or voting interest entities, eliminates the presumption that a general partner should consolidate a limited partnership and affects the consolidation analysis of reporting entities that are involved in VIEs, particularly those that have fee arrangements and related party relationships. ASU 2015-02 is effective for annual reporting periods (including interim periods within those periods), beginning after December 15, 2015. Early adoption is permitted. We believe the adoption of this guidance will not have a material effect on our consolidated financial statements.
In May 2014, the FASB issued ASU 2014-09 "Revenue from Contract with Customers" as a new Topic, ASC Topic 606. The objective of ASU 2014-09 is to establish a single comprehensive model for entities to use in accounting for revenue arising from contracts with customers and it will supersede most of the existing revenue recognition guidance, including industry-specific guidance. The core principle is that a company should recognize revenue to depict the transfer of promised goods or services to customers in an amount that reflects the consideration to which the entity expects to be entitled in exchange for those goods or services. In applying the new standard, companies will perform a five-step analysis of transactions to determine when and how revenue is recognized. ASU 2014-09 applies to all contracts with customers except those that are within the scope of other topics
F-13
in the FASB ASC. Adoption shall be applied using either a full retrospective or modified retrospective approach. In July, the FASB issued a one year deferral of the effective date making it effective for annual reporting periods (including interim periods within those periods) beginning after December 15, 2017 while also providing for early adoption, but not before the original effective date of December 15, 2016. We are currently assessing the impact the adoption of this standard may have on our consolidated financial statements.
3. Real Estate
Included in our net real estate are income producing shopping center properties that are recorded at cost less accumulated depreciation and amortization, construction in process and land available for development or sale.
Following is the detail of the construction in progress and land available for development or sale as of December 31, 2015 and 2014:
December 31, | ||||||||
2015 | 2014 | |||||||
(In thousands) | ||||||||
Construction in progress | $ | 20,603 | $ | 25,667 | ||||
Land available for development | 28,503 | 27,167 | ||||||
Land available for sale | 11,060 | 21,821 | ||||||
Total | $ | 60,166 | $ | 74,655 | ||||
Construction in progress represents existing development, redevelopment and tenant build-out projects. When projects are substantially complete and ready for their intended use, balances are transferred to land or building and improvements as appropriate.
Land available for development or sale includes real estate projects where vertical construction has yet to commence, but which have been identified by us and are available for future development when market conditions dictate the demand for a new shopping center. At December 31, 2015, we had three projects under pre-development.
F-14
4. Property Acquisitions and Dispositions
Acquisitions
The following table provides a summary of our acquisitions during 2015 and 2014:
Gross | ||||||||||||||||||
Property Name | Location | GLA | Acreage | Date Acquired | Purchase Price | Debt | ||||||||||||
(In thousands) | (In thousands) | |||||||||||||||||
2015 | ||||||||||||||||||
Millennium Park (1) | Livonia, MI | 273 | N/A | 08/15/15 | $ | 47,000 | $ | — | ||||||||||
Spring Meadows - Kroger Building | Holland, OH | 51 | N/A | 08/06/15 | 4,110 | — | ||||||||||||
Ramco 450 - 6 Income Producing Properties (1) | GA, IL, OH, & MD | 1,126 | N/A | 07/21/15 | 191,090 | 60,048 | ||||||||||||
Jackson Plaza | Jackson, MI | 15 | N/A | 06/22/15 | 5,000 | — | ||||||||||||
West Oaks II - Petco parcel | Novi, MI | 26 | N/A | 06/10/15 | 5,500 | — | ||||||||||||
Total income producing acquisitions | 1,491 | 252,700 | 60,048 | |||||||||||||||
Gaines Marketplace | Gaines Township, MI | N/A | 1.9 | 02/12/15 | 1,000 | $ | — | |||||||||||
Lakeland Park Center | Lakeland, FL | N/A | 1.6 | 01/23/15 | 475 | — | ||||||||||||
Total land acquisitions | 3.5 | 1,475 | — | |||||||||||||||
Total acquisitions | 1,491 | 3.5 | $ | 254,175 | $ | 60,048 | ||||||||||||
2014 | ||||||||||||||||||
Front Range Village | Fort Collins, CO | 459 | N/A | 09/04/14 | $ | 128,250 | $ | — | ||||||||||
Buttermilk Towne Center | Crescent Springs (Cincinnati), KY | 278 | N/A | 08/22/14 | 41,900 | — | ||||||||||||
Woodbury Lakes | Woodbury (Minneapolis), MN | 305 | 2.4 | 07/22/14 | 66,200 | — | ||||||||||||
Bridgewater Falls Shopping Center | Hamilton (Cincinnati), OH | 504 | N/A | 07/10/14 | 85,542 | 58,634 | ||||||||||||
Total income producing acquisitions | 1,546 | 2.4 | 321,892 | 58,634 | ||||||||||||||
The Shoppes at Fox River | Waukesha (Milwaukee), WI | N/A | 9.9 | 09/08/14 | 1,216 | — | ||||||||||||
Total land acquisitions | 9.9 | 1,216 | — | |||||||||||||||
Total acquisitions | 1,546 | 12.3 | $ | 323,108 | $ | 58,634 | ||||||||||||
(1) Acquired from related parties. See note 1 to the fair value of the acquisitions table following.
F-15
The total aggregate fair value of the acquisitions was allocated and is reflected in the following table in accordance with accounting guidance for business combinations. At the time of acquisition, these assets and liabilities were considered Level 2 fair value measurements:
December 31, | |||||||||||
2015 | 2014 | 2013 | |||||||||
(In thousands) | |||||||||||
Land | $ | 50,367 | $ | 55,618 | $ | 122,963 | |||||
Buildings and improvements | 183,651 | 235,322 | 406,743 | ||||||||
Above market leases | 1,014 | 4,775 | 6,977 | ||||||||
Lease origination costs | 32,683 | 23,343 | 50,577 | ||||||||
Other assets | 4,256 | 30,883 | 10,196 | ||||||||
Below market leases | (16,616 | ) | (18,836 | ) | (27,216 | ) | |||||
Premium for above market interest rates on assumed debt | (1,180 | ) | (6,830 | ) | (3,697 | ) | |||||
Capital lease obligation | — | (1,167 | ) | — | |||||||
Total purchase price allocated | 254,175 | 323,108 | 566,543 | ||||||||
Mortgages notes assumed | (60,048 | ) | (58,634 | ) | (158,767 | ) | |||||
RPT's fair value of existing ownership (1) | (41,204 | ) | — | (64,989 | ) | ||||||
Net assets acquired | $ | 152,923 | $ | 264,474 | $ | 342,787 | |||||
(1) We acquired our partner's 80% interest in six properties owned by the Ramco 450 Venture LLC ("Ramco 450") and our partner's 70% interest in Millennium Park owned by the Ramco/Lion Venture LP ("RLV").
Total revenue and net income for the 2015 acquisitions included in our consolidated statement of operations for the year ended ended December 31, 2015 were $11.6 million and $1.4 million, respectively.
Unaudited Proforma Information
If the 2015 Acquisitions had occurred on January 1, 2014, our consolidated revenues and net income for the years ended December 31, 2015 and 2014 would have been as follows:
December 31, | ||||||||
2015 | 2014 | |||||||
Consolidated revenue | $ | 265,524 | $ | 242,354 | ||||
Consolidated net income (loss) available to common shareholders | $ | 59,098 | $ | (7,494 | ) | |||
F-16
Dispositions
Pursuant to the criteria established under ASC Topic 360 we will classify properties as held for sale when executed purchase and sales agreement contingencies have been satisfied thereby signifying that the sale is legally binding. Refer to Note 1 under Real Estate for additional information regarding the classification criteria. As of December 31, 2015, we had one parcel of land classified as held for sale which was sold in January 2016.
The following table provides a summary of our disposition activity during 2015 and 2014. All of the properties disposed of were unencumbered:
Gross | ||||||||||||||||||
Property Name | Location | GLA | Acreage | Date Sold | Sales Price | Gain (loss) on Sale | ||||||||||||
(In thousands) | (In thousands) | |||||||||||||||||
2015 | ||||||||||||||||||
Horizon Village | Suwanee, GA | 97 | N/A | 12/23/15 | $ | 9,300 | $ | 1,268 | ||||||||||
Cocoa Commons | Cocoa, FL | 90 | N/A | 11/19/15 | 12,000 | 2,420 | ||||||||||||
Conyers Crossing | Conyers, GA | 170 | 1.3 | 09/30/15 | 9,750 | 4,536 | ||||||||||||
Total income producing dispositions | 357 | 1.3 | 31,050 | 8,224 | ||||||||||||||
The Towne Center at Aquia - Commercial / Residential Outparcels | Stafford, VA | 35 | 32.8 | 05/29/15 | 13,350 | 495 | ||||||||||||
Taylors Square - Outparcel | Taylors, SC | N/A | 0.6 | 04/22/15 | 250 | (16 | ) | |||||||||||
Gaines Marketplace-Target and Shell Oil Parcels | Gaines Township, MI | N/A | 11.3 | 02/12/15 | 5,150 | 3,196 | ||||||||||||
Total outparcel dispositions | 35 | 44.7 | 18,750 | 3,675 | ||||||||||||||
Gain recognized on sale of joint venture real estate (1) | — | 5,671 | ||||||||||||||||
Total dispositions | 392 | 46.0 | $ | 49,800 | $ | 17,570 | ||||||||||||
2014 | ||||||||||||||||||
Lake Orion Plaza | Lake Orion, MI | 141 | N/A | 11/05/14 | $ | 4,300 | $ | 288 | ||||||||||
Northwest Crossing | Knoxville, TN | 124 | N/A | 10/21/14 | 15,550 | 7,082 | ||||||||||||
Fraser Shopping Center | Fraser, MI | 68 | N/A | 10/17/14 | 3,250 | 186 | ||||||||||||
The Town Center at Aquia - El Gran Charro Outparcel | Stafford, VA | 6 | N/A | 05/28/14 | 1,730 | 123 | ||||||||||||
Naples Town Center | Naples, FL | 135 | N/A | 04/17/14 | 7,150 | 2,343 | ||||||||||||
Total income producing dispositions | 474 | 31,980 | 10,022 | |||||||||||||||
Harvest Junction Land - BioLife Outparcel | Longmont, CO | N/A | 3.0 | 12/5/2014 | 1,568 | 371 | ||||||||||||
Parkway Land - Wendy's Outparcel | Jacksonville, FL | N/A | 1.0 | 8/27/2014 | 900 | 258 | ||||||||||||
Parkway Land - Express Oil Change Outparcel | Jacksonville, FL | N/A | 0.7 | 6/13/2014 | 680 | 215 | ||||||||||||
Hartland Land - Taco Bell Outparcel | Hartland Township, MI | N/A | 0.8 | 5/1/2014 | 650 | (9 | ) | |||||||||||
Total land / outparcel dispositions | 5.5 | 3,798 | 835 | |||||||||||||||
Total dispositions | 474 | 5.5 | $ | 35,778 | $ | 10,857 | ||||||||||||
(1) Represents the net proceeds from a joint venture property sale to a third party in October 2015.
F-17
5. Discontinued Operations
During 2013 and prior to our adoption of ASU 2014-08, certain disposal transactions were considered discontinued operations. A summary of the financial information for the discontinued operations is as follows:
December 31, 2013 | |||||
(In thousands) | |||||
Total revenue | $ | 2,175 | |||
Expenses: | |||||
Recoverable operating expenses and real estate taxes | 570 | ||||
Other non-recoverable property operating expenses | 2 | ||||
Depreciation and amortization | 537 | ||||
Operating income | 1,066 | ||||
Other expense | (95 | ) | |||
Gain on sale of properties | 2,120 | ||||
Income from discontinued operations | $ | 3,091 | |||
6. Impairment Provisions
We established provisions for impairment for the following consolidated assets:
Year Ended December 31, | |||||||||||
2015 | 2014 | 2013 | |||||||||
(In thousands) | |||||||||||
Land available for development or sale (1) | $ | 2,521 | $ | 23,285 | $ | 327 | |||||
Income producing properties marketed for sale | — | 4,580 | 9,342 | ||||||||
Total | $ | 2,521 | $ | 27,865 | $ | 9,669 | |||||
(1) | In the first quarter of 2015, unforeseen increases in development costs and changes in associated sales price assumptions related to land held for development or sale resulted in an impairment provision of $2.5 million. Refer to Note 1 under Accounting for the Impairment of Long-Lived Assets for a discussion of inputs used in determining the fair value of long-lived assets. |
F-18
7. Equity Investments in Unconsolidated Joint Ventures
We have four joint venture agreements whereby we own between 7% and 30% of the equity in the joint venture. We and the joint venture partners have joint approval rights for major decisions, including those regarding property operations. We cannot make significant decisions without our partner’s approval. Accordingly, we account for our interest in the joint ventures using the equity method.
Combined financial information of our unconsolidated joint ventures is summarized as follows:
December 31, | |||||||
Balance Sheets | 2015 | 2014 | |||||
(In thousands) | |||||||
ASSETS | |||||||
Investment in real estate, net | $ | 63,623 | $ | 394,740 | |||
Other assets | 4,230 | 23,102 | |||||
Total Assets | $ | 67,853 | $ | 417,842 | |||
LIABILITIES AND OWNERS' EQUITY | |||||||
Mortgage notes payable | $ | — | $ | 170,194 | |||
Other liabilities | 750 | 7,625 | |||||
Owners' equity | 67,103 | 240,023 | |||||
Total Liabilities and Owners' Equity | $ | 67,853 | $ | 417,842 | |||
RPT's equity investments in unconsolidated joint ventures | $ | 4,325 | $ | 28,733 | |||
December 31, | |||||||||||
Statements of Operations | 2015 | 2014 | 2013 | ||||||||
(In thousands) | |||||||||||
Total revenue | $ | 10,297 | $ | 14,038 | $ | 14,674 | |||||
Total expenses | (7,113 | ) | (10,848 | ) | (11,106 | ) | |||||
Gain on sale of real estate | 9,237 | 740 | — | ||||||||
Gain on extinguishment of debt | — | 529 | — | ||||||||
Income from continuing operations | 12,421 | 4,459 | 3,568 | ||||||||
Discontinued operations (1) | |||||||||||
Gain (loss) on sale of real estate (2) | 3,025 | — | (21,512 | ) | |||||||
Income (loss) from discontinued operations | 857 | (7,477 | ) | 1,157 | |||||||
Income (loss) from discontinued operations | 3,882 | (7,477 | ) | (20,355 | ) | ||||||
Net income (loss) | $ | 16,303 | $ | (3,018 | ) | $ | (16,787 | ) | |||
RPT's share of earnings (loss) from unconsolidated joint ventures | $ | 17,696 | $ | 75 | $ | (4,759 | ) | ||||
(1) | Discontinued operations reflects results of operations for those properties that meet the criteria for discontinued operations under ASU 2014-08. |
(2) | During 2015 Ramco 450 sold all of the properties from the joint venture. Ramco acquired its partners interest in six properties, our joint venture partner acquired our interest in one property and the final property, Chester Springs, was sold to an unrelated third party. The seven properties sold to partners in the venture generated a gain of $65.6 million, our share, $13.1 million, is recognized in the earnings (loss) from unconsolidated joint ventures. Ramco 450 recognized the gain as a distribution to the partners. |
F-19
Dispositions
The following table provides a summary of our unconsolidated joint venture property disposition activity during 2015. There were no dispositions of shopping centers in 2014.
Property Name | Location | GLA | Date Sold | Ownership % | |||||||
2015 | |||||||||||
Ramco 450 Venture LLC | |||||||||||
Chester Springs | Chester, NJ | 223 | 10/08/15 | 20 | % | ||||||
Partners Portfolio - 7 Income Producing Properties | FL, GA, IL, OH, & MD | 1,440 | 07/21/15 | 20 | % | ||||||
1,663 | |||||||||||
Ramco/Lion Venture LP | |||||||||||
Millennium Park | Livonia, MI | 273 | 08/11/15 | 30 | % | ||||||
Village of Oriole Plaza | Delray Beach, FL | 156 | 03/24/15 | 30 | % | ||||||
429 | |||||||||||
Total 2015 unconsolidated joint venture's dispositions | 2,092 | ||||||||||
Joint Venture Management and Other Fee Income
We are engaged by certain of our joint ventures to provide asset management, property management, leasing and investing services for such venture’s respective properties. We receive fees for our services, including property management fees calculated as a percentage of gross revenues received and recognize these fees as the services are rendered.
The following table provides information for our fees earned which are reported in our consolidated statements of operations:
December 31, | |||||||||||
2015 | 2014 | 2013 | |||||||||
(In thousands) | |||||||||||
Management fees | $ | 1,149 | $ | 1,514 | $ | 1,875 | |||||
Leasing fees | 311 | 315 | 390 | ||||||||
Acquisition/disposition fees | 108 | — | — | ||||||||
Construction fees | 185 | 230 | 61 | ||||||||
Total | $ | 1,753 | $ | 2,059 | $ | 2,326 | |||||
F-20
8. Other Assets, Net and Acquired Lease Intangible Assets, Net
Other assets, net consisted of the following:
December 31, | |||||||
2015 | 2014 | ||||||
(In thousands) | |||||||
Deferred leasing costs, net | $ | 35,282 | $ | 33,557 | |||
Deferred financing costs, net | 1,871 | 2,551 | |||||
Acquired development agreements (1) | 22,194 | 23,238 | |||||
Other, net | 2,655 | 2,718 | |||||
Total amortizable other assets | 62,002 | 62,064 | |||||
Straight-line rent receivable, net | 17,366 | 15,805 | |||||
Goodwill | 2,089 | 2,089 | |||||
Cash flow hedge marked-to-market asset | 642 | 537 | |||||
Prepaid and other deferred expenses, net | 5,791 | 7,054 | |||||
Other assets, net | $ | 87,890 | $ | 87,549 | |||
(1) | Represents the fair value of in-place public improvement fee of approximately $16.6 million and real estate tax exemption agreement of approximately $5.6 million associated with two properties acquired in 2014. |
Straight-line rent receivables are recorded net of allowances of $3.5 million and $4.3 million at December 31, 2015 and 2014, respectively.
Acquired lease intangible assets, net consisted of the following:
December 31, | |||||||
2015 | 2014 | ||||||
(In thousands) | |||||||
Lease originations costs | $ | 119,181 | $ | 96,059 | |||
Above market leases | 13,994 | 14,261 | |||||
133,175 | 110,320 | ||||||
Accumulated amortization | (44,356 | ) | (33,275 | ) | |||
Net acquired lease intangibles | $ | 88,819 | $ | 77,045 | |||
Acquired lease intangible assets have a remaining weighted-average amortization period of 4.3 years as of December 31, 2015. These intangible assets are being amortized over the lives of the applicable lease. Amortization of lease origination costs is an increase to amortization expense and amortization of above-market leases is a reduction to minimum rent revenue over the applicable terms of the respective leases. Amortization of the above market lease asset resulted in a reduction of revenue of approximately $3.1 million, $2.7 million, and $2.1 million for the years ended December 31, 2015, 2014, and 2013, respectively.
F-21
Combined, amortizable other assets, net and acquired lease intangibles, net totaled $150.8 million. The following table represents estimated aggregate amortization expense related to those assets as of December 31, 2015:
Year Ending December 31, | |||
(In thousands) | |||
2016 | $ | 27,874 | |
2017 | 20,863 | ||
2018 | 16,452 | ||
2019 | 13,294 | ||
2020 | 10,902 | ||
Thereafter | 61,436 | ||
Total (1) | $ | 150,821 | |
9. Debt
In April 2015, the FASB issued ASU 2015-03, which requires that debt issuance costs related to a recognized debt liability be presented in the balance sheet as a direct deduction from the carrying amount of that debt liability, consistent with debt discounts. We adopted ASU 2015-03 effective December 15, 2015 and appropriately retrospectively applied the guidance to our Notes Payable for all periods presented. Unamortized debt issuance costs of $3.8 million and $4.0 million are included in Notes Payable as of December 31, 2015 and 2014, respectively (previously included in Other assets on our Consolidated Balance Sheets).
The following table summarizes our mortgages and notes payable and capital lease obligation as of December 31, 2015 and 2014:
December 31, | |||||||
2015 | 2014 | ||||||
(In thousands) | |||||||
Senior unsecured notes | $ | 460,000 | $ | 310,000 | |||
Unsecured term loan facilities | 210,000 | 210,000 | |||||
Fixed rate mortgages | 322,457 | 354,714 | |||||
Unsecured revolving credit facility | 60,000 | 10,000 | |||||
Junior subordinated notes | 28,125 | 28,125 | |||||
1,080,582 | 912,839 | ||||||
Unamortized premium | 6,935 | 8,866 | |||||
Unamortized deferred financing costs | (3,806 | ) | (4,047 | ) | |||
$ | 1,083,711 | $ | 917,658 | ||||
Capital lease obligation | $ | 1,108 | $ | 1,828 | |||
Senior unsecured notes and unsecured term loans
We completed the following financing transactions during 2015:
• | In September 2015, we executed a $100.0 million private placement of senior unsecured notes. Series A consists of $50.0 million of notes, ten years term at a fixed interest rate of 4.09%, which funded on September 30, 2015. Series B, $25.0 million, nine years fixed interest rate of 4.05% and Series C, $25.0 million, eleven years fixed interest rate of 4.28%, funded in November 2015; and |
• | In July 2015, we funded the $50.0 million shelf facility related to the private placement of debt completed in May 2014. The notes have ten years term at a fixed interest rate of 4.2%. |
Our $670.0 million of senior unsecured notes and unsecured term loans have interest rates ranging from 2.9% to 4.7% and are due at various maturity dates from September 2018 through November 2026.
F-22
Mortgages
During 2015 we had the following mortgage transactions:
• | In conjunction with our acquisition of the Ramco 450 portfolio, we assumed three mortgage loans with principal balances totaling $60.1 million and an average interest rate of 4.1%. In addition, at closing, two additional mortgage loans were repaid totaling $41.7 million, of which our pro rata share was $11.3 million. We recorded a premium of approximately $1.2 million based upon the fair value of the loans on the date they were assumed. The mortgage premiums are being amortized to interest expense over the remaining life of the loans; and |
• | We repaid mortgage notes secured by certain properties totaling $86.5 million, with an average weighted interest rate of 5.2%. In conjunction with the mortgage repayments we recognized a gain on extinguishment of debt of approximately $1.4 million as a result of the write off of the associated debt premiums. |
In addition, we modified the mortgage secured by the Aquia Town Center Office property. The modification extends the maturity date one year with a fixed rate interest rate of 5.798%. Approximately $1.7 million of existing escrow balances were applied to the principal balance. The modified balance of $12.0 million matures on June 1, 2016 and the loan is interest only.
Our $322.5 million of fixed rate mortgages have interest rates ranging from 2.9% to 7.4% and are due at various maturity dates from June 2016 through June 2026. The fixed rate mortgage notes are secured by mortgages on properties that have an approximate net book value of $403.2 million as of December 31, 2015.
We have no mortgage maturities until June 2016 and it is our intent to repay these mortgages using cash, borrowings under our unsecured line of credit, or other sources of financing.
The mortgage loans encumbering our properties are generally nonrecourse, subject to certain exceptions for which we would be liable for any resulting losses incurred by the lender. These exceptions vary from loan to loan but generally include fraud or a material misrepresentation, misstatement or omission by the borrower, intentional or grossly negligent conduct by the borrower that harms the property or results in a loss to the lender, filing of a bankruptcy petition by the borrower, either directly or indirectly and certain environmental liabilities. In addition, upon the occurrence of certain events, such as fraud or filing of a bankruptcy petition by the borrower, we or our joint ventures would be liable for the entire outstanding balance of the loan, all interest accrued thereon and certain other costs, including penalties and expenses.
We have entered into mortgage loans which are secured by multiple properties and contain cross-collateralization and cross-default provisions. Cross-collateralization provisions allow a lender to foreclose on multiple properties in the event that we default under the loan. Cross-default provisions allow a lender to foreclose on the related property in the event a default is declared under another loan.
Revolving Credit Facility
During 2015 we had net borrowings of $50.0 million on our revolving credit facility and had outstanding letters of credit issued under our revolving credit facility, not reflected in the accompanying consolidated balance sheets, totaling $3.5 million. These letters of credit reduce borrowing availability under our bank facility. As of December 31, 2015, $286.5 million was available to be drawn on our $350.0 million unsecured revolving credit facility subject to our compliance with certain covenants. As of December 31, 2015 the variable interest rate was 1.6%.
The revolving credit and term loan facilities contain financial covenants relating to total leverage, fixed charge coverage ratio, tangible net worth and various other calculations. As of December 31, 2015, we were in compliance with these covenants.
Junior Subordinated Notes
Our junior subordinated notes have a variable rate of LIBOR plus 3.30%. The maturity date is January 2038.
Capital lease
At December 31, 2015 we had a capital ground lease at our Buttermilk Towne Center with the City of Crescent Springs, Kentucky. Additionally, at December 31, 2014 we had a capital ground lease at our Gaines Marketplace shopping center in Gaines Township, Michigan which expired in early 2015. Total amounts expensed as interest relating to these leases were $0.1 million, $0.2 million and $0.3 million for each of the years ended December 31, 2015, 2014, and 2013 respectively.
F-23
The following table presents scheduled principal payments on mortgages and notes payable and capital lease payments as of December 31, 2015:
Year Ending December 31, | Principal Payments | Capital Lease Payments | ||||||
(In thousands) | ||||||||
2016 | $ | 35,845 | $ | 100 | ||||
2017 | 129,096 | 100 | ||||||
2018 (1) | 159,132 | 100 | ||||||
2019 | 5,860 | 100 | ||||||
2020 | 102,269 | 100 | ||||||
Thereafter | 648,380 | 1,200 | ||||||
Subtotal debt | 1,080,582 | 1,700 | ||||||
Unamortized mortgage premium | 6,935 | — | ||||||
Deferred financing costs | (3,806 | ) | — | |||||
Amounts representing interest | — | (592 | ) | |||||
Total | $ | 1,083,711 | $ | 1,108 | ||||
(1) | Scheduled maturities in 2018 include the $60.0 million balance on the unsecured revolving credit facility drawn as of December 31, 2015. |
10. Acquired Lease Intangible Liabilities, Net
Acquired lease intangible liabilities, net were $64.2 million and $54.3 million as of December 31, 2015 and 2014, respectively. The increase was primarily due to the acquisitions that were completed in 2015 and the allocation of a portion of the purchase price to lease intangible liabilities. The lease intangible liability relates to below-market leases and is being accreted over the applicable terms of the acquired leases, which resulted in an increase of revenue of $5.8 million, $4.9 million, and $3.1 million for the years ended December 31, 2015, 2014 and 2013, respectively.
11. Fair Value
We utilize fair value measurements to record fair value adjustments to certain assets and liabilities and to determine fair value disclosures. Derivative instruments (interest rate swaps) are recorded at fair value on a recurring basis. Additionally, we, from time to time, may be required to record other assets at fair value on a nonrecurring basis. As a basis for considering market participant assumptions in fair value measurements, GAAP establishes three fair value levels, based on the markets in which the assets and liabilities are traded and the reliability of the assumptions used to determine fair value. The assessed inputs used in determining any fair value measurement could result in incorrect valuations that could be material to our consolidated financial statements. These levels are:
Level 1 | Valuation is based upon quoted prices for identical instruments traded in active markets. |
Level 2 | Valuation is based upon quoted prices for similar instruments in active markets, quoted prices for identical or similar instruments in markets that are not active, and model-based valuation techniques for which all significant assumptions are observable in the market. |
Level 3 | Valuation is generated from model-based techniques that use at least one significant assumption not observable in the market. These unobservable assumptions reflect estimates of assumptions that market participants would use in pricing the asset or liability. |
The following is a description of valuation methodologies used for our assets and liabilities recorded at fair value.
Derivative Assets and Liabilities
All of our derivative instruments are interest rate swaps for which quoted market prices are not readily available. For those derivatives, we measure fair value on a recurring basis using valuation models that use primarily market observable inputs, such as yield curves. We classify derivative instruments as Level 2. Refer to Note 12 of notes to the consolidated financial statements for additional information on our derivative financial instruments.
F-24
The table below presents the recorded amount of assets and liabilities measured at fair value on a recurring basis as of December 31, 2015 and 2014.
Balance Sheet location | Total Fair Value | Level 1 | Level 2 | Level 3 | ||||||||||||||
2015 | (In thousands) | |||||||||||||||||
Derivative assets - interest rate swaps | Other assets | $ | 642 | $ | — | $ | 642 | $ | — | |||||||||
Derivative liabilities - interest rate swaps | Other liabilities | $ | (2,241 | ) | $ | — | $ | (2,241 | ) | $ | — | |||||||
2014 | ||||||||||||||||||
Derivative assets - interest rate swaps | Other assets | $ | 537 | $ | — | $ | 537 | $ | — | |||||||||
Derivative liabilities - interest rate swaps | Other liabilities | $ | (2,705 | ) | $ | — | $ | (2,705 | ) | $ | — | |||||||
The carrying values of cash and cash equivalents, restricted cash, receivables and accounts payable and accrued liabilities are reasonable estimates of their fair values because of the short maturity of these financial instruments.
We estimated the fair value of our debt based on our incremental borrowing rates for similar types of borrowing arrangements with the same remaining maturity and on the discounted estimated future cash payments to be made for other debt. The discount rates used approximate current lending rates for loans or groups of loans with similar maturities and credit quality, assumes the debt is outstanding through maturity and considers the debt’s collateral (if applicable). Since such amounts are estimates that are based on limited available market information for similar transactions, there can be no assurance that the disclosed value of any financial instrument could be realized by immediate settlement of the instrument. Fixed rate debt (including variable rate debt swapped to fixed through derivatives) with carrying values of $996.3 million and $880.3 million as of December 31, 2015 and 2014, respectively, have fair values of approximately $1.0 billion and $900.9 million, respectively. Variable rate debt’s fair value is estimated to be the carrying values of $87.4 million and $37.4 million as of December 31, 2015 and 2014, respectively. We classify our debt as Level 2.
Net Real Estate
Our net real estate, including any identifiable intangible assets, is subject to impairment testing on a nonrecurring basis. To estimate fair value, we use discounted cash flow models that include assumptions of the discount rates that market participants would use in pricing the asset. To the extent impairment has occurred, we charge to expense the excess of the carrying value of the property over its estimated fair value. We classify impaired real estate assets as nonrecurring Level 3.
The table below presents the recorded amount of assets at the time they were marked to fair value during the years ended December 31, 2015 and 2014 on a nonrecurring basis. We did not have any material liabilities that were required to be measured at fair value on a nonrecurring basis during the years ended December 31, 2015 and 2014.
Assets | Total Fair Value | Level 1 | Level 2 | Level 3 | Total Impairment | ||||||||||||||
(In thousands) | |||||||||||||||||||
2015 | |||||||||||||||||||
Land available for sale | $ | 453 | $ | — | $ | — | $ | 453 | $ | (2,521 | ) | ||||||||
Total | $ | 453 | $ | — | $ | — | $ | 453 | $ | (2,521 | ) | ||||||||
2014 | |||||||||||||||||||
Income producing properties | $ | 28,754 | $ | — | $ | — | $ | 28,754 | $ | (4,580 | ) | ||||||||
Land available for sale | 13,972 | — | — | 13,972 | (23,285 | ) | |||||||||||||
Total | $ | 42,726 | $ | — | $ | — | $ | 42,726 | $ | (27,865 | ) | ||||||||
Equity Investments in Unconsolidated Entities
Our equity investments in unconsolidated joint venture entities are subject to impairment testing on a nonrecurring basis if a decline in the fair value of the investment below the carrying amount is determined to be a decline that is other-than-temporary. To estimate the fair value of properties held by unconsolidated entities, we use cash flow models, discount rates, and capitalization rates based upon assumptions of the rates that market participants would use in pricing the asset. To the extent other-than-temporary impairment
F-25
has occurred, we charge to expense the excess of the carrying value of the equity investment over its estimated fair value. We classify other-than-temporarily impaired equity investments in unconsolidated entities as nonrecurring Level 3.
12. Derivative Financial Instruments
We utilize interest rate swap agreements for risk management purposes to reduce the impact of changes in interest rates on our variable rate debt. We may also enter into forward starting swaps to set the effective interest rate on planned fixed rate financing. On the date we enter into an interest rate swap, the derivative is designated as a hedge against the variability of cash flows that are to be paid in connection with a recognized liability. Subsequent changes in the fair value of a derivative designated as a cash flow hedge that is determined to be highly effective are recorded in other comprehensive income (“OCI”) until earnings are affected by the variability of cash flows of the hedged transaction. The differential between fixed and variable rates to be paid or received is accrued, as interest rates change, and recognized currently as interest expense in our consolidated statements of operations. We assess effectiveness of our cash flow hedges both at inception and on an ongoing basis. Our cash flow hedges become ineffective if critical terms of the hedging instrument and the debt do not perfectly match such as notional amounts, settlement dates, reset dates, calculation period and LIBOR rate. At December 31, 2015, all of our hedges were highly effective.
At December 31, 2015, we had seven interest rate swap agreements in effect for an aggregate notional amount of $210.0 million. Additionally, in October 2015, we entered into three forward starting interest rate swap agreements for an aggregate notional amount of $75.0 million. All of our interest rate swap agreements are designated as cash flow hedges The agreements provide for swapping one-month LIBOR interest rates ranging from 1.2% to 2.2% on $210.0 million of unsecured term loans, and have expirations ranging from April 2016 to May 2021.
The following table summarizes the notional values and fair values of our derivative financial instruments as of December 31, 2015:
Underlying Debt | Hedge Type | Notional Value | Fixed Rate | Fair Value | Expiration Date | ||||||||||
(In thousands) | (In thousands) | ||||||||||||||
Derivative Assets | |||||||||||||||
Unsecured term loan facility | Cash Flow | $ | 20,000 | 1.4980 | % | $ | 151 | 05/2021 | |||||||
Unsecured term loan facility | Cash Flow | 15,000 | 1.4900 | % | 128 | 05/2021 | |||||||||
Unsecured term loan facility | Cash Flow | 40,000 | 1.4800 | % | 363 | 05/2021 | |||||||||
$ | 75,000 | $ | 642 | ||||||||||||
Derivative Liabilities | |||||||||||||||
Unsecured term loan facility | Cash Flow | $ | 75,000 | 1.2175 | % | $ | (180 | ) | 04/2016 | ||||||
Unsecured term loan facility | Cash Flow | 30,000 | 2.0480 | % | (729 | ) | 10/2018 | ||||||||
Unsecured term loan facility | Cash Flow | 25,000 | 1.8500 | % | (472 | ) | 10/2018 | ||||||||
Unsecured term loan facility | Cash Flow | 5,000 | 1.8400 | % | (93 | ) | 10/2018 | ||||||||
Unsecured term loan facility | Cash Flow | 15,000 | 2.1500 | % | (451 | ) | 05/2020 | ||||||||
Unsecured term loan facility | Cash Flow | 10,000 | 2.1500 | % | (301 | ) | 05/2020 | ||||||||
Unsecured term loan facility | Cash Flow | 50,000 | 1.4600 | % | (15 | ) | 05/2020 | ||||||||
$ | 210,000 | $ | (2,241 | ) | |||||||||||
F-26
The effect of derivative financial instruments on our consolidated statements of operations for the year ended December 31, 2015 and 2014 is summarized as follows:
Amount of Gain (Loss) Recognized in OCI on Derivative (Effective Portion) | Location of Loss Reclassified from Accumulated OCI | Amount of Loss Reclassified from Accumulated OCI into Income (Effective Portion) | ||||||||||||||||
Derivatives in Cash Flow Hedging Relationship | Year Ended December 31, | into Income | Year Ended December 31, | |||||||||||||||
2015 | 2014 | (Effective Portion) | 2015 | 2014 | ||||||||||||||
(In thousands) | (In thousands) | |||||||||||||||||
Interest rate contracts - assets | $ | 1,008 | $ | (1,046 | ) | Interest Expense | $ | (902 | ) | $ | (661 | ) | ||||||
Interest rate contracts - liabilities | 2,589 | 1,996 | Interest Expense | (2,125 | ) | (2,404 | ) | |||||||||||
Total | $ | 3,597 | $ | 950 | Total | $ | (3,027 | ) | $ | (3,065 | ) | |||||||
13. Leases
Revenues
Approximate future minimum revenues from rentals under non-cancelable operating leases in effect at December 31, 2015, assuming no new or renegotiated leases or option extensions on lease agreements and no early lease terminations were as follows:
Year Ending December 31, | |||
(In thousands) | |||
2016 | $ | 186,111 | |
2017 | 168,127 | ||
2018 | 149,005 | ||
2019 | 127,677 | ||
2020 | 109,863 | ||
Thereafter | 394,388 | ||
Total | $ | 1,135,171 | |
Expenses
We have an operating lease for our corporate headquarters in Michigan for a term expiring in 2019. We recognized rent expense of $0.6 million for the year ended December 31, 2015. For the years ended December 31, 2014 and 2013 we recognized $0.6 million and $0.7 million, respectively. Previous years expense included an operating lease adjacent to a former shopping center. The associated outparcel and operating lease were sold in early 2015.
Approximate future rental payments under our non-cancelable leases, assuming no option extensions are as follows:
Year Ending December 31, | |||
(In thousands) | |||
2016 | $ | 620 | |
2017 | 629 | ||
2018 | 638 | ||
2019 | 429 | ||
2020 | — | ||
Thereafter | — | ||
Total | $ | 2,316 | |
F-27
14. Earnings per Common Share
The following table sets forth the computation of basic earnings per share (“EPS”):
Year Ended December 31, | |||||||||||
2015 | 2014 | 2013 | |||||||||
(In thousands, except per share data) | |||||||||||
Income (loss) from continuing operations | $ | 66,895 | $ | (2,412 | ) | $ | 8,371 | ||||
Net (income) loss from continuing operations attributable to noncontrolling interest | (1,786 | ) | 48 | (355 | ) | ||||||
Preferred share dividends and conversion costs | (7,338 | ) | (7,250 | ) | (7,250 | ) | |||||
Allocation of continuing income to restricted share awards | (336 | ) | (180 | ) | (102 | ) | |||||
Income (loss) from continuing operations attributable to RPT | $ | 57,435 | $ | (9,794 | ) | $ | 664 | ||||
Income from discontinued operations | — | — | 3,091 | ||||||||
Net income from discontinued operations attributable to noncontrolling interest | — | — | (110 | ) | |||||||
Allocation of discontinued income to restricted share awards | — | — | (20 | ) | |||||||
Income from discontinued operations attributable to RPT | — | — | 2,961 | ||||||||
Net income (loss) available to common shareholders | $ | 57,435 | $ | (9,794 | ) | $ | 3,625 | ||||
Weighted average shares outstanding, Basic | 78,848 | 72,118 | 59,336 | ||||||||
Earnings (loss) per common share, Basic | |||||||||||
Continuing operations | $ | 0.73 | $ | (0.14 | ) | $ | 0.01 | ||||
Discontinued operations | — | — | 0.05 | ||||||||
$ | 0.73 | $ | (0.14 | ) | $ | 0.06 | |||||
The following table sets forth the computation of diluted EPS:
Year Ended December 31, | |||||||||||
2015 | 2014 | 2013 | |||||||||
(In thousands, except per share data) | |||||||||||
Income (loss) from continuing operations | $ | 66,895 | $ | (2,412 | ) | $ | 8,371 | ||||
Net (income) loss from continuing operations attributable to noncontrolling interest | (1,786 | ) | 48 | (355 | ) | ||||||
Preferred share dividends and conversion costs | (7,338 | ) | (7,250 | ) | (7,250 | ) | |||||
Allocation of continuing income to restricted share awards | (336 | ) | (180 | ) | (102 | ) | |||||
Income (loss) from continuing operations attributable to RPT | $ | 57,435 | $ | (9,794 | ) | $ | 664 | ||||
Income from discontinued operations | — | — | 3,091 | ||||||||
Net income from discontinued operations attributable to noncontrolling interest | — | — | (110 | ) | |||||||
Income from discontinued operations attributable to RPT | — | — | 2,981 | ||||||||
Net income (loss) available to common shareholders | $ | 57,435 | $ | (9,794 | ) | $ | 3,645 | ||||
Weighted average shares outstanding, Basic | 78,848 | 72,118 | 59,336 | ||||||||
Stock options and restricted share awards using the treasury method (1) | 187 | — | 392 | ||||||||
Weighted average shares outstanding, Diluted (2)(3) | 79,035 | 72,118 | 59,728 | ||||||||
Earnings (loss) per common share, Diluted | |||||||||||
Continuing operations | $ | 0.73 | $ | (0.14 | ) | $ | 0.01 | ||||
Discontinued operations | — | — | 0.05 | ||||||||
$ | 0.73 | $ | (0.14 | ) | $ | 0.06 | |||||
(1) | For the year ended December 31, 2014 stock options and restricted stock awards are anti-dilutive and accordingly, have been excluded from the weighted average common shares used to compute diluted EPS. |
(2) | The assumed conversion of preferred shares are anti-dilutive for all periods presented and accordingly, have been excluded from the weighted average common shares used to compute diluted EPS. |
(3) | The effect of the conversion of Common OP Units is not reflected in the computation of basic and diluted earnings per share, as they are exchangeable for Common Shares on a one-for-one basis. The income allocable to such units is allocated on this same basis and reflected as noncontrolling interests in the accompanying consolidated financial statements. As such, the assumed conversion of these units would have no net impact on the determination of diluted earnings per share. |
F-28
15. Shareholders’ Equity
Underwritten public offerings
In 2015 we did not complete any underwritten public offerings.
In August 2014 we completed an underwritten public offering of 6.9 million newly issued common shares of beneficial interest at $16.44 per share which included 0.9 million common shares sold in connection with the full exercise of the underwriters' option to purchase additional shares. Our total net proceeds, after deducting expenses, were approximately $108.7 million.
Controlled equity offerings
In 2015, through our controlled equity offering we issued 0.9 million common shares, at an average price of $19.28, and received approximately $17.1 million in net proceeds, after sales commissions and fees of $0.3 million.
In 2014, through our controlled equity offering we issued 3.8 million common shares, at an average share price of $16.50, and received approximately $61.7 million in net proceeds, after sales commissions and fees of $0.9 million.
Our controlled equity offerings were issued under a registration statement filed in 2013 whereby we may sell up to 8.0 million common shares of beneficial interest. As of December 31, 2015 we had 3.1 million shares available for issuance.
Non-Controlling Interests
As of December 31 2015 we had 2,001,461 OP Units outstanding. OP Unit holders are entitled to exchange their units for our common shares on a 1:1 basis or for cash. The form of payment is at our election. During 2015, 245,734 units were converted for cash in the amount of $3.8 million.
Preferred Shares
As of December 31, 2015 we had 1,848,539 shares of 7.25% Series D Cumulative Convertible Preferred Shares (“Preferred Shares”) outstanding that have a liquidation preference of $50 per share and par value $0.01 per share. The Preferred Shares are convertible at any time by the holders to our common shares at a conversion rate of $14.10 per share. The conversion rate is adjusted quarterly. The Preferred Shares are also convertible under certain circumstances at our election. The holders of the Preferred Shares have no voting rights.
In April 2015, we converted Preferred Shares with a liquidation preference of $7.6 million into 532,628 common shares pursuant to the terms of the Convertible Preferred Shares prospectus supplement dated April 27, 2011 and incurred conversion costs of approximately $0.5 million.
The following table provides a summary of dividends declared and paid per share:
Year Ended December 31, | |||||||||||||||||||||||
2015 | 2014 | 2013 | |||||||||||||||||||||
Declared | Paid | Declared | Paid | Declared | Paid | ||||||||||||||||||
Common shares | $ | 0.820 | $ | 0.810 | $ | 0.7750 | $ | 0.7625 | $ | 0.7115 | $ | 0.6923 | |||||||||||
Preferred shares | $ | 3.625 | $ | 3.625 | $ | 3.625 | $ | 3.625 | $ | 3.625 | $ | 3.625 | |||||||||||
Dividend reinvestment plan
We have a dividend reinvestment plan that allows for participating shareholders to have their dividend distributions automatically invested in additional shares of beneficial interest based on the average price of the shares acquired for the distribution.
F-29
16. Share-Based Compensation and Other Benefit Plans
Incentive and Stock Option Plans
As of December 31, 2015 we have one share-based compensation plan in effect, the 2012 Omnibus Long-Term Incentive Plan (“2012 LTIP”). Under the plan our compensation committee may grant, subject to the Company’s performance conditions as specified by the compensation committee, restricted shares, restricted share units, options and other awards for up to 2 million of our common shares, units or stock options, of which 1.6 million is available for issuance as of December 31, 2015.
The following share-based compensation plans have been terminated, except with respect to awards outstanding under each plan:
• | The 2009 Omnibus Long-Term Incentive Plan ("2009 LTIP") which allowed for the grant of restricted shares, restricted share units, options and other awards to trustees, officers and other key employees; |
• | The 2008 Restricted Share Plan for Non-Employee Trustees (the "Trustees' Plan") which allowed for the grant of restricted shares to non-employee trustees of the Company; |
• | 2003 LTIP which allowed for the grant of stock options to our executive officers and employees. As of December 31, 2015, there were 87,165 options exercisable; and |
• | 2003 Non-Employee Trustee Stock Option Plan – this plan provided for the annual grant of options to purchase our shares to our non-employee trustees. As of December 31, 2015, there were 20,000 options exercisable. |
We recognized total share-based compensation expense of $1.6 million, $4.6 million, and $3.6 million for 2015, 2014, and 2013, respectively.
Restricted Stock Share-Based Compensation
Beginning in 2012 the compensation committee determined that the LTIP award would consist of 50% service based restricted shares and 50% performance-based cash awards. The service-based restricted share awards include a five year vesting period and the compensation expense is recognized on a graded vesting basis. We recognized expense related to restricted share grants of $1.9 million for the year ended December 31, 2015 and $2.1 million for each of the years ended December 31, 2014 and 2013.
The performance shares are earned subject to a future performance measurement based on a three-year shareholder return peer comparison (the “TSR Grants”). If the performance criterion is met the actual value of the grant earned will be determined and 50% of the award will be paid in cash immediately while the balance will be paid in cash the following year.
Pursuant to ASC 718 – Stock Compensation, we determine the grant date fair value of TSR Grants, and any subsequent re-measurements, based upon a Monte Carlo simulation model. We recognize the compensation expense ratably over the requisite service period and we are required to re-value the performance cash awards at the end of each quarter. We use the same methodology as was used at the initial grant date and adjust the compensation expense accordingly. If it is determined that the performance criteria will not be met, compensation expense previously recognized would be reversed. We recognized a compensation benefit of $0.4 million during the year ended December 31, 2015 due to the change in value of the plans and expense reversal related to our former Chief Financial Officer. Compensation expense of $2.5 million and $1.5 million related to the cash awards recorded during the years ended December 31, 2014 and 2013, respectively.
A summary of the activity of service based restricted shares under the LTIP for the years ended December 31, 2015, 2014 and 2013 is presented below:
2015 | 2014 | 2013 | ||||||||||||||||||
Number of Shares | Weighted- Average Grant Date Fair Value | Number of Shares | Weighted- Average Grant Date Fair Value | Number of Shares | Weighted- Average Grant Date Fair Value | |||||||||||||||
Outstanding, beginning of the year | 365,524 | $ | 14.92 | 375,813 | $ | 13.71 | 286,306 | $ | 11.83 | |||||||||||
Granted | 180,914 | 17.77 | 286,954 | 16.70 | 293,732 | 15.68 | ||||||||||||||
Vested | (176,816 | ) | 14.29 | (281,851 | ) | 12.69 | (197,014 | ) | 10.07 | |||||||||||
Forfeited or expired | (41,890 | ) | 16.17 | (15,392 | ) | 14.69 | (7,211 | ) | 13.38 | |||||||||||
Outstanding, end of the year | 327,732 | 16.39 | 365,524 | 14.92 | 375,813 | 13.71 | ||||||||||||||
F-30
As of December 31, 2015 there was approximately $4.1 million of total unrecognized compensation cost related to non-vested restricted share awards granted under our various share-based plans that we expect to recognize over a weighted average period of 4.5 years.
Stock Option Share-Based Compensation
When we grant options, the fair value of each option granted, used in determining the share-based compensation expense, is estimated on the date of grant using the Black-Scholes option-pricing model. This model incorporates certain assumptions for inputs including risk-free rates, expected dividend yield of the underlying common shares, expected option life and expected volatility.
No options were granted under the LTIP in the years ended December 31, 2015, 2014 and 2013.
The following table reflects the stock option activity for all plans described above:
2015 | 2014 | 2013 | ||||||||||||||||||
Shares Under Option | Weighted-Average Exercise Price | Shares Under Option | Weighted-Average Exercise Price | Shares Under Option | Weighted-Average Exercise Price | |||||||||||||||
Outstanding, beginning of the year | 155,248 | $ | 30.94 | 190,993 | $ | 30.34 | 227,743 | $ | 27.81 | |||||||||||
Exercised | — | — | — | — | (25,000 | ) | 9.61 | |||||||||||||
Forfeited or expired | (48,083 | ) | 28.29 | (35,745 | ) | 27.73 | (11,750 | ) | 25.34 | |||||||||||
Outstanding, end of the year | 107,165 | $ | 32.13 | 155,248 | $ | 30.94 | 190,993 | $ | 30.34 | |||||||||||
Exercisable, end of the year | 107,165 | $ | 32.13 | 155,248 | $ | 30.94 | 190,993 | $ | 30.34 | |||||||||||
The following table summarizes information about options outstanding at December 31, 2015:
Options Outstanding | Options Exercisable | ||||||||||||||
Range of Exercise Price | Outstanding | Weighted-Average Remaining Contractual Life | Weighted-Average Exercise Price | Exercisable | Weighted-Average Exercise Price | ||||||||||
$23.77 - $27.96 | 10,000 | 0.5 | $ | 26.68 | 10,000 | $ | 26.68 | ||||||||
$28.80 - $29.06 | 34,025 | 0.2 | 29.06 | 34,025 | 29.06 | ||||||||||
$34.30 - $36.50 | 63,140 | 1.2 | 34.65 | 63,140 | 34.65 | ||||||||||
107,165 | 0.8 | $ | 32.13 | 107,165 | $ | 32.13 | |||||||||
We received cash of approximately $0.2 million from options exercised during the year ended December 31, 2013. The impact of the cash receipt is included in financing activities in the accompanying consolidated statements of cash flows.
17. Taxes
Income Taxes
We conduct our operations with the intent of meeting the requirements applicable to a REIT under sections 856 through 860 of the Internal Revenue Code. In order to maintain our qualification as a REIT, we are required to distribute annually at least 90% of our REIT taxable income, excluding net capital gain, to our shareholders. As long as we qualify as a REIT, we will generally not be liable for federal corporate income taxes.
Certain of our operations, including property management and asset management, as well as ownership of certain land, are conducted through our TRSs which allows us to provide certain services and conduct certain activities that are not generally considered as qualifying REIT activities.
F-31
Deferred tax assets and liabilities reflect the impact of temporary differences between the amounts of assets and liabilities for financial reporting purposes and the bases of such assets and liabilities as measured by tax laws. Deferred tax assets are reduced by a valuation allowance to the amount where realization is more likely than not assured after considering all available evidence, including expected taxable earnings and potential tax planning strategies. Our temporary differences primarily relate to deferred compensation, depreciation, impairment charges and net operating loss carryforwards.
As of December 31, 2015, we had a federal and state deferred tax asset of $10.7 million and a valuation allowance of $10.7 million, which represents a decrease of $0.2 million from December 31, 2014. Our deferred tax assets, such as net operating losses and land basis differences, are reduced by an offsetting valuation allowance where there is uncertainty regarding their realizability. We believe that it is more likely than not that the results of future operations will not generate sufficient taxable income to recognize the deferred tax assets. These future operations are primarily dependent upon the profitability of our TRSs, the timing and amounts of gains on land sales, and other factors affecting the results of operations of the TRSs.
If in the future we are able to conclude it is more likely than not that we will realize a future benefit from a deferred tax asset, we will reduce the related valuation allowance by the appropriate amount. The first time this occurs, it will result in a net deferred tax asset on our balance sheet and an income tax benefit of equal magnitude in our statement of operations in the period we made the determination.
During the years ended December 31, 2015 and 2014, we recorded an income tax provision of approximately $339,000 and $54,000, respectively.
We had no unrecognized tax benefits as of or during the three year period ended December 31, 2015. We expect no significant increases or decreases in unrecognized tax benefits due to changes in tax positions within one year of December 31, 2015. No material interest or penalties relating to income taxes were recognized in the statement of operations for the years ended December 31, 2015, 2014, and 2013 or in the consolidated balance sheets as of December 31, 2015, 2014, and 2013. It is our accounting policy to classify interest and penalties relating to unrecognized tax benefits as tax expense. As of December 31, 2015, returns for the calendar years 2012 through 2015 remain subject to examination by the Internal Revenue Service (“IRS”) and various state and local tax jurisdictions. As of December 31, 2015, certain returns for calendar year 2011 also remain subject to examination by various state and local tax jurisdictions.
Sales Tax
We collect various taxes from tenants and remit these amounts, on a net basis, to the applicable taxing authorities.
18. Commitments and Contingencies
Construction Costs
In connection with the development and expansion of various shopping centers as of December 31, 2015, we had entered into agreements for construction costs of approximately $10.6 million.
Litigation
We are currently involved in certain litigation arising in the ordinary course of business.
Environmental Matters
We are subject to numerous federal, state and local environmental laws, ordinances and regulations in the areas where we own or operate properties. We are not aware of any contamination which may have been caused by us or any of our tenants that would have a material effect on our consolidated financial statements.
As part of our risk management activities, we have applied and been accepted into state sponsored environmental programs which will expedite and assure satisfactory compliance with environmental laws and regulations should contaminants need to be remediated. We also have an environmental insurance policy that covers us against third party liabilities and remediation costs.
While we believe that we do not have any material exposure to environmental remediation costs, we cannot give absolute assurance that changes in the law or new discoveries of contamination will not result in additional liabilities to us.
F-32
19. Subsequent Events
We have evaluated subsequent events through the date that the consolidated financial statements were issued.
In February 2016 we completed the sale of a shopping center located in Troy, Ohio receiving net proceeds in the amount of $12.0 million.
20. Selected Quarterly Financial Data (Unaudited)
The following table sets forth summarized quarterly financial data for the year ended December 31, 2015:
Quarters Ended 2015 | |||||||||||||||
March 31 | June 30 | September 30 | December 31 | ||||||||||||
(In thousands, except per share amounts) | |||||||||||||||
Total revenue | $ | 59,417 | $ | 59,735 | $ | 64,060 | $ | 68,578 | |||||||
Operating income | $ | 14,631 | $ | 15,910 | $ | 18,854 | $ | 16,102 | |||||||
Net income attributable to RPT | $ | 9,667 | $ | 7,090 | $ | 33,666 | $ | 14,686 | |||||||
Net income available to common shareholders | $ | 7,855 | $ | 4,915 | $ | 31,991 | $ | 13,010 | |||||||
Earnings per common share, basic: (1) | $ | 0.10 | $ | 0.06 | $ | 0.39 | $ | 0.16 | |||||||
Earnings per common share, diluted:(1) | $ | 0.10 | $ | 0.06 | $ | 0.38 | $ | 0.16 | |||||||
(1) | EPS amounts are based on weighted average common shares outstanding during the quarter and, therefore, may not agree with the EPS calculated for the year ended December 31, 2015. |
The following table sets forth summarized quarterly financial data for the year ended December 31, 2014:
Quarters Ended 2014 | |||||||||||||||
March 31 (1) | June 30 (1) | September 30 (1) | December 31 (1) | ||||||||||||
(In thousands, except per share amounts) | |||||||||||||||
Total revenue | $ | 50,133 | $ | 49,930 | $ | 55,143 | $ | 63,157 | |||||||
Operating income (loss) | $ | 12,403 | $ | 6,732 | $ | 14,782 | $ | (10,587 | ) | ||||||
Net income (loss) attributable to RPT | $ | 2,672 | $ | 1,086 | $ | 6,083 | $ | (12,205 | ) | ||||||
Net income (loss) available to common shareholders | $ | 860 | $ | (727 | ) | $ | 4,270 | $ | (14,017 | ) | |||||
Earnings (loss) per common share, basic: (1) | $ | 0.01 | $ | (0.01 | ) | $ | 0.06 | $ | (0.18 | ) | |||||
Earnings (loss) per common share, diluted:(1) | $ | 0.01 | $ | (0.01 | ) | $ | 0.06 | $ | (0.18 | ) | |||||
(1) | EPS amounts are based on weighted average common shares outstanding during the quarter and, therefore, may not agree with the EPS calculated for the year ended December 31, 2014. |
F-33
RAMCO-GERSHENSON PROPERTIES TRUST
SCHEDULE III
SUMMARY OF REAL ESTATE AND ACCUMULATED DEPRECIATION
December 31, 2015
(in thousands of dollars)
INITIAL COST TO COMPANY | Capitalized Subsequent to Acquisition or Improvements, Net of Impairments | GROSS AMOUNTS AT WHICH CARRIED AT CLOSE OF PERIOD | |||||||||||||||||||||||||||||||||||
Property | Location | Encumbrances | Land | Building & Improvements | Land | Building & Improvements | Total | Accumulated Depreciation | Date Constructed | Date Acquired | |||||||||||||||||||||||||||
Auburn Mile | MI | $ | — | $ | 15,704 | $ | — | $ | (7,110 | ) | $ | 5,917 | $ | 2,677 | $ | 8,594 | $ | 2,323 | 2000 | 1999 | |||||||||||||||||
Bridgewater Falls | OH | 57,428 | 9,831 | 76,446 | 209 | 9,831 | 76,655 | 86,486 | 4,382 | 2005/2007 | 2014 | ||||||||||||||||||||||||||
Buttermilk Towne Center | KY | — | 13,249 | 21,103 | 11 | 13,249 | 21,114 | 34,363 | 1,212 | 2005 | 2014 | ||||||||||||||||||||||||||
Central Plaza | MO | — | 10,250 | 10,909 | 153 | 10,250 | 11,062 | 21,312 | 1,460 | 1970 | 2012 | ||||||||||||||||||||||||||
Centre at Woodstock | GA | — | 1,880 | 10,801 | (46 | ) | 1,987 | 10,648 | 12,635 | 3,010 | 1997 | 2004 | |||||||||||||||||||||||||
Clinton Pointe | MI | — | 1,175 | 10,499 | 541 | 1,175 | 11,040 | 12,215 | 3,443 | 1992 | 2003 | ||||||||||||||||||||||||||
Clinton Valley | MI | — | 1,500 | 13,498 | 11,455 | 1,625 | 24,828 | 26,453 | 10,230 | 1977/1985 | 1996 | ||||||||||||||||||||||||||
Coral Creek Shops | FL | — | 1,565 | 14,085 | 977 | 1,572 | 15,055 | 16,627 | 5,034 | 1992 | 2002 | ||||||||||||||||||||||||||
Crofton Centre | MD | 16,143 | 8,012 | 22,774 | 335 | 8,012 | 23,109 | 31,121 | 353 | 1974 | 2015 | ||||||||||||||||||||||||||
Crossroads Centre | OH | 3,536 | 5,800 | 20,709 | 3,047 | 4,904 | 24,652 | 29,556 | 10,279 | 2001 | 2001 | ||||||||||||||||||||||||||
Cypress Point | FL | — | 2,968 | 17,637 | 699 | 2,968 | 18,336 | 21,304 | 1,612 | 1983 | 2013 | ||||||||||||||||||||||||||
Deer Creek Shopping Center | MO | — | 6,070 | 18,105 | 116 | 6,070 | 18,221 | 24,291 | 1,445 | 1970's/2013 | 2013 | ||||||||||||||||||||||||||
Deer Grove Centre | IL | — | 8,408 | 8,197 | 4,178 | 8,408 | 12,375 | 20,783 | 977 | 1997 | 2013 | ||||||||||||||||||||||||||
Deerfield Towne Center | OH | — | 6,868 | 78,551 | 749 | 6,868 | 79,300 | 86,168 | 6,225 | 2004/2007 | 2013 | ||||||||||||||||||||||||||
East Town Plaza | WI | — | 1,768 | 16,216 | 3,022 | 1,768 | 19,238 | 21,006 | 6,938 | 1992 | 2000 | ||||||||||||||||||||||||||
Fairlane Meadows | MI | — | 3,255 | 17,620 | 5,093 | 3,260 | 22,708 | 25,968 | 6,499 | 1987/2007 | 2003/2005 | ||||||||||||||||||||||||||
Front Range Village | CO | — | 20,910 | 80,600 | 661 | 20,910 | 81,261 | 102,171 | 3,771 | 2008 | 2014 | ||||||||||||||||||||||||||
Gaines Marketplace | MI | — | 226 | 6,782 | 3,488 | 2,926 | 7,570 | 10,496 | 2,025 | 2004 | 2004 | ||||||||||||||||||||||||||
Harvest Junction North | CO | — | 8,254 | 25,232 | 5,382 | 7,609 | 31,259 | 38,868 | 2,654 | 2006 | 2012 | ||||||||||||||||||||||||||
Harvest Junction South | CO | — | 6,241 | 22,856 | 223 | 6,241 | 23,079 | 29,320 | 2,508 | 2006 | 2012 | ||||||||||||||||||||||||||
Heritage Place | MO | — | 13,899 | 22,506 | 885 | 13,899 | 23,391 | 37,290 | 3,898 | 1989 | 2011 | ||||||||||||||||||||||||||
Holcomb Center | GA | — | 658 | 5,953 | 9,808 | 658 | 15,761 | 16,419 | 5,973 | 1986 | 1996 | ||||||||||||||||||||||||||
Hoover Eleven | MI | — | 3,308 | 29,778 | 4,475 | 3,304 | 34,257 | 37,561 | 10,410 | 1989 | 2003 | ||||||||||||||||||||||||||
Hunters Square | MI | — | 7,673 | 52,774 | 5,367 | 7,652 | 58,162 | 65,814 | 4,564 | 1988 | 2013 | ||||||||||||||||||||||||||
Jackson Crossing | MI | 23,114 | 3,347 | 24,261 | 17,856 | 3,347 | 42,117 | 45,464 | 15,977 | 1967 | 1996 | ||||||||||||||||||||||||||
Jackson West | MI | — | 2,806 | 6,270 | 6,239 | 2,691 | 12,624 | 15,315 | 5,685 | 1996 | 1996 | ||||||||||||||||||||||||||
Lakeland Park Center | FL | — | 15,365 | — | 34,162 | 15,365 | 34,162 | 49,527 | 1,584 | 2014 | 2008 | ||||||||||||||||||||||||||
Lakeshore Marketplace | MI | — | 2,018 | 18,114 | 5,507 | 3,402 | 22,237 | 25,639 | 6,678 | 1996 | 2003 | ||||||||||||||||||||||||||
Liberty Square | IL | — | 2,670 | 11,862 | (35 | ) | 2,665 | 11,832 | 14,497 | 2,133 | 1987 | 2010 | |||||||||||||||||||||||||
Livonia Plaza | MI | — | 1,317 | 11,786 | 559 | 1,317 | 12,345 | 13,662 | 3,890 | 1988 | 2003 | ||||||||||||||||||||||||||
Marketplace of Delray | FL | — | 7,922 | 18,910 | 1,216 | 7,922 | 20,126 | 28,048 | 2,029 | 1981/2010 | 2013 | ||||||||||||||||||||||||||
Market Plaza | IL | 15,005 | 9,391 | 22,682 | 423 | 9,391 | 23,105 | 32,496 | 365 | 1965/2009 | 2015 | ||||||||||||||||||||||||||
Merchants' Square | IN | — | 4,997 | 18,346 | 3,630 | 4,997 | 21,976 | 26,973 | 4,470 | 1970 | 2010 | ||||||||||||||||||||||||||
Millennium Park | MI | — | 5,886 | 35,420 | 74 | 5,886 | 35,494 | 41,380 | 534 | 2000 | 2015 | ||||||||||||||||||||||||||
F-34
INITIAL COST TO COMPANY | Capitalized Subsequent to Acquisition or Improvements, Net of Impairments | GROSS AMOUNTS AT WHICH CARRIED AT CLOSE OF PERIOD | |||||||||||||||||||||||||||||||||||
Property | Location | Encumbrances | Land | Building & Improvements | Land | Building & Improvements | Total | Accumulated Depreciation | Date Constructed | Date Acquired | |||||||||||||||||||||||||||
Mission Bay | FL | — | 33,975 | 48,159 | 4,246 | 33,975 | 52,405 | 86,380 | 4,471 | 1989 | 2013 | ||||||||||||||||||||||||||
Mount Prospect Plaza | IL | — | 11,633 | 21,767 | 1,151 | 11,633 | 22,918 | 34,551 | 2,174 | 1958/1987/2012 | 2013 | ||||||||||||||||||||||||||
Nagawaukee Shopping Center | WI | 7,926 | 7,549 | 30,898 | 146 | 7,549 | 31,044 | 38,593 | 2,847 | 1994/2004/2008 | 2012/2013 | ||||||||||||||||||||||||||
New Towne Plaza | MI | — | 817 | 7,354 | 5,985 | 817 | 13,339 | 14,156 | 6,638 | 1975 | 1996 | ||||||||||||||||||||||||||
Oak Brook Square | MI | — | 955 | 8,591 | 5,892 | 955 | 14,483 | 15,438 | 6,226 | 1982 | 1996 | ||||||||||||||||||||||||||
Olentangy Plaza | OH | — | 4,283 | 20,774 | 137 | 4,283 | 20,911 | 25,194 | 416 | 1981 | 2015 | ||||||||||||||||||||||||||
Parkway Shops | FL | — | 3,145 | — | 21,692 | 5,902 | 18,935 | 24,837 | 1,259 | 2013 | 2008 | ||||||||||||||||||||||||||
Peachtree Hill | GA | — | 7,517 | 17,062 | 78 | 7,517 | 17,140 | 24,657 | 307 | 1986 | 2015 | ||||||||||||||||||||||||||
Promenade at Pleasant Hill | GA | — | 3,891 | 22,520 | 5,779 | 3,440 | 28,750 | 32,190 | 6,881 | 1993 | 2004 | ||||||||||||||||||||||||||
River City Marketplace | FL | 110,000 | 19,768 | 73,859 | 8,752 | 11,140 | 91,239 | 102,379 | 23,871 | 2005 | 2005 | ||||||||||||||||||||||||||
River Crossing Centre | FL | — | 728 | 6,459 | 198 | 728 | 6,657 | 7,385 | 2,043 | 1998 | 2003 | ||||||||||||||||||||||||||
Rivertowne Square | FL | — | 954 | 8,587 | 2,121 | 954 | 10,708 | 11,662 | 3,546 | 1980 | 1998 | ||||||||||||||||||||||||||
Rolling Meadows | IL | — | 4,393 | 5,252 | 112 | 4,393 | 5,364 | 9,757 | 125 | 1956/2009 | 2015 | ||||||||||||||||||||||||||
Roseville Towne Center | MI | — | 1,403 | 13,195 | 3,466 | 582 | 17,482 | 18,064 | 6,817 | 1963 | 1996 | ||||||||||||||||||||||||||
Rossford Pointe | OH | — | 796 | 3,087 | 1,749 | 797 | 4,835 | 5,632 | 1,452 | 2006 | 2005 | ||||||||||||||||||||||||||
Shoppes of Lakeland | FL | — | 5,503 | 20,236 | 846 | 5,503 | 21,082 | 26,585 | 2,002 | 1985 | 1996 | ||||||||||||||||||||||||||
Shops at Old Orchard | MI | — | 2,864 | 16,698 | 622 | 2,864 | 17,320 | 20,184 | 1,418 | 1972/2011 | 2013 | ||||||||||||||||||||||||||
Southfield Plaza | MI | — | 1,121 | 10,777 | 682 | 1,121 | 11,459 | 12,580 | 6,435 | 1969 | 1996 | ||||||||||||||||||||||||||
Spring Meadows Place (1) | OH | 28,068 | 2,646 | 16,758 | 11,004 | 5,041 | 25,367 | 30,408 | 8,918 | 1987 | 1996 | ||||||||||||||||||||||||||
Tel-Twelve | MI | — | 3,819 | 43,181 | 32,281 | 3,819 | 75,462 | 79,281 | 33,191 | 1968 | 1996 | ||||||||||||||||||||||||||
The Crossroads | FL | — | 1,850 | 16,650 | 885 | 1,857 | 17,528 | 19,385 | 5,878 | 1988 | 2002 | ||||||||||||||||||||||||||
The Shoppes at Fox River | WI | — | 8,534 | 26,227 | 12,546 | 9,750 | 37,557 | 47,307 | 4,595 | 2009 | 2010 | ||||||||||||||||||||||||||
The Shops on Lane Avenue | OH | 28,650 | 4,848 | 51,273 | 278 | 4,848 | 51,551 | 56,399 | 815 | 1952/2004 | 2015 | ||||||||||||||||||||||||||
The Town Center at Aquia Office Building | VA | 11,960 | — | — | 14,405 | 4,615 | 9,790 | 14,405 | 2,912 | 2009 | 1998 | ||||||||||||||||||||||||||
Town & Country Crossing | MO | — | 8,395 | 26,465 | 2,017 | 8,395 | 28,482 | 36,877 | 3,714 | 2008 | 2011 | ||||||||||||||||||||||||||
Treasure Coast Commons | FL | — | 2,924 | 10,644 | (2,024 | ) | 2,924 | 8,620 | 11,544 | 935 | 1996 | 2013 | |||||||||||||||||||||||||
Troy Marketplace | MI | 20,627 | 4,581 | 19,041 | 30 | 4,581 | 19,071 | 23,652 | 1,695 | 2000/2010 | 2013 | ||||||||||||||||||||||||||
Troy Marketplace II | MI | — | 3,790 | 10,292 | 472 | 3,790 | 10,764 | 14,554 | 1,370 | 2000/2010 | 2013 | ||||||||||||||||||||||||||
Troy Towne Center | OH | — | 930 | 8,372 | 56 | 813 | 8,545 | 9,358 | 3,890 | 1990 | 1996 | ||||||||||||||||||||||||||
Village Lakes Shopping Center | FL | — | 862 | 7,768 | 5,992 | 862 | 13,760 | 14,622 | 4,637 | 1987 | 1997 | ||||||||||||||||||||||||||
Village Plaza | FL | — | 2,531 | 12,688 | 1,583 | 2,531 | 14,271 | 16,802 | 1,088 | 1989 | 2013 | ||||||||||||||||||||||||||
Vista Plaza | FL | — | 3,667 | 16,769 | 330 | 3,667 | 17,099 | 20,766 | 1,419 | 1998 | 2013 | ||||||||||||||||||||||||||
West Broward | FL | — | 5,339 | 11,521 | 128 | 5,339 | 11,649 | 16,988 | 1,007 | 1965 | 2013 | ||||||||||||||||||||||||||
West Allis Towne Centre | WI | — | 1,866 | 16,789 | 14,932 | 1,866 | 31,721 | 33,587 | 11,246 | 1987 | 1996 | ||||||||||||||||||||||||||
West Oaks I | MI | — | 1,058 | 10,746 | 13,559 | 2,826 | 22,537 | 25,363 | 6,892 | 1979 | 1996 | ||||||||||||||||||||||||||
West Oaks II | MI | — | 1,391 | 12,519 | 7,303 | 1,391 | 19,822 | 21,213 | 8,718 | 1986 | 1996 | ||||||||||||||||||||||||||
Winchester Center | MI | — | 5,667 | 18,559 | 3,604 | 5,667 | 22,163 | 27,830 | 1,831 | 1980 | 2013 | ||||||||||||||||||||||||||
Woodbury Lakes | MN | — | 10,411 | 55,635 | 3,268 | 10,411 | 58,903 | 69,314 | 3,271 | 2005 | 2014 | ||||||||||||||||||||||||||
Land Held for Future Development (2) | Various | — | 28,266 | 14,026 | (13,566 | ) | 28,503 | 223 | 28,726 | — | N/A | N/A | |||||||||||||||||||||||||
Land Available for Sale (3) | Various | — | 10,931 | 27,252 | (31,510 | ) | 6,673 | — | 6,673 | — | N/A | N/A | |||||||||||||||||||||||||
TOTALS | $ | 322,457 | $ | 440,792 | $ | 1,539,732 | $ | 264,576 | $ | 432,368 | $ | 1,812,732 | $ | 2,245,100 | $ | 331,520 | |||||||||||||||||||||
(1) The property's mortgage loan is cross-collateralized with West Oaks II.
(2) Primarily in Hartland, MI, Lakeland, FL and Jacksonville, FL.
(3) Primarily in Hartland, MI.
F-35
SCHEDULE III
REAL ESTATE INVESTMENT AND ACCUMULATED DEPRECIATION
December 31, 2015
Year ended December 31, | |||||||||||
2015 | 2014 | 2013 | |||||||||
(In thousands) | |||||||||||
Reconciliation of total real estate carrying value: | |||||||||||
Balance at beginning of year | $ | 2,008,687 | $ | 1,727,191 | $ | 1,217,712 | |||||
Additions during period: | |||||||||||
Acquisition | 234,018 | 289,340 | 530,697 | ||||||||
Improvements | 57,046 | 70,982 | 38,613 | ||||||||
Deductions during period: | |||||||||||
Cost of real estate sold/written off | (52,130 | ) | (50,961 | ) | (50,162 | ) | |||||
Impairment | (2,521 | ) | (27,865 | ) | (9,669 | ) | |||||
Balance at end of year | $ | 2,245,100 | $ | 2,008,687 | $ | 1,727,191 | |||||
Reconciliation of accumulated depreciation: | |||||||||||
Balance at beginning of year | $ | 287,177 | $ | 253,292 | $ | 237,462 | |||||
Depreciation Expense | 59,602 | 50,081 | 39,469 | ||||||||
Cost of real estate sold/written off | (15,259 | ) | (16,196 | ) | (23,639 | ) | |||||
Balance at end of year | $ | 331,520 | $ | 287,177 | $ | 253,292 | |||||
Aggregate cost for federal income tax purposes | $ | 2,366,608 | $ | 2,115,287 | $ | 1,781,084 | |||||
F-36