Attached files
| file | filename |
|---|---|
| 8-K - FORM 8-K - Wendy's Co | form8-k_2010q4slides.htm |

Fourth Quarter and
Full-Year 2010 Earnings Call
Full-Year 2010 Earnings Call
March 3, 2011
Opening
Comments
Comments
John Barker
SVP and Chief Communications Officer
3
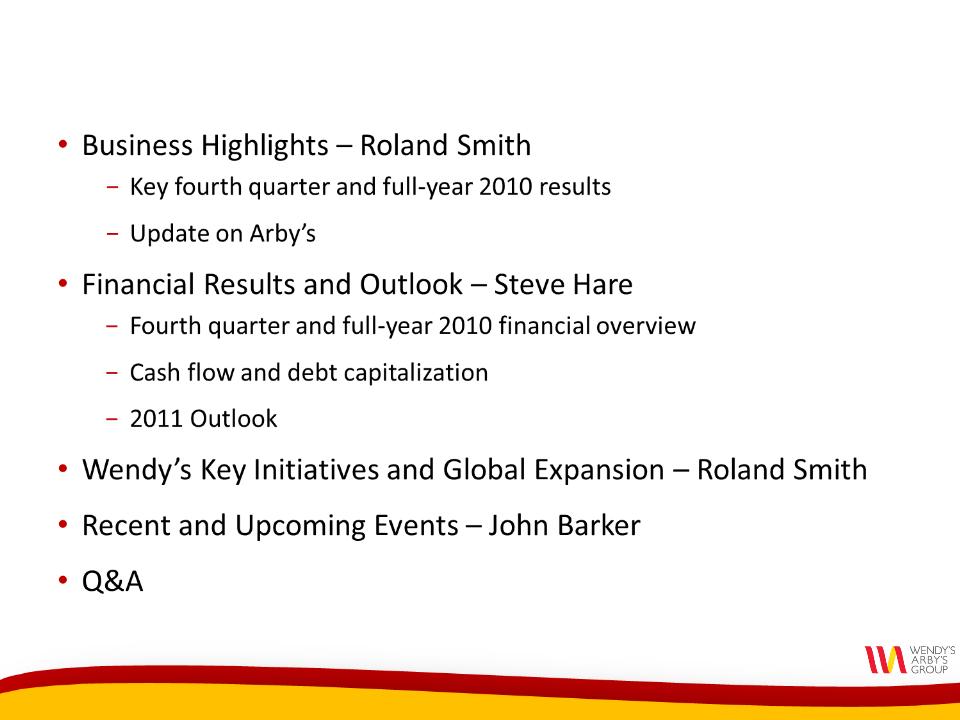
Agenda

4
Forward-Looking Statements and Regulation G
This presentation, and certain information that management may discuss in connection with this
presentation, may contain statements that are not historical facts, including, importantly,
information concerning possible or assumed future results of our operations. Those statements
constitute “forward-looking statements” within the meaning of the Private Securities Litigation
Reform Act of 1995 (the “Reform Act”). For all our forward-looking statements, we claim the
protection of the safe harbor for forward-looking statements contained in the Reform Act.
Many important factors could affect our future results and could cause those results to differ
materially from those expressed in or implied by our forward-looking statements. Such factors,
all of which are difficult or impossible to predict accurately, and many of which are beyond our
control, include but are not limited to those identified under the caption “Forward-Looking
Statements” in our most recent earnings press release and in the “Special Note Regarding
Forward-Looking Statements and Projections” and “Risk Factors” sections of our most recent
Form 10-K and subsequent Form 10-Qs.
In addition, this presentation and certain information management may discuss in connection
with this presentation reference non-GAAP financial measures, such as earnings before interest,
taxes, depreciation and amortization, or EBITDA. Reconciliations of non-GAAP financial measures
to the most directly comparable GAAP financial measure are in the Appendix to this
presentation, and are included in the earnings release and posted on the Investor Relations
section of our website.
Business
Highlights
Highlights
Roland Smith
President & Chief Executive Officer
6
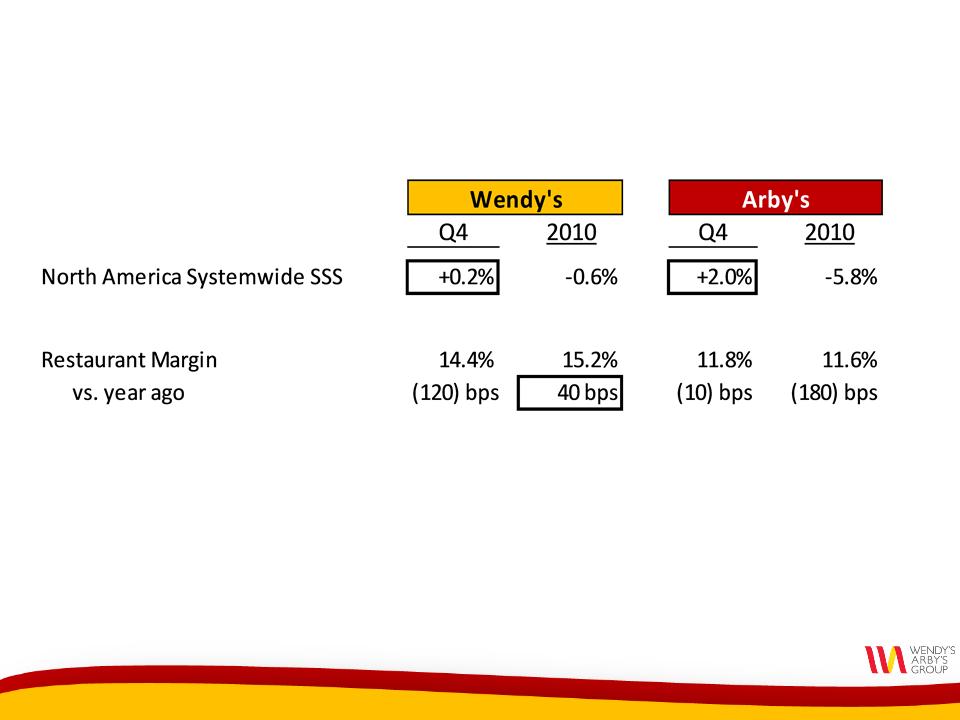
Key Results by Brand - Q4 and Full-Year 2010
*
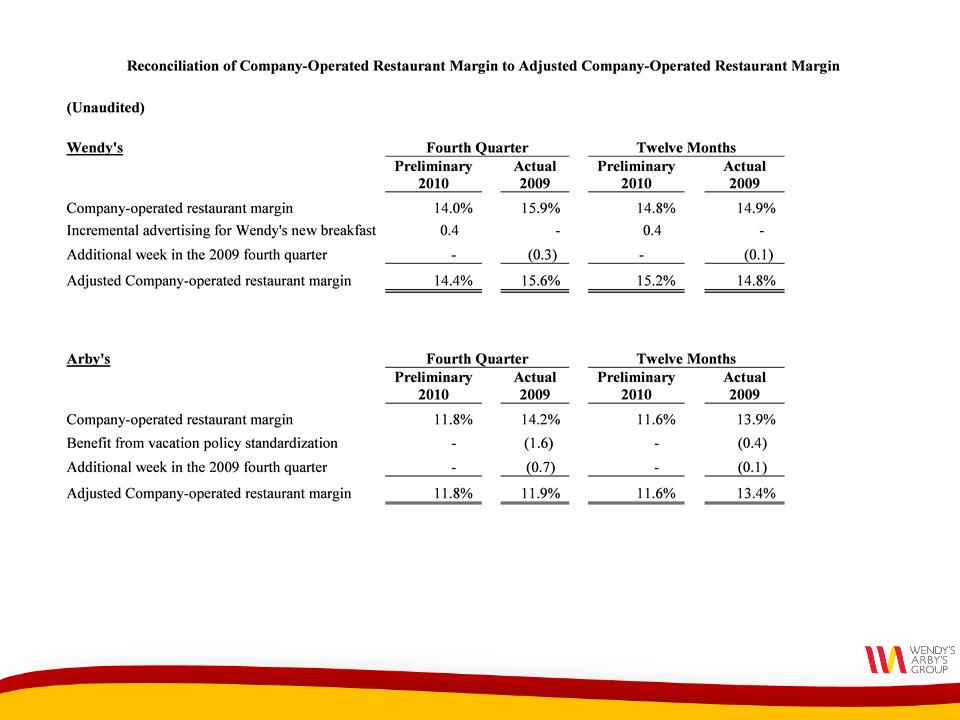
*Restaurant Margin adjusted to exclude breakfast impact of 0.4% in Q4 and 0.4% for full-year 2010.
*
7
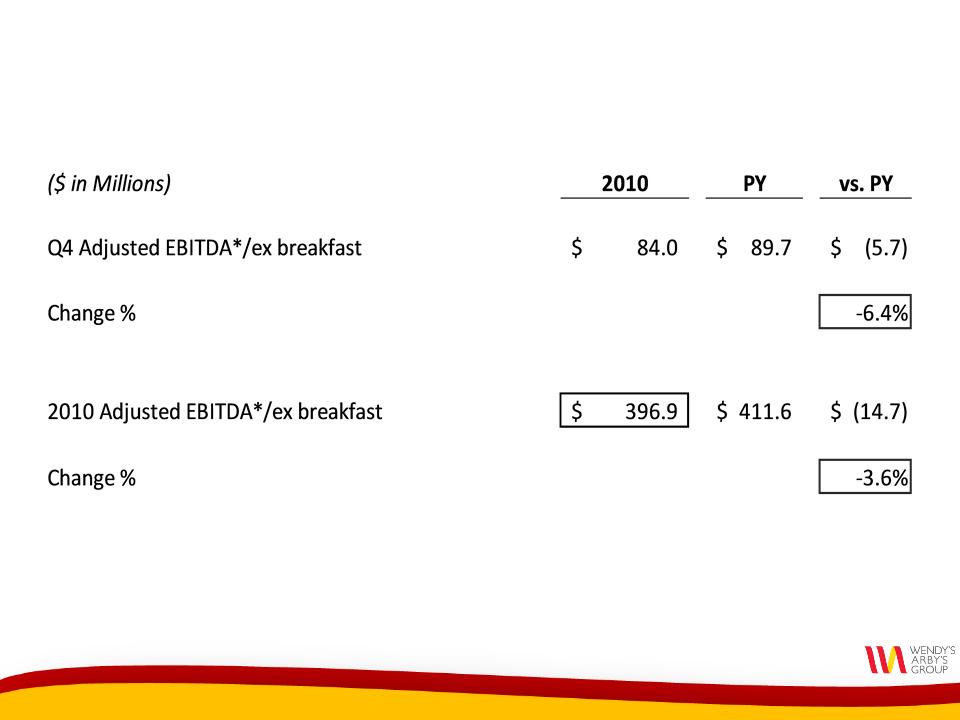
Q4 and Full-Year 2010 Results
*See Appendix for adjustments, which include: PY results adjusted to exclude 53rd week of $13.6 million.
8
Update on Arby’s
• Announced on January 20th that we are exploring
strategic alternatives for Arby’s, including a sale
strategic alternatives for Arby’s, including a sale
• Re-launch of the brand with national advertising
began on February 27th
began on February 27th
2010 Results and
2011 Outlook
2011 Outlook
Steve Hare
Chief Financial Officer
10
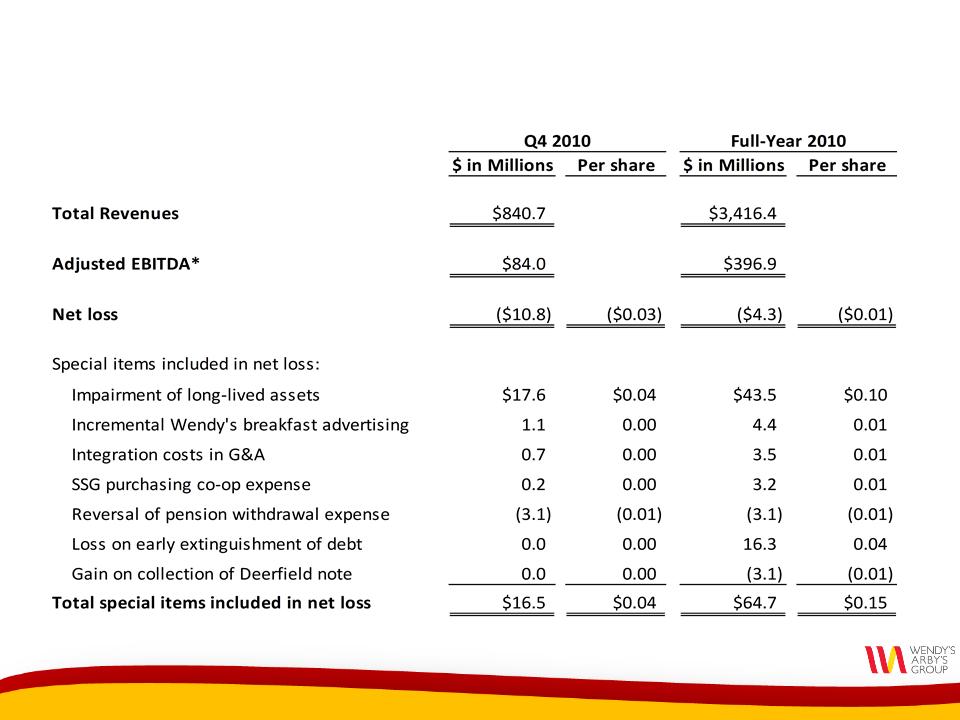
Fourth Quarter and Full-Year 2010 Results
*See Appendix.
11
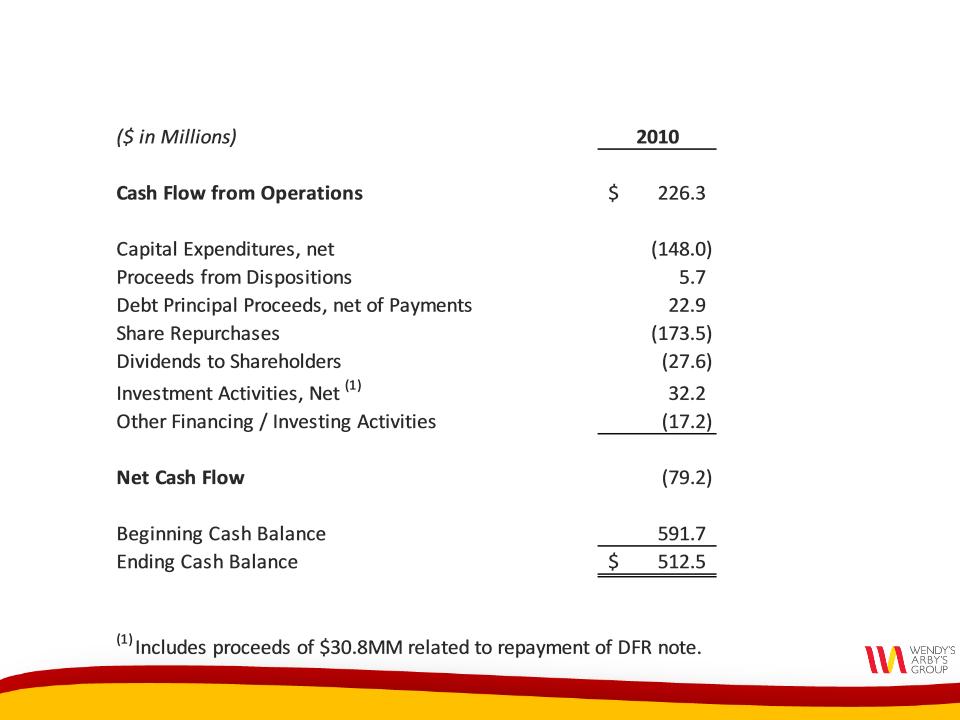
Cash Flow 2010
12
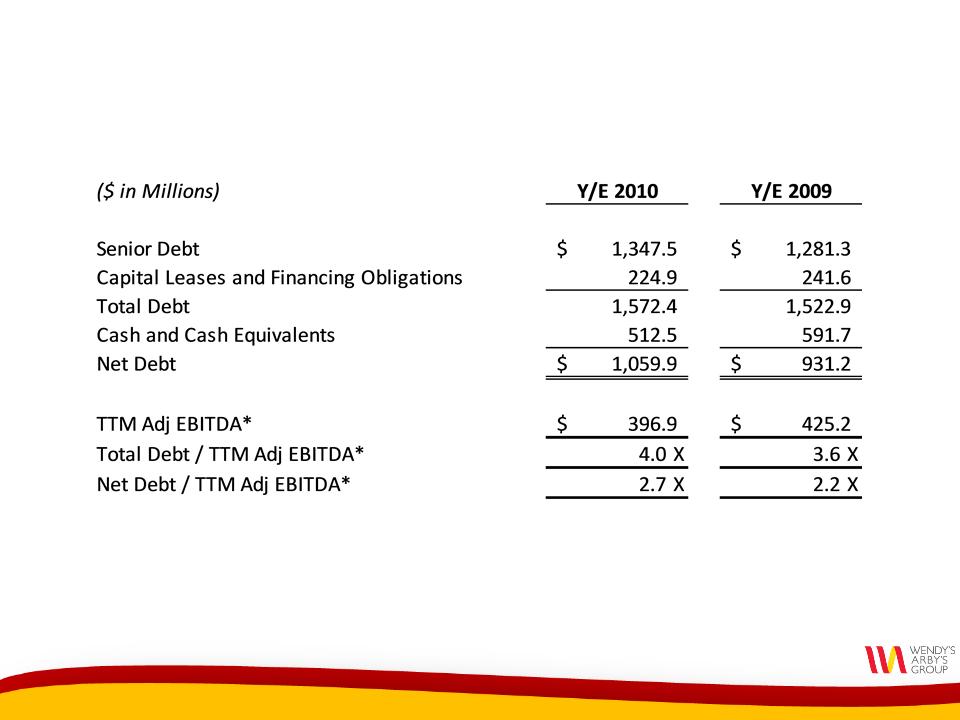
Consolidated Debt
*See Appendix.

13
• Pursuing strategic alternatives for Arby’s,
including a potential sale
including a potential sale
• Reducing corporate G&A to support single brand
2011: Transition Year

14
Benefits of Potential Sale of Arby’s
• Ability to focus resources on the Wendy’s brand
• Reduce corporate G&A to support a single brand
• Reduce capitalized lease obligations
• Reduce future capital expenditures
• Proceeds from sale would be available for
re-investment and return of capital to shareholders
re-investment and return of capital to shareholders
Sale expected to be accretive to net
income and free cash flow
income and free cash flow

15
Reduce G&A to Support Single Brand
• In 2010, approximately 1/3 of our $417 million G&A
expenses related to Arby’s
expenses related to Arby’s
• Arby’s G&A included direct G&A as well and
allocation of indirect support center G&A
allocation of indirect support center G&A
• Assuming a sale of Arby’s, direct and indirect G&A
related to Arby’s expected to transfer to the buyer or
be eliminated
related to Arby’s expected to transfer to the buyer or
be eliminated

16
2011 Outlook
• Expect $345-355 million of pro forma(1)
Company EBITDA
Company EBITDA
• Key Assumptions:
– Wendy’s same-store sales growth +1% to +3%
– Wendy’s company-operated restaurant margin(2)
improvement of 30 to 60 basis points
improvement of 30 to 60 basis points
• Commodities increasing 2-3%
– Capital expenditures of $145 million
(1) Assumes sale of Arby’s and related G&A reductions occurred as of the beginning of 2011.
(2) Includes breakfast expense in 2010 and 2011.

17
Uses of Capital 2011 and beyond
• Investments in Organic Growth & Operations
– Breakfast (new kitchen equipment, coffee program,
menuboards)
menuboards)
– Remodeling
– POS/restaurant technology
– New restaurant development - North America
– Expansion in international markets
• Common Stock Repurchase and Dividends
Wendy’s Initiatives
& Global Expansion
& Global Expansion
Roland Smith
President & Chief Executive Officer

19
Wendy’s Key 2011 Initiatives
• Reinforce “Real” Brand Positioning
• Introduce New Dave’s Hot ‘N Juicy Cheeseburger
• Launch New Products & Reinforce “My 99”
• Expand Breakfast Menu
• Deliver Operational Excellence
• Remodel Facilities
• Prepare for New Restaurant Growth
Drive Positive Same-Store Sales

20

21
• Fresh, never frozen, 100%
pure North American beef
pure North American beef
• 40% thicker patty
• Quality toppings
• Crinkle-cut pickle
• Red onion
• Toasted and buttered bun
Dave’s Hot ‘N Juicy
Cheeseburgers Feature:
Cheeseburgers Feature:
National Launch
2nd Half 2011
2nd Half 2011

22
Gold Hamburger Test Results
4 Week Base
1st Media Flight
2nd Media Flight
Dave’s Hot n’ Juicy Cheeseburgers
Test Market Average Unit Sales
(vs base)
(vs base)
+27%

23
Wendy’s New Products
and My 99 Everyday Value Menu
and My 99 Everyday Value Menu
Seasonal Salads
Seasonal Salads
Fish & Chips
Fish & Chips
Fresh Berry Frosty
Fresh Berry Frosty
Asiago
Asiago
Chicken Club
Chicken Club

24
Wendy’s Breakfast Opportunity
• Wendy’s is the only major QSR
hamburger chain with an opportunity
to introduce breakfast
hamburger chain with an opportunity
to introduce breakfast
• AUVs $1.4 million without breakfast
• Breakfast can add $140,000-$150,000
to AUVs in the near-term
to AUVs in the near-term

25
2011 Breakfast Expansion Timeline
Q4
2011
2011
Q2
2011
2011
Q3
2011
2011
Q1
2011
2011
2010
1,000
STORES
YE
2011
2011
CONVERT 300 OLD MENU
STORES
STORES
NEW
MENU
LAUNCH
MENU
LAUNCH
LOUISVILLE &
SAN ANTONIO
SAN ANTONIO
ADDITIONAL
MARKETS
MARKETS
• Kansas City
• Phoenix
• Pittsburgh
• Shreveport
26
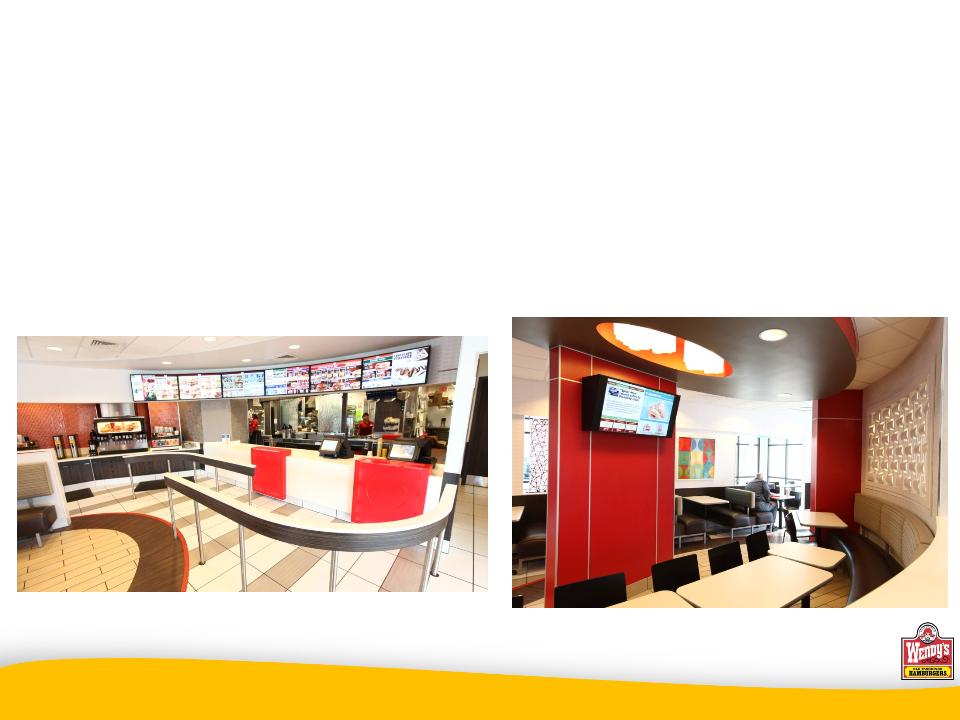
Wendy’s Facility Remodels and New Designs
Next Generation Designs in process
100 Remodels planned for 2011
75 to be in new design

27
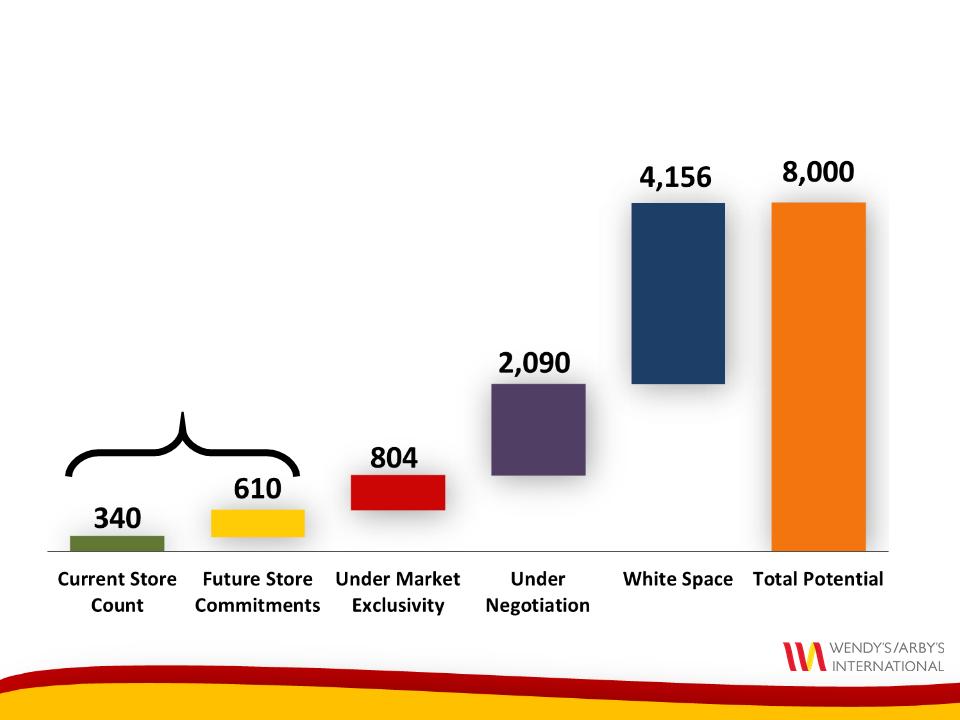
North America - Store Growth
~6,000 store base
1,000
new stores
new stores

28
8,000 store
opportunity
opportunity
8,000 store
opportunity
opportunity

29
Recent International Announcements
Philippines
•Expanding existing development agreement with Wenphil
– Adding 44 new restaurants for a total of 75 Wendy’s locations in
the country
the country
Japan
•New joint venture agreement with Higa Industries Co., Ltd
– Leading food importer and distributor
– Successful former Domino’s Pizza franchisee
– First Wendy’s restaurant scheduled to open in Tokyo in 2011, with
plans for rapid growth
plans for rapid growth
30
International* Development Pipeline
~1,000
*excludes Canada.

31
Growth Initiatives Summary
• Introduce exciting, new products
• Expand dayparts - especially breakfast
• Focus on operational excellence
• Modernize our facilities
• Pursue global expansion
Average annual EBITDA growth of 10-15%, beginning in 2012

32
Recent and Upcoming Events
• January 27
Investor Day
• March 9
Bank of America Merrill Lynch 2011
Consumer Conference
Consumer Conference
• March 14
Roth Capital Annual Orange County
Growth Stock Conference
Growth Stock Conference
• March 28
J.P. Morgan Gaming, Lodging,
Restaurant & Leisure Management
Access Forum 2011
Restaurant & Leisure Management
Access Forum 2011
•May 10
Q1 Earnings Release
Q&A

Appendix
35

36
|
(In Thousands)
|
Fourth Quarter
|
|
Twelve Months
|
||||
|
(Unaudited)
|
2010
(13 weeks)
|
|
2009
(14 weeks)
|
|
2010
(52 weeks)
|
|
2009
(53 weeks)
|
|
EBITDA
|
$ 85,824
|
|
$ 82,619
|
|
$ 384,037
|
|
$ 384,359
|
|
Depreciation and amortization
|
(44,724)
|
|
(46,882)
|
|
(182,172)
|
|
(190,251)
|
|
Impairment of long-lived assets
|
(28,053)
|
|
(51,024)
|
|
(69,477)
|
|
(82,132)
|
|
Operating profit (loss)
|
13,047
|
|
(15,287)
|
|
132,388
|
|
111,976
|
|
Interest expense
|
(32,694)
|
|
(37,037)
|
|
(137,229)
|
|
(126,708)
|
|
Loss on early extinguishment of debt
|
-
|
|
-
|
|
(26,197)
|
|
-
|
|
Investment income (expense), net
|
5
|
|
842
|
|
5,261
|
|
(3,008)
|
|
Other than temporary losses on investments
|
-
|
|
-
|
|
-
|
|
(3,916)
|
|
Other income, net
|
808
|
|
1,220
|
|
3,782
|
|
1,523
|
|
Loss before income taxes
|
(18,834)
|
|
(50,262)
|
|
(21,995)
|
|
(20,133)
|
|
Benefit from income taxes
|
8,076
|
|
35,544
|
|
17,670
|
|
23,649
|
|
Net (loss) income from continuing operations
|
$ (10,758)
|
|
$ (14,718)
|
|
$ (4,325)
|
|
$ 3,516
|
Wendy’s/Arby’s Group, Inc. and Subsidiaries
Calculation and Comparison of EBITDA and a Reconciliation of EBITDA to Net Income
|
(In Thousands)
|
Fourth Quarter
|
|
Twelve Months
|
||||
|
(Unaudited)
|
2010
(13 weeks)
|
|
2009
(14 weeks)
|
|
2010
(52 weeks)
|
|
2009
(53 weeks)
|
|
EBITDA
|
$ 85,824
|
|
$ 82,619
|
|
$ 384,037
|
|
$ 384,359
|
|
Plus:
Integration costs in general and administrative (G&A)
|
1,185
|
|
5,387
|
|
5,514
|
|
16,598
|
|
SSG purchasing co-op expenses in G&A
|
245
|
|
-
|
|
5,145
|
|
-
|
|
Incremental advertising for Wendy’s new breakfast
|
1,738
|
|
-
|
|
7,192
|
|
-
|
|
Reversal of pension withdrawal expense in cost of sales
|
(4,975)
|
|
-
|
|
(4,975)
|
|
-
|
|
Wendy’s purchasing co-op start-up costs in G&A
|
-
|
|
15,500
|
|
-
|
|
15,500
|
|
Facilities relocation and corporate restructuring
|
-
|
|
2,125
|
|
-
|
|
11,024
|
|
Pension withdrawal expense in cost of sales
|
-
|
|
4,975
|
|
-
|
|
4,975
|
|
Benefit from vacation policy standardization in G&A
|
-
|
|
(3,339)
|
|
-
|
|
(3,339)
|
|
Benefit from vacation policy standardization in cost of sales
|
-
|
|
(3,925)
|
|
-
|
|
(3,925)
|
|
Adjusted EBITDA
|
84,017
|
|
103,342
|
|
396,913
|
|
425,192
|
|
Less:
|
|
|
|
|
|
|
|
|
EBITDA effect of additional week in 2009
|
N.A.
|
|
(13,600)
|
|
N.A.
|
|
(13,600)
|
|
Normalized 52 weeks adjusted EBITDA
|
$ 84,017
|
|
$ 89,742
|
|
$ 396,913
|
|
$ 411,592
|
Reconciliation of EBITDA to Adjusted EBITDA
% Change in Adjusted EBITDA -6.4% -3.6%