Attached files
| file | filename |
|---|---|
| 8-K - NATIONAL PENN BANCSHARES, INC. FORM 8-K - NATIONAL PENN BANCSHARES INC | npb8k.htm |
EXHIBIT 99.1

National Penn Bancshares, Inc.
KBW Regional Bank Conference
March 2011
KBW Regional Bank Conference
March 2011
4Q/Year End 12.31.10
5

This presentation, including the attached Financial Highlights and financial data tables, contains supplemental financial information determined by methods other
than in accordance with Accounting Principles Generally Accepted in the United States of America (“GAAP”). National Penn’s management uses these non-GAAP
measures in its analysis of National Penn’s performance. These measures should not be considered a substitute for GAAP basis measures nor should they be viewed
as a substitute for operating results determined in accordance with GAAP. Management believes the presentation of the following non-GAAP financial measures, which
exclude the impact of the specified items, provides useful supplemental information that is essential to a proper understanding of the financial results of National Penn.
– Annualized return on average tangible common equity excludes the average balance of acquisition-related goodwill and intangible assets and the
average balance of preferred equity in determining average tangible shareholders’ equity. Annualized return on average tangible equity provides a
method to assess management’s success in utilizing the company’s tangible common capital.
average balance of preferred equity in determining average tangible shareholders’ equity. Annualized return on average tangible equity provides a
method to assess management’s success in utilizing the company’s tangible common capital.
– Tangible book value excludes from total equity goodwill, intangible assets and preferred stock. Banking and financial institution regulators also exclude
goodwill and intangible assets from shareholders’ equity when assessing the capital adequacy of a financial institution. Tangible book value provides a
method to assess the level of tangible net assets on a per share basis.
goodwill and intangible assets from shareholders’ equity when assessing the capital adequacy of a financial institution. Tangible book value provides a
method to assess the level of tangible net assets on a per share basis.
– Adjusted net income excludes the effects of certain gains and losses adjusted for applicable taxes. Adjusted net income provides a method to assess
earnings performance by excluding items that management believes are not comparable among the periods presented.
earnings performance by excluding items that management believes are not comparable among the periods presented.
– Efficiency ratio expresses operating expenses as a percentage of fully-taxable equivalent net interest income plus non-interest income. Operating
expenses exclude items from non-interest expense that management believes are not comparable among the periods presented. Non-interest income is
adjusted to also exclude items that management believes are not comparable among the periods presented. Efficiency ratio is used as a method for
management to assess its operating expense level and to compare to financial institutions of varying sizes.
Management believes the use of non-GAAP measures will help readers compare National Penn’s current results to those of prior periods as presented in the
accompanying Financial Highlights and financial data tables.
accompanying Financial Highlights and financial data tables.
Non-GAAP Financial Measures
Safe Harbor Regarding Forward Looking Statements
This presentation contains forward-looking information about National Penn Bancshares, Inc. that is intended to be covered by the safe harbor for forward-looking
statements provided by the Private Securities Litigation Reform Act of 1995. Forward-looking statements are statements that are not historical facts. These
statements can be identified by the use of forward-looking terminology such as “believe,” “expect,” “may,” “will,” “should,’’ “project,” ”could,” “plan,’’ “goal,” “potential,”
“pro forma,” “seek,” “intend,’’ or “anticipate’’ or the negative thereof or comparable terminology, and include discussions of strategy, financial projections, guidance
and estimates (including their underlying assumptions), statements regarding plans, objectives, expectations or consequences of announced transactions, and
statements about the future performance, operations, products and services of National Penn and its subsidiaries. National Penn cautions readers not to place undue
reliance on these statements.
National Penn’s business and operations, as well as its business and operations following the completion of transactions described in this presentation, are
subject to a variety of risks, uncertainties and other factors. Consequently, actual results and experience may materially differ from those contained in any forward-
looking statements. Such risks, uncertainties and other factors that could cause actual results and experience to differ from those projected include, but are not
limited to, the following: increased capital requirements and other requirements or actions mandated by National Penn’s regulators, National Penn’s inability to meet
the requirements of the memorandum of understanding or the individual minimum capital ratio requirements issued by its primary regulator, National Penn’s inability
to successfully implement its “self-improvement plan”, National Penn’s ability to raise capital and maintain capital levels, variations in interest rates, deterioration in
the credit quality of loans, the effect of credit risk exposure, declines in the value of National Penn’s assets and the effect of any resulting impairment charges, recent
and ongoing changes to the state and federal regulatory schemes under which National Penn and other financial services companies operate (including the recently
passed Dodd-Frank Act and regulations to be adopted to implement that Act), competition from other financial institutions, interruptions or breaches of National
Penn’s security systems, and the development and maintenance of National Penn’s information technology. These risks and others are described in greater detail in
National Penn’s Annual Report on Form 10-K for the fiscal year ended December 31, 2009, as well as in National Penn’s Quarterly Reports on Form 10-Q and other
documents filed by National Penn with the SEC after the date thereof. National Penn makes no commitment to revise or update any forward-looking statements in
order to reflect events or circumstances occurring or existing after the date any forward-looking statement is made.
6

•$8.8 billion assets
•125 community offices
•1,728 FTE employees
•$1.24 billion market cap*
•Approx. 750 thousand
share avg. daily volume
(52 week)*
share avg. daily volume
(52 week)*
* SNL as of 2.9.11
Attractive Franchise in the Heart of the
Mid-Atlantic Region
Mid-Atlantic Region
7

Sources: SNL Financial / FDIC
As of June 30, 2010
Strong Market Share in Demographically
Attractive Counties
Attractive Counties
|
|
Berks
|
Northampton
|
Chester
|
Lehigh
|
Centre
|
|
% of National Penn Deposits
|
22.6%
|
16.3%
|
13.2%
|
9.0%
|
5.9%
|
|
Market Rank
|
2
|
2
|
5
|
2
|
1
|
|
Market Share
|
18.3%
|
19.5%
|
7.8%
|
9.0%
|
16.8%
|
|
# Community Banking Offices
|
21
|
22
|
18
|
14
|
5
|
|
Median Household Income
($000) |
$58.1
|
$59.5
|
$87.1
|
$57.7
|
$47.0
|
|
Nationwide Median HH Income
($000) |
$54.4
|
||||
|
Projected Income Growth:
’10 - ’15
|
11.0%
|
13.9%
|
17.1%
|
14.5%
|
14.9%
|
|
Nationwide Projected Income
Growth |
12.4%
|
||||
8

Clean, Strong, Efficient
l Earnings improving
l Favorable asset quality trends
l Strong balance sheet
l Warburg Pincus partnership
9

Value of Warburg Pincus Partnership
l $150 million investment completed Jan. 7, 2011
l Sophisticated global investor with growth and long term
shareholder value creation focus
shareholder value creation focus
l Performed extensive due diligence, validating asset
quality, capital and balance sheet strength, and strategic
vision
quality, capital and balance sheet strength, and strategic
vision
– Firms supporting Warburg’s diligence included: KPMG, Franklin
Madison, Strategic Risk Advisors and Wachtell, Lipton, Rosen & Katz
Madison, Strategic Risk Advisors and Wachtell, Lipton, Rosen & Katz
l Appointed Director Michael Martin brings a wealth of
experience from the financial services industry
experience from the financial services industry
10

Source: SNL Financial
NPBC Daily Stock Price Change %
2.17.10 thru 2.16.11
2.17.10 thru 2.16.11
11

Improving Adjusted Earnings
Quarterly Analysis
Quarterly Analysis
12

Improving Adjusted Earnings
Full Year Analysis
Full Year Analysis
13

($000)
Adjusted earnings per share is a non-GAAP measurement. Refer to adjusted diluted earnings (loss)
per share Quarterly Analysis slide within this presentation for reconciliation to GAAP measurement.
per share Quarterly Analysis slide within this presentation for reconciliation to GAAP measurement.
Improving Adjusted Earnings Per Share
14

Net Interest Margin
(Taxable Equivalent)
(Taxable Equivalent)
15

($000)
Excludes certain items. Refer to appendix for a reconciliation to reported non-interest income and for
calculation of non-interest income / operating revenue
calculation of non-interest income / operating revenue
Non-Interest Income
16

($000)
Excludes certain items. Refer to appendix for a reconciliation to reported non-interest expense and for
calculation of efficiency ratio
calculation of efficiency ratio
Non-Interest Expense
17

($000)
Excludes certain items. Refer to appendix for calculation of pre-tax pre-provision revenue and ratio to
average assets.
average assets.
Pre-tax Pre-Provision Revenue
18

Asset Quality Statistics
19

NPL’s include non-accrual loans plus renegotiated loans.
Peer data is for peer banks, as defined in April 2009 proxy
statement, with 12/31/2010 data available as of 2/22/2011
statement, with 12/31/2010 data available as of 2/22/2011
Strong Asset Quality
Non-Performing Loans as a % of Loans
Non-Performing Loans as a % of Loans
20

NPL’s include non-accrual loans plus renegotiated loans.
Peer data is for peer banks, as defined in April 2009 proxy
statement, with 12/31/2010 data available as of 2/22/2011
statement, with 12/31/2010 data available as of 2/22/2011
Strong Reserve Coverage
ALLL as a % of Non-Performing Loans
ALLL as a % of Non-Performing Loans
21

(1) Does not assume repurchase of the 735,294 outstanding warrants, valued at approximately $1.0 million based on a
binomial valuation
binomial valuation
(2) Peer data is for peer banks, as defined in April 2009 proxy statement, with 12.31.2010 data available as of 2.22.2011
Pro Forma Capital Ratios
22

Peer data is for peer banks, as defined in April 2009 proxy
statement, with 12/31/2010 data available as of 2/22/2011
statement, with 12/31/2010 data available as of 2/22/2011
Strong Capital Position
Tangible Common Equity / Tangible Assets
Tangible Common Equity / Tangible Assets
23

Peer data is for peer banks, as defined in April 2009 proxy
statement, with 12/31/2010 data available as of 2/22/2011
statement, with 12/31/2010 data available as of 2/22/2011
Strong Capital Position
Tier 1 Common Capital Ratio
Tier 1 Common Capital Ratio
24

Loan Risk Profile
25

26
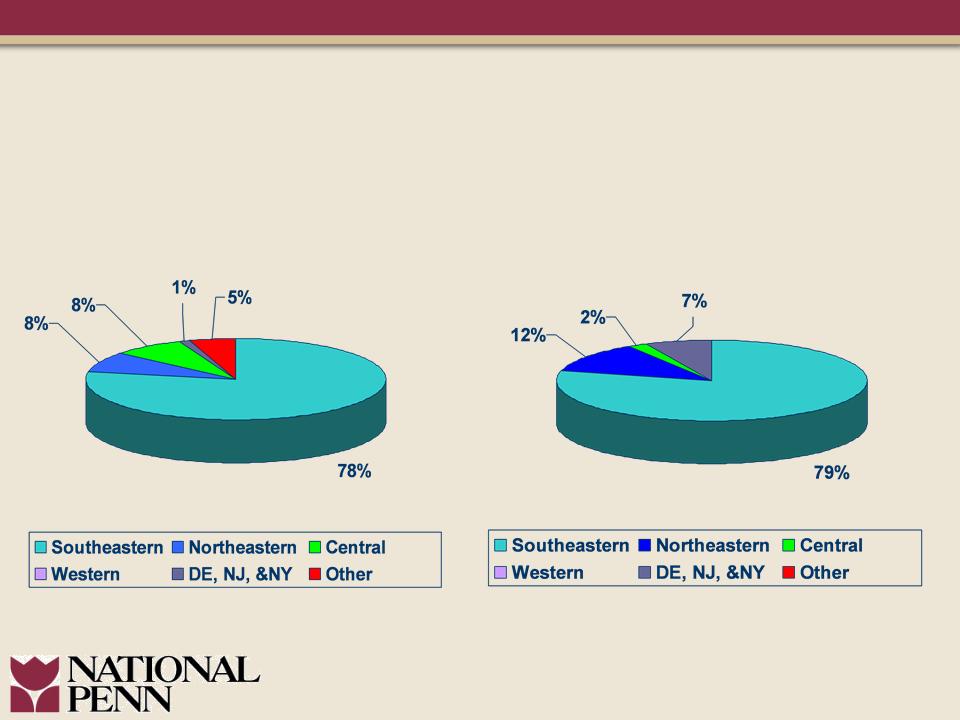
Non-Performing Assets
Gross Charge Offs
Non-Performing Assets and
Gross Charge-offs
Concentrated in SE PA Region
Gross Charge-offs
Concentrated in SE PA Region
27

Classified loans consist of loans risk rated substandard, doubtful, or loss. As such classified
loans include non-performing loans.
loans include non-performing loans.
Classified Loans - Positive Trend
($000s)
($000s)
28

2010 Strategic Accomplishments
l Deleveraged balance sheet
– reduction of higher cost, non-retail deposits
l Continued de-risking of balance sheet
– Notable improvement in credit quality
l Evaluated risk / reward profile of lines of
business / products
business / products
– Divested of Christiana Bank & Trust Company
– Surrendered separate account BOLI
l Enhanced capital position
– $150 million investment by Warburg Pincus
29

Longer-term Earnings Capacity
l Accelerate repayment of TARP
30

Longer-term Earnings Capacity
l Accelerate repayment of TARP
l Positioned for improving economic conditions
– Aggressively pursuing new customer relationships
31

Longer-term Earnings Capacity
l Accelerate repayment of TARP
l Positioned for improving economic conditions
– Aggressively pursuing new customer relationships
l Culture of addressing issues, not deferring
– Results in a strong balance sheet
32

Longer-term Earnings Capacity
l Accelerate repayment of TARP
l Positioned for improving economic conditions
– Aggressively pursuing new customer relationships
l Culture of addressing issues not deferring
– Results in a strong balance sheet
l Longer term capital management opportunities
33

Longer-term Earnings Capacity
l Accelerate repayment of TARP
l Positioned for improving economic conditions
– Aggressively pursuing new customer relationships
l Culture of addressing issues not deferring
– Results in a strong balance sheet
l Longer term capital management opportunities
l Realize advantages of operating leverage
34

35

($000s)
Appendix
GAAP/Non-GAAP Reconciliations
GAAP/Non-GAAP Reconciliations
36

|
Peer
|
Ticker
|
|
BancorpSouth, Inc.
|
BXS
|
|
F.N.B Corporation
|
FNB
|
|
First Midwest Bancorp, Inc.
|
FMBI
|
|
First Niagara Financial Group, Inc.
|
FNFG
|
|
FirstMerit Corporation
|
FMER
|
|
Fulton Financial Corporation
|
FULT
|
|
MB Financial, Inc.
|
MBFI
|
|
Old National Bancorp
|
ONB
|
|
Susquehanna Bancshares, Inc.
|
SUSQ
|
|
Trustmark Corporation
|
TRMK
|
|
Valley National Bancorp
|
VLY
|
|
Whitney Holding Corporation
|
WTNY
|
|
Wilmington Trust Corporation
|
WL
|
|
Wintrust Financial Corporation
|
WTFC
|
Appendix
NPBC Peer Data
2009 Proxy
Statement
NPBC Peer Data
2009 Proxy
Statement
37