Attached files
| file | filename |
|---|---|
| EX-21 - EX-21 - SUREWEST COMMUNICATIONS | a2202166zex-21.htm |
| EX-10.9 - EX-10.9 - SUREWEST COMMUNICATIONS | a2202166zex-10_9.htm |
| EX-10.8 - EX-10.8 - SUREWEST COMMUNICATIONS | a2202166zex-10_8.htm |
| EX-10.10 - EX-10.10 - SUREWEST COMMUNICATIONS | a2202166zex-10_10.htm |
| EX-10.12 - EX-10.12 - SUREWEST COMMUNICATIONS | a2202166zex-10_12.htm |
| EX-10.13 - EX-10.13 - SUREWEST COMMUNICATIONS | a2202166zex-10_13.htm |
| EX-10.11 - EX-10.11 - SUREWEST COMMUNICATIONS | a2202166zex-10_11.htm |
| EX-10.16 - EX-10.16 - SUREWEST COMMUNICATIONS | a2202166zex-10_16.htm |
| EX-23 - EX-23 - SUREWEST COMMUNICATIONS | a2202166zex-23.htm |
| EX-32.2 - EX-32.2 - SUREWEST COMMUNICATIONS | a2202166zex-32_2.htm |
| EX-31.2 - EX-31.2 - SUREWEST COMMUNICATIONS | a2202166zex-31_2.htm |
| EX-31.1 - EX-31.1 - SUREWEST COMMUNICATIONS | a2202166zex-31_1.htm |
| EX-32.1 - EX-32.1 - SUREWEST COMMUNICATIONS | a2202166zex-32_1.htm |
Use these links to rapidly review the document
TABLE OF CONTENTS
Item 8. Financial Statements and Supplementary Data.
UNITED STATES
SECURITIES AND EXCHANGE COMMISSION
Washington, D.C. 20549
FORM 10-K
| ý | ANNUAL REPORT PURSUANT TO SECTION 13 OR 15(d) OF THE SECURITIES EXCHANGE ACT OF 1934 |
|
For the fiscal year ended December 31, 2010 |
||
or |
||
o |
TRANSITION REPORT PURSUANT TO SECTION 13 or 15(d) OF THE SECURITIES EXCHANGE ACT OF 1934 |
|
Commission File Number 000-29660 |

|
||
| SUREWEST COMMUNICATIONS (Exact name of registrant as specified in its charter) |
||
California (State or other jurisdiction of incorporation or organization) |
68-0365195 (I.R.S. Employer Identification No.) |
|
8150 Industrial Avenue, Building A, Roseville, California (Address of principal executive offices) |
95678 (Zip Code) |
|
Registrant's telephone number, including area code (916) 786-6141 |
||
Securities registered pursuant to Section 12(b) of the Act: |
||
Title of each class Common Stock–Without Par Value Common Stock Purchase Rights |
Name of each exchange on which registered The NASDAQ Stock Market LLC The NASDAQ Stock Market LLC |
|
Securities registered pursuant to Section 12 (g) of the Act: None |
||
Indicate by check mark if the registrant is a well-known seasoned issuer, as defined in Rule 405 of the Securities Act.
Yes o No ý
Indicate by check mark if the registrant is not required to file reports pursuant to Section 13 or Section 15(d) of the Act.
Yes o No ý
Indicate by check mark whether the registrant (1) has filed all reports required to be filed by Section 13 or 15(d) of the Securities Exchange Act of 1934 during the preceding 12 months (or for such shorter period that the registrant was required to file such reports), and (2) has been subject to such filing requirements for the past 90 days.
Yes ý No o
Indicate by check mark whether the registrant has submitted electronically and posted on its corporate Web site, if any, every Interactive Data File required to be submitted and posted pursuant to Rule 405 of Regulation S-T (§232.405 of this chapter) during the preceding 12 months (or for such shorter period that the registrant was required to submit and post such files).
Yes o No o
Indicate by check mark if disclosure of delinquent filers pursuant to Item 405 of Regulation S-K (§229.405 of this chapter) is not contained herein, and will not be contained, to the best of registrant's knowledge, in definitive proxy or information statements incorporated by reference in Part III of this Form 10-K or any amendment to this Form 10-K. o
Indicate by check mark whether the registrant is a large accelerated filer, an accelerated filer, a non-accelerated filer, or a small reporting company. See definitions of "large accelerated filer," "accelerated filer" and "smaller reporting company" in Rule 12b-2 of the Exchange Act.
| Large accelerated filer o | Accelerated filer ý | Non-accelerated filer o (Do not check if a smaller reporting company) |
Smaller reporting company o |
Indicate by check mark whether the registrant is a shell company (as defined in Rule 12b-2 of the Act).
Yes o No ý
As of June 30, 2010, the aggregate market value of the shares held by non-affiliates of the registrant's common stock was $79,101,169 based on the closing price as reported on the NASDAQ Stock Market LLC. The market value calculations exclude shares held on the stated date by registrant's employee benefit plans, directors and officers on the assumption such shares may be shares owned by affiliates. Exclusion from these public market value calculations does not necessarily conclude affiliate status for any other purpose.
On February 9, 2011, the registrant had 14,091,342 shares of Common Stock outstanding.
DOCUMENTS INCORPORATED BY REFERENCE
Portions of the Registrant's Proxy Statement to be delivered to shareholders in connection with the Annual Meeting of Shareholders to be held on May 25, 2011 are incorporated herein by reference in Part II and Part III of this Annual Report on Form 10-K. Such proxy statement will be filed with the Securities and Exchange Commission within 120 days of the Registrant's fiscal year ended December 31, 2010.
Note About Forward-Looking Statements
Certain statements in this report, including that which relates to the impact on future revenue sources and potential sharing obligations of pending and future regulatory orders, continued expansion of the telecommunications network and expected changes in the sources of our revenue and cost structure resulting from our entrance into new communications markets, are forward-looking statements and are made pursuant to the safe harbor provisions of the Securities Litigation Reform Act of 1995. These forward looking statements generally are identified by the words "believe", "expect", "anticipate", "estimate", "intend", "should", "may", "will", "would", "will be", "will continue" or similar expressions. Such forward looking statements involve known and unknown risks, uncertainties and other factors that may cause actual results, performance or achievements of SureWest Communications to be different from those expressed or implied in the forward-looking statements. A detailed discussion of these and other risks and uncertainties that could cause actual results and events to differ materially from such forward–looking statements is included in the section entitled "Risk Factors" (refer to Part I, Item 1A). We disclaim any intention or obligation to update or revise publicly any forward-looking statements.
Item 1. Business. (Dollars in thousands, except per share amounts)
General Development of Business
SureWest Communications (the "Company", "we" or "our") is a California holding company with operating subsidiaries that provide a wide range of telecommunications, digital video, Internet, data and other facilities-based communications services in Northern California, primarily in the greater Sacramento region ("Sacramento region"), and in the greater Kansas City, Kansas and Missouri areas ("Kansas City area"). We were incorporated under the laws of the State of California in 1995, and through our predecessor we have operated in the telecommunications business since 1914.
As of December 31, 2010, our operating subsidiaries included SureWest Broadband, SureWest TeleVideo, SureWest Kansas, Inc. (with its various direct and indirect subsidiaries, "SureWest Kansas" or the "Kansas City operations"), SureWest Telephone and SureWest Long Distance. SureWest Telephone has a competitive local exchange carrier division (the "SureWest CLEC") which was authorized by the California Public Utilities Commission ("CPUC") in 1998 to provide telecommunications services in areas outside the telephone service area of SureWest Telephone, but it is not a separate subsidiary. The SureWest CLEC is reported in the Broadband segment.
Our strategy is to be the first choice as an integrated communications provider in the Sacramento region and Kansas City area. We seek to achieve this position by leveraging our existing advanced fiber network to extend our operations throughout Sacramento, Placer and adjacent counties in California and by providing superior customer service and integrating our systems, products and operating functions in the Kansas City area.
We have two reportable business segments: Broadband and Telecommunications ("Telecom"). The Telecom segment includes the Incumbent Local Exchange Carrier ("ILEC") operations of SureWest Telephone and SureWest Long Distance. The Broadband segment includes substantially all of the rest of
1
our operations. The table that follows reflects the percentage of total operating revenues generated by each of our two business segments for the last three fiscal years:
| |
% of Total Operating Revenues | |||||||||
|---|---|---|---|---|---|---|---|---|---|---|
| Reporting Segment | 2010 | 2009 | 2008 | |||||||
Broadband |
72% | 67% | 59% | |||||||
Telecom |
28% | 33% | 41% | |||||||
Total operating revenues |
100% | 100% | 100% | |||||||
All telecommunications providers continue to face increased competition. As a result of technology changes and industry, legislative and regulatory developments, we too continue to face new competitive challenges. In recent years, changes in the legislative and regulatory environment have provided us with significant growth opportunities in our Broadband segment. As indicated by the table above, our Broadband segment has grown to contribute the majority of our total operating revenues. We anticipate Broadband revenues will continue to increase and will offset the anticipated decline of Telecom segment revenues.
The Telecom segment provides wholesale access services through the use of its network to the Broadband segment, which enables the Broadband segment to offer high-speed Internet, Voice-over-Internet-Protocol ("VoIP") services and video services to those customers within SureWest Telephone's service area. These wholesale services are included as intersegment revenues and expenses in each of the respective segments and eliminated in the consolidated statements of income.
No customer accounted for more than 10% of our consolidated operating revenues during the years ended December 31, 2010, 2009 and 2008.
Our products or services that generated 10% or more of our total operating revenues in any of the last three years are as follows:
| |
Total Operating Revenues | |||||||||
|---|---|---|---|---|---|---|---|---|---|---|
| |
2010 | 2009 | 2008 | |||||||
Broadband residential data service |
$ | 48,878 | $ | 45,061 | $ | 39,966 | ||||
Broadband residential video service |
$ | 49,139 | $ | 47,522 | $ | 38,520 | ||||
Broadband residential voice service |
$ | 26,461 | $ | 25,897 | $ | 20,619 | ||||
Broadband business service |
$ | 46,209 | $ | 39,554 | $ | 33,077 | ||||
Telecom residential service |
$ | 17,276 | $ | 24,504 | $ | 32,464 | ||||
Telecom business service |
$ | 34,160 | $ | 35,457 | $ | 38,066 | ||||
Telecom access service |
$ | 16,895 | $ | 19,727 | $ | 23,732 | ||||
A summary of net operating revenues from external customers, income from continuing operations, assets and capital expenditures for each of the business segments can be found in Note 12 in the Notes to Consolidated Financial Statements, in Item 8, which is incorporated herein by reference. A discussion of factors potentially affecting our operations is set forth in "Risk Factors" in Item 1A, which is incorporated herein by reference.
As of December 31, 2010, we employed approximately 818 employees, an approximate 8% decline compared to December 31, 2009. The year-over-year decrease in the number of employees was primarily due to a workforce reduction initiative that eliminated approximately 60 positions during 2010. None of our employees are represented by a union. We believe our employee relations are positive.
2
Broadband
General
The Broadband segment includes SureWest Broadband, SureWest TeleVideo, SureWest Kansas and the SureWest CLEC. As of December 31, 2010, the Broadband segment had 104,100 residential subscribers and 236,100 Revenue-generating units ("RGUs").
The Broadband segment utilizes fiber-to-the-home ("FTTH") and fiber-to-the-node ("FTTN") networks in portions of the Sacramento region and Kansas City area to offer bundled residential and commercial services that include Internet protocol ("IP")-based digital and high-definition television, high-speed Internet, VoIP and local and long distance telephone. We continue to expand the use of optical fiber in our networks.
Our advanced telecommunications network gives us a competitive edge that enables us to provide our customers with high data speeds for Internet service and to deploy multiple services of superior quality. Technology changes have fostered the development of a wide range of alternatives to traditional telephone and cable television services. Our advanced telecommunications network gives us the ability to respond to the emerging trends and evolution of our customers' expectations for voice communications and the distribution and viewing of video programming.
In February 2008 we acquired 100% of the issued and outstanding stock of Everest Broadband, Inc. ("Everest" or "SureWest Kansas" or the "Kansas City Operations") for a total purchase price of $181,459, including transaction costs. Subsequent to the acquisition, the Kansas City operations have been included in our Broadband segment and consolidated results of operations. SureWest Kansas is a competitive provider of high-speed data, video and voice services in the Kansas City area. The addition of our Kansas City operations accelerates our growth strategy and has positioned us as a premier provider of network services to residential and business customers in the markets we serve there, as well as in California.
During 2008, SureWest TeleVideo possessed authorizations to serve areas of Sacramento and Placer counties and the cities of Roseville and Lincoln, California. SureWest TeleVideo has expanded its services into previously licensed areas of Elk Grove and Natomas, California as well as to other areas within its service area footprint. We are authorized to provide video programming to substantially all of the residents in the SureWest Telephone service area.
In 2006, the California legislature adopted California Assembly Bill No. 2987, the Digital Infrastructure and Video Competition Act of 2006 ("DIVCA"), which requires providers of multichannel video services to obtain a state franchise instead of a local franchise, and to replace local franchises with state franchises as they expire. DIVCA also accommodates video service delivery in areas that are smaller than an entire municipality. On January 1, 2009, the various local cable television franchises of our subsidiaries in California were replaced with a single California state video franchise that covers our currently served areas plus areas in which we have considered future network expansion.
Our Kansas City operations possess local or state cable television and/or telecommunications franchises covering the cities of Lenexa, Merriam, Olathe, Overland Park, Prairie Village and Shawnee, in Kansas; and they also hold a Federal Communications Commission ("FCC") Open Video System certification for parts of Kansas City, Missouri.
SureWest Broadband procures digital transport capability through a wholesale access agreement with its affiliate, SureWest Telephone, and also through agreements with other carriers. With SureWest TeleVideo, it has developed an advanced method of delivering video services to subscribers in the Sacramento region using IP, or IP-video capability.
3
Competition
All of the businesses in the Broadband segment are subject to extensive competition. Competition has grown dramatically in recent years. Except for the multichannel video delivery business, which requires significant capital investment to serve customers, the barriers to entry are not high, and technology changes force rapid competitive adjustments.
We compete against AT&T, Comcast, Frontier, Wave Broadband, DirecTV, Dish and other companies in the Sacramento region. We compete against Comcast, Time Warner Cable, AT&T, DirecTV, Dish and a number of smaller companies in the Kansas City area.
Numerous wireless carriers also compete against our subsidiaries in the telecommunications business. Most of our wireless competitors now offer Internet and data connectivity, and they are increasing their capabilities in delivering video.
We have found that we can be successful against these competitors by constantly seeking out new sales opportunities in attractive geographic locations and market segments, by maintaining a highly reliable network that is accessible to new customers and by focusing on the provision of excellent service to our customers. To the extent permitted by law and regulatory requirements, we seek to operate our business across the Broadband segment in an integrated manner and to run our network as a single integrated facility in each region. The operating units in this segment benefit within the Sacramento region from the name recognition and reputation of SureWest, and from the active participation of our executives and employees in civic and other groups.
In most cases, we have entered the cable television service markets as the operator of a second (or subsequent) cable system. While we will benefit from the somewhat reduced regulation that such entrants enjoy, we nevertheless face the challenge of drawing customers away from the incumbent cable service provider. The provision of cable television over a closed transmission path has been recognized as possessing certain monopoly characteristics and, therefore, the ability of a second or subsequent provider to succeed in the marketplace is not assured. Similarly, the possession of comparatively greater size and scale can give an incumbent cable competitor an advantage in both access to and pricing of the program content needed to operate a cable television business. Comcast (in California and in parts of the Kansas City area) and Time Warner (in the Kansas City area) each possess significantly greater size and scale than the Company.
Regulation
We operate businesses that are regulated on the Federal, state and local levels.
The most recent comprehensive revision of the nation's primary law governing telecommunications and cable television occurred in 1996, when the Telecommunications Act of 1996 was enacted. This law amended the Communications Act of 1934 and significantly altered the regulatory structure for telecommunications providers. It also has directly and indirectly changed the environment for cable television and Internet providers. Current state and Federal laws and regulations that are applicable to our subsidiaries actively promote competition, but in most cases, maintain varying degrees of regulation as well.
Some level of regulation also is exerted over our subsidiaries by agencies other than the FCC and the state commissions. For example, the Federal Trade Commission ("FTC") has asserted jurisdiction over certain aspects of Internet sales and marketing and the use and misuse of customer information by providers of goods and services.
The FCC was directed by Congress to develop a National Broadband Plan ("NBP") as part of the American Recovery and Reinvestment Act of 2009. In March 2010, after taking extensive public comment, the FCC released the full text of its NBP, which contains policy recommendations on a variety of issues that
4
the FCC has linked to expanded broadband deployment. The policy recommendations include guiding principles to foster competition in broadband, telephone, wireless and cable services over the next decade, including recommendations related to universal service fund ("USF") reform, intercarrier compensation, cable set-top boxes and spectrum reallocation, among others. The NBP recommendations most relevant to the Company include shifting the current USF mechanisms that support universal voice telephone services to support of universal broadband deployment and the phased reduction of intercarrier access compensation levels, with a potential phase-out of all such compensation within ten years. Some of these recommendations only restate pre-existing FCC proposals in current rulemakings while others raise new issues. The FCC has begun some proceedings to implement aspects of the NBP.
In an April 6, 2010 decision, a Federal appeals court found that the FCC lacked authority over certain Internet-related practices of Comcast. This decision came during a proceeding that had been initiated by the FCC to adopt rules related to the conduct of providers of retail Internet services. Notwithstanding the Federal appeals court decision, on December 21, 2010, the FCC adopted rules requiring that such providers honor certain operating principles, including principles of (i) transparency, (ii) no blocking, (iii) no unreasonable discrimination and (iv) reasonable network management in connection with their Internet services. The FCC order has already been appealed.
In addition, the FCC initiated action on February 8, 2011 to again consider reform of the current structure for intercarrier compensation and to consider rules for transitioning the current universal service fund to support broadband deployment. The FCC's actions in these and future proceedings could significantly alter the structure of these arrangements, and affect the costs and sources or revenue for affected service providers. Action in any of these proceedings could have a material impact on us. We will continue to monitor these matters, participate in them as we deem appropriate, and assess the potential impact on our consolidated financial position and results of operations.
The following narrative summarizes the primary regulatory issues affecting the telecommunications, video services and Internet services of our subsidiaries in the Broadband segment:
Telecommunications
Our subsidiaries that provide telecommunications services are subject to varying degrees of Federal and state regulation. They are also subject to local government regulation in some cases.
The FCC has jurisdiction over services and facilities that are interstate in nature, and it can also regulate in other circumstances where it has been given statutory authority to act, including through preemption. State commissions have jurisdiction over most matters that are exclusively intrastate in nature, except for certain matters preempted by the FCC. Telecommunications regulation by local governmental units is generally limited to matters involving the use of local streets and rights of way. Our Kansas City operations hold certain local telecommunications franchises, for example.
The FCC and the state commissions do not regulate all providers that come under their jurisdiction in the same way. Incumbent Local Exchange Carriers ("ILECs") remain more highly regulated. While some regulation of ILECs has eased as competition has increased, that regulation remains more burdensome than the regulation of other telecommunications providers.
Almost all other providers of regulated services, including local competitors to ILECs, are typically subjected to lighter regulation. This lighter regulation is sometimes characterized as "non-dominant" regulation. The basis for this asymmetric form of regulation lies in the determination that these other firms do not possess market power in the provision of services, and as a result will be regulated effectively by market forces. SureWest Telephone is regulated as an ILEC, but our subsidiaries in the Broadband segment are all regulated as non-dominant providers of telecommunications services.
The nature and extent of regulation by the FCC and by state commissions is constantly evolving as a result of ongoing events, changes in public policy, initiatives by carriers and customer interest groups, judicial
5
decisions and other factors. The application of some rules that were once reserved for comprehensively regulated providers alone has now been expanded in some cases to cover lightly regulated companies as well. Examples include the expansion of 911 access obligations, network outage reporting, protection of customer privacy and compliance with the Communications Assistance for Law Enforcement Act.
Among our subsidiaries in the Broadband segment, the following addresses the nature of their regulation:
SureWest CLEC, SureWest TeleVideo, and SureWest Kansas each offer telecommunications services, and when engaged in providing telecommunications, each is subjected to a lighter form of regulation than ILECs face. In addition, regulations that are intended to promote the growth of competition and that are restrictive when applied to ILECs may actually be of benefit to these subsidiaries. For example, a mandatory resale requirement applied to AT&T in California and/or Kansas allows the SureWest CLEC and our Kansas City operations to gain access to special access services and other connections that can be used in the provision of services to our customers.
Ongoing proceedings at the FCC and at the state level are addressing a number of critical telecommunications issues within their respective jurisdictions. A number of these proceedings have been active for many years. Others were newly instituted in 2010. Some of the issues being addressed include the nature of interconnection between different types of networks; the pricing of access and interconnection; the regulation of special access services; the interrelationship between traditional circuit switched telephone services and newer services that use IP and other advanced technologies and standards; the treatment of VoIP; the manner in which broadband services can be made more widely available; the nature and extent of any rules and regulations dealing with the provision of Internet access services, including rules requiring nondiscrimination in the treatment of applications providers; the future of the various Federal and state universal service support funds and the mechanisms that support them; the structure of intercarrier compensation and the future direction and organization of the agency itself. During calendar year 2009, Congress passed legislation making funding available for the expanded deployment of broadband services in certain areas of the country. Some of that funding may be made available to our competitors, allowing them to invest in facilities in defined underserved areas, and helping them to directly or indirectly finance competitive activities. Even if the areas are not areas in which we do business, the availability of Federal funding can free up other capital funds for use in areas in which we compete. The implementation of the broadband program by the FCC and the National Telecommunications and Information Administration is ongoing. The impact of some of these proceedings on the ILEC is separately discussed below under Telecom–Regulation.
Common carriers activities are generally exempt by law from direct FTC regulation, but carriers can be subject to FTC regulation to the extent that they offer non-common carrier services. The FTC's interest in telecommunications and related issues appears to have increased recently, particularly in areas related to privacy.
Video Services
Our cable television subsidiaries each require a state or local franchise or other authorization in order to provide cable service to customers. Each of these subsidiaries is subject to regulation under a framework first added to the Communications Act as Title VI in 1984, substantially amended in 1992 and further amended by the Telecommunications Act of 1996.
Under this framework, the responsibilities and obligations of franchising bodies and cable operators have been carefully defined. The law addresses such issues as the use of local streets and rights of way; the carriage of public, educational and governmental channels; the provision of channel space for leased commercial access; the amount and payment of franchise fees; consumer protection; the enforcement and/or termination of a franchise; and similar issues. In addition, Federal laws place limits on the common ownership of cable systems and competing multichannel video distribution systems, and on the common ownership of cable systems and local telephone systems in the same geographic area. Many provisions of
6
the Federal law have been implemented through FCC regulations. These matters are subject to ongoing oversight by the FCC. The FCC has expanded its oversight and regulation of the cable television-related matters recently. In some cases, FCC action has created opportunities for the Company against incumbent cable operators.
The Telecommunications Act of 1996 also added to the Communications Act a number of provisions addressing the implementation and operation of open video systems ("OVS"). An OVS is a form of multichannel video delivery that is distinct from a traditional cable television delivery system and Congress identified a distinct regulatory structure to be applied to it. OVS were intended to accommodate unaffiliated providers of video programming on the same network. The OVS regulatory structure also offered a means for a single provider to serve less than an entire community. Our Kansas City operations in Missouri utilize an OVS that allows us to operate in only a part of Kansas City.
A number of state and local provisions also affect the operation of our cable systems. The enactment of DIVCA in California sought to encourage further the entrance of telephone companies and other new cable operators to compete against the large incumbent cable operators. DIVCA changed preexisting California law to require new franchise applicants to obtain franchise authorizations on the state level. In addition, DIVCA established a general set of state-defined terms and conditions to replace numerous terms and conditions that had applied uniquely in local municipalities, and it repealed a state law that had prohibited local governments from adopting terms for new competitive franchises that differed in any material way from the incumbent's franchise, even if competitive circumstances were very different. Some portions of this law are also available to incumbent cable operators with existing local franchises who compete against us.
A state franchising law also has been enacted in Kansas. While these laws have reduced franchise burdens on our subsidiaries, and have made it easier for them to seek out and enter new markets, they also have reduced the entry barriers for others who may want to enter our cable television markets.
Federal law and regulation also affects numerous issues related to video programming and other content.
Under Federal law, certain local television broadcast stations (both commercial and non-commercial) can elect, every three years, to take advantage of rules that require a cable operator to distribute the station's content to the cable system's customers without charge, or to forego this "must-carry" obligation and to negotiate for carriage on an arm's length contractual basis, which typically involves the payment of a fee by the cable operator, and sometimes involves other consideration as well.
If the station and the cable operator can come to an agreement, the station grants "retransmission consent" for the term of the agreement, typically for the entire three year period. The current three-year cycle commenced on January 1, 2009. Fees under retransmission consent agreements generally underwent marked increases for the 2009-2011 period. New three-year elections will occur in late 2011 and would generally apply for the 2012-2014 period. We expect stations again to seek significantly higher fees for retransmission consent rights covering this period.
Federal law and regulation regulate access to certain programming content that is delivered by satellite. The 1992 amendment to the Communications Act put in place a ban on exclusive contracts between cable operators and certain affiliated satellite programmers. The ban has been extended by the FCC until October 5, 2012. It will expire at that time unless it is extended again. The FCC recently adopted an order banning exclusive contracts between affiliates where the programming is sent via terrestrial media, and banning certain other unfair acts, making it clear that the withholding of regional sports programming and high definition television programming by content affiliates of incumbent cable operators would receive special attention. Unlike the satellite provisions, the new rules would not expire. The FCC's order is under appeal and a decision in this matter is anticipated during 2011.
In connection with the FCC's approval of a cable transaction involving Comcast and Time Warner in July 2006, the parties' regional sports networks also remain subject to certain program access rules until July
7
2012. In early 2010, Comcast proposed to enter into a joint venture with NBC Universal, through which it would acquire control of numerous NBC properties, including both broadcast and cable television programming operations of NBC. In early 2011, the FCC and the Department of Justice ("DOJ") approved the transaction, with a significant number of conditions related to program access and carriage, non-discrimination, bundling and the relationship of the joint venture to emerging on-line competition. Most of the conditions will have a duration of seven years. A few of the conditions are marginally favorable for the Company's cable operations, in part because they would qualify as small cable operators. The FCC and DOJ conditions may give the Company additional options in bargaining for video programming content licenses with the joint venture, and promote more equal treatment in comparison with larger cable competitors. Other conditions relate to the continued independence of the NBC operations from Comcast in dealing with cable operators on certain issues, as well as the expansion of content alternatives in a number of areas that may ultimately become available to the Company.
The contractual relationships between cable operators and most providers of content who are not television broadcast stations generally are not subject to FCC oversight or other regulation. The majority of providers of content to our subsidiaries, including content providers affiliated with incumbent cable operators such as Comcast, but who are not subject to any FCC or DOJ conditions, do so through arm's length contracts where the parties have mutually agreed upon the terms of carriage and the applicable fees.
The transition to digital television ("DTV") has led the FCC to adopt and implement new rules designed to ease the shift. These rules can be expected to make broadcast content more accessible over the air to smartphones, personal computers and other non-television devices. Local television broadcast stations will also be able to offer more content over their assigned digital spectrum after the DTV transition, including additional channels. The FCC is considering whether it should modify its must carry rules to cover any new digital channels offered by local television broadcast stations entitled to must carry treatment. This could cause additional costs and compliance burdens for cable operators, including our cable subsidiaries.
The Company continues to monitor the emergence of video content options for customers that have become available over the Internet, and that may be made available free, by individual subscription or in conjunction with a separate cable service agreement. In some cases, this involves the ability to watch episodes of desirable network television programming and to procure additional content related to programs carried on linear cable channels. These options have increased significantly, and can lead cable television customers to terminate or reduce their level of services. At this time, these "over-the-top" programming options do not purport to duplicate the nature or extent of desirable programming carried by cable systems, and the market is still comparatively nascent, but in light of changing technology and events such as the Comcast-NBC transaction, the "over-the-top" market will continue to grow and evolve rapidly.
Cable operators depend to some degree upon their ability to utilize the poles (and conduit) of electric and telephone utilities. The terms and conditions under which such attachments can be made were established in the Federal Pole Attachment Act of 1978, as amended. The Pole Attachment Act outlined the formula for calculating the fee to be charged for the use of utility poles, a formula that assesses fees based on the proportionate amount of space assigned for use and an allocation of certain qualified costs of the pole owner. The FCC has put in place a structure for pole attachment regulation that has covered cable operators and other types of providers. A proceeding is currently pending in which the FCC proposes to examine its current formula and to determine whether a single rate should apply equally to all providers who use poles, whether they are cable operators, telecommunications providers, or Internet providers, even if they use the attachment to offer more than one service. States have the option to opt out of the Federal formula and to regulate pole attachments independently. Kansas and Missouri follow the FCC pole attachment framework. California has elected to separately regulate pole attachments and pole attachment rates. FCC action may affect the rates paid for pole attachments by our Kansas City operations, and may indirectly affect the way in which the state of California regulates pole attachments. It also could increase our costs for such attachments.
8
Cable operators are subject to longstanding cable copyright obligations where they pay copyright fees for some types of programming that are considered secondary retransmissions. The copyright fees are updated from time to time, and are paid into a pool administered by the United States Copyright Office for distribution to qualifying recipients.
There are numerous other regulations applicable to cable operators and/or to cable systems that apply in diverse ways. For example, the FCC has adopted a rule that governs the disposition of inside wiring installed by a cable operator in multiple dwelling units when another cable provider seeks to serve a customer there. The FCC also has invalidated exclusivity provisions in agreements between multiple dwelling unit owners and cable providers (the FCC is still considering proposals to prohibit related exclusive marketing agreements and bulk billing arrangements altogether). The FCC also has adopted rules to promote the use of plug-and-play televisions and to eliminate the need for set top boxes, but is reassessing its policies in light of rapid changes in technology and the emergence of broadband access to video content through the Internet.
The FCC has so far declined to require that cable operators allow unaffiliated Internet service providers to gain access to customers by using the network of the operator's cable system. The FCC also has considered the benefits of a requirement that cable operators offer programming on their systems on an a la carte or themed basis, but to date has not adopted regulations requiring such action. These matters may resurface in the future, particularly as the "over-the-top" market grows. In light of the fact that programming is increasingly being made available through Internet connections, some cable operators have considered their own a la carte alternatives. Content owners with linear channels also are moving toward greater "on demand" programming, offerings that maintain the value of their linear channels for customers.
The outcome of pending matters cannot be determined at this time but can lead to increased costs for the Company in connection with our provision of cable services, and can affect our ability to compete in the markets we serve.
Internet Services
During 2010, SureWest TeleVideo, SureWest CLEC and our Kansas City operations provided retail Internet services, and/or facilities for the transport of Internet services.
The provision of Internet access services is not significantly regulated by either the FCC or the state commissions. However, the FCC has been moving toward the imposition of some controls on the provision of Internet access. In 2002, in part to place cable modem service and Digital Subscriber Line ("DSL") service on an equal competitive footing, the FCC asserted jurisdiction over these services as "information services" under Title I of the Communications Act, and removed them from treatment under Title II of the Act, but to date it has not determined what regulatory framework, if any, is appropriate for Internet services under Title I.
The FCC has also adopted policy principles to signal its objectives with respect to high speed Internet and related services. These principles are intended to encourage broad customer access to the content and applications of their choice, to promote the unrestricted use of lawful equipment by users of Internet services and to promote competition among providers. Some parties have sought action by the FCC to convert these policy principles to formal rules.
The FCC has used its authority in individual Internet-related situations through ad hoc decision making. For example, it has fined providers who have engaged in network management practices that affect, and in some cases restrict, customers' use of the Internet or their access to content. In 2009, the FCC proposed to enact rules related to Internet access services, relying in part on the policy principles that it had earlier adopted, but expanding their reach and adding additional provisions. The adoption of the rules as they have been proposed would prohibit discrimination with respect to applications providers, among other things, subject to reasonable network management by an Internet access service provider.
9
The Federal appeals court decision in April 2010 reassessed the FCC's authority over Internet services under the Communications Act, and invalidated action taken by the FCC that was based on authority that the FCC thought it possessed. The FCC continues to evaluate its jurisdictional options in light of this decision, and it has continued to assert jurisdictional authority in some areas related to the promotion of an open Internet. Its adoption of rules in this regard in December 2010, has been appealed to a Federal appeals court. The extent of the FCC's jurisdiction in connection with the Internet will not be resolved for some time. The Company is unable to predict the outcome of current proceedings.
The FTC is currently assessing certain advertising and marketing practices of Internet-related companies. A recent FTC report encourages disclosure by providers about the way in which search-related information of a consumer may be used for targeted marketing of goods and services, and further encourages these providers to obtain prior consent from consumers for such use. It also has issued a report promoting options for Internet users to prohibit the tracking of their usage. It is currently unclear whether the FTC initiatives will lead to new rules or new law.
The outcome of pending matters cannot be determined at this time but can lead to increased costs for the Company in connection with our provision of Internet services, and can affect our ability to compete in the markets we serve.
Telecom
General
The Telecom segment includes SureWest Telephone and SureWest Long Distance, which provide landline telecommunications services, wholesale access services, domestic and international long distance services and certain non-regulated services. The services provided by the subsidiaries in this segment are available only in the Sacramento region. SureWest Telephone, which is the principal operating subsidiary of the Telecom segment, provides local services, regional toll telephone services, network access services and certain non-regulated services. Some services are provided through connections with other carriers serving adjacent areas, including AT&T, and also through service agreements with numerous interexchange carriers, including national interexchange carriers. SureWest Long Distance provides long distance services. Revenues from this segment have decreased as a percentage of our consolidated revenues from continuing operations over the past several years due to declining voice RGUs (and a corresponding reduction in the use of services) and most recently, the acquisition of Everest, which is included in the Broadband segment. In addition, many customers are choosing to subscribe to our Broadband Digital Phone offering instead of the traditional circuit-switched phone service offered by SureWest Telephone. Despite these events, we expect this segment to continue to provide a large proportion of our earnings in 2011.
The Telecom segment will continue to experience decreases in access revenues through 2011 due to scheduled reductions in California High Cost Fund ("CHCF") subsidies and the elimination of transport interconnection revenue effective January 1, 2011. We anticipate Telecom revenue declines to slow over the next several years with the completion of the phased subsidy reductions. Despite these events, during 2011 we expect this segment to continue to generate the majority of our income from continuing operations.
SureWest Telephone continues to benefit from past investments to enhance the copper network and build an advanced fiber network, creating a next-generation platform. Through our network, we offer services such as fiber-optics-based high-speed Internet, customized data and Ethernet transport services, data center and disaster recovery solutions, traditional landline and scalable IP communications platform. As a result, declines in business revenues have slowed as the climate for small and medium sized businesses begins to stabilize. Additionally, we supply wholesale access and DSL services through our network to the Broadband segment, enabling them to offer high-speed Internet, VoIP, video and wireless backhaul
10
services to customers within the Telecom service territory. The expansion of the Broadband segment customer base and backhaul services has caused wholesale revenues to grow over the past three years.
SureWest Telephone operates as an ILEC with a service area of approximately 83 square miles, covering Roseville and Citrus Heights, California, and adjacent areas in Placer and Sacramento Counties. We hold a non-exclusive perpetual franchise granted by Section 7901 of the California Public Utilities Code. The area served by SureWest Telephone has been one of the most rapidly growing areas in California during the past two decades causing it to attract new competitors, but the pace of growth has slowed in recent years as the area has become more developed and as the economy has moved through a recession.
SureWest Telephone provides services to residential, business and carrier customers, and continues to be subject to the competitive and regulatory challenges faced by ILECs both nationally and in California. As a result of competitive pressures, SureWest Telephone experienced a 25% decrease in voice RGUs and a 7% decline in business customers from December 31, 2009 to December 31, 2010. As of December 31, 2010, SureWest Telephone served approximately 28,900 voice RGUs and approximately 7,900 business customers. We believe that the economic downturn in the area in recent years, expanding competition and service substitution have impacted, and will continue to reduce, the number of voice RGUs and business customers.
SureWest Long Distance offers intrastate, interstate and international long distance services, including calling card and 800 services. SureWest Long Distance is a resale business that utilizes other national and international carriers for wholesale transport, switching and other capabilities. SureWest Long Distance maintains agreements with Sprint Communications Company L.P. and Level 3 Communications, LLC to diversify its risks related to its wholesale providers. The rates offered to SureWest Long Distance by these companies are competitive; however, changes in the wholesale marketplace in the recent past have provided recurring opportunities to long distance resellers to further reduce their costs.
Competition
In recent years, competition to serve customers in the SureWest Telephone service area has increased significantly. SureWest Telephone competes against AT&T and a number of other certificated carriers, Comcast and numerous other companies in both the business and residential telecommunications and information transport markets in its telephone service area. Its competitors offer traditional telecommunications services as well as IP-based services and other emerging data-based services. Some competitors have extended their own network facilities in the SureWest Telephone service area. Changes in technology have made it possible for customers to receive services in new ways at competitive rates. To meet the competition, SureWest Telephone has responded in part by introducing new services and service "bundles", offering services in convenient groupings with package discounts and billing advantages and by investing in its network and business operations. Changing technology requires that we continue to adapt our network and the manner in which we provide service. Within our telephone service area, services are provided over an integrated network making extensive use of optical fiber. SureWest Telephone deploys fiber optic facilities to broaden the reach and capacity of our services requiring additional bandwidth. In some instances, fiber optics is deployed directly to a customer's premises. Because bandwidth is limited by distance when utilizing copper facilities, we are also deploying equipment throughout our service area to enable the improved provision of services over copper. Certain of our facilities take advantage of IP, which allows for more efficient use of bandwidth.
See Item 7–"Management's Discussion and Analysis of Financial Condition and Results of Operations" for further discussion regarding SureWest Telephone's revenues that are subject to the competitive environment in which SureWest Telephone operates.
We anticipate that our businesses will continue to experience competition and that the nature and extent of such competition will increase. Competitors to the SureWest Telephone business include competitive local exchange carriers, interexchange carriers (including interexchange carriers which serve customers directly
11
without using facilities of local exchange carriers), traditional video providers expanding into voice and data services, wireless service providers, providers of IP-based calling services (including SureWest Broadband), customers which are telecommunications self-providers and a range of other providers that specialize in certain niche areas of telecommunications. Technology change has accelerated the pressure on established carriers, including SureWest Telephone, by virtue of software-defined businesses and innovations related to packet switching and the use of the Internet and IP capabilities.
Regulation
Some of the general aspects of telecommunications regulation on the Federal and state levels are outlined above in the discussion of regulation as it applies to the Broadband segment. SureWest Telephone, as an ILEC, is subject to significant regulation by both the CPUC and the FCC. In particular, SureWest Telephone's revenues are influenced greatly by the actions of the CPUC and the FCC. However, since SureWest Telephone is not a retail provider of Internet access service, the FCC's actions to regulate certain aspects of how Internet service is made available are expected to have little direct impact on it.
Intrastate telecommunications service rates of SureWest Telephone are subject to regulation by the CPUC. The provision of access to the networks of interexchange carriers for long distance calling is governed by access tariffs and by intercarrier agreements, which are subject to the jurisdiction of the CPUC or FCC, or both, depending upon the nature of the transmissions. SureWest Telephone has a tariff on file with the FCC for all elements of interstate access services except carrier common line charges, for which SureWest Telephone concurs with the tariff of the National Exchange Carrier Association.
The characterization of traffic as interstate or intrastate, and as a telecommunications or information service has been a significant source of dispute among carriers and others in recent years, as those characterizations can impact the regulatory treatment of the traffic and the payment obligations of the providers which are involved. The characterization of: (i) traffic involved in intercarrier interconnection, (ii) Internet traffic and (iii) traffic that utilizes IP and other transmission technologies are examples of issues that are currently subject to analysis on the state and federal levels, and that are expected to be subject to regulatory action in the future. Both the FCC and CPUC have initiated proceedings to evaluate the appropriate level of regulation for providers of telecommunications services and for IP-enabled services. In addition, various proceedings at the FCC are pending that could lead to significant alteration of the existing compensation arrangements among providers of telecommunications services, and that could adversely impact the amount of the payments we receive from carriers and others for use of our network.
The FCC monitors SureWest Telephone's interstate earnings through the use of annual cost separation studies prepared by SureWest Telephone, which utilize estimated cost information and projected demand usage. The FCC establishes rules that carriers must follow in the preparation of the annual studies. Additionally, under current FCC rules governing rate making, SureWest Telephone is required to establish interstate rates based on projected demand usage for its various services and determine the actual earnings from these rates once actual volumes and costs are known.
With respect to its regulatory authority over SureWest Telephone's rates, the CPUC also has the power, among other things, to establish terms and conditions of intrastate service, to prescribe uniform systems of accounts and to regulate the mortgaging or disposition of public utility properties.
A CPUC decision in August 2005 allowed SureWest Telephone to continue receiving our $11,500 annual interim draw from the CHCF. The CHCF was previously authorized by the CPUC to offset SureWest Telephone's intrastate regulated operating expenses on an interim basis. In August 2006, we requested permission from the CPUC to implement a graduated phase-down of our annual $11,500 interim draw. In September 2007, the CPUC issued Decision 07-09-002 which provides for SureWest Telephone to phase-down its interim annual CHCF draw over a five-year period. The phase-down of the interim draw
12
began in January 2007, initially reducing the annual $11,500 interim draw to $10,200, and in each subsequent year will be incrementally reduced by $2,040.
In an ongoing proceeding relating to the New Regulatory Framework (under which SureWest Telephone has been regulated since 1996), the CPUC adopted Decision 06-08-030 in 2006, which grants carriers broader pricing freedom in the provision of telecommunications services, bundling of services, promotions and customer contracts. This decision adopted a new regulatory framework, the Uniform Regulatory Framework ("URF"), which among other things (i) eliminates price regulation and allows full pricing flexibility for all new and retail services except basic residential services, which could only be raised up to $3.25 per year for 2009 and 2010 as described below, (ii) allows new forms of bundles and promotional packages of telecommunication services, (iii) allocates all gains and losses from the sale of assets to shareholders and (iv) eliminates almost all elements of rate of return regulation, including the calculation of shareable earnings. On September 18, 2008, the CPUC adopted Decision 08-09-042, which allows URF ILECs to increase their basic residential rate by up to $3.25 per year over the next two years. Beginning January 1, 2011, the URF ILECs are allowed full pricing flexibility for the basic residential rate. On December 31, 2010, the CPUC issued a ruling to initiate a new phase to assess whether, or to what extent, the level of competition in the telecommunications industry is sufficient to control prices for the four largest ILECs in the state, including SureWest Telephone. The CPUC's actions in this and future proceedings could lead to new rules and an increase in government regulation.
In December 2007, the CPUC issued a final decision in a proceeding investigating the continued need for an intrastate access element called the transport interconnection charge ("TIC"). The final decision capped SureWest Telephone's intrastate access charges through 2010 and the TIC was eliminated effective January 1, 2011. SureWest Telephone will have an opportunity to recover all or part of our lost TIC revenue elsewhere, including residential rate adjustments, as well as through growth of our Broadband segment. We anticipate a reduction in our 2011 intrastate access revenues of approximately $2,050.
These actions of the CPUC and of the FCC, as noted above, can affect the rates charged for access and interconnection, and, as a result, the revenues we derive from access and related services. SureWest Telephone's future operations also may be impacted by other proceedings at the FCC and CPUC, including proceedings that address interstate access and other rates and charges, the nature of interconnection between ILEC carriers and others, the collection and distribution of support payments required to assure universal access to basic telephone services, the charges that can be assessed for new forms of service that directly or indirectly utilize carrier networks, the expansion of broadband services, the treatment of Internet access and VoIP services as telecommunications or information services under the Communications Act and the promotion of Internet openness (sometimes characterized as network neutrality). The general nature of regulation of telecommunications companies, including SureWest Telephone, is also addressed above in the section captioned Broadband–Regulation.
The long distance business is recognized as being fully competitive and there are many providers of long distance services. Because of the level of competition, regulation of this area of the telecommunications business is light or has been removed altogether. Where it exists, regulation is focused on specific public policy concerns, such as customer account slamming and other consumer protection issues, rather than the rates, terms and conditions of service.
The FCC has opened a number of investigative proceedings to establish policies and/or rules to maintain and promote universal service, to reform the structure of intercarrier compensation and to address the provision of broadband services. Further regulatory actions with respect to these matters may have a material impact on us. We will continue to monitor these matters and the potential effects on our consolidated financial position and results of operations.
13
Current Business Developments
Sale of Communication Tower Assets
In February 2009, we sold our fifty-two wireless communications towers ("Tower Assets") owned by our subsidiary West Coast PCS, LLC ("West Coast PCS") to Global Tower Partners. West Coast PCS was a component of our Broadband segment. The sale was completed for an aggregate cash purchase price of $9,222, resulting in a gain of $2,525, net of tax. Proceeds from the sale of the Tower Assets were used to repay a portion of outstanding long-term debt.
Sale of Wireless Assets
In May 2008, we completed the sale of the operating assets of our Wireless business, SureWest Wireless, to Verizon Wireless ("Verizon") for an aggregate cash purchase price of $69,746, resulting in a gain of $18,864, net of tax. Under the agreement, Verizon acquired the spectrum licenses and operating assets of SureWest Wireless, excluding our owned communication towers. SureWest Wireless was previously reported as a separate reportable segment.
Acquisition of Everest Broadband, Inc.
In February 2008, we acquired 100% of the issued and outstanding stock of SureWest Kansas Inc., formerly Everest Broadband, Inc. for a total purchase price of $181,459, including transaction costs. Subsequent to the acquisition, the Kansas City operations have been included in our Broadband segment and consolidated results of operations. SureWest Kansas is a competitive provider of high-speed data, video and voice services in the Kansas City area. The addition of our Kansas City operations accelerates our growth strategy and has positioned us as a premier provider of network services to residential and business customers in the markets we serve.
Executive Officers of the Registrant
Our executive officers are appointed by, and serve at the discretion of, our board of directors. Each executive officer is a full-time employee. There is no family relationship between any of our executive officers or directors. Our executive officers as of February 1, 2011 were as follows:
Steven C. Oldham; age 60; President and Chief Executive Officer
Mr. Oldham has served as President and Chief Executive Officer since January 2006 and as a member of the Board of Directors since 2004. Prior to joining the Company, Mr. Oldham served from 2002 to 2005 as a Senior Advisor for The Brattle Group, which provides consulting services in economics, finance and regulation. He also served as Senior Vice President, Energy Supply for Sierra Pacific Resources, where he worked for 27 years in various positions of increasing responsibility.
Fred A. Arcuri; age 58; Senior Vice President and Chief Operating Officer
Mr. Arcuri has served as Senior Vice President and Chief Operating Officer since January 2006. From 2002 to 2005, he served as Senior Vice President and Chief Operating Officer of SureWest Broadband, after being elected a Vice President in 2000.
L. Scott Sommers; age 53; Senior Vice President, Finance and Corporate Development
Mr. Sommers has served as Senior Vice President, Finance and Corporate Development since March 2008. Prior to his appointment to Senior Vice President, he served as Vice President, Treasurer since he joined the Company in 2006. Prior to joining the Company, Mr. Sommers served from 2005 to 2006 as Managing Director of Investment Banking for Cantor Fitzgerald. Before joining Cantor Fitzgerald, Mr. Sommers served as First Vice President for Mellon Financial from 1998 to 2005.
14
Scott K. Barber; age 50; Vice President and General Manager of Operations, California
Mr. Barber has served as Vice President and General Manager of Operations, California since March 2008. Prior to his appointment to General Manager of Operations, California, he served as Vice President, Network Operations from 2003 to 2008 and as Executive Director, Network Services from 2000 to 2003.
Dan T. Bessey; age 45; Vice President and Chief Financial Officer
Mr. Bessey has served as Chief Financial Officer since March 2008 after being appointed to Vice President, Finance in 2007. Prior to his appointment to Vice President, he served as Controller from 2003 to 2007 and as Director of Corporate Finance from 2000 to 2003.
Edwin B. Butler; age 47, Vice President, Sales
Mr. Butler was named Vice President, Sales in December 2009. Prior to his appointment to Vice President, he served as Executive Director, Business Sales Kansas since he joined the company in 2008 as part of our acquisition of Everest. Prior to joining the Company, Mr. Butler served as the Vice President, Business Solutions for Everest from 2002 to 2008.
Timothy J. Dotson; age 50; Vice President and Chief Information Officer
Mr. Dotson has served as Vice President, Chief Information Officer since March 2007. Prior to his appointment to Vice President, he served in various leadership roles with increasing responsibilities in Information Technology for over sixteen years with the Company. He served as Chief Information Officer from 2006 to 2007, Executive Director Information Technology Solutions from 2004 to 2006 and Information Technology Director from 2002 to 2004.
Peter C. Drozdoff; age 55; Vice President, Marketing
Mr. Drozdoff has served as Vice President, Marketing since 2002. From 2000 to 2002, he served as Executive Director, Corporate Marketing.
Kenneth E. Johnson; age 47; Vice President and Chief Technology Officer
Mr. Johnson was named Chief Technology Officer in November 2010. Prior to his appointment as Chief Technology Officer, he served as Vice President, General Manager of Operations, Kansas since February of 2008. Mr. Johnson joined the Company as part of our acquisition of Everest in 2008. Prior to joining the Company, Mr. Johnson served as the Chief Technology Officer for Everest from 2003 to 2008.
Karlyn S. Oberg; age 51; Vice President, Administration
Ms. Oberg has served as Vice President, Administration since September 2008. Prior to her appointment as Vice President, she served as Executive Director, Enterprise Initiatives from 2006 to 2008. She also served as Director of Investor Relations from 2005 to 2006 and as Director, ITS Program Office from 2003 to 2005.
Darla J. Yetter; age 50; Corporate Secretary
Ms. Yetter was elected Corporate Secretary in 2003. Since 1994, she has served as Assistant to the President.
Available Information
Our Annual Reports on Form 10-K, Quarterly Reports on Form 10-Q, Current Reports on Form 8-K and amendments to reports filed pursuant to Sections 13(a) or 15(d) of the Securities Exchange Act of 1934, as
15
amended, are available free of charge on our web site at www.surw.com/ir/, as soon as reasonably practicable after we electronically file such material with, or furnish it to, the Securities and Exchange Commission ("SEC"). Our website also contains copies of our Code of Ethics and charter of each committee of our Board of Directors. Copies are also available free of charge upon request to SureWest Communications, P.O. Box 969, Roseville, CA 95678, Attn: Investor Relations Manager. The information found on our web site is not part of this or any other report we file with or furnish to the SEC. The public may read and copy any materials we file with the SEC at the SEC's Public Reference Room at 100 F Street, NE, Washington, DC 20549. The public may obtain information on the operation of the Public Reference Room by calling the SEC at 1-800-SEC-0330. The SEC maintains an Internet site that contains reports, proxy and information statements, and other information regarding our filings at http://www.sec.gov.
Our operations and financial results are subject to various risks and uncertainties, including but not limited to those described below, that could adversely affect our business, financial condition, results of operations, cash flows and the trading price of our common stock.
We expect to continue to face significant competition in all parts of our business and the level of competition is expected to intensify. The telecommunications, Internet and digital video businesses are highly competitive. We face actual or potential competition from many existing and emerging companies, including other incumbent and competitive local telephone companies, long-distance carriers and resellers, wireless companies, Internet service providers, satellite companies, cable television companies and in some cases by new forms of providers who are able to offer competitive services through software applications, requiring a comparatively small initial investment. The wireless business has expanded significantly and has caused many subscribers to traditional telephone services and land-based Internet access services to give up those services and to rely exclusively on wireless service. Consumers are finding individual television shows of interest to them through the Internet and are watching content that is downloaded to their computers. Some providers, including television and cable television content owners, have initiated what are called "over-the-top" services that deliver video content to televisions and computers over the Internet. Over-the-top services can include episodes of highly-rated television series in their current broadcast seasons. They also can include content that is related to broadcast or sports content that the Company carries, but that is distinct and may be available only through the alternative source. Finally, the transition to digital broadcast television has allowed many consumers to obtain high definition local broadcast television signals (including many network affiliates) over-the-air, using a simple antenna. Consumers can pursue each of these options without foregoing any of the other options. We may not be able to successfully anticipate and respond to many of these various competitive factors affecting the industry, including regulatory changes that may affect our competitors and us differently, new technologies, services and applications that may be introduced, changes in consumer preferences, demographic trends and discount or bundled pricing strategies by competitors. The incumbent telephone carrier in the markets we serve (AT&T in both Sacramento and in the Kansas City area) enjoys certain business advantages, including size, financial resources, favorable regulatory position, a more diverse product mix, brand recognition and connection to virtually all of our customers and potential customers. The largest cable operators (Comcast in the Sacramento region and Time Warner in the Kansas City area) also enjoy certain business advantages, including size, financial resources, ownership of or superior access to desirable programming and other content, a more diverse product mix, brand recognition and first-in-the-field advantages with a customer base that generates positive cash flow for its operations. Both Comcast and Time Warner also actively offer telephone services and Internet services to business and residential customers. Our competitors continue to add features and adopt aggressive pricing and packaging for services comparable to the services we offer. Their success in selling some services competitive with ours can lead to revenue erosion in other related areas. We face intense
16
competition in our markets for long-distance, Internet access and other ancillary services that are important to our business and to our growth strategy. Our business and results of operations may be adversely affected if we do not compete effectively.
We must adapt to rapid technological change. If we are unable to take advantage of technological developments, or if we adopt and implement them more slowly than our competitors, we may experience a decline in the demand for our services. Our industry operates in a technologically complex environment. New technologies are continually developed and products and services undergo constant improvement. These offer consumers a variety of choices for their communication needs. To remain competitive, we will need to adapt to future changes in technology to enhance our existing offerings and to introduce new or improved offerings that anticipate and respond to the varied and continually changing demands of our customers. If we are unable to match the benefits offered by competing technologies on a timely basis or at an acceptable cost, if we fail to employ technologies desired by our customers before our competitors do so, or if we do not successfully execute on our technology initiatives, our business and results of operations could be adversely affected.
In addition, evolving technologies can reduce the costs of entry for others, resulting in greater competition and give competitors significant new advantages. Technological developments could require us to make a significant new capital investment in order to remain competitive with other service providers. If we do not replace or upgrade our network and its technology once it becomes obsolete, we will be unable to compete effectively and will likely lose customers. We also may be placed at a cost disadvantage in offering our services. Technology changes are also allowing individuals to bypass telephone companies and cable operators entirely to make and receive calls, and to provide for the distribution and viewing of video programming without the need to subscribe to traditional voice and video products and services. Increasingly, this can be done over wireless facilities and other emerging mobile technologies as well as traditional wired networks. Although we use fiber optics in parts of our networks, including in some residential areas, we continue to rely on coaxial cable and copper transport media to serve customers in many areas. The facilities we use to offer our video services, including the interfaces with customers, are undergoing a rapid evolution, and depend in part on the products, expertise and capabilities of third parties. If we cannot develop new services and products to keep pace with technological advances, or if such services and products are not widely embraced by our customer, our results of operations could be adversely impacted.
Current and future economic conditions could impact our results of operations and the availability of financing. The past few years have been characterized by weak global economic conditions, tightening of credit markets and instability in the financial markets. Although these conditions are improving in some areas, if these conditions worsen, customers may delay, reduce or forego subscribing to advanced or premium services to which they subscribe, or may discontinue subscribing to one or more of our services, or may delay purchasing decisions or delay full implementation of service offerings. Further, volatility or deteriorating economic conditions, in the California economy in particular, could adversely affect our customers and their ability to pay amounts owed to us. Any of these events would likely harm our business, results of operations and financial condition.
In addition, adverse changes in the credit markets, including increases in interest rates and borrowing spreads, could increase our cost of borrowing and negatively impact our operating results as well as our ability to expand our network. A sustained decline in the current economic environment could affect our access to financing and could have an adverse effect on our ability to execute future strategic initiatives, including potential future acquisitions or divestitures.
Unfavorable changes in the financial markets could adversely affect our pension plan investments resulting in a material funding requirement to meet future pension obligations. The cost to maintain our frozen defined benefit Pension Plan (the "Pension Plan") and future funding requirements for the Pension Plan are affected by several factors including the expected return on investment of the assets held by
17
the Pension Plan, changes in the discount rate used to calculate pension expense and the amortization of unrecognized gains and losses. Returns generated on Pension Plan assets have historically funded a significant portion of the benefits paid under the Pension Plan. We estimate the long-term rate of return of Pension Plan assets will be 8.0%. The Pension Plan invests in marketable equity securities which are exposed to changes in the financial markets. If the financial markets experience a downturn and returns fall below our estimate, as seen in recent years, we could be required to make a material contribution to the Pension Plan, which could adversely affect our cash flows from operations.
Our operations and those of our customers may be adversely affected by the impact of California economic conditions and California's budget deficit. As of December 31, 2010, a significant portion of our operations are located in California. The continuing economic crisis has particularly affected the economy of California. The State of California began its fiscal year on July 1, 2010 with a significant reported deficit, which continues to impact and aggravate current recessionary conditions within the State. Given the budgetary situation in California, there is also the possibility that the California State Legislature could enact new tax legislation, increasing tax rates in California. The economic and legislative environment within the State could have an adverse impact on businesses operating in California, including us and our customers. Any of these factors would likely harm our business, results of operations and financial condition.
Video programming costs are substantial and continue to increase. The price increases sought by content owners have not subsided during the economic downturn. We expect the cost of obtaining video programming to continue to be one of our largest operating costs associated with providing video service. Video programming content includes cable-oriented programming designed to be shown in linear channels, as well as the programming of local over-the-air television stations that we retransmit. In addition, on-demand programming is being made available in response to customer demand. In recent years, the cable industry has experienced rapid increases in the cost of programming, especially the costs for sports programming and for local broadcast station retransmission consent. Programming costs are generally assessed on a per-subscriber basis, and therefore are related directly to the number of subscribers to which the programming is provided. Our relatively small base of subscribers limits our ability to negotiate lower per-subscriber programming costs. Larger cable companies often can qualify for discounts based on the number of their subscribers. This cost difference can cause us to experience reduced operating margins, while our competitors with a larger subscriber base may not experience similar margin compression. In addition, escalators in existing content agreements cause cost increases that are out of line with general inflation. While we expect these increases to continue we may not be able to pass our programming cost increases on to our customers, particularly as an increasing amount of programming content becomes available via the Internet at little or no cost. Also, some competitors (or their affiliates) own programming in their own right and we may be unable to secure license rights to that programming. As our programming contracts with content providers expire, there can be no assurance that they will be renewed on acceptable terms or that they will be renewed at all, in which case we may be unable to provide such programming as part of our video services packages and our business and results of operations may be adversely affected.
We are subject to a complex and uncertain regulatory environment by federal, state and local governments, and we face costs and restrictions greater than those of our competitors. Our businesses are subject to regulation by the Federal Communications Commission ("FCC") and other federal, state and local agencies. The nature of regulation continues to undergo fundamental change and reinterpretation. Many businesses that compete with SureWest Telephone and our franchised digital video subsidiaries are comparatively less regulated. Some IP-based telephone services may be available over the Internet with even fewer regulatory obligations than SureWest Broadband or our Kansas subsidiaries. Many significant regulatory decisions have had to be accommodated in recent years, and there are pending decisions on issues affecting us that are of great importance. In late 2010, the FCC adopted rules that are intended to promote an "open" Internet. In early 2011, the FCC commenced new proceedings to
18
reassess the universal service framework and the intercarrier compensation structure. Each of these actions is likely to take a number of years to be resolved, and the FCC's authority to take some of the steps taken or contemplated has been challenged. Therefore, these sectors face continued uncertainty for the immediate future. Other proceedings also exist that may affect our telephone, video and Internet businesses. Over time, new appointees to Federal and state regulatory bodies may bring a different perspective on critical regulatory issues in key proceedings, which may significantly affect the way in which our businesses are regulated.
Our success depends upon our ability to manage our growth and expansion. Our growth strategy will continue to require us to invest significant capital in facilities and services that may not achieve the desired returns. Our future success depends, in part, upon our ability to manage our growth, including our ability to build network and related facilities to serve new customers, effectively enter new communication markets, dispose of non-strategic investments, integrate our operations to take advantage of new capabilities and systems, attract and retain skilled personnel, effectively manage the demands of day to day operations in new areas while attempting to execute our business strategy and realize our projected growth and revenue targets. If we invest sums in capital expansion that are too great, we may not be able to attract the number of customers required to earn a reasonable profit, and our investment may become obsolete before we can recapture the investment. However, if we fail to invest enough or in the right areas, our growth opportunities may be adversely affected, and we may fail to earn the returns expected by investors. Selecting the appropriate capital investment path is critical in our rapidly-evolving business areas.
Periodically we may enter into a strategic transaction that may include an acquisition or other investments as a growth strategy. We may incur unanticipated expenses, fail to realize anticipated benefits, have difficulty incorporating the acquired business or incur additional indebtedness. The occurrence of any of the foregoing events could prevent us from realizing the financial and strategic goals that were intended at the time of the transaction and could have a material adverse effect on our business, results of operations, cash flows and financial condition.
We receive support from various funds established under federal and state law and the continued receipt of that support is not assured. While we do not receive any support from the rural or non-rural Federal Universal Service high cost loop fund, we do receive payments from various other federal or state programs. These include interstate common line support, California High Cost Fund ("CHCF") and Lifeline, Education and Libraries programs. These governmental programs are reviewed and amended from time to time, and because of the FCC's action in February 2011, they are likely to change in the near future. As described in the Telecom–Regulation section above, in 2007 the California Public Utilities Commission issued a final decision which began to phase down our current annual CHCF draw of $11,500, over a five-year period which will end in January 2012. The outcome and impact on our operations resulting from future changes to these governmental programs cannot be determined at this time.
If key suppliers or other communications companies that our business relies on experience financial difficulties it may adversely affect our operations and results of operations. We depend on third party vendors to supply us with a significant amount of hardware, software and operational support necessary to provide certain of our services and to maintain, upgrade and enhance our network facilities and operations. Our video platform is made available through a third party vendor. If any of our third party vendors, some of whom represent our primary source of supply for products and services for which there are few substitutes, should experience financial difficulties or elect to exit an area in which we depend upon them, it could cause us to experience delays or service interruptions, and to incur additional expenses.
We originate and terminate calls for long distance carriers and other interexchange carriers over our network in exchange for access charges that represent a significant revenue stream. If any of these
19
carriers go bankrupt or experience substantial financial difficulties, our inability to timely collect access charges from them could have a negative effect on our business and results of operations. Increasingly, the services of third parties that trigger access charges that we receive are being replaced by other services and treated as being outside the access charge structure. Therefore, we may receive significantly lower sums as compensation for originating and terminating these services. In addition, we are dependent on easements, franchises and licenses from various private parties such as established telephone companies and other utilities, railroads, long-distance companies and from state highway authorities, local governments and transit authorities for access to aerial pole space, underground conduits and other rights-of-way in order to construct and operate our networks. The failure to maintain in effect the necessary third party arrangements on acceptable terms would have an adverse effect on our ability to conduct our business.
Item 1B. Unresolved Staff Comments.
None.
Our corporate headquarters and administrative offices are located in Placer County, California and consist of approximately 111,000 square feet of owned office space. We also own office facilities and related equipment for administrative personnel, central office buildings, and operations with approximately 298,000 square feet of space in Roseville, Citrus Heights, Granite Bay and other locations in Sacramento and Placer Counties in California, as well as approximately 20,000 square feet of space in Lenexa, Kansas in Johnson County. We own approximately 21 acres of undeveloped land in Roseville, California.
We lease approximately 77,000 square feet for central office facilities, operations and warehouse space in Sacramento County. Our leased Sacramento County facilities are primarily located at McClellan Park. The terms of the McClellan Park lease were renewed January 1, 2011. Through the terms of the new lease agreement, the amount of leased square footage at McClellan Park decreased by over 70%, to approximately 58,000 square feet, primarily as the result of workforce consolidations into our other facilities in California. The leased McClellan Park facilities are utilized by our Broadband segment.
We lease an approximate 55,000 square foot facility in Lenexa, Kansas which is utilized by our Broadband segment. We have appropriate easements, rights of way and other arrangements for the accommodation of our pole lines, underground conduits, aerial and underground cables and wires. See Note 9 in the Notes to Consolidated Financial Statements and Part II, Item 7–"Management's Discussion and Analysis of Financial Condition and Results of Operations" for information regarding our lease obligations.
As a result of efficiencies realized through cost controls and efficiencies gained through our recent acquisitions, certain of our owned and leased facilities are currently not being utilized to their full capacity and can accommodate future growth and expansion. In connection with our efforts to evaluate and potentially monetize our under-utilized assets, during 2009 we identified and began to actively market for sale an approximate 66,000 square foot building and 21 acres of undeveloped land, both in Roseville, California. During the quarter ended December 31, 2009, we completed our plan to sell these assets and as a result they were classified as assets held for sale. As of December 31, 2010, these assets continue to be actively marketed for sale and classified as assets held for sale.
In addition to land and structures, our property consists of equipment necessary for the provision of communication services including central office equipment, customer premises equipment and connections, pole lines, video head-end, remote terminals, aerial and underground cable and wire facilities, vehicles, furniture and fixtures, computers and other equipment. We also own certain other communications equipment held as inventory for sale or lease.
20
In addition to plant and equipment that we wholly-own, we utilize poles, towers and cable and conduit systems jointly-owned with other entities, and lease space on facilities to other entities. These arrangements are in accordance with written agreements customary in the industry.
We are not aware of any material pending legal proceedings, other than ordinary routine litigation incidental to our business, to which we are a party or to which any of our property is subject. However, SureWest Telephone, one of our subsidiaries, is a regulated utility subject to ongoing regulatory proceedings which can have a material impact on results of operations. For a detailed discussion regarding our ongoing regulatory proceedings, see Part II, Item 7–"Management's Discussion and Analysis of Financial Condition and Results of Operations".
21
Item 5. Market for Registrant's Common Equity, Related Stockholder Matters and Issuer Purchases of Equity Securities.
SureWest Communications' (the "Company", "we" or "our") common stock is traded on The NASDAQ Stock Market LLC ("NASDAQ") under the symbol "SURW". As of February 9, 2011, there were approximately 9,525 beneficial owners of the Company's common stock, based on the number of record holders of the Company's common stock. The following table indicates the range of stock closing prices of the Company's common stock as reported on the NASDAQ, for each of the quarters ending on the dates indicated:
| |
NASDAQ National Market | ||||||
|---|---|---|---|---|---|---|---|
| |
High | Low | |||||
March 31, 2009 |
$ | 11.74 | $ | 7.50 | |||
June 30, 2009 |
$ | 11.05 | $ | 6.22 | |||
September 30, 2009 |
$ | 13.50 | $ | 10.45 | |||
December 31, 2009 |
$ | 12.55 | $ | 8.23 | |||
March 31, 2010 |
$ | 10.35 | $ | 7.54 | |||
June 30, 2010 |
$ | 8.70 | $ | 5.97 | |||
September 30, 2010 |
$ | 7.45 | $ | 5.66 | |||
December 31, 2010 |
$ | 10.75 | $ | 7.11 | |||
In April 2008, our Board of Directors announced the decision to discontinue the quarterly dividend payment of $0.25 per share for the foreseeable future in an effort to foster our growth strategy by reinvesting the approximate $13,900 of annual dividend distributions back into the Company. Consequently, we did not pay any cash dividends on our common stock during the years ended 2010 or 2009. Additional information concerning dividends may be found in "Selected Financial Data" in Item 6, which is incorporated herein by reference.
During the year ended December 31, 2010, we did not sell any equity securities of the Company, which were not registered under the Securities Act of 1933, as amended.
Share Repurchases
As discussed in Part II, Item 7–"Management's Discussion and Analysis of Financial Condition and Results of Operations", our Board of Directors has authorized the repurchase of up to 3.5 million shares of our common stock. Shares are purchased from time to time in the open market or through privately negotiated transactions, subject to overall financial and market conditions. As of December 31, 2010, we had remaining authorization from the Board of Directors to repurchase approximately 1.2 million additional outstanding shares.
22
Performance Graph
The following graph shows a five-year comparison of cumulative total shareholder return of our common stock (assuming dividend reinvestment) with the Dow Jones US Telecommunications Index (a published index which measures the stock performance of U.S. companies in the Telecommunications sector) and the Russell 2000 Index. The comparison of total return on investment (change in year-end stock price plus reinvested dividends) for each of the periods assumes that $100 was invested on December 31, 2005 respectively in each of SureWest Communications, the Russell 2000 Index and the Dow Jones US Telecommunications Index. The stock performance shown on the graphs below is not necessarily indicative of future price performance.
COMPARISON OF 5 YEAR CUMULATIVE TOTAL RETURN*
Among SureWest Communications, the Russell 2000 Index
and the Dow Jones US Telecommunications Index
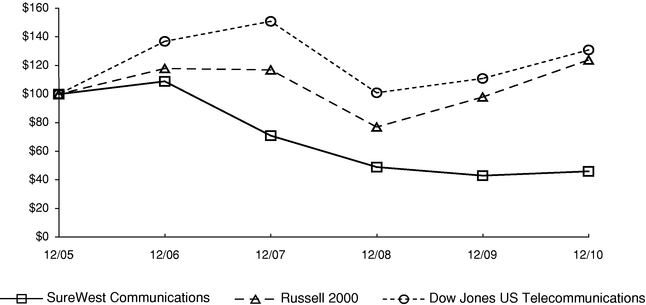
*$100 investment on 12/31/05 in stock or index, including reinvestment of dividends.
Fiscal year ending December 31.
Copyright© 2011 Dow Jones & Co. All rights reserved.
| |
Fiscal Years Ending December 31, | ||||||||||||||||||
|---|---|---|---|---|---|---|---|---|---|---|---|---|---|---|---|---|---|---|---|
| |
2005 | 2006 | 2007 | 2008 | 2009 | 2010 | |||||||||||||
SureWest Communications |
$ | 100 | $ | 109 | $ | 71 | $ | 49 | $ | 43 | $ | 46 | |||||||
Russell 2000 |
$ | 100 | $ | 118 | $ | 117 | $ | 77 | $ | 98 | $ | 124 | |||||||
Dow Jones US Telecommunications |
$ | 100 | $ | 137 | $ | 151 | $ | 101 | $ | 111 | $ | 131 | |||||||
23
Item 6. Selected Financial Data.
The selected financial data set forth below should be read in conjunction with Item 7–"Management's Discussion and Analysis of Financial Condition and Results of Operations", our consolidated financial statements and the related notes, and other financial data included elsewhere in this annual report. Historical results are not necessarily indicative of the results to be expected in future periods.
| |
2010 | 2009 | 2008(1) | 2007 | 2006 | |||||||||||||
|---|---|---|---|---|---|---|---|---|---|---|---|---|---|---|---|---|---|---|
| |
(Dollars in thousands, except per share amounts) |
|||||||||||||||||
Statements of Income Data: |
||||||||||||||||||
Total operating revenues |
$ | 243,499 | $ | 241,700 | $ | 230,373 | $ | 174,257 | $ | 170,982 | ||||||||
Operating income |
15,194 | 13,573 | 15,141 | 8,387 | 10,416 | |||||||||||||
Net income: |
||||||||||||||||||
Income from continuing operations |
3,355 | 667 | 826 | 5,223 | 2,004 | |||||||||||||
Income from discontinued operations(2)(3)(4) |
— | 2,499 | 18,107 | 57,717 | 3,734 | |||||||||||||
Net income |
$ | 3,355 | $ | 3,166 | $ | 18,933 | $ | 62,940 | $ | 5,738 | ||||||||
Per Share Data–Earnings Per Share and Dividends: |
||||||||||||||||||
Basic earnings per share: |
||||||||||||||||||
Income per share from continuing operations(5) |
$ | 0.24 | $ | 0.05 | $ | 0.06 | $ | 0.36 | $ | 0.14 | ||||||||
Income per share from discontinued operations(5) |
— | 0.18 | 1.28 | 3.99 | 0.25 | |||||||||||||
Net income per basic share |
$ | 0.24 | $ | 0.23 | $ | 1.34 | $ | 4.35 | $ | 0.39 | ||||||||
Diluted earnings per share: |
||||||||||||||||||
Income per share from continuing operations(5) |
$ | 0.24 | $ | 0.05 | $ | 0.06 | $ | 0.36 | $ | 0.14 | ||||||||
Income per share from discontinued operations(5) |
— | 0.18 | 1.28 | 3.98 | 0.25 | |||||||||||||
Net income per diluted share |
$ | 0.24 | $ | 0.23 | $ | 1.34 | $ | 4.34 | $ | 0.39 | ||||||||
Cash dividends per share(6) |
$ | — | $ | — | $ | 0.50 | $ | 1.00 | $ | 1.00 | ||||||||
Balance Sheet Data: |
||||||||||||||||||
Total assets |
$ | 603,181 | $ | 622,863 | $ | 633,809 | $ | 484,767 | $ | 445,750 | ||||||||
Long-term obligations |
$ | 189,773 | $ | 207,409 | $ | 226,045 | $ | 118,189 | $ | 123,722 | ||||||||
Shareholders' equity |
$ | 272,058 | $ | 269,183 | $ | 261,345 | $ | 271,003 | $ | 225,776 | ||||||||
Statements of Cash Flows Data: |
||||||||||||||||||
Net cash provided by operating activities from continuing operations |
$ | 63,553 | $ | 71,842 | $ | 50,778 | $ | 50,830 | $ | 45,089 | ||||||||
Other Data:(7) |
||||||||||||||||||
Adjusted EBITDA(7a) |
$ | 82,511 | $ | 77,898 | $ | 69,239 | $ | 57,295 | $ | 64,324 | ||||||||
Free cash flow(7b) |
$ | 12,620 | $ | 2,061 | $ | (30,636 | ) | $ | (4,473 | ) | $ | (2,760 | ) | |||||
- (1)
- In February 2008, we acquired 100% of the issued and outstanding stock of SureWest Kansas, Inc., formerly Everest Broadband, Inc. (the "Kansas City operations") for a total purchase price of $181,459, including transaction costs. Subsequent to the acquisition date of February 13, 2008, the operating results for the Kansas City operations have been included in our consolidated financial statements.
24
- (2)
- In
February 2009, we sold our fifty-two wireless communication towers ("Tower Assets"). The operating results of our Tower Assets
are included in income from discontinued operations for the years ended on or before December 31, 2009.
- (3)
- In
May 2008, we sold the operating assets of our Wireless business, SureWest Wireless. The operating results and the net gain from the sale of
SureWest Wireless are included in income from discontinued operations for the years ended on or before December 31, 2009.
- (4)
- In
February 2007, we sold 100% of the stock of SureWest Directories, our directory publishing business. The operating results and the net gain
from the sale of SureWest Directories are included in income from discontinued operations for the years ended on or before December 31, 2007.
- (5)
- Shares
used in the computation of basic earnings per share are based on the weighted average number of common shares and restricted common
stock units ("RSUs") outstanding, excluding unvested restricted common shares and unvested RSUs. Shares used in the computation of diluted earnings per share are based on the weighted average number
of common shares, restricted common shares and RSUs outstanding, along with other potentially dilutive securities outstanding in each period.
- (6)
- In
2008, our Board of Directors announced its decision to discontinue the quarterly dividend payment of $0.25 per share subsequent to the
payment of the second quarter dividend paid to shareholders of record as of May 15, 2008. Additional information concerning dividends may be found in "Share Repurchases" in Item 5, which
is incorporated herein by reference. Cash dividends per share were based on the actual dividends per share, as declared by our Board of Directors. On each date that we paid a cash dividend to the
holders of our common stock, we credited to the holders of RSUs an additional number of RSUs equal to the total number of whole RSUs and additional RSUs previously credited to the holders multiplied
by the dollar amount of the cash dividend per share of common stock. Any fractional RSUs resulting from such calculation were included in the additional RSUs.
- (7)
- In
addition to the results reported in accordance with United States generally accepted accounting principles ("US GAAP" or "GAAP"), we
also use certain non-GAAP measures including Adjusted EBITDA and free cash flow to evaluate operating performance and to facilitate the comparison of our historical results and trends.
These financial measures are not a measure of financial performance under US GAAP and should not be considered in isolation or as a substitute for net income from continuing operations as a
measure of performance and net cash provided by operating activities as a measure of liquidity. The calculation of these non-GAAP measures may not be comparable to similarly titled
measures used by other companies. Reconciliations to the most directly comparable GAAP measure are provided below.
- (7a)
- Adjusted EBITDA represents net income from continuing operations excluding amounts for income taxes; depreciation and amortization; non-cash pension and certain post-retirement benefits; non-cash stock compensation; severance and other related termination costs; and all other non-operating income and expenses. Adjusted EBITDA is a common measure of operating performance in the telecommunications industry. Adjusted EBITDA helps us evaluate our performance by removing from our operating results non-cash items and items which do not relate to our core operating performance.
25
- The following table is a reconciliation of income from continuing operations to Adjusted EBITDA:
| |
2010 | 2009 | 2008 | 2007 | 2006 | ||||||||||||
|---|---|---|---|---|---|---|---|---|---|---|---|---|---|---|---|---|---|
Income from continuing operations |
$ | 3,355 | $ | 667 | $ | 826 | $ | 5,223 | $ | 2,004 | |||||||
Add (subtract): |
|||||||||||||||||
Income tax expense (benefit) |
3,354 | 2,006 | 3,139 | (367 | ) | 1,383 | |||||||||||
Other (income) expense, net |
8,485 | 10,900 | 11,176 | 3,531 | 7,029 | ||||||||||||
Depreciation and amortization |
61,825 | 59,724 | 55,027 | 43,636 | 48,410 | ||||||||||||
Impairment loss |
— | — | — | 5,454 | — | ||||||||||||
Non-cash pension and post-retirement expense (income) |
1,503 | 2,591 | (1,808 | ) | (1,159 | ) | 4,279 | ||||||||||
Non-cash stock compensation expense |
2,845 | 2,010 | 879 | 977 | 1,219 | ||||||||||||
Severance and other related termination costs |
1,144 | — | — | — | — | ||||||||||||
Adjusted EBITDA |
$ | 82,511 | $ | 77,898 | $ | 69,239 | $ | 57,295 | $ | 64,324 | |||||||
- (7b)
- We
define free cash flow as net income from continuing operations plus depreciation and amortization expense less capital expenditures. Free
cash flow is used to measure operating cash flows available for corporate purposes after providing sufficient fixed asset additions to maintain current productive capacity.
The following table is a reconciliation of net cash provided by operating activities from continuing operations to consolidated free cash flow:
| |
2010 | 2009 | 2008 | 2007 | 2006 | ||||||||||||
|---|---|---|---|---|---|---|---|---|---|---|---|---|---|---|---|---|---|
Net cash provided by operating activities from continuing operations |
$ | 63,553 | $ | 71,842 | $ | 50,778 | $ | 50,830 | $ | 45,089 | |||||||
Less: Adjustments for all non-cash items and net changes in operating assets and liabilities |
(60,198 | ) | (71,175 | ) | (49,952 | ) | (45,607 | ) | (43,085 | ) | |||||||
Income from continuing operations |
3,355 | 667 | 826 | 5,223 | 2,004 | ||||||||||||
Add: Depreciation and amortization |
61,825 | 59,724 | 55,027 | 43,636 | 48,410 | ||||||||||||
Less: Capital expenditures |
(52,560 | ) | (58,330 | ) | (86,489 | ) | (53,332 | ) | (53,174 | ) | |||||||
Free cash flow |
$ | 12,620 | $ | 2,061 | $ | (30,636 | ) | $ | (4,473 | ) | $ | (2,760 | ) | ||||
26
Item 7. Management's Discussion and Analysis of Financial Condition and Results of Operations.
(Amounts in thousands, except selected operating metrics and share and per share amounts)
Reference is made to Part I, Item 1 "Note About Forward Looking Statements" and Item 1A "Risk Factors" which describes important factors that could cause actual results to differ from expectations and non-historical information contained herein. In addition, the following Management's Discussion and Analysis ("MD&A") is intended to help the reader understand the results of operations and financial condition of SureWest Communications (the "Company", "we" or "our"). MD&A should be read in conjunction with our audited consolidated financial statements and accompanying notes to the consolidated financial statements ("Notes") as of and for each of the three years in the period ended December 31, 2010 included elsewhere in this Annual Report on Form 10-K.
Throughout MD&A, we refer to measures that are not a measure of financial performance in accordance with United States generally accepted accounting principles ("US GAAP" or "GAAP"). We believe the use of these non-GAAP measures on a consolidated and segment basis provides the reader with additional information that is useful in understanding our operating results and trends. These measures should be viewed in addition to, rather than as a substitute for, those measures prepared in accordance with GAAP. See the Non-GAAP Measures section below for a more detailed discussion on the use and calculation of these measures.
We are one of the leading providers of integrated communications services and are the bandwidth leader in the markets we serve. We provide data, video and voice services to residential and business customers in the greater Sacramento, California ("Sacramento region") and greater Kansas City, Kansas and Missouri areas ("Kansas City area"). We continue to expand the use of optical fiber in our networks. We increasingly deploy our services by combining fiber-to-the-home ("FTTH") and fiber-to-the-node ("FTTN") facilities with the use of Internet Protocol ("IP") based communications protocol. Our advanced telecommunications networks give us a competitive edge that enables us to provide our customers with higher data speeds for Internet service and deploy multiple services at superior quality through our high bandwidth capacity. Our IP based communication protocol enables us to provide dedicated bandwidth at symmetrical data speeds to each of our customers in the Sacramento region. We classify our operations in two reportable segments: Broadband and Telecommunications ("Telecom").
Broadband Segment
Our Broadband segment generates approximately 72% of our consolidated operating revenues, primarily from subscriptions to our data, video and voice services ("broadband services"). We market our broadband services to residential and business customers, either individually or as part of a bundled package. As of December 31, 2010, our broadband services served approximately 104,100 residential subscribers, of which 81% subscribed to two or more of our broadband services, including 46% that subscribed to all three of our broadband services ("triple play"). As of December 31, 2010, we had approximately 7,800 business customers. During 2010, new products and features including Advanced Digital TV ("ADTV"), faster data speeds, increased high definition ("HD") channels, home networking and Internet security software created enhanced subscriber value for our broadband services. We continue to successfully offset industry-wide declines of operating revenues in the Telecom segment with our long-term strategy to grow our Broadband operations.
Our data service can provide high-speed Internet access at symmetrical speeds of up to 50 megabits per second ("Mbps"), depending on the nature of the network facilities that are available, the level of service selected and the geographic market availability. Our advanced telecommunications networks gives us the ability to offer our customers both faster and symmetrical data speeds, meaning Internet speeds downstream are the same as those upstream, than our competitors. Customers can use the faster speeds
27
for enhanced online gaming and faster uploading and downloading of multimedia such as music, photos and video content. During 2010, our data customers continued to demand higher data speeds. As of December 31, 2010, approximately 61% and 28% of our data customers subscribed to speeds of 5 Mbps and 15 Mbps or greater, respectively. In the Sacramento region, approximately 40% of our data customers subscribe to plans with speeds at or higher than 15 Mbps. As of December 31, 2010, approximately 32% of the homes in the areas we serve subscribed to one of our high-speed Internet services.
Our video services range from a limited basic service to our new product offering ADTV, powered by Microsoft® Mediaroom™. Depending on the service selected and subject to geographic market availability, our video service subscribers have access to over 310 channels, including premium and pay-per-view channels (which include concerts, wrestling, boxing, sporting events and movies); video on demand ("VOD") service (which allows access to a library of movies and the ability to start a selection at any time and to pause, rewind, fast-forward and replay); premium VOD channels, music channels and an interactive, on-screen program guide (which allows the subscriber to navigate the channel lineup, the VOD library and recorded programs). Digital video subscribers may also subscribe to our advanced services, which consist of high-definition television ("HDTV"), and/or digital video recorders ("DVR"). Our ADTV product, which is currently available in the Sacramento region only, includes a Whole Home DVR, which allows customers the ability to watch recorded shows on any television in the house, record multiple shows at one time and utilize an intuitive on-screen guide and user interface. We anticipate the deployment of a Whole Home DVR in the Kansas City area during 2011. As of December 31, 2010, approximately 23% of the homes in the areas we serve subscribed to one of our video services.
Our Voice over Internet Protocol ("VoIP") digital phone product is available in the Sacramento market, including those customers residing in the Telecom segment service territory. Customers can select individual services or bundled packages that may include unlimited local calling or unlimited local and domestic long distance calling plans. Our voice products also include value-added services such as voicemail, call waiting, caller identification and many other calling feature options. As of December 31, 2010, approximately 18% of the homes in our Sacramento market have subscribed to our VoIP phone service. We also offer traditional circuit-switched voice services in some of the areas we serve. The total voice penetration in the markets we serve was approximately 24% as of December 31, 2010.
We provide a variety of business communications services to small, medium and large business customers. The services we offer to our business customers include: fiber-optics-based high-speed Internet, customized data and Ethernet transport services, data center and disaster recovery solutions, traditional landline and VoIP phone services, wireless backhaul and digital TV. Utilizing our existing fiber-optic network, we have successfully secured contracts to serve over 350 wireless carrier backhaul sites, primarily in the Sacramento region. We anticipate wireless backhaul revenue will continue to grow as wireless carriers, faced with escalating consumer and business demand for mobile broadband traffic, are forced to increase backhaul capacity.
Telecom Segment
Our Telecom segment, which operates only in the Sacramento region, offers a broad selection of telecommunications services including traditional circuit-switched voice services, long distance services and a number of lightly-regulated or non-regulated services. Most long distance services are offered by our subsidiary SureWest Long Distance, which is a reseller of long distance services.
The Telecom segment provides a variety of business service offerings to small, medium and large business customers, including many services over our advanced fiber network. The services we offer to our business customers include, but are not limited to high-speed Internet, customized data and Ethernet transport services, data center and disaster recovery solutions, traditional landline and scalable IP communication systems. During 2010, business customers decreased 7% to 7,900, as a result of the strained economic conditions. We anticipate the Telecom segment's business customer count will stabilize and begin to trend favorably as the real estate market initiates a recovery and commercial vacancy rates decline.
28
The Telecom segment also provides wholesale access services through the use of its network to the Broadband segment, which enables the Broadband segment to offer high-speed Internet, VoIP and video services to those customers within SureWest Telephone's service area. We anticipate the wholesale access services revenue stream will continue to increase as customers within the Telecom segment service territory continue to demand broadband services.
Telecom segment revenues have decreased as a percentage of our consolidated revenues from continuing operations over the past several years. During 2010, the Telecom segment generated 28% of our consolidated revenues from continuing operations, a decrease of 5% from 2009. The decline in revenues is primarily the result of an industry wide trend of declining circuit-switched voice Revenue-generating units ("RGUs") and a corresponding reduction in the use of related services. Many customers are choosing to subscribe to our Broadband Digital Phone product instead of the traditional circuit-switched phone service offered by SureWest Telephone. In addition, the Telecom segment revenues have been impacted by scheduled reductions in the subsidies we receive from governmental regulatory agencies. However, the Telecom segment remains an important part of our long-term growth strategy as it continues to generate the majority of our income from continuing operations and free cash flow, which has been used in the current year to reduce long-term debt and fund network enhancements.
In connection with our efforts to evaluate and potentially monetize excess assets, during 2009 we identified and began to actively market for sale certain of our real estate assets. These regulated assets, which are included in the Telecom segment, include 21 acres of undeveloped land and an office building. During the quarter ended December 31, 2009, we completed our plan to sell these assets and as a result they were classified as assets held for sale. We expect the land will sell in the range of $3,000 to $5,000. In connection with the classification to assets held for sale, the carrying value of the office building was reduced to its estimated fair value, less selling costs, based on the current market conditions and listed selling price. As a result, an impairment charge of $1,199 was recorded against accumulated depreciation during 2009, in accordance with regulated telephone plant and equipment composite group remaining life methodology. We evaluated the estimated fair value of the assets held for sale as of December 31, 2010 and determined there was not a significant change. Therefore, no additional impairment charge was recorded during the year ended December 31, 2010. As of December 31, 2010, these assets continue to be actively marketed for sale and classified as assets held for sale.
In February 2009, we sold fifty-two wireless communications towers ("Tower Assets") owned by our subsidiary West Coast PCS, LLC ("West Coast PCS") to Global Tower Partners. West Coast PCS was a component of our Broadband segment. The sale was completed for an aggregate cash purchase price of $9,222, resulting in a gain of $2,525, net of tax. Proceeds from the sale of the Tower Assets were used to repay a portion of outstanding long-term debt.
In May 2008, we completed the sale of the operating assets of our Wireless business, SureWest Wireless, to Verizon Wireless ("Verizon") for an aggregate cash purchase price of $69,746, resulting in a gain of $18,864, net of tax. As part of the agreement, Verizon acquired the spectrum licenses and operating assets of SureWest Wireless, excluding our owned communication towers. SureWest Wireless was previously reported as a separate reportable segment.
In February 2008, we acquired 100% of the issued and outstanding stock of SureWest Kansas, Inc., formerly Everest Broadband, Inc. ("Everest", "SureWest Kansas" or the "Kansas City operations") for a total purchase price of $181,459, including transaction costs. Subsequent to the acquisition, the Kansas City operations have been included in our Broadband segment and consolidated results of operations. SureWest Kansas is a competitive provider of high-speed data, video and voice services in the Kansas City area. The addition of our Kansas City operations accelerates our growth strategy and has positioned us as a premier provider of network services to residential and business customers in the markets we serve there, as well as in California.
29
Consolidated Overview
The tables below reflect certain financial data (on a consolidated and segment basis) and select operating metrics for each of our reportable segments as of and for the years ended December 31, 2010, 2009 and 2008.
| |
|
|
|
%Change | |||||||||||||
|---|---|---|---|---|---|---|---|---|---|---|---|---|---|---|---|---|---|
| |
2010 | 2009 | 2008 | 2010 vs. 2009 |
2009 vs. 2008 |
||||||||||||
Operating revenues(1) |
|||||||||||||||||
Broadband |
$ | 174,546 | $ | 161,222 | $ | 135,341 | 8 | % | 19 | % | |||||||
Telecom |
68,953 | 80,478 | 95,032 | (14 | ) | (15 | ) | ||||||||||
Operating revenues |
243,499 | 241,700 | 230,373 | 1 | 5 | ||||||||||||
Income (loss) from operations |
|||||||||||||||||
Broadband |
(14,793 | ) | (23,550 | ) | (27,261 | ) | 37 | 14 | |||||||||
Telecom |
29,987 | 37,123 | 42,402 | (19 | ) | (12 | ) | ||||||||||
Income from operations |
15,194 | 13,573 | 15,141 | 12 | (10 | ) | |||||||||||
Income (loss) from continuing operations |
|||||||||||||||||
Broadband |
(12,873 | ) | (20,782 | ) | (23,684 | ) | 38 | 12 | |||||||||
Telecom |
16,228 | 21,449 | 24,510 | (24 | ) | (12 | ) | ||||||||||
Income from continuing operations |
3,355 | 667 | 826 | 403 | (19 | ) | |||||||||||
Net cash provided by operating activities from continuing operations |
63,553 | 71,842 | 50,778 | (12 | ) | 41 | |||||||||||
Adjusted EBITDA(2) |
|||||||||||||||||
Broadband |
37,473 | 25,590 | 12,899 | 46 | 98 | ||||||||||||
Telecom |
45,038 | 52,308 | 56,340 | (14 | ) | (7 | ) | ||||||||||
Adjusted EBITDA |
82,511 | 77,898 | 69,239 | 6 | 13 | ||||||||||||
Free cash flow(2) |
|||||||||||||||||
Broadband |
(7,196 | ) | (21,398 | ) | (49,930 | ) | 66 | 57 | |||||||||
Telecom |
21,146 | 24,459 | 20,527 | (14 | ) | 19 | |||||||||||
Corporate |
(1,330 | ) | (1,000 | ) | (1,233 | ) | (33 | ) | 19 | ||||||||
Free cash flow |
12,620 | 2,061 | (30,636 | ) | 512 | 107 | |||||||||||
- (1)
- External customers only.
- (2)
- A non-GAAP measure. See the Non-GAAP Measures section below for additional information and reconciliation to the most directly comparable GAAP measure.
30
| |
|
|
|
%Change | ||||||||||||||
|---|---|---|---|---|---|---|---|---|---|---|---|---|---|---|---|---|---|---|
| |
2010 | 2009 | 2008 | 2010 vs. 2009 |
2009 vs. 2008 |
|||||||||||||
Broadband |
||||||||||||||||||
Total residential subscribers(1)(5) |
104,100 | 103,100 | 103,000 | 1 | % | 0 | % | |||||||||||
Broadband residential Revenue-generating units(2)(5) |
236,100 | 228,500 | 220,300 | 3 | 4 | |||||||||||||
Data |
99,400 | 98,300 | 97,100 | 1 | 1 | |||||||||||||
Video |
61,800 | 58,900 | 60,000 | 5 | (2 | ) | ||||||||||||
Voice |
74,900 | 71,300 | 63,200 | 5 | 13 | |||||||||||||
Total business customers(3)(5) |
7,800 | 7,300 | 6,800 | 7 | 7 | |||||||||||||
Telecom |
||||||||||||||||||
Voice Revenue-generating units(4) |
28,900 | 38,500 | 54,000 | (25 | ) | (29 | ) | |||||||||||
Total business customers(3) |
7,900 | 8,500 | 9,200 | (7 | ) | (8 | ) | |||||||||||
- (1)
- Total residential subscribers are customers who receive one or more residential data, video or voice services from one of our subsidiaries in the Broadband segment.
- (2)
- We can deliver multiple services to a customer. Accordingly, we maintain statistical data regarding RGUs for video, voice and data, in addition to the number of subscribers. For example, a single customer who purchases video, voice and data services would be reflected as three RGUs.
- (3)
- Total business customers are customers who receive business data, voice or video services and represent a distinct customer account.
- (4)
- Voice RGUs are residential customers who subscribe to one or more voice access lines.
- (5)
- During the third quarter of 2010, we revised our methodology of counting Broadband residential subscribers, RGUs and business customer counts. The revised methodology facilitates the consistent application of customer counts within the Broadband segment. Accordingly, the Broadband segment metrics previously reported for 2009 have been revised to conform to current practice.
31
Consolidated Overview
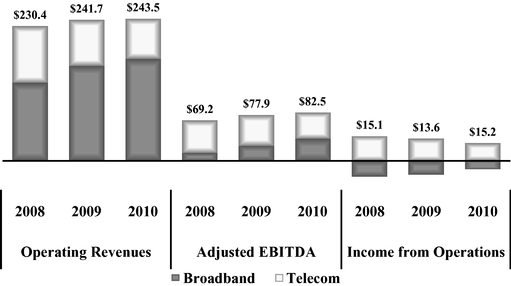
For Broadband and Telecom results, see the Financial Data table above.
Revenue and Cost Structure
Our Broadband segment contributes the majority of our consolidated operating revenues as Telecom revenues continue to decline as a result of a decline in traditional regulatory support mechanisms and continuing competitive challenges within the communications industry. As we maintain our focus on growing the Broadband segment, the Telecom segment continues to comprise a smaller percentage of total revenues and adjusted EBITDA. However, the Telecom segment remains an important part of our long-term growth strategy as it continues to generate the majority of our income from continuing operations and free cash flow, which has been used in the current year to reduce long-term debt and fund network enhancements. Our long-term strategy remains to continue growing our Broadband operations to counter the industry-wide trend of declines in Telecom revenues.
Operating Revenues
Operating revenues in the Broadband segment increased $13,324 in 2010 compared to 2009 due to the continued growth in residential and business services. Broadband residential revenues increased $5,998 in 2010 compared to 2009 as a result of a 3% increase in RGUs and higher pricing for video and data services during 2010. The launch of our new ADTV video product in the Sacramento market in 2010 also contributed to the growth in residential revenue and RGUs.
We offer a broadband VoIP phone service in the Sacramento market, including in the Telecom segment service territory. The VoIP phone service provides us with a competitive triple-play offering and has mitigated past declines in consolidated operating revenue and voice RGUs by allowing us to migrate those customers to voice RGUs in the Broadband segment rather than those moving to our competitors. Broadband voice RGUs in the Sacramento market increased 12% as of December 31, 2010 compared to the prior year.
Broadband business revenues increased $6,655, or 17%, in 2010 compared to 2009. Business customers increased 7% as of December 31, 2010 compared to the prior year as a result of growth primarily in the Kansas City market. The variety of our product offerings and our ability to offer customized service
32
packages to businesses of all sizes contributed to the current year growth in business revenue and will continue to provide us with new opportunities in the commercial market.
Utilizing our existing fiber-optic network, we are able to acquire more diversified business customers and create new long-term revenue opportunities, such as wireless carrier backhaul and data center services. Growth in these services also contributed to the current year increase in business revenue as the demand for wireless data continues to grow. We will continue to invest in new opportunities as they emerge in order to develop and enhance the broadband infrastructure and the residential and business services we offer, while focusing on the generation of new customers and increasing residential penetration on our existing marketable homes.
Operating revenues in the Telecom segment decreased $11,525 in 2010 compared to 2009. Residential services decreased $7,228 in 2010 compared to 2009 and were largely impacted by our customers' migration toward alternative communication services, including those offered by our Broadband segment, as discussed above, which contributed to a 25% decline in the Telecom segment voice RGUs as of December 31, 2010. Business revenues decreased $1,297 in 2010 compared to 2009 as a result of a 7% decline in business customers due to the economic impact on small and medium sized businesses in the California market. However, the decline was mitigated by higher pricing for data services in 2010, which were implemented during the third quarter. The decrease in operating revenues for the Telecom segment was also impacted by the scheduled reduction in support received from the California High Cost Fund ("CHCF") of $2,040 during 2010 compared to 2009. See the Regulatory Matters section below for a further discussion regarding the regulatory subsidies we receive.
The Telecom segment also provides wholesale access services through the use of its network to the Broadband segment, which enables the Broadband segment to offer high-speed Internet, VoIP, video and wireless backhaul services to those customers within SureWest Telephone's service area. These wholesale services are included as intersegment revenues and expenses in each of the respective segments and eliminated in the consolidated statements of income.
Operating Expenses
Consolidated operating expenses, excluding depreciation and amortization, decreased $1,923 in 2010 compared to 2009. During the quarter ended June 30, 2010, we implemented a workforce reduction initiative in which approximately 60 positions were eliminated as we continue to improve operating efficiencies and align our operating costs with the decline in Telecom revenues. Affected employees were provided a range of benefits and resources, including severance. As a result, severance and other related termination costs of $1,428 were incurred during 2010.
Cost of services and products expense increased $2,642 in 2010 compared to 2009 largely due to increases in programming and network costs related to providing video and data services. These costs result from an increase in programming fees per subscriber and the growth in business services. However, labor costs have declined as a result of a reduction in headcount through the workforce reduction initiative and the outsourcing of certain network and property maintenance services in 2010.
Customer operations and selling expense decreased $680 in 2010 compared to 2009. Sales and advertising costs declined as a result of a reduction in radio advertising in the current year. However, selling costs, primarily sales labor and commissions, increased related to the launch and promotion of our new ADTV product during the first and second quarters of 2010.
General and administrative expenses decreased $3,885 in 2010 compared to 2009. Labor costs decreased resulting from a reduction in headcount and a decline in pension expense associated with our defined benefit pension plan ("Pension Plan"), which was offset in part by employee severance costs of $935 incurred during 2010 related to the workforce reduction initiative. Professional fees also decreased as a
33
result of lower annual rates and a reduction in information technology project support costs in the current year.
Our consolidated depreciation and amortization expense increased $2,101 in 2010 compared to 2009 primarily due to the continued expansion of the network and success-based capital projects undertaken within the residential and business broadband service territories. The change in depreciation and amortization expense was also impacted by a change in accounting estimate recorded during 2010, as described below.
During the first quarter of 2010, we completed our triennial review that evaluated the appropriateness of the estimated useful lives of our property, plant and equipment for all segments. The evaluation considered our investment and business strategy, reliability and historical performance data of certain assets, as well as the impacts of competition and anticipated technological change. As a result of this evaluation, effective January 1, 2010, we increased the estimated useful lives of general purpose software, general purpose hardware and certain central office equipment. We decreased the lives of certain of our customer premise equipment and outside plant categories. During the year ended December 31, 2010, this change in estimate decreased consolidated depreciation and amortization expense by $1,241 and increased consolidated net income by $741 ($0.05 per share).
Income from Operations and Adjusted EBITDA
Income from operations and adjusted EBITDA increased $1,621 and $4,613, respectively, in 2010 compared to 2009 as a result of the continued growth in our broadband services and a reduction in operating expenses through cost containment efforts implemented during 2010. We continue to maintain positive adjusted EBITDA growth by successfully replacing the declines in the Telecom segment with growth in our Broadband segment.
Reclassifications
Certain amounts in our 2009 and 2008 consolidated financial statements have been reclassified to conform to the presentation of our 2010 consolidated financial statements. Operating expenses have been reclassified for a change during the third quarter of 2010 in the classification of customer technical support costs from customer operations and selling to cost of services and products. Prior period costs have been reclassified to conform to the current year presentation.
In addition, the calculation of certain select operating metrics has been revised to reflect the consistent application of customer counts within the Broadband segment. Accordingly, where necessary, prior period metric calculations have been revised to conform to current practice.
34
Segment Results of Operations
Broadband
| |
2010 | 2009 | $Change | %Change | |||||||||||
|---|---|---|---|---|---|---|---|---|---|---|---|---|---|---|---|
Residential revenues: |
|||||||||||||||
Data |
$ | 48,878 | $ | 45,061 | $ | 3,817 | 8 | % | |||||||
Video |
49,139 | 47,522 | 1,617 | 3 | |||||||||||
Voice |
26,461 | 25,897 | 564 | 2 | |||||||||||
Total residential revenues |
124,478 | 118,480 | 5,998 | 5 | |||||||||||
Business |
46,209 | 39,554 | 6,655 | 17 | |||||||||||
Access |
2,235 | 1,628 | 607 | 37 | |||||||||||
Other |
1,624 | 1,560 | 64 | 4 | |||||||||||
Total operating revenues from external customers |
174,546 | 161,222 | 13,324 | 8 | |||||||||||
Intersegment revenues |
564 | 438 | 126 | 29 | |||||||||||
Operating expenses: |
|||||||||||||||
Cost of services and products(1) |
101,205 | 93,308 | 7,897 | 8 | |||||||||||
Customer operations and selling |
21,878 | 24,025 | (2,147 | ) | (9 | ) | |||||||||
General and administrative |
17,199 | 20,518 | (3,319 | ) | (16 | ) | |||||||||
Total operating expenses |
140,282 | 137,851 | 2,431 | 2 | |||||||||||
Depreciation and amortization |
49,621 | 47,359 | 2,262 | 5 | |||||||||||
Loss from operations |
(14,793 | ) | (23,550 | ) | 8,757 | 37 | |||||||||
Loss from continuing operations |
(12,873 | ) | (20,782 | ) | 7,909 | 38 | |||||||||
Adjusted EBITDA(2) |
37,473 | 25,590 | 11,883 | 46 | |||||||||||
- (1)
- Exclusive of depreciation and amortization.
- (2)
- A non-GAAP measure. See the Non-GAAP Measures section below for additional information and reconciliation to the most directly comparable GAAP measure.
Broadband Segment Overview
Adjusted EBITDA and loss from operations for the Broadband segment has continued to improve over the last three years and is reflective of our long-term strategy to invest in and grow the Broadband business. The investment in our network over the last several years has created a next-generation platform, which enables us to grow revenues through increased penetration of our existing network as well as create new long-term revenue opportunities with only nominal capital expenditures. We continue to successfully migrate Telecom customers to our Broadband VoIP product mitigating the loss of Telecom voice RGUs. The successful launch during 2010 of our ADTV product in the Sacramento market and switched digital video and DOCSIS 3.0 in our Kansas City market has enabled us to capture customers who seek the high data speeds and enhanced products our superior network provides. As a result, data, video and voice revenues continued to increase for both residential and business services. Growth in business revenues significantly contributed to the increase in adjusted EBITDA in 2010 as a result of an increase in business customers primarily in the Kansas City market. Data center and wireless carrier backhaul services in the Sacramento market also contributed to the increase in business revenues. We anticipate continued growth in both data center and wireless carrier backhaul services as consumer demand for managed services and wireless data continues to increase.
In addition, during 2010, we implemented a strategic restructuring designed to improve operating efficiencies and enhance our focus on the growth of the Broadband segment. This cost cutting initiative resulted in cost savings as a result of a reduction in the workforce and reduced professional fees.
35
Broadband Segment Operating Revenues
Residential Revenues
Broadband residential revenues increased $5,998 in 2010 compared to 2009. The increase in Broadband operating revenues was due in part to the growth of Broadband residential RGUs of 3% as of December 31, 2010 compared to 2009. Broadband residential revenues also increased as a result of higher pricing for video and data services during 2010. We are realizing the benefits of the investment we made in our network over the last several years. Our superior fiber network enables us to cost effectively provide our customers with faster data speeds, offer new services and upgrade existing services as we continue to enhance the value of our broadband services for our customers. The launch of DOCSIS 3.0 in our Kansas City market significantly enhanced our hybrid fiber coaxial ("HFC") network, which enables us to offer our customers faster data speeds and additional HD channels. The success of our ADTV product in our Sacramento market has resulted in higher take rates for our triple-play services as a bundled package. We anticipate continued growth in residential broadband RGUs and average revenue per user resulting from our VoIP phone service, our ADTV product which launched in January 2010 and an increase in residential fiber marketable homes in 2011 through the expansion of our network in our Kansas City market.
Data
We offer high speed Internet access at symmetrical speeds of up to 50 Mbps, depending on the nature of the network facilities that are available, the level of service selected and the location. The reliability and high speeds of the data service in both the Sacramento and Kansas City markets enhance other services such as VoIP and Digital Phone, where customers manage phone services through the online SureWest portal. Through the SureWest portal, customers can manage their VoIP or Digital Phone service and access a variety of value added features and enhancements that are designed to take advantage of the speed of the Internet service we provide.
Our residential data revenues increased $3,817 in 2010 compared to 2009 primarily as a result of a 1% increase in data RGUs and higher price points on our data services, as discussed above.
Video
Our video services range from limited basic service to our newest product offering ADTV. ADTV is currently deployed through our copper and fiber networks in the greater Sacramento region. The integration of the new Mediaroom™ platform includes a Whole Home DVR, which allows customers the ability to watch recorded shows on any television in the house, record multiple shows at one time and utilize an intuitive on-screen guide and user interface. Our services primarily are delivered utilizing FTTH and FTTN networks, which allow us to offer a high quality experience with digital TV packages. Our full digital video package provides access to approximately 330 and 320 channels in our California and Kansas City markets, respectively, including premium and pay-per-view channels, VOD service, premium VOD channels, music channels and an interactive, on-screen program guide. Digital video subscribers can also subscribe to additional services, including a DVR and HDTV. We offer 74 and 67 HD channels in our California and Kansas City markets, respectively.
Residential video revenues increased $1,617 in 2010 compared to 2009. Revenues increased as a result of a 5% increase in video RGUs and higher pricing on many of our video service offerings, as discussed above. During 2010, we continued to enhance the subscriber value for our broadband services by offering new products and features including ADTV, a Whole Home DVR, faster data speeds and additional channels including premium, VOD and HD channels.
36
Voice
We offer phone services that provide local and long-distance calling and include features such as caller ID and call waiting. Our VoIP phone service is offered in the Sacramento market and is available in packages ranging from basic telephone service to unlimited local and domestic long distance calling plans. Nearly all of our VoIP phone service plans include enhanced calling features such as caller ID on TV, Find Me/Follow Me, sequential ringing and selective call acceptance and rejection. Voice RGUs in the Sacramento market increased 12% as of December 31, 2010 compared to 2009. As of December 31, 2010, approximately 18% of the homes in our Sacramento market have subscribed to our VoIP phone service. Our VoIP phone service in the Sacramento market offers our customers, including those in the Telecom service territory an alternative to traditional circuit switched land line service and presents our customers with a more competitive triple-play offering with increased options and multiple packages.
Residential voice revenues increased $564 in 2010 compared to 2009 primarily as a result of growth in voice RGUs of 5% in that same time period. The continued success in migrating telecom customers to our Broadband VoIP product significantly contributed to the increase in voice RGUs.
Business Revenues
We provide a variety of business communications services to small, medium and large business customers. The services we offer to our business customers include: fiber-optics-based high-speed Internet, customized data and Ethernet transport services, data center and disaster recovery solutions, traditional landline and VoIP phone services, wireless backhaul and digital TV.
Business revenues increased $6,655 due primarily to a 7% increase in business customers as of December 31, 2010 compared to 2009. Our Kansas City operations contributed a significant portion of the business revenue growth. Average monthly revenue per user ("ARPU") also increased 6% in 2010 compared to 2009 as a result of new revenue opportunities such as wireless backhaul services.
Wireless backhaul revenue also contributed to the growth in the business revenue during 2010. We anticipate backhaul revenue will continue to grow as wireless carriers, faced with escalating consumer and business demand for mobile broadband traffic, are forced to increase backhaul capacity. Our existing fiber-optic network provides the capacity to secure new wireless carrier backhaul agreements and create new long-term revenue opportunities without significant additional capital expenditures.
Access Revenues
Access revenues increased $607 in 2010 compared to 2009. The increase was mostly attributable to cash settlements received during the quarter ended March 31, 2010 from certain telecommunications carriers relating to disputed carrier access charges which were fully reserved in prior year periods.
Broadband Segment Operating Expenses
Total operating expenses in the Broadband segment increased $2,431 in 2010 compared to 2009.
Cost of services and products (exclusive of depreciation and amortization) increased $7,897 in 2010 compared to 2009. The increase in costs in the current year was largely due to direct costs incurred to provide our voice, video and data services. Video programming fees are paid to programming networks to license the programming we distribute to our video customers. Video programming costs continue to increase due to the growth in residential video RGUs, the expansion of channels offered and an increase in costs on a per subscriber basis and per program channel, particularly for sports and HD channels.
We also incur network access and transport costs to provide data and voice services to our customers. Transport costs increased as a result of growth in our business customer base primarily in the Kansas City market. In addition, due to the rising demand for our VoIP product in the Sacramento market and the
37
additional capacity required to handle the increasing volume of data usage, network access costs have increased in the current year period. Network access costs include costs paid to external vendors as well as our Telecom segment, in accordance with the provisions of a wholesale access agreement. The wholesale access agreement enables the Broadband segment to offer high-speed Internet, VoIP, video and wireless backhaul services to its customers within the Telecom segment territory.
Customer operations expense decreased $2,147 in 2010 compared to 2009. Product marketing and advertising costs declined as a result of a reduction in radio advertising in the current year. However, selling expenses, primarily salaries and wages, commissions and customer events, increased to promote the launch of our new ADTV product during 2010.
General and administrative expense decreased $3,319 in 2010 compared to 2009. The decrease in costs was primarily due to (i) a decline in labor costs resulting from a reduction in headcount, (ii) a decrease in professional fees and (iii) a reduction in information technology costs related to system maintenance and development. However, severance costs of approximately $451 were incurred during 2010 related to the workforce reduction initiative, as discussed in the consolidated overview section above.
Depreciation and amortization increased $2,262 in 2010 compared to 2009 due primarily to the continued expansion and enhancement of the broadband network and success-based capital projects.
Telecom
| |
2010 | 2009 | $Change | %Change | |||||||||||
|---|---|---|---|---|---|---|---|---|---|---|---|---|---|---|---|
Residential |
$ | 17,276 | $ | 24,504 | $ | (7,228 | ) | (29 | )% | ||||||
Business |
34,160 | 35,457 | (1,297 | ) | (4 | ) | |||||||||
Access |
16,895 | 19,727 | (2,832 | ) | (14 | ) | |||||||||
Other |
622 | 790 | (168 | ) | (21 | ) | |||||||||
Total operating revenues from external customers |
68,953 | 80,478 | (11,525 | ) | (14 | ) | |||||||||
Intersegment revenues |
20,637 | 19,897 | 740 | 4 | |||||||||||
Operating expenses: |
|||||||||||||||
Cost of services and products(1) |
23,012 | 26,977 | (3,965 | ) | (15 | ) | |||||||||
Customer operations and selling |
9,938 | 8,843 | 1,095 | 12 | |||||||||||
General and administrative |
14,449 | 15,067 | (618 | ) | (4 | ) | |||||||||
Total operating expenses |
47,399 | 50,887 | (3,488 | ) | (7 | ) | |||||||||
Depreciation and amortization |
12,204 | 12,365 | (161 | ) | (1 | ) | |||||||||
Income from operations |
29,987 | 37,123 | (7,136 | ) | (19 | ) | |||||||||
Income from continuing operations |
16,228 | 21,449 | (5,221 | ) | (24 | ) | |||||||||
Adjusted EBITDA(2) |
45,038 | 52,308 | (7,270 | ) | (14 | ) | |||||||||
- (1)
- Exclusive of depreciation and amortization.
- (2)
- A non-GAAP measure. See the Non-GAAP Measures section below for additional information and reconciliation to the most directly comparable GAAP measure.
38
Telecom Segment Overview
Telecom revenues continue to experience an overall decline resulting from an industry-wide trend of access line attrition and scheduled reductions in the subsidies we receive from governmental regulatory agencies. Access revenues will continue to decline through 2011 due to scheduled reductions in the CHCF subsidy and the elimination of transport interconnection revenue, which is effective January 1, 2011. However, we anticipate Telecom revenue declines to slow over the next several years as the scheduled phased reductions of our subsidies are complete. Revenues earned by the Telecom segment through a wholesale access agreement with the Broadband segment increased during 2010. We anticipate the wholesale revenue stream to continue to trend favorably as consumers within the Telecom segment service territory continue to demand more broadband services. As technology and the regulatory environment changes within the communications industry, the Telecom segment will increasingly consist of services that generate higher margins such as business and wholesale services. Business and wholesale services comprised 61% of total Telecom revenues at December 31, 2010 compared to 55% and 50% in 2009 and 2008, respectively.
Despite the reduction in subsidies and industry-wide declines in access lines, the Telecom segment was able to maintain favorable margins during 2010 through cost containment efforts including a strategic restructuring that reduced our consolidated workforce by approximately 60 positions and a reduction in professional fees. The Telecom segment also continues to contribute the majority of our income from continuing operations and free cash flow.
Telecom Segment Operating Revenues
Residential Revenues
SureWest Telephone offers several different phone service options, from basic local service packages to unlimited California and nationwide flat-rate plans. All of the plans include options for voicemail and other calling features such as caller ID and call forwarding. SureWest Telephone residential revenues decreased $7,228 in 2010 compared to 2009 as we continue to be impacted by the industry-wide decline in residential access lines and competition from wireless, wireline, and digital phone competitors (including SureWest Broadband). Residential subscribers and voice RGUs declined 25% as of December 31, 2010 compared to the same period in 2009. We continue to mitigate additional voice access line and operating revenue losses through our VoIP phone service offered to customers within the Telecom service area through our Broadband segment. As a result, we expect a portion of the Telecom segment's voice revenue will continue to shift to the VoIP service being offered by our Broadband segment. As of December 31, 2010, 38% of the decline in Telecom voice RGUs in 2010 was due to customers who have transferred to SureWest Broadband's VoIP phone service rather than moving to competitors. See the Broadband segment residential revenue section above for a more detailed discussion regarding VoIP and other services offered by SureWest Broadband.
Business Revenues
We provide a variety of business service offerings to small, medium and large business customers, including many services over our advanced fiber network. The services we offer to our business customers include, but are not limited to high-speed Internet, customized data and Ethernet transport services, data center and disaster recovery solutions, traditional landline and scalable IP communication systems.
SureWest Telephone business revenues decreased $1,297 in 2010 compared to 2009. The decrease in revenue was mostly due to the 7% decline in business customers which resulted from the strained economic conditions for small and medium sized businesses and continued strong competitive pressures, as discussed above. The decrease in business revenue was mitigated in part by a price increase for data services effective during the third quarter of 2010 resulting in an increase to ARPU of 4% as of December 31, 2010 compared to the same period in 2009.
39
Access Revenues
Access revenues, which include interstate and intrastate switched access revenue, interstate common line ("CL") revenue and support payments from the CHCF, decreased $2,832 in 2010 compared to 2009. As anticipated, CHCF support received during the year ended December 31, 2010 decreased $2,040 compared to the prior year as a result of the scheduled reduction in subsidies received from the CHCF. Switched access revenue also decreased in 2010 compared to 2009 due to a decline in carrier access usage associated with the reduction in access lines. See the Regulatory Matters section below for a more detailed discussion regarding SureWest Telephone's regulated revenues.
Intersegment Revenues
Intersegment revenues consist predominately of revenues earned through a wholesale access agreement between the Telecom and Broadband segments. The Telecom segment supplies wholesale access services through its network to the Broadband segment, which enables the Broadband segment to offer high-speed Internet, VoIP, video and wireless backhaul services to customers residing within the Telecom service territory. Wholesale access and Digital Subscriber Line ("DSL") intersegment revenue increased in 2010 compared to 2009 and is anticipated to continue to increase with heightened demand for the Broadband segment's VoIP and ADTV products offered in the Telecom segment service territory. See the Broadband operating revenue section above for more detailed discussion of the Broadband revenues and product offerings.
Telecom Segment Operating Expenses
Total operating expenses for the Telecom segment decreased $3,488 in 2010 compared to 2009. During 2010, we implemented cost reduction initiatives in an effort to improve operating efficiencies and align operating costs with the decline in Telecom revenues.
Cost of services and products (exclusive of depreciation and amortization) decreased $3,965 in 2010 compared to 2009. Costs to support local and long distance services decreased as a result of the decline in residential voice RGUs and business customers. Rent and utility costs also declined as a result of cost savings from a consolidation of office space. In addition, labor costs decreased due to a reduction in headcount and the outsourcing of certain network and property maintenance services in 2010.
Customer operations expense increased $1,095 in 2010 compared to 2009. The increase in the current year was mostly attributable to an increase in advertising, promotion, and sales force costs to support product offerings in the Telecom segment service territory.
General and administrative expense decreased $618 in 2010 compared to 2009. The decrease in costs was due primarily to (i) a reduction in professional fees as a result of lower annual rates, (ii) a decline in pension expense associated with our frozen defined benefit pension plan and (iii) lower information technology project support costs in the current year. The decrease was offset in part by employee severance costs of approximately $484 incurred during 2010 related to the workforce reduction initiative, as discussed in the consolidated overview section above.
Regulatory Matters
Revenues subject to regulation, which include such telecommunications services as local telephone service, network access service and toll service, are derived from various sources, including:
- •
- business and residential subscribers of basic exchange services;
- •
- surcharges mandated by state commissions;
- •
- long distance carriers for network access service;
- •
- competitive access providers and commercial enterprises for network access service;
- •
- interstate pool settlements from NECA;
40
- •
- support payments from federal or state programs; and
- •
- support payments from the CHCF, recovering costs of services including extended area service.
Certain of our interstate telecommunications service rates are subject to regulation by the Federal Communications Commission ("FCC"). Interstate switched and special access rates are established through a SureWest Telephone tariff filed with the FCC. For interstate CL charges, SureWest Telephone concurs with tariffs filed by National Exchange Carrier Association ("NECA"). Intrastate service rates are subject to regulation by state commissions. Prices for intrastate telecommunications services are established through tariffs or through other regulatory mechanisms, including, in California, service guides. Pending and future regulatory actions may have a material impact on our consolidated financial position and results of operations.
FCC Matters
Under current FCC rules governing rate making, SureWest Telephone is required to establish rates for its interstate telecommunications services based on projected demand usage for the various services. SureWest Telephone projects its earnings through the use of annual cost separation studies, which utilize estimated total cost information and projected demand usage. Carriers are required to follow FCC rules in the preparation of these annual studies. SureWest Telephone determines actual earnings from its interstate rates as actual volumes and costs become known. The FCC monitors SureWest Telephone's interstate earnings.
The FCC requires SureWest Telephone to prepare and submit periodic cost separation studies related to certain NECA CL accounts receivable balances. As a result of the cost separation filings, SureWest Telephone may change its estimates for certain NECA CL accounts receivable balances related to the prior year monitoring periods. During the years ended December 31, 2010 and 2009 we did not record any significant changes in estimates related to prior year monitoring periods.
The FCC was directed by Congress to develop a National Broadband Plan ("NBP") as part of the American Recovery and Reinvestment Act of 2009. In March 2010, after taking extensive public comment, the FCC released the full text of its NBP, which contains policy recommendations on a variety of issues that the FCC has linked to expanded broadband deployment. The policy recommendations include guiding principles to foster competition in broadband, telephone, wireless and cable services over the next decade, including recommendations related to universal service fund ("USF") reform, intercarrier compensation, cable set-top boxes and spectrum reallocation, among others. The NBP recommendations most relevant to the Company include shifting the current USF mechanisms that support universal voice telephone services to support of universal broadband deployment and the phased reduction of intercarrier access compensation levels to local reciprocal compensation levels, with a potential phase-out of all such compensation within ten years. Some of these recommendations only restate pre-existing FCC proposals in current rulemakings while others raise new issues. The FCC has begun some proceedings to implement aspects of the National Broadband Plan.
In an April 6, 2010 decision, a Federal appeals court found that the FCC lacked authority over certain Internet-related practices of Comcast. This decision came during a proceeding that had been initiated by the FCC to adopt rules related to the conduct of providers of retail Internet services. Notwithstanding the Federal appeals court decision, on December 21, 2010, the FCC adopted rules requiring that such providers honor certain operating principles, including principles of (i) transparency, (ii) no blocking, (iii) no unreasonable discrimination and (iv) reasonable network management in connection with their Internet services. The FCC order has already been appealed.
In addition, the FCC initiated action on February 8, 2011 to again consider reform of the current structure for intercarrier compensation and to consider rules for transitioning the current universal service fund to support broadband deployment. The FCC's actions in these and future proceedings could significantly alter the structure of these arrangements, and affect the costs and sources or revenue for affected service
41
providers. Action in any of these proceedings could have a material impact on us. We will continue to monitor these matters, participate in them as we deem appropriate, and assess the potential impact on our consolidated financial position and results of operations.
California Public Utility Commission ("CPUC") Matters
A CPUC decision in August 2005 allowed SureWest Telephone to continue receiving our $11,500 annual interim draw from the CHCF. The CHCF was previously authorized by the CPUC to offset SureWest Telephone's intrastate regulated operating expenses on an interim basis. In August 2006, we requested permission from the CPUC to implement a graduated phase-down of our annual $11,500 interim draw. In September 2007, the CPUC issued Decision 07-09-002 which provides for SureWest Telephone to phase-down its interim annual CHCF draw over a five-year period. The phase-down of the interim draw began in January 2007, initially reducing the annual $11,500 interim draw to $10,200, and in each subsequent year will be incrementally reduced by $2,040. In 2010 our interim CHCF draw was $4,080. We anticipate our 2011 interim CHCF draw will be $2,040.
In an ongoing proceeding relating to the New Regulatory Framework (under which SureWest Telephone has been regulated since 1996), the CPUC adopted Decision 06-08-030 in 2006, which grants carriers broader pricing freedom in the provision of telecommunications services, bundling of services, promotions and customer contracts. This decision adopted a new regulatory framework, the Uniform Regulatory Framework ("URF"), which among other things (i) eliminates price regulation and allows full pricing flexibility for all new and retail services except basic residential services, which limits increases to $3.25 per year during 2009 and 2010, (ii) allows new forms of bundles and promotional packages of telecommunication services, (iii) allocates all gains and losses from the sale of assets to shareholders and (iv) eliminates almost all elements of rate of return regulation, including the calculation of shareable earnings. Beginning January 1, 2011, the URF Incumbent Local Exchange Carriers ("ILECs") are allowed full pricing flexibility for the basic residential rate. On December 31, 2010, the CPUC issued a ruling to initiate a new phase to assess whether, or to what extent, the level of competition in the telecommunications industry is sufficient to control prices for the four largest ILECs in the state, including SureWest Telephone. The CPUC's actions in this and future proceedings could lead to new rules and an increase in government regulation.
In December 2007, the CPUC issued a final decision in a proceeding investigating the continued need for an intrastate access element called the transport interconnection charge ("TIC"). The final decision capped SureWest Telephone's intrastate access charges through 2010 and the TIC was eliminated effective January 1, 2011. SureWest Telephone will have an opportunity to recover all or part of our lost TIC revenue elsewhere, including residential rate adjustments, as well as through growth of our Broadband segment. We anticipate a reduction in our 2011 intrastate access revenues of approximately $2,050.
Other Regulatory Matters
We are also subject to a number of regulatory proceedings occurring at the federal and state levels that may have a material impact on our operations. The FCC and state commissions have authority to issue rules and regulations related to our business. A number of proceedings are pending or anticipated that are related to such telecommunications issues as competition, interconnection, access charges, intercarrier compensation, broadband deployment, consumer protection and universal service reform. Some proceedings may authorize new services to compete with our existing services. Proceedings that relate to our cable television operations include rulemakings on set top boxes, carriage of programming, industry consolidation and ways to promote additional competition. There are various on-going legal challenges to the scope or validity of FCC orders that have been issued. As a result, it is not yet possible to determine fully the impact of the related FCC rules and regulations on our operations.
42
Non-Operating Items
Other Income and Expense, Net
Consolidated interest expense decreased $2,972 in 2010 compared to 2009, primarily due to a decrease in long-term debt and a decline in interest rates on our outstanding debt subject to London Interbank Offered Rates.
We received patronage dividends of $979 and $963 during 2010 and 2009, respectively. We earn patronage dividends from CoBank, ACB ("CoBank") based on our share of the net income earned by CoBank. We record the receipt of the patronage dividends against interest expense.
Income Taxes
Income taxes increased $1,348 in 2010 compared to 2009 due primarily to an increase in income before income taxes, an increase in state deferred income taxes related to apportionment factor changes in 2010 resulting from the acquisition of our Kansas City operation and offset by a decrease in permanent differences related to stock compensation in 2010. Changes in state apportionment factors, based on operational results, may affect future effective tax rates. The effective federal and state income tax rates for continuing operations were 50% and 75% for the years ended December 31, 2010 and 2009, respectively. The decrease in the effective tax rate in the current year compared to the prior year was due primarily to a reduction in permanent differences related to stock compensation.
We have federal net operating loss carryforwards of approximately $37,701 ($1,528, of which are subject to additional limitations) which will begin to expire in 2026 if not used. It is reasonably likely that federal net operating loss carryforwards will increase during 2011 as a result of bonus depreciation provisions included in the Tax Relief Act of 2010. We have state net operating loss carryforwards of approximately $36,820 which will begin to expire in 2016 if not used. We also have approximately $1,847 and $1,834 of state income tax hiring credit carryforwards as of December 31, 2010 and 2009, respectively, which do not expire. Management believes that the future utilization of these credits is uncertain and has placed a full valuation allowance on these credits. The valuation allowance increased $9 and $77 during 2010 and 2009, respectively.
43
Segment Results of Operations
Broadband
| |
2009 | 2008 | $Change | %Change | |||||||||||
|---|---|---|---|---|---|---|---|---|---|---|---|---|---|---|---|
Residential revenues: |
|||||||||||||||
Data |
$ | 45,061 | $ | 39,966 | $ | 5,095 | 13 | % | |||||||
Video |
47,522 | 38,520 | 9,002 | 23 | |||||||||||
Voice |
25,897 | 20,619 | 5,278 | 26 | |||||||||||
Total residential revenues |
118,480 | 99,105 | 19,375 | 20 | |||||||||||
Business |
39,554 | 33,077 | 6,477 | 20 | |||||||||||
Access |
1,628 | 1,453 | 175 | 12 | |||||||||||
Other |
1,560 | 1,706 | (146 | ) | (9 | ) | |||||||||
Total operating revenues from external customers |
161,222 | 135,341 | 25,881 | 19 | |||||||||||
Intersegment revenues |
438 | 539 | (101 | ) | (19 | ) | |||||||||
Operating expenses |
|||||||||||||||
Cost of services and products(1) |
93,308 | 79,053 | 14,255 | 18 | |||||||||||
Customer operations and selling |
24,025 | 22,098 | 1,927 | 9 | |||||||||||
General and administrative |
20,518 | 21,499 | (981 | ) | (5 | ) | |||||||||
Total operating expenses |
137,851 | 122,650 | 15,201 | 12 | |||||||||||
Depreciation and amortization |
47,359 | 40,491 | 6,868 | 17 | |||||||||||
Loss from operations |
(23,550 | ) | (27,261 | ) | 3,711 | 14 | |||||||||
Loss from continuing operations |
(20,782 | ) | (23,684 | ) | 2,902 | 12 | |||||||||
Adjusted EBITDA(2) |
25,590 | 12,899 | 12,691 | 98 | |||||||||||
- (1)
- Exclusive of depreciation and amortization.
- (2)
- A non-GAAP measure. See the Non-GAAP Measures section below for additional information and reconciliation to the most directly comparable GAAP measure.
Broadband Segment Operating Revenues
Operating revenues from external customers in the Broadband segment increased $25,881 in 2009 compared to 2008. The increase in operating revenues was due in part to the acquisition of Everest in February 2008, as described above, as well as from growth in residential RGUs and business customers.
Residential Revenues
Broadband residential revenues increased $19,375 in 2009 compared to 2008. Broadband residential RGUs increased 4% as of December 31, 2009 compared to the same period in 2008.
Data
Our residential data revenues increased $5,095 in 2009 compared to 2008 as a result of higher price points on our data services, which were effective beginning in January and November 2009, and the addition of our Kansas City operations. Data RGUs increased 1% as of December 31, 2009 compared to the same period in 2008.
44
Video
Residential video revenues increased $9,002 in 2009 compared to 2008. Revenues increased as a result of higher pricing on our video services, which were effective beginning in January and November 2009, and demand for enhanced video offerings such as VOD, DVR and HDTV.
Voice
Residential voice revenues increased $5,278 in 2009 compared to 2008. The increase was due in part to the growth in voice RGUs of 13% as of December 31, 2009 compared to the same period in 2008. The launch of our VoIP Digital Phone product in the Sacramento market in March 2008, including in the Telecom service territory, resulted in elevated take rates and an increase in Broadband residential triple-play RGUs. As of December 31, 2009, approximately 14% of the homes in our Sacramento market have subscribed to our VoIP phone service. The total voice penetration in the markets we serve was 23% as of December 31, 2009.
Business Revenues
Business revenues increased $6,477 in 2009 compared to 2008 due primarily to a 7% increase in business customers as of December 31, 2009 compared to the same period in 2008. A significant portion of the business revenue growth was due to our Kansas City operations.
Broadband Segment Operating Expenses
Total operating expenses in the Broadband segment increased $15,201 in 2009 compared to 2008. The increase was due in part to the addition of our Kansas City operations in February 2008 and an approximate $1,475 increase in costs related to our Pension Plan.
Cost of services and products (exclusive of depreciation and amortization) increased $14,255 in 2009 compared to 2008. The increase in costs in 2009 was largely due to direct costs incurred to provide video services. Costs to provide data and voice services increased due to the additional capacity required to handle the increasing volume of data usage, including our VoIP digital phone product in the Sacramento market.
Customer operations expense increased $1,927 in 2009 compared to 2008. The increase in 2009 was mostly attributable to an increase in salaries and wages and advertising costs in the Kansas City market. We experienced a modest decrease in the Sacramento market in sales and advertising costs due to decreases in radio and television advertising in 2009.
General and administrative expense decreased $981 in 2009 compared to 2008 primarily due to decreases in (i) information technology costs related to system maintenance and development, including integration of our Kansas City operations and increased production support projects in the prior year period and (ii) headcount in 2009.
Depreciation and amortization increased $6,868 in 2009 compared to 2008 due primarily to the acquisition of the Kansas City operations in February 2008, as well as the continued expansion of the broadband network and success-based capital projects.
45
Telecom
| |
2009 | 2008 | $Change | %Change | |||||||||||
|---|---|---|---|---|---|---|---|---|---|---|---|---|---|---|---|
Residential |
$ | 24,504 | $ | 32,464 | $ | (7,960 | ) | (25 | )% | ||||||
Business |
35,457 | 38,066 | (2,609 | ) | (7 | ) | |||||||||
Access |
19,727 | 23,732 | (4,005 | ) | (17 | ) | |||||||||
Other |
790 | 770 | 20 | 3 | |||||||||||
Total operating revenues from external customers |
80,478 | 95,032 | (14,554 | ) | (15 | ) | |||||||||
Intersegment revenues |
19,897 | 18,455 | 1,442 | 8 | |||||||||||
Operating expenses: |
|||||||||||||||
Cost of services and products(1) |
26,977 | 28,915 | (1,938 | ) | (7 | ) | |||||||||
Customer operations and selling |
8,843 | 10,841 | (1,998 | ) | (18 | ) | |||||||||
General and administrative |
15,067 | 16,793 | (1,726 | ) | (10 | ) | |||||||||
Total operating expenses |
50,887 | 56,549 | (5,662 | ) | (10 | ) | |||||||||
Depreciation and amortization |
12,365 | 14,536 | (2,171 | ) | (15 | ) | |||||||||
Income from operations |
37,123 | 42,402 | (5,279 | ) | (12 | ) | |||||||||
Income from continuing operations |
21,449 | 24,510 | (3,061 | ) | (12 | ) | |||||||||
Adjusted EBITDA(2) |
52,308 | 56,340 | (4,032 | ) | (7 | ) | |||||||||
- (1)
- Exclusive of depreciation and amortization.
- (2)
- A non-GAAP measure. See the Non-GAAP Measures section below for additional information and reconciliation to the most directly comparable GAAP measure.
Telecom Segment Operating Revenues
Operating revenues from external customers in the Telecom segment decreased $14,554 in 2009 compared to 2008.
Residential Revenues
SureWest Telephone residential revenues decreased $7,960 in 2009 compared to 2008 as we continued to experience decreases in revenue due to competition from wireless, wireline, and digital phone competitors (including SureWest Broadband). Residential subscribers and voice RGUs declined approximately 29% as of December 31, 2009 compared to the same period in 2008. In addition, some competitors initiated marketing campaigns to include voice services targeted directly to residential subscribers within SureWest Telephone's service area.
Business Revenues
SureWest Telephone business revenues decreased by $2,609 in 2009 compared to 2008 largely due to the economic impact on small to medium sized businesses and the continued strong competitive pressures. In addition, subsequent to the sale of our Wireless business in May 2008 to Verizon, SureWest Telephone recorded additional business revenues of approximately $1,099 during the year ended December 31, 2008 for long distance services provided to Verizon during the transition of the wireless business to Verizon. The additional revenue in the prior year period temporarily increased ARPU during those periods. While our business customer base declined 8% as of December 31, 2009 compared to the same period in 2008, ARPU remained relatively flat, but would have shown an increase without the additional revenue from Verizon recognized in the same prior year period.
46
Access Revenues
Access revenues, which include switched access revenue, interstate CL revenue and draws from the CHCF, decreased $4,005 in 2009 compared to 2008. As anticipated, subsidies received during 2009 from the CHCF decreased by $2,040 compared to 2008. Switched access revenues also declined by approximately $2,710 in 2009 compared to 2008 due to declines in minutes of use associated with the reduction of residential voice services previously discussed. The decline in access revenues was partially offset by an increase in interstate CL settlements received from NECA of approximately $1,200 during the year ended December 31, 2009 as a result of a shift in revenue recovery from end users to the NECA pool. The increase in the interstate CL settlements includes a change in estimate to the NECA CL accounts receivable balance which resulted in a decrease to access revenue of $923 during the year ended December 31, 2009. See the Regulatory Matters section above for a more detailed discussion regarding SureWest Telephone's regulated revenues.
Telecom Segment Operating Expenses
Total operating expenses for the Telecom segment decreased $5,662 in 2009 compared to 2008. As discussed in the Residential Revenue section above, during 2009 we experienced a decline in voice RGUs due in part to subscribers opting to initiate VoIP digital phone service offered by our Broadband segment. As a result, certain of the operating costs associated with these subscribers are now included in the Broadband segment. The decrease in operating expenses in 2009 was offset in part by an increase in costs related to our Pension Plan of approximately $2,777.
Cost of services and products (exclusive of depreciation and amortization) decreased $1,938 in 2009 compared to 2008. This decrease was predominately due to the decline in local and long distance expenses as a result of decreases in voice RGUs and business customers of 29% and 8%, respectively, as of December 31, 2009 compared to the same prior year period. Additionally, during 2009 property maintenance costs declined through a consolidation of office space and cost cutting initiatives.
Customer operations expense decreased $1,998 in 2009 compared to 2008. The decrease in customer operations expense was due predominately to the decline in voice RGUs and business customers base, as discussed above, and to reduced spending on sales and advertising, which included radio and television advertising during 2009 in the Telecom segment service territory.
General and administrative expense decreased $1,726 in 2009 compared to 2008. The decrease was primarily due to (i) a decline in consulting and advisory fees and (ii) the incurrence in the prior year period of additional information technology costs related to production support projects.
Depreciation and amortization decreased $2,171 in 2009 compared to 2008. This decrease was due predominately to a portion of aerial and underground cable becoming fully depreciated in 2009 and a portion of general purpose software becoming fully depreciated during the third quarter of 2008.
Non-Operating Items
Other Income and Expense, Net
Consolidated investment income decreased $555 in 2009 compared to 2008. During 2008, we had higher cash and investment balances due primarily to the receipt of proceeds from the sale of certain non-core assets, including our Wireless business. The higher cash and investment balances in the prior year periods resulted in a decrease in investment income in the current year periods. Further, decreases in interest rates on our invested balances have also contributed to the reduction of investment income.
Consolidated interest expense decreased $808 in 2009 compared to 2008, primarily due to (i) the receipt of patronage dividends of $963 and $400 during 2009 and 2008, respectively, (ii) the impact of the loss on the
47
extinguishment of debt of $607 recorded during the quarter ended March 31, 2008 and (iii) offset by a decrease in capitalized interest of approximately $340.
Income Taxes
Income taxes decreased $1,133 in 2009 compared to 2008 due primarily to a decrease in income before income taxes, a decrease in state deferred income taxes related to apportionment factor changes in 2008 resulting from the acquisition of our Kansas City operations, offset by an increase in permanent differences resulting from the decrease in our tax-exempt interest income, a decrease in deductible dividends and a decrease in the tax deductions for certain stock compensation vesting in 2009. Changes in state apportionment factors, based on operational results, may affect our future effective tax rates. The effective federal and state income tax rates for continuing operations were 75.0% and 79.2% for the years ended December 31, 2009 and 2008, respectively. The decrease in the effective tax rate in 2009 compared to 2008 was due primarily to deferred state income tax related to apportionment changes offset by changes to permanent differences related to tax-exempt income, deductible dividends and stock compensation.
We had federal net operating loss carryforwards of approximately $16,869 ($1,528, of which are subject to additional limitations) which will begin to expire in 2026 if not used. We had state net operating loss carryforwards of approximately $11,726 which will begin to expire in 2016 if not used. We also had approximately $1,834 and $1,716 of state income tax hiring credit carryforwards as of December 31, 2009 and 2008, respectively, which do not expire. Management believes that the future utilization of these credits is uncertain and has placed a full valuation allowance on these credits. The valuation allowance increased $77 and $631 during 2009 and 2008, respectively.
Non-GAAP Measures
In addition to the results reported in accordance with US GAAP, we also use certain non-GAAP measures including Adjusted EBITDA and free cash flow to evaluate operating performance and to facilitate the comparison of our historical results and trends. These non-GAAP measures are also used to manage and evaluate the operating performance of our reportable segments. These financial measures are not a measure of financial performance under US GAAP and should not be considered in isolation or as a substitute for net income from continuing operations as a measure of performance and net cash provided by operating activities as a measure of liquidity. The calculation of these non-GAAP measures may not be comparable to similarly titled measures used by other companies. Reconciliations to the most directly comparable GAAP measure are provided below.
Adjusted EBITDA
Adjusted EBITDA represents net income (loss) from continuing operations excluding amounts for income taxes; depreciation and amortization; non-cash pension and certain post-retirement benefits; non-cash stock compensation; severance and other related termination costs; and all other non-operating income and expenses. Adjusted EBITDA is a common measure of operating performance in the telecommunications industry. Adjusted EBITDA helps us evaluate our performance by removing from our operating results non-cash items and items which do not relate to our core operating performance.
48
The following tables are a reconciliation of income (loss) from continuing operations to Adjusted EBITDA for the years ended December 31, 2010, 2009 and 2008:
2010
|
Broadband | Telecom | Consolidated | ||||||||
|---|---|---|---|---|---|---|---|---|---|---|---|
Income (loss) from continuing operations |
$ | (12,873 | ) | $ | 16,228 | $ | 3,355 | ||||
Add (subtract): |
|||||||||||
Income tax expense (benefit) |
(9,893 | ) | 13,247 | 3,354 | |||||||
Other (income) expense |
7,973 | 512 | 8,485 | ||||||||
Depreciation and amortization |
49,621 | 12,204 | 61,825 | ||||||||
Non-cash pension and post-retirement expense |
727 | 776 | 1,503 | ||||||||
Non-cash stock compensation expense |
1,449 | 1,396 | 2,845 | ||||||||
Severance and other related termination costs(1) |
469 | 675 | 1,144 | ||||||||
Adjusted EBITDA |
$ | 37,473 | $ | 45,038 | $ | 82,511 | |||||
- (1)
- As discussed in the Consolidated Overview section above, severance and other related termination costs were incurred as a result of the workforce reduction initiative implemented during the quarter ended June 30, 2010 in which approximately 60 positions were eliminated. Amounts exclude the termination costs related to stock compensation expense, which are included in non-cash stock compensation expense of the Adjusted EBITDA reconciliation.
2009
|
Broadband | Telecom | Consolidated | ||||||||
|---|---|---|---|---|---|---|---|---|---|---|---|
Income (loss) from continuing operations |
$ | (20,782 | ) | $ | 21,449 | $ | 667 | ||||
Add (subtract): |
|||||||||||
Income tax expense (benefit) |
(13,453 | ) | 15,459 | 2,006 | |||||||
Other (income) expense |
10,685 | 215 | 10,900 | ||||||||
Depreciation and amortization |
47,359 | 12,365 | 59,724 | ||||||||
Non-cash pension and post-retirement expense |
779 | 1,812 | 2,591 | ||||||||
Non-cash stock compensation expense |
1,002 | 1,008 | 2,010 | ||||||||
Adjusted EBITDA |
$ | 25,590 | $ | 52,308 | $ | 77,898 | |||||
2008
|
Broadband | Telecom | Consolidated | ||||||||
|---|---|---|---|---|---|---|---|---|---|---|---|
Income (loss) from continuing operations |
$ | (23,684 | ) | $ | 24,510 | $ | 826 | ||||
Add (subtract): |
|||||||||||
Income tax expense (benefit) |
(15,157 | ) | 18,296 | 3,139 | |||||||
Other (income) expense |
11,580 | (404 | ) | 11,176 | |||||||
Depreciation and amortization |
40,491 | 14,536 | 55,027 | ||||||||
Non-cash pension and post-retirement expense |
(738 | ) | (1,070 | ) | (1,808 | ) | |||||
Non-cash stock compensation expense |
407 | 472 | 879 | ||||||||
Adjusted EBITDA |
$ | 12,899 | $ | 56,340 | $ | 69,239 | |||||
49
Free Cash Flow
We define free cash flow as net income from continuing operations plus depreciation and amortization expense less capital expenditures. Free cash flow is used to measure operating cash flows available for corporate purposes after providing sufficient fixed asset additions to maintain current productive capacity.
The following table is a reconciliation of net cash provided by operating activities from continuing operations to consolidated free cash flow for the years ended December 31, 2010, 2009 and 2008:
| |
2010 | 2009 | 2008 | ||||||||
|---|---|---|---|---|---|---|---|---|---|---|---|
Net cash provided by operating activities from continuing operations |
$ | 63,553 | $ | 71,842 | $ | 50,778 | |||||
Less: Adjustments for all non-cash items and net changes in operating assets and liabilities |
(60,198 | ) | (71,175 | ) | (49,952 | ) | |||||
Income from continuing operations |
3,355 | 667 | 826 | ||||||||
Add: Depreciation and amortization |
61,825 | 59,724 | 55,027 | ||||||||
Less: Capital expenditures |
(52,560 | ) | (58,330 | ) | (86,489 | ) | |||||
Free cash flow |
$ | 12,620 | $ | 2,061 | $ | (30,636 | ) | ||||
By segment: |
|||||||||||
Broadband |
$ | (7,196 | ) | $ | (21,398 | ) | $ | (49,930 | ) | ||
Telecom |
21,146 | 24,459 | 20,527 | ||||||||
Corporate |
(1,330 | ) | (1,000 | ) | (1,233 | ) | |||||
Free cash flow |
$ | 12,620 | $ | 2,061 | $ | (30,636 | ) | ||||
Liquidity and Capital Resources
Overview
We generate significant cash flows from operating activities. We believe that we will be able to meet our current and long-term liquidity and capital requirements through our cash flow from operating activities, existing cash, cash equivalents and investments; through available borrowings under our existing credit facilities; and through our ability to obtain future external financing. Our primary use of cash in 2010 was for capital expenditures and scheduled payments of long-term debt (including interest). We anticipate continuing to use a substantial portion of our cash flow to fund our capital expenditures, invest in new business opportunities, fund network expansion, meet scheduled payments of long-term debt and fund the authorized share repurchase plan.
50
The following table summarizes our cash flows:
| |
Years Ended December 31, | ||||||||||
|---|---|---|---|---|---|---|---|---|---|---|---|
| |
2010 | 2009 | 2008 | ||||||||
Cash Flows Provided By (Used In) |
|||||||||||
Operating Activities: |
|||||||||||
Continuing operations |
$ | 63,553 | $ | 71,842 | $ | 50,778 | |||||
Discontinued operations |
– | (562 | ) | (1,605 | ) | ||||||
Investing Activities: |
|||||||||||
Continuing operations |
(46,945 | ) | (46,587 | ) | (183,292 | ) | |||||
Discontinued operations |
– | – | (176 | ) | |||||||
Financing Activities: |
|||||||||||
Continuing operations |
(21,160 | ) | (20,044 | ) | 106,021 | ||||||
Increase (Decrease) In Cash and Cash Equivalents |
$ | (4,552 | ) | $ | 4,649 | $ | (28,274 | ) | |||
Cash Flows Provided By Operating Activities
Net cash provided by continuing operating activities was $63,553 during 2010. Adjustments to net income of $3,355 to arrive at cash provided by operating activities primarily include non-cash charges of (i) depreciation and amortization of $61,825 due to capital investments principally in the Broadband segment, (ii) deferred income taxes of $2,699 and (iii) stock compensation expense of $2,845. Cash provided by operating activities was offset in part by a decrease in (i) accrued compensation of $2,174 related in part to the payment in the current year of 2009 incentive compensation and (ii) accrued liabilities of $5,709 related to the timing of various expenditures in the current year. As compared to 2009, the decrease in cash provided by continuing operations was primarily due to income tax refunds of $5,860 received in 2009 as compared to income taxes paid of $153 in 2010.
Cash Flows Used In Investing Activities
Net cash used in continuing investing activities was $46,945 during 2010 and was related to capital expenditures that were partially offset by proceeds from the sale of our auction rate security.
Capital Expenditures
Capital expenditures continue to be our primary recurring investing activity and were $52,560 in 2010. A significant portion of our capital spending has been invested into success-based capital projects within our Broadband segment as we continue to expand and enhance the network within the Sacramento region and Kansas City area. During 2010, we added 900 fiber marketable homes and upgraded 29,600 copper homes within the ILEC service territory to be video service capable. We also increased our capital investment in business services in order to optimize new long-term revenue opportunities and support the growth in wireless backhaul services. In 2011, we plan to continue to invest in our network through success-based capital projects and network expansion which will include the addition of 10,000 fiber marketable homes in the Kansas City area. Capital expenditures for 2011 are expected to be $60,000 to $70,000 of which approximately 25% are planned for network expansion and 55% are projected for success-based projects.
Proceeds from Sale of Discontinued Operations
In May 2008, we sold the operating assets of our Wireless business, SureWest Wireless, to Verizon for an aggregate cash purchase price of $69,746. A portion of the purchase price equal to $3,450 was placed in escrow, half of which was received during the quarter ended June 30, 2009 and the balance of which was received during the quarter ended June 30, 2010.
51
Auction Rate Security
As of December 31, 2009, we held one $3,700 par value auction rate security ("ARS") purchased from UBS Financial Services, Inc., a subsidiary of UBS AG ("UBS") with an estimated fair value of $3,054, which was measured using a discounted cash flow model. As of December 31, 2009, we also held an offer ("Right" or "put option") entitling us to sell at par our ARS anytime during a two-year period from June 30, 2010 through July 2, 2012.
As of December 31, 2009, the ARS and Right were classified as current assets in short-term investments on our consolidated balance sheet, as a result of our put option period under the Right. We continued to earn and receive interest on our ARS, as specified in the terms of the prospectus, during 2009.
On January 6, 2010, UBS exercised their rights under the Right to purchase our ARS at par of $3,700 and we recorded a gain of $646 on the ARS in the condensed consolidated statements of income during the quarter ended March 31, 2010. The gain was largely offset by a loss of $621 recorded on the Right resulting from the cancellation of our put option under the Right.
Cash Flows Provided By Financing Activities
Net cash provided by financing activities consists primarily of our proceeds and principal payments on long-term borrowings and planned repurchases of our common stock.
Long-term Debt
On January 29, 2010, we entered into a letter agreement with CoBank amending certain terms of the Third Amended and Restated Credit Agreement ("Credit Agreement"). The Credit Agreement included a provision which required permanent reductions of the Revolving Loan facility of $7,500 at December 31, 2009 and 2010. The letter agreement amended those provisions and included (i) an increase in the total Revolving Loan facility of $7,500, (ii) CoBank's share of the Revolving Loan facility will be permanently reduced by $5,000 (rather than $7,500) on December 31, 2010 and (iii) the total Revolving Loan facility will be $57,500. As a result of this letter agreement, our combined revolving commitment balance on our Revolving Loan and Swingline Loan facilities was $60,000.
As of December 31, 2010, $10,909 and $36,000 were outstanding on the Series A and Series B Senior Notes, respectively. As of December 31, 2010, $120,000, $30,000, $8,500 and zero were outstanding on the CoBank Term Loan A, Term Loan B, Revolving Loan and Swingline Loan facilities, respectively. We had no short-term borrowings as of December 31, 2010.
As of December 31, 2010, our combined revolving commitment balance was $55,000 ($60,000 less $5,000 permanent reduction on December 31, 2010). The available balance on the revolving commitments, as of December 31, 2010 was approximately $46,500.
Debt Covenants
Our Series A and Series B Senior Notes and the Credit Agreement contain financial and operating covenants that may restrict, among other things, the repurchase of the Company's common stock, the payment of dividends, the making of certain other restricted payments and the incurrence of additional indebtedness. The covenants also require us to maintain certain financial ratios and minimum levels of tangible net worth. If we fail to comply with the covenants and other restrictions, such as making timely interest or principal payments, it could lead to an event of default and the acceleration of our obligations under those agreements. As of December 31, 2010, we were in compliance with all of our debt covenants.
52
Our financial covenants as defined in the Series A and Series B Senior Notes and the Credit Agreement, measured quarterly, are as follows:
Financial Covenant
|
Required Ratio Level | Actual Performance at December 31, 2010 |
||
|---|---|---|---|---|
Leverage ratio |
Not more than 3.75 | 2.58 | ||
Interest coverage ratio |
Not less than 3.00 | 9.55 | ||
Consolidated net worth |
Not less than $160,000 | $272,058 | ||
Debt to capitalization |
Not more than 0.55 | 0.43 |
At December 31, 2010 and 2009, retained earnings of $112,058 and $109,183, respectively, were available for the payments described above.
Share Repurchase Program
In September 2010, our Board of Directors authorized the repurchase of up to an additional 1 million shares of our common stock, supplementing the previously authorized share repurchase program. The share repurchase program was originally approved in February 2000, and expanded in June 2002 and November 2006. This additional authorization increases the total number of shares available for repurchase under the program to 3.5 million. Shares are purchased from time to time in the open market or through privately negotiated transactions, subject to overall financial and market conditions. As of December 31, 2010, under the share repurchase program approximately 2.3 million shares of common stock have been repurchased and approximately 1.2 million additional outstanding shares remain authorized for repurchase by the Board of Directors.
We repurchased approximately 430 thousand shares, 108 thousand shares and 553 thousand shares during 2010, 2009 and 2008, respectively. The purchase of common shares did not have a substantive effect on the average number of common shares outstanding or the calculation of basic and diluted earnings per share for the years ended December 31, 2010, 2009 or 2008.
Sufficiency of Cash Resources
We had cash, cash equivalents and short-term investments at December 31, 2010 of $3,708. As discussed in the Long-term Debt section above, we have additional long-term borrowing capacity of approximately $55,000 available to us through our Revolving Loan facility of which, $8,500 was outstanding as of December 31, 2010. We believe our operating cash flows and our borrowing capacity are sufficient to satisfy our liquidity requirements for the next twelve months, while maintaining adequate cash and cash equivalents.
Our most significant use of funds in 2011 is expected to be for (i) budgeted capital expenditures of $60,000 to $70,000, (ii) scheduled payments of long-term debt of $15,636 and (iii) anticipated interest payments of $8,000. As discussed above, throughout the year we may repurchase shares of the Company's common stock in the open market at the prevailing market price up to an amount authorized by the Board of Directors.
A portion of the 2011 budgeted capital expenditures is at our discretion and dependent upon our working capital position, operating cash flows and ability to borrow. We can modify our planned construction and commitments if the results of operations or available capital so require. A significant portion of our 2011 budgeted capital expenditures are success based and is partially dependent on our ability to manage our growth and expansion. We are required to comply with our cable franchise agreements to continue our build-out in the franchise areas.
53
Contractual Obligations
As of December 31, 2010, our contractual obligations were as follows:
| |
Less than 1 Year |
1-3 Years | 3-5 Years | Thereafter | Total | ||||||||||||
|---|---|---|---|---|---|---|---|---|---|---|---|---|---|---|---|---|---|
Long-term debt |
$ | 15,636 | $ | 189,773 | $ | – | $ | – | $ | 205,409 | |||||||
Interest on long-term debt(1) |
7,982 | 3,834 | – | – | 11,816 | ||||||||||||
Operating leases |
1,118 | 1,751 | 1,702 | 1,067 | 5,638 | ||||||||||||
Unconditional purchase obligations: |
|||||||||||||||||
Unrecorded(2) |
3,695 | 1,056 | 2 | – | 4,753 | ||||||||||||
Recorded(3) |
10,938 | – | – | – | 10,938 | ||||||||||||
Liabilities for unrecognized tax benefits including interest and penalties(4) |
109 | 67 | – | 91 | 267 | ||||||||||||
Pension funding(5) |
1,965 | 3,835 | – | – | 5,800 | ||||||||||||
- (1)
- Interest on long-term debt includes amounts due on fixed and variable rate debt. As of December 31, 2010, $118,500 of the long-term debt was subject to variable rates, as described above. In determining our future interest obligations, we used the rates in effect at December 31, 2010. The weighted average rate was approximately 2.56%.
- (2)
- Unrecorded purchase obligations include binding commitments for future capital expenditures and services.
- (3)
- Recorded obligations include amounts in accounts payable and accrued expenses for external goods and services received as of December 31, 2010 and expected to be settled in cash.
- (4)
- The settlement period for unrecognized tax benefits and potential interest and penalties of $91 cannot be reasonably determined; however, the liabilities are not expected to become due within the next twelve months.
- (5)
- We contribute to our frozen Pension Plan an actuarially determined amount as deemed necessary and in accordance with applicable federal income tax regulations. A carryover balance of approximately $2,000 will reduce the required cash contribution for the 2011 Pension Plan year to approximately $3,800. See the Defined Benefit Pension Plan section below and Note 8 for more detailed discussion about the Plan.
Defined Benefit Pension Plan
As required, we contribute to our frozen Pension Plan, Supplemental Executive Retirement Plan and certain post-retirement benefits other than pensions ("Other Benefits Plan") (collectively the "Plans"), which provide retirement benefits to certain eligible employees. Contributions are intended to provide for benefits attributed to service to date. Our funding policy is to contribute annually an actuarially determined amount consistent with applicable federal income tax regulations.
The cost to maintain our Pension Plan and future funding requirements are affected by several factors including the expected return on investment of the assets held by the Pension Plan, changes in the discount rate used to calculate pension expense and the amortization of unrecognized gains and losses. Returns generated on Plan assets have historically funded a significant portion of the benefits paid under the Pension Plan. We estimate the long term rate of return of Plan assets will be 8.0%. However, the significant decline in the equity markets precipitated by the credit crisis in recent years has negatively affected the value of our Pension Plan assets. The Pension Plan invests in marketable equity securities which are exposed to changes in the financial markets. If the financial markets experience a downturn and returns fall below our estimate, as seen in recent years, we could be required to make a material contribution to the Pension Plan, which could adversely affect our cash flows from operations.
54
Our minimum funding requirement for 2011 related to the Pension Plan is expected to be approximately $5,800. However, due to a carryover balance of approximately $2,000 and the timing of the quarterly installments, we are not required to make a cash contribution until January 2012. We will continue to evaluate the future funding requirements of the Plans and fund them as necessary. See Note 8 for a more detailed discussion regarding our Pension Plan and Other Benefits Plan and the Contractual Obligations table above for information related to the funding requirement of our Pension Plan.
Income Taxes
The timing of cash payments for income taxes, which is governed by the Internal Revenue Service and other taxing jurisdictions, will differ from the timing of recording tax expense and deferred income taxes, which are reported in accordance with GAAP. For example, tax laws currently in effect for 2010 through 2012 regarding accelerated or "bonus" depreciation for tax reporting may result in less cash payments than the GAAP tax expense. Acceleration of tax deductions could eventually result in situations where cash payments will exceed GAAP tax expense. Changes in tax laws create uncertainty as to when or if this situation will occur within the next three years.
Our deferred tax assets are expected to be realized through the reversal of deferred tax liabilities and through the generation of future taxable income from ordinary and recurring operations. Deferred tax assets that are dependent on specific business segments generating future taxable income were determined to be more likely than not to be realized since those segments have at least 10 years in which to generate the estimated required taxable income. Approximately $1,500 of future taxable income is estimated to be required to realize these deferred tax assets.
Historically, pre-tax earnings for financial reporting purposes have exceeded the amount of taxable income reported for income tax purposes. This has primarily occurred due to the acceleration of depreciation deductions for income tax reporting purposes.
Regulatory Matters
As discussed more fully in the Regulatory Matters section above, the CPUC issued a final decision which will phase down our annual CHCF interim draw by approximately $2,040 annually, over a 5-year period ending on January 1, 2012. In addition, SureWest Telephone's intrastate access element, the TIC, was eliminated effective January 1, 2011 in accordance with previous CPUC final decisions. We anticipate a reduction in our 2011 intrastate access revenues of approximately $2,050 when the TIC is eliminated. SureWest Telephone will have an opportunity to recover all or part of the lost TIC revenue elsewhere, including residential rate adjustments.
Our significant accounting policies and estimates are discussed in the Notes to our Consolidated Financial Statements. We prepare our consolidated financial statements in accordance with generally accepted accounting principles in the United States. The preparation of financial statements requires management to make estimates and assumptions that affect reported amounts of assets, liabilities, revenues and expenses. These estimates and assumptions are affected by management's application of our accounting policies. Our judgments are based on historical experience and various other assumptions that are believed to be reasonable under the circumstances, the results of which form the basis for making estimates about the carrying values of assets and liabilities that are not readily apparent from other sources. However, because future events and the related effects cannot be determined with certainty, actual results may differ from our estimates and assumptions and such differences could be material. Management believes that the following accounting estimates are the most critical to understanding and evaluating our reported financial results.
55
Goodwill
As discussed more fully in Note 1, in accordance with Financial Accounting Standards Board ("FASB") Accounting Standards Codification ("ASC") Topic 350, Intangibles-Goodwill and Other ("ASC 350") (formerly Statement of Financial Accounting Standards ("SFAS") No. 142, Goodwill and other Intangible Assets), goodwill is reviewed for impairment annually or more frequently if an event occurs or circumstances change that would indicate potential impairment. We perform our annual fair value evaluation on November 30.
The impairment test for goodwill requires us to estimate the fair value at the reporting unit level. Our goodwill is allocated to the Kansas City operations reporting unit and the Telephone reporting unit. The Broadband segment includes the Kansas City operations reporting unit. The Telecom segment includes the Telephone reporting unit. At December 31, 2010 the goodwill allocated to the Kansas City operations reporting unit and the Telephone reporting unit was $43,643 and $2,171, respectively.
Kansas City Operations Reporting Unit
For the Kansas City operations reporting unit, the estimated fair value of the reporting unit is determined using a combination of a discounted cash flow ("DCF") model and market based approaches. The assumptions used in estimating fair value are based upon a combination of historical results and trends, new industry developments, future cash flow projections, and relevant comparable company valuation multiples for the market based approach. Such assumptions are subject to change as a result of changing economic and competitive conditions. The market based approach used in the valuation effort includes the guideline public companies method and the guideline transaction method. The various valuation methods are weighted to reach a fair value conclusion for the Kansas City operating reporting unit. Assumptions used in the DCF model include the following:
- •
- cash flow assumptions regarding investment in network facilities, distribution channels and customer base (the assumptions
underlying these inputs are based upon a combination of historical results and trends, new industry developments and the Company's business plans);
- •
- 14% weighted average cost of capital based on comparable public companies; and
- •
- 4% terminal growth rate.
At November 30, 2010 the fair value of the Kansas City operations reporting unit was estimated at $237,000 and the associated carrying value was $198,000. When determining the fair value, the use of different estimates or assumptions within the DCF model could result in a different fair value. As a sensitivity calculation, if the discount rate in our DCF model was increased 1% to 15%, the fair value would decrease from $237,000 to $223,000, which would not result in an impairment of goodwill recorded at the Kansas City operations reporting unit, assuming there are no changes to the market-based approaches used in the valuation. Assuming the discount rate in our DCF model was to increase 2%, the terminal growth rate decreased by 2% and the market-based valuation approaches decreased in value by 5%, the fair value of $237,000 would decrease by approximately $40,000, which may indicate an impairment as the carrying value would exceed the fair value by $1,000 in this scenario. As discussed above, the other market-based approaches are subject to change as a result of changing economic and competitive conditions. Negative changes relating to the Kansas City operations could result in potential impairment of goodwill recorded at the Kansas City operations reporting unit. Changes in the overall weighting of the DCF model and the market based approach valuation models may also impact the resulting fair value and could result in potential impairment of goodwill recorded at the Kansas City operations reporting unit.
56
Telephone Reporting Unit
For the Telephone reporting unit, the estimated fair value is determined using a DCF model. Assumptions used in the DCF model for the Telephone reporting unit include the following:
- •
- cash flow assumptions regarding investment in network facilities, distribution channels and customer base (the assumptions
underlying these inputs are based upon a combination of historical results and trends, new industry developments and the Company's business plans);
- •
- 14% weighted average cost of capital based on industry weighted average cost of capital; and
- •
- negative 2% terminal growth rate.
At November 30, 2010, the fair value of the Telephone reporting unit was $85,000 and the associated carrying value was $(48,000). When determining the fair value, the use of different estimates or assumptions within the DCF model could result in a different fair value. As a sensitivity calculation, if the discount rate were to increase 2% and the terminal growth rate decreased by 2%, the fair value would decrease by approximately $9,000, but would not result in an impairment of goodwill recorded at the Telephone reporting unit.
Revenue Recognition
As discussed more fully in Note 6, total revenues from telephone services are affected by rates authorized by various regulatory agencies. The FCC monitors SureWest Telephone's interstate earnings through its tariff review procedures and the use of annual cost separation studies prepared by SureWest Telephone. The FCC establishes rules that carriers must follow in the filing of tariffs and the preparation of the annual studies. Based on these rules, we are required to prospectively set our interstate rates based on the aforementioned cost separation studies. These cost studies include estimates and assumptions regarding various financial data including operating expenses, taxes and investment in property, plant and equipment. Non-financial data estimates are also utilized in the preparation of these cost studies, including projected demand usage and detailed network information. We must also make estimates of the jurisdictional separation of this data to assign current financial and operating data to the interstate or intrastate jurisdiction. These estimates are finalized in future periods as actual data becomes available to complete the separation studies. We also participate in the NECA Common Line pool for certain interstate services and derive revenues from that pool.
As a result of estimates and assumptions, it is reasonably possible that management's estimates of SureWest Telephone's interstate access revenues and shareable earnings obligations could change in the near term, and the amounts involved could be material.
Allowances For Doubtful Accounts
As discussed more fully in Note 1, we maintain allowances for doubtful accounts for estimated losses resulting from the potential inability of our customers to make required payments. In evaluating the collectability of our accounts receivable, we assess a number of factors including a specific customer's or carrier's ability to meet its financial obligations to us, the length of time the receivable has been past due and historical and future expectations of conditions that may impact our ability to collect our accounts receivable. If circumstances change or economic conditions worsen such that our past collection experience is no longer relevant, our estimate of the recoverability of our accounts receivable could be further reduced from the levels reflected in our consolidated balance sheet. If uncollectibility of our billed revenue changes by 1%, we would expect an increase in uncollectible expense of approximately $2,500. As of December 31, 2010, we had three customers that accounted for approximately 4% of our consolidated accounts receivable, net of allowances. Although management believes that these customers are creditworthy, a severe adverse impact on their business operations could have a corresponding material effect on their ability to pay timely and, therefore, to our results of operations, cash flows and financial
57
condition. In addition, certain revenues are subject to refund if the customer terminates services or returns equipment within a stipulated time period, or if certain performance criteria are not met. Accordingly, we maintain accounts receivable allowances and recognize certain customer refund liabilities, through charges to revenues, based on our best estimates of the resolution of these contingencies, which are based on historical experience.
Income Taxes
As discussed more fully in Notes 1 and 7, we account for income taxes using the liability method. Under this method, deferred tax assets and liabilities are determined based on differences between the financial reporting and tax bases of assets and liabilities and are measured using the enacted tax rates and laws that are expected to be in effect when the differences are expected to reverse. As we operate in more than one state, changes in our state apportionment factors, based on operational results, may affect our future effective tax rates and the value of our deferred tax assets and liabilities. We account for income taxes in accordance with ASC Topic 740, Income Taxes ("ASC 740") (formerly FASB Interpretation No. 48, Accounting for Uncertainty in Income Taxes) which clarifies the accounting for uncertainty in income taxes recognized in a company's financial statements. Under ASC 740, we do not recognize any benefit in our financial statements for any uncertain income tax position if we believe the position in the aggregate has less than a 50% likelihood of being sustained. If we believe there is greater than 50% likelihood that the position will be sustained, a benefit would be recognized in the financial statements equal to the largest amount that is believed more likely than not to be sustained upon an audit.
Pension Plan
As discussed more fully in Note 8, the cost to maintain our frozen Pension Plan and future funding requirements for the Pension Plan are affected by several factors including the expected return on investment of the Pension Plan assets, changes in the discount rate used to calculate pension expense and the amortization of unrecognized gains and losses. Changes in these estimates and other factors could significantly impact our benefit costs and obligations to maintain the Pension Plan.
Returns generated on Pension Plan assets have historically funded a significant portion of the benefits paid under the Pension Plan. We estimate the long-term rate of return of Pension Plan assets will be 8.0%. The Pension Plan invests in marketable equity securities which are exposed to changes in the financial markets. If the financial markets experience a downturn and returns fall below our estimate, as seen in recent years, we could be required to make a material contribution to the Pension Plan, which could adversely affect our cash flows from operations.
For 2010 the discount rate used to determine net periodic benefit cost for the Pension Plan was 6.0%. The discount rate was determined based on current yields on high quality corporate fixed-income investments with maturities corresponding to the expected duration of the benefit obligations. A one percentage-point increase or decrease in the discount rate would have the following effects on net periodic benefit cost:
| 1-Percentage- Point Increase |
1-Percentage- Point Decrease |
|
|---|---|---|
| $(1,156) | $ 1,337 |
Recently Issued Accounting Pronouncements
In December 2010, the FASB issued Accounting Standards Update ("ASU") No. 2010-29, Business Combinations (Topic 805)–Disclosure of Supplementary Pro Forma Information for Business Combinations–a consensus of the FASB Emerging Issues Task Force ("ASU 2010-29"). ASU 2010-29 requires a public entity to disclose pro forma revenue and earnings for a business combination occurring in the current year as though the business combination occurred as of the beginning of the year or, if comparative statements are presented, pro forma amounts are required to be presented as though the business combination took place
58
as of the beginning of the comparative year. ASU 2010-29 also expands the supplemental pro forma disclosures to include a description of the nature and amount of material, nonrecurring pro forma adjustments directly attributable to the business combination included in the reported pro forma revenue and earnings. We will apply ASU 2010-29 prospectively to business combinations consummated subsequent to January 1, 2011. We are currently evaluating the impact this update will have on our consolidated financial statements.
In December 2010, the FASB issued ASU No. 2010-28, Intangibles–Goodwill and Other (Topic 350)–When to Perform Step 2 of the Goodwill Impairment Test for Reporting Units with Zero or Negative Carrying amounts–a consensus of the FASB Emerging Issues Task Force ("ASU 2010-28"). ASU 2010-28 provides guidance on (i) the circumstances under which step 2 of the goodwill impairment test must be performed for reporting units with zero or negative carrying amounts and (ii) the qualitative factors to be taken into account when performing step 2 in determining whether it is more likely than not that an impairment exists. For public entities, the provisions of ASU 2010-28 will be effective for fiscal years and interim periods within those years beginning after December 15, 2010. We are currently evaluating the impact this update will have on our consolidated financial statements.
In October 2009, the FASB issued ASU No. 2009-13, Revenue Recognition (Topic 605): Multiple-Deliverable Revenue Arrangements–a consensus of the FASB Emerging Issues Task Force ("ASU 2009-13"). ASU 2009-13 addresses the accounting for multiple-deliverable arrangements to enable vendors to account for products or services separately rather than as a combined unit and modifies the manner in which the transaction consideration is allocated across the separately identified deliverables. ASU 2009-13 significantly expands the disclosure requirements for multiple-deliverable revenue arrangements. ASU 2009-13 will be effective for the first annual reporting period beginning on or after June 15, 2010, and may be applied retrospectively for all periods presented or prospectively to arrangements entered into or materially modified after the adoption date. We are currently evaluating the impact this update will have on our condensed consolidated financial statements.
Recently Adopted Accounting Pronouncements
In July 2010, the FASB issued ASU No. 2010-20, Receivables (Topic 310)–Disclosures about the Credit Quality of Financing Receivables and the Allowance for Credit Losses ("ASU 2010-20"). ASU 2010-20 requires entities to provide additional disclosures concerning financing receivables and allowance for credit losses. Specifically, the new disclosures include (i) the nature of credit risk inherent in the entity's portfolio of financing receivables, (ii) the factors considered in analyzing such risk in arriving at the allowance for credit losses and (iii) the changes and reasons for those changes in the allowance for credit losses. Public entities are required to adopt the provisions of ASU 2010-20 related to disclosures of financing receivables as of the end of a reporting period for interim or annual reporting periods ending on or after December 15, 2010. The financing receivables disclosures related to activity that occurs during a reporting period are effective for interim or annual reporting periods beginning on or after December 15, 2010. Our adoption of this guidance had no impact on our consolidated financial statements.
In February 2010, the FASB issued ASU No. 2010-09, Subsequent Events (Topic 855)–Amendments to Certain Recognition and Disclosure Requirements ("ASU 2010-09"). ASU 2010-09 amends ASC Topic 855 to remove the requirement for an SEC filer to disclose the date through which subsequent events have been evaluated both in issued and revised financial statements. ASU 2010-09 was effective immediately. Our adoption of this guidance had no impact on our condensed consolidated financial position and results of operations.
In January 2010, the FASB issued ASU No. 2010-06, Fair Value Measurements and Disclosures (Topic 820)–Improving Disclosures about Fair Value Measurements ("ASU 2010-06"). ASU 2010-06 amends ASC Topic 820, Fair Value Measurements and Disclosures ("ASC 820") to require additional disclosures regarding fair value measurements. Specifically, ASU 2010-06 requires entities to disclose additional information
59
regarding (i) the reconciliation of recurring Level 3 measurements about purchases, sales, issuances and settlements on a gross basis, (ii) the amounts of significant transfers between Level 1 and Level 2 of the fair value hierarchy and the reasons for these transfers and (iii) the reasons for any transfers in or out of Level 3. In addition to these new disclosure requirements, ASU 2010-06 also amends ASC 820 to further clarify existing guidance pertaining to the level of disaggregation at which fair value disclosures should be made and the requirements to disclose information about the valuation techniques and inputs used in estimating Level 2 and Level 3 fair value measurements. Our adoption of this guidance on January 1, 2010, except for the requirement to separately disclose information about purchases, sales, issuances, and settlements in the reconciliation of recurring Level 3 measurements on a gross basis which becomes effective for fiscal years (and interim periods within those fiscal years) beginning after December 15, 2010, did not have a material impact on our consolidated financial position or results of operations.
Significant portions of our telecommunication rates and charges are subject to regulation by the FCC and state commissions. Many of these rates and charges are based on various tariffs or service guides filed by SureWest and others, including those filed by the NECA for CL charges. Pending and future regulatory actions, with respect to these and other matters and the filing of new or amended tariffs, may have a material impact on our consolidated financial position and results of operations. In addition, the emergence of a range of products and services that operate partially or entirely outside traditional regulatory frameworks but that compete with regulated service offerings has created new challenges for both us and the regulators.
Our consolidated financial condition and results of operations have been and will be affected by recent and future proceedings before the state commissions and FCC. Pending before the FCC and state commissions are proceedings that, among other things, are considering:
- •
- additional rules governing the opening of markets to competition and the regulation of the competing telecommunications
providers;
- •
- the nature and extent of the compensation, if any, to be paid by carriers and other providers to one another for network
use, and the sums to be recovered through end users and other sources;
- •
- the goals and definition of universal telephone service in a changing environment, including examination of subsidy
support mechanisms for subscribers of different carriers (including incumbent carriers) and in various geographic areas;
- •
- rules that will provide non-discriminatory access by competing service providers to the network capabilities
of local exchange carriers; and
- •
- the regulated rates and earnings of SureWest Telephone.
There are a number of pending and anticipated other regulatory proceedings occurring at the federal and state levels that may have a material impact on SureWest Telephone and also on subsidiaries in the Broadband segment. These regulatory proceedings also include newer issues, such as consideration of broadband deployment and regulation of IP-enabled services. The outcomes and impact of these proceedings and related court matters on the Telecom segment, the Broadband segment and the Company as a whole cannot be determined at this time.
60
Item 7A. Quantitative and Qualitative Disclosures About Market Risk.
The primary objective of the following information is to provide forward-looking quantitative and qualitative information about our potential exposure to market risks. The term "market risk" refers to the risk of loss arising from adverse changes in interest rates and credit risk. The disclosure is not meant to be a precise indicator of expected future losses, but rather an indicator of reasonably possible losses. Our exposure to market risk is primarily related to the impact of interest rate fluctuations of our debt obligations.
Interest Rate Risks in our Debt Obligations
We enter into debt obligations to fund acquisitions, operations and planned capital expenditures. At December 31, 2010, we had long-term debt outstanding of $205,409. Of this amount, $86,909, or 42%, bears interest at fixed rates with a weighted average rate of 5.88%. Additionally, we had $118,500 of outstanding borrowings on our credit facility bearing interest at London Interbank Offered Rate ("LIBOR") based rates with a weighted average rate of 2.56%. Based on borrowing rates currently available for loans with similar terms and maturities, the estimated fair value of all of our long-term debt as of December 31, 2010 was $203,549. We currently have no outstanding short-term debt obligations as of December 31, 2010.
Based on our variable-rate debt outstanding at December 31, 2010, each 25 basis point increase or decrease in the level of interest rates would, respectively, increase or decrease our annual interest expense and related cash payments by approximately $300. Such potential increases or decreases are based on certain simplifying assumptions, including a constant level of variable-rate debt and an immediate, across-the-board increase or decrease in the level of interest rates with no other subsequent changes for the remainder of the period. We continually monitor our interest rate risk exposures and may consider entering into interest rate swaps or interest rate cap contracts to manage the impact of the interest rate changes on earnings and operating cash flows.
61
Item 8. Financial Statements and Supplementary Data.
62
Management's Report on Internal Control Over Financial Reporting
To the Board of Directors and Shareholders of SureWest Communications
The Company's management is responsible for establishing and maintaining adequate internal control over financial reporting, as such term is defined in the Securities Exchange Act of 1934, as amended Rules 13a-15(f). Under the supervision and with the participation of our management, including our principal executive officer and our principal financial officer, we conducted an evaluation of the effectiveness of our internal control over financial reporting based on the criteria established in Internal Control–Integrated Framework issued by the Committee of Sponsoring Organizations of the Treadway Commission. Based on our evaluation under the framework in Internal Control–Integrated Framework, we have concluded that the Company's internal control over financial reporting was effective as of December 31, 2010.
Ernst & Young LLP, an independent registered public accounting firm, has audited our consolidated financial statements included in this Annual Report on Form 10-K and, as part of its audit, has issued an attestation report dated February 25, 2011, on the effectiveness of our internal control over financial reporting.
February 25, 2011
/s/ STEVEN C. OLDHAM Steven C. Oldham President and Chief Executive Officer |
/s/ DAN T. BESSEY Dan T. Bessey, Vice President and Chief Financial Officer |
63
Report of Independent Registered Public Accounting Firm
The Board of Directors and Shareholders of SureWest Communications
We have audited SureWest Communications' internal control over financial reporting as of December 31, 2010, based on criteria established in Internal Control–Integrated Framework issued by the Committee of Sponsoring Organizations of the Treadway Commission (the COSO criteria). SureWest Communications' management is responsible for maintaining effective internal control over financial reporting, and for its assessment of the effectiveness of internal control over financial reporting included in the accompanying Management's Report on Internal Control Over Financial Reporting. Our responsibility is to express an opinion on the company's internal control over financial reporting based on our audit.
We conducted our audit in accordance with the standards of the Public Company Accounting Oversight Board (United States). Those standards require that we plan and perform the audit to obtain reasonable assurance about whether effective internal control over financial reporting was maintained in all material respects. Our audit included obtaining an understanding of internal control over financial reporting, assessing the risk that a material weakness exists, testing and evaluating the design and operating effectiveness of internal control based on the assessed risk, and performing such other procedures as we considered necessary in the circumstances. We believe that our audit provides a reasonable basis for our opinion.
A company's internal control over financial reporting is a process designed to provide reasonable assurance regarding the reliability of financial reporting and the preparation of financial statements for external purposes in accordance with generally accepted accounting principles. A company's internal control over financial reporting includes those policies and procedures that (1) pertain to the maintenance of records that, in reasonable detail, accurately and fairly reflect the transactions and dispositions of the assets of the company; (2) provide reasonable assurance that transactions are recorded as necessary to permit preparation of financial statements in accordance with generally accepted accounting principles, and that receipts and expenditures of the company are being made only in accordance with authorizations of management and directors of the company; and (3) provide reasonable assurance regarding prevention or timely detection of unauthorized acquisition, use, or disposition of the company's assets that could have a material effect on the financial statements.
Because of its inherent limitations, internal control over financial reporting may not prevent or detect misstatements. Also, projections of any evaluation of effectiveness to future periods are subject to the risk that controls may become inadequate because of changes in conditions, or that the degree of compliance with the policies or procedures may deteriorate.
In our opinion, SureWest Communications maintained, in all material respects, effective internal control over financial reporting as of December 31, 2010, based on the COSO criteria.
We also have audited, in accordance with the standards of the Public Company Accounting Oversight Board (United States), the consolidated balance sheets of SureWest Communications as of December 31, 2010 and 2009, and the related consolidated statements of income, shareholders' equity and cash flows for each of the three years in the period ended December 31, 2010 of SureWest Communications and our report dated February 25, 2011 expressed an unqualified opinion thereon.
/s/ Ernst & Young LLP
Sacramento,
California
February 25, 2011
64
Report of Independent Registered Public Accounting Firm
The Board of Directors and Shareholders of SureWest Communications
We have audited the accompanying consolidated balance sheets of SureWest Communications as of December 31, 2010 and 2009, and the related consolidated statements of income, shareholders' equity and cash flows for each of the three years in the period ended December 31, 2010. These financial statements are the responsibility of the Company's management. Our responsibility is to express an opinion on these financial statements based on our audits.
We conducted our audits in accordance with the standards of the Public Company Accounting Oversight Board (United States). Those standards require that we plan and perform the audit to obtain reasonable assurance about whether the financial statements are free of material misstatement. An audit includes examining, on a test basis, evidence supporting the amounts and disclosures in the financial statements. An audit also includes assessing the accounting principles used and significant estimates made by management, as well as evaluating the overall financial statement presentation. We believe that our audits provide a reasonable basis for our opinion.
In our opinion, the financial statements referred to above present fairly, in all material respects, the consolidated financial position of SureWest Communications at December 31, 2010 and 2009, and the consolidated results of its operations and its cash flows for each of the three years in the period ended December 31, 2010, in conformity with U.S. generally accepted accounting principles.
We also have audited, in accordance with the standards of the Public Company Accounting Oversight Board (United States), SureWest Communications' internal control over financial reporting as of December 31, 2010, based on criteria established in Internal Control–Integrated Framework issued by the Committee of Sponsoring Organizations of the Treadway Commission and our report dated February 25, 2011 expressed an unqualified opinion thereon.
/s/ Ernst & Young LLP
Sacramento,
California
February 25, 2011
65
SUREWEST COMMUNICATIONS
CONSOLIDATED STATEMENTS OF INCOME
(amounts in thousands, except per share amounts)
| |
Years Ended December 31, | |||||||||||
|---|---|---|---|---|---|---|---|---|---|---|---|---|
| |
2010 | 2009 | 2008 | |||||||||
Operating revenues: |
||||||||||||
Broadband |
$ | 174,546 | $ | 161,222 | $ | 135,341 | ||||||
Telecom |
68,953 | 80,478 | 95,032 | |||||||||
Total operating revenues |
243,499 | 241,700 | 230,373 | |||||||||
Operating expenses: |
||||||||||||
Cost of services and products (exclusive of depreciation and amortization) |
105,719 | 103,077 | 92,509 | |||||||||
Customer operations and selling |
29,637 | 30,317 | 30,108 | |||||||||
General and administrative |
31,124 | 35,009 | 37,588 | |||||||||
Depreciation and amortization |
61,825 | 59,724 | 55,027 | |||||||||
Total operating expenses |
228,305 | 228,127 | 215,232 | |||||||||
Income from operations |
15,194 | 13,573 | 15,141 | |||||||||
Other income (expense): |
||||||||||||
Investment income |
77 | 121 | 676 | |||||||||
Interest expense |
(8,346 | ) | (11,318 | ) | (12,126 | ) | ||||||
Other, net |
(216 | ) | 297 | 274 | ||||||||
Total other income (expense), net |
(8,485 | ) | (10,900 | ) | (11,176 | ) | ||||||
Income from continuing operations before income taxes |
6,709 | 2,673 | 3,965 | |||||||||
Income tax expense |
3,354 | 2,006 | 3,139 | |||||||||
Income from continuing operations |
3,355 | 667 | 826 | |||||||||
Discontinued operations, net of tax: |
||||||||||||
Income (loss) from discontinued operations |
– | (69 | ) | 103 | ||||||||
Gain on sale of discontinued operations |
– | 2,568 | 18,004 | |||||||||
Total discontinued operations |
– | 2,499 | 18,107 | |||||||||
Net income |
$ | 3,355 | $ | 3,166 | $ | 18,933 | ||||||
Basic and diluted earnings per common share: |
||||||||||||
Income from continuing operations |
$ | 0.24 | $ | 0.05 | $ | 0.06 | ||||||
Discontinued operations, net of tax |
– | 0.18 | 1.28 | |||||||||
Net income per basic and diluted common share |
$ | 0.24 | $ | 0.23 | $ | 1.34 | ||||||
Dividends per share |
$ | – | $ | – | $ | 0.50 | ||||||
Shares of common stock used to calculate earnings per share: |
||||||||||||
Basic |
13,836 | 13,996 | 14,096 | |||||||||
Diluted |
13,836 | 13,996 | 14,099 | |||||||||
See accompanying notes.
66
SUREWEST COMMUNICATIONS
CONSOLIDATED BALANCE SHEETS
(amounts in thousands)
| |
December 31, | |||||||
|---|---|---|---|---|---|---|---|---|
| |
2010 | 2009 | ||||||
ASSETS |
||||||||
Current assets: |
||||||||
Cash and cash equivalents |
$ | 2,937 | $ | 7,489 | ||||
Short-term investments |
771 | 4,306 | ||||||
Accounts receivable (less allowances of $2,365 and $3,532 at December 31, 2010 and 2009, respectively) |
20,298 | 19,734 | ||||||
Income tax receivable |
1,782 | 2,221 | ||||||
Prepaid expenses |
3,792 | 3,704 | ||||||
Deferred income taxes |
2,284 | 3,373 | ||||||
Other current assets |
– | 1,760 | ||||||
Assets held for sale |
6,009 | 6,009 | ||||||
Total current assets |
37,873 | 48,596 | ||||||
Property, plant and equipment, net |
514,639 | 522,493 | ||||||
Intangible and other assets: |
||||||||
Customer relationships, net |
2,632 | 3,847 | ||||||
Goodwill |
45,814 | 45,814 | ||||||
Deferred charges and other assets |
2,223 | 2,113 | ||||||
|
50,669 | 51,774 | ||||||
|
$ | 603,181 | $ | 622,863 | ||||
LIABILITIES AND SHAREHOLDERS' EQUITY |
||||||||
Current liabilities: |
||||||||
Current portion of long-term debt |
$ | 15,636 | $ | 15,636 | ||||
Accounts payable |
2,885 | 2,547 | ||||||
Other accrued liabilities |
12,847 | 18,315 | ||||||
Advance billings and deferred revenues |
8,035 | 8,580 | ||||||
Accrued compensation |
6,998 | 9,172 | ||||||
Total current liabilities |
46,401 | 54,250 | ||||||
Long-term debt |
189,773 | 207,409 | ||||||
Deferred income taxes |
56,661 | 54,856 | ||||||
Accrued pension and other post-retirement benefits |
33,815 | 32,451 | ||||||
Other liabilities and deferred revenues |
4,473 | 4,714 | ||||||
Commitments and contingencies |
||||||||
Shareholders' equity: |
||||||||
Common stock, without par value; 100,000 shares authorized, 13,866 and 14,148 shares issued and outstanding at December 31, 2010 and December 31, 2009, respectively |
143,309 | 146,844 | ||||||
Accumulated other comprehensive loss |
(15,081 | ) | (15,280 | ) | ||||
Retained earnings |
143,830 | 137,619 | ||||||
Total shareholders' equity |
272,058 | 269,183 | ||||||
|
$ | 603,181 | $ | 622,863 | ||||
See accompanying notes.
67
SUREWEST COMMUNICATIONS
CONSOLIDATED STATEMENTS OF SHAREHOLDERS' EQUITY
(amounts in thousands)
| |
Common Stock | |
|
|
|||||||||||||
|---|---|---|---|---|---|---|---|---|---|---|---|---|---|---|---|---|---|
| |
Number of Shares |
Amount | Other Comprehensive Income (Loss) |
Retained Earnings |
Total | ||||||||||||
Balance at December 31, 2007 |
14,514 | $ | 158,870 | $ | (3,530 | ) | $ | 115,663 | $ | 271,003 | |||||||
Issuance and amortization of restricted common stock, net of forfeitures and stock surrenders |
121 | 671 | – | 84 | 755 | ||||||||||||
Stock repurchases |
(553 | ) | (13,034 | ) | – | 6,530 | (6,504 | ) | |||||||||
Other comprehensive (loss) |
– | – | (15,718 | ) | – | (15,718 | ) | ||||||||||
Cash dividends |
– | – | – | (7,124 | ) | (7,124 | ) | ||||||||||
Restricted Stock Units dividends |
– | 51 | – | (51 | ) | – | |||||||||||
Net Income |
– | – | – | 18,933 | 18,933 | ||||||||||||
Balance at December 31, 2008 |
14,082 | 146,558 | (19,248 | ) | 134,035 | 261,345 | |||||||||||
Issuance and amortization of restricted common stock, net of forfeitures and stock surrenders |
174 | 1,533 | – | 93 | 1,626 | ||||||||||||
Stock repurchases |
(108 | ) | (1,165 | ) | – | 243 | (922 | ) | |||||||||
Other comprehensive income |
– | – | 3,968 | – | 3,968 | ||||||||||||
Restricted Stock Units dividends |
– | (82 | ) | – | 82 | – | |||||||||||
Net Income |
– | – | – | 3,166 | 3,166 | ||||||||||||
Balance at December 31, 2009 |
14,148 | 146,844 | (15,280 | ) | 137,619 | 269,183 | |||||||||||
Issuance and amortization of restricted common stock, net of forfeitures and stock surrenders |
148 | 1,788 | – | 571 | 2,359 | ||||||||||||
Stock repurchases |
(430 | ) | (5,323 | ) | – | 2,285 | (3,038 | ) | |||||||||
Other comprehensive income |
– | – | 199 | – | 199 | ||||||||||||
Net Income |
– | – | – | 3,355 | 3,355 | ||||||||||||
Balance at December 31, 2010 |
13,866 | $ | 143,309 | $ | (15,081 | ) | $ | 143,830 | $ | 272,058 | |||||||
See accompanying notes.
68
SUREWEST COMMUNICATIONS
CONSOLIDATED STATEMENTS OF CASH FLOWS
(amounts in thousands)
| |
Years Ended December 31, | ||||||||||||
|---|---|---|---|---|---|---|---|---|---|---|---|---|---|
| |
2010 | 2009 | 2008 | ||||||||||
Cash flows from operating activities: |
|||||||||||||
Net income |
$ | 3,355 | $ | 3,166 | $ | 18,933 | |||||||
Less income from discontinued operations, net of tax |
– | (2,499 | ) | (18,107 | ) | ||||||||
Income from continuing operations |
3,355 | 667 | 826 | ||||||||||
Adjustments to reconcile income from continuing operations to net cash provided by operating activities: |
|||||||||||||
Depreciation and amortization |
61,825 | 59,724 | 55,027 | ||||||||||
Loss (gain) on put option |
621 | 762 | (1,383 | ) | |||||||||
(Gain) loss on auction rate security |
(646 | ) | (929 | ) | 1,575 | ||||||||
Provision for deferred income taxes |
2,699 | 7,161 | 4,708 | ||||||||||
Provision for doubtful accounts |
1,479 | 2,944 | 2,772 | ||||||||||
Stock-based compensation |
2,845 | 2,105 | 963 | ||||||||||
Other, net |
(803 | ) | (258 | ) | (557 | ) | |||||||
Net changes in: |
|||||||||||||
Receivables |
(2,043 | ) | (1,263 | ) | 239 | ||||||||
Refundable and accrued income taxes, net |
439 | 843 | (4,057 | ) | |||||||||
Prepaid expenses and other current assets |
180 | 1,566 | 395 | ||||||||||
Accounts payable |
338 | (251 | ) | (2,101 | ) | ||||||||
Accrued liabilities, other liabilities and deferred credits |
(6,736 | ) | (1,229 | ) | (7,629 | ) | |||||||
Net cash provided by continuing operations |
63,553 | 71,842 | 50,778 | ||||||||||
Net cash used in discontinued operations |
– | (562 | ) | (1,605 | ) | ||||||||
Net cash provided by operating activities |
63,553 | 71,280 | 49,173 | ||||||||||
Cash flows from investing activities: |
|||||||||||||
Business acquisition, net of cash acquired |
– | – | (179,749 | ) | |||||||||
Proceeds from sale of discontinued operations |
1,725 | 10,947 | 66,296 | ||||||||||
Proceeds from sale of property and equipment |
227 | 830 | – | ||||||||||
Capital expenditures for property, plant and equipment |
(52,560 | ) | (58,330 | ) | (86,489 | ) | |||||||
Purchases of available-for-sale securities |
(37 | ) | (34 | ) | – | ||||||||
Proceeds from sale of available-for-sale securities |
3,700 | – | 16,650 | ||||||||||
Net cash used in continuing operations |
(46,945 | ) | (46,587 | ) | (183,292 | ) | |||||||
Net cash used in discontinued operations |
– | – | (176 | ) | |||||||||
Net cash used in investing activities |
(46,945 | ) | (46,587 | ) | (183,468 | ) | |||||||
Cash flows from financing activities: |
|||||||||||||
Proceeds from issuance of long-term debt |
8,069 | 10,500 | 109,500 | ||||||||||
Proceeds from short-term borrowings |
– | – | 60,000 | ||||||||||
Repayment of short-term borrowings |
– | – | (30,000 | ) | |||||||||
Dividends paid |
– | – | (7,124 | ) | |||||||||
Principal payments of long-term debt and capital lease obligations |
(25,705 | ) | (29,143 | ) | (19,643 | ) | |||||||
Repurchases and surrenders of common stock |
(3,524 | ) | (1,401 | ) | (6,712 | ) | |||||||
Net cash provided by (used in) financing activities |
(21,160 | ) | (20,044 | ) | 106,021 | ||||||||
Increase (decrease) in cash and cash equivalents |
(4,552 | ) | 4,649 | (28,274 | ) | ||||||||
Cash and cash equivalents at beginning of year |
7,489 | 2,840 | 31,114 | ||||||||||
Cash and cash equivalents at end of year |
$ | 2,937 | $ | 7,489 | $ | 2,840 | |||||||
See accompanying notes.
69
SUREWEST COMMUNICATIONS
NOTES TO CONSOLIDATED FINANCIAL STATEMENTS
YEARS ENDED DECEMBER 31, 2010, 2009 AND 2008
1. SUMMARY OF SIGNIFICANT ACCOUNTING POLICIES
Business and Basis of Accounting
SureWest Communications (the "Company", "we" or "our") is a holding company with operating subsidiaries that provide communications services in Northern California, primarily the greater Sacramento region ("Sacramento region"), and the greater Kansas City, Kansas and Missouri areas ("Kansas City area"). Our operating subsidiaries are SureWest Broadband, SureWest TeleVideo, SureWest Kansas, Inc., formerly Everest Broadband, Inc. ("Everest", "SureWest Kansas" or the "Kansas City operations"), SureWest Telephone and SureWest Long Distance.
As discussed in Note 4, we acquired 100% of the issued and outstanding stock of Everest in February 2008. We sold the operating assets of our Wireless business, SureWest Wireless, in May 2008 and our communication tower assets in February 2009. Accordingly, the financial results of SureWest Wireless and our communication tower assets have been reported as discontinued operations for all periods presented in accordance with Financial Accounting Standards Board ("FASB") Accounting Standards Codification ("ASC") Topic 360, Property, Plant and Equipment (formerly Statement of Financial Accounting Standards ("SFAS") No. 144, Accounting for the Impairment or Disposal of Long-Lived Assets). The notes to consolidated financial statements ("Notes") reflect historical amounts exclusive of discontinued operations, unless otherwise noted.
We expect that the sources of our revenues and our cost structure may be different in future periods, both as a result of our entry into new communications markets and competitive forces in each of the markets in which we have operations.
Preparation of the financial statements in conformity with accounting principles generally accepted in the United States and pursuant to the rules and regulations of the Securities and Exchange Commission (the "SEC") requires management to make estimates and assumptions that affect the reported amounts of assets and liabilities at the date of the financial statements and the reported amounts of revenues and expenses during the reporting period. Actual results may differ materially from those estimates. Our critical accounting policies include (i) revenue recognition and accounts receivable allowances (Notes 1 and 2), (ii) impairment evaluations associated with property, plant and equipment and intangible assets (Note 1), (iii) the determination of deferred tax asset and liability balances (Notes 1 and 7) and (iv) pension plan and other post-retirement costs and obligations (Note 8). Events subsequent to the balance sheet date have been evaluated for inclusion in the accompanying consolidated financial statements through the date of issuance.
Principles of Consolidation
The consolidated financial statements include the accounts of the Company and its wholly-owned subsidiaries. All significant intercompany transactions have been eliminated.
The Telecom segment provides wholesale access services through the use of its network to the Broadband segment, which enables the Broadband segment to offer high-speed Internet, Voice-over-Internet-Protocol and video services to those customers within SureWest Telephone's service area. These wholesale services are included as intersegment revenues and expenses in each of the respective segments and are eliminated in the consolidated statements of income.
70
SUREWEST COMMUNICATIONS
NOTES TO CONSOLIDATED FINANCIAL STATEMENTS (Continued)
YEARS ENDED DECEMBER 31, 2010, 2009 AND 2008
1. SUMMARY OF SIGNIFICANT ACCOUNTING POLICIES (Continued)
Concentration of Credit Risk
Financial instruments that potentially subject us to a concentration of credit risk consist primarily of accounts receivables, cash and cash equivalents and corporate equity securities. Our concentration of credit risk with respect to accounts receivable is limited due to our large number of customers. Cash and investments are deposited with financial institutions that management believes are of high credit quality.
Cash and Cash Equivalents
We invest our excess cash in money market mutual funds and in highly liquid investments. We consider all highly liquid investments with an original maturity of three months or less to be cash equivalents. As of December 31, 2010 and 2009, all of our cash equivalents consisted of money market mutual funds. The carrying amount of cash equivalents approximates its fair value due to their short maturities. We had the following cash and cash equivalents as of December 31, 2010 and 2009, respectively:
| |
2010 | 2009 | |||||
|---|---|---|---|---|---|---|---|
Cash |
$ | 2,853 | $ | 2,143 | |||
Cash equivalents |
84 | 5,346 | |||||
|
$ | 2,937 | $ | 7,489 | |||
Investments
As of December 31, 2010 and 2009, our available-for-sale investments consisted of corporate equity securities (common stock), which are recorded at fair value and determined by quoted market prices. Unrealized gains and losses on our available-for-sale investments are recorded in accumulated other comprehensive income.
All of our available-for-sale investments are subject to a periodic impairment review. We recognize an impairment charge when a decline in the fair value of our investments below the cost basis is judged to be other-than-temporary. We consider various factors in determining whether to recognize an impairment charge, including the length of time and extent to which the fair value has been less than our cost basis, the financial condition and our intent and ability to hold the investment for a period of time sufficient to allow for any anticipated recovery in the market value.
During the year ended December 31, 2009, we held a tax exempt auction rate security ("ARS") which was classified as a trading security and recorded at fair value. We also held an offer ("Right" or "put option") entitling us to sell at par our ARS. The ARS and Right were classified as current assets in short-term investments on our consolidated balance sheet as a result of our Right. Fair values for the ARS and Right were determined based on discounted cash flow models. See Note 3 for detail regarding the ARS and Right.
71
SUREWEST COMMUNICATIONS
NOTES TO CONSOLIDATED FINANCIAL STATEMENTS (Continued)
YEARS ENDED DECEMBER 31, 2010, 2009 AND 2008
1. SUMMARY OF SIGNIFICANT ACCOUNTING POLICIES (Continued)
The following is a summary of our short-term investments as of December 31, 2010 and 2009:
| |
2010 | 2009 | |||||
|---|---|---|---|---|---|---|---|
Investment in common stock |
$ | 771 | $ | 631 | |||
Auction rate securities |
– | 3,054 | |||||
Put option (Right) |
– | 621 | |||||
|
$ | 771 | $ | 4,306 | |||
Fair Value of Financial Instruments
In accordance with ASC Topic 820, Fair Value Measurements and Disclosures ("ASC 820") (formerly SFAS No. 157, Fair Value Measurements), we measure our cash equivalents (money market funds) and short-term investments (equity securities, ARS and Right) at fair value. ASC 820 clarifies that fair value is an exit price, representing the amount that would be received to sell an asset or paid to transfer a liability in an orderly transaction between market participants. As such, fair value is a market-based measurement that should be determined based on assumptions that market participants would use in pricing an asset or a liability. A financial asset or liability's classification within the hierarchy is determined based on the lowest level input that is significant to the fair value measurement. As a basis for considering such assumptions, ASC 820 establishes a three-tier value hierarchy, which prioritizes the inputs used in the valuation methodologies in measuring fair value:
| Level 1 – | Observable inputs that reflect quoted prices (unadjusted) for identical assets or liabilities in active markets. | |||
Level 2 – |
Inputs that reflect quoted prices in active markets for similar assets or liabilities, quoted prices for identical or similar assets or liabilities in inactive markets and inputs other than quoted prices that are directly or indirectly observable in the marketplace. |
|||
Level 3 – |
Unobservable inputs which are supported by little or no market activity. |
Allowance for Doubtful Accounts
We maintain an allowance for doubtful accounts for estimated losses, which result from the inability of our customers to make required payments. Such allowance is based on the likelihood of recoverability of accounts receivable based on past experience and management's best estimates of current bad debt exposures. We perform ongoing credit evaluations of our customers' financial condition and management believes that adequate allowances for doubtful accounts have been provided. Accounts are determined to be past due if customer payments have not been received in accordance with the payment terms. Uncollectible accounts are charged against the allowance for doubtful accounts and removed from the accounts receivable balances when internal collection efforts have been unsuccessful in collecting the amount due. In addition, certain revenues are subject to refund if the customer terminates services or returns equipment within a stipulated time period, or if certain performance criteria are not met. Accordingly, we maintain accounts receivable allowances and recognize certain customer refund liabilities, through charges to revenues, based on our best estimates of the resolution of these contingencies, which are based on historical experience. For the years ended December 31, 2010, 2009 and 2008, we wrote-off certain accounts receivable balances related to continuing operations aggregating $3,659, $3,171 and
72
SUREWEST COMMUNICATIONS
NOTES TO CONSOLIDATED FINANCIAL STATEMENTS (Continued)
YEARS ENDED DECEMBER 31, 2010, 2009 AND 2008
1. SUMMARY OF SIGNIFICANT ACCOUNTING POLICIES (Continued)
$3,072, respectively. During the years ended December 31, 2010, 2009 and 2008, we recovered $663, $451 and $529, respectively, of accounts receivable balances previously written-off against such allowance.
Property, Plant and Equipment
Property, plant and equipment is recorded at cost. Additions and substantial improvements are capitalized. Repairs and maintenance costs are charged to expense as incurred. Retirements and other reductions of property, plant and equipment were approximately $16,989, $24,492 and $7,106 in 2010, 2009 and 2008, respectively. Retirements or impairments of regulated telephone plant and equipment are charged against accumulated depreciation with no gain or loss recognized in accordance with the composite group remaining life methodology utilized for telephone plant assets. When property applicable to non-telephone operations is sold or retired, the asset and related accumulated depreciation are removed from the accounts and the associated gain or loss is recognized.
We capitalize the cost of internal-use network and non-network software which has a useful life in excess of one year. Subsequent additions, modifications or upgrades to internal-use network and non-network software are capitalized only to the extent that they allow the software to perform a task it previously did not perform. Software maintenance and training costs are expensed in the period in which they are incurred. Also, we capitalize interest associated with the development of internal-use network and non-network software.
Property, plant and equipment consisted of the following as of December 31, 2010 and 2009:
| |
2010 | 2009 | Estimated Useful Lives |
|||||
|---|---|---|---|---|---|---|---|---|
Land |
$ | 2,824 | $ | 2,824 | ||||
Buildings |
76,483 | 76,363 | 35 years | |||||
Central office equipment |
336,168 | 312,338 | 3-12 years | |||||
Outside plant equipment |
495,418 | 481,099 | 5-40 years | |||||
Internal-use software |
59,807 | 58,714 | 5-7 years | |||||
Other |
59,498 | 56,974 | 3-25 years | |||||
Total plant in service |
1,030,198 | 988,312 | ||||||
Less accumulated depreciation and amortization |
525,427 | 481,639 | ||||||
Plant in service |
504,771 | 506,673 | ||||||
Plant under construction |
5,344 | 10,557 | ||||||
Construction inventory |
4,524 | 5,263 | ||||||
Property, plant and equipment, net |
$ | 514,639 | $ | 522,493 | ||||
Construction inventory, which is stated at weighted average cost, consists primarily of network construction materials and supplies that when issued are predominately capitalized as part of new customer installations and the construction of the network.
During the first quarter of 2010, we completed our triennial review that evaluated the appropriateness of the estimated useful lives of our property, plant and equipment for all segments. The evaluation
73
SUREWEST COMMUNICATIONS
NOTES TO CONSOLIDATED FINANCIAL STATEMENTS (Continued)
YEARS ENDED DECEMBER 31, 2010, 2009 AND 2008
1. SUMMARY OF SIGNIFICANT ACCOUNTING POLICIES (Continued)
considered our investment and business strategy, reliability and historical performance data of certain assets, as well as the impacts of competition and anticipated technological change. As a result of this evaluation, effective January 1, 2010, we increased the estimated useful lives of general purpose software, general purpose hardware and certain central office equipment. We decreased the lives of certain of our customer premise equipment and outside plant categories. During the year ended December 31, 2010, this change in estimate decreased consolidated depreciation expense by $1,241 and increased consolidated net income by $741 ($0.05 per share).
We record depreciation and amortization using the straight-line method over estimated useful lives. The useful lives are estimated at the time the assets are acquired and are based on historical experience with similar assets, anticipated technological changes and the expected impact of our strategic operating plan on our network infrastructure. Depreciation expense was $55,521, $52,843 and $46,478 and amortization expense was $6,304, $6,881 and $8,549 in 2010, 2009 and 2008, respectively. Average annual composite depreciation and amortization rates were 6.1%, 6.1% and 6.2% in 2010, 2009 and 2008, respectively.
As a result of our analysis related to ASC Topic 350, Intangibles–Goodwill and Other ("ASC 350"), as described in the Intangible Assets section below, we performed an analysis in accordance with the provision of ASC Topic 360, Property, Plant, and Equipment ("ASC 360") (formerly SFAS No. 144, Accounting for Disposal for Impairment or Disposal of Long-Lived Assets) as of November 30, 2010. In accordance with ASC 350, property, plant and equipment is reviewed for impairment whenever events or changes in circumstances indicate that the carrying amount of an asset group may not be recoverable. Recoverability of assets to be held and used is measured by a comparison of the carrying amount of an asset group to estimated undiscounted future cash flows expected to be generated by the asset group. If the carrying amount of an asset group exceeds its estimated future cash flows, an impairment charge is recognized in the amount by which the carrying amount of the asset group exceeds the fair value of the asset group.
Intangible Assets
Goodwill and intangible assets that are not subject to amortization are tested for impairment annually or more frequently when events or changes in circumstances indicate that the asset might be impaired. Goodwill is the excess of the acquisition cost of a business over the fair value of the identifiable net assets acquired.
Goodwill is not amortized but instead evaluated annually for impairment using a two-step process. In the first step of the impairment test, the fair value of each of our two reporting units is compared to its carrying amount, including goodwill. We determined that goodwill should be applied to the reporting units within the business segments that benefit from the assets whose fair value exceeds their carrying amount. As a result, goodwill has been allocated to the Kansas City operations reporting unit, within the Broadband segment, and the Telephone reporting unit, within the Telecommunications ("Telecom") segment. The recorded goodwill for the Telecom and Broadband segments was $2,171 and $43,643 as of December 31, 2010 and 2009, respectively.
The estimated fair value of the reporting unit is determined using a combination of a discounted cash flow ("DCF") model and a market based approach. The assumptions used in the estimate of fair value are based upon a combination of historical results and trends, new industry developments, future cash flow projections, as well as relevant comparable company earnings multiples for the market based approach.
74
SUREWEST COMMUNICATIONS
NOTES TO CONSOLIDATED FINANCIAL STATEMENTS (Continued)
YEARS ENDED DECEMBER 31, 2010, 2009 AND 2008
1. SUMMARY OF SIGNIFICANT ACCOUNTING POLICIES (Continued)
Such assumptions are subject to change as a result of changing economic and competitive conditions. We use a weighting of the results derived from the valuation approaches to estimate the fair value of the Kansas City operations reporting unit. We use a DCF model to estimate the fair value of the Telephone reporting unit. If the carrying value of the reporting unit exceeds its fair value, the second step of the impairment test is performed to measure the amount of impairment loss. In measuring the fair value of our reporting units as previously described, we consider the combined carrying and fair values of our reporting units in relation to our overall enterprise value, measured as the publicly traded stock price multiplied by the fully diluted shares outstanding plus the value of outstanding debt. Our reporting unit fair value models are consistent with a range in value indicated by both the preceding three month average stock price and the stock price on the valuation date, plus an estimated acquisition premium which is based on observable transactions of comparable companies, if applicable.
The second step compares the implied fair value of the reporting unit goodwill with the carrying amount of that goodwill. The implied fair value is determined by allocating the fair value of the reporting unit to all of the assets and liabilities other than goodwill in a manner similar to a purchase price allocation. The excess of the fair value of a reporting unit over the amounts assigned to its assets and liabilities is the implied fair value of goodwill. If the carrying amount of goodwill is greater than the implied fair value of that goodwill, then an impairment charge would be recorded equal to the difference between the implied fair value and the carrying value.
Our intangible assets that do not have indefinite lives (customer relationships) are amortized over their useful lives and are reviewed for impairment in accordance with ASC 360, whenever events or changes in circumstances indicate that the carrying amount of the asset may not be recoverable. If any indications were present, we would test for recoverability by comparing the carrying amount of the asset to the net undiscounted cash flows expected to be generated from the asset. If those net undiscounted cash flows do not exceed the carrying amount (i.e., the asset is not recoverable), we would perform the next step, which is to determine the fair value of the asset and record an impairment, if any. We reevaluate the useful life determinations for these intangible assets each reporting period to determine whether events and circumstances warrant a revision in their remaining useful lives.
The gross carrying amount, accumulated amortization and net carrying value of our acquisition-related intangible assets (customer relationships) were $6,240, $3,608 and $2,632, respectively, as of December 31, 2010. Customer relationships are definite-life assets and have a weighted average useful life from the date of purchase of 5 years. The expected amortization expense for customer relationships is $1,215 for 2011 and 2012 and $202 in 2013, for a total of $2,632.
Income Taxes
We account for income taxes using the liability method. Under this method, deferred tax assets and liabilities are determined based on differences between the financial reporting and tax bases of assets and liabilities and are measured using the enacted tax rates and laws that are expected to be in effect when the differences are expected to reverse. As we operate in more than one state, changes in our state apportionment factors, based on operational results, may affect our future effective tax rates and the value of our deferred tax assets and liabilities.
75
SUREWEST COMMUNICATIONS
NOTES TO CONSOLIDATED FINANCIAL STATEMENTS (Continued)
YEARS ENDED DECEMBER 31, 2010, 2009 AND 2008
1. SUMMARY OF SIGNIFICANT ACCOUNTING POLICIES (Continued)
Pension Plan and Other Post-Retirement Benefits
We maintain a frozen noncontributory defined benefit pension plan ("the Pension Plan") and provide certain post-retirement benefits other than pensions ("Other Benefits" Plan") to certain eligible employees. We also maintain an unfunded Supplemental Executive Retirement Plan ("SERP") to provide incremental pension payments to certain of our retired executives.
We recognize pension expense during the current period in the consolidated income statement using certain assumptions, including the expected long-term rate of return on plan assets, interest cost implied by the discount rate and the amortization of unrecognized gains and losses. Refer to Note 8 for further details regarding the determination of these assumptions.
We recognize the overfunded or underfunded status of our defined benefit post-retirement plan as either an asset or liability in the consolidated balance sheet. We recognize changes in that funded status in the year in which the changes occur through comprehensive income, net of applicable income taxes, including unrecognized actuarial gains and losses and prior service costs and credits.
Share-based Compensation
Our share-based compensation consists of the issuance of restricted stock awards ("RSAs"), restricted stock units ("RSUs"), performance shares, stock options and stock appreciation rights. Associated costs are based on an award's estimated fair value at the date of the grant and are recognized over a period in which any related services are provided. Our policy is to recognize the costs on a straight-line basis over the requisite service period using the straight line method, generally from immediate vest to a four-year vesting period. See Note 10 for further details regarding share-based compensation.
Earnings Per Share
Shares used in the computation of basic earnings (loss) per share are based on the weighted average number of common shares and RSUs outstanding, excluding RSAs and unvested RSUs. Shares used in the computation of diluted earnings per share are based on the weighted average number of common shares, RSAs and RSUs outstanding, along with other potentially dilutive securities outstanding in each period.
The following table presents a reconciliation of the denominators used in the earnings per share calculations:
| |
Years Ended December 31, | ||||||||||
|---|---|---|---|---|---|---|---|---|---|---|---|
| |
2010 | 2009 | 2008 | ||||||||
Weighted average common shares |
13,836 | 13,996 | 14,096 | ||||||||
Potentially dilutive common equivalent shares: |
|||||||||||
Unvested RSAs and RSUs |
– | – | 3 | ||||||||
Weighted average common shares and RSUs outstanding and potentially dilutive common equivalent shares |
13,836 | 13,996 | 14,099 | ||||||||
Unvested RSAs and unvested RSUs, in the aggregate of 373 and 309 were excluded from the computation of diluted earnings per share for the years ended December 31, 2010 and 2009, respectively. The per share value of the unvested RSAs and RSUs, including the amount of compensation cost not yet recognized, was
76
SUREWEST COMMUNICATIONS
NOTES TO CONSOLIDATED FINANCIAL STATEMENTS (Continued)
YEARS ENDED DECEMBER 31, 2010, 2009 AND 2008
1. SUMMARY OF SIGNIFICANT ACCOUNTING POLICIES (Continued)
greater than the average market price of the shares which would have resulted in an anti-dilutive effect to diluted earnings per share.
Advertising Costs
Advertising costs are expensed as incurred. Advertising expense was $4,878, $6,548 and $7,411 in 2010, 2009 and 2008, respectively.
Statements of Cash Flows Information
During 2010, 2009 and 2008, we made payments for interest and income taxes as follows:
| |
2010 | 2009 | 2008 | |||||||
|---|---|---|---|---|---|---|---|---|---|---|
Interest, net of amounts capitalized ($106, $393 and $727 in 2010, 2009 and 2008, respectively) |
$ | 9,117 | $ | 12,309 | $ | 11,752 | ||||
Income taxes (received) paid, net |
$ | 153 | $ | (5,860 | ) | $ | 3,627 | |||
Other Comprehensive Income
Significant components of our other comprehensive income are as follows:
| |
Years Ended December 31, | |||||||||
|---|---|---|---|---|---|---|---|---|---|---|
| |
2010 | 2009 | 2008 | |||||||
Net income |
$ | 3,355 | $ | 3,166 | $ | 18,933 | ||||
Minimum pension and post-retirement benefit (liability) net of income taxes (benefit) of $168, $2,691 and $(10,579) in 2010, 2009 and 2008, respectively |
158 | 3,960 | (15,602 | ) | ||||||
Unrealized (loss) gain on available-for-sale investments, net of income taxes (benefit) of $27, $(4) and $(77) in 2010, 2009 and 2008, respectively |
41 | (8 | ) | (116 | ) | |||||
Reclassification adjustment for losses included in net income, net of income taxes of $11 in 2009 |
– | 16 | – | |||||||
Comprehensive income |
$ | 3,554 | $ | 7,134 | $ | 3,215 | ||||
As of December 31, 2010 and 2009, accumulated other comprehensive loss, net of tax, consisted of the following:
| |
2010 | 2009 | |||||
|---|---|---|---|---|---|---|---|
Minimum pension and post-retirement liability, net of tax |
$ | (15,141 | ) | $ | (15,299 | ) | |
Unrealized gain on available-for-sale investments, net of tax |
60 | 19 | |||||
|
$ | (15,081 | ) | $ | (15,280 | ) | |
77
SUREWEST COMMUNICATIONS
NOTES TO CONSOLIDATED FINANCIAL STATEMENTS (Continued)
YEARS ENDED DECEMBER 31, 2010, 2009 AND 2008
1. SUMMARY OF SIGNIFICANT ACCOUNTING POLICIES (Continued)
Severance and Termination Costs
In an effort to improve operating efficiencies and align operating costs, during the quarter ended June 30, 2010 we implemented a workforce reduction initiative in which approximately 60 positions were eliminated. Affected employees were provided a range of benefits and resources, including severance payments and the acceleration of unvested stock awards (collectively "severance costs"). During 2010 severance costs of $1,428 were recorded to the statements of income, primarily to general and administrative expense. Severance costs of approximately $613 and $815 were recorded to the Broadband and Telecom segments, respectively. As of December 31, 2010, our obligations related to the severance costs were concluded.
Recently Issued Accounting Pronouncements
In December 2010, the FASB issued Accounting Standards Update ("ASU") No. 2010-29, Business Combinations (Topic 805)–Disclosure of Supplementary Pro Forma Information for Business Combinations–a consensus of the FASB Emerging Issues Task Force ("ASU 2010-29"). ASU 2010-29 requires a public entity to disclose pro forma revenue and earnings for a business combination occurring in the current year as though the business combination occurred as of the beginning of the year or, if comparative statements are presented, pro forma amounts are required to be presented as though the business combination took place as of the beginning of the comparative year. ASU 2010-29 also expands the supplemental pro forma disclosures to include a description of the nature and amount of material, nonrecurring pro forma adjustments directly attributable to the business combination included in the reported pro forma revenue and earnings. We will apply ASU 2010-29 prospectively to business combinations consummated subsequent to January 1, 2011. We are currently evaluating the impact this update will have on our consolidated financial statements.
In December 2010, the FASB issued ASU No. 2010-28, Intangibles–Goodwill and Other (Topic 350)–When to Perform Step 2 of the Goodwill Impairment Test for Reporting Units with Zero or Negative Carrying amounts–a consensus of the FASB Emerging Issues Task Force ("ASU 2010-28"). ASU 2010-28 provides guidance on (i) the circumstances under which step 2 of the goodwill impairment test must be performed for reporting units with zero or negative carrying amounts and (ii) the qualitative factors to be taken into account when performing step 2 in determining whether it is more likely than not that an impairment exists. For public entities, the provisions of ASU 2010-28 will be effective for fiscal years and interim periods within those years beginning after December 15, 2010. We are currently evaluating the impact this update will have on our consolidated financial statements.
In October 2009, the FASB issued ASU No. 2009-13, Revenue Recognition (Topic 605): Multiple-Deliverable Revenue Arrangements–a consensus of the FASB Emerging Issues Task Force ("ASU 2009-13"). ASU 2009-13 addresses the accounting for multiple-deliverable arrangements to enable vendors to account for products or services separately rather than as a combined unit and modifies the manner in which the transaction consideration is allocated across the separately identified deliverables. ASU 2009-13 significantly expands the disclosure requirements for multiple-deliverable revenue arrangements. ASU 2009-13 will be effective for the first annual reporting period beginning on or after June 15, 2010, and may be applied retrospectively for all periods presented or prospectively to arrangements entered into or materially modified after the adoption date. We are currently evaluating the impact this update will have on our condensed consolidated financial statements.
78
SUREWEST COMMUNICATIONS
NOTES TO CONSOLIDATED FINANCIAL STATEMENTS (Continued)
YEARS ENDED DECEMBER 31, 2010, 2009 AND 2008
1. SUMMARY OF SIGNIFICANT ACCOUNTING POLICIES (Continued)
Recently Adopted Accounting Pronouncements
In July 2010, the FASB issued ASU No. 2010-20, Receivables (Topic 310)–Disclosures about the Credit Quality of Financing Receivables and the Allowance for Credit Losses ("ASU 2010-20"). ASU 2010-20 requires entities to provide additional disclosures concerning financing receivables and allowance for credit losses. Specifically, the new disclosures include (i) the nature of credit risk inherent in the entity's portfolio of financing receivables, (ii) the factors considered in analyzing such risk in arriving at the allowance for credit losses and (iii) the changes and reasons for those changes in the allowance for credit losses. Public entities are required to adopt the provisions of ASU 2010-20 related to disclosures of financing receivables as of the end of a reporting period for interim or annual reporting periods ending on or after December 15, 2010. The financing receivables disclosures related to activity that occurs during a reporting period are effective for interim or annual reporting periods beginning on or after December 15, 2010. Our adoption of this guidance had no impact on our consolidated financial statements.
In February 2010, the FASB issued ASU No. 2010-09, Subsequent Events (Topic 855)–Amendments to Certain Recognition and Disclosure Requirements ("ASU2010-09"). ASU 2010-09 amends ASC Topic 855 to remove the requirement for an SEC filer to disclose the date through which subsequent events have been evaluated both in issued and revised financial statements. ASU 2010-09 was effective immediately. Our adoption of this guidance had no impact on our condensed consolidated financial position and results of operations.
In January 2010, the FASB issued ASU No. 2010-06, Fair Value Measurements and Disclosures (Topic 820)–Improving Disclosures about Fair Value Measurements ("ASU 2010-06"). ASU 2010-06 amends ASC 820 to require additional disclosures regarding fair value measurements. Specifically, ASU 2010-06 requires entities to disclose additional information regarding (i) the reconciliation of recurring Level 3 measurements about purchases, sales, issuances and settlements on a gross basis, (ii) the amounts of significant transfers between Level 1 and Level 2 of the fair value hierarchy and the reasons for these transfers and (iii) the reasons for any transfers in or out of Level 3. In addition to these new disclosure requirements, ASU 2010-06 also amends ASC 820 to further clarify existing guidance pertaining to the level of disaggregation at which fair value disclosures should be made and the requirements to disclose information about the valuation techniques and inputs used in estimating Level 2 and Level 3 fair value measurements. Our adoption of this guidance on January 1, 2010, except for the requirement to separately disclose information about purchases, sales, issuances, and settlements in the reconciliation of recurring Level 3 measurements on a gross basis which becomes effective for fiscal years (and interim periods within those fiscal years) beginning after December 15, 2010, did not have a material impact on our consolidated financial position or results of operations.
Reclassifications
Certain amounts in our 2009 and 2008 consolidated financial statements have been reclassified to conform to the presentation of our 2010 consolidated financial statements. The reclassifications consist of the following:
Inventories have been reclassified from current assets to property, plant and equipment on the consolidated balance sheets. Inventories consist primarily of network construction materials and supplies that when issued are capitalized as part of new customer installations and the construction of the network.
79
SUREWEST COMMUNICATIONS
NOTES TO CONSOLIDATED FINANCIAL STATEMENTS (Continued)
YEARS ENDED DECEMBER 31, 2010, 2009 AND 2008
1. SUMMARY OF SIGNIFICANT ACCOUNTING POLICIES (Continued)
The proportion of the items included in inventories that are capitalized to property, plant and equipment has increased as a result of the growth in the Broadband business.
Operating expenses on the consolidated statements of income have been reclassified for a change in the classification during the third quarter of 2010 of customer technical support costs from customer operations and selling to cost of services and products. Prior period costs have been reclassified to conform to the current year presentation.
2. REVENUE RECOGNITION
We recognize revenue when (i) persuasive evidence of an arrangement exists between us and the customer, (ii) delivery of the product to the customer has occurred or service has been provided to the customer, (iii) the price to the customer is fixed or determinable and (iv) collectability of the sales price is reasonably assured. Revenues based on a flat fee, derived principally from local telephone, dedicated network access, data communications, Internet access service and residential/business broadband service are billed in advance and recognized in subsequent periods when the services are provided. Revenues based on usage, derived primarily from network access and long distance services, are recognized monthly as services are provided.
When required as part of providing service, revenues related to nonrefundable, upfront service activation and setup fees are deferred and recognized over the estimated customer life.
Incremental direct costs of telecommunications service activation are charged to expense in the period in which they are incurred, except when we maintain ownership of wiring installed during the activation process. In such cases the cost is capitalized and charged to expense over the estimated useful life of the asset.
We collect and remit Federal Universal Service contributions on a gross basis, which resulted in recorded revenue of $4,476, $3,692 and $3,048 for the years ended December 31, 2010, 2009 and 2008, respectively. We account for all other taxes collected from customers and remitted to the respective government agencies on a flow through basis.
3. FAIR VALUE MEASUREMENTS
Investments
The following is a summary of our short-term available-for-sale investments:
| |
As of December 31, 2010 | As of December 31, 2009 | |||||||||||||||||||||||
|---|---|---|---|---|---|---|---|---|---|---|---|---|---|---|---|---|---|---|---|---|---|---|---|---|---|
| |
Adjusted Cost |
Gross Unrealized Gains |
Gross Unrealized Losses |
Estimated Fair Market Value |
Adjusted Cost |
Gross Unrealized Gains |
Gross Unrealized Losses |
Estimated Fair Market Value |
|||||||||||||||||
Equity securities |
$ | 727 | $ | 44 | $ | – | $ | 771 | $ | 654 | $ | – | $ | (23 | ) | $ | 631 | ||||||||
Cost Method Investments
We held $1,115 and $772 in cost method investments which were included in other long-term assets in the consolidated balance sheets as of December 31, 2010 and 2009, respectively. Our cost method investments
80
SUREWEST COMMUNICATIONS
NOTES TO CONSOLIDATED FINANCIAL STATEMENTS (Continued)
YEARS ENDED DECEMBER 31, 2010, 2009 AND 2008
3. FAIR VALUE MEASUREMENTS (Continued)
primarily consist of our investment in CoBank, ACB ("CoBank") and are related to patronage distributions of restricted equity. Our investment in CoBank is required in accordance with the provisions of our Credit Agreement (see Note 5) held by CoBank. We periodically monitor our investments for impairment and will record reductions in carrying values if and when necessary. We did not estimate the fair value of the cost method investments as no events or changes in circumstances that may have a significant adverse effect on the fair value of the investment were identified during the year ended December 31, 2010. We determined that it was not practicable to estimate the fair value of the investments.
Fair Value of Financial Instruments
The following table summarizes our financial assets (cash equivalents and short-term investments) measured at fair value on a recurring basis:
| |
As of December 31, 2010 | ||||||||||||
|---|---|---|---|---|---|---|---|---|---|---|---|---|---|
| |
Total | Level 1 | Level 2 | Level 3 | |||||||||
Money market funds |
$ | 84 | $ | 84 | $ | – | $ | – | |||||
Equity securities |
771 | 771 | – | – | |||||||||
|
$ | 855 | $ | 855 | $ | – | $ | – | |||||
| |
As of December 31, 2009 | ||||||||||||
|---|---|---|---|---|---|---|---|---|---|---|---|---|---|
| |
Total | Level 1 | Level 2 | Level 3 | |||||||||
Money market funds |
$ | 5,346 | $ | 5,346 | $ | – | $ | – | |||||
Equity securities |
631 | 631 | – | – | |||||||||
Auction rate securities |
3,054 | – | – | 3,054 | |||||||||
Put option (Right) |
621 | – | – | 621 | |||||||||
|
$ | 9,652 | $ | 5,977 | $ | – | $ | 3,675 | |||||
The following table provides a reconciliation of the beginning and ending balances for the assets measured at fair value using significant unobservable inputs (Level 3):
| |
2010 | 2009 | ||||||||||||
|---|---|---|---|---|---|---|---|---|---|---|---|---|---|---|
| |
Put Option | Auction Rate Securities |
Put Option | Auction Rate Securities |
||||||||||
Beginning balance at January 1st |
$ | 621 | $ | 3,054 | $ | 1,383 | $ | 2,125 | ||||||
Sale of auction rate security |
– | (3,700 | ) | – | – | |||||||||
Gains (losses) included in earnings |
(621 | ) | 646 | (762 | ) | 929 | ||||||||
Ending balance at December 31st |
$ | – | $ | – | $ | 621 | $ | 3,054 | ||||||
As of December 31, 2009, we held one $3,700 par value ARS purchased from UBS Financial Services, Inc., a subsidiary of UBS AG ("UBS") with an estimated fair value of $3,054, which was measured using Level 3 inputs. This ARS was collateralized by student loans that are guaranteed primarily by a monoline
81
SUREWEST COMMUNICATIONS
NOTES TO CONSOLIDATED FINANCIAL STATEMENTS (Continued)
YEARS ENDED DECEMBER 31, 2010, 2009 AND 2008
3. FAIR VALUE MEASUREMENTS (Continued)
insurance company and partially by the Federal Family Education Loan Program ("FFELP"). As of December 31, 2009, we also held a Right entitling us to sell at par our ARS anytime during a two-year period from June 30, 2010 through July 2, 2012.
As of December 31, 2009, the ARS and Right were classified as current assets in short-term investments on our consolidated balance sheet, as a result of our put option period under the Right. We continued to earn and receive interest on our ARS, as specified in the terms of the prospectus, during 2009.
On January 6, 2010, UBS exercised their rights under the Right to purchase our ARS at par of $3,700 and we recorded a gain of $646 on the ARS to other income (expense), other, net in the condensed consolidated statements of income during the quarter ended March 31, 2010. The gain was largely offset by a loss of $621 recorded on the Right resulting from the cancellation of our put option under the Right.
Fair Value of Debt
We had no short-term borrowings as of December 31, 2010 and 2009. The fair value of our long-term debt and capital leases was estimated using a DCF analyses based on incremental borrowing rates for similar types of borrowing arrangements.
| |
As of December 31, 2010 | As of December 31, 2009 | |||||||||||
|---|---|---|---|---|---|---|---|---|---|---|---|---|---|
| |
Carrying Value | Fair Value | Carrying Value | Fair Value | |||||||||
Long-term debt and capital leases (including current maturities) |
$ | 205,409 | $ | 203,459 | $ | 223,045 | $ | 221,323 | |||||
4. ACQUISITION & DIVESTITURES
Acquisition
Everest Broadband, Inc.
In February 2008, we acquired 100% of the issued and outstanding stock of Everest for a total purchase price of $181,459, including transaction costs. Subsequent to the acquisition, the Kansas City operations have been included in our Broadband segment. SureWest Kansas is a competitive provider of high-speed data, video and voice services in the Kansas City area. The addition of our Kansas City operations accelerates our growth strategy and has positioned us as a premier provider of network services to residential and business customers in the markets we serve.
The acquisition has been accounted for using the purchase method in accordance with ASC Topic 805, Business Combinations. Accordingly, the net assets acquired were recorded at their estimated fair values and Everest's operating results are included in our consolidated financial statements from the date of acquisition.
82
SUREWEST COMMUNICATIONS
NOTES TO CONSOLIDATED FINANCIAL STATEMENTS (Continued)
YEARS ENDED DECEMBER 31, 2010, 2009 AND 2008
4. ACQUISITION & DIVESTITURES (Continued)
The purchase accounting relating to the Everest acquisition was complete as of December 31, 2008, as follows:
| |
February 13, 2008 | |||
|---|---|---|---|---|
Current assets |
$ | 12,952 | ||
Property, plant and equipment |
149,793 | |||
Intangible assets |
6,240 | |||
Goodwill |
43,643 | |||
Other long-term assets |
2,244 | |||
Total assets acquired |
214,872 | |||
Current liabilities |
9,603 | |||
Long-term liabilities |
1,257 | |||
Deferred income taxes |
22,553 | |||
Total liabilities acquired |
33,413 | |||
Net assets acquired |
$ | 181,459 | ||
The acquired intangible assets of $6,240 were derived from the associated value of a significant number of residential and business customers. The intangible assets are being amortized over the estimated useful life of 5 years. During the years ended December 31, 2010, 2009 and 2008, we recorded amortization expense of approximately $1,215, $1,215 and $1,178, respectively, relating to the customer relationships. Goodwill of $43,643 has been accounted for as an indefinite lived asset and will be tested annually for impairment at November 30 or at interim dates if potential impairment indicators arise. Goodwill is not deductible for income tax purposes. For further discussion regarding the goodwill impairment testing, see the Intangible Assets section in Note 1 above.
Our purchase accounting included an accrued liability of $1,255 relating primarily to the termination (the "Severance Plan") of certain members of Everest's management. The Severance Plan required payments to be made over a course of nine to eighteen months. During the year ended December 31, 2008, we paid $468 relating to the Severance Plan and in January 2009 we elected to pay the final severance payments early in the amount of $681, which concluded our obligations under the Severance Plan.
Unaudited Pro Forma Results
The following unaudited pro forma information presents our results of operations as if the acquisition of Everest occurred at the beginning of the fiscal periods presented. The pro forma information below does
83
SUREWEST COMMUNICATIONS
NOTES TO CONSOLIDATED FINANCIAL STATEMENTS (Continued)
YEARS ENDED DECEMBER 31, 2010, 2009 AND 2008
4. ACQUISITION & DIVESTITURES (Continued)
not purport to present what the actual results would have been if the acquisition had in fact occurred at the beginning of the fiscal periods presented, nor does the information project results for any future period.
| |
2008 | ||||
|---|---|---|---|---|---|
Operating revenues |
$ | 237,930 | |||
Income from operations |
16,787 | ||||
Income from continuing operations |
1,180 | ||||
Net income |
19,287 | ||||
Basic earnings per common share: |
|||||
Income from continuing operations |
$ | 0.08 | |||
Net income |
$ | 1.37 | |||
Diluted earnings per common share: |
|||||
Income from continuing operations |
$ | 0.08 | |||
Net income |
$ | 1.37 | |||
Discontinued Operations
SureWest Wireless
In May 2008, we completed the sale of the operating assets of our Wireless business, SureWest Wireless, to Verizon Wireless ("Verizon") for an aggregate cash purchase price of $69,746, resulting in a gain of $18,864, net of tax. A portion of the purchase price equal to $3,450 was placed in escrow, half of which was received during the quarter ended June 30, 2009 and the balance of which was received during the quarter ended June 30, 2010. As part of the sale, Verizon acquired the spectrum licenses and operating assets of SureWest Wireless, excluding our owned communication towers. See the Communication Tower Assets section below for further discussion regarding our owned communication towers. SureWest Wireless was previously reported as a separate reportable segment.
The results of SureWest Wireless are reported as a discontinued operation in our consolidated financial statements for all periods presented.
The following table summarizes the financial information for SureWest Wireless' operations:
| |
2009 | 2008 | |||||
|---|---|---|---|---|---|---|---|
Operating revenues |
$ | – | $ | 10,055 | |||
Operating expenses including depreciation and amortization |
– | 9,962 | |||||
Income from operations |
– | 93 | |||||
Other income (expense) |
– | (7 | ) | ||||
Income tax expense |
– | 66 | |||||
Income from discontinued operations |
$ | – | $ | 20 | |||
Gain on sale of discontinued operations, net of taxes of $30 and $13,088 in 2009 and 2008, respectively |
$ | 43 | $ | 18,821 | |||
84
SUREWEST COMMUNICATIONS
NOTES TO CONSOLIDATED FINANCIAL STATEMENTS (Continued)
YEARS ENDED DECEMBER 31, 2010, 2009 AND 2008
4. ACQUISITION & DIVESTITURES (Continued)
In connection with the sale, we entered into a short-term Transition Services Agreement ("TSA") with Verizon to provide certain operating services during the transition of the Wireless business to Verizon. The TSA concluded during the third quarter of 2008. During the transition period, our Telecom and Broadband segments provided certain services including long distance and interconnect services to Verizon. Such services, which were provided to SureWest Wireless prior to the sale and eliminated in our consolidated financial statements, were $1,869 for the year ended December 31, 2008.
Communication Tower Assets
In February 2009, we sold fifty-two wireless communications towers ("Tower Assets") owned by our subsidiary West Coast PCS, LLC ("West Coast PCS") to Global Tower Partners. West Coast PCS was a component of our Broadband segment. The sale was completed for an aggregate cash purchase price of $9,222, resulting in a gain of $2,525, net of tax.
The results of the Tower Assets have been reported as a discontinued operation in our consolidated financial statements for all periods presented.
The following table summarizes the financial information for the operations of the Tower Assets:
| |
Years Ended December 31, | ||||||
|---|---|---|---|---|---|---|---|
| |
2009 | 2008 | |||||
Operating revenues |
$ | 249 | $ | 1,616 | |||
Operating expenses including depreciation and amortization |
365 | 1,476 | |||||
Income (loss) from operations |
(116 | ) | 140 | ||||
Income tax expense (benefit) |
(47 | ) | 57 | ||||
Income (loss) from discontinued operations |
$ | (69 | ) | $ | 83 | ||
Gain on sale of discontinued operations, net of taxes of $1,684 in 2009 |
$ | 2,525 | $ | – | |||
SureWest Directories
In 2007, we sold 100% of the stock of SureWest Directories, our directory publishing business, to GateHouse Media, Inc. for an aggregate cash purchase price of $110,123, resulting in a gain of $59,339, net of tax. SureWest Directories was previously included in the Telecom segment. During the quarter ended September 30, 2008, the gain on sale of discontinued operations was reduced by $817, net of tax of $548, related to disputed claims owed to us under a transitional service agreement for billing services performed after the sale date.
Assets Held For Sale
In connection with our efforts to evaluate and potentially monetize excess assets, during 2009 we identified and began to actively market for sale certain of our real estate assets. These regulated assets, which are included in the Telecom segment, include 21 acres of undeveloped land and an office building. During the quarter ended December 31, 2009, we completed our plan to sell these assets and as a result they were
85
SUREWEST COMMUNICATIONS
NOTES TO CONSOLIDATED FINANCIAL STATEMENTS (Continued)
YEARS ENDED DECEMBER 31, 2010, 2009 AND 2008
4. ACQUISITION & DIVESTITURES (Continued)
classified as assets held for sale. As of December 31, 2010, these assets continue to be actively marketed for sale and classified as assets held for sale.
The following is the carrying value of the assets held for sale as of December 31, 2010 and 2009:
Undeveloped land |
$ | 1,556 | ||
Office building |
4,453 | |||
|
$ | 6,009 | ||
We expect that the land will sell in the range of $3,000 to $5,000. In connection with the classification to assets held for sale, the carrying value of the office building was reduced to its estimated fair value less selling costs as determined based on the current market conditions and listed selling price. As a result, an impairment charge of $1,199 was recorded against accumulated depreciation in 2009, in accordance with regulated telephone plant and equipment composite group remaining life methodology. We evaluated the estimated fair value of the assets held for sale as of December 31, 2010 and determined there was not a significant change. Therefore, no additional impairment charge was recorded during the year ended December 31, 2010.
5. CREDIT AGREEMENTS
Long-term debt outstanding as of December 31, 2010 and 2009 consisted of the following:
| |
Weighted Average Interest Rates at December 31, |
|
|
|
|||||||||||||
|---|---|---|---|---|---|---|---|---|---|---|---|---|---|---|---|---|---|
| |
2010 | 2009 | Maturities | 2010 | 2009 | ||||||||||||
Unsecured Series A Senior Notes |
6.30% | 6.30% | December 2013 | $ | 10,909 | $ | 14,545 | ||||||||||
Unsecured Series B Senior Notes |
4.74% | 4.74% | March 2013 | 36,000 | 48,000 | ||||||||||||
Unsecured Term Loan A credit facility |
3.97% | 5.39% | May 2012 | 120,000 | 120,000 | ||||||||||||
Unsecured Term Loan B credit facility |
2.56% | 3.66% | May 2012 | 30,000 | 30,000 | ||||||||||||
Unsecured Revolving Loan credit facility |
2.56% | 4.81% | May 2012 | 8,500 | 10,500 | ||||||||||||
Total long-term debt |
205,409 | 223,045 | |||||||||||||||
Less current portion |
15,636 | 15,636 | |||||||||||||||
Total long-term debt, net of current |
$ | 189,773 | $ | 207,409 | |||||||||||||
At December 31, 2010, the aggregate maturities of long-term debt were (i) $15,636 in 2011, (ii) $174,137 in 2012 and (iii) $15,636 in 2013, for a total of $205,409. We had no short-term borrowings as of December 31, 2010 and 2009.
86
SUREWEST COMMUNICATIONS
NOTES TO CONSOLIDATED FINANCIAL STATEMENTS (Continued)
YEARS ENDED DECEMBER 31, 2010, 2009 AND 2008
5. CREDIT AGREEMENTS (Continued)
Our long-term debt consists of unsecured Senior Notes and an unsecured Third Amended and Restated Credit Agreement ("Credit Agreement") with CoBank. The Senior Notes have interest payable semi-annually at their respective fixed interest rates. Principal payments on the Senior Notes are due in equal annual installments. The Credit Agreement includes term and revolving loan facilities. The Credit Agreement's interest payments are due at, the shorter of, their interest rate reset date or quarterly. All principal payments due on the Credit Agreement are due on the maturity date.
On January 29, 2010, we entered into a letter agreement with CoBank amending certain terms of the Credit Agreement. The Credit Agreement included a provision which required permanent reductions of the Revolving Loan facility of $7,500 at December 31, 2009 and 2010. The letter agreement amended those provisions and included (i) an increase in the total Revolving Loan facility of $7,500, (ii) a permanent reduction in CoBank's share of the Revolving Loan facility of $5,000 (rather than $7,500) on December 31, 2010 and (iii) setting the total Revolving Loan facility at $57,500. As a result of this letter agreement, our combined revolving commitment balance on our Revolving Loan and Swingline Loan facilities was $60,000.
As of December 31, 2010, our combined revolving commitment balance was $55,000 ($60,000 less $5,000 permanent reduction on December 31, 2010). The available balance on the revolving commitments, as of December 31, 2010 was approximately $46,500.
Our Series A and Series B Senior Notes and the Credit Agreement contain financial and operating covenants that may restrict, among other things, the repurchase of the Company's common stock, the payment of dividends, the making of certain other restricted payments and the incurrence of additional indebtedness. The covenants also require us to maintain certain financial ratios and minimum levels of tangible net worth. If we fail to comply with the covenants and other restrictions, such as making timely interest or principal payments, it could lead to an event of default and the acceleration of our obligations under those agreements. As of December 31, 2010, we were in compliance with all of our debt covenants.
Our financial covenants as defined in the Series A and Series B Senior Notes and the Credit Agreement, measured quarterly, are as follows:
Financial Covenant
|
Required Ratio Level | Actual Performance at December 31, 2010 |
||
|---|---|---|---|---|
Leverage ratio |
Not more than 3.75 | 2.58 | ||
Interest coverage ratio |
Not less than 3.00 | 9.55 | ||
Consolidated net worth |
Not less than $160,000 | $272,058 | ||
Debt to capitalization |
Not more than 0.55 | 0.43 |
At December 31, 2010 and 2009, retained earnings of $112,058 and $109,183, respectively, were available for the payments described above.
6. REGULATORY MATTERS
Certain of our interstate telecommunications service rates are subject to regulation by the Federal Communications Commission ("FCC"). Interstate switched and special access rates are established through a SureWest Telephone tariff filed with the FCC. For interstate common line ("CL") charges, SureWest Telephone concurs with tariffs filed by the National Exchange Carrier Association ("NECA"). Intrastate service rates are subject to regulation by state commissions. Prices for intrastate
87
SUREWEST COMMUNICATIONS
NOTES TO CONSOLIDATED FINANCIAL STATEMENTS (Continued)
YEARS ENDED DECEMBER 31, 2010, 2009 AND 2008
6. REGULATORY MATTERS (Continued)
telecommunications services are established through tariffs or through other regulatory mechanisms, including, in California, service guides. Pending and future regulatory actions may have a material impact on our consolidated financial position and results of operations.
FCC Matters
Under current FCC rules governing rate making, SureWest Telephone is required to establish rates for its interstate telecommunications services based on projected demand usage for the various services. SureWest Telephone projects its earnings through the use of annual cost separation studies, which utilize estimated total cost information and projected demand usage. Carriers are required to follow FCC rules in the preparation of these annual studies.
SureWest Telephone determines actual earnings from its interstate rates as actual volumes and costs become known. The FCC monitors SureWest Telephone's interstate earnings.
The FCC requires SureWest Telephone to prepare and submit periodic cost separation studies related to certain NECA CL accounts receivable balances. As a result of the cost separation filings, SureWest Telephone may change its estimates for certain NECA CL accounts receivable balances related to the prior year monitoring periods. During the years ended December 31, 2010 and 2009 we did not record any significant changes in estimates related to prior year monitoring periods.
California Public Utility Commission ("CPUC") Matters
A CPUC decision in August 2005 allowed SureWest Telephone to continue receiving our $11,500 annual interim draw from the California High Cost Fund ("CHCF"). The CHCF was previously authorized by the CPUC to offset SureWest Telephone's intrastate regulated operating expenses on an interim basis. In August 2006, we requested permission from the CPUC to implement a graduated phase-down of our annual $11,500 interim draw. In September 2007, the CPUC issued Decision 07-09-002 which provides for SureWest Telephone to phase-down its interim annual CHCF draw over a five-year period. The phase-down of the interim draw began in January 2007, initially reducing the annual $11,500 interim draw to $10,200, and in each subsequent year will be incrementally reduced by $2,040. In 2010 our interim CHCF draw was $4,080.
In an ongoing proceeding relating to the New Regulatory Framework (under which SureWest Telephone has been regulated since 1996), the CPUC adopted Decision 06-08-030 in 2006, which grants carriers broader pricing freedom in the provision of telecommunications services, bundling of services, promotions and customer contracts. This decision adopted a new regulatory framework, the Uniform Regulatory Framework ("URF"), which among other things (i) eliminates price regulation and allows full pricing flexibility for all new and retail services except basic residential services, which limits increases to $3.25 per year during 2009 and 2010, (ii) allows new forms of bundles and promotional packages of telecommunication services, (iii) allocates all gains and losses from the sale of assets to shareholders and (iv) eliminates almost all elements of rate of return regulation, including the calculation of shareable earnings. Beginning January 1, 2011, the URF Incumbent Local Exchange Carriers ("ILECs") are allowed full pricing flexibility for the basic residential rate. On December 31, 2010, the CPUC issued a ruling to initiate a new phase to assess whether, or to what extent, the level of competition in the telecommunications industry is sufficient to control prices for the four largest ILECs in the state, including
88
SUREWEST COMMUNICATIONS
NOTES TO CONSOLIDATED FINANCIAL STATEMENTS (Continued)
YEARS ENDED DECEMBER 31, 2010, 2009 AND 2008
6. REGULATORY MATTERS (Continued)
SureWest Telephone. The CPUC's actions in this and future proceedings could lead to new rules and an increase in government regulation.
7. INCOME TAXES
We account for income taxes in accordance with ASC Topic 740, Income Taxes ("ASC 740") (formerly FASB Interpretation No. 48, Accounting for Uncertainty in Income Taxes) which clarifies the accounting for uncertainty in income taxes recognized in a company's financial statements. Specifically, this guidance prescribes a recognition threshold and a measurement attribute for the financial statement recognition and measurement of a tax position taken or expected to be taken in a tax return. ASC 740 also provides guidance on de-recognition, classification, interest and penalties, accounting in interim periods, disclosure and transition of uncertain tax positions.
We had a liability for uncertain tax positions of $267, $203 and $257 at December 31, 2010, 2009 and 2008, respectively. Included in our liability for uncertain tax positions at December 31, 2010 was $167 of accrued interest and penalties. Our policy is to recognize interest and penalties related to uncertain tax positions in income tax expense. We did not accrue significant amounts of interest and penalties related to unrecognized tax benefits during 2010, 2009 or 2008.
The total amount of unrecognized tax benefits that, if recognized, would affect the effective tax rate was $176 and $129 at December 31, 2010 and 2009, respectively. We anticipate the release of up to $109 of the unrecognized tax benefits within the next twelve months as a result of the expiration of the statute of limitations.
As of December 31, 2010, the following tax years and related taxing jurisdictions were open:
| Tax Year | Taxing Jurisdiction | |
|---|---|---|
| 2002, 2004, 2007 - 2010 | Federal | |
| 2004, 2006 - 2010 | California | |
| 2006 - 2010 | Kansas and Missouri |
Income tax expense (benefit) consists of the following components:
| |
2010 | 2009 | 2008 | ||||||||
|---|---|---|---|---|---|---|---|---|---|---|---|
Current expense (benefit): |
|||||||||||
Federal |
$ | 777 | $ | (5,359 | ) | $ | (1,588 | ) | |||
State |
(122 | ) | 204 | 19 | |||||||
Total current expense (benefit) |
655 | (5,155 | ) | (1,569 | ) | ||||||
Deferred expense: |
|||||||||||
Federal |
1,609 | 6,492 | 2,760 | ||||||||
State |
1,090 | 669 | 1,948 | ||||||||
Total deferred expense |
2,699 | 7,161 | 4,708 | ||||||||
Total income tax expense |
$ | 3,354 | $ | 2,006 | $ | 3,139 | |||||
89
SUREWEST COMMUNICATIONS
NOTES TO CONSOLIDATED FINANCIAL STATEMENTS (Continued)
YEARS ENDED DECEMBER 31, 2010, 2009 AND 2008
7. INCOME TAXES (Continued)
Income tax expense (benefit) differs from the amounts computed by using the statutory federal tax rate (35% in all years presented) due to the following:
| |
2010 | 2009 | 2008 | ||||||||
|---|---|---|---|---|---|---|---|---|---|---|---|
Computed at statutory rates |
$ | 2,348 | $ | 936 | $ | 1,388 | |||||
Increase (decrease): |
|||||||||||
State taxes, net of federal benefit |
322 | 209 | 415 | ||||||||
State taxes attributable to change to multi-state apportionment |
249 | 325 | 863 | ||||||||
Tax exempt interest |
– | (14 | ) | (160 | ) | ||||||
Interest and penalties |
64 | – | 549 | ||||||||
KSOP dividends |
– | – | (127 | ) | |||||||
Deferred compensation |
217 | 482 | 123 | ||||||||
Other, net |
154 | 68 | 88 | ||||||||
Income tax expense |
$ | 3,354 | $ | 2,006 | $ | 3,139 | |||||
Effective federal and state tax rate |
50.0 | % | 75.0 | % | 79.2 | % | |||||
The significant components of our deferred income tax assets and liabilities were as follows at December 31, 2010 and 2009:
| |
Deferred Income Taxes | ||||||||||||
|---|---|---|---|---|---|---|---|---|---|---|---|---|---|
| |
2010 | 2009 | |||||||||||
| |
Assets | Liabilities | Assets | Liabilities | |||||||||
Property, plant and equipment-primarily due to timing of recognition of depreciation expense |
$ | – | $ | 85,601 | $ | – | $ | 74,277 | |||||
Differences in the timing of recognition of revenues |
2,429 | – | 3,183 | 488 | |||||||||
Net operating losses |
13,595 | – | 5,999 | – | |||||||||
Post-retirement and post-employment benefits |
13,215 | – | 12,872 | – | |||||||||
Accrued compensation |
1,292 | – | 1,367 | – | |||||||||
Other, net |
2,288 | 394 | 1,701 | 648 | |||||||||
Total deferred income taxes |
32,819 | 85,995 | 25,122 | 75,413 | |||||||||
Valuation allowance |
(1,201 | ) | – | (1,192 | ) | – | |||||||
Total deferred income taxes, net of valuation allowance |
$ | 31,618 | $ | 85,995 | $ | 23,930 | $ | 75,413 | |||||
Net deferred income tax liability |
$ | 54,377 | $ | 51,483 | |||||||||
We have federal net operating loss carryforwards of approximately $37,701 ($1,528 of which is subject to additional limitations), which will begin to expire in 2026, if not used. We have state net operating loss carryforwards of approximately $36,820 which will begin to expire in 2016, if not used. We also have approximately $1,847 and $1,834 of state income tax hiring credit carryforwards as of December 31, 2010 and 2009, respectively, which do not expire. Management believes that the future utilization of these credits is uncertain and has placed a full valuation allowance on these credits. The valuation allowance increased $9 and $77 during 2010 and 2009, respectively.
90
SUREWEST COMMUNICATIONS
NOTES TO CONSOLIDATED FINANCIAL STATEMENTS (Continued)
YEARS ENDED DECEMBER 31, 2010, 2009 AND 2008
8. PENSION PLAN AND OTHER POST-RETIREMENT BENEFITS
We maintain a Pension Plan which covers certain eligible employees. Benefits are based on years of service and the employee's average compensation during the five highest consecutive years of the last ten years of credited service. Our funding policy is to contribute annually an actuarially determined amount consistent with applicable federal income tax regulations. Contributions are intended to provide for benefits attributed to service to date. Pension Plan assets are primarily invested in domestic equity securities, fixed income and international equity securities.
We also maintain an unfunded SERP, which provides supplemental retirement benefits to certain of our retired executives. The SERP provides for incremental pension payments to partially offset the reduction in amounts that would have been payable under the Pension Plan if it were not for limitations imposed by federal income tax regulations.
In addition, we provide an Other Benefits Plan to certain eligible employees of our California location, including life insurance benefits and a stated reimbursement for Medicare supplemental insurance.
Effective April 1, 2007, we amended our Pension Plan, SERP and Other Benefits Plan (collectively the "Plans") such that the Plans were frozen so that no person is eligible to become a new participant on or following that date and all future benefit accruals for existing participants under the Plans cease.
The following tables set forth the change in benefit obligation, change in plan assets and funded status of the Plans as of December 31, 2010 and 2009:
| |
Pension Plan and SERP | Other Benefits Plan | ||||||||||||
|---|---|---|---|---|---|---|---|---|---|---|---|---|---|---|
| |
2010 | 2009 | 2010 | 2009 | ||||||||||
Change in benefit obligation |
||||||||||||||
Benefit obligation at beginning of the year |
$ | 123,417 | $ | 118,636 | $ | 7,712 | $ | 8,481 | ||||||
Service cost |
– | – | 62 | 90 | ||||||||||
Interest cost on projected benefit obligation |
7,169 | 7,234 | 319 | 442 | ||||||||||
Plan participant's contributions |
– | – | 375 | 412 | ||||||||||
Actuarial loss (gain) |
5,378 | 5,073 | (390 | ) | (808 | ) | ||||||||
Benefits paid |
(7,762 | ) | (7,526 | ) | (816 | ) | (905 | ) | ||||||
Benefit obligation at end of the year |
$ | 128,202 | $ | 123,417 | $ | 7,262 | $ | 7,712 | ||||||
| |
Pension Plan and SERP | Other Benefits Plan | ||||||||||||
|---|---|---|---|---|---|---|---|---|---|---|---|---|---|---|
| |
2010 | 2009 | 2010 | 2009 | ||||||||||
Change in plan assets |
||||||||||||||
Fair value of plan assets at beginning of year |
$ | 94,610 | $ | 87,126 | $ | 3,853 | $ | 3,731 | ||||||
Actual return on plan assets |
10,554 | 14,787 | 416 | 602 | ||||||||||
Employer contribution |
212 | 223 | 8 | 13 | ||||||||||
Plan participant's contributions |
– | – | 375 | 412 | ||||||||||
Benefits paid |
(7,762 | ) | (7,526 | ) | (816 | ) | (905 | ) | ||||||
Fair value of plan assets at end of year |
$ | 97,614 | $ | 94,610 | $ | 3,836 | $ | 3,853 | ||||||
Funded status at year end |
$ | (30,588 | ) | $ | (28,807 | ) | $ | (3,426 | ) | $ | (3,859 | ) | ||
91
SUREWEST COMMUNICATIONS
NOTES TO CONSOLIDATED FINANCIAL STATEMENTS (Continued)
YEARS ENDED DECEMBER 31, 2010, 2009 AND 2008
8. PENSION PLAN AND OTHER POST-RETIREMENT BENEFITS (Continued)
Amounts recognized in the consolidated balance sheets at December 31, 2010 and 2009 consist of:
| |
Pension Plan and SERP | Other Benefits Plan | |||||||||||
|---|---|---|---|---|---|---|---|---|---|---|---|---|---|
| |
2010 | 2009 | 2010 | 2009 | |||||||||
Current liabilities |
$ | 199 | $ | 216 | $ | – | $ | – | |||||
Noncurrent liabilities |
$ | 30,389 | $ | 28,591 | $ | 3,426 | $ | 3,859 | |||||
Amounts recognized in accumulated other comprehensive income for the years ended December 31, 2010 and 2009 consist of:
| |
Pension Plan and SERP | Other Benefits Plan | |||||||||||
|---|---|---|---|---|---|---|---|---|---|---|---|---|---|
| |
2010 | 2009 | 2010 | 2009 | |||||||||
Net actuarial loss (gain) |
$ | 28,172 | $ | 28,242 | $ | (2,344 | ) | $ | (1,997 | ) | |||
Prior service cost |
– | 2 | (452 | ) | (544 | ) | |||||||
|
$ | 28,172 | $ | 28,244 | $ | (2,796 | ) | $ | (2,541 | ) | |||
Net periodic pension (income) cost recognized in the consolidated statements of income for the years ended December 31, 2010, 2009 and 2008 under the Plans included the following components:
| |
Pension Plan and SERP | Other Benefits Plan | ||||||||||||||||||
|---|---|---|---|---|---|---|---|---|---|---|---|---|---|---|---|---|---|---|---|---|
| |
2010 | 2009 | 2008 | 2010 | 2009 | 2008 | ||||||||||||||
Service cost-benefits earned during the year |
$ | – | $ | – | $ | – | $ | 62 | $ | 90 | $ | 107 | ||||||||
Interest cost on projected benefit obligation |
7,169 | 7,234 | 7,153 | 319 | 441 | 438 | ||||||||||||||
Expected return on plan assets |
(7,280 | ) | (6,685 | ) | (9,065 | ) | (269 | ) | (245 | ) | (360 | ) | ||||||||
Amortization of: |
||||||||||||||||||||
Prior service cost |
2 | 2 | 2 | (92 | ) | (92 | ) | (92 | ) | |||||||||||
Net actuarial gain (loss) |
2,173 | 2,593 | 23 | (190 | ) | (45 | ) | (107 | ) | |||||||||||
Net pension and other benefits (income) cost during the year |
$ | 2,064 | $ | 3,144 | $ | (1,887 | ) | $ | (170 | ) | $ | 149 | $ | (14 | ) | |||||
The following table summarizes other changes in plan assets and benefit obligations recognized in other comprehensive income, before tax effects, during 2010 and 2009:
| |
Pension Plan and SERP | Other Benefits Plan | |||||||||||
|---|---|---|---|---|---|---|---|---|---|---|---|---|---|
| |
2010 | 2009 | 2010 | 2009 | |||||||||
Actuarial loss (gain), net |
$ | 2,104 | $ | (3,029 | ) | $ | (537 | ) | $ | (1,164 | ) | ||
Recognized actuarial (loss) gain |
(2,173 | ) | (2,593 | ) | 190 | 45 | |||||||
Recognized prior service (cost) credit |
(2 | ) | (2 | ) | 92 | 92 | |||||||
Total amount recognized in other comprehensive income, before tax effects |
$ | (71 | ) | $ | (5,624 | ) | $ | (255 | ) | $ | (1,027 | ) | |
The estimated net loss, net prior service cost and transition obligation for the defined benefit pension plans that will be amortized from accumulated other comprehensive income in net periodic benefit cost over the
92
SUREWEST COMMUNICATIONS
NOTES TO CONSOLIDATED FINANCIAL STATEMENTS (Continued)
YEARS ENDED DECEMBER 31, 2010, 2009 AND 2008
8. PENSION PLAN AND OTHER POST-RETIREMENT BENEFITS (Continued)
next fiscal year are $2,311, $0 and $0, respectively. The estimated net gain, net prior service credit and transition obligation for the other defined benefit post-retirement plans that will be amortized from accumulated other comprehensive income in net periodic benefit cost over the next fiscal year are $172, $92 and $0, respectively.
The weighted-average assumptions used to determine projected benefit obligations as of December 31, 2010 and 2009 were as follows:
| |
Pension Plan and SERP | Other Benefits Plan | |||||||||||
|---|---|---|---|---|---|---|---|---|---|---|---|---|---|
| |
2010 | 2009 | 2010 | 2009 | |||||||||
Discount rate |
5.60% | 6.00% | 4.22% | 4.80% | |||||||||
The weighted-average assumptions used to determine net periodic benefit cost for the years ended December 31, 2010, 2009 and 2008 were as follows:
| |
Pension Plan and SERP | Other Benefits Plan | |||||||||||||||||
|---|---|---|---|---|---|---|---|---|---|---|---|---|---|---|---|---|---|---|---|
| |
2010 | 2009 | 2008 | 2010 | 2009 | 2008 | |||||||||||||
Discount rate |
6.00% | 6.25% | 6.00% | 4.80% | 6.00% | 5.50% | |||||||||||||
Expected long-term return on plan assets |
8.00% | 8.00% | 8.00% | 8.00% | 8.00% | 8.00% | |||||||||||||
Rate of compensation increase |
NA | NA | NA | NA | NA | NA | |||||||||||||
The expected rate of return on plan assets is the weighted average of expected long-term asset return assumptions.
Assumed health care cost trend rates at December 31, 2010 and 2009 were as follows:
| |
2010 | 2009 | |||||
|---|---|---|---|---|---|---|---|
Health care cost trend assumed for the next year |
10.50% | 9.00% | |||||
Rate to which the cost trend is assumed to decline (the ultimate trend rate) |
5.00% | 5.00% | |||||
Year that the rate reaches the ultimate trend rate |
2018 | 2013 | |||||
Assumed health care cost trend rates have a significant effect on the amounts reported for the Other Benefits Plan. A one-percentage-point change in assumed health care cost trend rates would have the following effects:
| |
1-Percentage- Point Increase |
1-Percentage- Point Decrease |
|||||
|---|---|---|---|---|---|---|---|
Effect on total of service and interest cost |
$ | 1 | $ | (2) | |||
Effect on post-retirement benefit obligation as of January 1, 2010 |
$ | 33 | $ | (43) | |||
Plan Assets
Our investment strategy is designed to provide a stable environment to earn a rate of return over time to satisfy the benefit obligations and minimize the reliance on contributions as a source of benefit security. The objectives are based on a long-term (5 to 15 year) investment horizon, so that interim fluctuations
93
SUREWEST COMMUNICATIONS
NOTES TO CONSOLIDATED FINANCIAL STATEMENTS (Continued)
YEARS ENDED DECEMBER 31, 2010, 2009 AND 2008
8. PENSION PLAN AND OTHER POST-RETIREMENT BENEFITS (Continued)
should be viewed with appropriate perspective. The assets of the fund are to be invested to achieve the greatest return for the Pension Plan consistent with a prudent level of risk.
The asset return objective is to achieve, as a minimum over time, the passively managed return earned by managed index funds, weighted in the proportions outlined by the asset class exposures identified in the Pension Plan's strategic allocation. We update our long-term, strategic asset allocations every few years to ensure they are in line with our fund objectives. The target allocation of the Pension Plan assets is approximately 33% U.S. large cap equities, 17% international equities, 7% U.S. small cap equities and 43% domestic fixed income. Domestic fixed income is in the form of corporate and municipal bonds, U.S. Treasury and Government Agency securities and mortgage-backed securities. Currently, we believe that there are no significant concentrations of risk associated with the Pension Plan assets.
Refer to Note 3, Fair Value Measurements, for more detail regarding the three-tier value hierarchy, which prioritizes the inputs used in the valuation methodologies in measuring fair value. The fair value measurements used to value our Pension Plan and Other Benefits Plan assets as of December 31, 2010 were generated by using market transactions involving identical or comparable assets. There were no changes in the valuation techniques used during 2010.
94
SUREWEST COMMUNICATIONS
NOTES TO CONSOLIDATED FINANCIAL STATEMENTS (Continued)
YEARS ENDED DECEMBER 31, 2010, 2009 AND 2008
8. PENSION PLAN AND OTHER POST-RETIREMENT BENEFITS (Continued)
The fair values of our Pension Plan assets at December 31, 2010 and 2009, by asset category were as follows:
| |
December 31, 2010 | |||||||||||||
|---|---|---|---|---|---|---|---|---|---|---|---|---|---|---|
Asset Category
|
Total | Level 1 | Level 2 | Level 3 | ||||||||||
Short-term investment fund(1) |
$ | 1,437 | $ | 1,437 | $ | – | $ | – | ||||||
Equity securities: |
||||||||||||||
United States large-cap(2) |
31,445 | 31,445 | – | – | ||||||||||
United States small-cap(4) |
7,833 | – | 7,833 | – | ||||||||||
International value(5) |
8,513 | – | 8,513 | – | ||||||||||
International growth funds(5) |
7,987 | 7,987 | – | – | ||||||||||
Domestic fixed income: |
||||||||||||||
United States treasury and government agency securities |
11,093 | 11,093 | – | – | ||||||||||
Corporate and municipal bonds |
9,410 | – | 9,410 | – | ||||||||||
Mortgage/asset-backed securities |
19,896 | – | 19,896 | – | ||||||||||
Total |
$ | 97,614 | $ | 51,962 | $ | 45,652 | $ | – | ||||||
| |
December 31, 2009 | |||||||||||||
|---|---|---|---|---|---|---|---|---|---|---|---|---|---|---|
Asset Category
|
Total | Level 1 | Level 2 | Level 3 | ||||||||||
Short-term investment fund(1) |
$ | 2,449 | $ | 2,449 | $ | – | $ | – | ||||||
Equity securities: |
||||||||||||||
United States large-cap(3) |
32,467 | – | 32,467 | – | ||||||||||
United States small-cap(4) |
7,160 | – | 7,160 | – | ||||||||||
International value(5) |
7,967 | – | 7,967 | – | ||||||||||
International growth funds(5) |
7,789 | 7,789 | – | – | ||||||||||
Domestic fixed income: |
||||||||||||||
United States treasury and government agency securities |
6,669 | 6,669 | – | – | ||||||||||
Corporate commercial paper |
1,302 | – | 1,302 | – | ||||||||||
Corporate and municipal bonds |
10,523 | – | 10,523 | – | ||||||||||
Mortgage/asset-backed securities |
18,284 | – | 18,284 | – | ||||||||||
Total |
$ | 94,610 | $ | 16,907 | $ | 77,703 | $ | – | ||||||
- (1)
- This category represents a sweep fund that is used for daily Plan operations.
- (2)
- This category comprises low-cost equity index funds and investments in common stock of domestic corporations in a industry sectors with a benchmark of the Russell 1000 Index.
- (3)
- This category comprises low-cost equity index funds with a benchmark of the Russell 1000 Index.
- (4)
- This category comprises low-cost equity index funds with a benchmark of the Russell 2000 Index.
- (5)
- These categories compromise equity funds with a benchmark of the Morgan Stanley Capital International Europe, Asia, Australia, Far East Stock index, net of withholding taxes to United States investors.
95
SUREWEST COMMUNICATIONS
NOTES TO CONSOLIDATED FINANCIAL STATEMENTS (Continued)
YEARS ENDED DECEMBER 31, 2010, 2009 AND 2008
8. PENSION PLAN AND OTHER POST-RETIREMENT BENEFITS (Continued)
The fair values of our Other Benefits Plan assets at December 31, 2010 and 2009, by asset category were as follows:
| |
December 31, 2010 | |||||||||||||
|---|---|---|---|---|---|---|---|---|---|---|---|---|---|---|
Asset Category
|
Total | Level 1 | Level 2 | Level 3 | ||||||||||
Short-term investment fund(1) |
$ | 57 | $ | 57 | $ | – | $ | – | ||||||
Equity securities: |
||||||||||||||
United States large-cap(2) |
1,238 | 1,238 | – | – | ||||||||||
United States small-cap(4) |
308 | – | 308 | – | ||||||||||
International value(5) |
335 | – | 335 | – | ||||||||||
International growth funds(5) |
314 | 314 | – | – | ||||||||||
Domestic fixed income: |
||||||||||||||
United States treasury and government agency securities |
437 | 437 | – | – | ||||||||||
Corporate and municipal bonds |
370 | – | 370 | – | ||||||||||
Mortgage/asset-backed securities |
783 | – | 783 | – | ||||||||||
Total |
$ | 3,842 | $ | 2,046 | $ | 1,796 | $ | – | ||||||
| |
December 31, 2009 | |||||||||||||
|---|---|---|---|---|---|---|---|---|---|---|---|---|---|---|
Asset Category
|
Total | Level 1 | Level 2 | Level 3 | ||||||||||
Short-term investment fund(1) |
$ | 100 | $ | 100 | $ | – | $ | – | ||||||
Equity securities: |
||||||||||||||
United States large-cap(3) |
1,322 | – | 1,322 | – | ||||||||||
United States small-cap(4) |
291 | – | 291 | – | ||||||||||
International value(5) |
324 | – | 324 | – | ||||||||||
International growth funds(5) |
317 | 317 | – | – | ||||||||||
Domestic fixed income: |
||||||||||||||
United States treasury and government agency securities |
272 | 272 | – | – | ||||||||||
Corporate commercial paper |
53 | – | 53 | – | ||||||||||
Corporate and municipal bonds |
429 | – | 429 | – | ||||||||||
Mortgage/asset-backed securities |
745 | – | 745 | – | ||||||||||
Total |
$ | 3,853 | $ | 689 | $ | 3,164 | $ | – | ||||||
- (1)
- This category represents a sweep fund that is used for daily Plan operations.
- (2)
- This category comprises low-cost equity index funds and investments in common stock of domestic corporations in a industry sectors with a benchmark of the Russell 1000 Index.
- (3)
- This category comprises low-cost equity index funds with a benchmark of the Russell 1000 Index.
- (4)
- This category comprises low-cost equity index funds with a benchmark of the Russell 2000 Index.
- (5)
- These categories compromise equity funds with a benchmark of the Morgan Stanley Capital International Europe, Asia, Australia, Far East Stock index, net of withholding taxes to United States investors.
96
SUREWEST COMMUNICATIONS
NOTES TO CONSOLIDATED FINANCIAL STATEMENTS (Continued)
YEARS ENDED DECEMBER 31, 2010, 2009 AND 2008
8. PENSION PLAN AND OTHER POST-RETIREMENT BENEFITS (Continued)
Cash Flows
Contributions
Our minimum funding requirement for 2011 related to the Pension Plan is expected to be approximately $5,800. However, due to a carryover balance of approximately $2,000 and the timing of the quarterly installments we are not required to make a cash contribution until January 2012. We will continue to evaluate the future funding requirements of the Plans and fund them as necessary.
Estimated Future Benefit Payments
As of December 31, 2010, benefit payments expected to be paid over the next ten years from the Plans are outlined in the following table:
| |
Pension Plan & SERP | Other Benefits Plan | ||||||
|---|---|---|---|---|---|---|---|---|
Expected benefit payments: |
||||||||
2011 |
$ | 7,780 | $ | 1,084 | ||||
2012 |
8,043 | 998 | ||||||
2013 |
8,316 | 987 | ||||||
2014 |
8,646 | 956 | ||||||
2015 |
8,856 | 774 | ||||||
2016-2020 |
46,521 | 1,882 | ||||||
We maintain a defined contribution retirement plan, the SureWest KSOP (the "KSOP"). We have retained a financial advisor and an investment management company to serve as the record keeper and fund manager for certain funds of the KSOP. The KSOP allows its participants an opportunity to diversify their retirement holdings by offering a choice of twenty-two investment options, including the Company's common stock. The KSOP has a retirement and savings feature. The retirement feature allows for qualified tax deferred contributions by employees under Section 401(k) of the Internal Revenue Code. We match an employee's contributions dollar-for-dollar up to six percent of an employee's salary. Our matching contribution vests when the employee completes one year of service. The KSOP provides for voting rights as to the participant's share of the Company's common stock held by the KSOP and for certain diversification rights of the participant's account balances. Our earnings (loss) per share calculations include the issued and outstanding shares held by the KSOP.
The following table summarizes matching KSOP contributions we expensed, the number of shares of the Company's common stock held by the KSOP and dividends received from the shares of the Company's common stock held by the KSOP for the years ended December 31, 2010, 2009 and 2008:
| |
2010 | 2009 | 2008 | |||||||
|---|---|---|---|---|---|---|---|---|---|---|
Aggregate matching KSOP contributions expensed by the Company |
$ | 2,871 | $ | 3,015 | $ | 3,138 | ||||
Number of the Company's shares held by the KSOP at December 31, |
656,000 | 751,000 | 766,000 | |||||||
Dividends received from the Company's shares held by the KSOP |
$ | – | $ | – | $ | 364 | ||||
97
SUREWEST COMMUNICATIONS
NOTES TO CONSOLIDATED FINANCIAL STATEMENTS (Continued)
YEARS ENDED DECEMBER 31, 2010, 2009 AND 2008
9. COMMITMENTS AND CONTINGENCIES
We have certain other obligations for various contractual agreements that secure future rights to goods and services to be used in the normal course of operations. These include purchase commitments for planned capital expenditures, agreements securing dedicated access and transport services, programming license agreements and support agreements. Additionally, SureWest Long Distance has procured transport resale arrangements with several interexchange carriers. These resale arrangements are on a month-to-month basis with no long-term obligations.
We lease certain facilities and equipment used in our operations under arrangements accounted for as operating leases. The facility leases generally require us to pay operating costs; including property taxes, insurance and maintenance, and certain of them contain scheduled rent increases and renewal options. Leasehold improvements are amortized over their estimated useful lives or lease period, whichever is shorter. We recognize rent expense on a straight-line basis over the term of each lease.
The following table summarizes our minimum annual contractual obligations as of December 31, 2010 and the estimated timing and effect the obligations will have on our liquidity and cash flows in future periods:
| |
2011 | 2012 | 2013 | 2014 | 2015 | Thereafter | Total | ||||||||||||||||
|---|---|---|---|---|---|---|---|---|---|---|---|---|---|---|---|---|---|---|---|---|---|---|---|
Operating lease agreements(1) |
$ | 1,118 | 928 | 823 | 852 | 850 | 1,067 | $ | 5,638 | ||||||||||||||
Capital expenditures(2) |
2,114 | – | – | – | – | – | 2,114 | ||||||||||||||||
Service and support agreements(3) |
804 | 527 | 18 | – | – | – | 1,349 | ||||||||||||||||
Programming content agreements(4) |
477 | 360 | 26 | 2 | – | – | 865 | ||||||||||||||||
High-speed data connectivity(5) |
300 | 125 | – | – | – | – | 425 | ||||||||||||||||
Total |
$ | 4,813 | $ | 1,940 | $ | 867 | $ | 854 | $ | 850 | $ | 1,067 | $ | 10,391 | |||||||||
- (1)
- We have entered into various non-cancelable operating leases for certain facilities and equipment with terms greater than one year.
- (2)
- We have binding commitments with numerous suppliers for future capital expenditures.
- (3)
- We have entered into service and maintenance agreements to support various computer hardware and software applications and certain equipment.
- (4)
- Programming content represents contracts with cable television networks and broadcast stations to provide programming services to our subscribers. The amounts included in the above schedule represent estimated future payments for contracts with guaranteed minimum commitment levels and other factors, including the number of subscribers receiving the programming.
- (5)
- High-speed data connectivity represents contracts with guaranteed dedicated Internet access at designated bandwidth levels.
The table below summarizes payments we made for operating leases, long distances transport, and high-speed data connectivity services for the years ended December 31, 2010, 2009 and 2008:
| |
2010 | 2009 | 2008 | |||||||
|---|---|---|---|---|---|---|---|---|---|---|
Operating lease agreements |
$ | 3,369 | $ | 3,561 | $ | 3,614 | ||||
Long distance transport services |
1,716 | 2,112 | 2,201 | |||||||
High-speed data connectivity |
853 | 1,546 | 783 | |||||||
|
$ | 5,938 | $ | 7,219 | $ | 6,598 | ||||
98
SUREWEST COMMUNICATIONS
NOTES TO CONSOLIDATED FINANCIAL STATEMENTS (Continued)
YEARS ENDED DECEMBER 31, 2010, 2009 AND 2008
9. COMMITMENTS AND CONTINGENCIES (Continued)
Litigation, Regulatory Proceedings and Other Contingencies
We are subject to certain legal and regulatory proceedings, Internal Revenue Service examinations and other income tax exposures, and other claims arising in the ordinary course of our business. In the opinion of management, the ultimate outcome of these matters will not materially affect our consolidated financial position, results of operations or cash flows.
10. SHARE-BASED COMPENSATION
Stock Plan
Our Board of Directors may grant share-based awards from our shareholder approved Equity Incentive Plan, the 2000 Equity Incentive Plan (the "Stock Plan"), to certain employees, outside directors and consultants. The Stock Plan permits issuance of awards in the form of RSAs, RSUs, performance shares, stock options and stock appreciation rights. Under the Stock Plan, approximately 2.1 million shares of our common stock were authorized for issuance, including those outstanding as of December 31, 2010.
Restricted Common Stock Awards and Units
We measure the fair value of the RSAs and RSUs based upon the market price of the underlying common stock as of the date of the grant. RSAs and RSUs are amortized over their respective vesting periods, generally from immediate vest to a four-year vesting period using the straight-line method. We have estimated expected forfeitures based on historical experience and are recognizing compensation expense only for those RSAs and RSUs expected to vest.
The following table summarizes the grants that occurred under the Stock Plan during the years 2010, 2009 and 2008:
| |
Years Ended December 31, | |||||||||||||||||||
|---|---|---|---|---|---|---|---|---|---|---|---|---|---|---|---|---|---|---|---|---|
| |
2010 | Grant Date Fair Value |
2009 | Grant Date Fair Value |
2008 | Grant Date Fair Value |
||||||||||||||
RSAs Granted |
217,575 | $ | 9.95 | 166,506 | $ | 11.56 | 143,340 | $ | 12.34-15.59 | |||||||||||
RSUs Granted |
92,709 | $ | 9.95 | 72,443 | $ | 11.56 | 66,810 | $ | 8.43-12.34 | |||||||||||
RSU Dividends |
– | $ | – | 8,470 | $ | 9.79 | 802 | $ | 8.88 | |||||||||||
Total |
310,284 | 247,419 | 210,952 | |||||||||||||||||
RSU Dividends consist of dividends that were previously granted to the holders of RSUs, which have fully vested and were released during the years presented in accordance with the underlying award agreement. Stock-based compensation expense for both RSAs and RSUs of $2,845 (which included the costs to accelerate certain RSAs in accordance with the workforce reduction initiative as described below), $2,010 and $879 was recorded during the years ended December 31, 2010, 2009 and 2008, respectively. Income tax benefits related to stock-based compensation of approximately $1,147, $813 and $356 were recorded for the years ended December 31, 2010, 2009 and 2008, respectively.
99
SUREWEST COMMUNICATIONS
NOTES TO CONSOLIDATED FINANCIAL STATEMENTS (Continued)
YEARS ENDED DECEMBER 31, 2010, 2009 AND 2008
10. SHARE-BASED COMPENSATION (Continued)
During the year ended December 31, 2010, the following summarizes the restricted common stock activity:
| Nonvested Shares | Shares | Weighted Average Grant Date Fair Value | |||||
|---|---|---|---|---|---|---|---|
Nonvested-January 1, 2010 |
349,916 | $ | 12.90 | ||||
Granted |
310,284 | $ | 9.95 | ||||
Vested |
(259,044 | ) | $ | 12.05 | |||
Forfeited |
(4,813 | ) | $ | 11.03 | |||
Nonvested-December 31, 2010 |
396,343 | $ | 11.17 | ||||
As of December 31, 2010, total unrecognized compensation costs related to nonvested restricted stock was $4,336 and will be recognized over a weighted-average period of approximately 2.31 years. The total fair value of RSAs and RSUs vested during the years ended December 31, 2010, 2009 and 2008 was $3,123, $2,305 and $1,222, respectively.
Stock Options
In 2003, we ceased granting stock options and have since granted RSAs and RSUs as part of our equity compensation plan. We issue new shares of common stock upon exercise of stock options. The exercise price per share of the Company's common stock to be purchased under any incentive stock option shall not be less than 100% of the fair market value of a share of the Company's common stock on the date of the grant, and the exercise price under a non-qualified stock option shall not be less than 85% of the fair market value of the Company's common stock at the date of the grant. The term of any stock option shall not exceed ten years. There were no stock options granted or exercised during the year ended December 31, 2010. The aggregate intrinsic value is calculated as the difference between the exercise price of the stock options and the quoted price of our common stock. There were no options that were in-the-money as of December 31, 2010.
The following table summarizes stock option activity for the year ended December 31, 2010, along with options exercisable at the end of the year:
| Options | Shares | Weighted Average Exercise Price |
Weighted Average Remaining Contractual Life |
|||||||
|---|---|---|---|---|---|---|---|---|---|---|
Outstanding-January 1, 2010 |
318,389 | $ | 40.45 | |||||||
Expired |
(222,007 | ) | ||||||||
Outstanding-December 31, 2010 |
96,382 | $ | 41.85 | 1.00 | ||||||
Vested and exercisable at December 31, 2010 |
96,382 | $ | 41.85 | 1.00 | ||||||
11. STOCK REPURCHASE
In September 2010, our Board of Directors authorized the repurchase of up to an additional 1 million shares of our common stock, supplementing the previously authorized share repurchase program. The share repurchase program was originally approved in February 2000, and expanded in June 2002 and
100
SUREWEST COMMUNICATIONS
NOTES TO CONSOLIDATED FINANCIAL STATEMENTS (Continued)
YEARS ENDED DECEMBER 31, 2010, 2009 AND 2008
11. STOCK REPURCHASE (Continued)
November 2006. This additional authorization increases the total number of shares available for repurchase under the program to 3.5 million. Shares are purchased from time to time in the open market or through privately negotiated transactions, subject to overall financial and market conditions. As of December 31, 2010, under the share repurchase program approximately 2.3 million shares of common stock have been repurchased and approximately 1.2 million additional outstanding shares remain authorized for repurchase by the Board of Directors.
We repurchased approximately 430 thousand shares, 108 thousand shares and 553 thousand shares during 2010, 2009 and 2008, respectively. The purchase of common shares did not have a substantive effect on the average number of common shares outstanding or the calculation of basic and diluted earnings per share for the years ended December 31, 2010, 2009 or 2008.
12. BUSINESS SEGMENTS
We have two reportable business segments: Broadband and Telecom. We have aggregated certain of our operating segments within the Broadband and Telecom segments because we believe that such operating segments share similar economic characteristics. We measure and evaluate the performance of our segments based on income (loss) from operations. Corporate Operations are allocated to the appropriate segment, except for cash; investments; certain property, plant, and equipment; and miscellaneous other assets, which are not allocated to the segments. However, the interest income associated with cash and investments held by Corporate Operations is included in the results of the operations of our segments.
The Broadband segment utilizes fiber-to-the-home and fiber-to-the-node networks to offer many of its bundled residential and commercial services that include Internet Protocol-based digital and high-definition television, high-speed Internet, Voice over Internet Protocol ("VoIP") and local and long distance telephone in the Sacramento region and Kansas City area. The Broadband segment continues to expand its use of optical fiber in its networks.
The Telecom segment, which operates only in the Sacramento region, offers a broad selection of telecommunications services including traditional circuit-switched voice services, domestic and international long distance services and a number of lightly-regulated or non-regulated services. Customers in the Telecom segment can select individual services or bundled packages that may include unlimited local calling or unlimited local and domestic long distance calling plans. Our voice products also include value-added services such as voicemail, call waiting, caller identification and many other calling feature options. Most long distance services are offered by our subsidiary SureWest Long Distance, which is a reseller of long distance services.
The Telecom segment also provides wholesale access services through the use of its network to the Broadband segment, which enables the Broadband segment to offer high-speed Internet, VoIP and video services to those customers within SureWest Telephone's service area. These wholesale services are included as intersegment revenues and expenses in each of the respective segments and eliminated in the consolidated statements of income.
These segments are strategic business units that offer different products and services. The accounting policies of these segments are the same as those described in Note 1. We account for intersegment revenues and expenses at prevailing market rates.
101
SUREWEST COMMUNICATIONS
NOTES TO CONSOLIDATED FINANCIAL STATEMENTS (Continued)
YEARS ENDED DECEMBER 31, 2010, 2009 AND 2008
12. BUSINESS SEGMENTS (Continued)
Our business segment information is as follows:
| 2010 | Broadband | Telecom | Corporate Operations |
Discontinued Operations |
Intercompany Eliminations |
Consolidated | |||||||||||||
|---|---|---|---|---|---|---|---|---|---|---|---|---|---|---|---|---|---|---|---|
Operating revenues from external customers |
$ | 174,546 | $ | 68,953 | $ | – | $ | – | $ | – | $ | 243,499 | |||||||
Intersegment revenues |
564 | 20,637 | – | – | (21,201 | ) | – | ||||||||||||
Operating expenses* |
140,282 | 47,399 | – | – | (21,201 | ) | 166,480 | ||||||||||||
Depreciation and amortization |
49,621 | 12,204 | – | – | – | 61,825 | |||||||||||||
Income (loss) from operations |
(14,793 | ) | 29,987 | – | – | – | 15,194 | ||||||||||||
Investment income |
21 | 56 | – | – | – | 77 | |||||||||||||
Interest expense, net of capitalized interest |
(8,089 | ) | (257 | ) | – | – | – | (8,346 | ) | ||||||||||
Income tax expense (benefit) |
(9,893 | ) | 13,247 | – | – | – | 3,354 | ||||||||||||
Income (loss) from continuing operations |
$ | (12,873 | ) | $ | 16,228 | $ | – | $ | – | $ | – | $ | 3,355 | ||||||
Total assets |
$ | 1,004,739 | $ | 1,308,367 | $ | 997,012 | $ | – | $ | (2,706,937 | ) | $ | 603,181 | ||||||
Capital expenditures |
$ | 43,944 | $ | 7,286 | $ | 1,330 | $ | – | $ | – | $ | 52,560 | |||||||
*Exclusive of depreciation and amortization
| 2009 | Broadband | Telecom | Corporate Operations |
Discontinued Operations |
Intercompany Eliminations |
Consolidated | |||||||||||||
|---|---|---|---|---|---|---|---|---|---|---|---|---|---|---|---|---|---|---|---|
Operating revenues from external customers |
$ | 161,222 | $ | 80,478 | $ | – | $ | – | $ | – | $ | 241,700 | |||||||
Intersegment revenues |
438 | 19,897 | – | – | (20,335 | ) | – | ||||||||||||
Operating expenses* |
137,851 | 50,887 | – | – | (20,335 | ) | 168,403 | ||||||||||||
Depreciation and amortization |
47,359 | 12,365 | – | – | – | 59,724 | |||||||||||||
Income (loss) from operations |
(23,550 | ) | 37,123 | – | – | – | 13,573 | ||||||||||||
Investment income |
28 | 93 | – | – | – | 121 | |||||||||||||
Interest expense, net of capitalized interest |
(10,856 | ) | (462 | ) | – | – | – | (11,318 | ) | ||||||||||
Income tax expense (benefit) |
(13,453 | ) | 15,459 | – | – | – | 2,006 | ||||||||||||
Income (loss) from continuing operations |
$ | (20,782 | ) | $ | 21,449 | $ | – | $ | – | $ | – | $ | 667 | ||||||
Total assets |
$ | 914,026 | $ | 1,186,441 | $ | 827,566 | $ | – | $ | (2,305,170 | ) | $ | 622,863 | ||||||
Capital expenditures |
$ | 47,975 | $ | 9,355 | $ | 1,000 | $ | – | $ | – | $ | 58,330 | |||||||
*Exclusive of depreciation and amortization
102
SUREWEST COMMUNICATIONS
NOTES TO CONSOLIDATED FINANCIAL STATEMENTS (Continued)
YEARS ENDED DECEMBER 31, 2010, 2009 AND 2008
12. BUSINESS SEGMENTS (Continued)
| 2008 | Broadband | Telecom | Corporate Operations |
Discontinued Operations |
Intercompany Eliminations |
Consolidated | |||||||||||||
|---|---|---|---|---|---|---|---|---|---|---|---|---|---|---|---|---|---|---|---|
Operating revenues from external customers |
$ | 135,341 | $ | 95,032 | $ | – | $ | – | $ | – | $ | 230,373 | |||||||
Intersegment revenues |
539 | 18,455 | – | – | (18,994 | ) | – | ||||||||||||
Operating expenses* |
122,650 | 56,549 | – | – | (18,994 | ) | 160,205 | ||||||||||||
Depreciation and amortization |
40,491 | 14,536 | – | – | – | 55,027 | |||||||||||||
Income (loss) from operations |
(27,261 | ) | 42,402 | – | – | – | 15,141 | ||||||||||||
Investment income |
95 | 581 | – | – | – | 676 | |||||||||||||
Interest expense, net of capitalized interest |
(11,798 | ) | (328 | ) | – | – | – | (12,126 | ) | ||||||||||
Income tax expense (benefit) |
(15,157 | ) | 18,296 | – | – | – | 3,139 | ||||||||||||
Income (loss) from continuing operations |
$ | (23,684 | ) | $ | 24,510 | $ | – | $ | – | $ | – | $ | 826 | ||||||
Total assets |
$ | 858,899 | $ | 1,087,032 | $ | 682,712 | $ | 5,002 | $ | (1,999,836 | ) | $ | 633,809 | ||||||
Capital expenditures |
$ | 66,737 | $ | 18,519 | $ | 1,233 | $ | – | $ | – | $ | 86,489 | |||||||
*Exclusive of depreciation and amortization
13. QUARTERLY FINANCIAL INFORMATION (UNAUDITED)
| 2010 | March 31 | June 30 | September 30 | December 31 | |||||||||
|---|---|---|---|---|---|---|---|---|---|---|---|---|---|
Operating revenues |
$ | 60,188 | $ | 60,548 | $ | 61,117 | $ | 61,646 | |||||
Income from operations |
$ | 3,142 | $ | 2,037 | $ | 5,017 | $ | 4,998 | |||||
Net income (loss) |
$ | 527 | $ | (527 | ) | $ | 1,404 | $ | 1,951 | ||||
Net income (loss) per basic and diluted common share |
$ | 0.04 | $ | (0.04 | ) | $ | 0.10 | $ | 0.14 | ||||
| 2009 | March 31 | June 30 | September 30 | December 31 | ||||||||||
|---|---|---|---|---|---|---|---|---|---|---|---|---|---|---|
Operating revenues |
$ | 60,942 | $ | 60,930 | $ | 59,529 | $ | 60,299 | ||||||
Income from operations |
$ | 3,320 | $ | 4,615 | $ | 2,616 | $ | 3,022 | ||||||
Income (loss) from continuing operations |
$ | 79 | $ | 899 | $ | (211 | ) | $ | (100 | ) | ||||
Loss from discontinued operations |
(69 | ) | – | – | – | |||||||||
Gain on discontinued operations |
2,508 | 60 | – | – | ||||||||||
Net income (loss) |
$ | 2,518 | $ | 959 | $ | (211 | ) | $ | (100 | ) | ||||
Basic and diluted earnings (loss) per share: |
||||||||||||||
Income (loss) from continuing operations |
$ | 0.01 | $ | 0.06 | $ | (0.02 | ) | $ | – | |||||
Discontinued operations, net of tax |
0.17 | 0.01 | – | – | ||||||||||
Net income (loss) per basic and diluted common share |
$ | 0.18 | $ | 0.07 | $ | (0.02 | ) | $ | – | |||||
103
SUREWEST COMMUNICATIONS
NOTES TO CONSOLIDATED FINANCIAL STATEMENTS (Continued)
YEARS ENDED DECEMBER 31, 2010, 2009 AND 2008
13. QUARTERLY FINANCIAL INFORMATION (UNAUDITED) (Continued)