Attached files
Table of Contents
UNITED STATES
SECURITIES AND EXCHANGE COMMISSION
Washington, D.C. 20549
Form 10-K
| þ | ANNUAL REPORT PURSUANT TO SECTION 13 OR 15(d) OF THE SECURITIES EXCHANGE ACT OF 1934 |
For the Fiscal Year ended December 31, 2010
Or
| ¨ | TRANSITION REPORT PURSUANT TO SECTION 13 OR 15(d) OF THE SECURITIES EXCHANGE ACT OF 1934 |
Commission file number 001-14758
Questcor Pharmaceuticals, Inc.
(Exact name of registrant as specified in its charter)
| California | 33-0476164 | |
| (State or other jurisdiction of incorporation or organization) |
(I.R.S. Employer Identification No.) | |
| 1300 North Kellogg Drive, Suite D Anaheim, California |
92807 | |
| (Address of principal executive offices) | (Zip Code) | |
Registrant’s telephone number, including area code:
(714) 786-4200
Securities registered pursuant to Section 12(b) of the Act:
| Title of Each Class |
Name of Each Exchange on Which Registered | |
| Common Stock, no par value |
Nasdaq Global Market |
Securities registered pursuant to Section 12(g) of the Act:
None
(Title of class)
Indicate by check mark if the Registrant is a well-known seasoned issuer, as defined in Rule 405 of the Securities Act. Yes þ No ¨
Indicate by check mark if the Registrant is not required to file reports pursuant to Section 13 or 15(d) of the Act. Yes ¨ No þ
Indicate by check mark whether the Registrant (1) has filed all reports required to be filed by Section 13 or 15(d) of the Securities Exchange Act of 1934 during the preceding 12 months (or for such shorter period that the registrant was required to file such reports), and (2) has been subject to such filing requirements for the past 90 days. Yes þ No ¨
Indicate by check mark whether the registrant has submitted electronically and posted on its corporate Website, if any, every Interactive Data File required to be submitted and posted pursuant to Rule 405 of Regulation S-T (§ 229.405 of this chapter) during the preceding 12 months (or for such shorter period that the registrant was required to submit and post such files). ¨ Yes ¨ No
Indicate by check mark if disclosure of delinquent filers pursuant to Item 405 of Regulation S-K is not contained herein, and will not be contained, to the best of registrant’s knowledge, in definitive proxy or information statements incorporated by reference in Part III of this Form 10-K or any amendment to this Form 10-K. ¨
Indicate by check mark whether the registrant is a large accelerated filer, an accelerated filer, a non-accelerated filer, or a smaller reporting company. See the definitions of “large accelerated filer,” “accelerated filer” and “smaller reporting company” in Rule 12b-2 of the Exchange Act. (Check one):
| ¨ Large accelerated filer | þ Accelerated filer | ¨ Non-accelerated filer | ¨ Smaller reporting company | |||
| (Do not check if a smaller reporting company) | ||||||
Indicate by check mark whether the Registrant is a shell company (as defined by Rule 12b-2 of the Act). Yes ¨ No þ
The aggregate market value of the voting and non-voting Common Stock held by non-affiliates of the Registrant was approximately $586,926,000 as of June 30, 2010.
As of January 31, 2011 the Registrant had 62,442,748 shares of Common Stock outstanding.
DOCUMENTS INCORPORATED BY REFERENCE
Part III of this Annual Report incorporates by reference information from the definitive Proxy Statement for Questcor Pharmaceuticals, Inc.’s 2011 Annual Meeting of Shareholders.
Table of Contents
| Page | ||||||
| PART I | ||||||
| Item 1. |
3 | |||||
| Item 1A. |
8 | |||||
| Item 1B. |
16 | |||||
| Item 2. |
16 | |||||
| Item 3. |
17 | |||||
| Item 4. |
17 | |||||
| PART II | ||||||
| Item 5. |
18 | |||||
| Item 6. |
20 | |||||
| Item 7. |
Management’s Discussion and Analysis of Financial Condition and Results of Operations |
21 | ||||
| Item 7A. |
30 | |||||
| Item 8. |
30 | |||||
| Item 9. |
Changes in and Disagreements with Accountants on Accounting and Financial Disclosure |
30 | ||||
| Item 9A. |
30 | |||||
| Item 9B. |
33 | |||||
| PART III | ||||||
| Item 10. |
33 | |||||
| Item 11. |
34 | |||||
| Item 12. |
Security Ownership of Certain Beneficial Owners and Management and Related Shareholder Matters |
34 | ||||
| Item 13. |
Certain Relationships and Related Transactions, and Director Independence |
34 | ||||
| Item 14. |
34 | |||||
| PART IV | ||||||
| Item 15. |
35 | |||||
| 39 | ||||||
2
Table of Contents
QUESTCOR PHARMACEUTICALS, INC.
PART I
References in this Annual Report on Form 10-K to “Questcor”, “we”, “our”, “us”, or the “Company” refer to Questcor Pharmaceuticals, Inc. This Annual Report on Form 10-K contains forward-looking statements based on expectations, estimates and projections as of the date of this filing. Actual results may differ materially from those expressed in forward-looking statements. See Item 7 of Part II—“Management’s Discussion and Analysis of Financial Condition and Results of Operations—Forward-Looking Statements.”
We obtained the market data and industry information contained in this Annual Report on Form 10-K from internal surveys, estimates, reports and studies, as appropriate, as well as from market research, publicly available information and industry publications. Although we believe our internal surveys, estimates, reports, studies and market research, as well as industry publications are reliable, we have not independently verified such information, and as such, we do not make any representation as to its accuracy.
Overview
We are a biopharmaceutical company whose primary product helps patients with serious, difficult-to-treat medical conditions. Our primary product is H.P. Acthar® Gel (repository corticotropin injection), or Acthar, an injectable drug that is approved by the U.S. Food and Drug Administration, or FDA. Acthar is only available in a multi-use vial. We derive substantially all of our net sales from the sale of Acthar in the U.S. and do not have operations outside of the U.S. However, we own the worldwide rights to Acthar. Acthar is approved for the treatment of 19 indications, though we currently generate most of our net sales from two indications: the treatment of acute exacerbations of multiple sclerosis, or MS, in adults, and the treatment of infantile spasms, or IS, in infants and children under two years of age. We are also exploring the other therapeutic areas where Acthar is approved, including the use of Acthar to induce a diuresis or a remission of proteinuria in the nephrotic syndrome without uremia of the idiopathic type or due to lupus erythematosus. As a current on-label indication for Acthar, we have commenced a small pilot sales effort to attempt to generate incremental net sales and better understand the commercial opportunity for Acthar in this indication. We are also exploring the possibility of pursuing FDA approval of additional indications not currently on the Acthar label where there is high unmet medical need.
Brief descriptions of the diseases and conditions that Acthar is currently approved to treat are as follows:
| • | MS causes the immune system to attack the protective covering of the nerves, leading to impaired sensory and motor nerve function, and, in most cases, some degree of disability. The myelin sheath is a protective covering around a portion of nerve cells that allows the cells to transmit impulses effectively. In MS, the myelin sheath is damaged, causing varying symptoms that include increased difficulty moving and progressive weakness. An exacerbation is a sudden worsening of these symptoms. The goal of treatment by neurologists of an MS exacerbation is to return the patient to the level of functionality that existed before the exacerbation occurred. Neurologists generally do not prescribe Acthar unless the primary treatment, intravenous steroids, is not suitable, including where the MS patient has not adequately responded to, cannot tolerate or has inadequate venous access for intravenous steroids. Acthar has been used as a second line treatment to treat MS exacerbations for the last several years. Treatment for MS exacerbations using Acthar generally requires two vials. Acthar and steroids are the only drugs currently approved for the treatment of MS exacerbations. |
| • | IS is a specific type of epilepsy seen in infancy and very early childhood; it is also known as West Syndrome. IS is characterized by spasms and a specific pattern of electroencephalography, or EEG, called hypsarrhythmia. The onset of infantile spasms is usually in the first year of life. IS is considered a medical emergency because the normal developmental process for the baby is adversely impacted. The prognosis for patients with IS is generally poor. Significant developmental delay and potentially death may result if IS is not treated successfully. The goal of child neurologists in treating IS is to eliminate both the spasms and the hypsarrhythmia. We believe that many child neurologists who treat IS consider Acthar the treatment of choice although other treatments are also used. Only one other product is approved for the treatment of IS. Acthar has been used to treat IS for many decades. Acthar was approved by the FDA for the treatment of IS on October 15, 2010 and has received Orphan Drug designation relating to the treatment of IS. The treatment for IS using Acthar generally requires four to five vials, although sometimes fewer vials are used. |
3
Table of Contents
| • | Nephrotic syndrome, or NS, occurs when there is a malfunction in the kidney’s filtering system (glomeruli) causing protein in the blood to leak into the urine (proteinuria). The result is fluid accumulating in the body, and prolonged proteinuria has been shown to cause kidney failure, or end-stage renal disease, or ESRD. Patients who reach ESRD require kidney dialysis or kidney transplantation surgery. NS can be classified by the damage occurring to different cells in the kidney, for example, idiopathic membraneous nephropathy (IMN) or focal segmented glomerular sclerosis (FSGS). The goal of nephrologists in treating proteinuria is to reduce the level of proteinuria by 50% or more. Proteinuria associated with IMN, FSGS and lupus nephritis are included in the labeled indication for Acthar. While physicians have not yet developed a common dosing administration protocol for Acthar in treating NS, treatment regimens for NS have historically used six to ten vials of Acthar in treating each NS patient. In addition to Acthar, steroids are the only other treatment approved by the FDA for the treatment of NS. |
In addition to the preceding indications, the new Acthar label includes other indications organized under the following disease states:
| • | Rheumatic Disorders: As adjunctive therapy for short-term administration (to tide the patient over an acute episode or exacerbation) in Psoriatic arthritis; Rheumatoid arthritis, including juvenile rheumatoid arthritis (selected cases may require low-dose maintenance therapy); and Ankylosing spondylitis. |
| • | Collagen Diseases: During an exacerbation or as maintenance therapy in selected cases of systemic lupus erythematosus and systemic dermatomyositis (polymyositis). |
| • | Dermatologic Diseases: Severe erythema multiforme and Stevens-Johnson syndrome. |
| • | Allergic States: Serum sickness. |
| • | Ophthalmic Diseases: Severe acute and chronic allergic and inflammatory processes involving the eye and its adnexa such as keratitis, iritis, iridocyclitis, diffuse posterior uveitis and choroiditis; optic neuritis; chorioretinitis; and anterior segment inflammation. |
| • | Respiratory Diseases: Symptomatic sarcoidosis. |
Acthar has also been used to treat other conditions not on the label of approved indications for Acthar. During the year ended December 31, 2010, we believe physicians wrote prescriptions for Acthar for a variety of conditions that are not on its label of approved indications, including the following: Opsoclonus Myoclonus, Adrenal Insufficiency, Landau-Kleffner Syndrome, Myasthenia Gravis, Neurosarcoidosis, and Ulcerative Colitis.
Our other product is Doral® (quazepam), which is indicated for the treatment of insomnia characterized by difficulty in falling asleep, frequent nocturnal awakenings, and/or early morning awakenings. We own the U.S. rights to and have modest sales of Doral.
Our total net sales were $115.1 million for the year ended December 31, 2010 as compared to $88.3 million and $95.2 million for the years ended December 31, 2009 and 2008, respectively. Approximately 99% of our net sales in all three years were from Acthar. Our net income applicable to common shareholders was $35.1 million for the year ended December 31, 2010 as compared to $26.6 million and $35.3 million for the years ended December 31, 2009 and 2008, respectively. As of December 31, 2010, our cash, cash equivalents and short-term investments totaled $114.8 million as compared to $75.7 million as of December 31, 2009.
We have registered trademarks on H.P. Acthar® Gel and Doral®. Any other trademark, trade name or service mark appearing in this document belongs to its respective holder. We believe that our trademarks, trade names and service marks have value and play an important role in our business efforts. We own all the worldwide rights for Acthar and the U.S. manufacturing, marketing and distribution rights for Doral.
Sales and Marketing
We have a highly trained sales force with significant experience in the pharmaceutical industry. During the fourth quarter of 2010, we completed our previously announced plan to expand the size of our commercial organization including all territorial re-alignments. Our expanded MS sales force of 77 sales representatives and 15 sales managers continues to allow us to build upon positive growth trends in prescriptions of Acthar for the treatment of exacerbations associated with MS. With the FDA’s October 2010 approval of our supplement new drug application, or sNDA, our expanded MS sales force will also market Acthar to child neurologists for the treatment of IS. In addition, we have recently hired a five person sales force to promote Acthar for the on-label indications associated with NS.
4
Table of Contents
Customers and Distribution
In the U.S., our exclusive customer for Acthar is CuraScript Specialty Distribution, Inc., or CuraScript SD. We sell Acthar at a discount from our list price to CuraScript SD, which then resells Acthar primarily to approximately 12 specialty pharmacies, including CuraScript Specialty Pharmacy, or CuraScript SP, and to children’s hospitals. Effective January 1, 2011, our price to CuraScript SD was $24,195 per vial. We sell Doral to pharmaceutical wholesalers, who resell Doral primarily to retail pharmacies and hospitals.
We have engaged Integrated Commercialization Services, Inc., or ICS, to act as our exclusive agent for commercial shipment of our products to our customers. In addition to distribution services, ICS provides us with related services, including product storage, returns, customer support, and administrative support.
After Acthar and Doral are manufactured, they are shipped to ICS where the drugs are warehoused. Upon receiving orders from CuraScript SD, ICS ships Acthar to Curascript SD. Upon receiving orders from national distributors, ICS ships Doral to those customers.
We recognize revenue when we have persuasive evidence that an arrangement, agreement or contract exists, when title for our product and risk of loss have passed to our customer, the price we charge for our product is fixed or is readily determinable, and we are reasonably assured of collecting the amounts owed under the resulting receivable. For Acthar, this occurs when CuraScript SD accepts a shipment of Acthar based on its order of Acthar from ICS. For sales of both our products, we do not require collateral from our customers.
Government Insurance Program Reimbursement
A portion of our end-user vial demand for Acthar is for patients covered under Medicaid, Medicare and other government-related programs. As required by Federal regulations, we provide rebates and discounts in connection with these programs such as Tricare and the Veterans Administration, or VA. As a result of Medicaid rebates, we do not generate any net sales with respect to Medicaid sales, but we do generate net sales with respect to Medicare sales, Tricare sales and sales made to the VA. As a result of the enactment of the Patient Protection and Affordable Care Act of 2010 and the Healthcare and Education Affordability Reconciliation Act of 2010, signed into law on March 23, 2010 and March 30, 2010, respectively, or the Healthcare Reform Acts, a greater proportion of our sales of Acthar have been subject to Medicaid rebates, although the per vial rebate amount decreased to 100% of our Average Manufacturers Price, or AMP. For Medicare, starting January 1, 2011, we pay a rebate under the Healthcare Reform Acts. However, this rebate is estimated to be less than 10% of the price of Acthar.
See Item 1A “Risk Factors: Risks Associated with Government Regulations and Health Care Reform” for a discussion of additional risks related to reimbursement.
Competition
The pharmaceutical and biotechnology industries are intensely competitive and subject to rapid and significant technological change. A number of companies are pursuing the development of pharmaceuticals and products that target the same diseases and conditions that Acthar is currently approved to treat or which we may seek to add to the label of approved indications for Acthar. There are products and treatments on the market that compete with Acthar.
Most of our competitors are larger than us and have substantially greater financial, marketing and technical resources than we have. If any of our present or future competitors develop new products that are superior to Acthar, our performance may be materially and adversely affected.
The current success of our business strategy likely will attract additional competition. See Item 1A “Risk Factors: Risks Associated with Acthar” for a discussion of additional risks related to competition.
Manufacturing
Acthar is derived from the extraction and purification of porcine pituitary glands through complicated processes, and is difficult to manufacture. Acthar bulk concentrate, the active pharmaceutical ingredient, or API, used in Acthar, is processed in several stages to produce a highly purified raw material for formulation. We have a supply agreement with Bio Vectra, Inc., or Bio Vectra, to produce this API. We have a supply agreement with Cangene bioPharma, Inc., or Cangene, to manufacture commercial quantities of Acthar in sterile solution. Currently, both Bio Vectra and Cangene are our sole source suppliers for Acthar. While we have received approval from the FDA for the Acthar finished vials and API, transfers to new contract manufacturers, the processes used to manufacture and test Acthar are complex and subject to FDA inspection and approval. Acthar has a shelf life of 18 months from the date of manufacture.
5
Table of Contents
We have a supply agreement with Meda Pharmaceuticals, or Meda, to manufacture commercial quantities of Doral. Currently, Meda is our sole source supplier for Doral. Doral has a shelf life of 60 months from the date of manufacture.
We cannot assure you that any of our API or finished goods contract manufacturers will continue to meet our requirements for quality, quantity and timeliness. Also we cannot assure you that our contract manufacturers will be able to meet all of the FDA’s current good manufacturing practice, or cGMP, requirements.
Our dependence upon others for the manufacture of API or our finished products may adversely affect the future profit margin on the sale of those products and our ability to develop and deliver products on a timely and competitive basis. We do not have substitute suppliers for our products although we strive to plan appropriately and maintain safety stocks of product to cover unforeseen events at manufacturing sites.
See Item 1A “Risk Factors: Risks Associated with Acthar” for a discussion of additional risks related to manufacturing.
Research and Development
During the years ended December 31, 2010, 2009 and 2008, we spent $10.9 million, $9.7 million and $10.6 million, respectively, on research and development activities.
We plan to continue our research and development efforts to explore the use of Acthar as a therapeutic alternative for the treatment of nephrotic syndrome. In 2010, we provided funding for investigator-initiated studies conducted in patients with idiopathic membranous nephropathy (on-label) and diabetic nephropathy (not on-label). Based on the results of these investigations, we currently intend to conduct a Phase IV dose response clinical trial for idiopathic membranous nephropathy and a Phase II dose response clinical trial for diabetic nephropathy in 2011. If we initiate and conduct these dose response clinical trials, we will significantly increase our research and development expenses for 2011 through 2013. We also may pursue additional clinical trials to evaluate the use of Acthar to treat other therapeutic uses, including conditions which are currently not on the label of approved indications for Acthar.
See Item 1A “Risk Factors: Risks Associated with Acthar” for a discussion of additional risks related to research and development.
Patents and Proprietary Rights
The FDA first approved the use of Acthar in 1952. While Acthar is no longer subject to patent protection, Acthar has received orphan drug designation from the FDA, which provides Acthar with a seven-year exclusivity period that began in October 2010. During the exclusivity period, the FDA is prohibited from approving any other adrenocorticotropic hormone (ACTH) formulation for the treatment of IS unless the other formulation is demonstrated to be clinically superior to Acthar.
Our success depends partially upon our ability to maintain confidentiality and operate without infringing upon the proprietary rights of third parties. We rely primarily on a combination of copyright, trademark and trade secret laws, confidentiality procedures, and contractual provisions to protect our intellectual property. We also have a U.S. patent related to Doral.
Our efforts to protect our intellectual property may not be adequate. Our competitors may independently develop similar technology or duplicate our products or services. Unauthorized parties may infringe upon or misappropriate our products, services or proprietary information. In addition, the laws of some foreign countries do not protect proprietary rights as well as the laws of the United States. In the future, litigation may be necessary to enforce our intellectual property rights or to determine the validity and scope of the proprietary rights of others. Any such litigation could be time consuming and costly.
We could be subject to intellectual property infringement claims as we expand our product and service offerings and the number of competitors increases. Defending against these claims, even if the claims are without merit, could be expensive and divert our attention from our operations. If we become liable to third parties for infringing upon their intellectual property rights, we could be required to pay a substantial damage award and be forced to develop non-infringing technology, obtain a license or cease using the applications that contain the infringing technology or content. We may be unable to develop non-infringing technology or content or obtain a license on commercially reasonable terms, or at all.
See Item 1A “Risk Factors: Risks Associated with Acthar” for a discussion of additional risks related to patents and proprietary rights.
6
Table of Contents
Government Regulation of Acthar and Doral
Our pharmaceutical products are subject to extensive government regulation in the United States. FDA regulations govern the research, development, testing, manufacture, quality control, labeling, storage, record-keeping, approval, sale, distribution, advertising and promotion of our products.
The FDA testing and approval process for new indications for previously approved drugs requires substantial time, effort and money. We cannot assure you that any application we submit to the FDA will be timely approved, if ever.
The FDA may withdraw product approval for non-compliance with regulatory requirements or if safety or efficacy problems occur after the product reaches the market. The FDA also has the power to require changes in labeling or to prevent further marketing of a product based on the results of these post-marketing programs.
The facilities, procedures, and operations of our contract manufacturers must be determined to be adequate by the FDA before a new drug application or supplemental new drug application is approved. Additionally, manufacturing facilities are subject to inspections by the FDA for compliance with cGMP, licensing specifications, and other FDA regulations on an on-going basis. Vendors that supply us finished products or components used to manufacture, package and label products are subject to similar regulations and period inspections.
Following such inspections, the FDA may issue notices on Form 483 and issue Warning Letters that could cause us to modify certain activities identified during the inspection. The FDA generally issues a Form 483 notice at the conclusion of an FDA inspection and lists conditions the FDA investigators believe may violate cGMP or other FDA regulations. FDA guidelines specify that a Warning Letter be issued only for violations of “regulatory significance” for which the failure to adequately and promptly achieve correction may be expected to result in an enforcement action.
In addition, the FDA imposes a number of complex regulatory requirements on entities that advertise and promote pharmaceuticals, including but not limited to, standards and regulations for direct-to-consumer advertising, off-label promotion, industry-sponsored scientific and educational activities and promotional activities involving the internet.
Failure to comply with FDA and governmental regulations can result in fines, unanticipated compliance expenditures, recall or seizure of products, total or partial suspension of production and/or distribution, suspension of the FDA’s review of new drug applications or supplemental new drug applications, injunctions, disqualification from participation in government reimbursement programs and criminal prosecution. Any of these actions or events could have a material adverse effect on us.
Human Resources
During 2010, we completed a sales force expansion. As of January 31, 2011, we had 152 full-time employees, 113 of whom are engaged in sales and commercialization activities.
Our continued success will depend in large part on our ability to attract and retain key employees. We believe that our relationship with our employees is good. None of our employees is represented by a collective bargaining agreement, nor have we experienced work stoppages.
General Information
We incorporated in California in September 1992 as Cypros Pharmaceutical Corporation. In November 1999, we changed our name to Questcor Pharmaceuticals, Inc. In the third quarter of 2010, we moved our corporate headquarters to southern California and we are now located at 1300 North Kellogg Drive, Suite D, Anaheim, California 92807, and our telephone number is (714) 786-4200.
We make the following reports available on our website, at www.questcor.com, free of charge as soon as practicable after filing with the U.S. Securities and Exchange Commission, or SEC:
| • | Our annual reports on Form 10-K, quarterly reports on Form 10-Q, current reports on Form 8-K, our proxy statements on Schedule 14A, and amendments to these reports and statements; |
| • | Our policies related to corporate governance, including our Code of Ethics and Conduct which apply to our directors, officers and employees (including our principal executive officer and principal financial and accounting officer) that we have adopted to meet the requirements set forth in the rules and regulations of the SEC and its corporate governance principles; and |
7
Table of Contents
| • | The charters of the Audit, Compensation and Nomination & Corporate Governance Committees of our Board of Directors. |
All such reports are also available free of charge via EDGAR through the SEC website www.sec.gov. In addition, the public may read and copy material filed by us with the SEC at the SEC’s public reference room located at 100 F St., NE, Washington, D.C., 20549. Information regarding operation of the SEC’s public reference room can be obtained by calling the SEC at 1-800-SEC-0330. The contents of our website are not incorporated by reference into this Annual Report.
Risks Associated with Acthar
Substantially all of our net sales and profits are derived from Acthar.
For the year ended December 31, 2010, sales of Acthar for the treatment of acute exacerbations of MS and for the treatment of IS represented approximately 99% of our total net sales. We expect to continue to rely on sales of Acthar for these two conditions for substantially all of our net sales and profits for the foreseeable future. In the fourth quarter of 2010, we substantially increased the size of our sales force, but we cannot provide assurance that this sales force expansion will result in increased sales of Acthar. The primary course of treatment for MS exacerbations is intravenous corticosteroids and there is a limited history of, or clinical data regarding, the use of Acthar to treat patients who do not respond adequately to steroids or for whom steroids are not suitable. Further, over the past several years disease modifying agents have been increasingly prescribed to treat the underlying disease state of MS, and the success of these treatments could reduce the overall incidence rate of acute exacerbations for MS including acute exacerbations of MS in patients who might be candidates for being treated with Acthar.
The demand for Acthar to treat IS is highly variable, and we cannot predict whether we will continue to generate significant net sales from sales of Acthar for the treatment of IS.
If the demand for Acthar declines, if third-party payors refuse to provide reimbursement for purchases of Acthar, if a greater proportion of our Acthar unit sales is comprised of product dispensed to Medicaid eligible patients where we do not recognize any net sales, our net sales from the sale of Acthar would decline. If the cost to produce Acthar increases, our gross margins on the sale of Acthar would decline. If our net sales or gross margins from the sale of Acthar decline, our ability to generate profits would be harmed.
We utilize CuraScript SD, a third-party specialty distributor, to distribute Acthar. We rely on CuraScript SD for all of our proceeds from sales of Acthar in the United States. The outsourcing of our distribution function is complex, and we may experience difficulties that could reduce, delay or stop shipments of Acthar. If we encounter such distribution problems, and we are unable to quickly enter into a similar agreement with another specialty distributor on substantially similar terms, Acthar distribution could become disrupted, resulting in lost revenues or customer dissatisfaction.
The manufacture of Acthar is a highly exacting and complex process and, if any of our suppliers encounters problems manufacturing products, our business could suffer.
Biological products such as Acthar require production processes that are significantly more complicated than those required for chemical pharmaceuticals, due in part to strict regulatory requirements. Problems may arise during manufacturing for a variety of reasons, including equipment malfunction, failure to follow specific protocols and procedures, problems with raw materials, natural disasters, and environmental factors. In addition, we currently use single suppliers for our products and materials.
If problems arise during the production of a batch of product, that batch of product may have to be discarded. Among other impacts to our business, lost batches could lead to increased costs, lost revenue, damage to our reputation and customer relations, time and expense spent investigating the cause of such problems and, depending on the cause, similar losses with respect to other batches of Acthar. If we do not discover problems before Acthar is released to the market, we also may incur recall and product liability costs. To the extent that one of our suppliers experiences significant manufacturing problems, these could have a material adverse effect on our revenues and profitability.
8
Table of Contents
Acthar is derived from the extraction and purification of porcine pituitary glands through complicated processes, and, as a result, Acthar is difficult to manufacture. We have a supply agreement with BioVectra to produce the active pharmaceutical ingredient in Acthar. Our supply agreement with BioVectra continues until written notice of no less than 12 months is given by either us or BioVectra. If either party terminates the agreement, BioVectra is obligated under the agreement to continue to provide manufacturing services for up to four years after termination. In the event of termination, if we were unable to enter into a new supply agreement on substantially similar terms with a new manufacturer, or are unable to obtain FDA approval for a new manufacturer, in such four year period, we may not be able to manufacture or sell Acthar, which would result in a substantial loss of revenues and damage to our business.
We have a supply agreement with Cangene to produce our finished vials of Acthar. Our supply agreement with Cangene is in effect until terminated by either party upon 12 months notice. If Cangene terminates the agreement, Cangene is obligated under the agreement to continue to provide manufacturing services for up to three years after the termination. If either party cancels the supply agreement, and we are unable to enter into a new supply agreement on substantially similar terms with a new manufacturer, or are unable to obtain FDA approval for a new manufacturer, we may not be able to manufacture or sell Acthar, which would result in a substantial loss of revenues and damage to our business.
Both BioVectra and Cangene are our contract manufacturers that produce Acthar. The manufacturing process for Acthar is complex and these contract manufacturers may not be able to meet our needs with respect to timing, cost, quantity or quality. All of our contract manufacturers are sole-source manufacturers and no currently qualified alternative suppliers exist. If either of these agreements terminate, and we are unable to contract for a sufficient supply of Acthar on acceptable terms, or if we encounter delays or difficulties in our relationships with our manufacturers, we will lose the ability to fulfill orders and thus will lose sales. Moreover, our contract manufacturers must continually adhere to current good manufacturing practices enforced by the FDA. If the facilities of these manufacturers cannot pass an inspection, supply would be disrupted. Failure to obtain products for sale for any reason may result in an inability to meet Acthar demand and a loss of potential revenues.
We have no patent protection for Acthar, and potential competitive products to Acthar may reduce or eliminate our commercial opportunity.
Acthar was first approved by the FDA in 1952, and the patent for Acthar has expired. While the FDA has provided Acthar with orphan designation for the treatment of IS, the FDA could approve another ACTH formulation for the treatment of IS if it is demonstrated to be clinically superior to Acthar or if we are unable to supply sufficient amounts of Acthar. We have no intellectual property or regulatory-based market exclusivity with respect to MS exacerbations or any other indication or condition we might target.
The pharmaceutical and biotechnology industries are intensely competitive and subject to rapid and significant technological change, and a number of companies are pursuing the development of pharmaceuticals and products that target the same diseases and conditions that we target. Some of the companies developing competing technologies and products have significantly greater financial resources and expertise in development, manufacturing, obtaining regulatory approvals, and marketing than we do. Other smaller companies may also prove to be significant competitors, particularly through collaborative arrangements with large and established companies. In the event we are successful in expanding the therapeutic uses for Acthar, other companies may dedicate greater resources to develop and introduce generic versions of Acthar and other competitive therapies for the same diseases and conditions that we target. We cannot predict with accuracy the timing or impact of the introduction of potentially competitive products or their possible effect on our sales. If a competitor applied to the FDA for a generic or bio similar version of Acthar or any competitive product not based on ACTH, we would not receive any notice from the FDA about the existence of the application. Further, the announcement of a filing with the FDA relating to a potentially competitive product could have an adverse effect on our business and share price, regardless of the ultimate outcome of such filing.
If we are successful in growing our sales in the MS and nephrotic syndrome markets or in developing other markets for Acthar, our increasing the overall sales volume of Acthar may lead other companies to dedicate greater resources to develop and introduce generic versions of Acthar or other competitive therapies for the diseases and conditions that we target.
Our strategy to generate revenue from sales of Acthar to treat Nephrotic Syndrome might not be successful.
In connection with the FDA’s October 2010 approval of our sNDA to add the treatment of IS to the label of approved indications for Acthar, the overall label for Acthar was modernized and there are now 19 approved indications, including the treatment of acute exacerbations of MS, the treatment of IS and the use of Acthar to induce a diuresis or a remission of proteinuria in the nephrotic syndrome without uremia of the idiopathic type or that due to lupus erythematosus.
9
Table of Contents
There is limited data on the efficacy of Acthar in the treatment of nephrotic syndrome. It is unclear what amount of clinical or other data physicians will require prior to deciding whether or not to use Acthar in the treatment of nephrotic syndrome. Acthar is not approved for all forms of nephrotic syndrome. We currently intend to conduct a Phase IV dose response clinical trial to evaluate the use of Acthar to treat membranous nephropathy, an on-label indication, and a Phase II dose response clinical trial to evaluate the use of Acthar to treat diabetic nephropathy, an indication not on our current label. These trials will require the expenditure of significant financial and management resources and we cannot assure you these trials will result in data that supports the use of Acthar to treat these conditions. Further, even if one or more of these trials produce positive data, it is unclear whether the Phase IV dose response clinical trial will result in doctors prescribing Acthar for the treatment of membranous nephropathy or whether the Phase II dose response clinical trial will provide a basis to pursue the addition of diabetic nephropathy to the label of approved indications for Acthar. Such approval would require one or more additional clinical studies and the preparation and submission of an sNDA with the FDA, and we cannot assure you that any such submission would ultimately be approved by the FDA.
Our attempts to further develop other therapeutic uses for Acthar may be unsuccessful.
Commercializing products is time consuming, expensive and unpredictable. We cannot assure you that we will be able to, either by ourselves or in collaboration with others, successfully develop or commercialize new therapeutic uses for Acthar, even those uses which are on our current label, complete clinical trials, obtain regulatory approvals, or gain market acceptance for such uses.
Should we decide to collaborate with third parties in the development or commercialization of new therapeutic uses for Acthar, such collaboration may require us to commit substantial effort and expense in seeking out, evaluating and negotiating collaboration agreements, which expense maybe incurred without achieving our desired results and which effort involves inherent risks, including uncertainties due to matters that may affect the successful development or commercialization of such uses, as well as the possibility of contractual disagreements with regard to terms such as proprietary rights, license scope or termination rights. It may be necessary for us to enter into arrangements with other pharmaceutical companies in order to effectively market any new therapeutic uses for Acthar. We cannot assure you that we will be successful in entering into such arrangements on terms favorable to us or at all.
Once developed, a number of factors may affect negatively the market acceptance of additional therapeutic uses for Acthar, including, among others:
| • | the price of Acthar relative to other therapies for the same or similar treatments; |
| • | the perception by patients, physicians and other members of the health care community of the safety and efficacy of Acthar for their prescribed treatments; |
| • | the availability of third-party reimbursement for Acthar and related treatments; |
| • | our ability to fund our sales and marketing efforts; and |
| • | the effectiveness of our sales and marketing efforts. |
In addition, our ability to market and promote Acthar is restricted to the indications and labeling claims approved by the FDA. If we are unable to obtain approval for additional labeled indications for Acthar, or if we are unable to successfully commercialize existing labeled indications, our sales and marketing efforts and market acceptance and the commercial potential of Acthar may be negatively affected.
We depend primarily on third parties to assist us in our research and development.
We have limited ability to conduct our own clinical trial and research and development projects and we rely upon third-party vendors to plan, conduct and report on clinical trials for uses of Acthar. In the event that any of these vendors has unforeseen issues that negatively impact the quality of its work, our ability to evaluate clinical results may also be negatively impacted. As a result, a clinical trial failure could adversely affect our ability to develop data to support the use of Acthar in the treatment of on-label indications or file for or gain regulatory approvals for new indications on a timely basis. In addition, any one of these vendors could determine that its own research and development requirements or those of other parties, takes precedence over the research and development they provide to us. Though we believe we have made efforts to mitigate this risk by working with multiple, simultaneous third-party developers and increasing our own research and development capabilities, we could experience a development gap if a substantial number of our clinical trial vendors choose to prioritize other projects over our development projects. This prioritization could cause a gap in our research and development timelines until we achieve further advancement of our own capabilities. Any gap could impact our ability to develop and commercialize other therapeutic uses for Acthar.
10
Table of Contents
We will not be able to commercialize additional therapeutic uses for Acthar if pre-clinical trials do not produce successful results or if clinical trials do not demonstrate safety and efficacy in humans.
The regulatory process, which may include extensive pre-clinical trials and clinical trials of Acthar to establish its safety and efficacy in a new therapeutic area, is uncertain, can span many years, and requires the expenditure of substantial time and resources to ensure compliance with complex regulations. Should we fail to comply with applicable regulations, possible regulatory actions could include warning letters, fines, damages, injunctions, civil penalties, recalls, seizures of our products and criminal prosecution. These actions could result in, among other things, substantial modifications to our business practices and operations; refunds, recalls or a total or partial shutdown of production in one or more of our suppliers’ facilities while our suppliers remedy the alleged violation; the inability to obtain future pre-market clearances or approvals; and withdrawals or suspensions of Acthar from the market. Any of these events could disrupt our business and have a material adverse effect on our revenues and financial condition.
In addition, data obtained from pre-clinical and clinical activities are susceptible to varying interpretations that could delay, limit or prevent regulatory approval or clearance. Also, we may encounter delays or rejections based upon changes in regulatory policy during the development period and the period of review of any application for regulatory approval or clearance for Acthar.
Regulatory approval, if granted, may entail limitations on the indicated uses for which Acthar may be marketed that could limit the potential market. Regulatory approvals, once granted, may be withdrawn if problems occur after initial marketing. Furthermore, manufacturers of approved products are subject to pervasive review, including compliance with detailed regulations governing FDA good manufacturing practices. The FDA periodically revises the good manufacturing practices regulations and requires manufacturers to remain current with the latest regulations.
Our success will depend on the success of the pre-clinical and clinical trials conducted by us and our clinical trial vendors. It can take several years to complete the pre-clinical and clinical trials of a new therapeutic use, and a failure of one or more of these pre-clinical or clinical trials can occur at any stage of testing. We believe that the development of new therapeutic uses for Acthar involves significant risks at each stage of testing. If pre-clinical or clinical trial difficulties and failures arise, new therapeutic uses for Acthar may never be approved for sale or become commercially viable.
In addition, the possibility exists that:
| • | the results from early pre-clinical or clinical trials may not be statistically significant or predictive of results that will be obtained from expanded, advanced clinical trials; |
| • | a proposed new use for Acthar may not exhibit the expected therapeutic results in humans, may cause harmful side effects or have other unexpected characteristics that may delay or preclude regulatory approval or limit commercial use even if approved; |
| • | institutional review boards or regulators, including the FDA, may hold, suspend or terminate our pre-clinical or clinical research or the pre-clinical or clinical trials of Acthar for various reasons, including noncompliance with regulatory requirements or if, in their opinion, the participating subjects are being exposed to unacceptable health risks; |
| • | our pre-clinical or clinical trials may produce negative, inconsistent or inconclusive results, and we may decide, or regulators may require us, to conduct additional pre-clinical or clinical trials; |
| • | the cost of our pre-clinical or clinical trials may be greater than we currently anticipate; and |
| • | the difficulties and risks associated with pre-clinical and clinical trials may result in the failure to receive regulatory approval to continue to test or to sell Acthar in new therapeutic uses or the inability to commercialize Acthar for any of these therapeutic uses. |
Risks Associated with Government Regulation and Health Care Reform
Changes in the health care regulatory environment may adversely affect our business.
The Healthcare Reform Acts substantially change the way health care is financed by both governmental and private insurers, and could have a material adverse effect on our future business, cash flows, financial condition and results of operations, including by operation of the following provisions:
11
Table of Contents
| • | Effective March 23, 2010, Medicaid managed care programs became eligible for drug rebates. This expanded eligibility affected our rebate liability for those state entities which had Medicaid managed care programs, but had not previously taken legislative action at the state level to permit drugs provided to Medicaid managed care patients to be eligible for Medicaid rebates (approximately 28 states). |
| • | Effective January 1, 2011, pharmaceutical companies, including Questcor, must provide rebates to cover a portion of the Medicare Part D coverage gap or “donut hole,” which is a portion of the gap between Medicare funding and Medicare recipients’ drug deductibles. Approximately 25% of our sales for MS are to Medicare insureds. We estimate our obligation could be as much as $1,800 per Medicare insured in 2011. At our current sales levels, we estimate that this obligation would be less than $0.5 million per year. |
| • | Effective January 1, 2011, the U.S. Federal government will allocate an annual fee among manufacturers of branded prescription drugs based on their market share for specified government programs. The Healthcare Reform Acts determine an individual manufacturer’s market share as the ratio of its aggregate sales of branded prescription drugs during the preceding calendar year as a percentage of the aggregate branded prescription drug sales for all covered manufacturers. |
| • | We expect the number of Medicaid patients to increase gradually through 2014. We further expect this expansion more likely to impact the number of adults in Medicaid because many states have already set their eligibility criteria for children at or above the level designated in the Healthcare Reform Acts. An increase in the proportion of patients who receive Acthar and who are covered by Medicaid could adversely affect our net sales. |
In addition, substantial new provisions affecting compliance also have been added, which may require us to modify our business practices with health care practitioners. Our failure to comply with these new provisions may subject us to significant penalties or enforcement actions, either of which may negatively impact the results of our operations or business.
Presently, uncertainty exists as many of the specific determinations necessary to implement the Healthcare Reform Acts have yet to be decided and communicated to industry participants. For example, while we have established a reserve for Medicaid MCO, the affected states have only begun to bill us for Medicaid MCO rebates, as many of the states are still implementing their internal systems in order to submit Medicaid rebates claims to us. Additionally, we do not yet know when we will be required to provide discounts to the additional hospitals eligible to participate under the 340(B) program. We have made several estimates with regard to important assumptions relevant to determining the financial impact of the Healthcare Reform Acts on our business due to the lack of availability of both certain information and complete understanding of how the process of applying the Healthcare Reform Acts will be implemented.
In addition, Congress and the President may make additional refinements to the Healthcare Reform Acts which may have an additional, potential negative impact on our overall financial position, results of operations and cash flows. At this time, we cannot predict the full impact of the Healthcare Reform Acts, or the timing and impact of any future rules or regulations promulgated to implement the Healthcare Reform Acts.
We may be negatively affected by lower reimbursement levels.
Our ability to generate net sales is affected by the availability of third-party reimbursement for Acthar, and our ability to generate net sales will be diminished if we fail to maintain an adequate level of reimbursement for Acthar from such third-party payors.
Acthar is a high priced drug and the sale of Acthar depends in part on the availability of reimbursement from third-party payors such as private insurance plans. In the United States, there have been, and we expect there will continue to be, a number of state and federal proposals that limit the amount that private insurance plans may pay to reimburse the cost of drugs, including Acthar. We believe the increasing emphasis on managed care in the United States has and will continue to put pressure on the price and usage of Acthar. In addition, current third-party reimbursement policies for Acthar may change at any time. Negative changes in reimbursement or our failure to obtain reimbursement for Acthar may reduce the demand for, or the price of, Acthar, which could result in lower Acthar net sales, thereby weakening our competitive position and negatively impacting our results of operations.
Medicaid eligible patients and government entities may account for a greater proportion of our Acthar unit sales resulting in reduced net sales.
Our net sales may be adversely affected by laws and regulations reducing reimbursement rates. Administrative or judicial interpretations of such laws and regulations could also force us to reduce our reimbursement rates or increase the amount of
12
Table of Contents
chargebacks paid to certain government entities. The sources and amounts of our revenues are determined by a number of factors, including the rates of reimbursement among payors. Changes in the payor mix among private pay, Medicaid, and government programs usage may significantly affect our profitability.
A portion of the estimated end-user vial demand for Acthar is for patients covered under Medicaid and other government-related programs. As required by Federal regulations, we provide rebates related to Acthar dispensed to a significant percentage of Medicaid patients. In addition, certain other government-supported agencies are permitted to purchase Acthar for a nominal amount from our specialty distributor, which then charges the discount back to us. As a result of these rebates and chargebacks, we do not generate any net sales with respect to sales that are subject to rebates or chargebacks. As a result of the enactment of the Healthcare Reform Acts, it is possible that a greater proportion of Acthar sales will be subject to these rebates and chargebacks, reducing our net sales. Additionally, there could be changes to Medicaid regulations resulting in higher rebates and chargebacks, which would reduce our net sales further.
The interpretation of laws and regulations may negatively affect the amount we are able to charge government agencies for Acthar, or may negatively affect our financial results. For example, on March 17, 2009, the Department of Defense issued final regulations under the Fiscal Year 2008 National Defense Authorization Act which interpreted such Act to expand a government health care program, Tricare, to include prescription drugs dispensed by Tricare retail network pharmacies, retroactively effective as of January 28, 2008. As a result, we established a sales reserve of $3.5 million for Tricare rebates as of the year ended December 31, 2009 which covered 100% of our estimated liability for the time period January 28, 2008 through December 31, 2009. Effective January 1, 2010, we entered into a new pricing agreement with the Veterans Administration, resulting in a rebate for pharmaceutical products utilized through the Tricare Retail Pharmacy program during 2010 of $5,670 per vial, or a reduction of $14,865 from the previous rebates of $20,535. As a result, we recorded additional sales reserves of $1.2 million for the year ended December 31, 2010, for which we received invoices for $0.6 million.
We may be negatively affected by unforeseen invoicing of historical Medicaid sales.
We provide a rebate related to Acthar dispensed to Medicaid eligible patients in instances where regulations provide for such a rebate. The rebate per unit formula results in a rebate amount equal to 100% of our price to CuraScript SD. We multiply the rebate amount per unit by the estimated rebate units to arrive at the reserve for the period. This reserve is deducted from gross sales in the determination of net sales. The Medicaid rebates associated with end user demand for a period are mostly paid to the states by the end of the quarter following the quarter in which the rebate reserve is established. As a result, at the end of each quarter we must estimate the amount of Medicaid sales in that quarter and such estimates could prove to be inaccurate. Revisions in the Medicaid rebate estimates are charged to income in the period in which the information that gives rise to the revision becomes known. However, certain states may provide their requested rebates to us on a delayed basis, which would negatively affect future financial performance in periods occurring after the period in which the original reserved Medicaid rebate accrual occurred. For example, in the third quarter of 2009, we received higher than anticipated amounts of Medicaid rebates related to prior period Acthar usage. In connection with our receipt of invoices related to these rebates, we increased our rebate reserve which reduced net sales in the third quarter of 2009 by approximately $4.6 million. In connection with the enactment of the Healthcare Reform Acts and the adoption of Medicaid Managed Care Organizations, or Medicaid MCO, we increased our reserves for Medicaid rebates. In the absence of historical data for Medicaid MCO, we based this portion of our Medicaid reserve on national statistics. The various states have only begun to bill us for Medicaid MCO rebates and we cannot assure you that our reserves for Medicaid MCO related rebates are adequate.
We are currently subject to numerous governmental regulations and it can be costly to comply with these regulations and to develop compliant products and processes.
No assurance can be given that we will remain in compliance with currently applicable FDA and other regulatory requirements for Acthar. These requirements include, among other things, regulations regarding manufacturing practices, product labeling and post-marketing reporting, including adverse event reports and field alerts due to product quality concerns. Additionally, the facilities and procedures of our suppliers are subject to ongoing regulation, including periodic inspection by the FDA and other regulatory authorities. Any new use of Acthar that we develop must receive all relevant regulatory approvals or clearances before it may be marketed in a particular country.
From time to time, Acthar is prescribed for various conditions that are not on the label of approved indications. While physicians may lawfully prescribe Acthar for off-label uses, any promotion by us of any off-label uses would be unlawful. Some of our practices that are intended to respond to questions from physicians with respect to off-label uses of Acthar without engaging in off-label promotion could nonetheless be construed by the FDA as off-label promotion. Although we have policies and procedures in place designed to help assure ongoing compliance with regulatory requirements regarding off-label promotion, some non-compliant actions may nonetheless occur or be deemed by regulatory authorities to have occurred. The Department of Justice has in recent years
13
Table of Contents
initiated a number of investigations and enforcement action against pharmaceutical manufacturers alleged to have engaged in off-label promotion, and it, or other regulatory authorities, could take action against us if they believe we are promoting or have promoted Acthar for off-label use.
In addition, we cannot predict the extent of governmental regulations or the impact of new governmental regulations that may result in a delay in the development, production and marketing of Acthar. As such, we may be required to incur significant costs to comply with current or future laws or regulations.
Other Risks Associated with our Business
Our business and operations have experienced rapid growth. If we fail to effectively manage our growth, our business and operating results could be harmed.
We have experienced rapid growth in our headcount and operations, which has placed, and will continue to place, significant demands on our management and, operational and financial infrastructure. To effectively manage this growth, we will need to continue to improve our operational, financial and management controls and our reporting systems and procedures. These systems enhancements and improvements will require significant capital expenditures and management resources. Failure to implement these improvements could hurt our ability to manage our growth and our financial position.
The loss of our key management personnel or failure to integrate new management personnel could have an adverse impact on future operations.
We are highly dependent on the services of the principal members of our senior management team, and the loss of a member of senior management could create significant disruption in our ability to provide Acthar to our customers. We do not carry key person life insurance for our senior management or other personnel. Additionally, the future potential growth and expansion of our business is expected to place increased demands on our management skills and resources. Recruiting and retaining management and operational personnel to perform sales and marketing, financial operations, clinical development, regulatory affairs, quality assurance, medical affairs and contract manufacturing in the future will also be critical to our success. We do not know if we will be able to attract and retain skilled and experienced management and operational personnel in the future on acceptable terms given the intense competition among numerous pharmaceutical and biotechnology companies for such personnel. If we are unable to hire necessary skilled personnel in the future, our business could be harmed.
Our financial results can be negatively impacted by economic downturns.
Downturns in the general economic environment present us with several potential challenges. In challenging economies and periods of increased unemployment, a greater percentage of our unit volume may be subject to reimbursement under Medicaid and other government programs. This shifting in payor mix can negatively impact our financial results because of the resulting decrease in our net sales. In addition, third-party payors such as private insurance companies may be less willing to satisfy their reimbursement obligations in a timely matter, or at all.
As a result of downturns in the economy, there may be a disruption or delay in the performance of our third-party contractors, suppliers or collaborators, including CuraScript SD. If CuraScript SD is unable to satisfy its commitments to us, our business would be adversely affected because of our reliance upon CuraScript SD for our sales and distribution. There may be a disruption or delay in the performance of our third-party manufacturers for Acthar. If such third-party manufacturers are unable to satisfy their commitments to us, our business would be adversely affected because of the resulting supply disruption.
Downturns in the capital markets may have a negative impact on the market values of the investments in our investment portfolio. We cannot predict future market conditions or market liquidity and we cannot assure you that the markets for these securities will not deteriorate or that the institutions that hold these investments will be able to meet their debt obligations at the time we may need to liquidate such investments or until such time as the investments mature.
If we are unable to protect our proprietary rights, we may lose our competitive position and future revenues.
We do not have a patent on Acthar. However, our success will depend in part on our ability to do the following:
| • | protect our trade secrets, |
14
Table of Contents
| • | operate without infringing upon the proprietary rights of others, and |
| • | prevent others from infringing on our proprietary rights. |
We will only be able to protect our proprietary rights from unauthorized use by third parties to the extent that these rights are covered by valid and enforceable patents or are effectively maintained as trade secrets and are otherwise protectable under applicable law.
We rely on trade secrets and proprietary know-how for Acthar. We currently seek protection, in part, through confidentiality and proprietary information agreements. These agreements may not provide meaningful protection or adequate remedies for proprietary technology in the event of unauthorized use or disclosure of confidential and proprietary information. The parties may not comply with or may breach these agreements. Furthermore, our trade secrets may otherwise become known to, or be independently developed by, competitors.
Our success will further depend, in part, on our ability to operate without infringing the proprietary rights of others. If our activities infringe on patents owned by others, we could incur substantial costs in defending ourselves in suits brought against a licensor or us. Should Acthar or its associated technologies be found to infringe on patents issued to third parties, the manufacture, use and sale of Acthar could be enjoined, and we could be required to pay substantial damages. In addition, we, in connection with the development and use of Acthar and its associated technologies, may be required to obtain licenses to patents or other proprietary rights of third parties, which may not be made available on terms acceptable to us.
If we fail to maintain an effective system of internal controls, we may not be able to accurately report our financial results. As a result, current and potential shareholders could lose confidence in our financial reporting, which could have a negative market reaction.
Section 404 of the Sarbanes-Oxley Act of 2002 requires us to report on, and requires our independent registered public accounting firm to attest to, the effectiveness of our internal control over financial reporting. At December 31, 2010, our management determined that we were compliant and we have an ongoing program to perform the system and process evaluation and testing necessary to continue to comply with these requirements. Accordingly, we continue to incur expenses and will devote management resources to Section 404 compliance as necessary. Further, effective internal controls including controls with respect to cash and cash equivalents, and procedures are necessary for us to provide reliable financial reports. If our internal controls and procedures become ineffective, we may not be able to provide reliable financial reports, our business and operating results could be harmed and current and potential shareholders may not have confidence in our financial reporting.
If product liability lawsuits are successfully brought against us or we become subject to other forms of litigation, we may incur substantial liabilities and costs and may be required to limit commercialization of Acthar.
Our business exposes us to potential liability risks that are inherent in the manufacturing, testing and marketing of pharmaceutical products. The use of Acthar, including in connection with clinical trials, may expose us to product liability claims and possible adverse publicity. Under a 2009 United States Supreme Court ruling, FDA approval of a drug does not prevent the filing of product liability claims in state courts, potentially making it more costly and time consuming to defend against such claims. Product liability insurance for the pharmaceutical industry is generally expensive, if available at all. We currently have product liability insurance for claims up to $10 million. However, if we are unable to maintain insurance coverage at acceptable costs, in a sufficient amount, or at all, or if we become subject to a product liability claim, our reputation, stock price and ability to devote the necessary resources to the commercialization of Acthar could be negatively impacted.
Business interruptions could limit our ability to operate our business.
Our operations, including those of our suppliers, are vulnerable to damage or interruption from computer viruses, human error, natural disasters, and telecommunications failures, intentional acts of vandalism and similar events. We have not established a formal disaster recovery plan, and our back-up operations and our business interruption insurance may not be adequate to compensate us for losses that occur. A significant business interruption could result in losses or damages incurred by us and require us to cease or curtail our operations.
15
Table of Contents
Risks Related to our Common Stock
Our stock price has a history of volatility, and an investment in our stock could decline in value.
The price of our common stock is subject to significant volatility. The closing price per share of our common stock ranged in value from $3.49 to $15.46 during the two year period ended December 31, 2010. Any number of events, both internal and external to us, may continue to affect our stock price. For example, our quarterly revenues or earnings or losses can fluctuate based on the buying patterns of our specialty distributor and our end users. In the event that patient demand for Acthar is less than our sales to our specialty distributor, excess Acthar inventories may result at our specialty distributor, which may impact future Acthar sales. Other potential events that could affect our stock price include, without limitation, our quarterly and yearly revenues and earnings or losses; announcement by us or our competitors regarding Acthar development efforts, including the status of regulatory approval applications; the outcome of legal proceedings; the launch of competing products or the public notice of an FDA filing relating to a potential competitive product; our ability to obtain product from our contract manufacturers; and the resolution of (or failure to resolve) disputes with collaboration partners.
We have significant stock option overhang which could dilute your investment.
We have a substantial overhang of common stock due to a low average exercise price of employee stock options. The future exercise of employee stock options could cause substantial dilution, which may negatively affect the market price of our shares.
We have certain anti-takeover provisions in place.
Certain provisions of our Amended and Restated Articles of Incorporation and the California General Corporation Law could discourage a third-party from acquiring, or make it more difficult for a third-party to acquire, control of our company without approval of our board of directors. These provisions could also limit the price that certain investors might be willing to pay in the future for shares of our common stock. Certain provisions allow the board of directors to authorize the issuance of preferred stock with rights superior to those of the common stock. We are also subject to Section 1101(e) of the California General Corporation Law, which, among other things, limits the ability of a majority shareholder holding more than 50% but less than 90% of the outstanding shares of a California corporation from consummating a cash-out merger.
Item 1B. Unresolved Staff Comments
None.
We do not own any real property. We currently lease space in four locations.
| • | We lease 23,000 square feet of office and warehouse space in Union City, California under a lease agreement that expires in March 2011. This facility is occupied by our Commercial Development, Sales and Marketing, Medical Affairs, Contract Manufacturing, Quality Control and Quality Assurance departments. In connection with the expiration of this lease, these functions are being moved to our Hayward, California facility. |
| • | We lease 30,000 square feet of laboratory and office space in Hayward, California under a master lease that expires in November 2012. Effective November 2010, we subleased 9,000 square feet of the facility through November 2012 and effective September 2010, we subleased 4,500 square feet on a month-to-month basis. The remainder of the lease will be occupied by Questcor following the expiration of the Union City lease in March 2011. |
| • | We lease 6,200 square feet of office space in Ellicott City, Maryland under a lease agreement that expires in October 2015. This facility is occupied by our Product Development and Regulatory Affairs departments. |
| • | We lease 4,400 square feet of office space in Anaheim, California under a lease agreement that expires in October 2014. This facility is occupied by our Executive, Finance and Administration departments, and serves as our corporate headquarters. |
We believe that our current leased office space is sufficient to meet our current business requirements and that additional office space will be available on commercially reasonable terms if required.
16
Table of Contents
Questcor operates in a highly regulated industry. We are subject to the regulatory authority of the SEC, the FDA and numerous other federal and state governmental agencies including state Attorney General Offices, which have become more active in investigating the business practices of pharmaceutical companies. From time to time, we receive requests for information from various governmental agencies. In addition, from time to time, we may become involved in litigation relating to claims arising from our ordinary course of business. We are not aware of any claims or actions pending or threatened against us, the ultimate disposition of which we believe would have a material adverse effect on us.
Item 4. (Removed and Reserved)
17
Table of Contents
PART II
Item 5. Market for Registrant’s Common Equity; Related Shareholder Matters and Issuer Purchases of Equity Securities
Price Range of Common Stock
Our common stock is listed on the NASDAQ Global market under the symbol “QCOR.” The following table shows the high and low sale prices for our common stock as reported by The NASDAQ Global Market during the calendar quarters indicated:
| High | Low | |||||||
| Year Ended December 31, 2009 |
||||||||
| First Quarter |
$ | 9.63 | $ | 4.36 | ||||
| Second Quarter |
5.49 | 3.10 | ||||||
| Third Quarter |
6.79 | 4.97 | ||||||
| Fourth Quarter |
5.69 | 3.33 | ||||||
| Year Ended December 31, 2010 |
||||||||
| First Quarter |
8.67 | 4.26 | ||||||
| Second Quarter |
11.62 | 7.84 | ||||||
| Third Quarter |
11.63 | 8.89 | ||||||
| Fourth Quarter |
15.57 | 9.33 | ||||||
| Year Ended December 31, 2011 |
||||||||
| First Quarter (through February 18, 2011) |
$ | 16.67 | $ | 13.51 | ||||
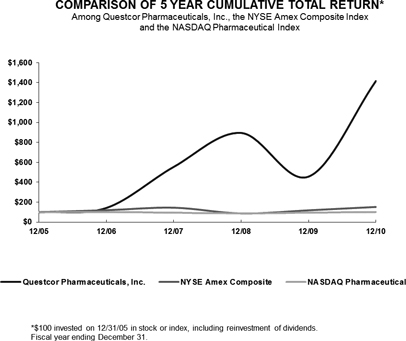
Stock Performance Graph
The following graph compares our total cumulative shareholder return as compared to the NYSE Amex Composite Index and the NASDAQ Pharmaceutical Index for the period beginning on December 31, 2005 and ending on December 31, 2010. Total shareholder return assumes $100.00 invested at the beginning of the period in our common stock, the stocks represented by the NYSE Amex Composite Index and the NASDAQ Pharmaceutical Index, respectively. Total return assumes reinvestment of dividends. We have not paid dividends on our common stock.
This stock performance graph shall not be considered soliciting material and shall not be deemed “filed” for purposes of Section 18 of the Securities Exchange Act of 1934, as amended, or the Exchange Act, or otherwise subject to the liabilities of that section, nor shall it be deemed incorporated by reference in any filing under the Securities Act of 1933, as amended, or the Securities Act, whether made on, before or after the date of this filing and irrespective of any general incorporation language in such filing.
18
Table of Contents
Holders of Common Stock
As of January 31, 2011, there were approximately 159 shareholders of record of our common stock based upon the records of our transfer agent which do not include beneficial owners of common stock whose shares are held in the names of various securities brokers, dealers and registered clearing agencies.
Stock Repurchases
See “Liquidity and Capital Resources — Financing Cash Flows” in Management’s Discussion and Analysis of Financial Condition and Results of Operations in Part II, Item 7 of this Form 10-K for information on our stock repurchases.
Dividend Policy
We have never declared or paid any cash dividends on our common stock. Any future cash dividends will depend on future earnings, capital requirements, our financial condition and other factors deemed relevant by our board of directors.
19
Table of Contents
Equity Compensation Plans
For information regarding our equity compensation plans please see Item 12 of this Annual Report.
Item 6. Selected Financial Data
The following table sets forth certain financial data with respect to our business. The selected consolidated financial data should be read in conjunction with our Consolidated Financial Statements and related Notes and Item 7, “Management’s Discussion and Analysis of Financial Condition and Results of Operations” and other information contained elsewhere in this Annual Report.
| Years Ended December 31, | ||||||||||||||||||||
| 2010 | 2009 | 2008 | 2007(1) | 2006 | ||||||||||||||||
| (In thousands, except per share data) | ||||||||||||||||||||
| Consolidated Statement of Operations Data: | ||||||||||||||||||||
| Net sales |
$ | 115,131 | $ | 88,320 | $ | 95,248 | $ | 49,768 | $ | 12,788 | ||||||||||
| Total operating expenses |
53,278 | 40,083 | 30,364 | 22,918 | 20,631 | |||||||||||||||
| Income (loss) from operations |
53,840 | 41,220 | 57,580 | 21,555 | (10,843 | ) | ||||||||||||||
| Gain on sale of product rights |
— | 225 | 75 | 448 | — | |||||||||||||||
| Income tax expense (benefit)(2) |
19,302 | 15,502 | 18,198 | (14,592 | ) | — | ||||||||||||||
| Net income (loss) |
35,071 | 26,629 | 40,532 | 37,586 | (10,109 | ) | ||||||||||||||
| Net income (loss) applicable to common shareholders |
35,071 | 26,629 | 35,265 | 36,449 | (10,109 | ) | ||||||||||||||
| Net income (loss) per share applicable to common shareholders: |
||||||||||||||||||||
| Basic |
$ | 0.56 | $ | 0.41 | $ | 0.52 | $ | 0.53 | $ | (0.18 | ) | |||||||||
| Diluted |
$ | 0.54 | $ | 0.40 | $ | 0.49 | $ | 0.51 | $ | (0.18 | ) | |||||||||
| Shares used in computing net income (loss) per share applicable to common shareholders: |
||||||||||||||||||||
| Basic |
62,112 | 64,196 | 67,761 | 69,131 | 56,732 | |||||||||||||||
| Diluted |
64,741 | 66,257 | 71,350 | 70,915 | 56,732 | |||||||||||||||
| December 31, | ||||||||||||||||||||
| 2010 | 2009 | 2008 | 2007(1) | 2006 | ||||||||||||||||
| (In thousands) | ||||||||||||||||||||
| Consolidated Balance Sheet Data: | ||||||||||||||||||||
| Cash, cash equivalents and short-term investments |
$ | 114,832 | $ | 75,707 | $ | 55,451 | $ | 30,212 | $ | 18,425 | ||||||||||
| Working capital |
111,988 | 71,049 | 59,272 | 57,153 | 17,506 | |||||||||||||||
| Total assets |
151,993 | 111,440 | 89,146 | 78,448 | 29,635 | |||||||||||||||
| Preferred stock, Series A(3) |
— | — | — | 5,081 | 5,081 | |||||||||||||||
| Common stock |
74,809 | 67,793 | 84,028 | 108,387 | 105,352 | |||||||||||||||
| Retained earnings (accumulated deficit) |
45,295 | 10,224 | (16,405 | ) | (51,670 | ) | (89,256 | ) | ||||||||||||
| Total shareholders’ equity |
120,127 | 78,003 | 67,892 | 56,771 | 16,097 | |||||||||||||||
| (1) | In August 2007, we implemented a change in strategy which resulted in significantly improved financial results relative to 2006. |
| (2) | The income tax benefit for the year ended December 31, 2007 resulted from our ability to utilize net operating loss carryforwards to offset the majority of our 2007 taxable income and the reversal of the portion of the valuation allowance established against deferred tax assets available to reduce the tax obligations on our 2008 taxable income. In 2008, we reversed the remaining $5.2 million valuation allowance on deferred tax assets that we believed would be recovered based on anticipated taxable income in 2009 and future years, and the corresponding tax benefit reduced our income tax expense. |
| (3) | The Series A Preferred Stock was repurchased in February 2008 for $10.3 million. Please refer to Note 5 — Preferred Stock and Shareholders’ Equity in the accompanying Notes to Consolidated Financial Statements for further discussion. |
20
Table of Contents
Item 7. Management’s Discussion and Analysis of Financial Condition and Results of Operations
This Annual Report on Form 10-K contains forward-looking statements that have been made pursuant to the provisions of the Private Securities Litigation Reform Act of 1995 and concern matters that involve risks and uncertainties that could cause actual results to differ materially from those projected in the forward-looking statements. Discussions containing forward-looking statements may be found in the material set forth under “Business,” “Management’s Discussion and Analysis of Financial Condition and Results of Operations” and in other sections of this form 10-K. Words such as “may,” “will,” “should,” “could,” expect,” “plan,” “anticipate,” “believe,” “estimate,” “predict,” “potential,” “continue” or similar words are intended to identify forward-looking statements, although not all forward-looking statements contain these words. Although we believe that our opinions and expectations reflected in the forward-looking statements are reasonable as of the date of this Annual Report on Form 10-K, we cannot guarantee future results, levels of activity, performance or achievements, and our actual results may differ substantially from the views and expectations set forth in this Annual Report on Form 10-K. We expressly disclaim any intent or obligation to update any forward-looking statements after the date hereof to conform such statements to actual results or to changes in our opinions or expectations. Readers are urged to carefully review and consider the various disclosures made by us, which attempt to advise interested parties of the risks, uncertainties, and other factors that affect our business, set forth in detail in Item 1A of Part I, under the heading “Risk Factors.”
The following discussion and analysis should be read in conjunction with our consolidated financial statements and the related notes to those statements contained elsewhere in this Annual Report on Form 10-K.
Overview
We are a biopharmaceutical company whose primary product helps patients with serious, difficult-to-treat medical conditions. Our primary product is H.P. Acthar® Gel (repository corticotropin injection), or Acthar, an injectable drug that is approved by the FDA. Acthar is only available in a multi-use vial. We derive substantially all of our net sales from the sale of Acthar in the U.S. and do not have operations outside of the U.S. However, we own the worldwide rights to Acthar. Acthar is approved for the treatment of 19 indications, though we currently generate most of our net sales from two indications: the treatment of acute exacerbations of multiple sclerosis, or MS, in adults, and the treatment of infantile spasms, or IS, in infants and children under two years of age. We are also exploring the other therapeutic areas where Acthar is approved, including the use of Acthar to induce a diuresis or a remission of proteinuria in the nephrotic syndrome without uremia of the idiopathic type or due to lupus erythematosus. As a current on-label indication for Acthar, we have commenced a small pilot sales effort to attempt to generate incremental net sales and better understand the commercial opportunity for Acthar in this indication. We are also exploring the possibility of pursuing FDA approval of additional indications not currently on the Acthar label where there is high unmet medical need.
Our other product is Doral® (quazepam), which is indicated for the treatment of insomnia characterized by difficulty in falling asleep, frequent nocturnal awakenings, and/or early morning awakenings. We own the U.S. rights to and have modest sales of Doral.
Results of Operations
Years Ended December 31, 2010, 2009 and 2008
Net Sales. Net sales, which we derive from our sales of Acthar and Doral, were $115.1 million in 2010, compared to $88.3 million in 2009 and $95.2 million in 2008. The following table sets forth our net sales for the years ended December 31, 2010, 2009 and 2008, respectively (dollars in thousands):
| Years Ended December 31, | ||||||||||||
| 2010 | 2009 | 2008 | ||||||||||
| Revenue |
$ | 154,806 | $ | 138,220 | $ | 133,252 | ||||||
| Less sales reserves: |
||||||||||||
| Provision for Medicaid rebates |
37,159 | 40,814 | 34,240 | |||||||||
| Provision for chargebacks |
106 | 5,029 | 3,395 | |||||||||
| Provision for Tricare rebates |
1,202 | 3,530 | — | |||||||||
| Co-payment assistance and other |
1,208 | 527 | 369 | |||||||||
| Total sales reserves |
39,675 | 49,900 | 38,004 | |||||||||
| Net sales |
$ | 115,131 | $ | 88,320 | $ | 95,248 | ||||||
21
Table of Contents
2010 compared to 2009: Net sales of Acthar increased by approximately 31% to $114.7 million for the year ended December 31, 2010 from $87.6 million in 2009. The increase in net sales for the year ended December 31, 2010 was due to an increase in vials of Acthar shipped, to 6,696 in 2010 from 5,973 in 2009, a reduction in the per vial rebate liability for both Medicaid and Tricare, and a reduction in the number of Medicaid fee for service prescriptions. This increase was partially offset by an increase in our Medicaid Managed Care rebate, which became effective on March 23, 2010.
During 2009, we expanded our MS sales force to support our increased sales efforts related to the use of Acthar for the treatment of exacerbations associated with MS. Our increased sales efforts and our initiatives to educate MS specialists about the treatment benefits of Acthar have resulted in a significant increase in sales of Acthar to treat select MS exacerbation patients for the year ended December 31, 2010 as compared to the same period in 2009. During the year ended December 31, 2010, new paid Acthar prescriptions processed by our reimbursement support center for the treatment of MS exacerbations increased by approximately 118% as compared to 2009. In order to build upon these positive prescription trends, we further expanded our sales organization during the second half of 2010, resulting in a sales organization of 77 sales representatives as of the end of 2010.
We cannot assure you that this prescription growth trend will continue or that our sales force expansion will be successful. The process of significantly expanding a sales force in the biopharmaceutical industry is complex. We modify and re-allocate individual sales territories across our enlarged sales force, which can cause temporary disruptions in our selling efforts. Additionally, while the cost of our new sales representatives impacts our operating expenses immediately, there can be a delay in the expected ability of our new representatives to increase our net sales due to the time it takes for us to train the new representatives and for the new representatives to establish relationships with prescribing physicians within their territories. As such, even if our sales force expansion is successful in the long-term, there can be a near-term negative impact on our financial results from this expansion.
In addition, in January 2011, we completed the hiring of five sales representatives who will market Acthar exclusively to nephrologists for use in treating nephrotic syndrome.
Effective January 1, 2011, we increased the price we charge CuraScript SD for Acthar by 5%.
2009 compared to 2008: Net sales of Acthar decreased by approximately 7% to $87.6 million in 2009 from $95.2 million in 2008. The decrease in net sales for the year ended December 31, 2009 was due to a combination of a lower number of prescriptions of Acthar for the treatment of IS, higher amounts of Medicaid rebates related to previous paid Acthar usage and an adjustment of our Tricare rebate reserve during 2009. There has been significant variability in prescription activity in the use of Acthar in the treatment of IS and, while we can now market Acthar for the treatment of IS following the FDA’s approval of our sNDA on October 15, 2010, we expect to continue to experience significant fluctuations in demand in this market. We believe these fluctuations are principally due to the low incidence of IS, as a relatively small number of cases can create meaningful fluctuations in net sales.
Acthar orders may be affected by several factors, including inventory levels at specialty and hospital pharmacies, greater use of patient assistance programs, the overall pattern of usage by the health care community, including Medicaid and government-supported entities, the use of alternative therapies for the treatment of IS, and the reimbursement policies of insurance companies. Our specialty distributor ships Acthar to specialty pharmacies and hospitals to meet end user demand. We track our own Acthar shipments daily, but those shipments vary compared to end user demand because of changes in inventory levels at specialty pharmacies and hospitals.
Cost of Sales and Gross Profit
| Years Ended December 31, | ||||||||||||
| 2010 | 2009 | 2008 | ||||||||||
| Cost of sales |
$ | 8,013 | $ | 7,017 | $ | 7,304 | ||||||
| Gross profit |
107,118 | 81,303 | 87,944 | |||||||||
| Gross margin |
93 | % | 92 | % | 92 | % | ||||||
Cost of sales was $8.0 million for the year ended December 31, 2010, as compared to $7.0 million for 2009 and $7.3 million for 2008. We include in cost of sales material costs, packaging, warehousing and distribution, product liability insurance, royalties, quality control (which primarily includes product stability testing), quality assurance and reserves for excess or obsolete inventory.
22
Table of Contents
Our gross margin was 93% or $107.1 million in 2010, as compared to 92%, or $81.3 million in 2009 and 92%, or $87.9 million in 2008. The increase in gross margin in 2010 as compared to 2009 and 2008 is primarily the result of continued growth in paid prescriptions for patients with MS. The increase in cost of sales was primarily due to an increase in product stability testing and royalties on Acthar net sales, offset by a reduction in distribution costs. The manufacturing process for Acthar is complex and problems may arise during manufacturing for a variety of reasons, including equipment malfunction, failure to follow specific protocols and procedures, problems with raw materials, natural disasters, and environmental factors. During 2009, our cost of sales increased because of the impact of some of these problems.
Selling, General and Administrative. Selling, general and administrative expenses were $41.8 million for the year ended December 31, 2010, as compared to $30.0 million in 2009 and $19.2 million in 2008. The increase of $11.8 million in 2010 as compared to 2009 is due primarily to increases in headcount-related costs and costs associated with our expanded sales and marketing effort. During the latter part of 2010, to further build on positive prescription trends, we doubled the size of our sales organization, increasing the sales force to 77 Acthar specialists.
The increase of $10.8 million in 2009 as compared to 2008 reflects the initial expansion of our sales force to 38 representatives and additional managers in order to build upon continued positive growth trends in prescriptions of Acthar for the treatment of exacerbations associated with MS.
We cannot guarantee you that this prescription growth trend will continue or that our sales force expansion will be successful, and, even if it is successful in the long-term, our sales force expansion may impact negatively our short-term financial results.
Research and Development. Research and development expenses were $10.9 million in 2010, as compared to $9.7 million in 2009 and $10.6 million in 2008. The increase in research and development expenses in 2010, as compared to 2009, was primarily the result of both an increase in headcount-related expenses and costs associated with the resubmission of our Acthar sNDA for IS. Costs included in research and development also include costs associated with the funding of medical research projects to better understand the therapeutic benefit of Acthar in current and new therapeutic applications, product development efforts and compliance activities. The slight decrease in research and development expenses from 2008 to 2009 was due primarily to decreases in the costs related to our resubmission of our sNDA, partially offset by increases in headcount-related costs and funding of medical research projects.
We plan to continue our research and development efforts to explore the use of Acthar as a therapeutic alternative for the treatment of nephrotic syndrome. In 2010, we supported investigator-initiated studies in patients with idiopathic membranous nephropathy (on-label) and diabetic nephropathy (not on-label). Based on the results of these investigations, we currently intend to conduct a Phase IV dose response clinical trial for idiopathic membranous nephropathy and a Phase II dose response clinical trial for diabetic nephropathy in 2011. These dose response clinical trials will result in a significant increase in research and development expenses in 2011 through 2013. We may also pursue clinical trials to evaluate the use of Acthar to treat other therapeutic uses, including conditions that are not currently on the label of approved indications for Acthar.
Stock-based compensation costs. Total stock-based compensation costs for the years ended December 31, 2010, 2009 and 2008 were $3.7 million, $3.1 million and $4.1 million, respectively. For the year ended December 31, 2010, we granted options to employees and non-employee directors to purchase 1.8 million shares of our common stock at a weighted average exercise price of $7.15 per share, which was equal to the fair market value of our common stock on the date of the grant. In addition to stock options, we also issued restricted stock awards to certain employees. The total stock-based compensation costs for the years ended December 31, 2010, 2009 and 2008 included $50,000, $11,000 and $37,000, respectively, related to these restricted stock awards. The following table sets forth our stock-based compensation costs for the years ended December 31, 2010, 2009 and 2008, respectively (dollars in thousands):
| Years Ended December 31, | ||||||||||||
| 2010 | 2009 | 2008 | ||||||||||
| Selling, general and administrative |
$ | 2,784 | $ | 2,418 | $ | 3,351 | ||||||
| Research and development |
955 | 623 | 590 | |||||||||
| Total stock-based compensation expense |
$ | 3,739 | $ | 3,041 | $ | 3,941 | ||||||
Total Other Income. Total other income for the year ended December 31, 2010 was $0.5 million, as compared to $0.9 million for 2009 and $1.2 million for 2008. The decrease in total other income of $0.4 million in 2010 as compared to 2009 was the result of a lower yield on our cash, cash equivalent and short-term investment balances year over year. The decrease in total other income of $0.3 million in 2009 as compared to 2008 was due to a lower yield on our cash, cash equivalent and short-term investment balances, offset by a $0.2 million gain on the sale of product rights.
23
Table of Contents
Income tax expense. Income tax expense for the year ended December 31, 2010 was $19.3 million, as compared to $15.5 million in 2009 and $18.2 million in 2008. The increase in income tax expense of $3.8 million in 2010 as compared to 2009 was due to both an increase in net sales (resulting in a higher basis for income taxes) and the increase in the valuation allowance associated with our California deferred tax asset. In the fourth quarter of 2010, California enacted legislation that deferred the ability of corporations to utilize their California net operating losses. Starting in 2011, we intend to use the single sales factor methodology for California, which we expect to result in tax savings beginning in 2011. Because most of our sales are sourced outside of California, we do not expect to continue to pay significant income taxes in California. As a result, we anticipate that we will not be able to fully utilize our California deferred tax asset and, therefore, have established a valuation allowance for the deferred tax asset.
The decrease of $2.7 million in income tax expense in 2009 as compared to 2008 was due to lower pre-tax income in 2009 as compared to 2008, offset by a higher effective tax rate (36.8%) in 2009.
Deemed dividend on Series A Preferred Stock. The deemed dividend on our Series A Preferred Stock in 2008 of $5.3 million resulted from the repurchase of our Series A preferred stock in February 2008. We repurchased all of our outstanding Series A Preferred Stock for cash consideration of $10.3 million, or $4.80 per share. As of December 31, 2007, the Series A Preferred Stock had a carrying amount of $5.1 million; the deemed dividend represented the difference between the cash consideration actually paid by us and the carrying amount.
Liquidity and Capital Resources
At December 31, 2010, we had approximately $114.8 million in cash, cash equivalents and short-term investments and working capital of $112.0 million.
For 2010, we generated $37.0 million of cash from operations, primarily the result of net income of $35.1 million, plus the total change in operating assets and liabilities of ($2.5) million (which primarily included an increase in our sales-related reserves of $6.6 million, offset by a decrease in accounts payable of $9.1 million), $3.7 million in stock-based compensation expense, $0.7 million in amortization of investments and $0.5 million in depreciation and amortization expense, offset by a reduction in our deferred tax asset of $1.0 million.
For 2009, we generated $40.0 million of cash from operations, primarily the result of net income of $26.6 million, plus the total change in operating assets and liabilities of $10.1 million (which included an increase in our sales-related reserves of $3.1 million, an increase in accounts payable of $8.6 million, a decrease in prepaid income taxes of $3.3 million, offset by an increase in accounts receivable of $4.4 million), $3.1 million in stock-based compensation expense, $0.7 million in depreciation and amortization expense offset by ($0.3) million in deferred income taxes, and ($0.2) million for the gain on sale of product rights.
For 2008, we generated $63.5 million of cash from operations, primarily the result of net income of $40.5 million, plus the total change in operating assets and liabilities of $14.1 million (which included an increase in our sales-related reserves of $3.6 million, an increase in accounts payable of $2.5 million, a decrease in accounts receivable of $13.2 million, offset by an increase in prepaid income taxes of $3.3 million and a decrease in income taxes payable of $1.3 million), and $4.1 million in stock-based compensation expense, $4.6 million in deferred income taxes.
Net cash used in investing activities totaled $44.2 million in 2010, primarily due to the purchase of short-term investments ($106.6 million), offset by the maturities of short-term investments ($62.6 million). Net cash provided by investing activities totaled $11.9 million for 2009, primarily due to the maturities of our short-term investments ($73.4 million), offset by the purchase of short-term investments ($61.6 million). Net cash used in investing activities totaled $27.2 million in 2008, primarily due to the purchase of short-term investments ($69.6 million), offset by the maturities of short-term investments ($42.4 million).
Net cash provided by financing activities totaled $2.9 million for 2010, primarily due to the issuance of common stock associated with our Employee Stock Purchase Plan and the exercise of stock options. Net cash used in financing activities for 2009 totaled $19.3 million as a result of the repurchase of 4.9 million shares of our common stock for $21.1 million under our board-approved stock repurchase program; offset by $1.0 million in cash received from the exercise of stock options and the issuance of common stock associated with our Employee Stock Purchase Program, or ESPP, and $0.7 million in excess tax benefits from stock-based compensation plans. Net cash used in financing activities for 2008 totaled $38.9 million as a result of the repurchase of 7.5 million shares of our common stock for $35.6 million under our board-approved stock repurchase program, the repurchase of the outstanding Series A Preferred Stock for $10.3 million; offset by $2.2 million in cash received from the exercise of stock options and the issuance of common stock associated with our ESPP and $4.8 million in excess tax benefits from stock-based compensation plans.
In February 2008, our board of directors approved a stock repurchase plan that provides for our repurchase of up to 7 million of our shares of common stock in either open market or private transactions. In May 2009, our board of directors increased our common
24
Table of Contents
share repurchase program authorization by an additional 6.5 million shares. As of December 31, 2010, there are 5.1 million shares authorized remaining under the stock repurchase plan. We did not repurchase any shares of our common stock under our share repurchase program during 2010. We do not currently intend to conduct business development activities which would utilize a material portion of our liquidity. We review our level of liquidity and anticipated cash needs for the business on an ongoing basis, and consider whether to return additional capital to our shareholders as well as alternative methods to return capital.
Contractual Obligations
The following table summarizes our contractual obligations at December 31, 2010. This table does not include potential milestone payments and assumes non-termination of agreements.
| Payments Due by Period | ||||||||||||||||||||
| Total | 1 Year or Less |
1 to 3 Years |
3 to 5 Years |
After 5 Years |
||||||||||||||||
| (In $000’s) | ||||||||||||||||||||
| Minimum payments remaining under operating leases(1) |
$ | 5,828 | $ | 2,354 | $ | 3,153 | $ | 321 | $ | — | ||||||||||
| Total contractual cash obligations |
$ | 5,828 | $ | 2,354 | $ | 3,153 | $ | 321 | $ | — | ||||||||||
| (1) | As of December 31, 2010 we leased space in four buildings with lease terms expiring in 2011, 2012, 2014 and 2015, and subleased additional office space with a term expiring in 2011. We have also entered into various office equipment leases and automobile leases, the terms of which are typically three years. Annual rent expense for all of our facilities, equipment and automobile leases for the year ended December 31, 2010 was approximately $1.5 million. |
| • | We lease 23,000 square feet of office space and warehouse space in Union City, California under a lease agreement that expires in March 2011. Our Commercial Development, Sales and Marketing, Medical Affairs, Contract Manufacturing, Quality Control and Quality Assurance departments occupy this facility. In connection with the expiration of this lease, we are moving these functions to the Hayward, California facility. |
| • | We lease 30,000 square feet of laboratory and office space in Hayward, California under a master lease that expires in November 2012. Effective November 2010, we subleased 9,000 square feet of the facility through November 2012 and effective September 2010, we subleased 4,500 square feet on a month-to-month basis. We will occupy the remainder of this lease following the expiration of the Union City lease in March 2011. |
| • | We lease 6,200 square feet of office space in Ellicott City, Maryland under a lease agreement that expires in October 2015. Our Product Development and Regulatory Affairs departments occupy this facility. |
| • | We lease 4,400 square feet of office space in Anaheim, California under a lease agreement that expires in October 2014. Our Executive, Finance and Administration departments occupy this facility, and serves as our corporate headquarters. |
Critical Accounting Policies and Estimates
We base our management’s discussion and analysis of financial condition and results of operations, as well as disclosures included elsewhere in this Annual Report on Form 10-K, upon our consolidated financial statements, which we have prepared in accordance with U.S. generally accepted accounting principles. We describe our significant accounting policies in the notes to the audited consolidated financial statements contained elsewhere in this Annual Report on Form 10-K. We include within these policies our “critical accounting policies.” Critical accounting policies are those policies that are most important to the preparation of our consolidated financial statements and require management’s most subjective and complex judgment due to the need to make estimates about matters that are inherently uncertain. Changes in estimates and assumptions based upon actual results may have a material impact on our results of operations and/or financial condition.
We believe that the critical accounting policies that most impact the consolidated financial statements are as described below.
Revenue Recognition
We recognize revenue in accordance with Accounting Standards Codification, or ASC, 605, “Revenue Recognition-Products,” or ASC 605, from sales of Acthar and Doral. Pursuant to ASC 605, we recognize revenue when we have persuasive evidence that an
25
Table of Contents
arrangement, agreement or contract exists, when title for our product and risk of loss has passed to our customer, the price we charge for our product is fixed or is readily determinable, and we are reasonably assured of collecting the amounts owed under the resulting receivable. For sales of both of our products, we do not require collateral from our customers. We also support Acthar patient assistance programs administered by the National Organization for Rare Disorders, or NORD, and the Chronic Disease Fund. These and other patient-oriented support programs have now provided free drug with a commercial value of over $73 million to patients since September 2007 through December 31, 2010. We do not recognize any revenue from our free drug program.
In the U.S., our exclusive customer for Acthar is CuraScript SD. We sell Acthar at a discount from our list price to CuraScript SD, which then sells Acthar primarily to approximately 12 specialty pharmacies, including CuraScript Specialty Pharmacy, or CuraScript SP, and to many hospitals. We record a sale of Acthar when CuraScript SD accepts a shipment of Acthar based on its order of Acthar from Integrated Commercialization Services, Inc., or ICS, our exclusive distributor for commercial shipment and distribution of our products to our customers. In addition to Acthar, we sell Doral to pharmaceutical wholesalers, who in turn sell Doral primarily to retail pharmacies and hospitals.
International sales of our products are immaterial.
Net Sales
We record net sales after establishing reserves for the following:
| • | Medicaid rebates; |
| • | Tricare retail program rebates; |
| • | Chargebacks due to other government programs; |
| • | Questcor-sponsored co-pay assistance programs; and |
| • | Other deductions such as payment discounts. |
We currently provide our products to Medicaid participants under an agreement with the Center for Medicare and Medicaid Services, or CMS. Under this agreement, states are eligible to receive rebates from us for Medicaid patients in accordance with CMS regulations. States typically provide us with rebate invoices for their reimbursements between 60 to 90 days after the end of the calendar quarter in which our products were provided. We estimate the end of period liability and the sales reserve needed for these Medicaid rebates based on the following multi-step process:
| • | Using a predictive model, we review national Medicaid statistics as well as internal information received from the Acthar reimbursement support center and from CuraScript SP for the most recent completed quarter to develop an estimate of future Medicaid rebate invoices that we expect to receive for the most recently completed quarter. This includes an estimate for both future Medicaid Managed Care and Medicaid Fee for Service rebate invoices. |
| • | We review the Medicaid rebate invoices received during the last 90 days and compare those invoices to the reserve that we had previously set at the end of the prior quarter. Based on this comparison and using our predictive model, which we update quarterly based on all information available to us at the time, we estimate the remaining liability that we believe is still outstanding for periods prior to the most recently completed quarter. |
| • | Based on estimated end-of-quarter inventory held at CuraScript SD and at all specialty pharmacies and hospitals, we calculate the expected future rebate liability for that portion of the inventory which we eventually will use to fill prescriptions for Medicaid patients. |
Using a similar process, we estimate the end of period liability and the sales reserve needed for Tricare program rebates and chargebacks from other government programs.
We also sponsor co-pay assistance programs for Acthar patients which are administered by NORD and the Chronic Disease Fund. We account for these payments as a reduction to our revenue.
Our resulting total sales reserve for the quarter includes the sum of the Medicaid sales reserve, the Tricare sales reserve, the chargeback sales reserve, co-pay assistance payments, and payment discounts provided.
We believe that the assumptions we used to estimate these sales reserves are reasonable considering known facts and circumstances. However, significant judgment is inherent in our selection of assumptions and the interpretation of historical experience as well as the identification of external and internal factors affecting the estimate of our reserves for Medicaid rebates and other government program rebates and chargebacks. Our Medicaid rebates and other government program rebates and chargebacks could differ significantly from our estimates because of unanticipated changes in prescription trends or patterns in the states’ submissions of Medicaid claims, adjustments to the amount of product in the distribution channel, or if our estimate of the number of Medicaid patients with IS and MS are incorrect. If actual Medicaid rebates, or other government program rebates and chargebacks are
26
Table of Contents
significantly different from our estimates, we would account for such differences in the period in which they become known. If actual future payments for such reserves exceed the estimates we made at the time of sale, our financial position, results of operations and cash flows may be negatively impacted.
Medicaid Rebates and the New National Health Care Legislation
In March 2010, Congress passed, and the President signed into law, the Healthcare Reform Acts. The Healthcare Reform Acts contain a number of provisions that have impacted, both positively and negatively, our financial position, results of operations and cash flows. The provisions of the Healthcare Reform Acts have reduced our rebate provided to states for prescriptions filled for Medicaid patients to 100% of the AMP, which approximates the amount we charge to CuraScript SD. Before the passage of the Healthcare Reform Acts, the formula used to calculate the per vial rebate required us to rebate 110% of our AMP for Acthar. Effective March 23, 2010, the Healthcare Reform Acts extended required Medicaid rebates to Medicaid Managed Care plans. Medicaid Managed Care plans provide for the delivery of Medicaid health benefits and additional services through an arrangement between a state Medicaid agency and managed care organizations. Our provision for expected Medicaid rebate liability and our quarterly sales reserves have included an estimate for Medicaid Managed Care usage since March 23, 2010. We have reserved $8.2 million for expected Medicaid Managed Care rebates since March 23, 2010. We have begun to receive Medicaid Managed Care rebate invoices and expect to receive additional rebate invoices as state Medicaid agencies complete the implementation of their internal invoice processing systems.
Other Impacts from the National Health Care Legislation
In addition to the aforementioned impact to our required Medicaid rebates, the Healthcare Reform Acts contain a number of provisions that we expect to continue to impact, both positively and negatively, our financial position, results of operations and cash flows.
| • | Positive Impact. The Healthcare Reform Acts contain provisions that create a national high-risk insurance pool, temporarily extend health coverage to individuals with pre-existing medical conditions, prohibit the denial of health coverage to children with pre-existing conditions, prohibit the denial of health coverage to adults with pre-existing conditions and place limits on insurers with respect to lifetime and annual caps on health coverage, and increase the number of patients with private insurance. |
| • | Negative Impact. The Healthcare Reform Acts contain the following provisions that we have identified as having a negative or potential negative impact on our overall financial position, results of operations and cash flows: |
| • | Effective March 23, 2010, Medicaid managed care programs became eligible for drug rebates. This expanded eligibility affected our rebate liability for those state entities which had Medicaid managed care programs, but had not previously taken legislative action at the state level to permit drugs provided to Medicaid managed care patients to be eligible for Medicaid rebates (approximately 28 states). |
| • | Effective January 1, 2011, pharmaceutical companies, including Questcor, must provide rebates to cover a portion of the Medicare Part D coverage gap or “donut hole,” which is a portion of the gap between Medicare funding and Medicare recipient’s drug deductibles. Approximately 25% of our sales for MS are to Medicare insureds. We estimate our obligation could be as much as $1,800 per Medicare insured in 2011. At current sales levels, we estimate that this obligation would be less than $0.5 million per year. |
| • | Effective January 1, 2011, the U.S. Federal government will allocate an annual fee among manufacturers of branded prescription drugs based on market share for specified government programs. The Healthcare Reform Acts determine an individual manufacturer’s market share as the ratio of its aggregate sales of branded prescription drugs during the preceding calendar year as a percentage of the aggregate branded prescription drug sales for all covered manufacturers. |
| • | We expect the number of Medicaid patients to increase gradually through 2014. We further expect this expansion more likely to impact the number of adults in Medicaid because many states have already set their eligibility criteria for children at or above the level designated in the Healthcare Reform Acts. An increase in the proportion of patients who receive Acthar and who are covered by Medicaid could adversely affect our net sales. |
Substantial new provisions affecting compliance also have been added, which may require us to modify our business practices with health care practitioners. Our failure to comply with these new provisions may subject us to significant penalties or enforcement actions, either of which may negatively impact the results of our operations or business.
27
Table of Contents
Presently, uncertainty exists as many of the specific determinations necessary to implement the Healthcare Reform Acts have yet to be decided and communicated to industry participants. For example, under Medicaid MCO, the affected states have only begun to bill us for Medicaid MCO rebates, as many of the states are still implementing their internal systems in order to submit Medicaid rebate claims to us. Additionally, we do not yet know when we will have to provide discounts to additional hospitals eligible to participate under the 340(B) program. We have made several estimates with regard to important assumptions relevant to determining the financial impact of the Healthcare Reform Acts on our business due to the lack of availability of both certain information and complete understanding of how the process of applying the Healthcare Reform Acts will be implemented. Based on these estimates and assumptions, the Healthcare Reform Acts overall did not have a material impact on our financial condition or results of operations in 2010; however, the Healthcare Reform Acts could have a material adverse effect on our future business, cash flows, financial condition and results of operations.
In addition, Congress and the President may make additional refinements to the Healthcare Reform Acts which may have an additional, potential negative impact on our overall financial position, results of operations and cash flows. At this time, we cannot predict the full impact of the Healthcare Reform Acts, or the timing and impact of any future rules or regulations promulgated to implement the Healthcare Reform Acts. It is possible that the Healthcare Reform Acts and related rulemaking actions may have an overall negative effect on our net sales over time; however, at this time, we cannot determine the timing and magnitude of various positive and negative effects upon our business. Furthermore, there continues to be active debate in Congress and the courts ranging from repeal of the Healthcare Reform Acts to no change in the law.
TRICARE Retail Pharmacy Programs
The Department of Defense, or DoD, Tricare Retail Pharmacy program became effective on May 26, 2009, pursuant to section 703 of the National Defense Authorization Act of 2008. This program and its regulations require manufacturers to pay rebates, retroactive to January 28, 2008, to the DoD on products distributed to Tricare beneficiaries through retail pharmacies. The regulation further requires that pharmaceutical products paid for by the DoD through the Tricare Retail Pharmacy program be subject to the Federal Ceiling Price program, which requires manufacturers to provide the DoD with a refund on pharmaceutical products utilized through the Tricare Retail Pharmacy program. As a result, we established a sales reserve of $3.5 million for Tricare rebates as of the year ended December 31, 2009 which covered 100% of our estimated liability for the time period January 28, 2008 through December 31, 2009.
Effective January 1, 2010, we entered into a new pricing agreement with the Veterans Administration, resulting in a rebate for pharmaceutical products utilized through the Tricare Retail Pharmacy program during 2010 of $5,670 per vial, or a reduction of $14,865 from the previous rebates of $20,535. As a result, we recorded sales reserves of $1.2 million for the year ended December 31, 2010, for which we received invoices for $0.6 million
Government Chargebacks
We permit certain other government-supported entities, such as those covered by our contract with the VA or eligible Public Health Service, or PHS, 340(B) entities, to purchase Acthar from CuraScript SD based on a contractual amount. Because our payment terms with CuraScript SD are approximately 30 to 45 days, we include actual chargebacks taken plus an estimate applied to the units in channel when estimating the sales reserve related to government chargebacks. Sales to the Veteran Administration and PHS 340(B) entities are generally immaterial to our financial position as a whole.
Co-Pay Assistance Programs
We sponsor co-pay assistance programs for Acthar patients which are administered by NORD and the Chronic Disease Fund. We account for these co-pay assistance program payments as a reduction to our revenue.
Total Sales-related Reserves
At December 31, 2010 and 2009 sales-related reserves included in the accompanying Consolidated Balance Sheets were as follows (in thousands):
| Years Ended December 31, | ||||||||
| 2010 | 2009 | |||||||
| Medicaid rebates |
$ | 17,384 | $ | 11,070 | ||||
| Tricare rebates |
4,125 | 3,530 | ||||||
| Government chargebacks |
2 | 322 | ||||||
| Total |
$ | 21,511 | $ | 14,922 | ||||
28
Table of Contents
Product Sales Returns
On a limited basis, we generally authorize Acthar exchanges for expiring and expired product in accordance with our stated return policy, which allows CuraScript SD to return product within one month of its expiration date and for a period up to three months after such product has reached its expiration date. We exchange returns for replacement product and we include in the cost of sales the estimated costs for such exchanges, which include actual product material costs and related shipping charges. Product exchanges have been insignificant since we began utilizing the services of CuraScript SD to distribute Acthar.
Inventories
We state inventories, net of allowances, at the lower of cost or market. We determine cost by the first-in, first-to-expire method.
We review inventory periodically for slow-moving or obsolete status. We adjust our inventory to reflect situations in which we do not expect to recover the cost of inventory. We would record a reserve to adjust inventory to its net realizable value: (i) when a product is close to expiration and we do not expect it to be sold, (ii) when a product has reached its expiration date or (iii) when we do not expect a product to be saleable. In determining the reserves for these products, we consider factors such as the amount of inventory on hand and its remaining shelf life, and current and expected market conditions, including management forecasts and levels of competition. We have evaluated the current level of inventory considering historical trends and other factors, and based on our evaluation, have recorded adjustments to reflect inventory at its net realizable value. These adjustments are estimates, which could vary significantly from actual results if future economic conditions, customer demand, competition or other relevant factors differ from expectations. These estimates require us to assess the future demand for our products in order to categorize the status of such inventory items as slow-moving, obsolete or in excess-of-need. These future estimates are subject to the ongoing accuracy of our forecasts of market conditions, industry trends, competition and other factors. Differences between our estimated reserves and actual inventory adjustments have been immaterial, and we account for such adjustments in the current period as a change in estimate.
Stock-Based Compensation
We recognize compensation expense for all stock-based awards made to employees and directors. We estimate the fair value of stock-based awards at the grant date using an option pricing model and we recognize the portion that we ultimately expect to vest as compensation cost over the requisite service period.
Since we recognize stock-based compensation only for those awards that we ultimately expect to vest, we have applied an estimated forfeiture rate to unvested awards for the purpose of calculating compensation cost. These estimates will be revised, if necessary, in future periods if actual forfeitures differ from estimates. Changes in forfeiture estimates impact compensation cost in the period in which the change in estimate occurs.
We use the Black-Scholes option-pricing model to estimate the fair value of stock-based awards. The determination of fair value using the Black-Scholes option-pricing model is affected by our stock price as well as assumptions regarding a number of complex and subjective variables, including expected stock price volatility, risk-free interest rate, expected dividends and expected employee stock option exercise behaviors. We estimate the expected term based on the contractual term of the awards and employees’ exercise and expected post-vesting termination behavior.
At December 31, 2010, there was $7.2 million of total unrecognized compensation cost related to non-vested stock options, which is expected to be recognized over a remaining weighted average vesting period of approximately 2.7 years.
Income Taxes
We account for income taxes under ASC 740, “Income Taxes”, or ASC 740. We make certain estimates and judgments in determining income tax expense for financial statement purposes. These estimates and judgments occur in the calculation of certain tax assets and liabilities, which arise from differences in the timing of recognition of revenue and expense for tax and financial statement purposes.
As part of the process of preparing our consolidated financial statements, we are required to estimate our income taxes in each of the jurisdictions in which we operate. This process involves estimating our current tax exposure under the most recent tax laws and assessing temporary differences resulting from differing treatment of items for tax and accounting purposes. These differences result in deferred tax assets and liabilities, which are included in our consolidated balance sheets.
29
Table of Contents
Utilization of our net operating loss and research and development credit carryforwards may still be subject to substantial annual limitations due to the ownership change limitations provided by the Internal Revenue Code and similar state provisions for ownership changes after December 31, 2010. Such annual limitations could result in the expiration of the net operating loss and research and development credit carryforwards available as of December 31, 2010 before utilization.
Income tax expense for the years ended December 31, 2010, 2009 and 2008 was $19.3 million, $15.5 million and $18.2 million, respectively, and our effective tax rate for financial reporting purposes was approximately 35.5%, 36.8% and 31.0%, respectively. The decrease in our effective income tax rate is due to the Internal Revenue Code, or IRC, Section 199 Income Attributable to Domestic Production Activities deduction credit which increased to 9% in 2010 as compared to 6% in 2009.
Recent Accounting Pronouncements
In April 2010, the FASB issued ASU 2010-17, which establishes a revenue recognition model for contingent consideration that is payable upon the achievement of an uncertain future event, referred to as a milestone. The scope of the ASU is limited to research or development arrangements and requires an entity to record the milestone payment in its entirety in the period received if the milestone meets all the necessary criteria to be considered substantive. However, entities would not be precluded from making an accounting policy election to apply another appropriate accounting policy that results in the deferral of some portion of the arrangement consideration. The ASU is effective for fiscal years (and interim periods within those fiscal years) beginning on or after June 15, 2010. We adopted this guidance in the third quarter of 2010. The adoption of this guidance did not have an impact on our consolidated financial statements.
Item 7A. Quantitative and Qualitative Disclosures about Market Risk
Market Rate Risk
The primary objective of our investment policy is to preserve principal while at the same time maximizing the income we receive from our investments without significantly increasing risk. Some of the securities that we have invested in had market risk. This means that a change in prevailing interest rates may cause the principal amount of the investment to fluctuate. For example, if we hold a security that was issued with a fixed interest rate at the then-prevailing rate and the prevailing interest rate later increases, the principal amount of our investment will probably decline. Seeking to minimize this risk, we place our investments with high quality issuers and follow internally developed guidelines to limit the amount of credit exposure to any one issuer. Additionally, in an attempt to limit interest rate risk, we follow guidelines to limit the average and longest single maturity dates. Our investments include money market accounts, government-sponsored enterprises, certificates of deposit and municipal bonds. None of our investments are in auction rate securities.
The significant majority of our sales occur within the United States. Accordingly, we have not had any exposure to foreign currency rate fluctuations.
Item 8. Financial Statements and Supplementary Data
The consolidated financial statements and supplementary data required by this item are set forth on the pages indicated in
Item 15(a).
Item 9. Changes In and Disagreements with Accountants on Accounting and Financial Disclosure
None.
Item 9A. Controls and Procedures
| (a) | Evaluation of Disclosure Controls and Procedures |
Our management, with the participation and under the supervision of our Chief Executive Officer and Chief Financial Officer, has evaluated the effectiveness of our disclosure controls and procedures (as defined in Rules 13(a) – 15(e) and 15(d) – 15(e) under the Securities Exchange Act of 1934, as amended, or the Exchange Act) as of the end of the period covered by this Annual Report. The Chief Executive Officer and Chief Financial Officer have concluded, based on their evaluation of these controls and procedures, that our disclosure controls and procedures were effective as of the end of the period covered by this Annual Report to provide reasonable assurance that the information required to be disclosed by us in our Exchange Act reports is recorded, processed,
30
Table of Contents
summarized and reported within the time periods specified in applicable SEC rules and forms. A controls system, no matter how well designed and operated, cannot provide absolute assurance that the objectives of the controls are met, and no evaluation of controls can provide absolute assurance that all controls and instances of fraud, if any, within a company have been detected.
| (b) | Changes in Internal Control over Financial Reporting and Remediation Plans |
We have not made any significant changes to our internal control over financial reporting (as defined in Rules 13a – 15(f) and 15d – 15(f) under the Exchange Act) during the three-month period ended December 31, 2010 that have materially affected, or are reasonably likely to materially affect, our internal control over financial reporting.
| (c) | Management’s Report on Internal Control over Financial Reporting |
Our management is responsible for establishing and maintaining adequate internal control over financial reporting. Internal control over financial reporting is defined in Rule 13a – 15(f) or 15d – 15(f) promulgated under the Exchange Act as a process designed by, or under the supervision of, our principal executive and principal financial officers and effected by our board of directors, management and other personnel, to provide reasonable assurance regarding the reliability of financial reporting and the preparation of financial statements for external purposes in accordance with generally accepted accounting principles, and includes those policies and procedures that:
| • | Pertain to the maintenance of records that in reasonable detail accurately and fairly reflect the transactions and dispositions of our assets; |
| • | Provide reasonable assurance that transactions are recorded as necessary to permit preparation of financial statements in accordance with generally accepted accounting principles, and that our receipts and expenditures are being made only in accordance with authorization of our management and directors; and |
| • | Provide reasonable assurance regarding prevention or timely detection of unauthorized acquisitions, use or disposition of our assets that could have a material effect on the financial statements. |
Because of its inherent limitations, internal control over financial reporting may not prevent or detect misstatements. Projections of any evaluation of effectiveness to future periods are subject to the risk that controls may become inadequate because of changes in conditions, or that the degree of compliance with the policies or procedures may deteriorate.
Our management assessed the effectiveness of our internal control over financial reporting as of December 31, 2010. In making this assessment, management used the criteria set forth by the Committee of Sponsoring Organizations of the Treadway Commission, or COSO, in Internal Control-Integrated Framework.
Based on our assessment, management believes that, as of December 31, 2010, our internal control over financial reporting is effective based on those criteria.
Our independent registered public accounting firm has issued a report on our assessment of our internal control over financial reporting. This report appears below.
There was no change in our internal control over financial reporting that occurred during our most recently completed fiscal quarter that materially affected, or is reasonably likely to materially affect, our internal control over financial reporting.
| (d) | Report of Independent Registered Public Accounting Firm |
To the Board of Directors and Shareholders of Questcor Pharmaceuticals, Inc.
We have audited Questcor Pharmaceuticals, Inc.’s, or the Company’s, internal control over financial reporting as of December 31, 2010, based on criteria established in Internal Control – Integrated Framework issued by the Committee of Sponsoring Organizations of the Treadway Commission, or the COSO criteria. Questcor Pharmaceuticals, Inc.’s management is responsible for maintaining effective internal controls over financial reporting and for its assessment of the effectiveness of internal control over financial reporting included in the accompanying Management’s Report on Internal Control over Financial Reporting. Our responsibility is to express an opinion on the effectiveness of the Company’s internal control over financial reporting based on our audit.
31
Table of Contents
We conducted our audit in accordance with the standards of the Public Company Accounting Oversight Board (United States). Those standards require that we plan and perform the audit to obtain reasonable assurance about whether effective internal control over financial reporting was maintained in all material respects. Our audit included obtaining an understanding of internal control over financial reporting, assessing the risk that a material weakness exists, testing and evaluating the design and operating effectiveness of internal control based on the assessed risk, and performing such other procedures as we considered necessary in the circumstances. We believe that our audit provides a reasonable basis for our opinion.
A company’s internal control over financial reporting is a process designed to provide reasonable assurance regarding the reliability of financial reporting and the preparation of financial statements for external purposes in accordance with generally accepted accounting principles. A company’s internal control over financial reporting includes those policies and procedures that (1) pertain to the maintenance of records that, in reasonable detail, accurately and fairly reflect the transactions and dispositions of the assets of the Company; (2) provide reasonable assurance that transactions are recorded as necessary to permit preparation of financial statements in accordance with general accepted accounting principles, and that receipts and expenditures of the Company are being made only in accordance with authorizations of management and directors of the Company; and (3) provide reasonable assurance regarding prevention or timely detection of unauthorized acquisition, use, or disposition of the Company’s assets that could have a material effect on the financial statements.
Because of its inherent limitations, internal control over financial reporting may not prevent or detect misstatements. Also, projections of any evaluation of effectiveness to future periods are subject to the risk that controls may become inadequate because of changes in conditions, or that the degree of compliance with the policies or procedures may deteriorate.
In our opinion, Questcor Pharmaceuticals, Inc. maintained, in all material respects, effective internal control over financial reporting as of December 31, 2010, based on the COSO criteria.
We also have audited, in accordance with the standards of the Public Company Accounting Oversight Board (United States), the 2010 consolidated financial statements and financial statement schedule of Questcor Pharmaceuticals, Inc. and our report dated February 22, 2011 expressed an unqualified opinion thereon.
/s/ ODENBERG, ULLAKKO, MURANISHI & CO. LLP
San Francisco, California
February 22, 2011
32
Table of Contents
Determination of 2010 Cash Bonuses for Executive Officers
On February 16, 2011, our Board of Directors, or the Board, based on the recommendation of the Compensation Committee, approved the 2010 cash bonuses for our executive officers. The Board considered additional subjective and objective criteria in determining each executive officer’s bonus. The table below sets forth the cash bonuses for the following executive officers:
| Name |
Title |
2010 Cash Bonus |
||||
| Don M. Bailey |
President and Chief Executive Officer | $ | 487,710 | |||
| Stephen L. Cartt |
Executive Vice President and Chief Business Officer | $ | 264,114 | |||
| David J. Medeiros |
Senior Vice President, Pharmaceutical Operations | $ | 183,936 | |||
| Michael H. Mulroy |
Senior Vice President, Chief Financial Officer and General Counsel | N/A(1) | ||||
| David Young, Pharm.D., Ph.D. |
Chief Scientific Officer | $ | 326,610 | |||
| (1) | Mr. Mulroy commenced employment with Questcor on January 10, 2011. |
Determination of 2011 Cash Bonus Target Levels for Executive Officers
On February 16, 2011, the Board, based on the recommendation of the Compensation Committee, approved the 2011 cash bonus target levels for our executive officers. The actual amount of cash bonuses that may be awarded remains subject to the discretion of the Board. The table below sets forth the 2011 target bonus percentages for the following executive officers:
| Name |
Title |
2011 Bonus Target(1) |
||||
| Don M. Bailey |
President and Chief Executive Officer | 75 | % | |||
| Stephen L. Cartt |
Executive Vice President and Chief Business Officer | 55 | % | |||
| David J. Medeiros |
Senior Vice President, Pharmaceutical Operations | 45 | % | |||
| Michael H. Mulroy |
Senior Vice President, Chief Financial Officer and General Counsel | 45 | % | |||
| David Young, Pharm.D., Ph.D. |
Chief Scientific Officer | 60 | % | |||
| (1) | Targets are expressed as a percentage of the officer’s 2011 base salary. |
Grant of Options to Executive Officers
On February 16, 2011, the Board, based on the recommendation of the Compensation Committee, approved the grant of options to purchase shares of our common stock to our executive officers under our 2006 Equity Incentive Plan. The table below sets forth the stock option grants approved by the Board:
| Name |
Title |
Shares Subject to Option |
||||
| Don M. Bailey |
President and Chief Executive Officer | 350,000 | (1) | |||
| Stephen L. Cartt |
Executive Vice President, Corporate Development | 150,000 | (2) | |||
| David J. Medeiros |
Senior Vice President, Pharmaceutical Operations | 50,000 | ||||
| Michael H. Mulroy |
Senior Vice President, Chief Financial Officer, and General Counsel | 125,000 | (3) | |||
| David Young, Pharm.D., Ph.D. |
Chief Scientific Officer | 100,000 | ||||
| (1) | 175,000 shares of Mr. Bailey’s grant consist of time-based vesting and 175,000 shares of Mr. Bailey’s grant vest upon the achievement of certain performance goals and targets. |
| (2) | 75,000 shares of Mr. Cartt’s grant consist of time-based vesting and 75,000 shares of Mr. Cartt’s grant vest upon the achievement of certain performance goals and targets. |
| (3) | Mr. Mulroy commenced employment with Questcor on January 10, 2011 and this grant represents the option grant awarded to him in connection with his commencement of employment. |
Determination of 2011 Base Salaries
On February 16, 2011, the Board, based on the recommendation of the Compensation Committee, approved the 2011 base salaries for our executive officers.
The table below sets forth the 2011 base salary levels for the following executive officers:
| Name |
Title |
2011 Salary | ||||
| Don M. Bailey |
President and Chief Executive Officer | $ | 584,875 | |||
| Stephen L. Cartt |
Executive Vice President, Corporate Development | $ | 389,917 | |||
| David J. Medeiros |
Senior Vice President, Pharmaceutical Operations | $ | 362,066 | |||
| Michael H. Mulroy |
Senior Vice President, Chief Financial Officer and General Counsel | $ | 350,000 | (1) | ||
| David Young, Pharm.D., Ph.D. |
Chief Scientific Officer | $ | 424,320 | |||
| (1) | Mr. Mulroy commenced employment with Questcor on January 10, 2011 and the listed base salary represents his initial base salary amount. |
PART III
Item 10. Directors and Executive Officers of the Registrant
Biographical information for our executive officers is set forth below.
Don M. Bailey, 65, President and CEO, joined our Board of Directors in May 2006. Mr. Bailey was appointed our interim President in May 2007. Mr. Bailey was appointed President and Chief Executive Officer in November 2007. Mr. Bailey is currently the non-executive Chairman of the Board of STAAR Surgical Company. STAAR Surgical Company is a leader in the development, manufacture, and marketing of minimally invasive ophthalmic products employing proprietary technologies. Mr. Bailey was the Chairman of the Board of Comarco, Inc. from 1998 until 2007 and served as Comarco’s Chief Executive Officer from 1991 to 2000. Mr. Bailey has been Chairman of the Board of STAAR since April 2005. Mr. Bailey holds a B.S. degree in mechanical engineering from the Drexel Institute of Technology, an M.S. degree in operations research from the University of Southern California, and an M.B.A. from Pepperdine University.
Stephen L. Cartt, 48, Executive Vice President and Chief Business Officer, joined us in March 2005. Mr. Cartt was a private consultant from August 2002 until March 2005. From March 2000 through August 2002, Mr. Cartt was the Senior Director of Strategic Marketing for Elan Pharmaceuticals. Mr. Cartt holds a B.S. degree from the University of California at Davis in biochemistry, and an M.B.A. from Santa Clara University.
David J. Medeiros, 59, Senior Vice President, Pharmaceutical Operations, joined us in June 2003 as Vice President, Manufacturing. Prior to joining us, Mr. Medeiros served as Senior Director, Manufacturing at Titan Pharmaceuticals, Inc. from November 2000 to June 2003. Mr. Medeiros holds a B.S. degree in chemical engineering from San Jose State University, a Master’s degree in chemical engineering from University of California, Berkeley and an M.B.A. from the University of California at Berkeley.
David Young, Ph.D., 58, Chief Scientific Officer, joined our Board of Directors in September 2006. Dr. Young was appointed Chief Scientific Officer in October 2009. Prior to joining Questcor as an executive officer, Dr. Young was a member of our board of directors from September 2006 until his commencement of employment with the Company. Dr. Young was President of AGI Therapeutics, Inc. from 2006 to 2009. Previously, Dr. Young was the Executive Vice President of the Strategic Drug Development Division of ICON plc, an international CRO, from 2003 to 2006, and founder and CEO of GloboMax LLC, a contract drug development firm purchased by ICON plc in 2003, from 1997 to 2003. Prior to forming GloboMax, Dr. Young was an Associate Professor at the School of Pharmacy, University of Maryland where he held a number of roles including Director of the Pharmacokinetics and Biopharmaceutics Lab and Managing Director of the University of Maryland-VA Clinical Research Unit. Dr. Young holds a B.S. degree in physiology from the University of California, Berkeley, an M.S. degree in physics from the University of Wisconsin-Madison, a Pharm.D. from the University of Southern California and a Ph.D. in pharmaceutical sciences from the University of Southern California.
Michael H. Mulroy, 44, Senior Vice President, Chief Financial Officer, General Counsel and Corporate Secretary, joined us in January 2011. From 2003 to 2011, Mr. Mulroy was employed by the law firm of Stradling Yocca Carlson & Rauth, where he served as a partner from 2004, and represented Questcor and other publicly-traded companies. From 1997 to 2003, Mr. Mulroy was an investment banker at Merrill Lynch and Citigroup. Mr. Mulroy earned his J.D. degree from the University of California, Los Angeles and his B.A. (Economics) from the University of Chicago.
The information related to Questcor’s Directors required by this item will be contained in our definitive proxy statement to be filed with the Securities and Exchange Commission in connection with the Annual Meeting of our Shareholders, or the Proxy Statement, which is expected to be filed not later than 120 days after the end of our fiscal year ended December 31, 2010, and is incorporated in this report by reference.
The remaining information required by this item will be set forth in our Proxy Statement for our 2011 Annual Meeting of our Shareholders and is incorporated in this Annual Report by reference.
33
Table of Contents
Item 11. Executive Compensation
In accordance with Instruction G (3) to Form 10-K, the information required by this item will be set forth in the Proxy Statement and is incorporated in this Annual Report by reference.
Item 12. Security Ownership of Certain Beneficial Owners and Management and Related Shareholder Matters
The following table sets forth information regarding outstanding options and shares reserved for future issuance under our existing equity compensation plans as of December 31, 2010:
| Plan Category |
Number of Shares to be Issued Upon Exercise of Outstanding Options (a) |
Weighted- Average Exercise Price of Outstanding Options (b) |
Number of
Shares Remaining Available for Future Issuance Under Equity Compensation Plans (Excluding Shares Reflected in Column (a)) (c) |
|||||||||
| Equity compensation plans approved by shareholders |
6,286,436 | $ | 4.43 | 3,716,678 | ||||||||
| Equity compensation plans not approved by shareholders |
N/A | N/A | N/A | |||||||||
| Total |
6,286,436 | $ | 4.43 | 3,716,678 | ||||||||
The remaining information required by this item will be set forth in the Proxy Statement and is incorporated in this Annual Report by reference.
Item 13. Certain Relationships and Related Transactions, and Director Independence
In accordance with Instruction G-(3) to Form 10-K, the information required by this item will be set forth in our Proxy Statement for our 2011 Annual Meeting of our Shareholders and is incorporated in this Annual Report by reference.
Item 14. Principal Accountant Fees and Services
In accordance with Instruction G-(3) to Form 10-K, the information required by this item will be set forth in our Proxy Statement for our 2011 Annual Meeting of our Shareholders and is incorporated in this Annual Report by reference.
Consistent with Section 10A-(i)-(2) of the Exchange Act, as added by Section 202 of the Sarbanes-Oxley Act of 2002, we are responsible for listing the non-audit services approved by our Audit Committee to be performed by Odenberg, Ullakko, Muranishi & Co. LLP, our external auditors. Non-audit services are defined as services other than those provided in connection with an audit or a review of our financial statements. The Audit Committee has approved Odenberg, Ullakko, Muranishi & Co. LLP for non-audit services related to the preparation of federal and state income tax returns, and tax advice in preparing for and in connection with such filings.
34
Table of Contents
PART IV
Item 15. Exhibits and Financial Statement Schedules
(a) Financial Statements
1. Financial Statements. Our financial statements and the Reports of Independent Registered Public Accounting Firm are included in Part IV of this Annual Report on the pages indicated:
| Page | ||||
| 40 | ||||
| 42 | ||||
| 43 | ||||
| Consolidated Statements of Preferred Stock and Shareholders’ Equity |
44 | |||
| 45 | ||||
| 46 | ||||
2. Financial Statement Schedules. The following financial statement schedule is included in Item 15(a)(2): Valuation and Qualifying Accounts.
35
Table of Contents
(c) Exhibits
| Exhibit Number |
Description | |
| 2.1(1) | Merger agreement entered into August 4, 1999, by and among Cyprus Pharmaceutical Corporation, a California corporation (“Parent”), Cyprus Acquisition Corporation, a Delaware corporation and a wholly owned subsidiary of Parent, and RiboGene, Inc., a Delaware corporation. | |
| 3.1(2) | Amended and Restated Articles of Incorporation of the Company. | |
| 3.5(21) | Amended and Restated Bylaws of Questcor Pharmaceuticals, Inc, dated as of October 20, 2009. | |
| 10.1(3) | Forms of Incentive Stock Option and Non-statutory Stock Option. | |
| 10.2(4) | 1992 Employee Stock Option Plan, as amended.** | |
| 10.3(5) | 1993 Non-employee Directors’ Equity Incentive Plan, as amended and related form of Nonstatutory Stock Option.** | |
| 10.5(6) | Asset Purchase Agreement dated July 27, 2001 between the Company and Aventis Pharmaceuticals Products, Inc.† | |
| 10.6(6) | First Amendment to Asset Purchase Agreement dated January 29, 2002, between the Company and Aventis Pharmaceuticals Products, Inc.† | |
| 10.27(7) | 2004 Non-Employee Directors’ Equity Incentive Plan.** | |
| 10.30(8) | Letter Agreement between the Company and Steve Cartt dated March 7, 2005.** | |
| 10.31(8) | Letter Agreement between the Company and Steve Cartt dated March 8, 2005.** | |
| 10.44(10) | Severance Letter Agreement between the Company and David Medeiros dated July 10, 2003.** | |
| 10.45(11) | 2006 Equity Incentive Award Plan.** | |
| 10.46(12) | Form of Incentive Stock Option Agreement under the 2006 Equity Incentive Award Plan. | |
| 10.47(12) | Form of Non-Qualified Stock Option Agreement under the 2006 Equity Incentive Award Plan. | |
| 10.48(12) | Form of Restricted Stock Award Agreement under the 2006 Equity Incentive Award Plan. | |
| 10.58(13) | Amended Change of Control Letter Agreement between the Company and Stephen L. Cartt dated February 13, 2007.** | |
| 10.63(13) | Change of Control Letter Agreement between the Company and David J. Medeiros dated February 13, 2007.** | |
| 10.65(14) | Form of Performance-Based Vesting Stock Option Agreement under the 2006 Equity Incentive Award Plan. | |
| 10.66(15) | Severance Agreement between the Company and David J. Medeiros dated July 16, 2007.** | |
| 10.68(16) | Form of Option Agreement under the 2004 Non-Employee Directors’ Equity Incentive Plan for Director Options. | |
| 10.69(16) | Form of Option Agreement under the 2004 Non-Employee Directors’ Equity Incentive Plan for Committee Options. | |
| 10.70(17) | Amended and Restated 2003 Employee Stock Purchase Plan.** | |
| 10.72(18) | Stock Purchase Agreement, by and between the Company and Chaumiere Consultadoria & Servicos SDC Unipessoal L.D.A., dated August 13, 2008. | |
| 10.73(19) | Stock Purchase Agreement, by and between the Company and Inverlochy Consultadoria & Servicos L.D.A., dated September 3, 2008. | |
| 10.74(20) | Redemption Agreement, by and between the Company and Shire Pharmaceuticals, Inc., dated February 19, 2008. | |
| 10.75(20) | Severance Letter Agreement between the Company and Gary M. Sawka dated September 10, 2008.** | |
36
Table of Contents
| Exhibit Number |
Description | |
| 10.76(20) | Offer of Employment Letter Agreement between the Company and Gary M. Sawka dated September 9, 2008.** | |
| 10.77(20) | Amended and Restated Employment Agreement between the Company and Don Bailey dated December 19, 2008.** | |
| 10.78(20) | Form of 409A Letter Amendment to Officers’ Severance, Change in Control and Employment Agreements.** | |
| 10.81(21) | Offer Letter, by and between Questcor Pharmaceuticals, Inc. and Dr. David Young, Pharm.D., Ph.D., dated October 15, 2009.** | |
| 10.82(21) | Severance Agreement, by and between Questcor Pharmaceuticals, Inc. and Dr. David Young, Pharm.D., Ph.D., dated October 19, 2009.** | |
| 10.83(22) | Supply Agreement, dated January 21, 2010, by and between Questcor Pharmaceuticals, Inc. and Cangene bioPharma, Inc.† | |
| 10.84(23) | Resignation Agreement, dated August 24, 2010, by and between Questcor Pharmaceuticals, Inc. and Jason Zielonka, M.D.** | |
| 10.85(24) | Transition Agreement, dated September 23, 2010, by and between Questcor Pharmaceuticals, Inc. and Gary Sawka.** | |
| 10.86(25) | Offer Letter, dated January 3, 2011, by and between Questcor Pharmaceuticals, Inc. and Michael Mulroy.** | |
| 10.87(25) | Severance Agreement, dated January 3, 2011, by and between Questcor Pharmaceuticals, Inc. and Michael Mulroy.** | |
| 10.88(26) | Supply Agreement, dated July 14, 2010, by and between Questcor Pharmaceuticals, Inc., and BioVectra, Inc.† | |
| 23.1* | Consent of Odenberg, Ullakko, Muranishi & Co. LLP, Independent Registered Public Accounting Firm. | |
| 31.1* | Certification of Chief Executive Officer Pursuant to Rule 13a-14(a)/15d-14(a) of the Securities Exchange Act of 1934. | |
| 31.2* | Certification of Principal Accounting Officer Pursuant to Rule 13a-14(a)/15d-14(a) of the Securities Exchange Act of 1934. | |
| 32.1* | Certification of Chief Executive Officer Pursuant to Rule 13a-14(b)/15d-14(b) of the Securities Exchange Act of 1934 and 18 U.S.C. Section 1350. (3) | |
| 32.2* | Certification of Principal Accounting Officer Pursuant to Rule 13a-14(b)/15d-14(b) of the Securities Exchange Act of 1934 and 18 U.S.C. Section 1350. (3) | |
| * | Filed herewith. |
| ** | This exhibit is identified as a management contract or compensatory plan or arrangement pursuant to Item 15(a)(3) of Form 10-K. |
| (1) | Filed as an exhibit to the Company’s Annual Report on Form 10-K for the fiscal year ended December 31, 1999, filed on March 30, 2000, and incorporated herein by reference. |
| (2) | Filed as an exhibit to the Company’s Current Report on Form 8-K, filed on March 27, 2008, and incorporated herein by reference. |
| (3) | Filed as an exhibit to the Company’s Registration Statement on Form S-1, Registration No. 33-51682, and incorporated herein by reference. |
| (4) | Filed as an exhibit to the Company’s Proxy Statement on Schedule 14A, filed on March 28, 2002, and incorporated herein by reference. |
| (5) | Filed as an exhibit to the Company’s Registration Statement Form S-4, Registration Statement No. 333-87611, filed on September 23, 1999, and incorporated herein by reference. |
| (6) | Filed as an exhibit to the Company’s Quarterly Report on Form 10-Q for the quarter ended June 30, 2002, filed on August 14, 2002, and incorporated herein by reference. |
| (7) | Filed as an exhibit to the Company’s Proxy Statement on Schedule 14A, filed on March 29, 2004, and incorporated herein by reference. |
| (8) | Filed as an exhibit to the Company’s Annual Report on Form 10-K for the fiscal year ended December 31, 2004, filed on March 31, 2005, and incorporated herein by reference. |
37
Table of Contents
| (9) | Filed as an exhibit to the Company’s Current Report on Form 8-K, filed on October 19, 2005, and incorporated herein by reference. |
| (10) | Filed as an exhibit to the Company’s Annual Report on Form 10-K for the fiscal year ended December 31, 2005, filed on March 30, 2006, and incorporated herein by reference. |
| (11) | Filed as an exhibit to the Company’s Proxy Statement on Schedule 14A, filed on April 10, 2006, and incorporated herein by reference. |
| (12) | Filed as an exhibit to the Company’s Current Report on Form 8-K, filed on May 24, 2006, and incorporated herein by reference. |
| (13) | Filed as an exhibit to the Company’s Current Report on Form 8-K, filed on February 15, 2007, and incorporated herein by reference. |
| (14) | Filed as an exhibit to the Company’s Current Report on Form 8-K, filed on July 3, 2007, and incorporated herein by reference. |
| (15) | Filed as an exhibit to the Company’s Current Report on Form 8-K, filed on July 20, 2007, and incorporated herein by reference. |
| (16) | Filed as an exhibit to the Company’s Current Report on Form 8-K, filed on January 4, 2008, and incorporated herein by reference. |
| (17) | Filed as an exhibit to the Company’s Definitive Proxy Statement on Schedule 14A, filed on April 21, 2008, and incorporated herein by reference |
| (18) | Filed as an exhibit to the Company’s Current Report on Form 8-K, filed on August 19, 2008, and incorporated herein by reference. |
| (19) | Filed as an exhibit to the Company’s Current Report on Form 8-K, filed on September 9, 2008, and incorporated herein by reference. |
| (20) | Filed as an exhibit to the Company’s Annual Report on Form 10-K for the fiscal year ended December 31, 2008, filed on March 16, 2009, and incorporated herein by reference. |
| (21) | Filed as an exhibit to the Company’s Current Report on Form 8-K, filed on October 23, 2009, and incorporated herein by reference. |
| (22) | Filed as an exhibit to the Company’s Annual Report on Form 10-K for the year ended December 31, 2009, filed on March 16, 2010, and incorporated herein by reference. |
| (23) | Filed as an exhibit to the Company’s Current Report on Form 8-K, filed on August 30, 2010, and incorporated herein by reference. |
| (24) | Filed as an exhibit to the Company’s Current Report on Form 8-K, filed on September 30, 2010, and incorporated herein by reference. |
| (25) | Filed as an exhibit to the Company’s Current Report on Form 8-K, filed on January 10, 2011, and incorporated herein by reference. |
| (26) | Filed as an exhibit to the Company’s Quarterly Report on Form 10-Q, filed on November 2, 2010, and incorporated herein by reference. |
| † | The Company has requested confidential treatment with respect to portions of this exhibit. |
38
Table of Contents
Pursuant to the requirements of Section 13 or 15(d) of the Securities Exchange Act of 1934, the Registrant has duly caused this Annual Report to be signed on its behalf by the undersigned, thereunto duly authorized.
| QUESTCOR PHARMACEUTICALS, INC. | ||
| By | /s/ Don M. Bailey | |
| Don M. Bailey President and Chief Executive Officer | ||
Dated: February 23, 2011
Pursuant to the requirements of the Securities Exchange Act of 1934, this Annual Report has been signed below by the following persons on behalf of the Registrant and in the capacities and on the dates indicated.
| Signature |
Title |
Date | ||
| /s/ DON M. BAILEY Don M. Bailey |
President and Chief Executive Officer and Director (Principal Executive Officer) | February 23, 2011 | ||
| /s/ MICHAEL MULROY Michael Mulroy |
Senior Vice President, Chief Financial Officer, General Counsel and Corporate Secretary (Principal Financial Officer) | February 23, 2011 | ||
| /s/ KRISTINE ENGELKE Kristine Engelke |
Corporate Controller (Principal Accounting Officer) | February 23, 2011 | ||
| /s/ VIRGIL D. THOMPSON Virgil D. Thompson |
Chairman | February 23, 2011 | ||
| /s/ MITCHELL BLUTT Mitchell Blutt |
Director | February 23, 2011 | ||
| /s/ NEAL C. BRADSHER Neal C. Bradsher |
Director | February 23, 2011 | ||
| /s/ STEPHEN C. FARRELL Stephen C. Farrell |
Director | February 23, 2011 | ||
| /s/ LOU SILVERMAN Lou Silverman |
Director | February 23, 2011 | ||
39
Table of Contents
REPORT OF INDEPENDENT REGISTERED PUBLIC ACCOUNTING FIRM
The Board of Directors and Shareholders of
Questcor Pharmaceuticals, Inc.
We have audited the accompanying consolidated balance sheets of Questcor Pharmaceuticals, Inc. as of December 31, 2010 and 2009, and the related consolidated statements of income, preferred stock and shareholders’ equity, and cash flows for each of the three years in the period ended December 31, 2010. Our audits also included the financial statement schedule listed in Item 15(a)(2). These financial statements and schedule are the responsibility of the Company’s management. Our responsibility is to express an opinion on these financial statements and schedule based on our audits.
We conducted our audits in accordance with the standards of the Public Company Accounting Oversight Board (United States). Those standards require that we plan and perform the audit to obtain reasonable assurance about whether the financial statements are free of material misstatement. An audit includes examining, on a test basis, evidence supporting the amounts and disclosures in the financial statements. An audit also includes assessing the accounting principles used and significant estimates made by management, as well as evaluating the overall financial statement presentation. We believe that our audits provide a reasonable basis for our opinion.
In our opinion, the consolidated financial statements referred to above present fairly, in all material respects, the consolidated financial position of Questcor Pharmaceuticals, Inc. at December 31, 2010 and 2009, and the consolidated results of its operations and its cash flows for each of the three years in the period ended December 31, 2010, in conformity with U.S. generally accepted accounting principles. Also, in our opinion, the related financial statement schedule, when considered in relation to the basic financial statements taken as a whole, presents fairly in all material respects the information set forth therein.
We also have audited, in accordance with the standards of the Public Company Accounting Oversight Board (United States), Questcor Pharmaceuticals, Inc.’s internal control over financial reporting as of December 31, 2010, based on criteria established in Internal Control — Integrated Framework issued by the Committee of Sponsoring Organizations of the Treadway Commission and our report dated February 22, 2010 expressed an unqualified opinion thereon.
/s/ ODENBERG, ULLAKKO, MURANISHI & CO. LLP
San Francisco, California
February 22, 2011
40
Table of Contents
REPORT OF INDEPENDENT REGISTERED PUBLIC ACCOUNTING FIRM
The Board of Directors and Shareholders of
Questcor Pharmaceuticals, Inc.
We have audited Questcor Pharmaceuticals, Inc.’s internal control over financial reporting as of December 31, 2010, based on criteria established in Internal Control — Integrated Framework issued by the Committee of Sponsoring Organizations of the Treadway Commission (the COSO criteria). Questcor Pharmaceuticals, Inc.’s management is responsible for maintaining effective internal control over financial reporting and for its assessment of the effectiveness of internal control over financial reporting included in Management’s Report on Internal Control Over Financial Reporting included in Item 9A. Our responsibility is to express an opinion on the Company’s internal control over financial reporting based on our audit.
We conducted our audit in accordance with the standards of the Public Company Accounting Oversight Board (United States). Those standards require that we plan and perform the audit to obtain reasonable assurance about whether effective internal control over financial reporting was maintained in all material respects. Our audit included obtaining an understanding of internal control over financial reporting, assessing the risk that a material weakness exists, testing and evaluating the design and operating effectiveness of internal control based on the assessed risk, and performing such other procedures as we considered necessary in the circumstances. We believe that our audit provides a reasonable basis for our opinion.
A company’s internal control over financial reporting is a process designed to provide reasonable assurance regarding the reliability of financial reporting and the preparation of financial statements for external purposes in accordance with generally accepted accounting principles. A company’s internal control over financial reporting includes those policies and procedures that (1) pertain to the maintenance of records that, in reasonable detail, accurately and fairly reflect the transactions and dispositions of the assets of the Company; (2) provide reasonable assurance that transactions are recorded as necessary to permit preparation of financial statements in accordance with generally accepted accounting principles, and that receipts and expenditures of the Company are being made only in accordance with authorizations of management and directors of the Company; and (3) provide reasonable assurance regarding prevention or timely detection of unauthorized acquisition, use, or disposition of the Company’s assets that could have a material effect on the financial statements.
Because of its inherent limitations, internal control over financial reporting may not prevent or detect misstatements. Also, projections of any evaluation of effectiveness to future periods are subject to the risk that controls may become inadequate because of changes in conditions, or that the degree of compliance with the policies or procedures may deteriorate.
In our opinion, Questcor Pharmaceuticals, Inc. maintained, in all material respects, effective internal control over financial reporting as of December 31, 2010, based on the COSO criteria.
We also have audited, in accordance with the standards of the Public Company Accounting Oversight Board (United States), the 2010 consolidated financial statements and financial statement schedule of Questcor Pharmaceuticals, Inc. and our report dated February 22, 2011 expressed an unqualified opinion thereon.
/s/ ODENBERG, ULLAKKO, MURANISHI & CO. LLP
San Francisco, California
February 22, 2011
41
Table of Contents
QUESTCOR PHARMACEUTICALS, INC.
CONSOLIDATED BALANCE SHEETS
| December 31, | ||||||||
| 2010 | 2009 | |||||||
| (In thousands, except share amounts) |
||||||||
| ASSETS |
||||||||
| Current assets: |
||||||||
| Cash and cash equivalents |
$ | 41,508 | $ | 45,829 | ||||
| Short-term investments |
73,324 | 29,878 | ||||||
| Total cash, cash equivalents and short-term investments |
114,832 | 75,707 | ||||||
| Accounts receivable, net of allowance for doubtful accounts of $25 and $77 at December 31, 2010 and 2009, respectively |
11,128 | 14,833 | ||||||
| Inventories, net |
3,726 | 3,378 | ||||||
| Prepaid income taxes |
3,532 | — | ||||||
| Prepaid expenses and other current assets |
1,864 | 1,162 | ||||||
| Deferred tax assets |
8,417 | 8,180 | ||||||
| Total current assets |
143,499 | 103,260 | ||||||
| Property and equipment, net |
872 | 407 | ||||||
| Purchased technology, net |
3,074 | 3,372 | ||||||
| Goodwill |
299 | 299 | ||||||
| Deposits and other assets |
65 | 710 | ||||||
| Deferred tax assets |
4,184 | 3,392 | ||||||
| Total assets |
$ | 151,993 | $ | 111,440 | ||||
| LIABILITIES AND SHAREHOLDERS’ EQUITY |
||||||||
| Current liabilities: |
||||||||
| Accounts payable |
$ | 3,869 | $ | 12,921 | ||||
| Accrued compensation |
4,158 | 2,140 | ||||||
| Sales-related reserves |
21,511 | 14,922 | ||||||
| Other accrued liabilities |
1,973 | 2,228 | ||||||
| Total current liabilities |
31,511 | 32,211 | ||||||
| Lease termination, deferred rent and other non-current liabilities |
355 | 1,226 | ||||||
| Total liabilities |
31,866 | 33,437 | ||||||
| Commitments and contingencies (see Note 6) |
||||||||
| Shareholders’ equity: |
||||||||
| Preferred stock, no par value, 7,500,000 shares authorized; none outstanding |
— | — | ||||||
| Common stock, no par value, 105,000,000 shares authorized; 62,418,464 and 61,726,609 shares issued and outstanding at December 31, 2010 and 2009, respectively |
74,809 | 67,793 | ||||||
| Retained earnings |
45,295 | 10,224 | ||||||
| Accumulated other comprehensive income (loss) |
23 | (14 | ) | |||||
| Total shareholders’ equity |
120,127 | 78,003 | ||||||
| Total liabilities and shareholders’ equity |
$ | 151,993 | $ | 111,440 | ||||
See accompanying notes.
42
Table of Contents
QUESTCOR PHARMACEUTICALS, INC.
CONSOLIDATED STATEMENTS OF INCOME
| Years Ended December 31, | ||||||||||||
| 2010 | 2009 | 2008 | ||||||||||
| (In thousands, except per share amounts) |
||||||||||||
| Net sales |
$ | 115,131 | $ | 88,320 | $ | 95,248 | ||||||
| Cost of sales (exclusive of amortization of purchased technology) |
8,013 | 7,017 | 7,304 | |||||||||
| Gross profit |
107,118 | 81,303 | 87,944 | |||||||||
| Operating expenses: |
||||||||||||
| Selling, general and administrative |
41,798 | 29,950 | 19,247 | |||||||||
| Research and development |
10,934 | 9,653 | 10,614 | |||||||||
| Depreciation and amortization |
546 | 480 | 503 | |||||||||
| Total operating expenses |
53,278 | 40,083 | 30,364 | |||||||||
| Income from operations |
53,840 | 41,220 | 57,580 | |||||||||
| Other income: |
||||||||||||
| Interest and other income, net |
533 | 686 | 1,075 | |||||||||
| Gain on sale of product rights |
— | 225 | 75 | |||||||||
| Total other income |
533 | 911 | 1,150 | |||||||||
| Income before income taxes |
54,373 | 42,131 | 58,730 | |||||||||
| Income tax expense |
19,302 | 15,502 | 18,198 | |||||||||
| Net income |
35,071 | 26,629 | 40,532 | |||||||||
| Deemed dividend on Series A preferred stock |
— | — | 5,267 | |||||||||
| Net income applicable to common shareholders |
$ | 35,071 | $ | 26,629 | $ | 35,265 | ||||||
| Net income per share applicable to common shareholders: |
||||||||||||
| Basic |
$ | 0.56 | $ | 0.41 | $ | 0.52 | ||||||
| Diluted |
$ | 0.54 | $ | 0.40 | $ | 0.49 | ||||||
| Shares used in computing net income per share applicable to common shareholders: |
||||||||||||
| Basic |
62,112 | 64,196 | 67,761 | |||||||||
| Diluted |
64,741 | 66,257 | 71,350 | |||||||||
See accompanying notes.
43
Table of Contents
QUESTCOR PHARMACEUTICALS, INC.
CONSOLIDATED STATEMENTS OF PREFERRED STOCK AND SHAREHOLDERS’ EQUITY
| Series A Preferred Stock |
Common Stock | Retained Earnings (Accumulated Deficit) |
Accumulated Other Comprehensive Gain (Loss) |
Total Shareholders’ Equity |
||||||||||||||||||||||||
| Shares | Amount | Shares | Amount | |||||||||||||||||||||||||
| (In thousands, except share amounts) | ||||||||||||||||||||||||||||
| Balances at December 31, 2007 |
2,155,715 | 5,081 | 70,118,166 | 108,387 | (51,670 | ) | 54 | 56,771 | ||||||||||||||||||||
| Stock compensation for equity incentives and restricted common stock granted to consultants and employees |
— | — | 233,296 | 4,119 | — | — | 4,119 | |||||||||||||||||||||
| Issuance of common stock pursuant to employee stock purchase plan |
— | — | 803,616 | 494 | — | — | 494 | |||||||||||||||||||||
| Issuance of common stock upon exercise of stock options |
— | — | 2,109,133 | 1,667 | — | — | 1,667 | |||||||||||||||||||||
| Issuance of common stock upon cashless exercise of warrants |
— | — | 348,228 | — | — | — | — | |||||||||||||||||||||
| Repurchase of Series A Preferred Stock |
(2,155,715 | ) | (5,081 | ) | — | — | (5,267 | ) | — | (5,267 | ) | |||||||||||||||||
| Repurchase of common stock |
— | — | (7,490,900 | ) | (35,571 | ) | — | — | (35,571 | ) | ||||||||||||||||||
| Cancellation of unvested restricted stock |
— | — | (145,809 | ) | — | — | — | — | ||||||||||||||||||||
| Cancellation of shares related to tax liability |
— | — | (5,077 | ) | — | — | — | — | ||||||||||||||||||||
| Income tax benefit realized from share-based compensation plans |
— | — | — | 4,932 | — | — | 4,932 | |||||||||||||||||||||
| Comprehensive income (loss): |
||||||||||||||||||||||||||||
| Net unrealized gain on investments |
— | — | — | — | — | 215 | 215 | |||||||||||||||||||||
| Net income |
— | — | — | — | 40,532 | — | 40,532 | |||||||||||||||||||||
| Total comprehensive income |
— | — | — | — | — | — | 40,747 | |||||||||||||||||||||
| Balances at December 31, 2008 |
— | — | 65,970,653 | 84,028 | (16,405 | ) | 269 | 67,892 | ||||||||||||||||||||
| Stock compensation for equity incentives and restricted common stock granted to consultants and employees |
— | — | — | 3,066 | — | — | 3,066 | |||||||||||||||||||||
| Issuance of common stock pursuant to employee stock purchase plan |
— | — | 145,488 | 548 | — | — | 548 | |||||||||||||||||||||
| Issuance of common stock upon exercise of stock options |
— | — | 569,631 | 454 | — | — | 454 | |||||||||||||||||||||
| Repurchase of common stock |
— | — | (4,866,600 | ) | (21,086 | ) | — | — | (21,086 | ) | ||||||||||||||||||
| Cancellation of unvested restricted stock |
— | — | (87,487 | ) | — | — | — | — | ||||||||||||||||||||
| Cancellation of shares related to tax liability |
— | — | (5,076 | ) | — | — | — | — | ||||||||||||||||||||
| Income tax benefit realized from share-based compensation plans |
— | — | — | 783 | — | — | 783 | |||||||||||||||||||||
| Comprehensive income (loss): |
||||||||||||||||||||||||||||
| Net unrealized loss on investments |
— | — | — | — | — | (283 | ) | (283 | ) | |||||||||||||||||||
| Net income |
— | — | — | — | 26,629 | — | 26,629 | |||||||||||||||||||||
| Total comprehensive income |
— | — | — | — | — | — | 26,346 | |||||||||||||||||||||
| Balances at December 31, 2009 |
— | — | 61,726,609 | 67,793 | 10,224 | (14 | ) | 78,003 | ||||||||||||||||||||
| Stock compensation for equity incentives and restricted common stock granted to consultants and employees |
— | — | 30,000 | 3,739 | — | — | 3,739 | |||||||||||||||||||||
| Issuance of common stock pursuant to employee stock purchase plan |
— | — | 149,127 | 732 | — | — | 732 | |||||||||||||||||||||
| Issuance of common stock upon exercise of stock options |
— | — | 517,936 | 1,210 | — | — | 1,210 | |||||||||||||||||||||
| Cancellation of shares related to tax liability |
— | — | (5,208 | ) | — | — | — | — | ||||||||||||||||||||
| Income tax benefit realized from share-based compensation plans |
— | — | — | 1,335 | — | — | 1,335 | |||||||||||||||||||||
| Comprehensive income (loss): |
||||||||||||||||||||||||||||
| Net unrealized gain on investments |
— | — | — | — | — | 37 | 37 | |||||||||||||||||||||
| Net income |
— | — | — | — | 35,071 | — | 35,071 | |||||||||||||||||||||
| Total comprehensive income |
— | — | — | — | — | — | 35,108 | |||||||||||||||||||||
| Balances at December 31, 2010 |
— | $ | — | 62,418,464 | $ | 74,809 | $ | 45,295 | $ | 23 | $ | 120,127 | ||||||||||||||||
See accompanying notes.
44
Table of Contents
QUESTCOR PHARMACEUTICALS, INC.
CONSOLIDATED STATEMENTS OF CASH FLOWS
| Years Ended December 31, | ||||||||||||
| 2010 | 2009 | 2008 | ||||||||||
| (In thousands) | ||||||||||||
| Cash Flows From Operating Activities |
||||||||||||
| Net income |
$ | 35,071 | $ | 26,629 | $ | 40,532 | ||||||
| Adjustments to reconcile net income to net cash provided by operating activities: |
||||||||||||
| Share-based compensation expense |
3,739 | 3,066 | 4,119 | |||||||||
| Deferred income taxes |
(1,029 | ) | (290 | ) | 4,649 | |||||||
| Amortization of investments |
678 | 181 | (456 | ) | ||||||||
| Depreciation and amortization |
546 | 480 | 503 | |||||||||
| Gain on sale of product rights |
— | (225 | ) | (75 | ) | |||||||
| Income tax benefit realized from share-based compensation plans |
1,335 | 783 | 4,932 | |||||||||
| Excess tax benefit from share-based compensation plans |
(934 | ) | (743 | ) | (4,841 | ) | ||||||
| Changes in operating assets and liabilities: |
||||||||||||
| Accounts receivable |
3,705 | (4,415 | ) | 13,221 | ||||||||
| Inventories |
(348 | ) | (919 | ) | (94 | ) | ||||||
| Prepaid income taxes |
(3,532 | ) | 3,316 | (3,316 | ) | |||||||
| Prepaid expenses and other current assets |
(702 | ) | (61 | ) | (323 | ) | ||||||
| Accounts payable |
(9,052 | ) | 8,619 | 2,525 | ||||||||
| Accrued compensation |
2,018 | 244 | (49 | ) | ||||||||
| Sales-related reserves |
6,589 | 3,097 | 3,649 | |||||||||
| Other accrued liabilities |
(255 | ) | 526 | (1,120 | ) | |||||||
| Other non-current liabilities |
(871 | ) | (303 | ) | (347 | ) | ||||||
| Net cash provided by operating activities |
36,958 | 39,985 | 63,509 | |||||||||
| Cash Flows From Investing Activities |
||||||||||||
| Purchase of short-term investments |
(106,647 | ) | (61,557 | ) | (69,613 | ) | ||||||
| Proceeds from the sale and maturities of short-term investments |
62,560 | 73,375 | 42,388 | |||||||||
| Purchase of property, equipment and leasehold improvements |
(713 | ) | (140 | ) | (133 | ) | ||||||
| Net proceeds from sale of product rights |
— | 225 | 75 | |||||||||
| Changes in deposits and other assets |
645 | — | 34 | |||||||||
| Net cash (used in) provided by investing activities |
(44,155 | ) | 11,903 | (27,249 | ) | |||||||
| Cash Flows From Financing Activities |
||||||||||||
| Issuance of common stock and warrants |
1,942 | 1,002 | 2,161 | |||||||||
| Repurchase of Series A preferred stock |
— | — | (10,348 | ) | ||||||||
| Repurchase of common stock |
— | (21,086 | ) | (35,571 | ) | |||||||
| Excess tax benefit from share-based compensation plans |
934 | 743 | 4,841 | |||||||||
| Net cash provided by (used in) financing activities |
2,876 | (19,341 | ) | (38,917 | ) | |||||||
| (Decrease) increase in cash and cash equivalents |
(4,321 | ) | 32,547 | (2,657 | ) | |||||||
| Cash and cash equivalents at beginning of year |
45,829 | 13,282 | 15,939 | |||||||||
| Cash and cash equivalents at end of year |
$ | 41,508 | $ | 45,829 | $ | 13,282 | ||||||
| Supplemental Disclosures of Cash Flow Information: |
||||||||||||
| Cash paid for interest |
$ | 7 | $ | 5 | $ | 4 | ||||||
| Cash paid for income taxes |
$ | 23,185 | $ | 11,317 | $ | 13,232 | ||||||
See accompanying notes.
45
Table of Contents
QUESTCOR PHARMACEUTICALS, INC.
NOTES TO CONSOLIDATED FINANCIAL STATEMENTS
1. Organization and Summary of Significant Accounting Policies
The Company
We are a biopharmaceutical company whose primary product helps patients with serious, difficult-to-treat medical conditions. Our primary product is H.P. Acthar® Gel (repository corticotropin injection), or Acthar, an injectable drug that is approved by the FDA. Acthar is only available in a multi-use vial. We derive substantially all of our net sales from the sale of Acthar in the U.S. and do not have operations outside of the U.S. However, we own the worldwide rights to Acthar. Acthar is approved for the treatment of 19 indications, though we currently generate most of our net sales from two indications: the treatment of acute exacerbations of multiple sclerosis, or MS, in adults, and the treatment of infantile spasms, or IS, in infants and children under two years of age. We are also exploring the other therapeutic areas where Acthar is approved, including the use of Acthar to induce a diuresis or a remission of proteinuria in the nephrotic syndrome without uremia of the idiopathic type or due to lupus erythematosus. As a current on-label indication for Acthar, we have commenced a small pilot sales effort to attempt to generate incremental net sales and better understand the commercial opportunity for Acthar in this indication. We are also exploring the possibility of pursuing FDA approval of additional indications not currently on the Acthar label where there is high unmet medical need.
Our other product is Doral® (quazepam), which is indicated for the treatment of insomnia characterized by difficulty in falling asleep, frequent nocturnal awakenings, and/or early morning awakenings. We own the U.S. rights to and have modest sales of Doral.
Basis of Presentation
The consolidated financial statements include the accounts of Questcor and our wholly-owned subsidiary. All significant inter-company accounts and transactions have been eliminated in consolidation.
Use of Estimates
The preparation of financial statements in conformity with United States generally accepted accounting principles requires us to make estimates and assumptions that affect the amounts reported in the financial statements and accompanying notes. Actual results could differ significantly from those estimates.
Fair Value of Financial Instruments
Our financial instruments include cash and cash equivalents, short-term investments, accounts receivable, accounts payable and accrued liabilities. The carrying amounts of those financial instruments are considered to be representative of their respective fair values because of the short-term nature of those investments.
Cash Equivalents and Short-Term Investments
We consider highly liquid investments with maturities from the date of purchase of three months or less to be cash equivalents. We classify available-for-sale debt instruments with maturities at the date of purchase of greater than three months as short-term investments.
We carry available-for-sale securities at fair value, with the unrealized gains and losses, if any, reported in a separate component of shareholders’ equity. If we deem the decline in value to be other-than-temporary and we intend to sell such securities before their full cost can be recovered, we write down such securities to fair value and we charge the loss to net realized losses on investments. We use significant judgment in the determination of when an other-than-temporary decline in value has occurred. We evaluate our investment securities for other-than-temporary declines based on quantitative and qualitative factors. As of December 31, 2010, none of our investments had an other-than-temporary decline in valuation, and no other-than-temporary losses were recognized during the years ended December 31, 2010, 2009 and 2008. We base the cost of securities sold upon the specific identification method. We include realized gains and losses, if any, in the accompanying Consolidated Statements of Income, in Other Income.
46
Table of Contents
QUESTCOR PHARMACEUTICALS, INC.
NOTES TO CONSOLIDATED FINANCIAL STATEMENTS—(Continued)
Concentration of Risk
Financial instruments which subject us to a significant concentration of credit risk principally consist of cash and cash equivalents, short-term investments and accounts receivable. We invest our cash in high credit quality government and corporate debt instruments and believe the financial risks associated with these instruments are minimal.
We extend credit to our customers, which consist of CuraScript SD, a specialty distributor for Acthar, and large drug wholesalers for the distribution of Doral. We have not experienced significant credit losses on our customer accounts. The relative share of our accounts receivable and gross product sales are as follows:
| Years Ended December 31, |
||||||||
| % of Accounts Receivable |
2010 | 2009 | ||||||
| CuraScript |
99 | % | 99 | % | ||||
| Other customers |
1 | % | 1 | % | ||||
| 100 | % | 100 | % | |||||
| Years Ended December 31, | ||||||||||||
| % of Gross Product Sales |
2010 | 2009 | 2008 | |||||||||
| CuraScript |
99 | % | 99 | % | 99 | % | ||||||
| Other customers |
1 | % | 1 | % | 1 | % | ||||||
| 100 | % | 100 | % | 100 | % | |||||||
Inventories
We state inventories, net of allowances, at the lower of cost or market value. We compute cost using standard cost, which approximates actual cost, on a first-in, first-to-expire method.
We review inventory periodically for slow-moving or obsolete status. We adjust our inventory if we do not expect to recover the cost of inventory. We would record a reserve to adjust inventory to its net realizable value: (i) when a product is close to expiration and we do not expect it to be sold, (ii) when a product has reached its expiration date or (iii) when we do not expect a product to be saleable. In determining the reserves for these products, we consider factors such as the amount of inventory on hand and its remaining shelf life, and current and expected market conditions, including management forecasts and levels of competition. We have evaluated the current level of inventory considering historical trends and other factors, and based on our evaluation, have recorded adjustments to reflect inventory at its net realizable value. These adjustments are estimates, which could vary significantly from actual results if future economic conditions, customer demand, competition or other relevant factors differ from expectations. These estimates require us to assess the future demand for our products in order to categorize the status of such inventory items as slow-moving, obsolete or in excess-of-need. These future estimates are subject to the ongoing accuracy of our forecasts of market conditions, industry trends, competition and other factors. Differences between our estimated reserves and actual inventory adjustments have been immaterial, and we account for such adjustments in the current period as a change in estimate.
Property and Equipment
We record property and equipment at cost. We depreciate equipment and furniture using the straight-line method over their estimated useful lives (generally three to seven years) and leasehold improvements are amortized using the straight-line method over the estimated useful life of the asset or the lease term, whichever is shorter. We amortize equipment acquired under capital leases over the estimated useful life of the assets and included such amortization in depreciation expense.
Goodwill and Purchased Technology, net
Intangible and other long-lived assets consist of goodwill and purchased technology. We generated the goodwill from a 1999 merger and purchased technology relates to the direct costs associated with the acquisition of Doral in May 2006. Goodwill is not amortized, but instead is tested for impairment at least annually or whenever events occur or circumstances change that could indicate a possible impairment may have occurred. Any impairment loss recognized will be charged to operations. Purchased technology associated with the acquisition of products is stated at cost and amortized over the estimated sales life of the product.
47
Table of Contents
QUESTCOR PHARMACEUTICALS, INC.
NOTES TO CONSOLIDATED FINANCIAL STATEMENTS—(Continued)
If indicators of impairment exist, we assess the recoverability of the affected long-lived assets by determining whether the carrying value of such assets can be recovered through undiscounted future operating cash flows. If impairment is indicated, we measure the amount of such impairment by comparing the fair value to the carrying value. We believe the future cash flows to be received from the long-lived assets will exceed the assets’ carrying value, and accordingly, we have not recognized any impairment losses through December 31, 2010.
Commitments and Contingencies
We are subject to routine claims and litigation incidental to our business. In the opinion of management, the resolution of such claims is not expected to have a material adverse effect on our operating results or financial position.
Comprehensive Income (Loss)
Accounting Standards Codification 220 “Comprehensive Income”, or ASC 220, requires reporting and displaying comprehensive income (loss) and its components, which includes net income and unrealized gains and losses on investments and foreign currency translation gains and losses. Total comprehensive income for the years ended December 31, 2010 and 2009 was $35.1 million and $26.3 million, respectively. The accumulated balance of unrealized gains (losses) on investments is disclosed as a separate component of shareholders’ equity.
Income Taxes
We account for income taxes under the provisions of Accounting Standards Codification 740, “Income Taxes”, or ASC 740. We make certain estimates and judgments in determining income tax expense for financial statement purposes. These estimates and judgments occur in the calculation of certain tax assets and liabilities, which arise from differences in the timing of recognition of revenue and expense for tax and financial statement purposes.
As part of the process of preparing our consolidated financial statements, we are required to estimate income taxes in each of the jurisdictions in which we operate. This process involves estimating our tax exposure under the most current tax laws and assessing temporary differences resulting from differing treatment of items for tax and accounting purposes. These differences result in deferred tax assets and liabilities, which are included in our consolidated balance sheets.
We regularly assess the likelihood that we will be able to recover our deferred tax assets, which is ultimately dependent on us generating future taxable income. We consider all available evidence, both positive and negative, including historical levels of income, expectations and risks associated with estimates of future taxable income and ongoing prudent and feasible tax planning strategies in assessing the need for a valuation allowance. If it is not considered “more likely than not” that we will recover our deferred tax assets, we will increase our provision for taxes by recording a valuation allowance against the deferred tax assets that we estimate will not ultimately be recoverable. Changes in the valuation allowance based on our assessment will result in an income tax benefit if the valuation allowance is decreased and an income tax expense if the valuation allowance is increased.
Revenue Recognition
We recognize revenue in accordance with Accounting Standards Codification 605, “Revenue Recognition-Products,” or ASC 605, from sales of Acthar and Doral. Pursuant to ASC 605, we recognize revenue when we have persuasive evidence that an arrangement, agreement or contract exists, when title for our product and risk of loss has passed to our customer, the price we charge for our product is fixed or is readily determinable, and we are reasonably assured of collecting the amounts owed under the resulting receivable. For sales of both of our products, we do not require collateral from our customers. We also support Acthar patient assistance programs administered by the NORD and the Chronic Disease Fund. These and other patient-oriented support programs have now provided free drug with a commercial value of over $73 million to patients since September 2007 through December 31, 2010. We do not recognize any revenue from our free drug program.
In the U.S., our exclusive customer for Acthar is CuraScript SD. For our sales to CuraScript, a sale of Acthar occurs when CuraScript accepts a shipment of Acthar. We sell Acthar at a discount from our list price to CuraScript SD, which then sells Acthar primarily to approximately 12 specialty pharmacies, including CuraScript Specialty Pharmacy, or CuraScript SP, and to many hospitals. In addition to Acthar, we sell Doral to pharmaceutical wholesalers, who in turn sell Doral primarily to retail pharmacies and hospitals.
International sales of our products are immaterial.
48
Table of Contents
QUESTCOR PHARMACEUTICALS, INC.
NOTES TO CONSOLIDATED FINANCIAL STATEMENTS—(Continued)
Net Sales
We record net sales after establishing reserves for the following:
| • | Medicaid rebates; |
| • | Tricare retail program rebates; |
| • | Chargebacks due to other government programs; |
| • | Questcor-sponsored co-pay assistance programs; and |
| • | Other deductions such as payment discounts. |
We currently provide our products to Medicaid participants under an agreement with the Center for Medicare and Medicaid Services, or CMS. Under this agreement, states are eligible to receive rebates from us for Medicaid patients in accordance with CMS regulations. States typically provide us with rebate invoices for their reimbursements between sixty to ninety days after the end of the calendar quarter in which our products were provided. We estimate the end of period liability and the sales reserve needed for these Medicaid rebates based on the following multi-step process:
| • | Using a predictive model, we review national Medicaid statistics as well as internal information received from the Acthar reimbursement support center and from CuraScript SP for the most recent completed quarter to develop an estimate of future Medicaid rebate invoices that we expect to receive for the most recently completed quarter. This includes an estimate for both future Medicaid Managed Care and Medicaid Fee for Service rebate invoices. |
| • | We review the Medicaid rebate invoices received during the last 90 days and compare those invoices to the reserve that we had previously set at the end of the prior quarter. Based on this comparison and using the predictive model, which is updated quarterly, we estimate the remaining liability that we believe is still outstanding for periods prior to the most recently completed quarter. |
| • | Based on estimated end-of-quarter inventory held at CuraScript SD, all specialty pharmacies and hospitals, we calculate the expected future rebate liability for that portion of the inventory which we will eventually use to fill prescriptions for Medicaid patients. |
Using a similar process, we estimate the end of period liability and the sales reserve needed for Tricare program rebates and chargebacks from other government programs.
We also sponsor co-pay assistance programs for Acthar patients which are administered by NORD and the Chronic Disease Fund. We account for these payments as a reduction to our revenue.
Our resulting total sales reserve for the quarter includes the sum of the Medicaid sales reserve, the Tricare sales reserve, the chargeback sales reserve, co-pay assistance payments, and payment discounts provided.
Significant judgment is inherent in the selection of assumptions and the interpretation of historical experience as well as the identification of external and internal factors affecting the estimate of our reserves for Medicaid rebates and other government program rebates and chargebacks. We believe that the assumptions used to estimate these sales reserves are reasonable considering known facts and circumstances. However, our Medicaid rebates and other government program rebates and chargebacks could differ significantly from our estimates because of unanticipated changes in prescription trends or patterns in the states’ submissions of Medicaid claims, adjustments to the amount of product in the distribution channel, or if our estimate of the number of Medicaid patients with IS and MS are incorrect. If actual Medicaid rebates, or other government program rebates and chargebacks are significantly different from our estimates, we would account for such differences in the period in which they become known. If actual future payments for such reserves exceed the estimates we made at the time of sale, our financial position, results of operations and cash flows may be negatively impacted.
Medicaid Rebates and the New National Health Care Legislation
In March 2010, Congress passed, and the President signed into law, health care legislation entitled the Patient Protection and Affordable Care Act of 2010 and the Health Care and Education Affordability Reconciliation Act of 2010, and subsequent changes passed during the third quarter of 2010, which we refer to collectively as the Healthcare Reform Acts. The Healthcare Reform Acts contain a number of provisions that have impacted, both positively and negatively, our financial position, results of operations and cash flows. The provisions of the Healthcare Reform Acts have reduced our rebate provided to states for prescriptions filled for Medicaid patients to 100% of the AMP, which approximates the amount we charge to CuraScript
49
Table of Contents
QUESTCOR PHARMACEUTICALS, INC.
NOTES TO CONSOLIDATED FINANCIAL STATEMENTS—(Continued)
SD. Before the passage of the Healthcare Reform Acts, the formula used to calculate the per vial rebate required us to rebate 110% of our AMP for Acthar. Effective March 23, 2010, the Healthcare Reform Acts extended required Medicaid rebates to Medicaid Managed Care plans. Medicaid Managed Care plans provide for the delivery of Medicaid health benefits and additional services through an arrangement between a state Medicaid agency and managed care organizations. Our provision for expected Medicaid rebate liability and our quarterly sales reserves have included an estimate for Medicaid Managed Care usage since March 23, 2010. We have reserved $8.2 million for expected Medicaid Managed Care rebates since March 23, 2010. We have begun to receive Medicaid Managed Care rebate invoices and expect to receive additional rebate invoices as state Medicaid agencies complete the implementation of their internal invoice processing systems.
Other Impacts from the National Health Care Legislation
In addition to the aforementioned impact to our required Medicaid rebates, the Healthcare Reform Acts contain a number of provisions that we expect to continue to impact, both positively and negatively, our financial position, results of operations and cash flows.
| • | Positive Impact. The Healthcare Reform Acts contain provisions that create a national high-risk insurance pool, temporarily extend health coverage to individuals with pre-existing medical conditions, prohibit the denial of health coverage to children with pre-existing conditions, prohibit the denial of health coverage to adults with pre-existing conditions and place limits on insurers with respect to lifetime and annual caps on health coverage, and increase the number of patients with private insurance. |
| • | Negative Impact. The Healthcare Reform Acts contain the following provisions that we have identified as having a negative or potential negative impact on our overall financial position, results of operations and cash flows: |
| • | Effective March 23, 2010, Medicaid managed care programs became eligible for drug rebates. This expanded eligibility affected our rebate liability for those state entities which had Medicaid managed care programs, but had not previously taken legislative action at the state level to permit drugs provided to Medicaid managed care patients to be eligible for Medicaid rebates (approximately 28 states). |
| • | Effective January 1, 2011, pharmaceutical companies, including Questcor, must provide rebates to cover a portion of the Medicare Part D “donut hole,” which is the gap between Medicare funding and Medicare recipient’s drug deductibles. Approximately 25% of our sales for MS are to Medicare insureds. We estimate our obligation could be as much as $1,800 per Medicare insured per year. At current sales levels, we estimate this obligation would be less than $0.5 million and that it will be incurred in the first quarter of each year as the deductibles for Medicaid recipients are re-set at the beginning of the year. |
| • | Effective January 1, 2011, the U.S. Federal government will allocate an annual fee among manufacturers of branded prescription drugs based on market share, in the aggregate, for specified government programs. The Healthcare Reform Acts determine an individual manufacturer’s market share as the ratio of its aggregate sales of branded prescription drugs during the preceding calendar year as a percentage of the aggregate branded prescription drug sales for all covered manufacturers. |
| • | We expect the number of Medicaid patients to increase gradually through 2014. We further expect this expansion more likely to impact the number of adults in Medicaid because many states have already set their eligibility criteria for children at or above the level designated in the Healthcare Reform Acts. An increase in the proportion of patients who receive Acthar and who are covered by Medicaid could adversely affect our net sales. |
Many of the provisions of the Healthcare Reform Acts require rulemaking action by governmental agencies to implement. As various agencies implement these rules and regulations, our business may be negatively impacted other than as described above. In addition, Congress and the President may make additional refinements to the Healthcare Reform Acts which may have an additional, potential negative impact on our overall financial position, results of operations and cash flows. At this time, we cannot predict the full impact of the Healthcare Reform Acts, or the timing and impact of any future rules or regulations promulgated to implement the Healthcare Reform Acts. It is possible that the Healthcare Reform Acts and related rulemaking actions may have an overall negative effect on our net sales over time; however, at this time, we cannot determine the timing and magnitude of various positive and negative effects upon our business.
TRICARE Retail Pharmacy Programs
The Department of Defense, or DoD, Tricare Retail Pharmacy program became effective on May 26, 2009, pursuant to section 703 of the National Defense Authorization Act of 2008. This program and its regulations require manufacturers to pay
50
Table of Contents
QUESTCOR PHARMACEUTICALS, INC.
NOTES TO CONSOLIDATED FINANCIAL STATEMENTS—(Continued)
rebates, retroactive to January 28, 2008, to the DoD on products distributed to Tricare beneficiaries through retail pharmacies. The regulation further requires that pharmaceutical products paid for by the DoD through the Tricare Retail Pharmacy program be subject to the Federal Ceiling Price program, which requires manufacturers to provide the DoD with a refund on pharmaceutical products utilized through the Tricare Retail Pharmacy program. As a result, we established a sales reserve of $3.5 million for Tricare rebates as of the year ended December 31, 2009 which covered 100% of our estimated liability for the time period January 28, 2008 through December 31, 2009.
Effective January 1, 2010, we entered into a new pricing agreement with the Veterans Administration, resulting in a rebate for pharmaceutical products utilized through the Tricare Retail Pharmacy program during 2010 of $5,670 per vial, or a reduction of $14,865 from the previous rebates of $20,535. As a result, we recorded sales reserves of $1.2 million for the year ended December 31, 2010, for which we received invoices for $0.6 million
Government Chargebacks
We permit certain other government-supported entities, such as those covered by our contract with the Veterans Administration or eligible Public Health Service, or PHS, 340(B) entities, to purchase Acthar from CuraScript SD based on a contractual amount. Because our payment terms with CuraScript SD are approximately 30 to 45 days, we include actual chargebacks taken plus an estimate applied to the units in channel when estimating the sales reserve related to government chargebacks. Sales to the Veterans Administration and PHS 340(B) entities are generally immaterial to our financial position as a whole.
Co-Pay Assistance Programs
We sponsor co-pay assistance programs for Acthar patients which are administered by NORD and the Chronic Disease Fund. We account for these co-pay assistance program payments as a reduction to our revenue.
Total Sales-related Reserves
At December 31, 2010 and 2009 sales-related reserves included in the accompanying Consolidated Balance Sheets were as follows (in thousands):
| Years Ended December 31, | ||||||||
| 2010 | 2009 | |||||||
| Medicaid rebates |
$ | 17,384 | $ | 11,070 | ||||
| Tricare rebates |
4,125 | 3,530 | ||||||
| Government chargebacks |
2 | 322 | ||||||
| Total |
$ | 21,511 | $ | 14,922 | ||||
Product Sales Returns
On a limited basis, we generally authorize Acthar exchanges for expiring and expired product in accordance with our stated return policy, which allows CuraScript SD to return product within one month of its expiration date and for a period up to three months after such product has reached its expiration date. We exchange returns for replacement product and we include in the cost of sales the estimated costs for such exchanges, which include actual product material costs and related shipping charges. Product exchanges have been insignificant since we began utilizing the services of CuraScript SD to distribute Acthar.
Stock-Based Compensation
We recognize compensation expense for all stock-based awards made to employees and directors. The fair value of stock-based awards is estimated at grant date using an option pricing model and the portion that is ultimately expected to vest is recognized as compensation cost over the requisite service period.
Since stock-based compensation is recognized only for those awards that are ultimately expected to vest, we have applied an estimated forfeiture rate to unvested awards for the purpose of calculating compensation cost. These estimates will be revised, if necessary, in future periods if actual forfeitures differ from estimates. Changes in forfeiture estimates impact compensation cost in the period in which the change in estimate occurs.
We use the Black-Scholes option-pricing model to estimate the fair value of stock-based awards. The determination of fair value using the Black-Scholes option-pricing model is affected by our stock price as well as assumptions regarding a number of
51
Table of Contents
QUESTCOR PHARMACEUTICALS, INC.
NOTES TO CONSOLIDATED FINANCIAL STATEMENTS—(Continued)
complex and subjective variables, including expected stock price volatility, risk-free interest rate, expected dividends and projected employee stock option behaviors. We estimate the expected term based on the contractual term of the awards and employee’s exercise and expected post-vesting termination behavior.
Additionally, we are required to disclose in our consolidated statement of cash flows the income tax effects resulting from stock-based payment arrangements. We adopted the simplified method to calculate the beginning balance of the additional paid-in capital, or APIC, pool of excess tax benefits, and to determine the subsequent effect on the APIC pool and consolidated statements of cash flows of the tax effects of employee share-based compensation awards.
At December 31, 2010, there was $7.2 million of total unrecognized compensation cost related to non-vested stock options, which is expected to be recognized over a remaining weighted average vesting period of approximately 2.7 years.
Our stock-based compensation plans are discussed further in Note 5. Preferred Stock and Shareholders’ Equity.
Stock Repurchases
The Company accounts for common stock repurchases by charging the cost of shares acquired to the common stock account in the Consolidated Statements of Preferred Stock and Shareholders’ Equity.
Net Income Per Share
Basic net income per share applicable to common shareholders is computed by dividing the net income for the period by the weighted average number of common shares outstanding during the period. Diluted net income per share is computed by dividing the net income for the period by the weighted average number of common and common equivalents shares, such as stock options, restricted stock and warrants, outstanding during the period. Diluted earnings for our common shareholders per common stock considers the impact of potentially dilutive securities and excludes the impact of potential common shares related to our stock options, restricted stock and warrants in periods in which the option exercise or conversion price is greater than the average market price of our common stock during the period.
Basic net income per share also takes into consideration the two-class method. Under the two-class method, undistributed net income is allocated to common stock and participating securities based on their respective rights to share in dividends. Our Series A Preferred Stock was a participating security for periods prior to its repurchase on February 19, 2008 (see Note 5 — Preferred Stock and Shareholders’ Equity).
The following table presents the amounts used in computing basic and diluted net income per share applicable to common shareholders for the years ended December 31, 2010, 2009 and 2008 and the effect of dilutive potential common shares on the number of shares used in computing dilutive net income per share applicable to common shareholders. Diluted potential common shares resulting from the assumed exercise of outstanding stock options, restricted stock and warrants are determined based on the treasury stock method (in thousands, except per share amounts).
| Years Ended December 31, | ||||||||||||
| 2010 | 2009 | 2008 | ||||||||||
| Net income applicable to common shareholders |
$ | 35,071 | $ | 26,629 | $ | 35,265 | ||||||
| Shares used in computing net income per share applicable to common shareholders: |
||||||||||||
| Basic |
62,112 | 64,196 | 67,761 | |||||||||
| Effect of dilutive potential common shares: |
||||||||||||
| Stock options |
2,614 | 2,050 | 3,434 | |||||||||
| Restricted stock |
15 | 11 | 19 | |||||||||
| Warrants and placement agent unit options |
— | — | 136 | |||||||||
| Diluted |
64,741 | 66,257 | 71,350 | |||||||||
| Net income per share applicable to common shareholders: |
||||||||||||
| Basic |
$ | 0.56 | $ | 0.41 | $ | 0.52 | ||||||
| Diluted |
$ | 0.54 | $ | 0.40 | $ | 0.49 | ||||||
52
Table of Contents
QUESTCOR PHARMACEUTICALS, INC.
NOTES TO CONSOLIDATED FINANCIAL STATEMENTS—(Continued)
The following table presents the amounts excluded from the computation of diluted net income per share applicable to common shareholders for the years ended December 31, 2010, 2009 and 2008 as the inclusion of these securities would have been anti-dilutive (in thousands):
| Years Ended December 31, | ||||||||||||
| 2010 | 2009 | 2008 | ||||||||||
| Stock options |
309 | 2,548 | 1,093 | |||||||||
| Restricted stock |
— | — | 197 | |||||||||
| Series A Preferred Stock |
— | — | 294 | |||||||||
Segment Information
We have determined that we operate in one business segment.
Subsequent Events
We evaluated subsequent events that have occurred after December 31, 2010 and determined that there were no events or transactions occurring during this reporting period which require recognition or disclosure in our consolidated financial statements.
Recent Accounting Pronouncements
In April 2010, the FASB issued ASU 2010-17, which establishes a revenue recognition model for contingent consideration that is payable upon the achievement of an uncertain future event, referred to as a milestone. The scope of the ASU is limited to research or development arrangements and requires an entity to record the milestone payment in its entirety in the period received if the milestone meets all the necessary criteria to be considered substantive. However, entities would not be precluded from making an accounting policy election to apply another appropriate accounting policy that results in the deferral of some portion of the arrangement consideration. The ASU is effective for fiscal years (and interim periods within those fiscal years) beginning on or after June 15, 2010. We adopted this guidance in the third quarter of 2010. The adoption of this guidance did not have an impact on our consolidated financial statements.
2. Balance Sheet Details
Inventories
We state inventories, net of allowances, at the lower of cost (first-in, first-to-expire) or market. Inventories, net of allowances, at December 31, 2010 and 2009 consist of the following (in thousands):
| Years Ended December 31, | ||||||||
| 2010 | 2009 | |||||||
| Raw materials |
$ | 3,065 | $ | 2,921 | ||||
| Finished goods |
819 | 457 | ||||||
| Less allowance for excess and obsolete inventories |
(158 | ) | — | |||||
| $ | 3,726 | $ | 3,378 | |||||
Property and Equipment
Equipment and leasehold improvements and related accumulated depreciation and amortization are as following (in thousands):
| Years Ended December 31, | ||||||||
| 2010 | 2009 | |||||||
| Laboratory equipment |
$ | 8 | $ | 8 | ||||
| Manufacturing equipment |
692 | 680 | ||||||
| Office equipment, furniture and fixtures |
1,971 | 1,282 | ||||||
| Leasehold improvements |
420 | 408 | ||||||
| 3,091 | 2,378 | |||||||
| Less accumulated depreciation and amortization |
(2,219 | ) | (1,971 | ) | ||||
| $ | 872 | $ | 407 | |||||
Total depreciation and amortization expense amounted to $0.2 million for all years ended December 31, 2010, 2009 and 2008.
53
Table of Contents
QUESTCOR PHARMACEUTICALS, INC.
NOTES TO CONSOLIDATED FINANCIAL STATEMENTS—(Continued)
3. Short-Term Investments and Fair Value Measurements
A summary of cash equivalents and short-term investments, classified as available-for-sale, and carried at fair value is as follows (in thousands):
| December 31, 2010 |
Amortized Cost |
Gross Unrealized Gain |
Gross Unrealized (Loss) |
Estimated Fair Value |
||||||||||||
| Cash equivalents |
$ | 22,258 | $ | — | $ | — | $ | 22,258 | ||||||||
| Short-term investments: |
||||||||||||||||
| Certificates of deposit |
$ | 9,080 | $ | 39 | $ | (4 | ) | $ | 9,115 | |||||||
| Corporate bonds |
15,427 | 9 | (5 | ) | 15,431 | |||||||||||
| U.S. Government-sponsored enterprises |
41,983 | 12 | (27 | ) | 41,968 | |||||||||||
| Municipal bonds |
6,808 | 3 | (1 | ) | 6,810 | |||||||||||
| $ | 73,298 | $ | 63 | $ | (37 | ) | $ | 73,324 | ||||||||
| December 31, 2009 |
||||||||||||||||
| Cash equivalents |
$ | 34,445 | $ | — | $ | — | $ | 34,445 | ||||||||
| Short-term investments: |
||||||||||||||||
| Certificates of deposit |
$ | 5,360 | $ | — | $ | (7 | ) | $ | 5,353 | |||||||
| Government-sponsored enterprises |
14,066 | 3 | (45 | ) | 14,024 | |||||||||||
| Municipal bonds |
10,474 | 40 | (13 | ) | 10,501 | |||||||||||
| $ | 29,900 | $ | 43 | $ | (65 | ) | $ | 29,878 | ||||||||
The amortized cost and fair value of available-for-sale securities at December 31, 2010, by contractual maturity, are as follows (in thousands):
| Amortized Cost |
Estimated
Fair Value |
|||||||
| Due in one year or less |
$ | 18,192 | $ | 18,186 | ||||
| Due after one through two years |
55,106 | 55,138 | ||||||
| Total available-for-sale securities |
$ | 73,298 | $ | 73,324 | ||||
The net realized gains on sales of available-for-sale investments were not significant for the years ended December 31, 2010, 2009 and 2008. As of December 31, 2010, the average contractual maturity of our short-term investments was approximately eighteen months.
Fair Value Measurements
We account for fair value measurements under Accounting Standards Codification 820 “Fair Value Measurements and Disclosures”, or ASC 820, which defines fair value as the exchange price that would be received for an asset or paid to transfer a liability (an exit price) in the principal or most advantageous market for the asset or liability in an orderly transaction between market participants at the measurement date. ASC 820 establishes a three-level fair value hierarchy that prioritizes the inputs used to measure fair value. This hierarchy requires entities to maximize the use of observable inputs and minimize the use of unobservable inputs. The three levels of inputs used to measure fair value are as follows:
| • | Level 1 – Quoted prices in active markets for identical assets or liabilities. |
| • | Level 2 – Observable inputs other than quoted prices included in Level 1, such as quoted prices for similar assets and liabilities in active markets; quoted prices for identical or similar assets and liabilities in markets that are not active; or other inputs that are observable or can be corroborated by observable market data. |
| • | Level 3 – Unobservable inputs that are supported by little or no market activity and that are significant to the fair value of the assets or liabilities. This includes certain pricing models, discounted cash flow methodologies and similar techniques that use significant unobservable inputs. |
We have segregated all assets and liabilities measured at fair value on a recurring basis (at least annually) into the most appropriate level within the fair value hierarchy based on the inputs used to determine the fair value at the measurement date in the table below. As of December 31, 2010, all of our assets and liabilities are valued using Level 1 inputs except for our short-term investments which are valued using Level 2 inputs.
54
Table of Contents
QUESTCOR PHARMACEUTICALS, INC.
NOTES TO CONSOLIDATED FINANCIAL STATEMENTS—(Continued)
Assets measured at fair value on a recurring basis are summarized below (in thousands):
| Basis of Fair Value Measurements | ||||||||||||||||
| Balance
at December 31, 2010 |
Level 1 | Level 2 | Level 3 | |||||||||||||
| Cash equivalents |
$ | 22,258 | $ | 22,258 | $ | — | $ | — | ||||||||
| Certificates of deposit |
9,115 | — | 9,115 | — | ||||||||||||
| Corporate bonds |
15,431 | — | 15,431 | — | ||||||||||||
| Government-sponsored enterprises |
41,968 | — | 41,968 | — | ||||||||||||
| Municipal bonds |
6,810 | — | 6,810 | — | ||||||||||||
| Total |
$ | 95,582 | $ | 22,258 | $ | 73,324 | $ | — | ||||||||
Investment securities are exposed to various risks, such as interest rate, market and credit. Due to the level of risk associated with certain investment securities and the level of uncertainty related to changes in the value of investment securities, it is possible that changes in these risk factors in the near term could have an adverse material impact on our results of operations or shareholders’ equity.
Certain assets and liabilities are measured at fair value on a nonrecurring basis; that is, the instruments are not measured at fair value on an ongoing basis but are subject to fair value adjustments only in certain circumstances (for example, when there is evidence of impairment). There were no assets or liabilities measured at fair value on a nonrecurring basis during the periods ended December 31, 2010 and 2009.
4. Purchased Technology and Goodwill
Purchased technology consists of the following (in thousands):
| Years Ended December 31, | ||||||||
| 2010 | 2009 | |||||||
| Purchased technology |
$ | 4,386 | $ | 4,386 | ||||
| Less accumulated amortization |
(1,312 | ) | (1,014 | ) | ||||
| $ | 3,074 | $ | 3,372 | |||||
Purchased technology at December 31, 2010 and 2009 consists of our acquisition costs for Doral. Amortization expense for purchased technology totaled $0.3 million for each of the years ended December 31, 2010, 2009 and 2008, respectively. As of December 31, 2010 and 2009, we determined that purchased technology was not impaired and will continue to monitor the carrying value of the remaining purchased technology through the annual impairment test.
Goodwill consists of the following (in thousands):
| Years Ended December 31, | ||||||||
| 2010 | 2009 | |||||||
| Goodwill |
$ | 1,023 | $ | 1,023 | ||||
| Less accumulated amortization |
(724 | ) | (724 | ) | ||||
| $ | 299 | $ | 299 | |||||
As of December 31, 2010 and 2009, we determined that goodwill was not impaired and will continue to monitor the carrying value of the remaining goodwill through the annual impairment test.
5. Preferred Stock and Shareholders’ Equity
Preferred Stock
Pursuant to our Amended and Restated Articles of Incorporation, or Articles of Incorporation, we are authorized to issue up to 7,500,000 shares of Preferred Stock in one or more series. Our Articles of Incorporation authorize the issuance of Preferred Stock in classes and the board of directors may designate and determine the voting rights, redemption rights, conversion rights and other rights relating to such class of Preferred Stock, and to issue such stock in either public or private transactions. As of December 31, 2007, we had outstanding 2,155,715 shares of Series A Preferred Stock. On February 19, 2008, we completed the repurchase of the outstanding 2,155,715 shares of Series A Preferred Stock for cash consideration of $10.3 million or $4.80 per share, the same price per preferred
55
Table of Contents
QUESTCOR PHARMACEUTICALS, INC.
NOTES TO CONSOLIDATED FINANCIAL STATEMENTS—(Continued)
share as the closing price per share of our common stock on February 19, 2008. The Series A Preferred Stock had a carrying value of $5.1 million. We account for the $5.2 million difference between the $10.3 million repurchase payment and the $5.1 million balance sheet carrying value as a deemed dividend and reduced our net income in the determination of net income applicable to common shareholders in the accompanying Consolidated Statement of Income for the year ended December 31, 2008.
At December 31, 2010 and 2009, we had 7,500,000 shares of Preferred Stock authorized, no par value, and no shares of Preferred Stock were issued and outstanding.
Common Stock
The holders of outstanding shares of our common stock are entitled to receive ratably such dividends, if any, as may be declared from time to time by the board of directors out of assets legally available therefore, subject to the payment of preferential and participating dividends with respect to any preferred stock that may be outstanding. In the event of our liquidation, dissolution and winding-up of our business, the holders of our outstanding common stock are entitled to share ratably in all assets available for distribution to the common stock shareholders after payment of all our liabilities, subject to the rights of any outstanding shares of preferred stock. The holders of our common stock are entitled to one vote per share.
On February 29, 2008, our board of directors approved a stock repurchase program that provides for the repurchase of up to 7 million of our common shares. On May 29, 2009, our board of directors increased the stock repurchase program by an additional 6.5 million shares. Stock repurchases under this program may be made through either open market or privately negotiated transactions in accordance with all applicable laws, rules and regulations. Through December 31, 2010, we had repurchased 8.4 million common shares under our stock repurchase program for $36.7 million, at an average price of $4.39 per share. There were no repurchases under the program during the year ended December 31, 2010.
During the year ended December 31, 2008, 348,228 shares of our common stock were issued upon the cashless net exercise of 475,248 warrants in accordance with the terms of the warrants. At December 31, 2010 and 2009, no warrants were issued and outstanding.
Employee Stock Purchase Plan
Our 2003 Employee Stock Purchase Plan, or ESPP, provides our employees the opportunity to purchase our common stock through accumulated payroll deductions. The ESPP was originally adopted by the Board of Directors on January 24, 2003 and approved by our shareholders on May 12, 2003. It was amended by the Board of Directors on February 27, 2006 and our shareholders on May 18, 2006.
In May 2008, our shareholders approved an amendment to the ESPP to increase the number of shares authorized for issuance under the ESPP by 500,000 shares. This amendment brought the total shares available for issuance under the ESPP, including shares previously issued, to 2,900,000 shares. In April 2008, our Board further amended the ESPP to reduce the maximum offering period under the ESPP from 27 months to 6 months and to no longer allow employees the ability to increase their payroll contributions to the ESPP during an offering period.
Our Board, as Administrator of the ESPP, has also made administrative changes to how the ESPP operates. Our Board has discretionary authority to determine the duration of offering periods subject to the maximum offering period permitted under the ESPP. While the ESPP was administered to provide for 12 month offering periods in 2007 and part of 2008, the Board reduced the offering period from 12 months to 3 months effective September 1, 2008.
The purpose of the ESPP is to provide all of our employees with an opportunity to purchase our common stock through accumulated payroll deductions. Any person who is employed by us on the offering date, for at least 20 hours per week and more than five months in any calendar year, is eligible to participate in the ESPP. Under the ESPP, eligible employees could have up to 15% of their earnings withheld, subject to certain maximums, to be used to purchase shares of our common stock. Generally, the purchase price per share at which shares are sold under the ESPP is the lower of 85% of the fair market value of a share of our common stock on the first day of each offering period or 85% of the fair market value of a share of our common stock on the last day of each three month purchase period. During 2010, 2009 and 2008, 149,127,145,488 and 803,616 shares, respectively, had been issued to participants.
56
Table of Contents
QUESTCOR PHARMACEUTICALS, INC.
NOTES TO CONSOLIDATED FINANCIAL STATEMENTS—(Continued)
ESPP activity during 2010 was as follows:
| Number of Shares |
Weighted- Average Fair Value |
|||||||
| Available at December 31, 2009 |
413,887 | |||||||
| Purchases |
(149,127 | ) | $ | 4.91 | ||||
| Available at December 31, 2010 |
264,760 | |||||||
We use the Black-Scholes option–pricing model to estimate the fair value of the option element related to employees’ purchases under the ESPP included in the total share-based compensation expense recorded for the years ended December 31, 2010, 2009 and 2008. The determination of fair value using the Black-Scholes option-pricing model is affected by our stock price as well as similar assumptions used to value our stock-based awards.
| • | Volatility is based on the historical volatility of the Company’s common stock. During 2010, we reviewed our methodology for calculating volatility and, in doing so we shortened the look-back period to represent the time period following the implementation of our Acthar-centric pricing strategy in late 2007. This resulted in a lower volatility which, we believe, is a better representation of our current market condition. |
| • | Interest rate is based on the U.S. Treasury yield. |
| • | Expected term represents the life of the option element. |
| • | Expected dividend yield is zero, as we are currently not paying dividends. |
| Years Ended December 31, | ||||||||||||
| 2010 | 2009 | 2008 | ||||||||||
| Weighted average volatility |
54 | % | 71 | % | 79 | % | ||||||
| Risk-free interest rate |
0.1 | % | 0.1-0.3 | % | 1.0-2.8 | % | ||||||
| Expected term (in years) |
0.25 | 0.25 | 0.30-0.74 | |||||||||
| Expected dividend yield |
— | — | — | |||||||||
Stock Compensation Plans
Stock Options
We have options outstanding to purchase shares of our common stock under the following plans:
| • | 2006 Equity Incentive Award Plan that provides for the grant of equity incentives to employees, members of our board of directors, and consultants; |
| • | 1992 Employee Stock Option Plan that provided for the grant of stock options to employees, members of our board of directors, and consultants; and |
| • | 2004 Non-Employee Directors’ Equity Incentive Plan that provides for the grant of equity incentives to non-employee members of our board of directors. |
In May 2006, our shareholders approved the adoption of the 2006 Equity Incentive Award Plan. Upon the adoption of the 2006 Equity Incentive Award Plan, we ceased grants under our 1992 Employee Stock Option Plan. The 2006 Equity Incentive Award Plan provides for the grant of incentive stock options, non-qualified stock options, restricted stock grants, unrestricted stock grants, stock appreciation rights, restricted stock units and dividend equivalents. Equity incentives under the 2006 Equity Incentive Award Plan and the 1992 Employee Stock Option Plan generally include four year vesting periods, an exercise price that equals the fair market value of our common stock on the date of grant, and maximum terms of ten years. Restricted stock awards entitle the recipient to full dividend and voting rights. Non-vested shares are restricted as to disposition and subject to forfeiture under certain circumstances. The aggregate number of shares of common stock authorized for issuance under the 2006 Equity Incentive Award Plan is 6,250,000 shares.
Our 2004 Non-Employee Directors’ Equity Incentive Plan provides for the granting of 25,000 stock options to purchase common stock upon appointment as a non-employee director and 15,000 stock options each January thereafter for continuing service
57
Table of Contents
QUESTCOR PHARMACEUTICALS, INC.
NOTES TO CONSOLIDATED FINANCIAL STATEMENTS—(Continued)
upon reappointment. Such stock option grants vest over four years. In addition, 10,000 stock options are granted to members of one or more committees of the board of directors and an additional 7,500 stock options to the chairs of one or more committees. Such stock option grants are fully vested at the time of grant. As originally approved by shareholders, such option grants had an option exercise price equal to 85% of the fair market value on the date of grant. However, in May 2004, our board of directors approved an amendment to the 2004 Non-Employee Directors’ Equity Incentive Plan to provide that all option grants be made at an exercise price equal to 100% of the fair market value of our common stock on the date of grant. The maximum term of the stock options granted is ten years. Under the terms of the 2004 Non- Employee Directors’ Equity Incentive Plan, 1,250,000 shares of our common stock were authorized for grant.
As of December 31, 2010, a total of 3,716,678 shares of common stock were reserved for issuance under the both the 2006 Equity Incentive Award Plan and the 2004 Non-Employee Directors’ Equity Incentive Plan. A summary of our stock option activity and related information during 2010 follows:
| Stock Options |
Weighted- Average Exercise Price |
Weighted- Average Remaining Contractual Term |
Aggregate Intrinsic Value |
|||||||||||||
| (In years) | (In thousands) | |||||||||||||||
| Outstanding at December 31, 2009 |
5,489,322 | $ | 3.36 | |||||||||||||
| Granted |
1,794,150 | 7.15 | ||||||||||||||
| Exercised |
(517,936 | ) | 2.37 | |||||||||||||
| Forfeited or expired |
(479,100 | ) | 4.66 | |||||||||||||
| Outstanding at December 31, 2010 |
6,286,436 | $ | 4.43 | 7.12 | $ | 67,485 | ||||||||||
| Options vested and expected to vest at December 31, 2010 |
5,966,775 | $ | 4.27 | 7.02 | $ | 65,007 | ||||||||||
| Exercisable at December 31, 2010 |
3,667,378 | $ | 2.96 | 5.98 | $ | 44,752 | ||||||||||
Aggregate intrinsic value is the sum of the amounts by which the quoted market price of our stock exceeded the exercise price of the stock options at December 31, 2010, 2009 and 2008 for those stock options for which the quoted market price was in excess of the exercise price (“in-the-money options”). The total intrinsic value of stock options exercised was $3.7 million, $2.6 million and $13.1 million for the years ended December 31, 2010, 2009 and 2008, respectively.
Restricted Stock Awards
During the years ended December 31, 2010, 2009 and 2008, we granted a total of 30,000 shares of restricted common stock, respectively, to employees under the 2006 Equity Incentive Award Plan. Restrictions on these shares will expire and related charges are being amortized as earned over the vesting period of four years.
We base the amount of unearned compensation recorded on the market value of the shares on the date of issuance. Expenses related to the vesting of restricted stock were $50,000, $11,000 and $37,000 for the years ended December 31, 2010, 2009 and 2008, respectively. At December 31, 2010, there was approximately $96,000 of unamortized compensation cost related to restricted stock awards, which we expect to recognize ratably over the vesting period of four years.
Restricted stock activity during 2010 was as follows:
| Number of Shares |
Weighted- Average Fair Value |
|||||||
| Non-vested shares at December 31, 2009 |
14,201 | $ | 1.69 | |||||
| Granted |
30,000 | $ | 5.02 | |||||
| Vested |
(14,201 | ) | $ | 1.69 | ||||
| Forfeited or expired |
— | — | ||||||
| Non-vested shares at December 31, 2010 |
30,000 | $ | 5.02 | |||||
Fair Value of Stock-Based Awards
The weighted average fair value of equity instruments granted during 2010, 2009 and 2008 was as follows:
| Weighted Average Fair Value | ||||||||||||
| 2010 | 2009 | 2008 | ||||||||||
| Stock options |
$ | 7.15 | $ | 5.45 | $ | 5.27 | ||||||
| ESPP Purchases |
4.91 | 3.76 | 0.61 | |||||||||
| Restricted Stock |
5.02 | — | 5.10 | |||||||||
58
Table of Contents
QUESTCOR PHARMACEUTICALS, INC.
NOTES TO CONSOLIDATED FINANCIAL STATEMENTS—(Continued)
As of December 31, 2010, $7.2 million of total unrecognized compensation cost related to unvested grants of stock options and awards of restricted stock is expected to be recognized over a weighted-average period of 2.7 years.
We use the Black-Scholes option–pricing model to estimate the fair value of stock-based awards. The determination of fair value using the Black-Scholes option-pricing model is affected by our stock price as well as assumptions regarding a number of complex and subjective variables, including expected stock price volatility, risk-free interest rate, expected dividends and projected employee stock option exercise behaviors.
| • | Volatility is based on the historical volatility of our common stock. During 2010, we reviewed our methodology for calculating volatility and, in doing so we shortened the look-back period to represent the time period following the implementation of our Acthar-centric pricing strategy in late 2007. This resulted in a lower volatility which, we believe, is a better representation of our current market condition. |
| • | Interest rate is based on the U.S. Treasury yield. |
| • | Expected term was based on the historical experience of similar awards, giving consideration to the contractual terms of the share-based awards, vesting schedules and the expectations of future employee behavior. |
| • | Expected dividend yield is zero, as we are currently not paying dividends. |
The total number of stock option awards expected to vest is adjusted by estimated forfeiture rates. The weighted average assumptions used for the years ended December 31, 2010, 2009 and 2008 and the resulting estimates of weighted average fair value per share of options granted during those periods are as follows:
| Years Ended December 31, | ||||||||||||
| 2010 | 2009 | 2008 | ||||||||||
| Volatility |
65 | % | 83 | % | 86 | % | ||||||
| Interest rate |
1.0-2.1 | % | 1.9-2.2 | % | 1.3-3.2 | % | ||||||
| Expected term (in years) |
4.4 | 4.3 | 4.2-4.4 | |||||||||
| Expected dividend yield |
— | — | — | |||||||||
Stock-based compensation expense related to employees and non-employee members of the board of directors has been included in the accompanying Consolidated Statements of Income for the years ended December 31, 2010, 2009 and 2008 as follows (in thousands):
| Years Ended December 31, | ||||||||||||
| 2010 | 2009 | 2008 | ||||||||||
| Selling, general and administrative |
$ | 2,784 | $ | 2,418 | $ | 3,351 | ||||||
| Research and development |
955 | 623 | 590 | |||||||||
| Total stock-based compensation expense |
3,739 | 3,041 | 3,941 | |||||||||
| Tax benefit related to stock-based compensation expense |
(1,142 | ) | (780 | ) | (483 | ) | ||||||
| Net effect on net income |
$ | 2,597 | $ | 2,261 | $ | 3,458 | ||||||
6. Indemnifications, Commitments and Contingencies
Indemnifications
As permitted under California law and in accordance with our Bylaws, we indemnify our officers and directors for certain events or occurrences while the officer or director is or was serving at our request in such capacity. The potential future indemnification limit is to the fullest extent permissible under California law; however, we have a director and officer insurance policy that limits our exposure and may enable us to recover a portion of any future amounts paid. We believe the fair value of these indemnification agreements in excess of applicable insurance coverage is minimal. Accordingly, we had no liabilities recorded for these agreements as of December 31, 2010 and 2009.
59
Table of Contents
QUESTCOR PHARMACEUTICALS, INC.
NOTES TO CONSOLIDATED FINANCIAL STATEMENTS—(Continued)
Employment Agreements
We have entered into employment agreements with our corporate officers that provide for, among other things, base compensation and/or other benefits in certain circumstances in the event of termination or a change in control. In addition, certain of the agreements provide for the accelerated vesting of outstanding unvested stock options upon a change in control.
Leases
We lease office facilities under various operating lease agreements, with remaining terms that extend to October 2014. We have also entered into automobile and office equipment leases, with remaining terms that extend to 2015. As of December 31, 2010, we have made approximately $65,000 in cash deposits related to operating leases. Provisions of the facilities leases provide for abatement of rent during certain periods and escalating rent payments during the term. Rent expense is recognized on a straight-line basis over the term of the lease. Accordingly, rent expense recognized in excess of rent paid is reflected as deferred rent. Rent expense on the facilities and equipment during 2010, 2009 and 2008 was $0.5 million, $1.1 million and $0.7 million, respectively.
Future annual minimum payments under operating leases are as follows (in thousands):
| Years Ending December 31, |
||||
| 2011 |
$ | 2,354 | ||
| 2012 |
2,034 | |||
| 2013 |
1,119 | |||
| 2014 |
194 | |||
| 2015 |
127 | |||
| Thereafter |
— | |||
| $ | 5,828 | |||
| (1) | As of December 31, 2010 we leased four buildings with lease terms expiring in 2011, 2012, 2014 and 2015, and subleased additional office space with a term expiring in 2011. We have also entered into various office equipment leases and automobile leases, the terms of which are typically three years. Annual rent expense for all of our facilities, equipment and automobile leases for the year ended December 31, 2010 was approximately $1.5 million. |
| • | We lease 23,000 square feet of office and warehouse space in Union City, California under a lease agreement that expires in March 2011. Our Commercial Development, Sales and Marketing, Medical Affairs, Contract Manufacturing, Quality Control and Quality Assurance departments occupy this facility. In connection with the expiration of this lease, these functions are being moved to the Hayward, California facility. |
| • | We lease 30,000 square feet of laboratory and office space in Hayward, California under a master lease that expires in November 2012. Effective November 2010, we subleased 9,000 square feet of the facility through November 2012 and effective September 2010, we subleased 4,500 square feet on a month-to-month basis. We will occupy the remainder of the lease following the expiration of the Union City lease in March 2011. |
| • | We lease 6,200 square feet of office space in Ellicott City, Maryland under a lease agreement that expires in October 2015. Our Product Development and Regulatory Affairs departments occupy this facility. |
| • | We lease 4,400 square feet of office space in Anaheim, California under a lease agreement that expires in October 2014. Our Executive, Finance and Administration departments occupy this facility, and serves as our corporate headquarters. |
Contingencies
From time to time, we may become involved in claims and other legal matters arising in the ordinary course of business. We are currently not aware of any claims or other legal matters which we believe would have a material adverse effect on the financial position, results of operations or cash flows of the Company.
60
Table of Contents
QUESTCOR PHARMACEUTICALS, INC.
NOTES TO CONSOLIDATED FINANCIAL STATEMENTS—(Continued)
Commitments
We have an agreement with BioVectra dcl to produce the active pharmaceutical ingredient used in Acthar. The agreement requires the production of a minimum number of kilograms of the Acthar active pharmaceutical ingredient during the term. The agreement terminated on December 31, 2007 and was extended in January 2008 through December 2010. During the fiscal year ended December 31, 2010, we entered into a new agreement with BioVectra, which terminates 12 months after written notice by either party. Under the terms of the new agreement, we are obligated to purchase a minimum amount of Acthar active pharmaceutical ingredient and will not purchase in excess of a certain amount of Acthar API per year.
7. Income Taxes
The components of the income tax expense are as follows (in thousands):
| Years Ended December 31, | ||||||||||||
| 2010 | 2009 | 2008 | ||||||||||
| Current: |
||||||||||||
| Federal |
$ | 18,908 | $ | 14,102 | $ | 10,766 | ||||||
| State |
1,450 | 1,690 | 2,783 | |||||||||
| $ | 20,358 | 15,792 | 13,549 | |||||||||
| Deferred: |
||||||||||||
| Federal |
(2,155 | ) | (813 | ) | 5,327 | |||||||
| State |
1,099 | 523 | (678 | ) | ||||||||
| (1,056 | ) | (290 | ) | 4,649 | ||||||||
| Total income tax expense |
$ | 19,302 | $ | 15,502 | $ | 18,198 | ||||||
For the years ended December 31, 2010 and 2009, we realized tax benefits from the exercise of non-qualified stock options and early dispositions of stock acquired by employees through the exercise of incentive stock options and purchases under the employee stock purchase plan. These tax benefits resulted from tax deductions, including amounts which were in excess of amounts previously recognized as expense (“excess tax benefits”). These tax benefits reduced current income taxes payable and deferred income taxes, and the excess tax benefits of $1.3 million in 2010, $0.8 million in 2009 and $4.9 million in 2008 were recorded as an increase in shareholders’ equity in our Consolidated Statement of Preferred Stock and Shareholders’ Equity.
A reconciliation between the U.S. statutory tax rate and our effective tax rate is as follows:
| Years Ended December 31, | ||||||||||||
| 2010 | 2009 | 2008 | ||||||||||
| Tax at U.S. statutory rate |
35.0 | % | 35.0 | % | 35.0 | % | ||||||
| State income taxes, net |
2.1 | 3.4 | 3.6 | |||||||||
| Change in valuation allowance |
1.7 | 0.0 | (8.8 | ) | ||||||||
| Other |
(3.3 | ) | (1.6 | ) | 1.2 | |||||||
| Effective tax rate |
35.5 | % | 36.8 | % | 31.0 | % | ||||||
As a result of our positive earnings trend commencing in 2007, we reversed our valuation allowances for deferred tax assets by $5.2 million in 2008, and recorded a corresponding income tax benefit which reduced our income tax expense in 2008. Because of the effect of California legislation relating to apportionment of income, the company does not expect to realize certain deferred tax benefits, and it therefore recorded a valuation allowance against those assets in 2010.
Deferred income taxes reflect the net tax effects of temporary differences between the carrying amounts of assets and liabilities for financial reporting and the amount used for income tax purposes, as well as net operating loss and tax credit carryforwards. Significant components of our deferred tax assets are as follows (in thousands):
| Years Ended December 31, | ||||||||
| 2010 | 2009 | |||||||
| Deferred tax assets: |
||||||||
| Net operating loss carryforwards |
$ | 2,856 | $ | 2,868 | ||||
| Research and development credits |
351 | 831 | ||||||
| Sales-related reserves |
7,553 | 5,577 | ||||||
| Other, net |
2,757 | 2,296 | ||||||
| Total deferred tax assets |
13,517 | 11,572 | ||||||
| Valuation allowance |
(916 | ) | — | |||||
| Net deferred taxes |
$ | 12,601 | $ | 11,572 | ||||
61
Table of Contents
QUESTCOR PHARMACEUTICALS, INC.
NOTES TO CONSOLIDATED FINANCIAL STATEMENTS—(Continued)
We recognize valuation allowances on deferred tax assets reported if, based on the weight of the evidence, we believe that it is “more likely than not” that some or all of our deferred tax assets will not be realized. We evaluate deferred tax assets quarterly to assess the likelihood of realization, which is ultimately dependent upon our generating future taxable income. Changes in the valuation allowance based on our assessment will result in an income tax benefit if the valuation allowance is decreased and an income tax expense if the allowance is increased. There was no change to our valuation allowance for the year ended December 31, 2009. Our valuation allowance was increased by $0.9 million in 2010. This allowance was associated with our California deferred tax asset. In the fourth quarter of 2010, California enacted legislation that deferred the ability of corporations to utilize their California net operating losses. We intend to use the single sales factor methodology for California, which we expect to result in tax savings beginning in 2011. Because most of our sales are sourced outside of California, we do not expect to continue to pay significant income taxes in California. As a result, we anticipate that we will not be able to fully utilize our California deferred tax asset and, therefore, have established an allowance for the deferred tax asset.
At December 31, 2010, we had federal and state net operating loss carryforwards of $5.5 million and $16.0 million, respectively, and federal and California research and development tax credits of $0.4 million and $0, respectively. All federal net operating loss carryforwards are subject to annual limitations as a result of federal ownership change limitations, and will be available from 2011 through 2018, under those limitations. Of this amount, $1.5 million of federal net operating loss carryforwards and $0.2 million of research and development tax credits are available to reduce our 2011 taxable income.
The federal and state net operating loss carryforwards and the federal research and development credit carryforwards expire at various dates beginning in the years 2012 through 2018, if not utilized.
We account for income taxes under the Income Tax Topic of the FASB Accounting Standard Codification. As a result of implementing these provisions, we reversed certain fully reserved deferred tax assets related to uncertain tax benefits totaling $0.3 million and the related valuation allowance. We increased our unrecognized tax benefits by $0.3 million and $0.6 million for the years ended December 31, 2010 and 2009, respectively. A reconciliation of the beginning and ending amount of unrecognized tax benefits is as follows (in thousands):
| Years
Ended December 31, |
||||||||
| 2010 | 2009 | |||||||
| Balance at beginning of year |
$ | 922 | $ | 315 | ||||
| Increase of unrecognized tax benefits taken in prior years |
87 | 601 | ||||||
| Increase of unrecognized tax benefits related to current year |
234 | 6 | ||||||
| Balance at end of year |
$ | 1,243 | $ | 922 | ||||
The unrecognized tax benefits, if recognized in full, would reduce our income tax expense by $1.2 million and result in adjustments to other tax accounts, primarily deferred taxes. Our policy is to recognize interest and penalties accrued on any unrecognized tax benefits as a component of tax expense. At December 31, 2010 we have an accrual for interest and penalties for unrecognized tax benefits of $0.2 million in the Consolidated Statement of Income and $38,000 in the Consolidated Balance Sheet. As of December 31, 2010, our tax returns are subject to future examination in the U.S. federal and various state tax jurisdictions for tax years 1994 through 2009, due to net operating losses that are being carried forward.
8. Defined Contribution Plan
We have a defined-contribution savings plan under Section 401(k) of the Internal Revenue Code covering substantially all full-time U.S. employees. Participating employees may contribute up to 60% of their eligible compensation up to the annual Internal Revenue Service contribution limit. This plan allows for discretionary contributions by us. We did not match employee contributions during the years ended December 31, 2010 and 2009.
9. Quarterly Results of Operations (unaudited)
The following table sets forth a summary of our unaudited quarterly operating results for each of the last eight quarters in the period ended December 31, 2010. We have derived this data from our unaudited consolidated interim financial statements that, in our opinion, have been prepared on substantially the same basis as the audited financial statements contained elsewhere in this report and include all normal recurring adjustments necessary for a fair presentation of the financial information for the periods presented. These unaudited quarterly results should be read in conjunction with our financial statements and notes thereto included elsewhere in this report. The operating results in any quarter are not necessarily indicative of the results that may be expected for any future period (in thousands except earnings per share).
62
Table of Contents
QUESTCOR PHARMACEUTICALS, INC.
NOTES TO CONSOLIDATED FINANCIAL STATEMENTS—(Continued)
QUARTERLY FINANCIAL INFORMATION (UNAUDITED)
| Quarter Ended | ||||||||||||||||
| 12/31/10 | 09/30/10 | 06/30/10 | 03/31/10 | |||||||||||||
| Net sales(1) |
$ | 29,297 | $ | 31,274 | $ | 28,316 | $ | 26,244 | ||||||||
| Cost of sales |
1,723 | 2,292 | 2,000 | 1,998 | ||||||||||||
| Income tax expense |
4,527 | 5,423 | 5,109 | 4,242 | ||||||||||||
| Net income |
6,417 | 11,520 | 9,282 | 7,852 | ||||||||||||
| Net income applicable to common shareholders |
6,417 | 11,520 | 9,282 | 7,852 | ||||||||||||
| Net income per share applicable to common shareholders: |
||||||||||||||||
| Basic |
$ | 0.10 | $ | 0.19 | $ | 0.15 | $ | 0.13 | ||||||||
| Diluted |
$ | 0.10 | $ | 0.18 | $ | 0.14 | $ | 0.12 | ||||||||
| Quarter Ended | ||||||||||||||||
| 12/31/09 | 09/30/09 | 06/30/09 | 03/31/09 | |||||||||||||
| Net sales(2) |
$ | 25,905 | $ | 13,851 | $ | 25,266 | $ | 23,298 | ||||||||
| Cost of sales |
1,898 | 2,006 | 1,603 | 1,510 | ||||||||||||
| Income tax expense |
5,063 | 728 | 5,131 | 4,580 | ||||||||||||
| Net income |
8,421 | 1,223 | 9,311 | 7,674 | ||||||||||||
| Net income applicable to common shareholders |
8,421 | 1,223 | 9,311 | 7,674 | ||||||||||||
| Net income per share applicable to common shareholders: |
||||||||||||||||
| Basic |
$ | 0.13 | $ | 0.02 | $ | 0.14 | $ | 0.12 | ||||||||
| Diluted |
$ | 0.13 | $ | 0.02 | $ | 0.14 | $ | 0.11 | ||||||||
| (1) | Fourth quarter 2010 operating expenses increased by $4.6 million from the third quarter of 2010 due to the significant expansion of our MS sales force and costs associated with several major conferences and meetings held during the fourth quarter of 2010. |
| (2) | During the quarter ended September 30, 2009, we received higher than anticipated amounts of Medicaid rebates related to prior period Acthar usage, and we increased our rebate reserve which reduced net sales in the third quarter of 2009 by approximately $4.6 million. In addition, we recorded an additional rebate reserve which reduced net sales by $1.4 million in the quarter ended September 30, 2009 for rebates related to a health coverage program called Tricare. |
63
Table of Contents
QUESTCOR PHARMACEUTICALS, INC.
FINANCIAL STATEMENT SCHEDULES (ITEM 15(a)(2))
SCHEDULE II VALUATION AND QUALIFYING ACCOUNTS
Years Ended December 31, 2010, 2009 and 2008
| Balance at Beginning of Period |
Additions/ (Deductions) Charged to Income |
Deductions and Write-Offs |
Balance at End of Period |
|||||||||||||
| (In thousands) | ||||||||||||||||
| Reserves for uncollectible accounts |
||||||||||||||||
| December 31, 2010 |
$ | 77 | $ | 51 | $ | 103 | $ | 25 | ||||||||
| December 31, 2009 |
$ | 62 | $ | 114 | $ | 99 | $ | 77 | ||||||||
| December 31, 2008 |
$ | 57 | $ | 68 | $ | 63 | $ | 62 | ||||||||
| Reserves for cash discounts |
||||||||||||||||
| December 31, 2010 |
$ | 3 | $ | 13 | $ | 15 | $ | 1 | ||||||||
| December 31, 2009 |
$ | 1 | $ | 13 | $ | 11 | $ | 3 | ||||||||
| December 31, 2008 |
$ | 3 | $ | 17 | $ | 19 | $ | 1 | ||||||||
| Reserves for obsolete and excess inventories |
||||||||||||||||
| December 31, 2010 |
$ | — | $ | 158 | $ | — | $ | 158 | ||||||||
| December 31, 2009 |
$ | 29 | $ | 614 | $ | 643 | $ | — | ||||||||
| December 31, 2008 |
$ | 9 | $ | 20 | $ | — | $ | 29 | ||||||||
| Sales-related reserves |
||||||||||||||||
| December 31, 2010 |
$ | 14,922 | $ | 38,376 | $ | 31,787 | $ | 21,511 | ||||||||
| December 31, 2009 |
$ | 11,825 | $ | 49,900 | $ | 46,803 | $ | 14,922 | ||||||||
| December 31, 2008 |
$ | 8,176 | $ | 38,006 | $ | 34,357 | $ | 11,825 | ||||||||
All other financial statement schedules are omitted because the information described therein is not applicable, not required or is furnished in the financial statements or notes thereto.
64
Table of Contents
EXHIBIT INDEX
| Exhibit Number |
Description | |
| 2.1(1) |
Merger agreement entered into August 4, 1999, by and among Cyprus Pharmaceutical Corporation, a California corporation (“Parent”), Cyprus Acquisition Corporation, a Delaware corporation and a wholly owned subsidiary of Parent, and RiboGene, Inc., a Delaware corporation. | |
| 3.1(2) |
Amended and Restated Articles of Incorporation of the Company. | |
| 3.5(21) |
Amended and Restated Bylaws of Questcor Pharmaceuticals, Inc, dated as of October 20, 2009. | |
| 10.1(3) |
Forms of Incentive Stock Option and Non-statutory Stock Option. | |
| 10.2(4) |
1992 Employee Stock Option Plan, as amended.** | |
| 10.3(5) |
1993 Non-employee Directors’ Equity Incentive Plan, as amended and related form of Nonstatutory Stock Option.** | |
| 10.5(6) |
Asset Purchase Agreement dated July 27, 2001 between the Company and Aventis Pharmaceuticals Products, Inc.† | |
| 10.6(6) |
First Amendment to Asset Purchase Agreement dated January 29, 2002, between the Company and Aventis Pharmaceuticals Products, Inc.† | |
| 10.27(7) |
2004 Non-Employee Directors’ Equity Incentive Plan.** | |
| 10.30(8) |
Letter Agreement between the Company and Steve Cartt dated March 7, 2005.** | |
| 10.31(8) |
Letter Agreement between the Company and Steve Cartt dated March 8, 2005.** | |
| 10.40(9) |
Asset Purchase Agreement dated October 17, 2005 by and between Questcor Pharmaceuticals, Inc. and QOL Medical LLC. | |
| 10.44(10) |
Severance Letter Agreement between the Company and David Medeiros dated July 10, 2003.** | |
| 10.45(11) |
2006 Equity Incentive Award Plan.** | |
| 10.46(12) |
Form of Incentive Stock Option Agreement under the 2006 Equity Incentive Award Plan. | |
| 10.47(12) |
Form of Non-Qualified Stock Option Agreement under the 2006 Equity Incentive Award Plan. | |
| 10.48(12) |
Form of Restricted Stock Award Agreement under the 2006 Equity Incentive Award Plan. | |
| 10.58(13) |
Amended Change of Control Letter Agreement between the Company and Stephen L. Cartt dated February 13, 2007.** | |
| 10.63(13) |
Change of Control Letter Agreement between the Company and David J. Medeiros dated February 13, 2007.** | |
| 10.65(14) |
Form of Performance-Based Vesting Stock Option Agreement under the 2006 Equity Incentive Award Plan. | |
| 10.66(15) |
Severance Agreement between the Company and David J. Medeiros dated July 16, 2007.** | |
| 10.68(16) |
Form of Option Agreement under the 2004 Non-Employee Directors’ Equity Incentive Plan for Director Options. | |
| 10.69(16) |
Form of Option Agreement under the 2004 Non-Employee Directors’ Equity Incentive Plan for Committee Options. | |
| 10.70(17) |
Amended and Restated 2003 Employee Stock Purchase Plan.** | |
| 10.72(18) |
Stock Purchase Agreement, by and between the Company and Chaumiere Consultadoria & Servicos SDC Unipessoal L.D.A., dated August 13, 2008. | |
| 10.73(19) |
Stock Purchase Agreement, by and between the Company and Inverlochy Consultadoria & Servicos L.D.A., dated September 3, 2008. | |
| 10.74(20) |
Redemption Agreement, by and between the Company and Shire Pharmaceuticals, Inc., dated February 19, 2008. | |
65
Table of Contents
| Exhibit Number |
Description | |
| 10.75(20) |
Severance Letter Agreement between the Company and Gary M. Sawka dated September 10, 2008.** | |
| 10.76(20) |
Offer of Employment Letter Agreement between the Company and Gary M. Sawka dated September 9, 2008.** | |
| 10.77(20) |
Amended and Restated Employment Agreement between the Company and Don Bailey dated December 19, 2008.** | |
| 10.78(20) |
Form of 409A Letter Amendment to Officers’ Severance, Change in Control and Employment Agreements.** | |
| 10.80(21) |
Second Amendment, dated as of October 21, 2009, to the Rights Agreement, dated February 11, 2003, as amended September 9, 2005, between Questcor Pharmaceuticals, Inc. and Computershare Trust Company, N.A. | |
| 10.81(21) |
Offer Letter, by and between Questcor Pharmaceuticals, Inc. and Dr. David Young, Pharm.D., Ph.D., dated October 15, 2009.** | |
| 10.82(21) |
Severance Agreement, by and between Questcor Pharmaceuticals, Inc. and Dr. David Young, Pharm.D., Ph.D., dated October 19, 2009.** | |
| 10.83(22) |
Supply Agreement, dated January 21, 2010, by and between Questcor Pharmaceuticals, Inc. and Cangene bioPharma, Inc.† | |
| 10.84(23) |
Resignation Agreement, dated August 24, 2010, by and between Questcor Pharmaceuticals, Inc. and Jason Zielonka, M.D.** | |
| 10.85(24) |
Transition Agreement, dated September 23, 2010, by and between Questcor Pharmaceuticals, Inc. and Gary Sawka.** | |
| 10.86(25) |
Offer Letter, dated January 3, 2011, by and between Questcor Pharmaceuticals, Inc. and Michael Mulroy.** | |
| 10.87(25) |
Severance Agreement, dated January 3, 2011, by and between Questcor Pharmaceuticals, Inc. and Michael Mulroy.** | |
| 10.88(26) |
Supply Agreement, dated July 14, 2010, by and between Questcor Pharmaceuticals, Inc., and BioVectra, Inc.† | |
| 23.1* |
Consent of Odenburg, Ullakko, Muranishi & Co. LLP, Independent Registered Public Accounting Firm. | |
| 31.1* |
Certification of Chief Executive Officer Pursuant to Rule 13a-14(a)/15d-14(a) of the Securities Exchange Act of 1934. | |
| 31.2* |
Certification of Principal Accounting Officer Pursuant to Rule 13a-14(a)/15d-14(a) of the Securities Exchange Act of 1934. | |
| 32.1* |
Certification of Chief Executive Officer Pursuant to Rule 13a-14(b)/15d-14(b) of the Securities Exchange Act of 1934 and 18 U.S.C. Section 1350. (3) | |
| 32.2* |
Certification of Principal Accounting Officer Pursuant to Rule 13a-14(b)/15d-14(b) of the Securities Exchange Act of 1934 and 18 U.S.C. Section 1350. (3) | |
| * | Filed herewith. |
| ** | This exhibit is identified as a management contract or compensatory plan or arrangement pursuant to Item 15(a)(3) of Form 10-K. |
| (1) | Filed as an exhibit to the Company’s Annual Report on Form 10-K for the fiscal year ended December 31, 1999, filed on March 30, 2000, and incorporated herein by reference. |
| (2) | Filed as an exhibit to the Company’s Current Report on Form 8-K, filed on March 27, 2008, and incorporated herein by reference. |
| (3) | Filed as an exhibit to the Company’s Registration Statement on Form S-1, Registration No. 33-51682, and incorporated herein by reference. |
| (4) | Filed as an exhibit to the Company’s Proxy Statement on Schedule 14A, filed on March 28, 2002, and incorporated herein by reference. |
| (5) | Filed as an exhibit to the Company’s Registration Statement Form S-4, Registration Statement No. 333-87611, filed on September 23, 1999, and incorporated herein by reference. |
| (6) | Filed as an exhibit to the Company’s Quarterly Report on Form 10-Q for the quarter ended June 30, 2002, filed on August 14, 2002, and incorporated herein by reference. |
66
Table of Contents
| (7) | Filed as an exhibit to the Company’s Proxy Statement on Schedule 14A, filed on March 29, 2004, and incorporated herein by reference. |
| (8) | Filed as an exhibit to the Company’s Annual Report on Form 10-K for the fiscal year ended December 31, 2004, filed on March 31, 2005, and incorporated herein by reference. |
| (9) | Filed as an exhibit to the Company’s Current Report on Form 8-K, filed on October 19, 2005, and incorporated herein by reference. |
| (10) | Filed as an exhibit to the Company’s Annual Report on Form 10-K for the fiscal year ended December 31, 2005, filed on March 30, 2006, and incorporated herein by reference. |
| (11) | Filed as an exhibit to the Company’s Proxy Statement on Schedule 14A, filed on April 10, 2006, and incorporated herein by reference. |
| (12) | Filed as an exhibit to the Company’s Current Report on Form 8-K, filed on May 24, 2006, and incorporated herein by reference. |
| (13) | Filed as an exhibit to the Company’s Current Report on Form 8-K, filed on February 15, 2007, and incorporated herein by reference. |
| (14) | Filed as an exhibit to the Company’s Current Report on Form 8-K, filed on July 3, 2007, and incorporated herein by reference. |
| (15) | Filed as an exhibit to the Company’s Current Report on Form 8-K, filed on July 20, 2007, and incorporated herein by reference. |
| (16) | Filed as an exhibit to the Company’s Current Report on Form 8-K, filed on January 4, 2008, and incorporated herein by reference. |
| (17) | Filed as an exhibit to the Company’s Definitive Proxy Statement on Schedule 14A, filed on April 21, 2008, and incorporated herein by reference |
| (18) | Filed as an exhibit to the Company’s Current Report on Form 8-K, filed on August 19, 2008, and incorporated herein by reference. |
| (19) | Filed as an exhibit to the Company’s Current Report on Form 8-K, filed on September 9, 2008, and incorporated herein by reference. |
| (20) | Filed as an exhibit to the Company’s Annual Report on Form 10-K for the fiscal year ended December 31, 2008, filed on March 16, 2009, and incorporated herein by reference. |
| (21) | Filed as an exhibit to the Company’s Current Report on Form 8-K, filed on October 23, 2009, and incorporated herein by reference. |
| (22) | Filed as an exhibit to the Company’s Annual Report on Form 10-K for the year ended December 31, 2009, filed on March 16, 2010, and incorporated herein by reference. |
| (23) | Filed as an exhibit to the Company’s Current Report on Form 8-K, filed on August 30, 2010, and incorporated herein by reference. |
| (24) | Filed as an exhibit to the Company’s Current Report on Form 8-K, filed on September 30, 2010, and incorporated herein by reference. |
| (25) | Filed as an exhibit to the Company’s Current Report on Form 8-K, filed on January 10, 2011, and incorporated herein by reference. |
| (26) | Filed as an exhibit to the Company’s Quarterly Report on Form 10-Q, filed on November 2, 2010, and incorporated herein by reference. |
| † | The Company has requested confidential treatment with respect to portions of this exhibit. |
67