Attached files
| file | filename |
|---|---|
| 8-K - FORM 8-K - SNYDER'S-LANCE, INC. | g26233e8vk.htm |
| EX-99.3 - EX-99.3 - SNYDER'S-LANCE, INC. | g26233exv99w3.htm |
| EX-99.4 - EX-99.4 - SNYDER'S-LANCE, INC. | g26233exv99w4.htm |
| EX-99.1 - EX-99.1 - SNYDER'S-LANCE, INC. | g26233exv99w1.htm |
Exhibit 99.2
| Snyder’s -Lance Earnings Call February 18, 2011 |
| “Forward Looking During this discussion, we may make forward-looking statements within the meaning of applicable securities laws. The statements may include projections regarding future earnings and results current expectations and assumptions, which are subject to a number of risks and uncertainties. Factors that could cause actual results to differ include risks and business disruption from merger integration and the conversion of our distribution to independent operators, general economic conditions, increases in cost or availability of ingredients, packaging, energy and employees, price competition and industry consolidation, risks from large customers, ability to execute strategic initiatives, product recalls or safety concerns, disruptions of our supply chain or information technology systems, changes in consumer preferences, food industry and regulatory factors, and interest rate and foreign exchange rate risks, as well as those that have been discussed in our most recent Form 10-K and subsequent Forms 10-Q and other reports filed with the Securities and Exchange Commission including the form S-4. 2 |
| Overall Review David V. Singer CEO 3 |
| Operation Discussion Carl E. Lee, Jr. President and COO 4 |
| Fourth Quarter & Full Year 2010 Financial Review Rick Puckett EVP CFO 5 |
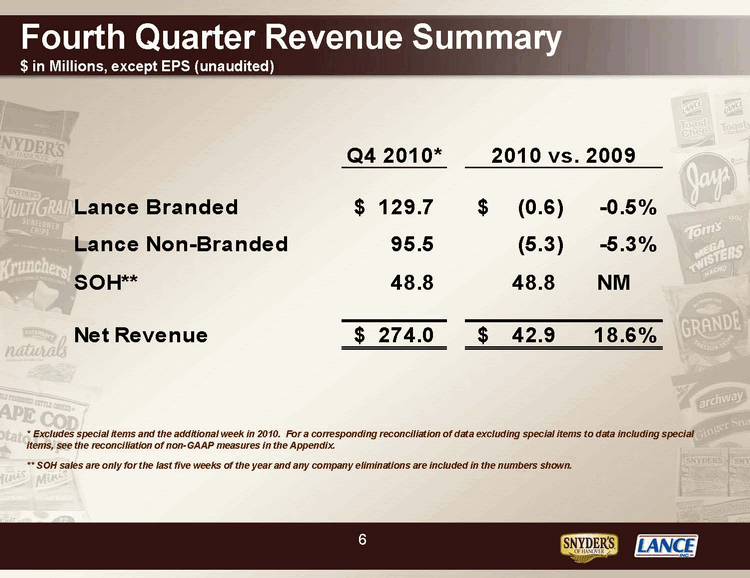
| Fourth Quarter Revenue Summary $ in Millions, except EPS (unaudited) Q4 2010* 2010 vs. 2009 Lance Branded $129.7 $ (0.6) -0.5% Lance Non-Branded 95.5 (5.3) -5.3% SOH** 48.8 48.8 NM Net Revenue $274.0 $42.9 18.6% * Excludes special items and the additional week in 2010. For a corresponding reconciliation of data excluding special items to data including special items, see the reconciliation of non-GAAP measures in the Appendix. ** SOH sales are only for the last five weeks of the year and any company eliminations are included in the numbers shown. 6 |
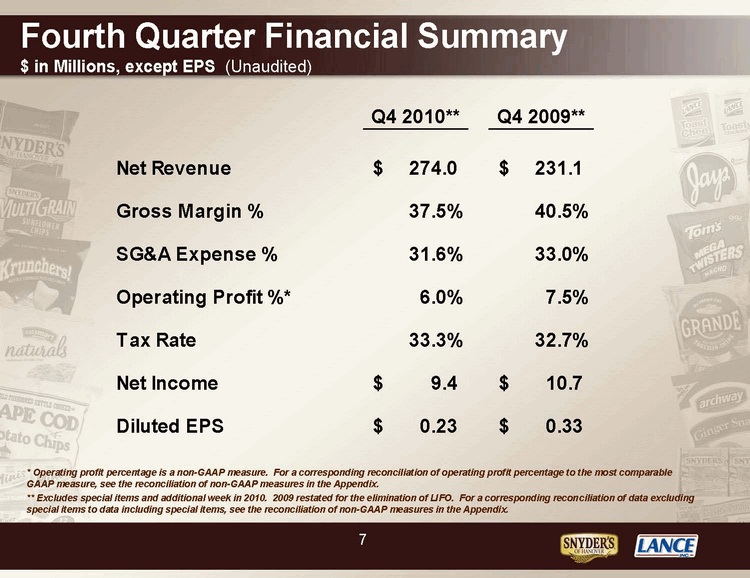
| Fourth Quarter Financial Summary $ in Millions, except EPS (Unaudited) Q4 2010** Q4 2009** Net Revenue $274.0 $231.1 Gross Margin % 37.5% 40.5% SG&A Expense % 31.6% 33.0% Operating Profit %* 6.0% 7.5% Tax Rate 33.3% 32.7% Net Income $9.4 $10.7 Diluted EPS $0.23 $0.33 * Operating profit percentage is a non-GAAP measure. For a corresponding reconciliation of operating profit percentage to the most comparable GAAP measure, see the reconciliation of non-GAAP measures in the Appendix. ** Excludes special items and additional week in 2010. 2009 restated for the elimination of LIFO. For a corresponding reconciliation of data excluding special items to data including special items, see the reconciliation of non-GAAP measures in the Appendix. 7 |
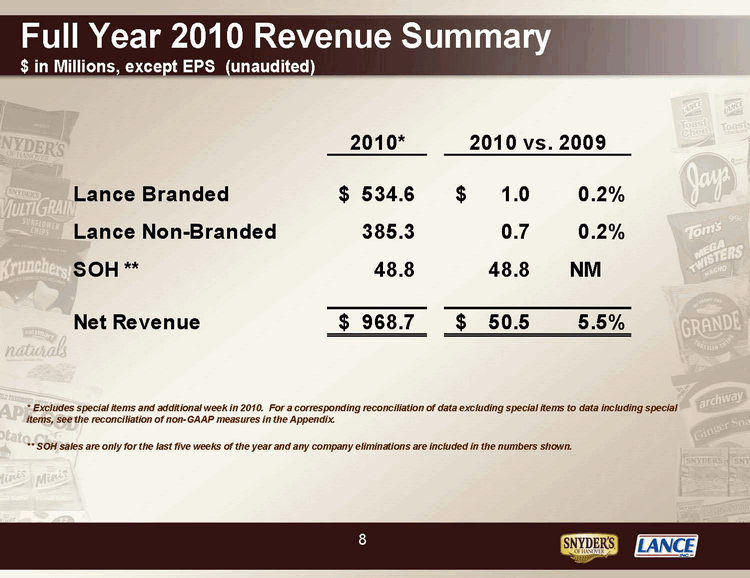
| Full Year 2010 Revenue Summary $ in Millions, except EPS (unaudited) 2010* 2010 vs. 2009 Lance Branded $534.6 $1.0 0.2% Lance Non-Branded 385.3 0.7 0.2% SOH ** 48.8 48.8 NM Net Revenue $968.7 $50.5 5.5% * Excludes special items and additional week in 2010. For a corresponding reconciliation of data excluding special items to data including special items, see the reconciliation of non-GAAP measures in the Appendix. ** SOH sales are only for the last five weeks of the year and any company eliminations are included in the numbers shown. 8 |
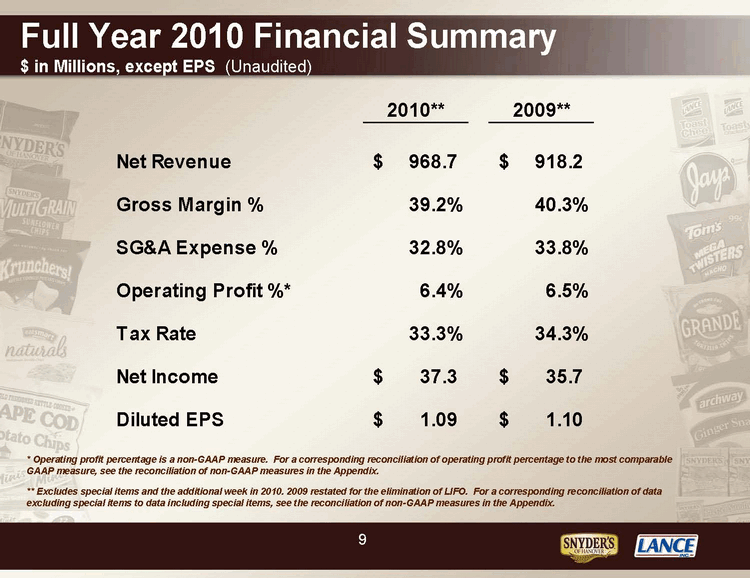
| Full Year 2010 Financial Summary $ in Millions, except EPS (Unaudited) 2010** 2009** Net Revenue $968.7 $918.2 Gross Margin % 39.2% 40.3% SG&A Expense % 32.8% 33.8% Operating Profit %* 6.4% 6.5% Tax Rate 33.3% 34.3% Net Income $37.3 $35.7 Diluted EPS $1.09 $1.10 * Operating profit percentage is a non-GAAP measure. For a corresponding reconciliation of operating profit percentage to the most comparable GAAP measure, see the reconciliation of non-GAAP measures in the Appendix. ** Excludes special items and the additional week in 2010. 2009 restated for the elimination of LIFO. For a corresponding reconciliation of data excluding special items to data including special items, see the reconciliation of non-GAAP measures in the Appendix. 9 |
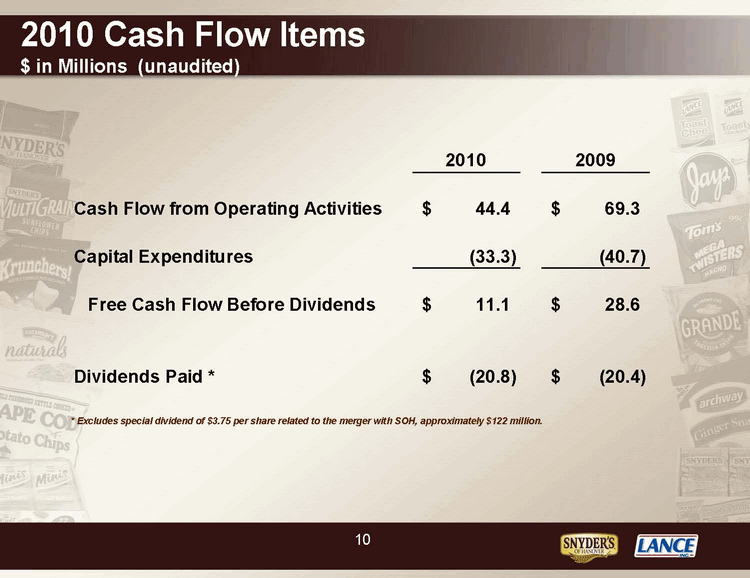
| 2010 Cash Flow Items $ in Millions (unaudited) 2010 2009 Cash Flow from Operating Activities $44.4 $69.3 Capital Expenditures (33.3) (40.7) Free Cash Flow Before Dividends $11.1 $28.6 Dividends Paid * $ (20.8) $ (20.4) * Excludes special dividend of $3.75 per share related to the merger with SOH, approximately $122 million. 10 |
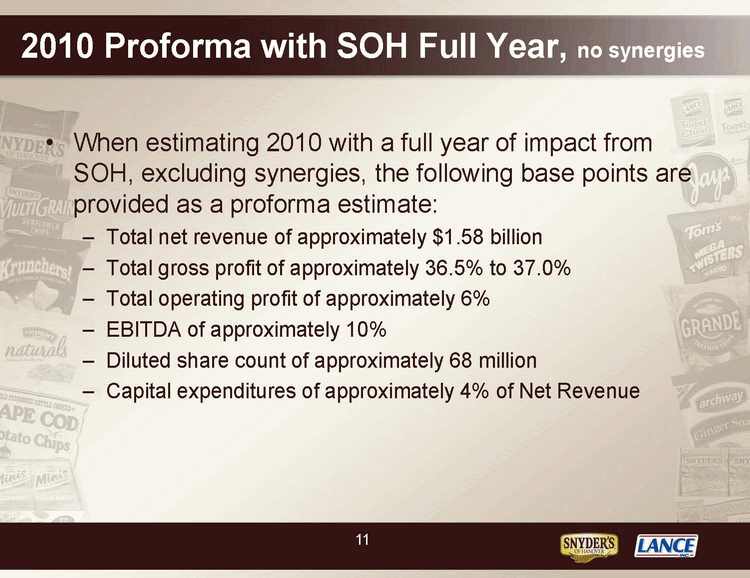
| 2010 Proforma with SOH Full Year, no synergies • When estimating 2010 with a full year of impact from SOH, excluding synergies, the following base points are provided as a proforma estimate: — Total net revenue of approximately $1.58 billion — Total gross profit of approximately 36.5% to 37.0% — Total operating profit of approximately 6% — EBITDA of approximately 10% — Diluted share count of approximately 68 million — Capital expenditures of approximately 4% of Net Revenue 11 |
| Insights for 2011 and 2012 |
| 12 |
| Questions? |
| 13 |
| Appendix |
| 14 |
| Reconciliation of Non-GAAP Measures This presentation includes certain measures not derived in accordance with generally accepted accounting principles (“GAAP”) . Such measures should not be considered substitutes for any measures derived in accordance with GAAP and may also be inconsistent with similar measures presented by other companies. Reconciliation of these non-GAAP financial measures to the most nearly comparable GAAP measures, if applicable, is presented on the slides that follow. The Company believes these non-GAAP financial measures provide useful information to investors as the measures emphasize core ongoing operations and are helpful in comparing past and present operating results. The Company uses these measures to evaluate past performance and prospects for future performance. The presentation of non-GAAP financial measures by the Company should not be considered in isolation or as a substitute for the financial results prepared in accordance with GAAP. |
| 15 |
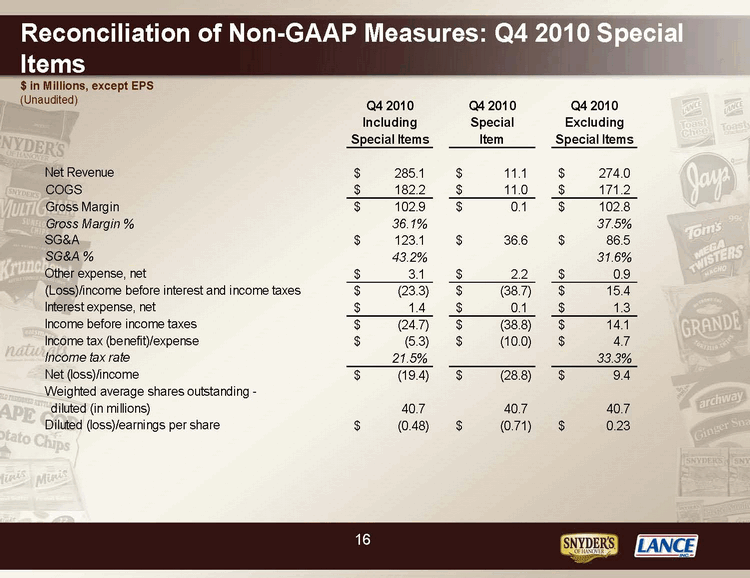
| Reconciliation of Non-GAAP Measures: Q4 2010 Special Items $ in Millions, except EPS (Unaudited) Q4 2010 Q4 2010 Q4 2010 Including Special Excluding Special Items Item Special Items Net Revenue $285.1 $11.1 $274.0 COGS $182.2 $11.0 $171.2 Gross Margin $102.9 $0.1 $102.8 Gross Margin % 36.1% 37.5% SG&A $123.1 $36.6 $86.5 SG&A % 43.2% 31.6% Other expense, net $3.1 $2.2 $0.9 (Loss)/income before interest and income taxes $ (23.3) $ (38.7) $15.4 Interest expense, net $1.4 $0.1 $1.3 Income before income taxes $ (24.7) $ (38.8) $14.1 Income tax (benefit)/expense $ (5.3) $ (10.0) $4.7 Income tax rate 21.5% 33.3% Net (loss)/income $ (19.4) $ (28.8) $9.4 Weighted average shares outstanding — diluted (in millions) 40.7 40.7 40.7 Diluted (loss)/earnings per share $ (0.48) $ (0.71) $0.23 16 |
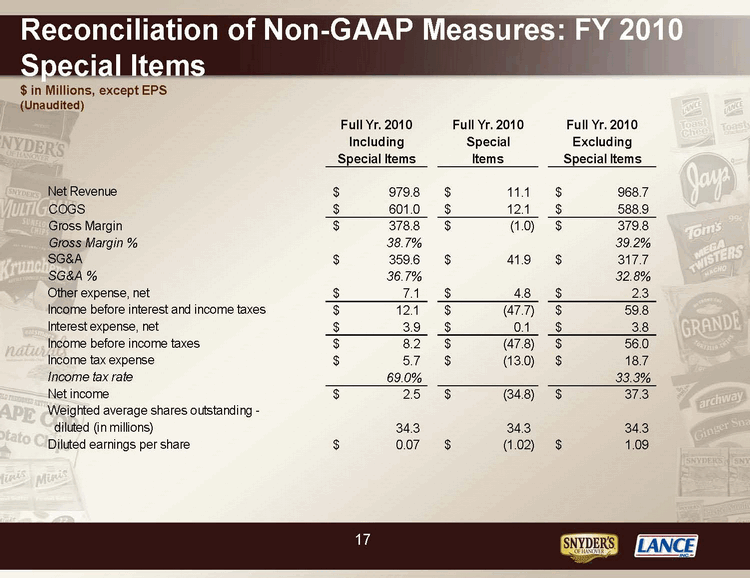
| Reconciliation of Non-GAAP Measures: FY 2010 Special Items $ in Millions, except EPS (Unaudited) Full Yr. 2010 Full Yr. 2010 Full Yr. 2010 Including Special Excluding Special Items Items Special Items Net Revenue $979.8 $11.1 $968.7 COGS $601.0 $12.1 $588.9 Gross Margin $378.8 $ (1.0) $379.8 Gross Margin % 38.7% 39.2% SG&A $359.6 $41.9 $317.7 SG&A % 36.7% 32.8% Other expense, net $7.1 $4.8 $2.3 Income before interest and income taxes $12.1 $ (47.7) $59.8 Interest expense, net $3.9 $0.1 $3.8 Income before income taxes $8.2 $ (47.8) $56.0 Income tax expense $5.7 $ (13.0) $18.7 Income tax rate 69.0% 33.3% Net income $2.5 $ (34.8) $37.3 Weighted average shares outstanding — diluted (in millions) 34.3 34.3 34.3 Diluted earnings per share $0.07 $ (1.02) $1.09 |
| 17 |
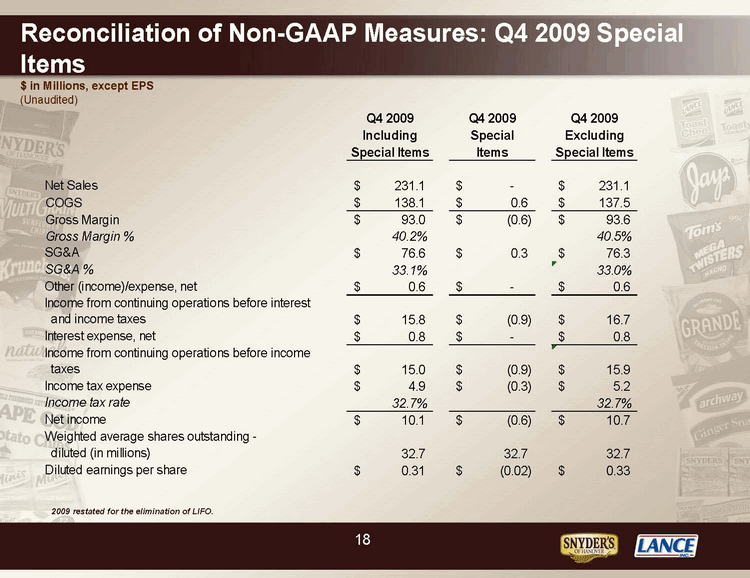
| Reconciliation of Non-GAAP Measures: Q4 2009 Special Items $ in Millions, except EPS (Unaudited) Q4 2009 Q4 2009 Q4 2009 Including Special Excluding Special Items Items Special Items Net Sales $231.1 $ — $231.1 COGS $138.1 $0.6 $137.5 Gross Margin $93.0 $ (0.6) $93.6 Gross Margin % 40.2% 40.5% SG&A $76.6 $0.3 $76.3 SG&A % 33.1% 33.0% Other (income)/expense, net $0.6 $ — $0.6 Income from continuing operations before interest and income taxes $15.8 $ (0.9) $16.7 Interest expense, net $0.8 $ — $0.8 Income from continuing operations before income taxes $15.0 $ (0.9) $15.9 Income tax expense $4.9 $ (0.3) $5.2 Income tax rate 32.7% 32.7% Net income $10.1 $ (0.6) $10.7 Weighted average shares outstanding — diluted (in millions) 32.7 32.7 32.7 Diluted earnings per share $0.31 $ (0.02) $0.33 2009 restated for the elimination of LIFO. 18 |
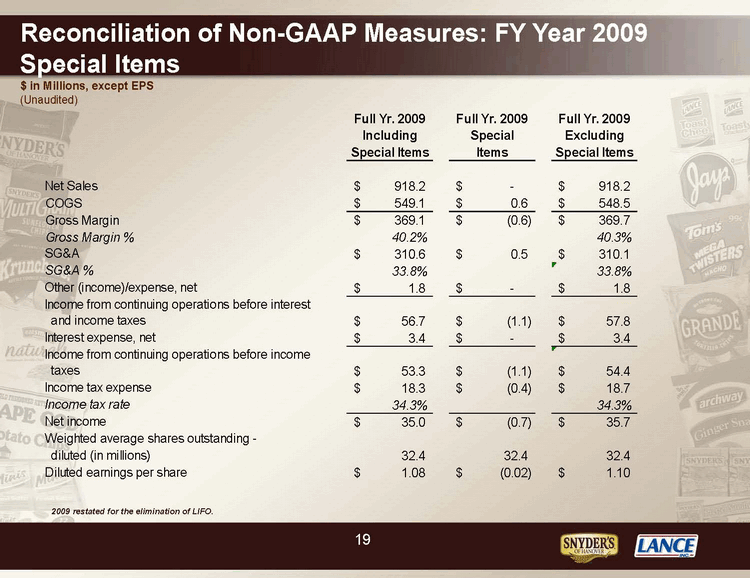
| Reconciliation of Non-GAAP Measures: FY Year 2009 Special Items $ in Millions, except EPS (Unaudited) Full Yr. 2009 Full Yr. 2009 Full Yr. 2009 Including Special Excluding Special Items Items Special Items Net Sales $918.2 $ — $918.2 COGS $549.1 $0.6 $548.5 Gross Margin $369.1 $ (0.6) $369.7 Gross Margin % 40.2% 40.3% SG&A $310.6 $0.5 $310.1 SG&A % 33.8% 33.8% Other (income)/expense, net $1.8 $ — $1.8 Income from continuing operations before interest and income taxes $56.7 $ (1.1) $57.8 Interest expense, net $3.4 $ — $3.4 Income from continuing operations before income taxes $53.3 $ (1.1) $54.4 Income tax expense $18.3 $ (0.4) $18.7 Income tax rate 34.3% 34.3% Net income $35.0 $ (0.7) $35.7 Weighted average shares outstanding — diluted (in millions) 32.4 32.4 32.4 Diluted earnings per share $1.08 $ (0.02) $1.10 2009 restated for the elimination of LIFO. 19 |
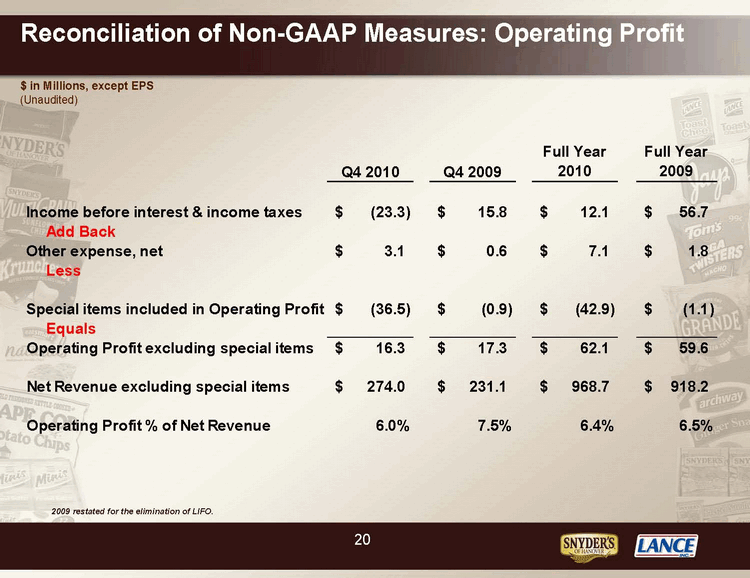
| Reconciliation of Non-GAAP Measures: Operating Profit $ in Millions, except EPS (Unaudited) Full Year Full Year Q4 2010 Q4 2009 2010 2009 Income before interest & income taxes $ (23.3) $15.8 $12.1 $56.7 Add Back Other expense, net $3.1 $0.6 $7.1 $1.8 Less Special items included in Operating Profit $ (36.5) $ (0.9) $ (42.9) $ (1.1) Equals Operating Profit excluding special items $16.3 $17.3 $62.1 $59.6 Net Revenue excluding special items $274.0 $231.1 $968.7 $918.2 Operating Profit % of Net Revenue 6.0% 7.5% 6.4% 6.5% 2009 restated for the elimination of LIFO. 20 |
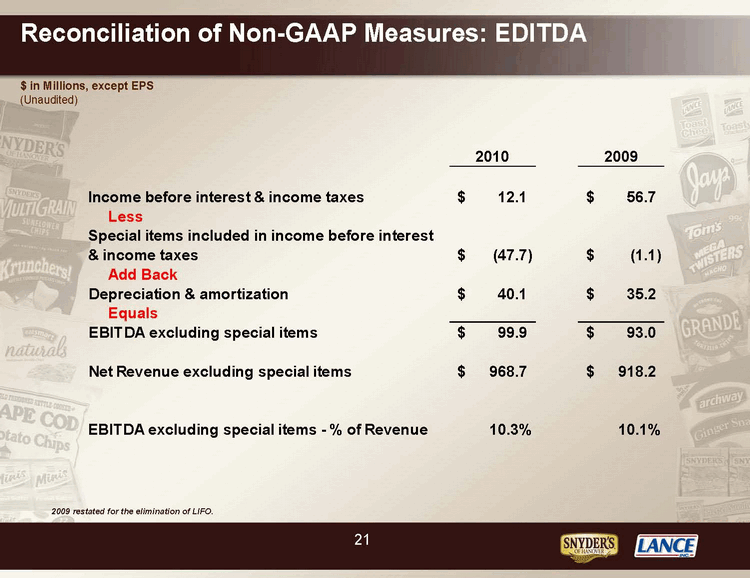
| Reconciliation of Non-GAAP Measures: EDITDA $ in Millions, except EPS (Unaudited) 2010 2009 Income before interest & income taxes $12.1 $56.7 Less Special items included in income before interest & income taxes $ (47.7) $ (1.1) Add Back Depreciation & amortization $40.1 $35.2 Equals EBITDA excluding special items $99.9 $93.0 Net Revenue excluding special items $968.7 $918.2 EBITDA excluding special items — % of Revenue 10.3% 10.1% 2009 restated for the elimination of LIFO. 21 |
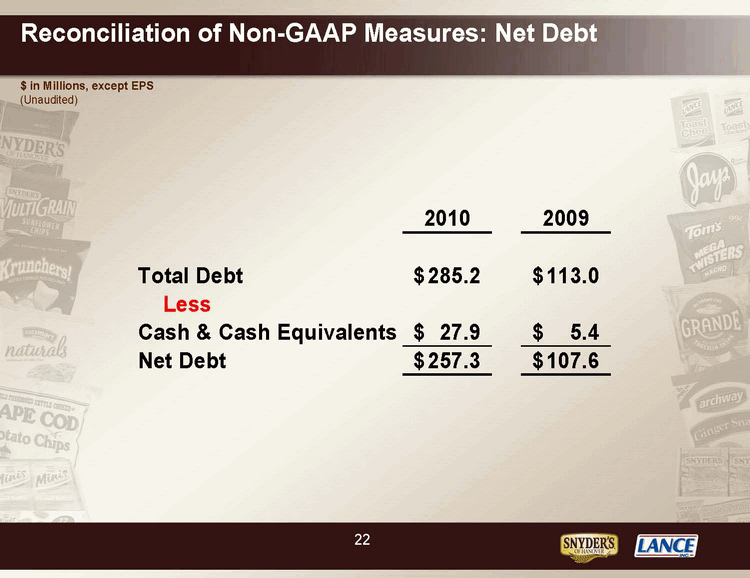
| Reconciliation of Non-GAAP Measures: Net Debt $ in Millions, except EPS (Unaudited) 2010 2009 Total Debt $285.2 $113.0 Less Cash & Cash Equivalents $27.9 $5.4 Net Debt $257.3 $107.6 |
| 22 |