Attached files
| file | filename |
|---|---|
| 8-K - FORM 8-K - CNO Financial Group, Inc. | form8k.htm |

4Q10
Financial and operating results for the period ended December 31, 2010
Financial and operating results for the period ended December 31, 2010
February 23, 2011
Unless otherwise specified, comparisons in this presentation are between 4Q10 and 4Q09.
Exhibit 99.1

CNO Financial Group
2
Forward-Looking Statements
Cautionary Statement Regarding Forward-Looking Statements. Our statements, trend analyses and other information contained in this
press release relative to markets for CNO Financial’s products and trends in CNO Financial’s operations or financial results, as well as other
statements, contain forward-looking statements within the meaning of the federal securities laws and the Private Securities Litigation Reform
Act of 1995. Forward-looking statements typically are identified by the use of terms such as “anticipate,” “believe,” “plan,” “estimate,” “expect,”
“project,” “intend,” “may,” “will,” “would,” “contemplate,” “possible,” “attempt,” “seek,” “should,” “could,” “goal,” “target,” “on track,” “comfortable
with,” “optimistic” and similar words, although some forward-looking statements are expressed differently. You should consider statements that
contain these words carefully because they describe our expectations, plans, strategies and goals and our beliefs concerning future business
conditions, our results of operations, financial position, and our business outlook or they state other ‘‘forward-looking’’ information based on
currently available information. Assumptions and other important factors that could cause our actual results to differ materially from those
anticipated in our forward-looking statements include, among other things: (i) changes in or sustained low interest rates causing a reduction in
investment income, the margins of our fixed annuity and life insurance businesses and demand for our products; (ii) general economic, market
and political conditions, including the performance and fluctuations of the financial markets which may affect our ability to raise capital or
refinance existing indebtedness and the cost of doing so; (iii) the ultimate outcome of lawsuits filed against us and other legal and regulatory
proceedings to which we are subject; (iv) our ability to make changes to certain non-guaranteed elements of our life insurance products; (v) our
ability to obtain adequate and timely rate increases on our health products, including our long-term care business; (vi) the receipt of any
required regulatory approvals for dividend and surplus debenture interest payments from our insurance subsidiaries; (vii) mortality, morbidity,
the increased cost and usage of health care services, persistency, the adequacy of our previous reserve estimates and other factors which may
affect the profitability of our insurance products; (viii) changes in our assumptions related to deferred acquisition costs or the present value of
future profits; (ix) the recoverability of our deferred tax assets and the effect of potential ownership changes and tax rate changes on their
value; (x) our assumption that the positions we take on our tax return filings, including our position that our 7.0% convertible senior debentures
due 2016 will not be treated as stock for purposes of Section 382 of the Internal Revenue Code of 1986, as amended, and will not trigger an
ownership change, will not be successfully challenged by the Internal Revenue Service; (xi) changes in accounting principles and the
interpretation thereof; (xii) our ability to continue to satisfy the financial ratio and balance requirements and other covenants of our debt
agreements; (xiii) our ability to achieve anticipated expense reductions and levels of operational efficiencies including improvements in claims
adjudication and continued automation and rationalization of operating systems, (xiv) performance and valuation of our investments, including
the impact of realized losses (including other-than-temporary impairment charges); (xv) our ability to identify products and markets in which we
can compete effectively against competitors with greater market share, higher ratings, greater financial resources and stronger brand
recognition; (xvi) our ability to generate sufficient liquidity to meet our debt service obligations and other cash needs; (xvii) our ability to maintain
effective controls over financial reporting; (xviii) our ability to continue to recruit and retain productive agents and distribution partners and
customer response to new products, distribution channels and marketing initiatives; (xix) our ability to achieve eventual upgrades of the
financial strength ratings of CNO Financial and our insurance company subsidiaries as well as the impact of our ratings on our business, our
ability to access capital and the cost of capital; (xx) the risk factors or uncertainties listed from time to time in our filings with the Securities and
Exchange Commission; (xxi) regulatory changes or actions, including those relating to regulation of the financial affairs of our insurance
companies, such as the payment of dividends and surplus debenture interest to us, regulation of financial services affecting (among other
things) bank sales and underwriting of insurance products, regulation of the sale, underwriting and pricing of products, and health care
regulation affecting health insurance products; and (xxii) changes in the Federal income tax laws and regulations which may affect or eliminate
the relative tax advantages of some of our products. Other factors and assumptions not identified above are also relevant to the forward-
looking statements, and if they prove incorrect, could also cause actual results to differ materially from those projected. All forward-looking
statements are expressly qualified in their entirety by the foregoing cautionary statements. Our forward-looking statements speak only as of the
date made. We assume no obligation to update or to publicly announce the results of any revisions to any of the forward-looking statements to
reflect actual results, future events or developments, changes in assumptions or changes in other factors affecting the forward-looking
statements.

CNO Financial Group
3
Non-GAAP Measures
This presentation contains the following financial measures that differ from the
comparable measures under Generally Accepted Accounting Principles (GAAP):
operating earnings measures; book value, excluding accumulated other comprehensive
income (loss) per share; operating return measures; earnings before net realized
investment gains (losses) and corporate interest and taxes; debt to capital ratios,
excluding accumulated other comprehensive income (loss); and interest-adjusted benefit
ratios. Reconciliations between those non-GAAP measures and the comparable GAAP
measures are included in the Appendix, or on the page such measure is presented.
While management believes these measures are useful to enhance understanding and
comparability of our financial results, these non-GAAP measures should not be
considered substitutes for the most directly comparable GAAP measures.
comparability of our financial results, these non-GAAP measures should not be
considered substitutes for the most directly comparable GAAP measures.
Additional information concerning non-GAAP measures is included in our periodic filings
with the Securities and Exchange Commission that are available in the “Investors - SEC
Filings” section of CNO’s website, www.CNOinc.com.
with the Securities and Exchange Commission that are available in the “Investors - SEC
Filings” section of CNO’s website, www.CNOinc.com.

CNO Financial Group
4

CNO Financial Group
5
4Q10: Summary
CNO
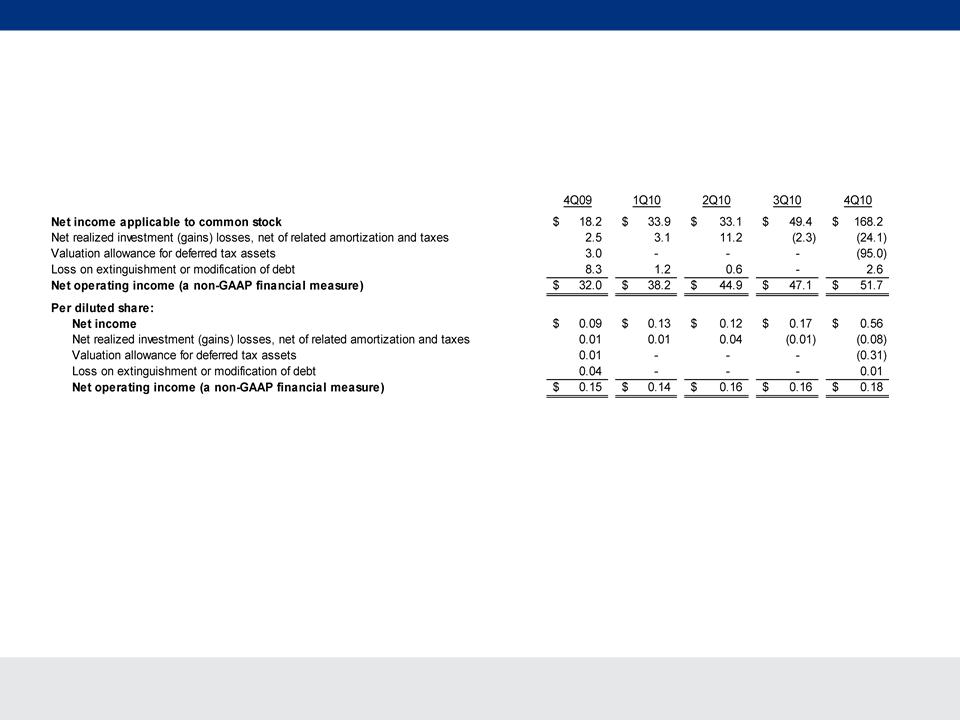
§ Net income of $168.2 million, compared to $18.2 million
§ Net operating income* of $51.7 million, up 62%, or 18 cents per
diluted share
diluted share
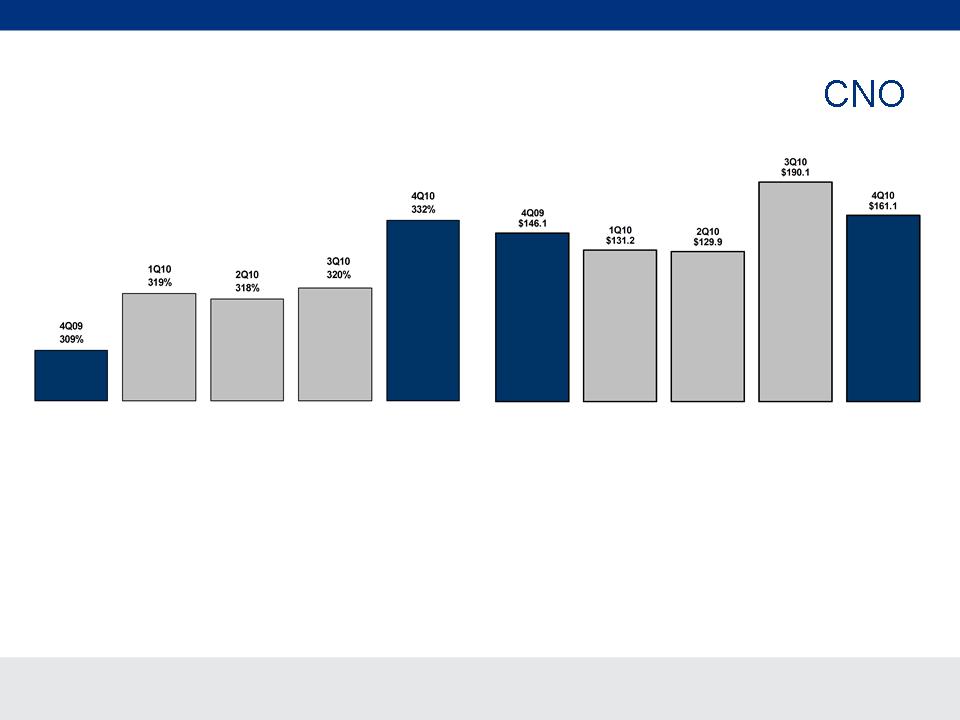
§ Consolidated RBC at 332%, up 12 percentage points from 9/30/10
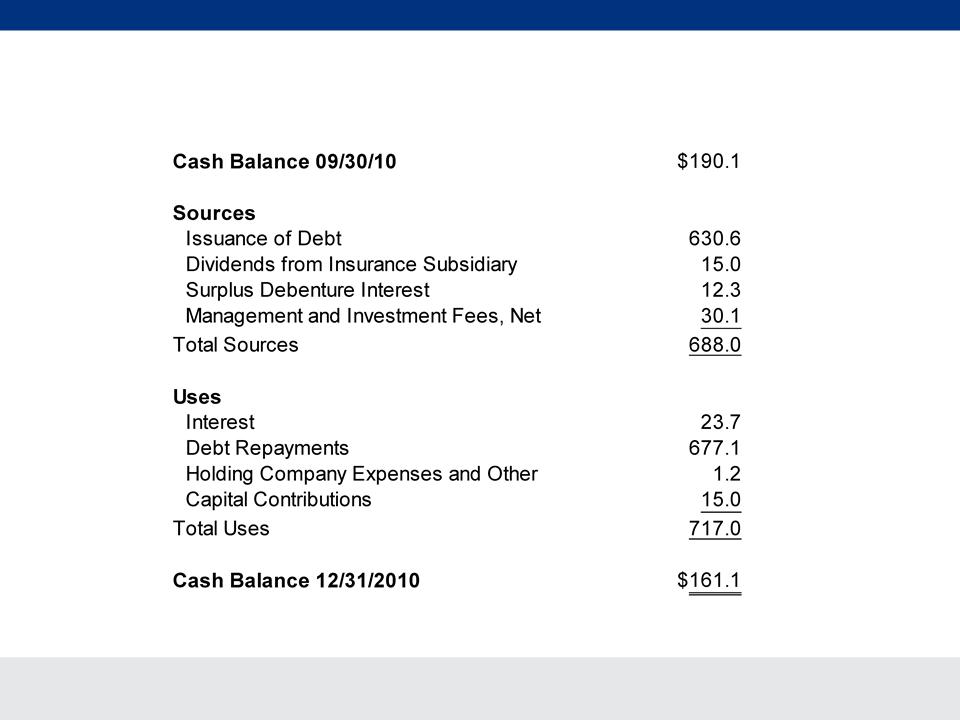
§ Holding company liquidity at $161 million, down $29 million from
9/30/10 primarily reflecting the repayment of debt
9/30/10 primarily reflecting the repayment of debt
§ Debt to total capital ratio, as defined in our Senior Secured Credit
Agreement 19.99%, down from 21.17% at 9/30/10
Agreement 19.99%, down from 21.17% at 9/30/10
§ AOCI of $238 million at 12/31/10 vs. AOCI of $688 million at 9/30/10
§ Core sales** up 13% over 3Q10
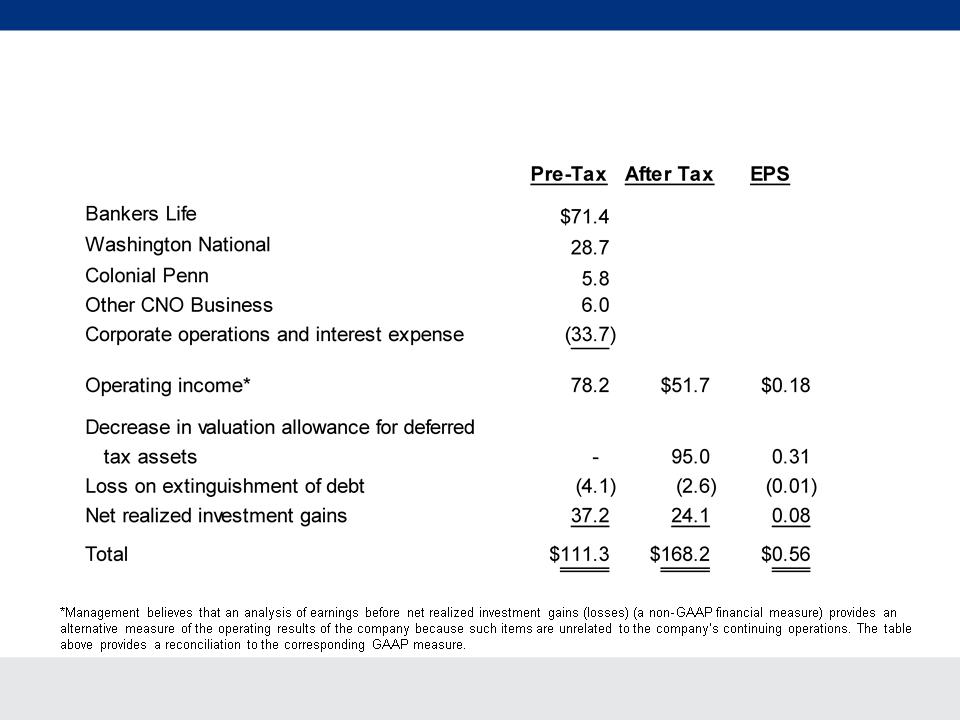
*Management believes that an analysis of net income applicable to common stock before: (1) loss on extinguishment or modification of debt, net of income taxes; (2)
net realized investment gains or losses, net of related amortization and income taxes; and (3) increases or decreases in the valuation allowance related to deferred
tax assets (“Net operating income,” a non-GAAP financial measure) is important to evaluate the financial performance of the company, and is a key measure
commonly used in the life insurance industry. Management uses this measure to evaluate performance because such items can be affected by events that are
unrelated to the company’s underlying fundamentals. The table on page 8 reconciles the non-GAAP measure to the corresponding GAAP measure.
**Excludes PFFS and PDP.

CNO Financial Group
6
2010 vs. 2009 Summary
CNO
§ Net income of $284.6 million, compared to $85.7 million
§ Net operating income* of $181.9 million, up 11%, or 65 cents per
diluted share
diluted share
§ Consolidated RBC at 332%, up 23 percentage points for the year
§ Holding company liquidity at $161 million, up $15 million
§ Debt to total capital ratio, as defined in our Senior Secured Credit
Agreement 19.99%, down from 21.63% at 12/31/09
Agreement 19.99%, down from 21.63% at 12/31/09
§ AOCI of $238 million at 12/31/10 vs. AOCL of $(264) million at
12/31/09
12/31/09
§ Core sales** for the year down 5%
§ Material weakness has been remediated
*Management believes that an analysis of net income applicable to common stock before: (1) loss on extinguishment or modification of debt, net of income taxes; (2) net
realized investment gains or losses, net of related amortization and income taxes; and (3) increases or decreases in the valuation allowance related to deferred tax
assets (“Net operating income,” a non-GAAP financial measure) is important to evaluate the financial performance of the company, and is a key measure commonly
used in the life insurance industry. Management uses this measure to evaluate performance because such items can be affected by events that are unrelated to the
company’s underlying fundamentals. The table on page 8 reconciles the non-GAAP measure to the corresponding GAAP measure.
**Excludes PFFS and PDP.
CNO Financial Group
7
4Q10 Summary of Results
CNO
($ millions, except per-share amounts)
CNO Financial Group
8
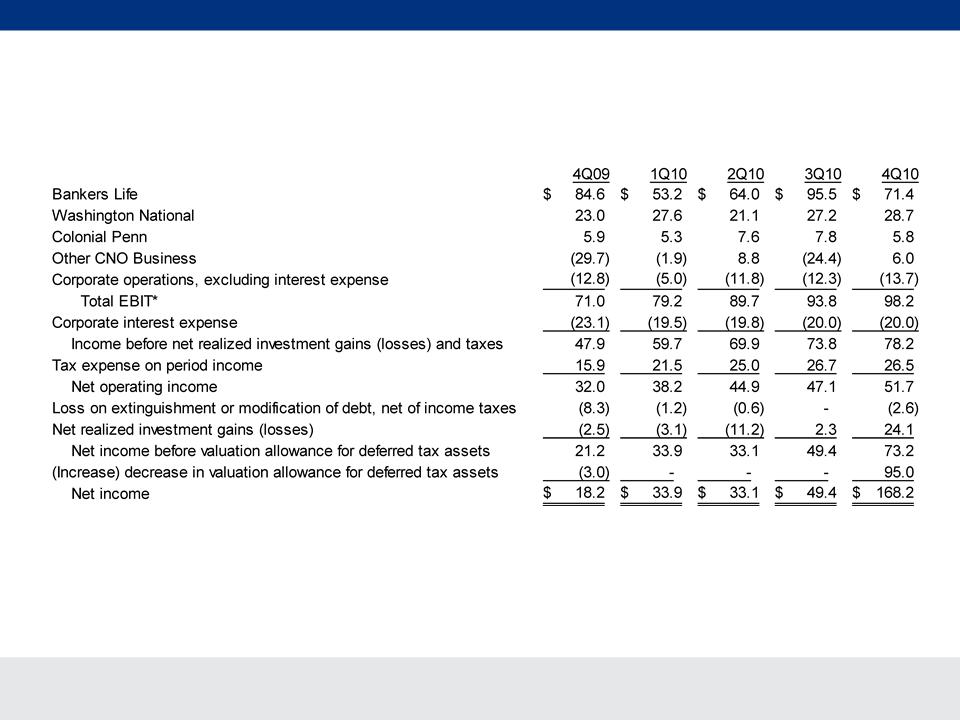
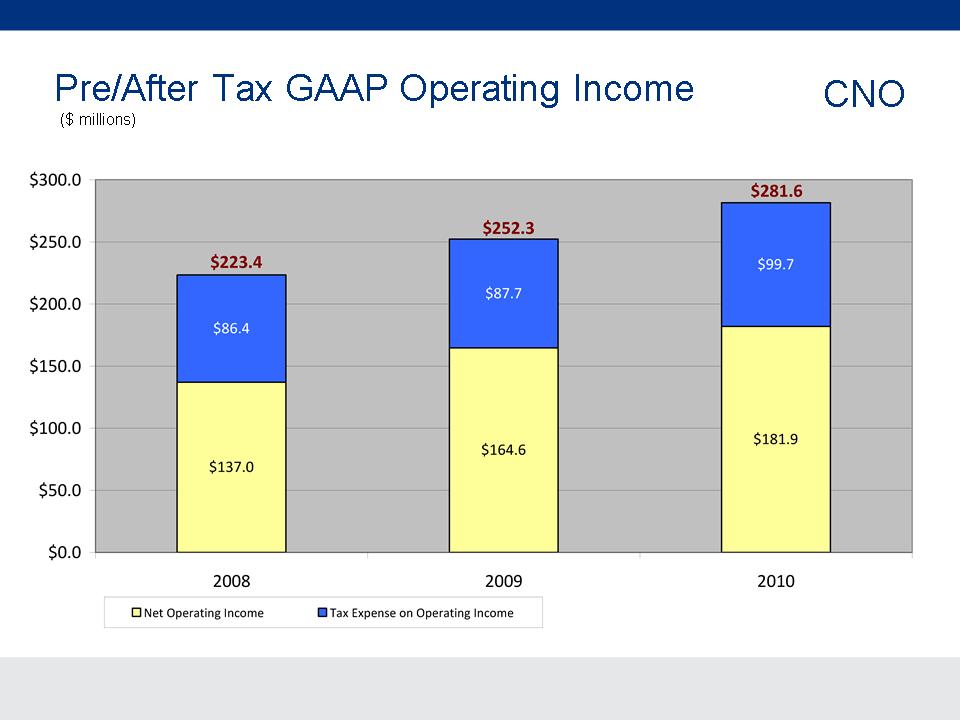
Quarterly Earnings
CNO
*Management believes that an analysis of earnings before net realized investment gains (losses), corporate interest, loss on extinguishment
or modification of debt and taxes (“EBIT,” a non-GAAP financial measure) provides a clearer comparison of the operating results of the
company quarter-over-quarter because it excludes: (1) corporate interest expense; (2) loss on extinguishment or modification of debt; and (3)
net realized investment gains (losses) that are unrelated to the company’s underlying fundamentals. The table above provides a reconciliation
of EBIT to net income.
($ millions)
CNO Financial Group
9
Operating ROE
CNO
Operating ROE*, Trailing 4 Quarters
*Operating return excludes loss on extinguishment or modification of debt, net realized investment gains (losses) and valuation
allowance related to deferred tax assets. Equity excludes accumulated other comprehensive income (loss) and the value of net
operating loss carryforwards. See Appendix for a reconciliation to the corresponding GAAP measure.
allowance related to deferred tax assets. Equity excludes accumulated other comprehensive income (loss) and the value of net
operating loss carryforwards. See Appendix for a reconciliation to the corresponding GAAP measure.
|
Average common shareholders’ equity,
excluding AOCI/L and net operating loss carryforwards, trailing 4 quarters: |
$2,551.1
|
$2,679.2
|
$2,808.3
|
$2,942.8
|
$3,048.5
|
($ millions)
CNO Financial Group
10
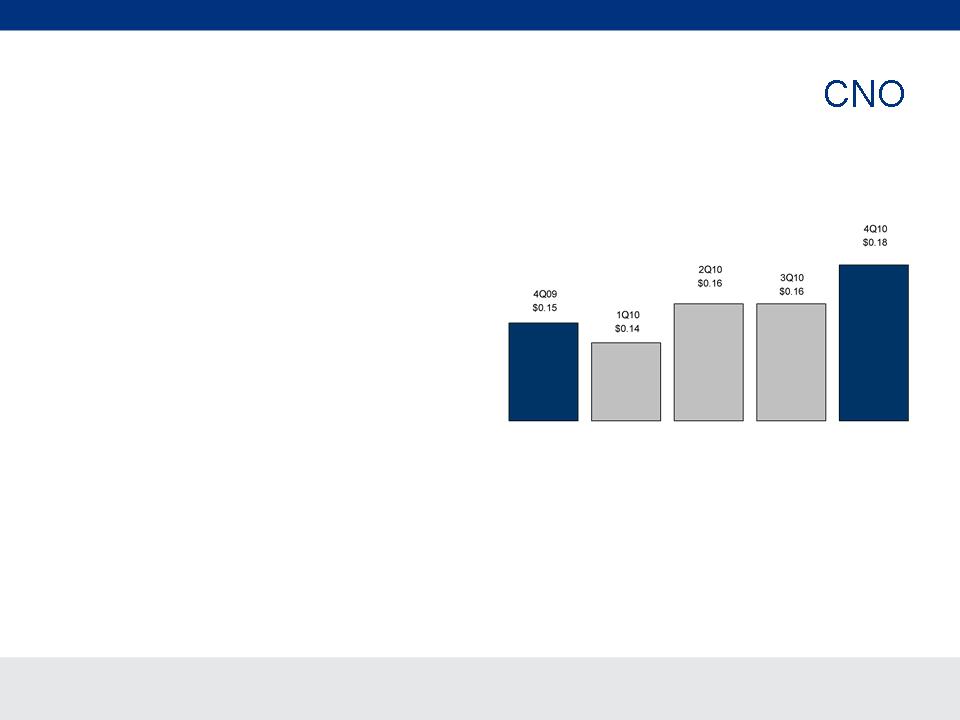
Operating EPS (Diluted)*
§ Increased EPS despite dilution
from recapitalization in 4Q09
from recapitalization in 4Q09
*Operating earnings per share exclude loss on extinguishment or modification of debt, net realized investment gains (losses) and
valuation allowance related to deferred tax assets. See Appendix for a reconciliation to the corresponding GAAP measure.
valuation allowance related to deferred tax assets. See Appendix for a reconciliation to the corresponding GAAP measure.
|
Weighted average diluted shares (in millions):
|
217.5
|
292.1
|
302.6
|
306.0
|
306.7
|
CNO Financial Group
11
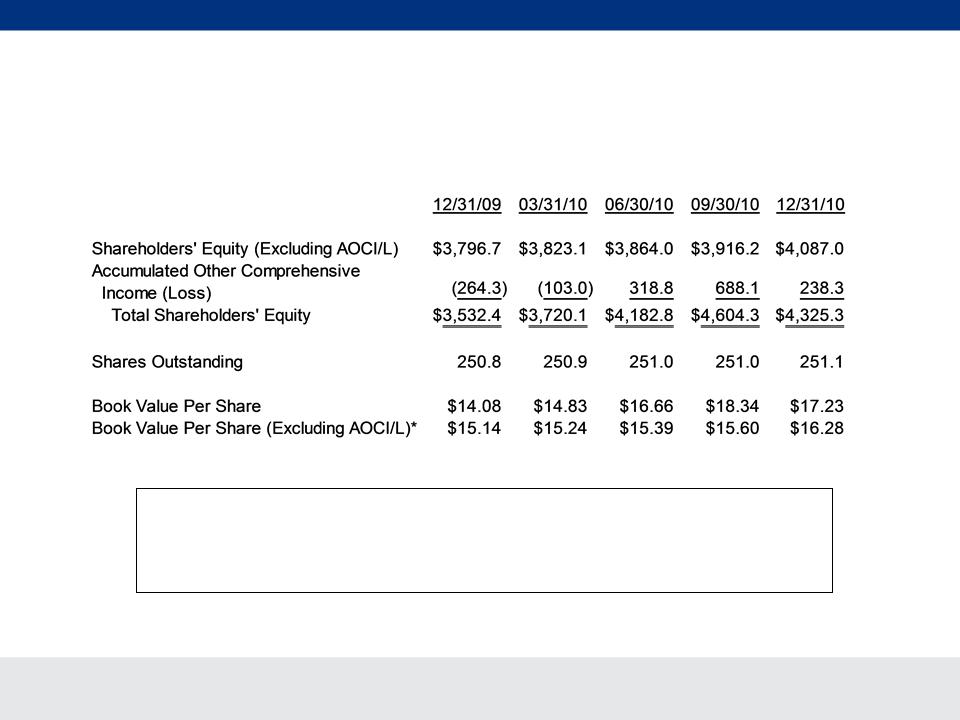
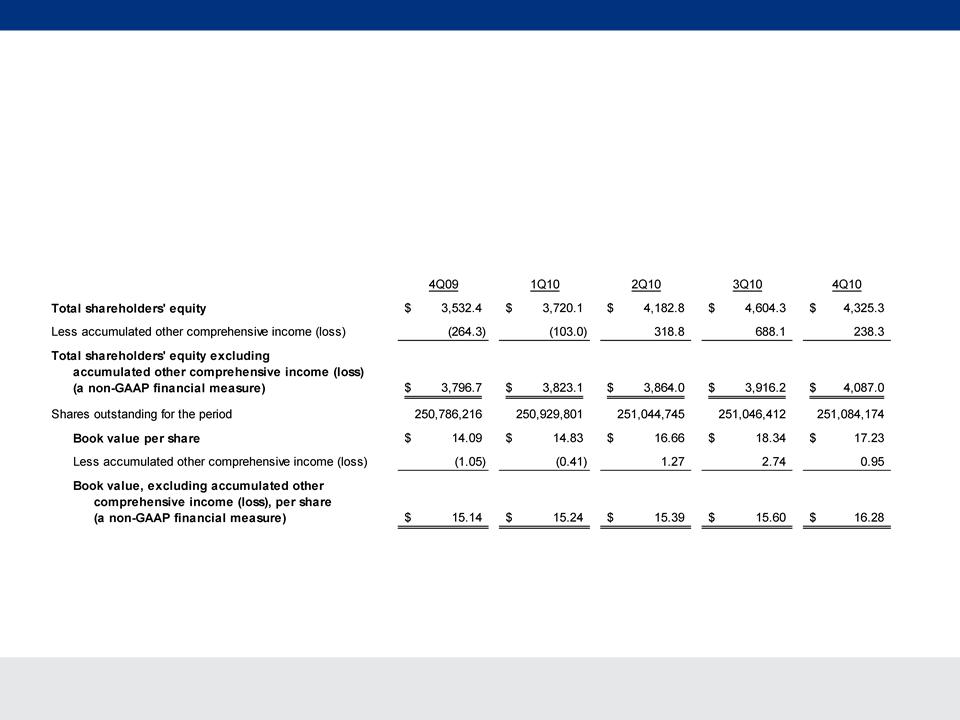
Book Value
CNO
*See Appendix for a reconciliation to the corresponding GAAP measure.
($ millions, except per-share amounts)
Book value per diluted share (excluding AOCI/L) as of December 31, 2010 was $14.23
– Includes dilutive impact of $293.0 million of 7.0% debentures
CNO Financial Group
12
CNO Financial Group
13
CNO Financial Group
14
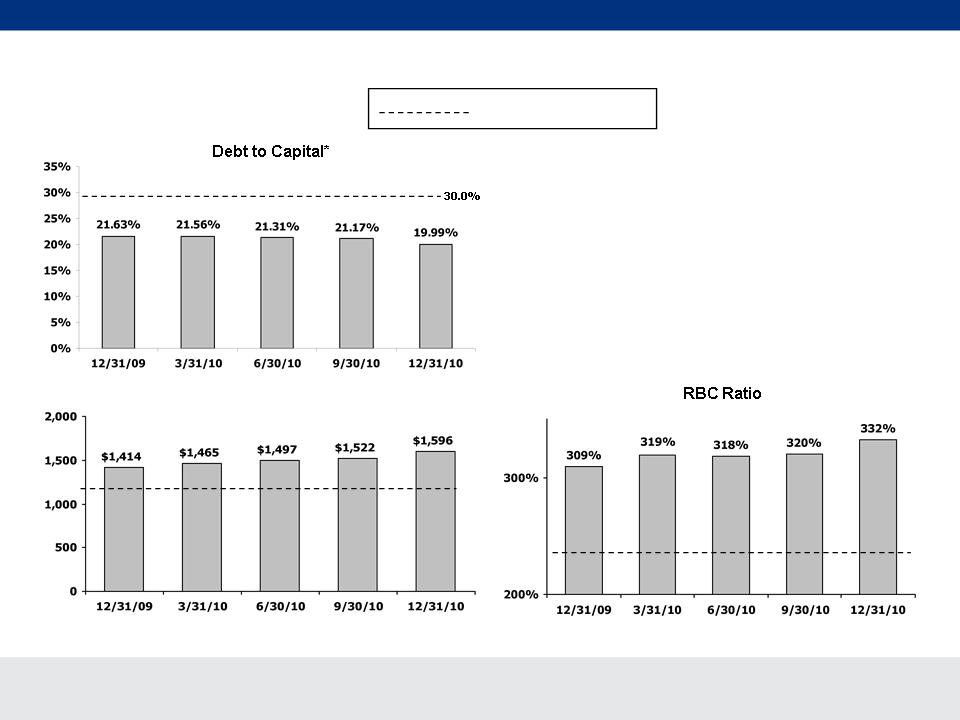
Financial Strength
§ RBC increased to 332% in 4Q10
– Positive impact from statutory operating income
(+22 points)
(+22 points)
– Impact of WNIC merger (+8 points)
– Impact of capital losses (-7 points)
– Other impacts, including surplus debenture
interest and increase in total investments (-11
points)
interest and increase in total investments (-11
points)
*Risk-Based Capital (“RBC”) requirements provide a tool for insurance regulators to determine the
levels of statutory capital and surplus an insurer must maintain in relation to its insurance and
investment risks. The RBC ratio is the ratio of the statutory consolidated adjusted capital of our
insurance subsidiaries to RBC.
levels of statutory capital and surplus an insurer must maintain in relation to its insurance and
investment risks. The RBC ratio is the ratio of the statutory consolidated adjusted capital of our
insurance subsidiaries to RBC.
Consolidated RBC Ratio*
§ Unrestricted cash held at the holding
company decreased $29 million to $161
million during 4Q10 primarily reflecting
the repayment of debt
company decreased $29 million to $161
million during 4Q10 primarily reflecting
the repayment of debt
Liquidity
($ millions)
|
21.63%
|
21.56%
|
21.31%
|
21.17%
|
19.99%
|
|
Debt to Total Capital Ratio**
|
**as defined in our Senior Secured Credit Agreement. See appendix for reconciliation
to GAAP measure.
to GAAP measure.

CNO Financial Group
15
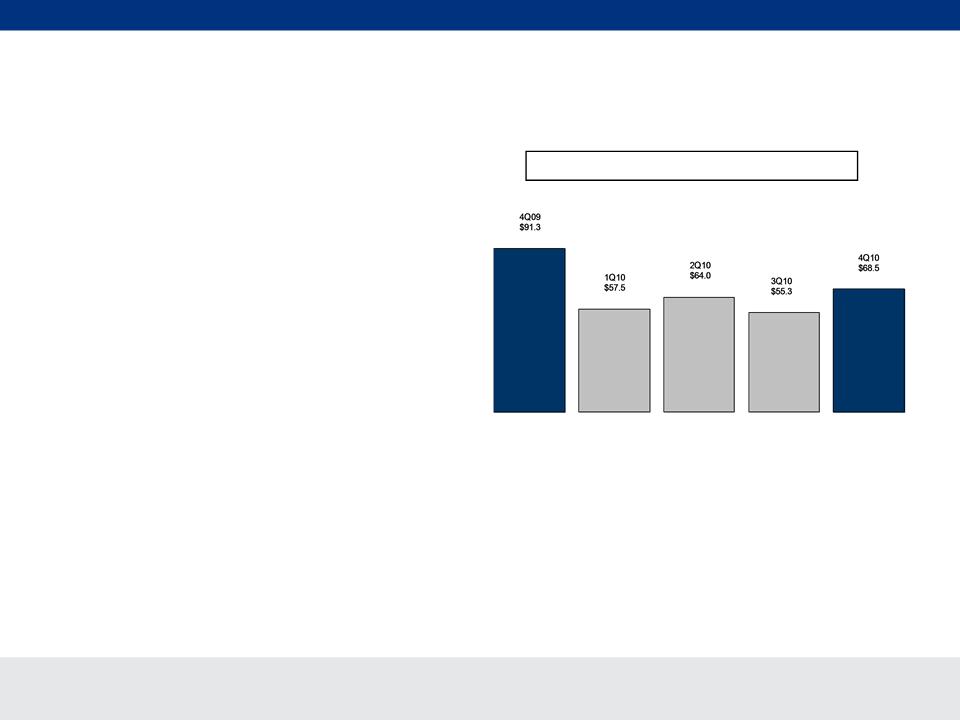
§ Earnings of $71.4 million, down 16%
– Results in 4Q10 were favorably impacted by $18 million from improved
spreads and growth in the annuity block
spreads and growth in the annuity block
– Results in 4Q10 were unfavorably impacted by:
• $4 million from unfavorable mortality
• $3 million from unfavorable Med Supp persistency
– Results in 4Q09 were favorably impacted by:
• $11 million from PFFS business we assumed from Coventry, the last of
which expired on January 1, 2010
which expired on January 1, 2010
• $10 million due to positive development of long-term care reserves and
the impact of policyholder actions following rate increases
the impact of policyholder actions following rate increases
• A $6 million out-of-period correction
4Q Summary
Bankers Life
CNO Financial Group
16
Sales and Distribution Results
§ Mixed sales results
– Med Supp sales 2nd highest in Bankers’
history
history
– Life and Annuity sales better than
industry results
industry results
• 16% increase in life sales
• 15% increase in annuity sales
– LTC sales in line with expectations
Bankers Life
Quarterly NAP*
*PFFS and PDP sales are not comparable and are excluded from NAP in all periods; in addition, we no longer assume any of the risks on
PFFS contracts through reinsurance.
PFFS contracts through reinsurance.
($ millions)
|
Med Supp policies issued (in thousands):
|
32.5
|
10.6
|
12.6
|
10.2
|
19.7
|
CNO Financial Group
17
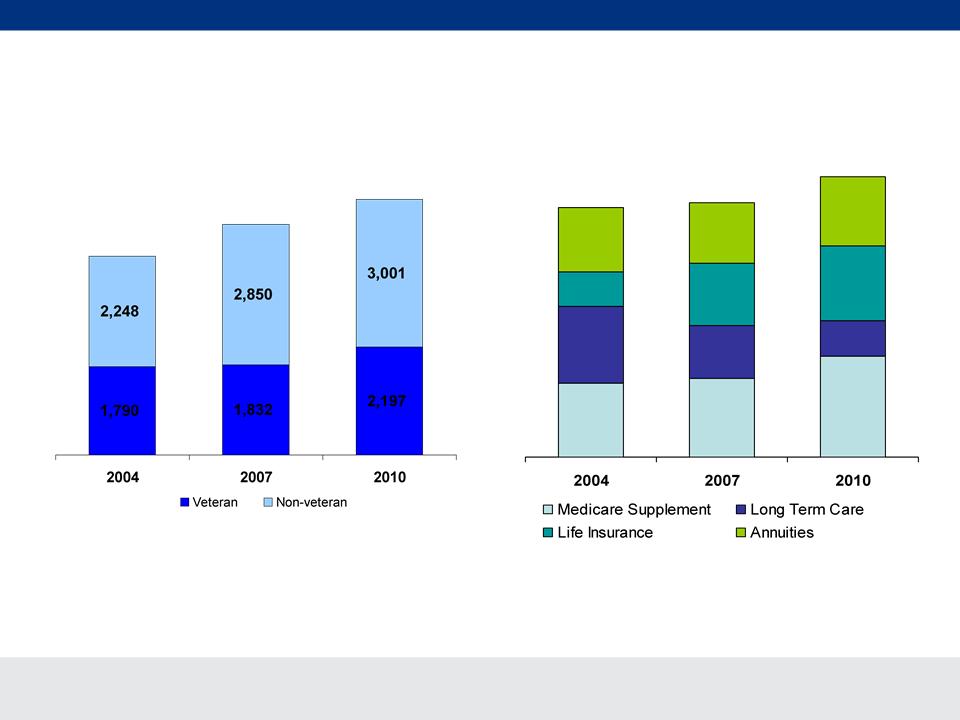
Distribution Value Proposition
Bankers Life
Average Agent Counts
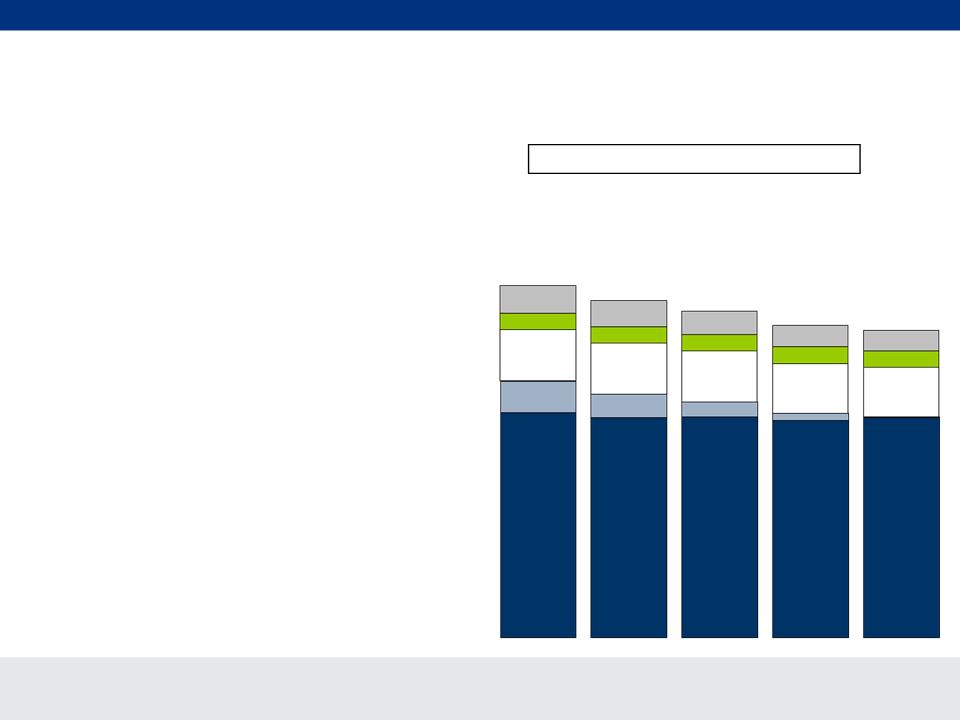
Diversified Product Suite (Share of Sales*)
4,682
4,038
5,198
$218.5
$222.4
$245.4
30%
30%
14%
26%
24%
24%
21%
31%
36%
13%
26%
25%
NAP in millions
*Excluding PFFS & PDP
§ Needs based market focus able to reach middle market boomers and seniors with straightforward products
§ Nationwide footprint with localized presence in key target markets (75% of sales take place within 10 miles of an agent’s home)
§ Bankers “franchise” model - standardization and development of best practices in key activities (e.g. recruiting/sales leads/ training)
drives productivity, consistency and compliance
drives productivity, consistency and compliance

CNO Financial Group
18
Bankers Life
§ LTC is an important product that enables Bankers Life to meet the needs
of its customers
of its customers
§ Stable financial results
§ Bankers experience and strategy enable us to differentiate through:
– Stringent underwriting
– Low exposure to higher risk product benefits (i.e. “0” day elimination period,
“lifetime” benefits, high compound inflation, etc.)
“lifetime” benefits, high compound inflation, etc.)
– Successful proactive in-force rate actions over last five years
– Rigorous claim management
– New business priced for higher returns
– Career Distribution channel positively impacts underwriting and re-rate results
LTC Update
CNO Financial Group
19
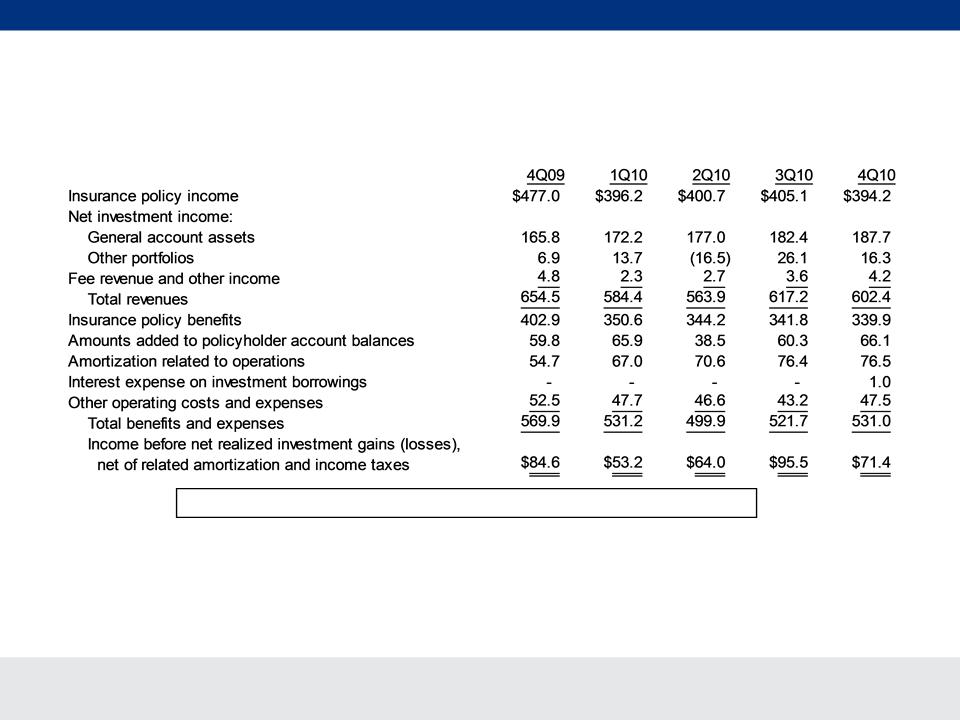
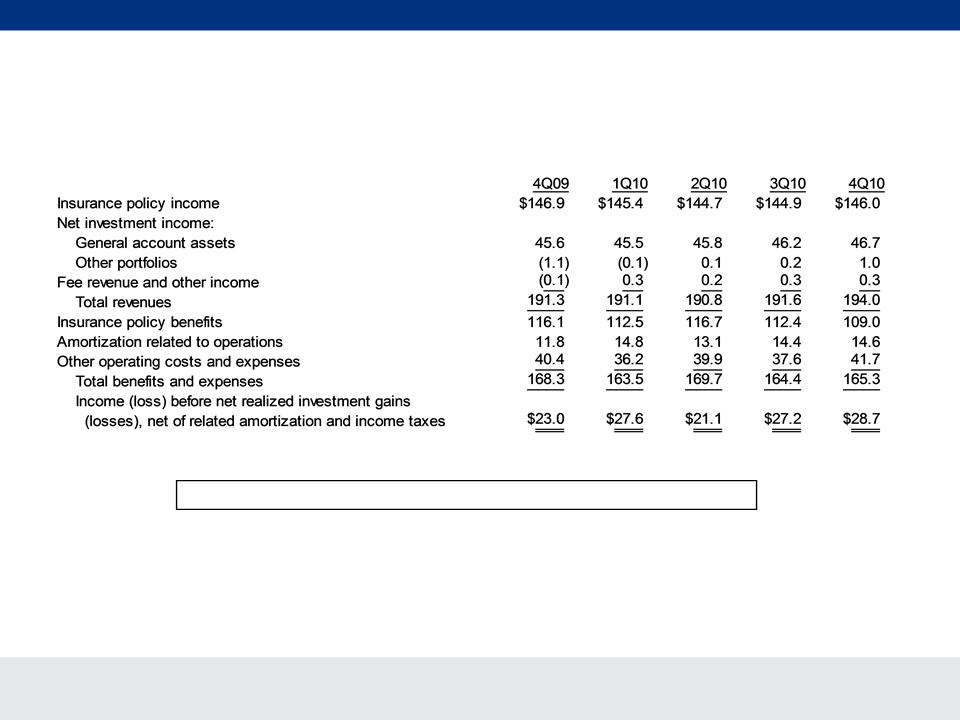
Quarterly Earnings
Management believes that an analysis of income before net realized investment gains (losses), net of related amortization (a non-GAAP
financial measure), is important to evaluate the financial performance of our business, and is a measure commonly used in the life insurance
industry. Management uses this measure to evaluate performance because realized gains or losses can be affected by events that are
unrelated to a company’s underlying fundamentals. The table on Page 8 reconciles the non-GAAP measure to the corresponding GAAP
measure. See Appendix for a reconciliation of the return on equity measure to the corresponding GAAP measure.
Trailing 4 Quarter Operating Return on Allocated Capital: 11.8%
Bankers Life
($ millions)

CNO Financial Group
20
§ Earnings of $28.7 million, up 25%
– Reflects an increase in earnings from our supplemental health
products due to growth in this block of business and lower claims
products due to growth in this block of business and lower claims
§ Sales (NAP) of $19 million, up 3%
– Supplemental health NAP of $17.5 million, up 15%
§ Strong supplemental health sales growth in both WNIC
Independent and PMA channels
Independent and PMA channels
4Q Summary
Washington National
CNO Financial Group
21
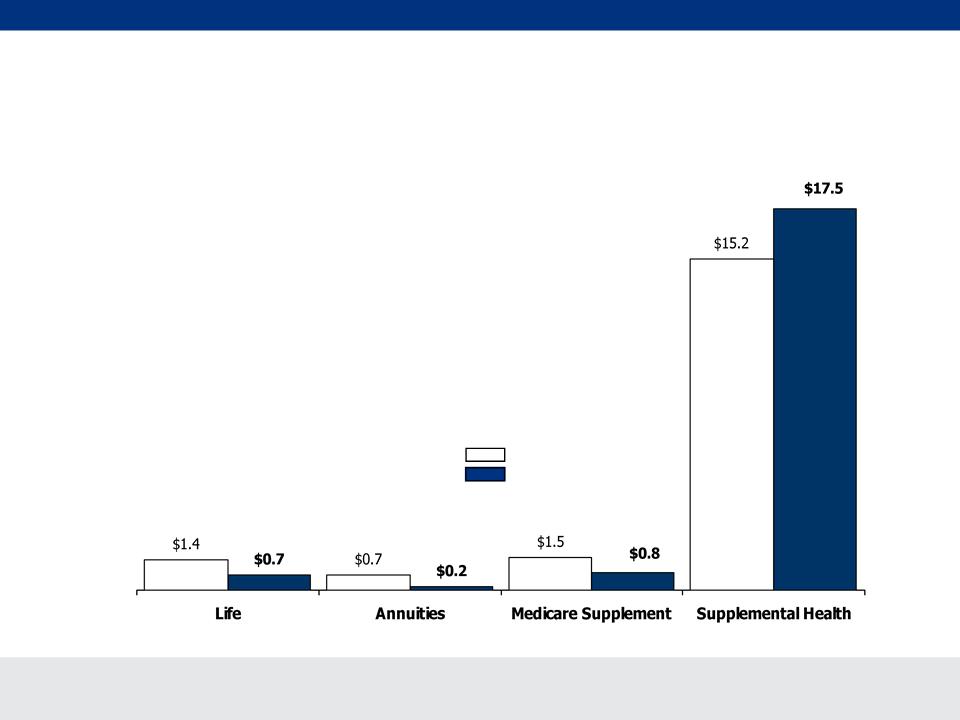
Washington National
§ Supplemental health sales up 15%
– PMA up 18%
– WNIC Independent up 8%
§ Worksite sales* up 3%
– WNIC Independent up 20%
– PMA down 3%
4Q09 NAP
4Q10 NAP
4Q10 Sales Results
* Worksite sales include supplemental health and life
($ millions)
CNO Financial Group
22
Quarterly Earnings
Washington National
Management believes that an analysis of income (loss) before net realized investment gains (losses), net of related amortization (a non-
GAAP financial measure), is important to evaluate the financial performance of our business, and is a measure commonly used in the life
insurance industry. Management uses this measure to evaluate performance because realized gains or losses can be affected by events
that are unrelated to a company’s underlying fundamentals. The table on Page 8 reconciles the non-GAAP measure to the corresponding
GAAP measure.
Trailing 4 Quarter Operating Return on Allocated Capital: 9.9%
($ millions)

CNO Financial Group
23
§ Earnings of $5.8 million, compared to $5.9 million
– Unfavorable mortality in life products
– Substantially offset by increased earnings in core life products due
to growth and higher investment yields
to growth and higher investment yields
§ Sales growth continues:
– NAP up 13%
– 2010 sales up 11%
– 2010 lead generation up 35%
Summary
Colonial Penn
CNO Financial Group
24
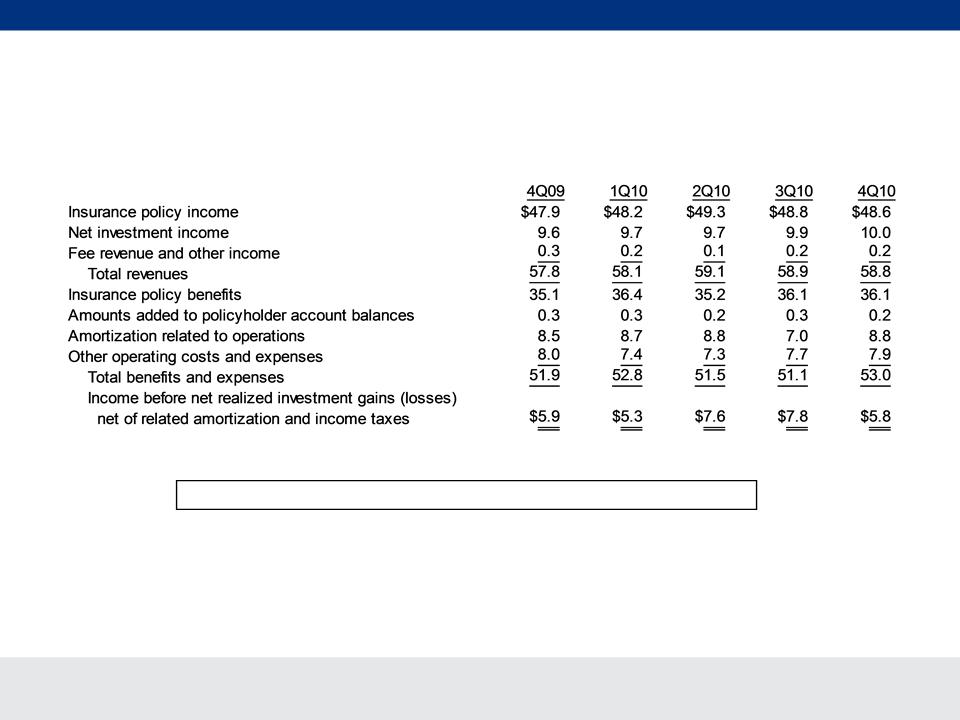
Quarterly Earnings
Colonial Penn
Management believes that an analysis of income before net realized investment gains (losses), net of related amortization (a non-GAAP
financial measure), is important to evaluate the financial performance of our business, and is a measure commonly used in the life
insurance industry. Management uses this measure to evaluate performance because realized gains or losses can be affected by events
that are unrelated to a company’s underlying fundamentals. The table on Page 8 reconciles the non-GAAP measure to the corresponding
GAAP measure. See Appendix for a reconciliation of the return on equity measure to the corresponding GAAP measure.
Trailing 4 Quarter Operating Return on Allocated Capital: 7.6%
($ millions)

CNO Financial Group
25
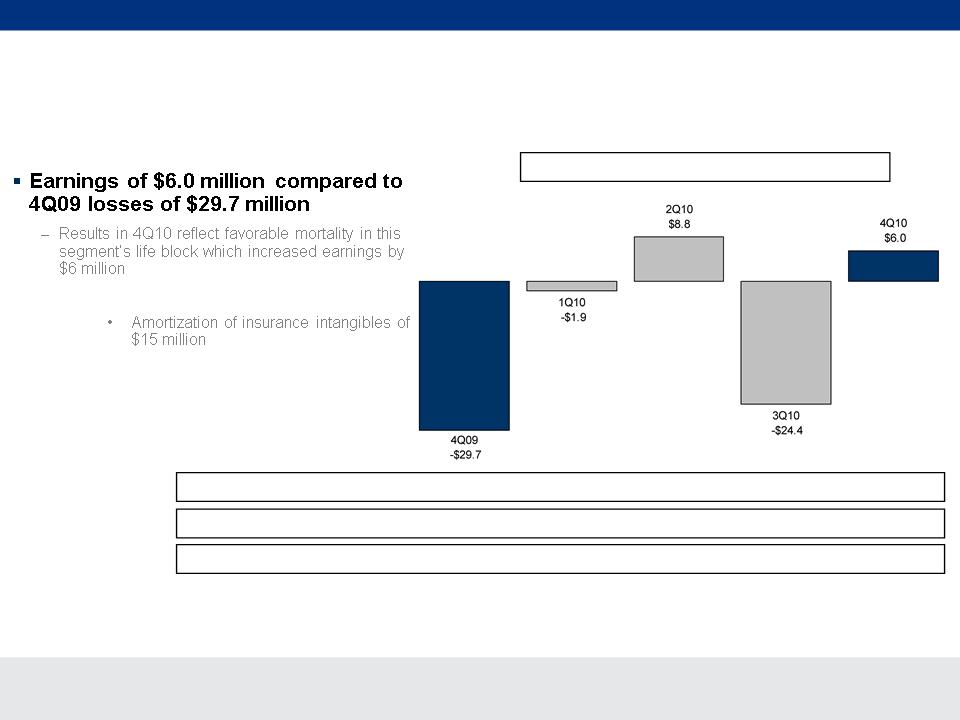
§ Earnings of $6.0 million, compared to loss of $29.7 million
– Results in 4Q10 reflect favorable mortality in this segment’s life block
which increased earnings by $6 million
which increased earnings by $6 million
– Results in 4Q09 were unfavorably impacted by:
• Amortization of insurance intangibles of $15 million
• Regulatory and legal settlements of $14 million
4Q Summary
Other CNO Business

CNO Financial Group
26
Sharpened Focus
§ Continued focus on:
– Non-Guaranteed Element Management
– Expense Management
– Risk Mitigation
§ Near-term results expected to continue to be volatile
– Portions of the business are in loss recognition
– Present value impact of some assumption changes
– NGE changes require a methodical approach
§ Yue vs. Conseco Life Litigation
– Rate increase in question had been previously withdrawn
– Appealing court’s declaratory judgment as to what items could be considered in future cost of insurance (COI) rate
increases on these ValueLife/ValueTerm policies
increases on these ValueLife/ValueTerm policies
– Conseco Life is preparing COI rate increases consistent with court decision and regulatory settlement agreement
– No reserve increase or intangible write-off resulted from court’s decision
Other CNO Business
CNO Financial Group
27
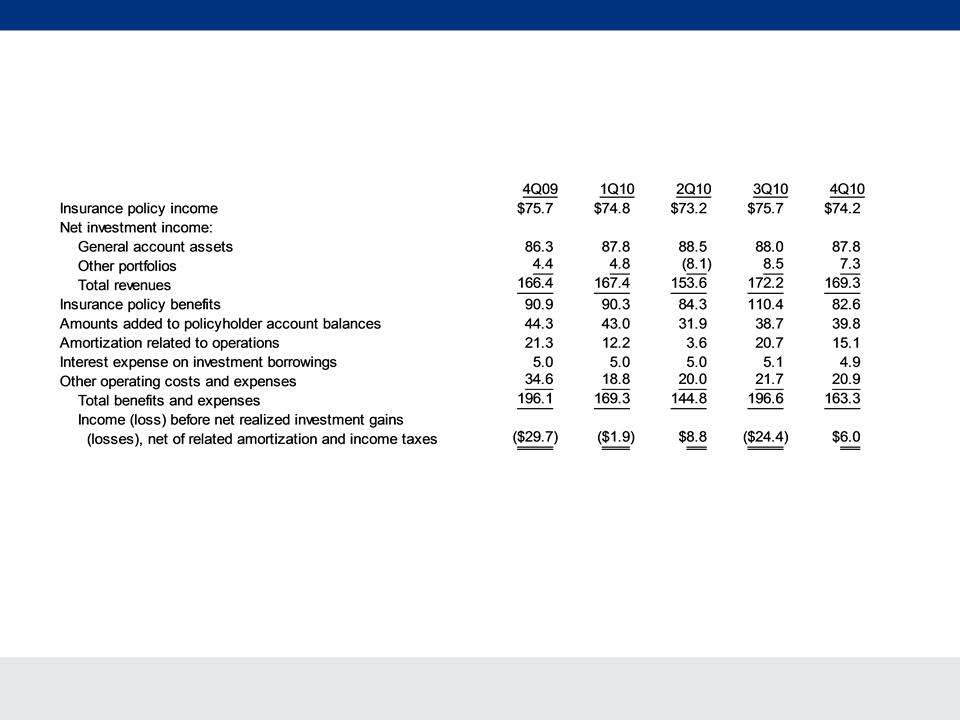
Quarterly Earnings (Losses)
Other CNO Business
Management believes that an analysis of income (loss) before net realized investment gains (losses), net of related amortization (a non-
GAAP financial measure), is important to evaluate the financial performance of our business, and is a measure commonly used in the life
insurance industry. Management uses this measure to evaluate performance because realized gains or losses can be affected by events
that are unrelated to a company’s underlying fundamentals. The table on Page 8 reconciles the non-GAAP measure to the corresponding
GAAP measure.
GAAP financial measure), is important to evaluate the financial performance of our business, and is a measure commonly used in the life
insurance industry. Management uses this measure to evaluate performance because realized gains or losses can be affected by events
that are unrelated to a company’s underlying fundamentals. The table on Page 8 reconciles the non-GAAP measure to the corresponding
GAAP measure.
($ millions)

CNO Financial Group
28
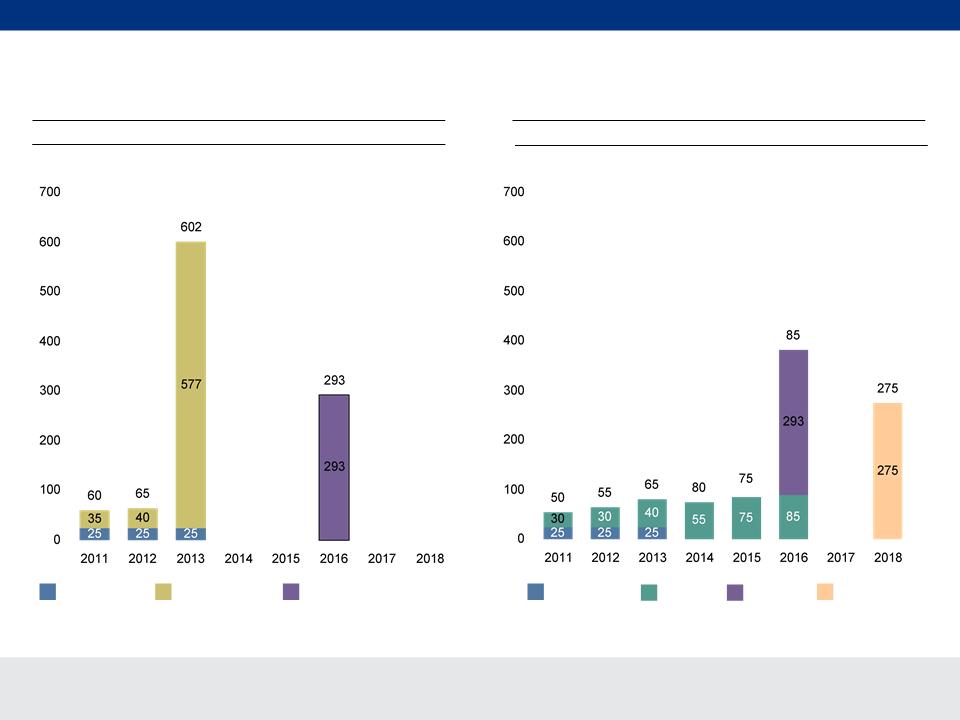
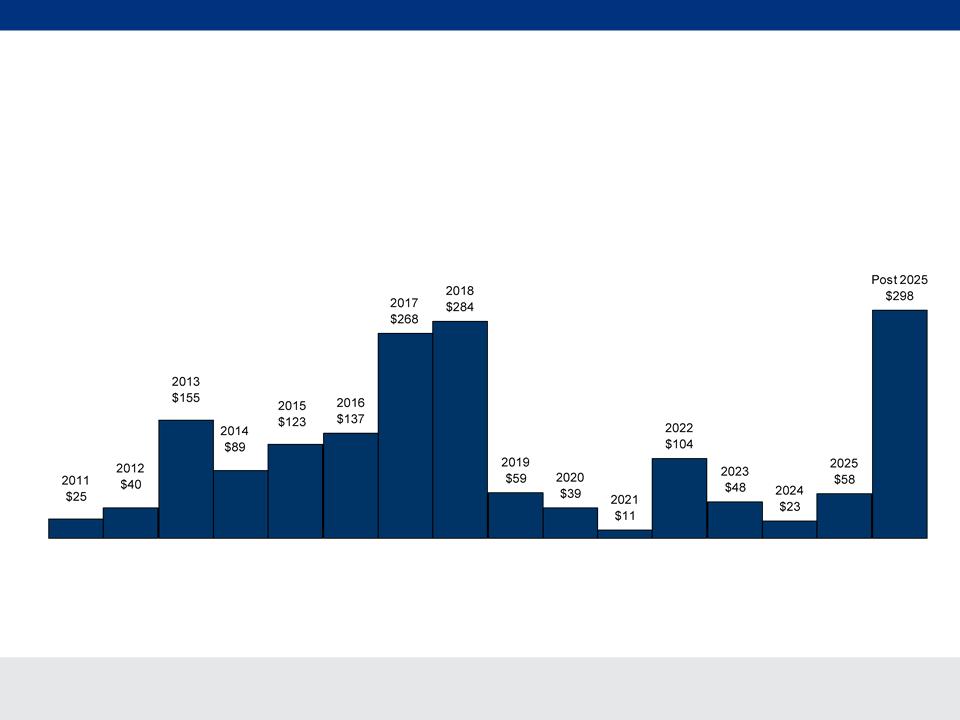
2010 Refinancing
§ $650 million of new financing
– $275 million 9.0% senior secured notes due January 2018
– $375 million senior secured credit facility amortizing through
September 2016
September 2016
§ Proceeds used to extinguish the previous senior secured credit facility of
$652 million
$652 million
§ Extended debt maturity profile by over 3 years
§ Diversified sources of financing
§ Increased financial flexibility
CNO Financial Group
29
2011 - 2018
2011 - 2018
Term Loan
Sr. Health Note
Convertible
9% Notes
Sr. Health Note
Convertible Debentures
Sr. Credit Facility
(1) Conversion price is $5.49. CNO can force conversion after 6/30/13 if CNO stock trades above $7.69 for 20 or more days in a consecutive 30 day trading
period. On 12/31/2010, CNO’s stock closed at $6.78.
period. On 12/31/2010, CNO’s stock closed at $6.78.
(1)
Prior Maturity Profile
Current Maturity Profile
($ millions)
$
$
Debt Maturity Profile
CNO Financial Group
30
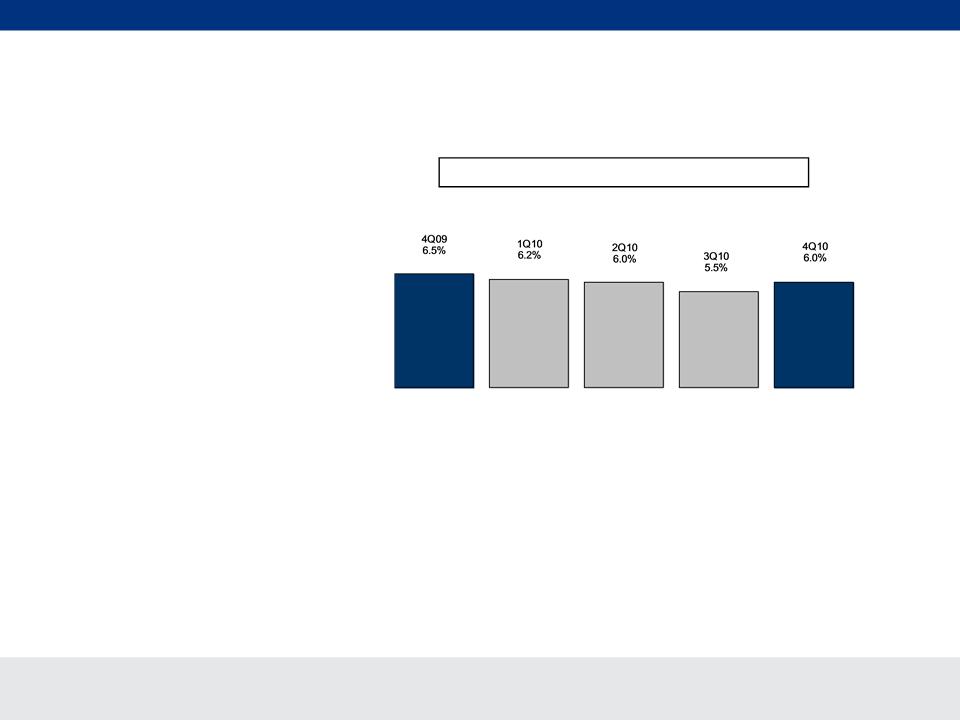
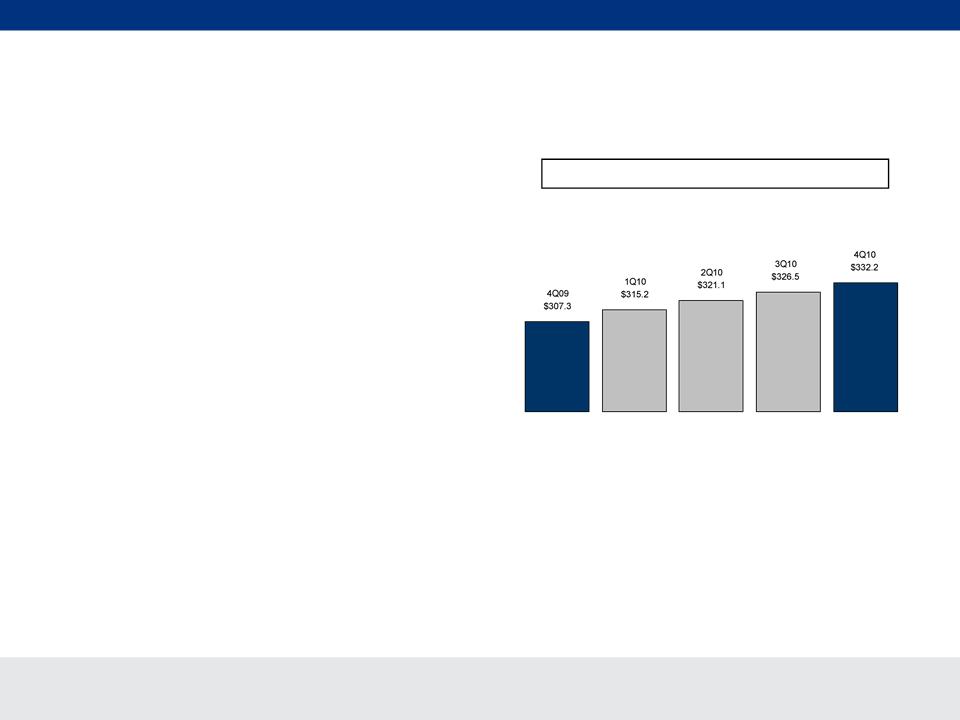
Net Investment Income
CNO
§ Increase in investment income due
principally to growth in average assets
principally to growth in average assets
§ 4Q10 decline in realized yield due primarily to
expansion of FHLB loans
expansion of FHLB loans
– Floating rate
– Matched
§ Full year portfolio yield increase due
primarily to investments at yields exceeding
portfolio rate
primarily to investments at yields exceeding
portfolio rate
General Account Investment Income
|
Yield:
|
5.63%
|
5.76%
|
5.83%
|
5.86%
|
5.77%
|
($ millions)
CNO Financial Group
31
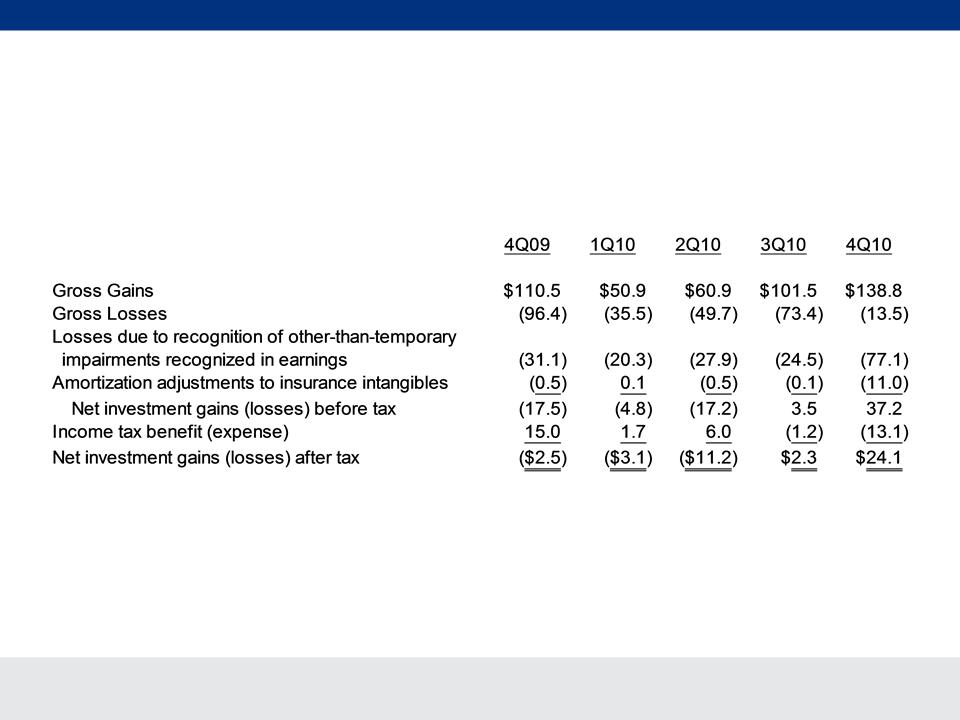
Realized Gains/Losses Recognized
through Net Income
CNO
($ millions)
CNO Financial Group
32
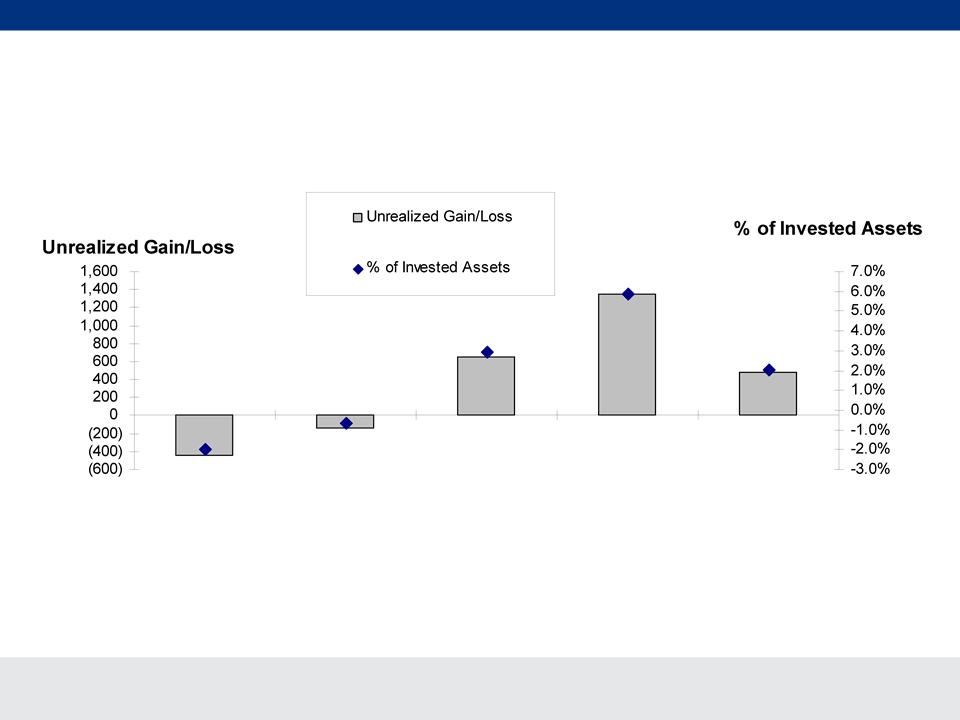
Unrealized Gain/Loss*
CNO
($ millions)
*Includes debt and equity securities classified as available for sale. Excludes investments from variable interest entities which we
consolidate under GAAP.
consolidate under GAAP.
4Q09
1Q10
2Q10
3Q10
4Q10
$
CNO Financial Group
33
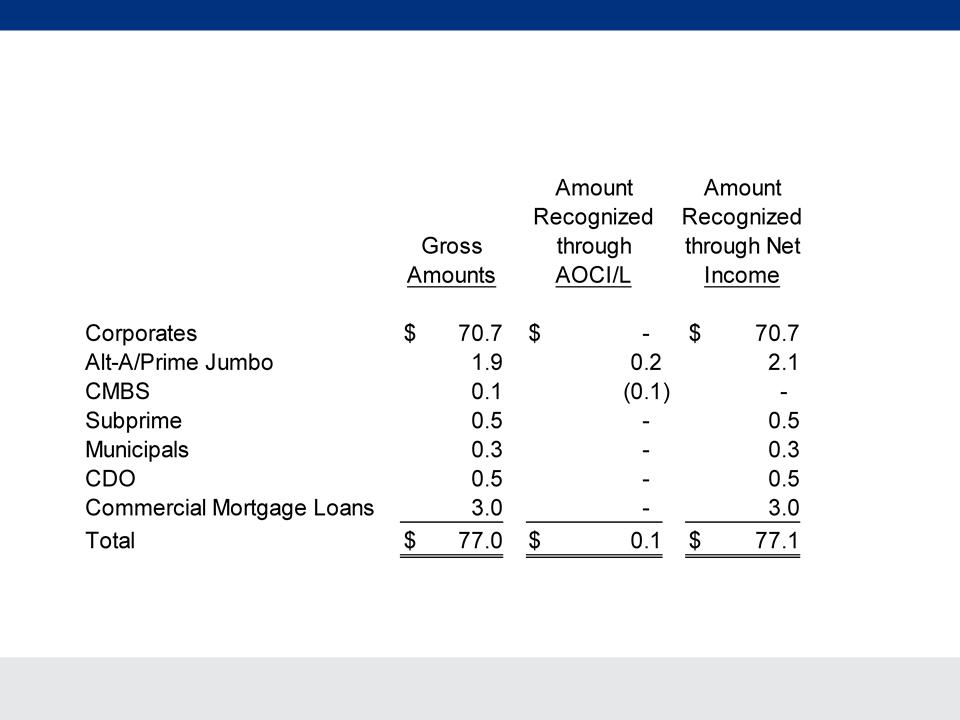
4Q10 Impairments
CNO
($ millions)
CNO Financial Group
34
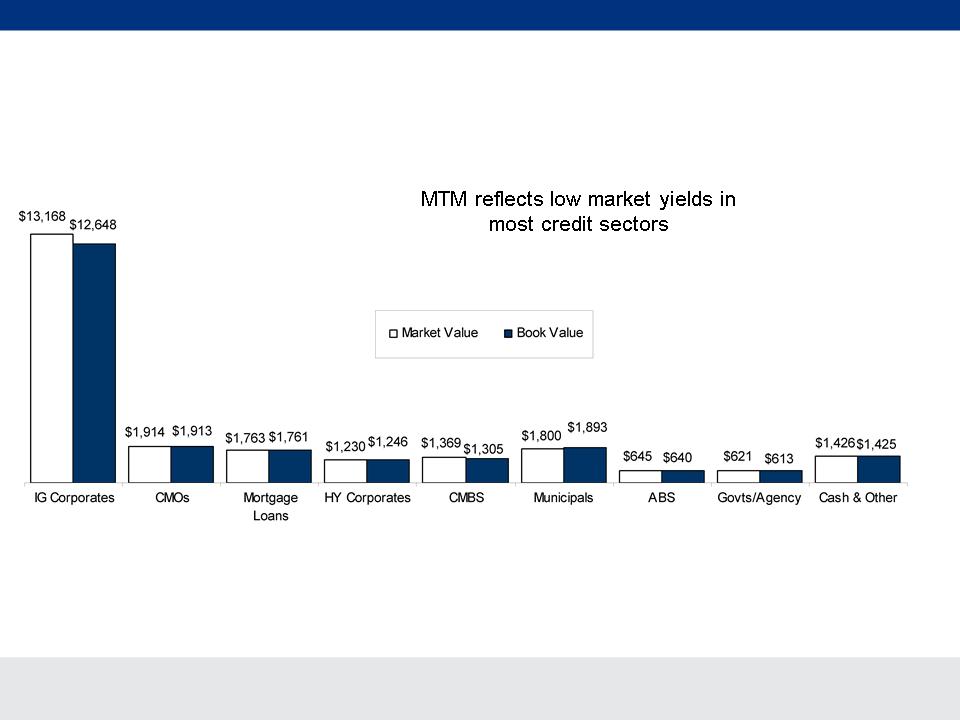
Asset Allocation at 12/31/10*
CNO
*Excludes investments from variable interest entities which we consolidate under GAAP (the related liabilities are non-recourse to CNO).
($ millions)
CNO Financial Group
35
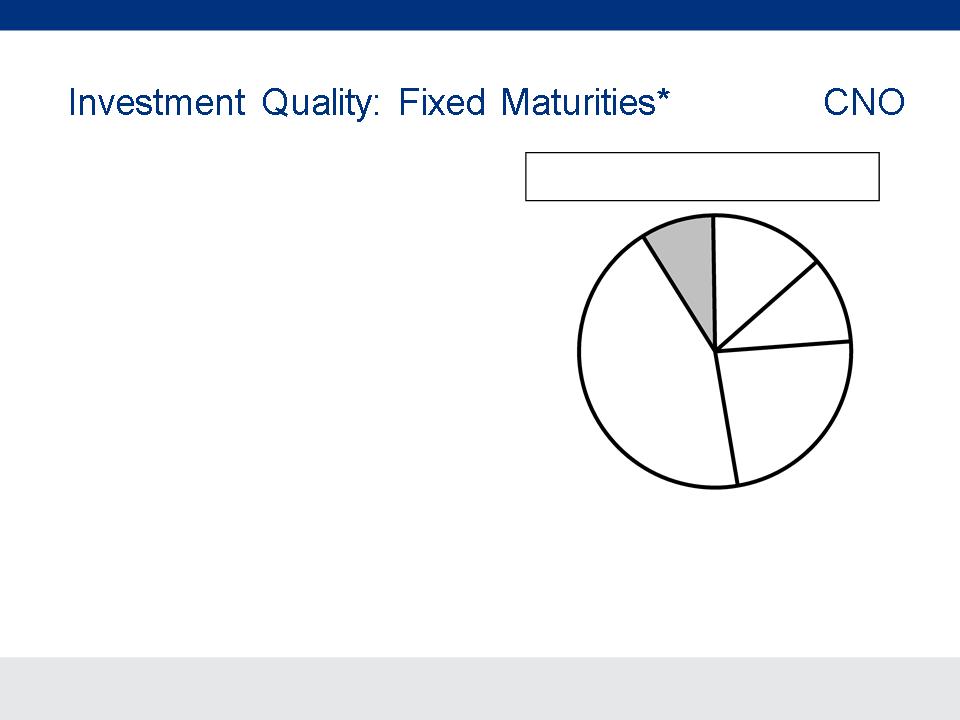
§ 91% investment grade
Fixed Maturities, available for sale, by Rating
at 12/31/10 (Market Value)
at 12/31/10 (Market Value)
|
% of Bonds which are Investment Grade:
|
12/31/09
93%
|
3/31/10
93%
|
6/30/10
92%
|
9/30/10
92%
|
12/31/10
91%
|
*Excludes investments from variable interest entities which we consolidate under GAAP (the related liabilities are non-recourse to CNO).
AAA
14%
AA
10%
A
23%
BBB
44%
<BBB
9%
CNO Financial Group
36
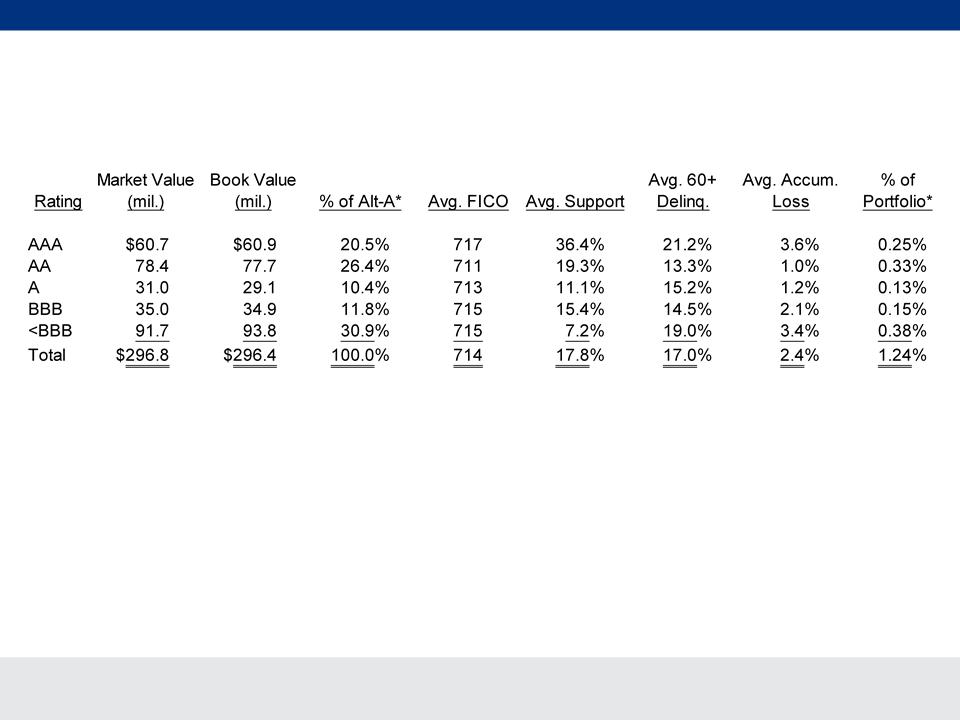
Alt-A at 12/31/10
CNO
§ 1.2% of total invested assets
§ 100% NAIC 1 classification
§ Substantial proportion of investments purchased at discounts reflective of current market
expectations for cash flows from collateral
expectations for cash flows from collateral
§ Collateral performing better than overall Alt-A collateral universe in terms of delinquency and
accumulated loss trends
accumulated loss trends
§ All securities evaluated using market-consistent estimates of future collateral performance
*Market value.
($ millions)
CNO Financial Group
37
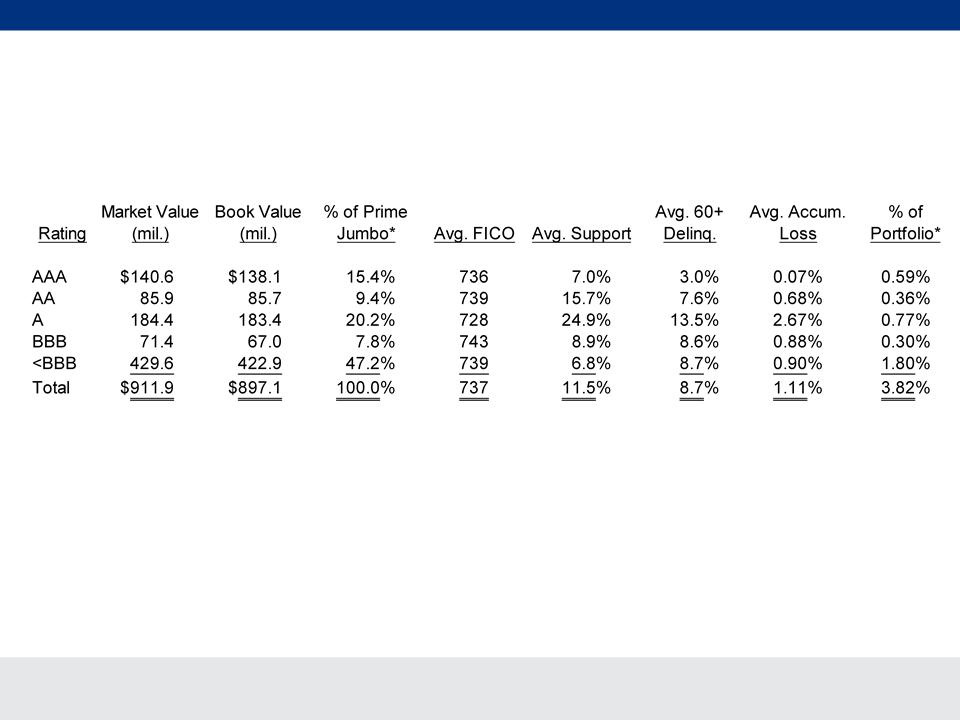
Prime Jumbo at 12/31/10
CNO
§ 3.8% of total invested assets
§ 98% NAIC 1 classification
§ Substantial proportion of investments purchased at discounts reflective of current
market expectations for cash flows from collateral
market expectations for cash flows from collateral
§ All securities evaluated using market-consistent estimates of collateral performance
§ Credit support remains substantial relative to anticipated cumulative losses
*Market value.
($ millions)
CNO Financial Group
38
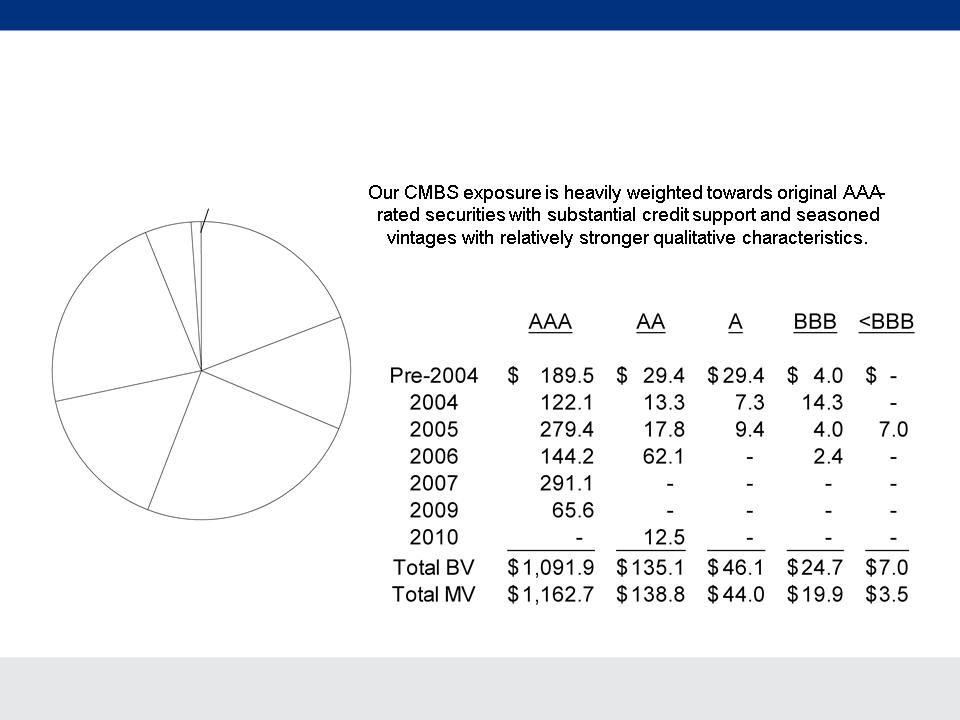
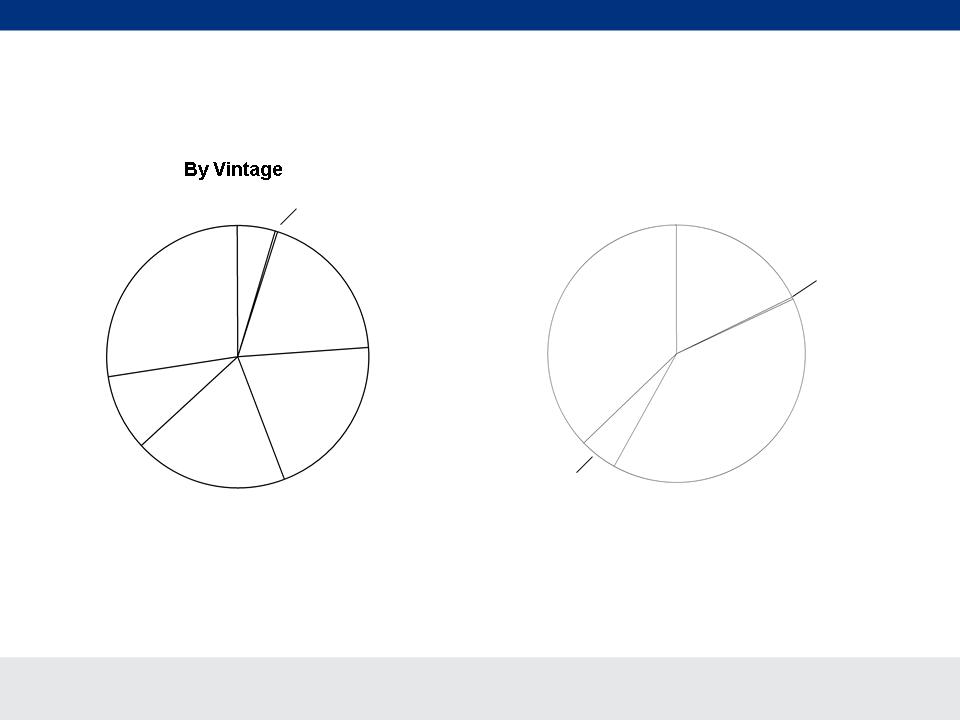
CMBS at 12/31/10
CNO
Pre-2004
19.3%
2004
12.0%
2005
24.4%
2006
16.0%
2007
22.3%
2009
5.0%
($ millions)
2010
1.0%
CNO Financial Group
39
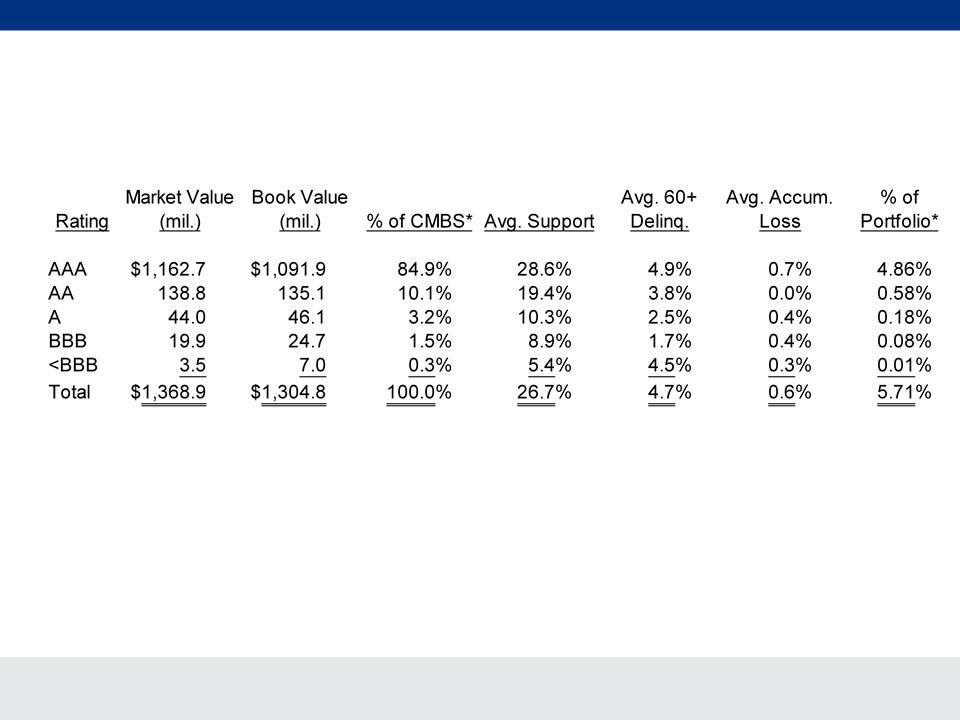
CMBS at 12/31/10
CNO
§ 5.7% of invested assets
§ 99.5% NAIC 1 classification
§ Negligible effect from Blackrock/NAIC rating process
§ Collateral performing materially better than overall CMBS collateral universe in terms of delinquency
and cumulative loss
and cumulative loss
§ All securities evaluated using market-consistent estimates of collateral performance
§ Substantial credit support inherent in structures relative to expected cumulative losses
*% of market value
($ millions)
CNO Financial Group
40
Commercial Mortgage Loans at 12/31/10
CNO
By Property Type
§ Current LTV of approximately 60.1%
§ Trailing debt service coverage ratio (DSCR) stable at approximately 1.41
§ As of 12/31/10, 1 delinquent loan ($.1mm unpaid balance)
2010
4.7%
4.7%
2009
0.4%
0.4%
2008
18.7%
18.7%
2007
20.4%
20.4%
2006
18.9%
18.9%
2005
9.4%
9.4%
2004 and Prior
27.5%
27.5%
Office
37.2%
37.2%
Indus.
17.9%
17.9%
Other
0.2%
0.2%
Retail
39.8%
39.8%
Multi-
Family
4.9%
Family
4.9%

CNO Financial Group
41
Summary
§ Solid earnings continued in Q4
§ Refinanced debt in Q4, provides more flexibility going
forward
forward
§ Improvements being recognized
– Credit rating upgrades
– Reduction in tax valuation allowance
§ Continued emphasis on profitable growth
– 2011 first year of baby boomers turning 65
– Adding 15 new locations for Bankers Life in 2011
– Expanding PMA’s recruiting capacity and sales
management team
management team
CNO

CNO Financial Group
42
Questions and Answers

CNO Financial Group
43
Appendix
CNO Financial Group
44
Covenant Metrics
Interest Coverage Ratio
Statutory Surplus ($ millions)
*Excludes Accumulated Other Comprehensive Income (Loss), as defined by the senior credit facility
$1,200
CNO
225%
Levels reflect covenants per
new agreement
new agreement
§ The ratio of available cash flow to interest
expense must equal or exceed 2.0
expense must equal or exceed 2.0
§ Covenant requirement begins 3/31/2011
CNO Financial Group
45
4Q10 Liquidity
CNO
($ millions)
CNO Financial Group
46
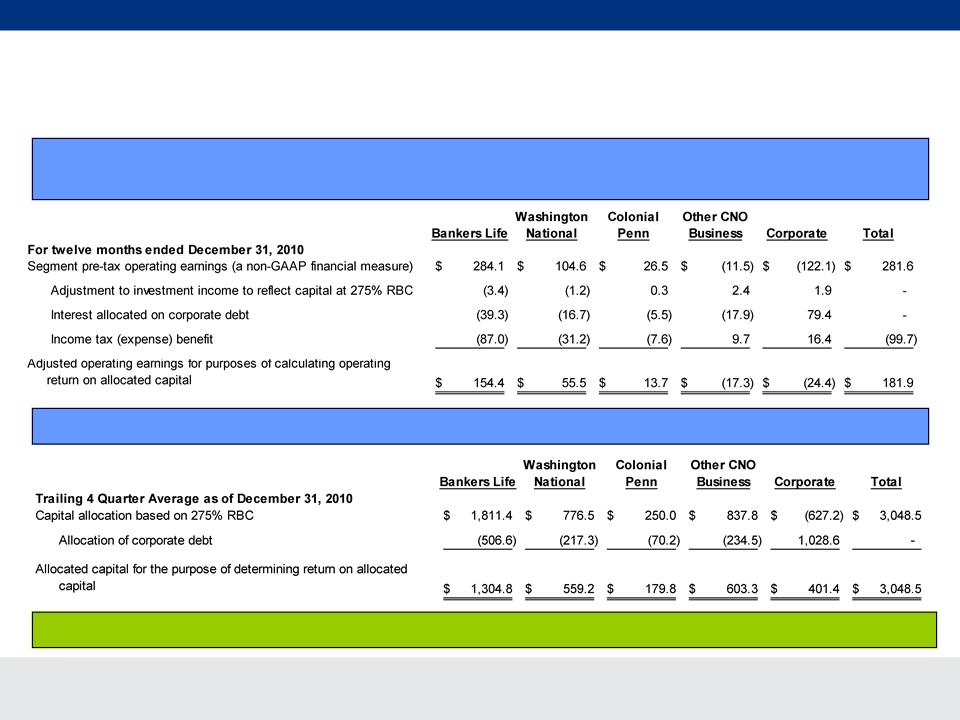
Operating Return on Allocated Capital Computation*
Adjusted operating earnings for the purpose of calculating operating return on allocated
capital is determined as follows:
capital is determined as follows:
Allocated capital is calculated as follows:
* A non-GAAP financial measure. Refer to the Appendix for a reconciliation to the corresponding GAAP measure.
Operating Return on Allocated Capital: 11.8% 9.9% 7.6% -2.9% -6.1% 6.0%
($ millions)
CNO Financial Group
47
Commercial Mortgage Loans at 12/31/10
CNO
Pacific
10.1%
Mountain
10.2%
West North
Central
Central
14.0%
West South
Central
Central
6.5%
East North
Central
Central
15.6%
East South
Central
Central
3.1%
New England
9.0%
Middle
Atlantic
Atlantic
8.5%
South
Atlantic
Atlantic
23.0%
CNO Financial Group
48
Commercial Mortgage Loans at 12/31/10
By Maturity
CNO
($ millions)
CNO Financial Group
49
Collected Premiums
CNO
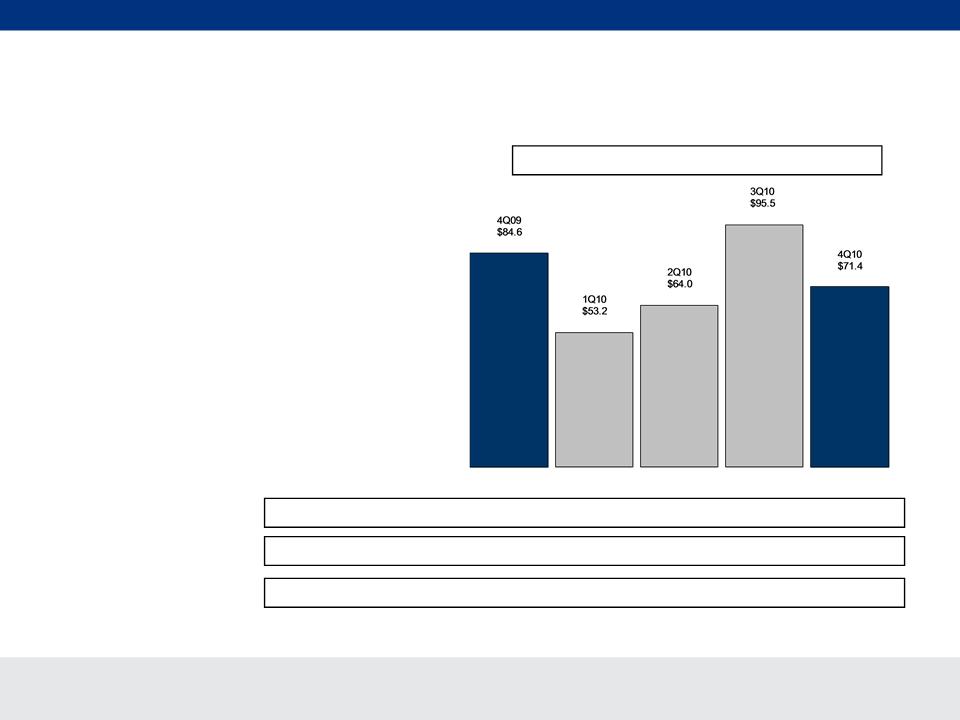
§ Trailing 4 quarters down 13%
– Decline at Bankers Life due
primarily to termination of
PFFS reinsurance contracts
primarily to termination of
PFFS reinsurance contracts
– Stable results at Colonial
Penn
Penn
– Slight decline at Washington
National primarily due to
Wilton Re transaction in
3Q09
National primarily due to
Wilton Re transaction in
3Q09
– Decline at OCB primarily
due to Wilton Re transaction
in 3Q09 and continued run-
off of inforce blocks, as
expected
due to Wilton Re transaction
in 3Q09 and continued run-
off of inforce blocks, as
expected
CP
Washington
National
National
Collected Premiums -Trailing 4 Quarters
4Q09
$4,114.8
1Q10
$3,937.2
BLC OTHER
2Q10
$3,819.6
BLC PFFS
3Q10
$3,651.1
4Q10
$3,590.1
OCB
($ millions)
CNO Financial Group
50
Segment Performance
Bankers Life
*Operating earnings exclude net realized gains (losses). See Appendix for corresponding GAAP measure of our consolidated results of
operations.
operations.
§ Earnings of $71.4 million, down
16%
16%
– Results in 4Q10 were favorably impacted by $18 million
increase from improved spreads and growth in the annuity
block
increase from improved spreads and growth in the annuity
block
– Results in 4Q10 were unfavorably impacted by:
• $4 million from unfavorable mortality
• $3 million from unfavorable Med Supp persistency
– Results in 4Q09 were favorably impacted by:
• $11 million from PFFS business we assumed from
Coventry, the last of which expired on January 1, 2010
Coventry, the last of which expired on January 1, 2010
• $10 million due to positive development of long-term
care reserves and the impact of policyholder actions
following rate increases
care reserves and the impact of policyholder actions
following rate increases
• A $6 million out-of-period correction
PTOI-Trailing 4 Quarters: $278.0 $286.5 $287.2 $297.3 $284.1
Revenues-Quarterly: $654.5 $584.4 $563.9 $617.2 $602.4
Pre-Tax Operating Income*
Revenues -Tr. 4 Quarters: $2,647.5 $2,596.8 $2,497.9 $2,420.0 $2,367.9
($ millions)
CNO Financial Group
51
Premiums - Med Supp
§ First-year premiums up 8%
Med Supp - First-Year Premiums
Bankers Life
($ millions)
Policies issued and not included in NAP (net of chargebacks, in thousands):
|
PFFS policies issued:
|
-1.0
|
22.8
|
-0.4
|
0.1
|
0.4
|
|
PDP policies issued:
|
1.3
|
8.0
|
0.3
|
1.0
|
0.4
|
|
Med Supp First-Year Prems.-Tr. 4 Qtrs:
|
$91.7
|
$99.2
|
$107.5
|
$114.1
|
$116.4
|
|
Med Supp Total Premiums-Quarterly:
|
$173.8
|
$176.6
|
$168.8
|
$170.1
|
$182.3
|
|
Med Supp NAP-Quarterly:
|
$56.8
|
$19.4
|
$21.0
|
$16.0
|
$31.8
|
|
Med Supp NAP-Trailing 4 Quarters:
|
$114.3
|
$115.3
|
$117.1
|
$113.2
|
$88.2
|
CNO Financial Group
52
Premiums - Long-Term Care
§ Net first-year premiums* up 5%,
reflecting reduction in new
business reinsurance
reflecting reduction in new
business reinsurance
First-Year Prems.-Tr. 4 Qtrs: $17.7 $18.3 $19.1 $21.9 $22.2
Total Premiums-Quarterly: $149.5 $149.5 $146.6 $145.0 $143.5
Long-Term Care - First-Year Premiums*
NAP-Quarterly: $8.3 $8.6 $8.7 $7.2 $6.7
NAP-Trailing 4 Quarters: $35.4 $36.5 $35.4 $32.8 $31.2
*Includes $3.4 million in 4Q09, $4.3 million in 1Q10, $3.7 million in 2Q10, $2.8 million in 3Q10 and $2.0 million in 4Q10 of premiums
ceded under business reinsurance agreement.
ceded under business reinsurance agreement.
4Q09
(Direct)
$9.3
1Q10
(Direct)
$9.1
2Q10
(Direct)
$9.2
3Q10
(Direct)
$8.5
4Q10
(Direct)
$8.2
Bankers Life
($ millions)
CNO Financial Group
53
Premiums - Life Insurance
§ First year premiums up 17%
First-Year Prems.-Tr. 4 Qtrs: $82.6 $86.0 $91.4 $93.8 $97.7
Total Premiums-Quarterly: $61.4 $46.5 $52.1 $54.8 $56.2
Life - First-Year Premiums
NAP-Quarterly: $13.7 $15.8 $17.3 $16.3 $15.9
NAP-Trailing 4 Quarters: $57.7 $60.9 $62.6 $63.1 $65.3
SPWL
Non-
SPWL
4Q09
$23.0
$10.8
$12.2
1Q10
$20.2
$9.6
$10.6
2Q10
$24.8
$12.4
$12.4
3Q10
$25.8
$11.9
$13.9
4Q10
$26.9
$12.3
$14.6
Bankers Life
($ millions)
CNO Financial Group
54
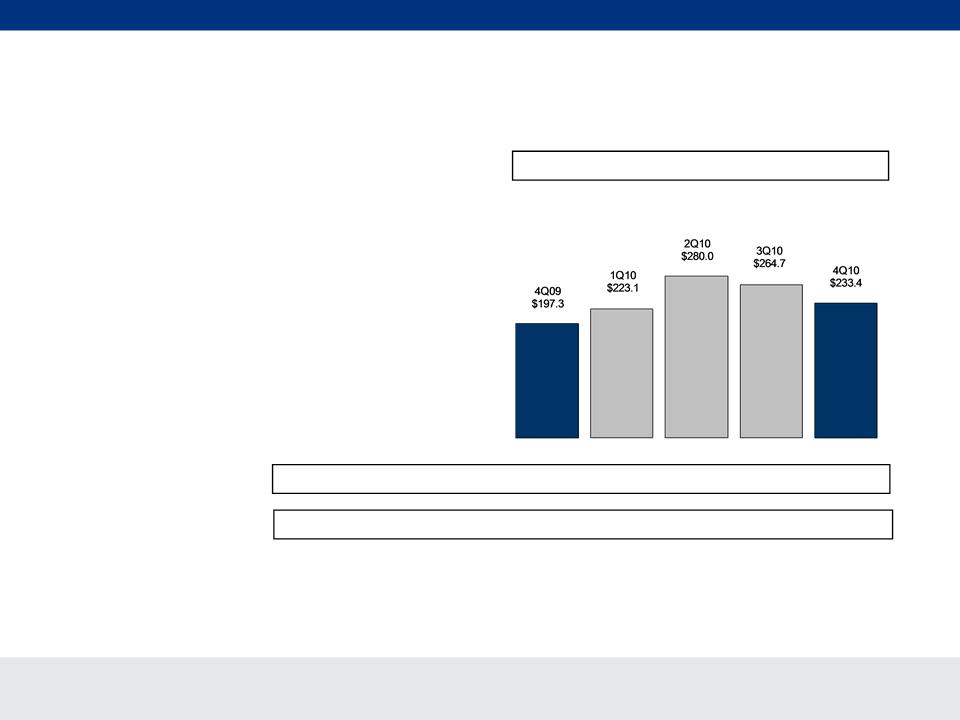
Premiums - Annuity
§ First-year premiums up 18%
First-Year Prems.-Tr. 4 Qtrs: $1,057.1 $979.1 $984.4 $965.1 $1,001.2
Total Premiums-Quarterly: $198.2 $224.4 $281.1 $265.8 $234.4
Annuity - First-Year Premiums
Bankers Life
($ millions)
CNO Financial Group
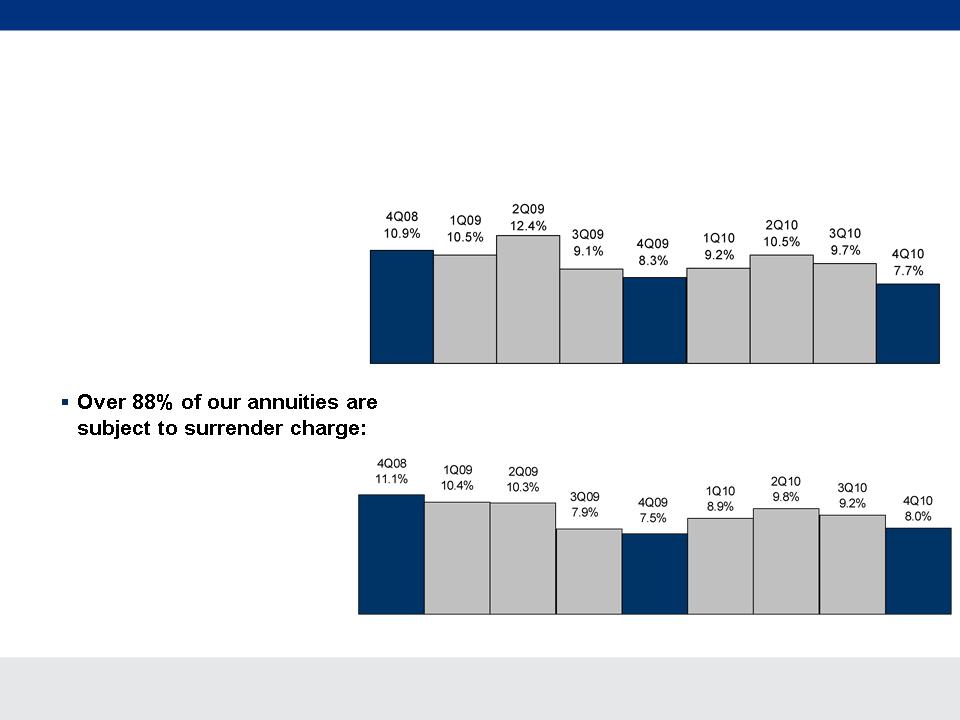
55
§ Total account value:
– IAs - $1.9 billion
– Non-IAs - $4.5 billion
§ Average account value:
– IAs - $1.9 billion
– Non-IAs - $4.7 billion
– IAs - 96%
– Non-IAs - 85%
Annuity Surrenders
IA Surrenders
(annualized quarterly rate)
Non-IA Surrenders
(annualized quarterly rate)
Bankers Life
CNO Financial Group
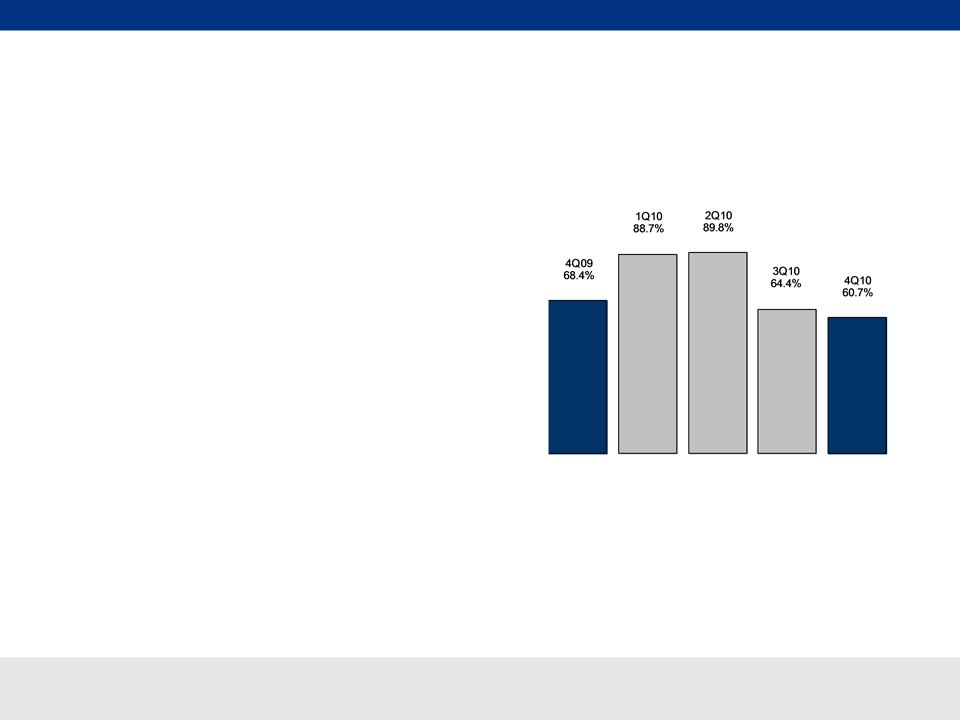
56
Benefit Ratio* - PDP
§ Down 7.7 points, impacted by
improved pricing and plan design
changes
improved pricing and plan design
changes
*We calculate benefit ratios by dividing insurance policy benefits by insurance policy income.
Bankers Life
CNO Financial Group
57
Benefit Ratio* - Med Supp
§ 4Q10 impacted by favorable
claims experience
claims experience
*We calculate benefit ratios by dividing insurance policy benefits by insurance policy income.
Bankers Life
CNO Financial Group
58
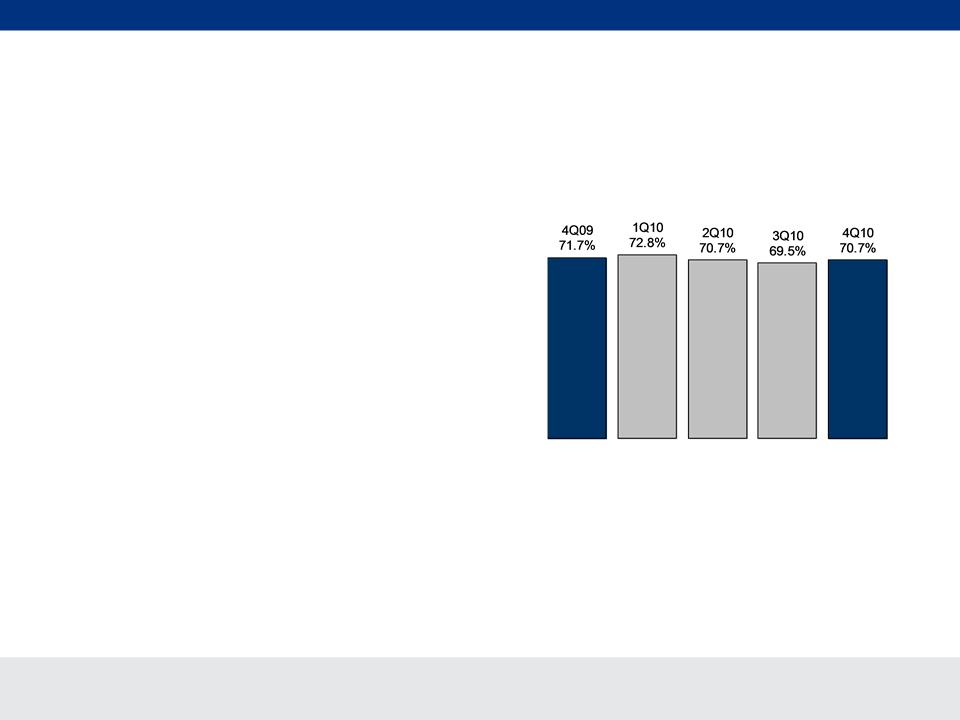
Interest-Adjusted Benefit
Ratio* - LTC
Ratio* - LTC
*We calculate interest-adjusted benefit ratios by dividing insurance policy benefits less interest income on the accumulated assets
backing the insurance liabilities by insurance policy income.
backing the insurance liabilities by insurance policy income.
§ 4Q09 reflects a reserve release
due to positive development of
reserves and the impact of
policyholder actions following
rate increases in 2009
due to positive development of
reserves and the impact of
policyholder actions following
rate increases in 2009
Trailing 4 Quarter Avg.: 67.9% 69.6% 71.0% 71.7% 73.0%
Qtrly. non-int. adjusted: 104.3% 114.4% 113.0% 114.2% 113.3%
Bankers Life
CNO Financial Group
59
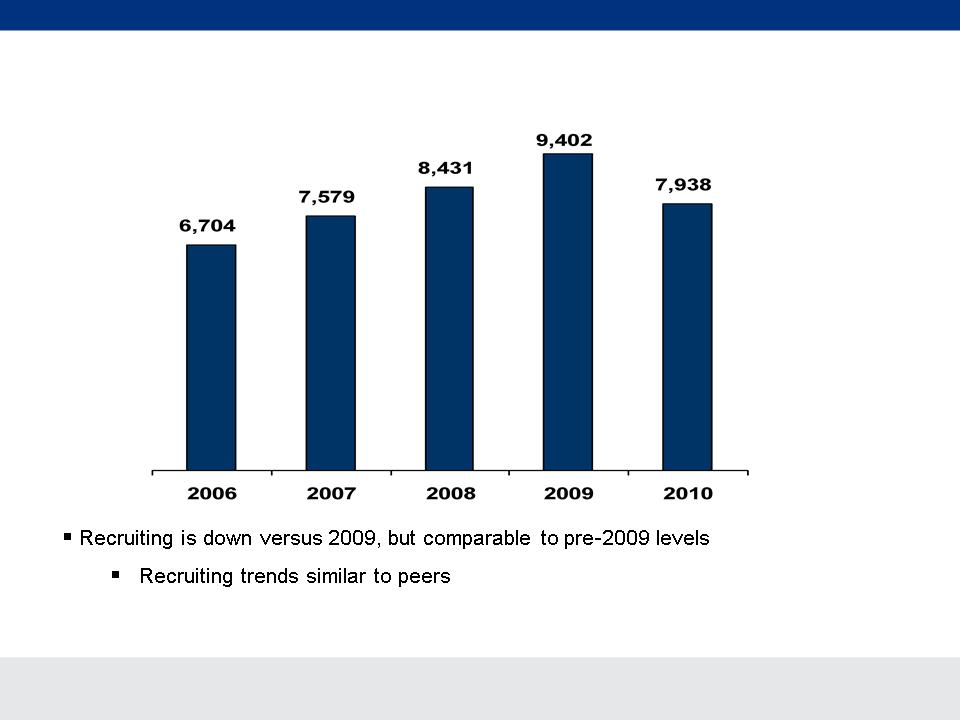
New Agent Contracts
Bankers Life
§ 15 new locations planned in 2011

CNO Financial Group
60
LTC Rate Increase
Bankers Life
§ We are filing for an additional increase on almost all plans sold between
2002 and 2005.
2002 and 2005.
§ For plans generally sold between 1992-2003, we are filing for an additional
increase ONLY on policies with inflation protection.
increase ONLY on policies with inflation protection.
§ For these two blocks, premium increase filings are in progress:
– We expect to implement rate increases of about $35 million after all
states have approved, of which approximately $5.5 million of approvals
had been received as of 12/31/10.
states have approved, of which approximately $5.5 million of approvals
had been received as of 12/31/10.
Additional rate increase filings commenced on our LTC portfolio in
October
October
CNO Financial Group
61
Segment Performance
Washington National
*Operating earnings exclude net realized gains (losses). See Appendix for corresponding GAAP measure of our consolidated results of
operations.
operations.
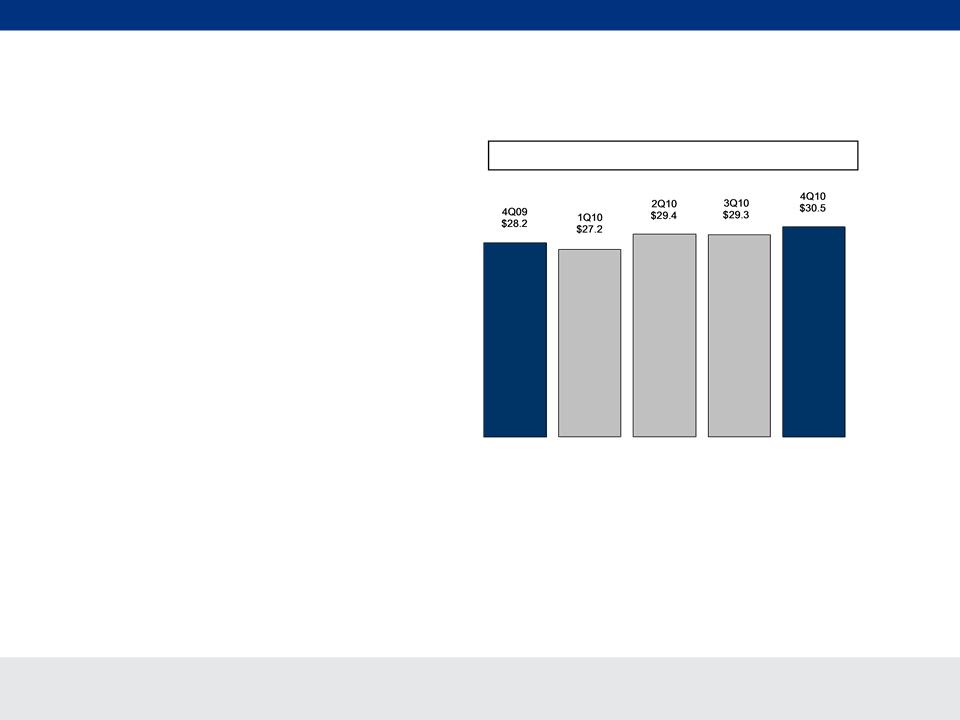
PTOI-Trailing 4 Quarters: $110.9 $104.9 $100.8 $98.9 $104.6
Revenues-Quarterly: $191.3 $191.1 $190.8 $191.6 $194.0
Pre-Tax Operating Income*
Revenues-Tr. 4 Quarters: $788.3 $780.2 $771.4 $764.8 $767.5
($ millions)
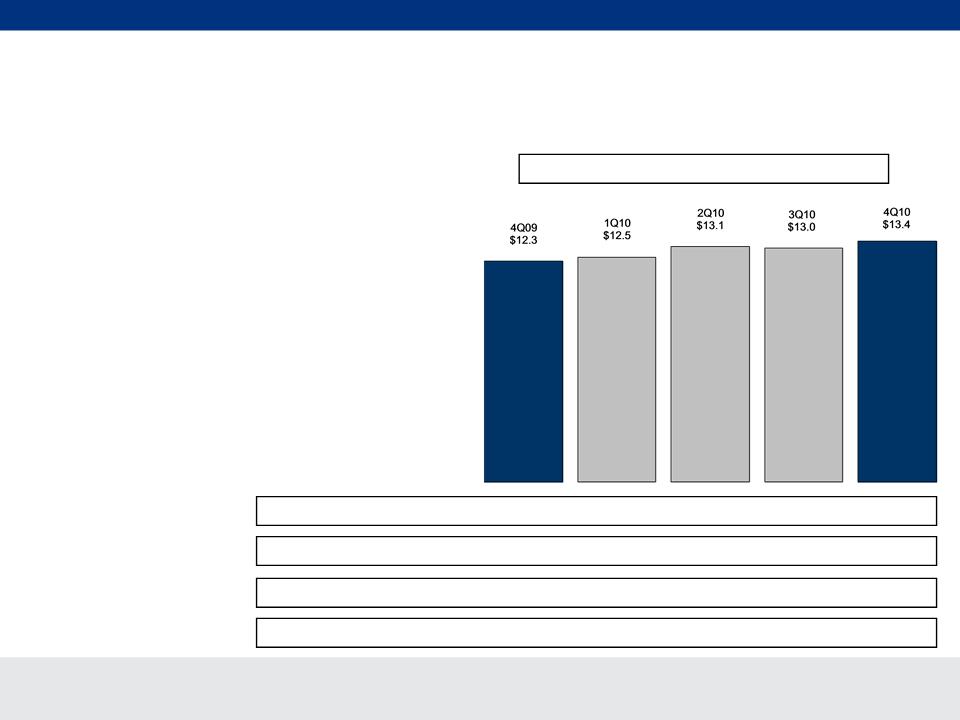
§ Earnings of $28.7 million, up 25%
– Reflects an increase in earnings
from our supplemental health
products due to growth in this block
of business and lower claims
from our supplemental health
products due to growth in this block
of business and lower claims
CNO Financial Group
62
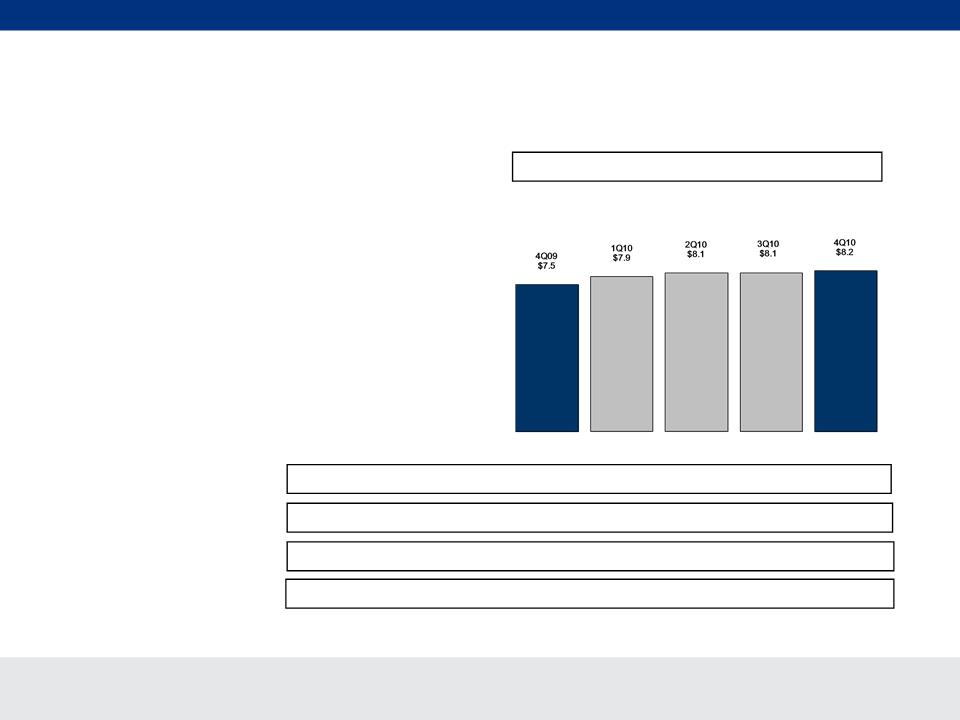
Premiums -
Supplemental Health
Washington National
§ NAP up 15%
– Increased focus on supplemental
health products
health products
– Momentum increasing in Worksite
market
market
First-Year Prems.-Tr. 4 Qtrs: $45.4 $47.7 $49.7 $50.9 $52.0
Total Premiums-Quarterly: $99.0 $99.6 $100.2 $101.5 $104.2
Supplemental Health - First-Year Premiums
NAP-Quarterly: $15.2 $14.6 $17.5 $18.0 $17.5
NAP-Trailing 4 Quarters: $57.5 $60.6 $63.4 $65.3 $67.6
($ millions)
CNO Financial Group
63
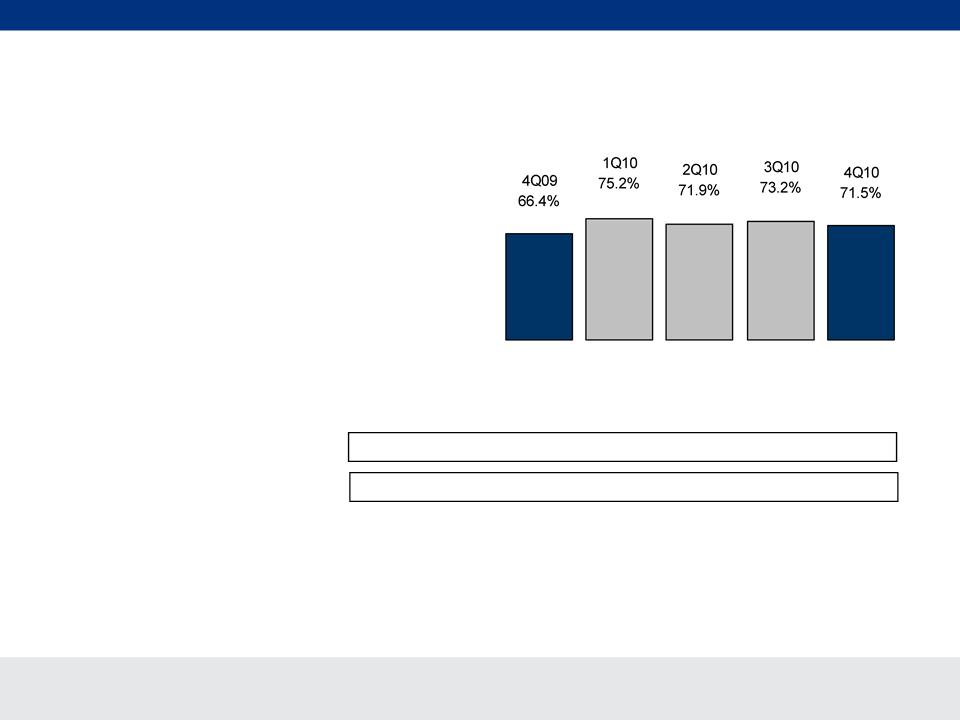
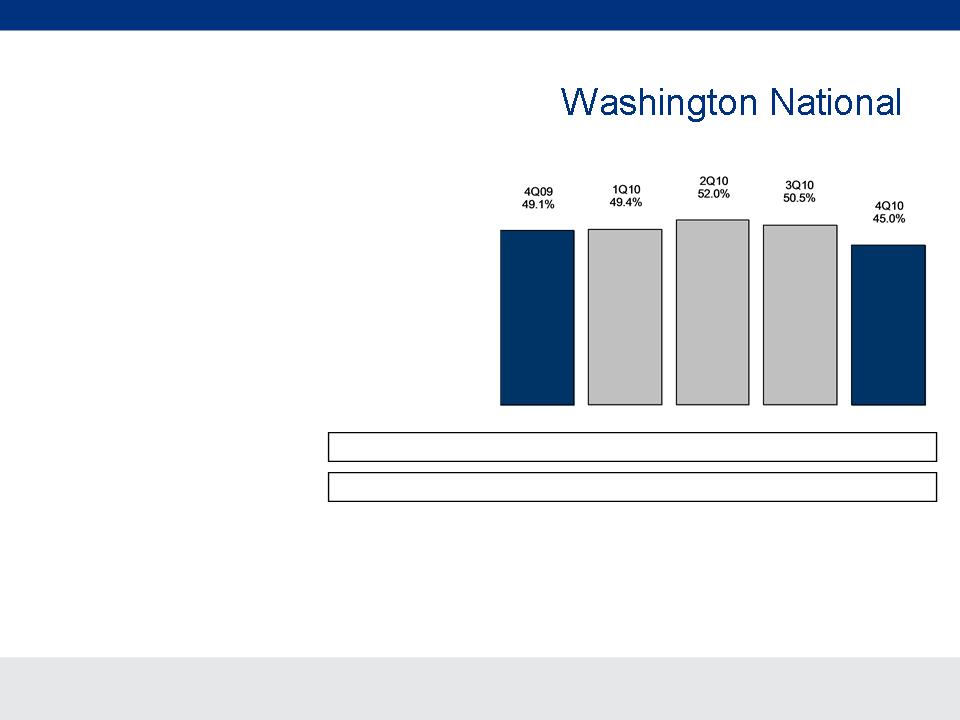
Interest-Adjusted Benefit Ratio* -
Supplemental Health Insurance
Trailing 4 Quarter Avg.: 46.0% 47.8% 48.4% 50.3% 49.2%
Qtrly. non-int. adjusted: 82.0% 82.3% 83.2% 81.3% 75.0%
*We calculate interest-adjusted benefit ratios by dividing insurance policy benefits, less interest income on the accumulated assets backing
the insurance liabilities, by insurance policy income.
the insurance liabilities, by insurance policy income.
§ Down 4.1 points vs. 4Q09 due
to favorable claim experience
to favorable claim experience
§ Non-interest adjusted ratio
75.0% vs. 4Q09 82.0%
75.0% vs. 4Q09 82.0%
CNO Financial Group
64
Segment Performance
Colonial Penn
*Operating earnings exclude net realized gains (losses). See Appendix for corresponding GAAP measure of our consolidated results of
operations.
operations.
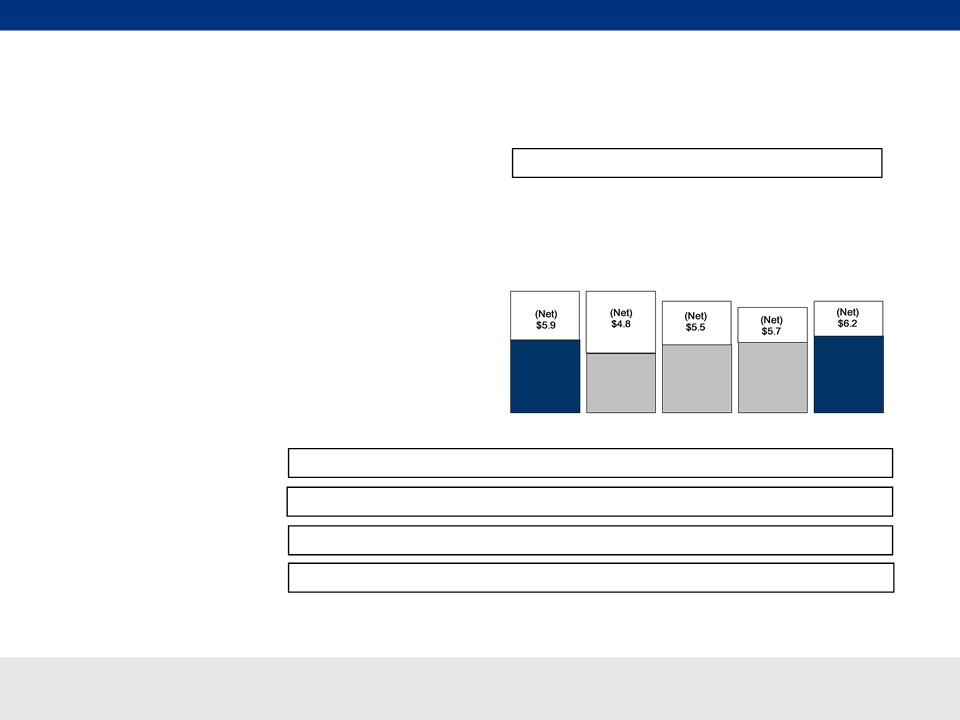
§ Earnings of $5.8 million, down
1.7%
1.7%
– Unfavorable mortality in life
products
products
– Substantially offset by increased
earnings in core life products due
to growth and higher investment
yields
earnings in core life products due
to growth and higher investment
yields
PTOI-Trailing 4 Quarters: $29.4 $29.6 $26.2 $26.6 $26.5
Revenues-Quarterly: $57.8 $58.1 $59.1 $58.9 $58.8
Pre-Tax Operating Income*
Revenues -Tr. 4 Quarters: $235.7 $236.7 $233.1 $233.9 $234.9
($ millions)
CNO Financial Group
65
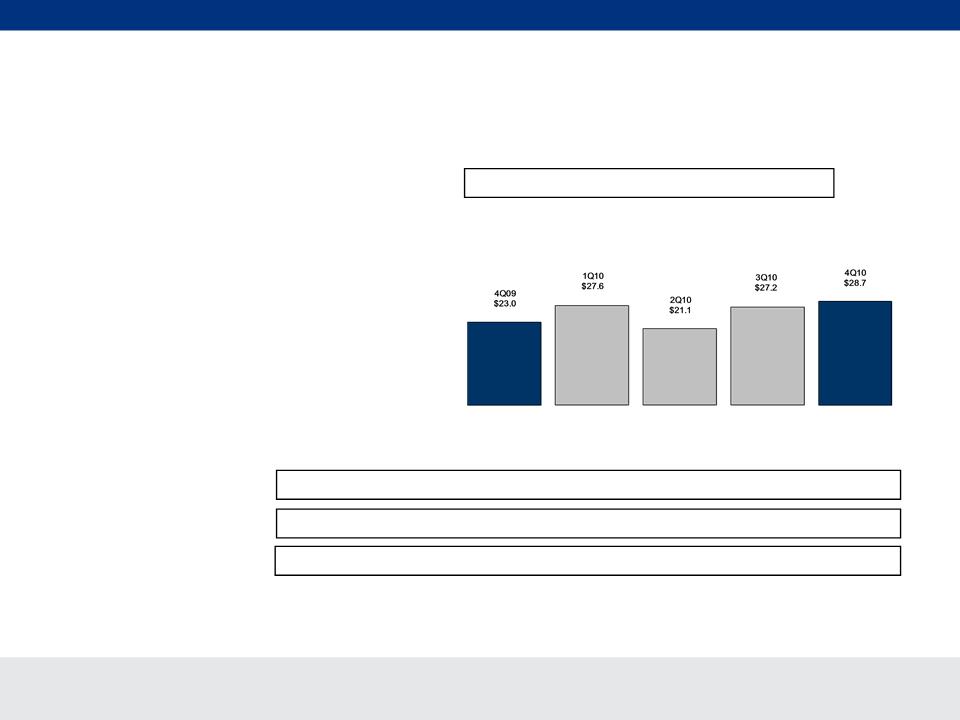
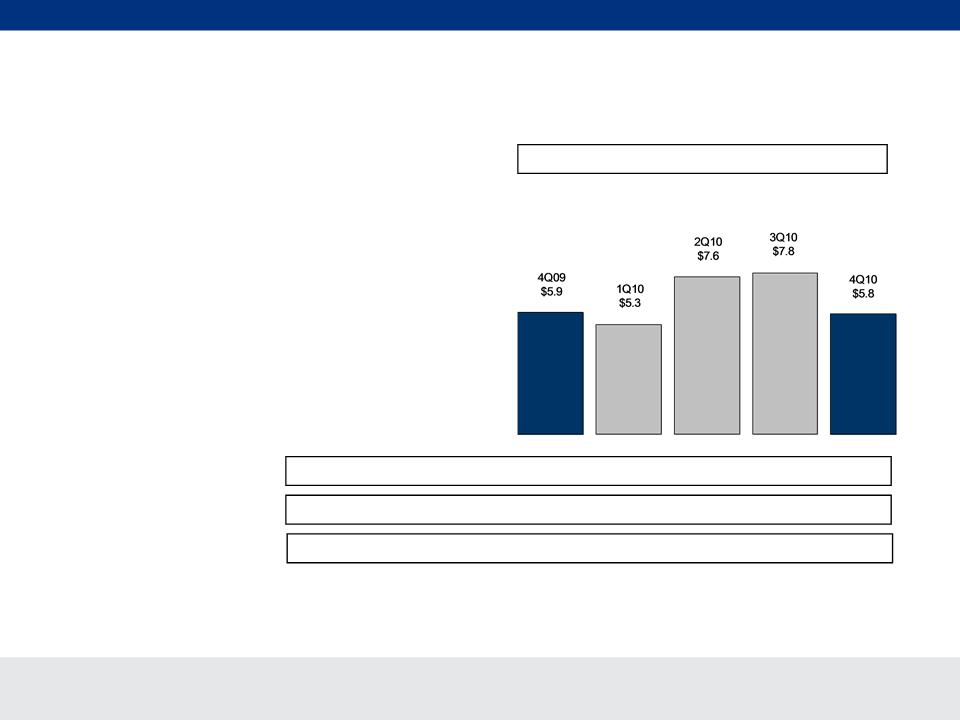
Premiums - Life Insurance
Colonial Penn
§ Sales (NAP) up 13%
§ YTD sales up 11%
§ YTD lead generation up 35%
First-Year Prems.-Tr. 4 Qtrs: $33.0 $31.7 $31.4 $31.6 $32.3
Total Premiums-Quarterly: $48.9 $47.3 $46.7 $46.9 $46.8
Life - First-Year Premiums
NAP-Quarterly: $8.4 $13.1 $12.2 $11.5 $9.5
NAP-Trailing 4 Quarters: $41.9 $42.7 $44.3 $45.2 $46.3
($ millions)
CNO Financial Group
66
Segment Performance
Other CNO Business
*Operating earnings exclude net realized gains (losses). See Appendix for corresponding GAAP measure of our consolidated results of
operations.
operations.
– Results in 4Q09 were unfavorably impacted by:
• Regulatory and legal settlements of
$14 million
$14 million
PTOI-Trailing 4 Quarters: $(43.6) $(43.1) $(30.3) $(47.2) $(11.5)
Revenues-Quarterly: $166.4 $167.4 $153.6 $172.2 $169.3
Pre-Tax Operating Income (Loss)*
Revenues-Tr. 4 Quarters: : $712.3 $699.7 $670.4 $659.6 $662.5
($ millions)

CNO Financial Group
67
Information Related to Certain Non-GAAP Financial Measures
The following provides additional information regarding certain non-GAAP measures used in this presentation. A non-GAAP
measure is a numerical measure of a company’s performance, financial position, or cash flows that excludes or includes amounts
that are normally excluded or included in the most directly comparable measure calculated and presented in accordance with
GAAP. While management believes these measures are useful to enhance understanding and comparability of our financial
results, these non-GAAP measures should not be considered as substitutes for the most directly comparable GAAP measures.
Additional information concerning non-GAAP measures is included in our periodic filings with the Securities and Exchange
Commission that are available in the “Investors - SEC Filings” section of CNO’s website, www.CNOinc.com.
Operating earnings measures
Management believes that an analysis of net income applicable to common stock before loss on extinguishment or modification of
debt, net realized gains or losses and increases or decreases to our valuation allowance for deferred tax assets (“net operating
income,” a non-GAAP financial measure) is important to evaluate the performance of the Company and is a key measure
commonly used in the life insurance industry. Management uses this measure to evaluate performance because loss on
extinguishment or modification of debt, realized investment gains or losses and increases or decreases to our valuation allowance
for deferred tax assets are unrelated to the Company’s continuing operations.
CNO Financial Group
68
Information Related to Certain Non-GAAP Financial Measures
A reconciliation of net income applicable to common stock to net operating income (and related per-share amounts) is as follows
(dollars in millions, except per-share amounts):
(dollars in millions, except per-share amounts):
CNO Financial Group
69
Information Related to Certain Non-GAAP Financial Measures
Book value, excluding accumulated other comprehensive income (loss), per share
This non-GAAP financial measure differs from book value per share because accumulated other comprehensive income (loss) has been
excluded from the book value used to determine the measure. Management believes this non-GAAP financial measure is useful because it
removes the volatility that arises from changes in accumulated other comprehensive income (loss). Such volatility is often caused by changes in
the estimated fair value of our investment portfolio resulting from changes in general market interest rates rather than the business decisions
made by management.
A reconciliation from book value per share to book value per share, excluding accumulated other comprehensive income (loss) is as follows
(dollars in millions, except per share amounts):
(dollars in millions, except per share amounts):

CNO Financial Group
70
Information Related to Certain Non-GAAP Financial Measures
Operating return measures
Management believes that an analysis of return before loss on extinguishment or modification of debt, net realized gains or losses, and
increases or decreases to our valuation allowance for deferred tax assets (“net operating income,” a non-GAAP financial measure) is important
to evaluate the performance of the Company and is a key measure commonly used in the life insurance industry. Management uses this
measure to evaluate performance because loss on extinguishment or modification of debt, realized investment gains or losses, and increases to
our valuation allowance for deferred tax assets are unrelated to the Company’s continued operations.
This non-GAAP financial measure also differs from return on equity because accumulated other comprehensive income (loss) has been
excluded from the value of equity used to determine this ratio. Management believes this non-GAAP financial measure is useful because it
removes the volatility that arises from changes in accumulated other comprehensive income (loss). Such volatility is often caused by changes in
the estimated fair value of our investment portfolio resulting from changes in general market interest rates rather than the business decisions
made by management.
In addition, our equity includes the value of significant net operating loss carryforwards (included in income tax assets). In accordance with
GAAP, these assets are not discounted, and accordingly will not provide a return to shareholders (until after it is realized as a reduction to taxes
that would otherwise be paid). Management believes that excluding this value from the equity component of this measure enhances the
understanding of the effect these non-discounted assets have on operating returns and the comparability of these measures from period-to-
period. Operating return measures are used in measuring the performance of our business units and are used as a basis for incentive
compensation.
All references to return on allocated capital measures assume a capital allocation based on a 275% targeted risk-based capital at the segment
level. Additionally, corporate debt has been allocated to the segments.
level. Additionally, corporate debt has been allocated to the segments.
CNO Financial Group
71
Information Related to Certain Non-GAAP Financial Measures
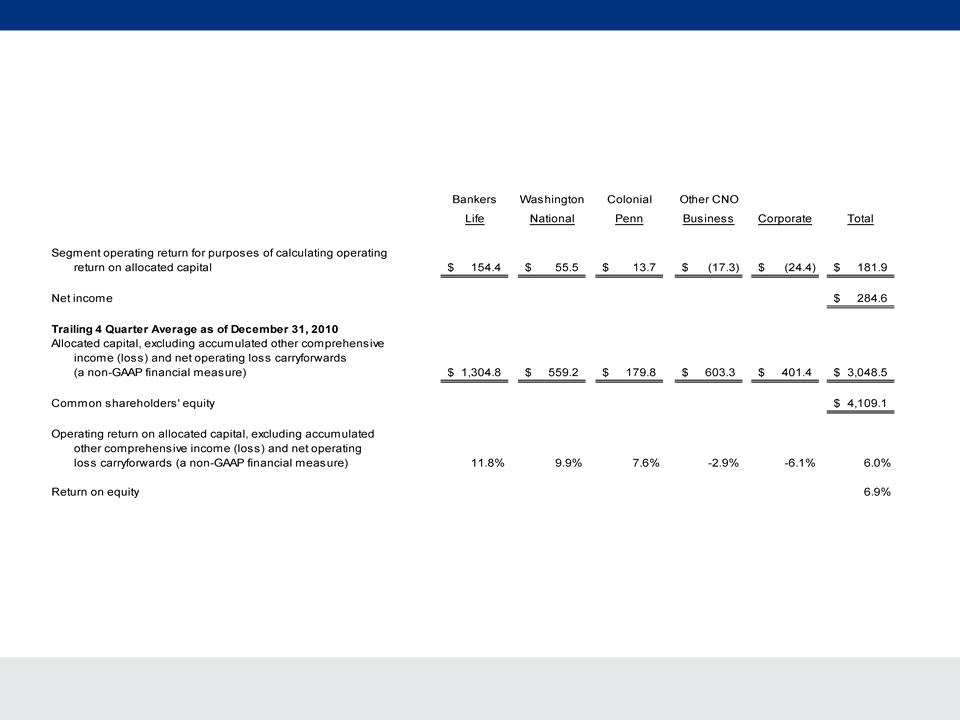
The calculations of: (i) operating return on allocated capital, excluding accumulated other comprehensive income (loss) and net operating
loss carryforwards (a non-GAAP financial measure); and (ii) return on equity, for the twelve months ended December 31, 2010, are as
follows (dollars in millions):
loss carryforwards (a non-GAAP financial measure); and (ii) return on equity, for the twelve months ended December 31, 2010, are as
follows (dollars in millions):
(Continued on next page)
CNO Financial Group
72
Information Related to Certain Non-GAAP Financial Measures
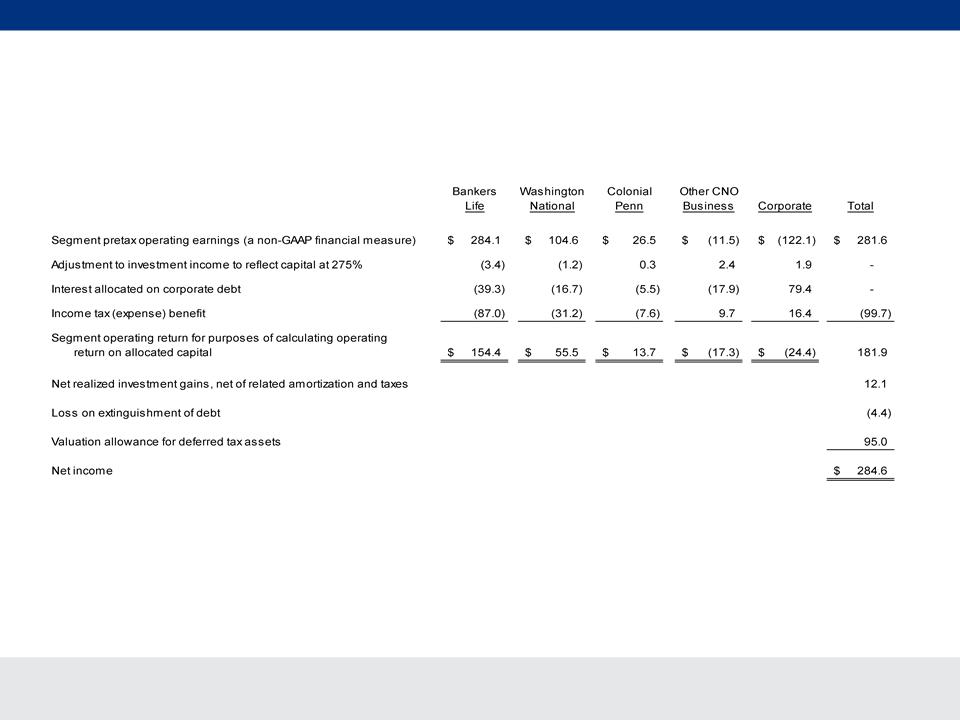
A reconciliation of pretax operating earnings (a non-GAAP financial measure) to segment operating return (loss) and consolidated net income
(loss) for the year ended December 31, 2010, is as follows (dollars in millions):
(loss) for the year ended December 31, 2010, is as follows (dollars in millions):
(Continued on next page)
CNO Financial Group
73
Information Related to Certain Non-GAAP Financial Measures
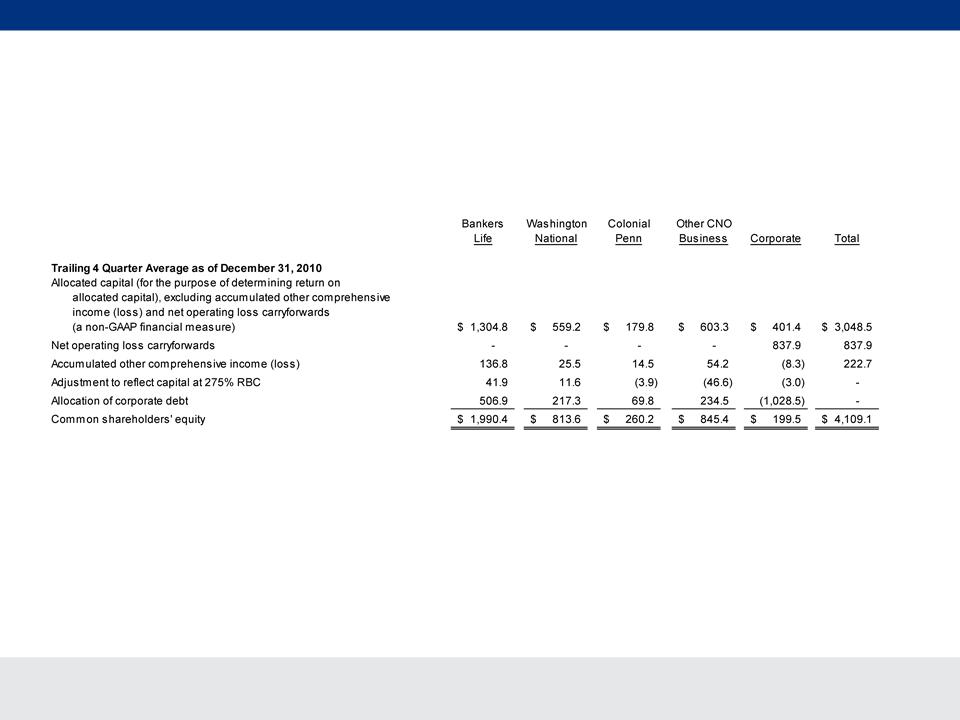
A reconciliation of average allocated capital (for the purpose of determining return on allocated capital), excluding accumulated other
comprehensive income (loss) and net operating loss carryforwards (a non-GAAP financial measure) to average common shareholders’ equity, is
as follows (dollars in millions):
comprehensive income (loss) and net operating loss carryforwards (a non-GAAP financial measure) to average common shareholders’ equity, is
as follows (dollars in millions):
(Continued on next page)
(Continued from previous page)
CNO Financial Group
74
Information Related to Certain Non-GAAP Financial Measures
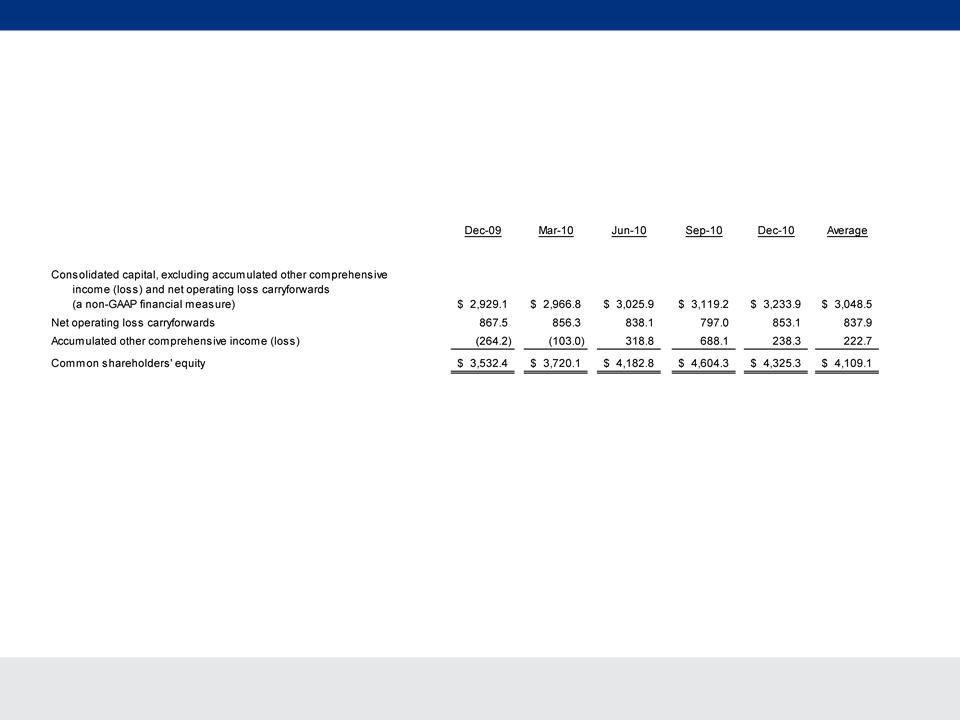
A reconciliation of consolidated capital, excluding accumulated other comprehensive income (loss) and net operating loss carryforwards (a non-
GAAP financial measure) to common shareholders’ equity, is as follows (dollars in millions):
GAAP financial measure) to common shareholders’ equity, is as follows (dollars in millions):
(Continued from previous page)
CNO Financial Group
75
Information Related to Certain Non-GAAP Financial Measures
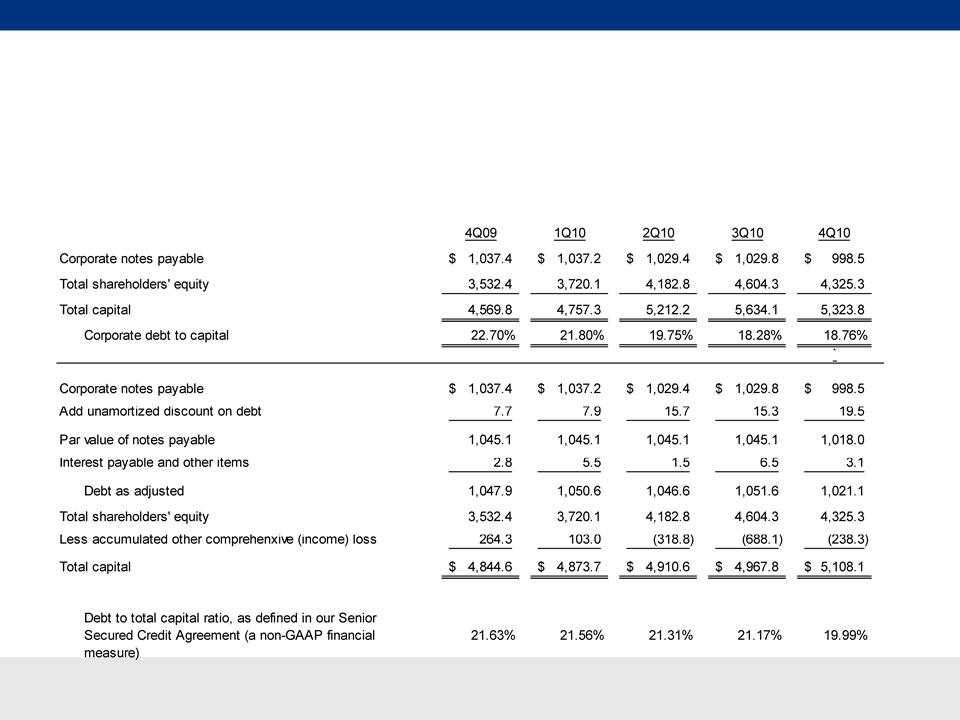
A reconciliation of the debt to capital ratio to debt to capital, as defined in our Senior Secured Agreement is as follows (dollars in millions)
Debt to capital ratio, excluding accumulated other comprehensive income (loss)
This non-GAAP financial measure differs from the debt to capital ratio because accumulated other comprehensive (income) loss has been
excluded from the value of capital used to determine this measure. In addition, debt is defined as par value plus accrued interest and certain
other items. Management believes this non-GAAP financial measure is useful as the level of such ratio impacts certain provisions in our Senior
Secured Credit Agreement.