Attached files
| file | filename |
|---|---|
| 8-K - FORM 8-K - PUBLIC SERVICE ELECTRIC & GAS CO | d8k.htm |
| EX-99 - PRESS RELEASE - PUBLIC SERVICE ELECTRIC & GAS CO | dex99.htm |
 Public Service Enterprise Group
PSEG Earnings Conference Call
4
th
Quarter and Year-end 2010
February 22, 2011
Exhibit 99.1 |
| 1
Forward-Looking Statement
Readers are cautioned that statements contained in this presentation about our and
our subsidiaries' future performance, including future revenues, earnings,
strategies, prospects, consequences and all other statements that are not purely
historical, are forward-looking statements for purposes of the safe harbor
provisions under The Private Securities Litigation Reform Act of
1995. When used herein, the words “anticipate”,
“intend”, “estimate”, “believe”, “expect”, “plan”,
“should”, “hypothetical”, “potential”,
“forecast”, “project”, variations of such words and similar expressions are intended to identify forward-looking statements.
Although we believe that our expectations are based on reasonable assumptions, they
are subject to risks and uncertainties and we can give no assurance they
will be achieved. The results or developments projected or predicted in these
statements may differ materially from what may actually occur. Factors which
could cause results or events to differ from current expectations include, but are
not limited to: •
adverse changes in energy industry law, policies and regulation, including market
structures and a potential shift away from competitive markets toward subsidized market
mechanisms, transmission planning and cost allocation rules, including rules
regarding how transmission is planned and who is permitted to build transmission going
forward, and reliability standards,
•
any inability of our transmission and distribution businesses to obtain adequate
and timely rate relief and regulatory approvals from federal and state regulators,
•
changes in federal and state environmental regulations that could increase our
costs or limit operations of our generating units, •
changes in nuclear regulation and/or developments in the nuclear power industry
generally that could limit operations of our nuclear generating units,
•
actions
or
activities
at
one
of
our
nuclear
units
located
on
a
multi-unit
site
that
might
adversely
affect
our
ability
to
continue
to
operate
that
unit
or
other
units
located
at
the
same site,
•
any inability to balance our energy obligations, available supply and trading
risks, •
any deterioration in our credit quality,
•
availability of capital and credit at commercially reasonable terms and conditions
and our ability to meet cash needs, •
any
inability
to
realize
anticipated
tax
benefits
or
retain
tax
credits,
•
changes in the cost of, or interruption in the supply of, fuel and other
commodities necessary to the operation of our generating units, •
delays in receipt of necessary permits and approvals for our construction and
development activities, •
delays or unforeseen cost escalations in our construction and development
activities, •
adverse changes in the demand for or price of the capacity and energy that we sell
into wholesale electricity markets, •
increase in competition in energy markets in which we compete,
•
adverse performance of our decommissioning and defined benefit plan trust fund
investments and changes in discount rates and funding requirements, and
•
changes in technology and customer usage patterns.
For further information, please refer to our Annual Report on Form 10-K,
including Item 1A. Risk Factors, and subsequent reports on Form 10-Q and Form 8-K
filed with the Securities and Exchange Commission. These documents address in
further detail our business, industry issues and other factors that could cause
actual
results
to
differ
materially
from
those
indicated
in
this
presentation.
In
addition,
any
forward-looking
statements
included
herein
represent
our
estimates
only as of today and should not be relied upon as representing our estimates as of
any subsequent date. While we may elect to update forward-looking
statements from time to time, we specifically disclaim any obligation to do so,
even if our internal estimates change, unless otherwise required by applicable
securities laws. |
| 2
GAAP Disclaimer
PSEG presents Operating Earnings in addition to its Net Income reported in
accordance with accounting principles generally accepted in the United
States (GAAP). Operating Earnings is a non-GAAP financial measure that
differs from Net Income because it excludes gains or losses associated with
Nuclear Decommissioning Trust (NDT), Mark-to-Market (MTM)
accounting, and other material one-time items. PSEG presents
Operating Earnings because management believes that it is appropriate for
investors to
consider results excluding these items in addition to the results reported in
accordance with GAAP. PSEG believes that the non-GAAP financial
measure of Operating Earnings provides a consistent and comparable
measure of performance of its businesses to help shareholders understand
performance trends. This information is not
intended to be viewed as an
alternative to GAAP information. The last slide in this presentation includes
a list of items excluded from Income from Continuing Operations to
reconcile to Operating Earnings, with a reference to that slide included on
each of the slides where the non-GAAP information appears.
|
| PSEG
2010 Q4 Review
Ralph Izzo
Chairman, President and Chief Executive Officer
*
*
*
*
*
*
* |
 4
Q4 Earnings Summary
$ millions (except EPS)
2010
2009
Operating Earnings
$ 303
$ 334
Reconciling Items, Net of Tax
(13)
40
Income from Continuing Operations
290
374
Discontinued Operations, Net of Tax
(8)
(25)
Net Income
282
349
EPS from Operating Earnings*
$ 0.60
$ 0.66
Quarter ended December 31
* See page 34 for Items excluded from Income from Continuing Operations to
reconcile to Operating Earnings. |
 5
Full-year Earnings Summary
$ millions (except EPS)
2010
2009
Operating Earnings
$ 1,584
$ 1,567
Reconciling Items, Net of Tax
(27)
27
Income from Continuing Operations
1,557
1,594
Discontinued Operations, Net of Tax
7
(2)
Net Income
1,564
1,592
EPS from Operating Earnings*
$ 3.12
$ 3.09
For the twelve months ended
December
31
* See page 34 for Items excluded from Income from Continuing Operations to
reconcile to Operating Earnings. |
 6
PSEG –
2010: Balanced asset mix met market’s challenges
2010 Earnings Within Guidance
Operating earnings of $3.12 compared with guidance of $3.00 -
$3.25
Results reflect the removal of Texas generating assets to discontinued
operations
A Year of Accomplishments
Completed installation of the Back-End Technology at NJ coal stations
Record year for generation for Power
Hope Creek received a 100 INPO rating
PSE&G won its 9
th
consecutive Reliability One Award
PSE&G’s
electric & gas distribution rate settlement supported improved returns
Holdings terminated all remaining international leveraged leases
O&M Growth Contained with Focus on Operating Efficiency
Balance Sheet Strengthened |
 7
PSEG –
2011: Meeting market’s challenges
Providing
Operating
Earnings
Guidance
for
2011
of
$2.50
-
$2.75
per share
Power’s outlook influenced by lower prices and volume
PSE&G benefits from increased investment and full year of rate relief
Energy Holdings’
outlook influenced by absence of lease termination gains
Responding to Market Challenges
Complaint filed at FERC in response to NJ’s LCAPP Legislation
U.S District Court action challenging constitutionality under Supremacy
and Commerce clauses
Foundation for Future
Committed to $6.7 billion Capital Program over 2011-2013
Balance Sheet strong
2011 Represents 104
th
Year of Paying an Annual Dividend on an
Uninterrupted Basis
Indicated annual rate of $1.37 per share for 2011 |
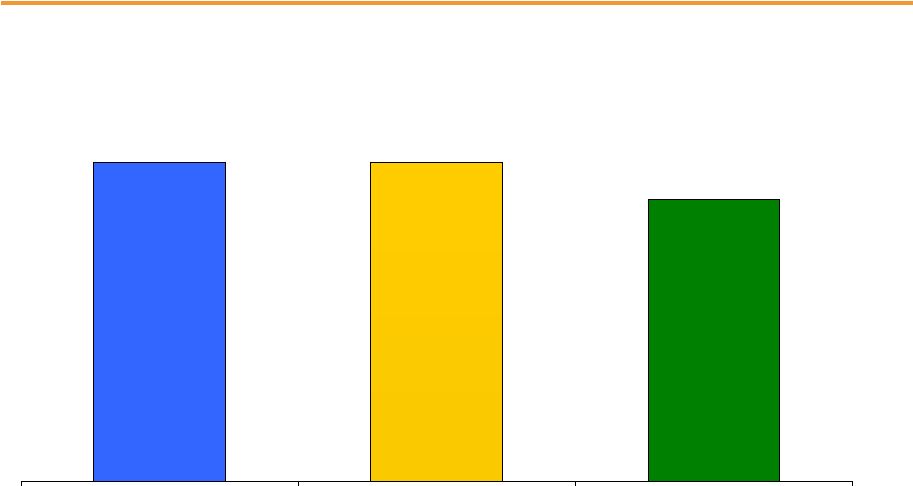 8
2009 Operating Earnings*
2010 Operating Earnings*
2011 Guidance
$2.50 -
$2.75E
PSEG –
Introducing 2011 Guidance
$3.09
* See page 34 for Items excluded from Income from Continuing Operations to
reconcile to Operating Earnings.
$3.12 |
| PSEG
2010 Q4 Operating Company Review
Caroline Dorsa
EVP and Chief Financial Officer
*
*
*
*
*
*
* |
 10
Q4 Operating Earnings by Subsidiary
Operating Earnings
Earnings per Share
$ millions (except EPS)
2010
2009
2010
2009
PSEG Power
$ 212
$ 260
$ 0.42
$ 0.51
PSE&G
83
68
0.16
0.13
PSEG Energy Holdings
5
12
0.01
0.03
Enterprise
3
(6)
0.01
(0.01)
Operating Earnings*
$ 303
$ 334
$ 0.60
$ 0.66
Quarter ended December 31
* See page 34 for Items excluded from Income from Continuing Operations to
reconcile to Operating Earnings. |
 11
Full-year Operating Earnings by Subsidiary
Operating Earnings
Earnings per Share
$ millions (except EPS)
2010
2009
2010
2009
PSEG Power
$ 1,091
$ 1,193
$ 2.15
$ 2.35
PSE&G
430
321
0.85
0.63
PSEG Energy Holdings
49
43
0.10
0.09
Enterprise
14
10
0.02
0.02
Operating Earnings*
$ 1,584
$ 1,567
$ 3.12
$ 3.09
For the year ended December 31
* See page 34 for Items excluded from Income from Continuing Operations to
reconcile to Operating Earnings. |
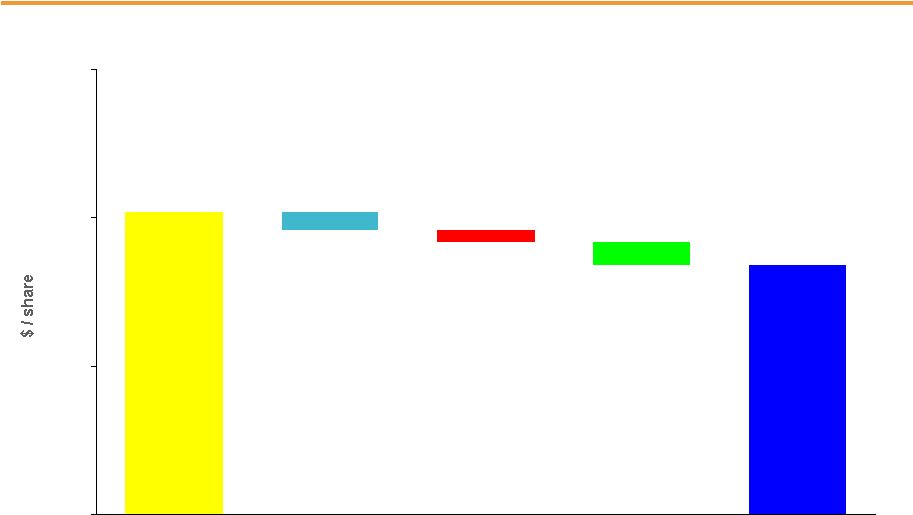
 12
$.66
(.09)
.03
(.02)
.02
$.60
0.00
0.35
0.70
PSEG EPS Reconciliation –
Q4 2010 versus Q4 2009
Q4 2010
operating
earnings*
Q4 2009
operating
earnings*
Higher Prices
partially offset by
Lower Volume .01
WPT (.03)
Migration (.01)
O&M (.02)
Taxes (.04)
PSEG Power
Electric & Gas
Margins
(including Rate
Increases) .03
O&M .02
D&A (.02)
PSE&G
PSEG Energy
Holdings
Enterprise
Lower Lease
Sales (.03)
Other .01
* See page 34 for Items excluded from Income from Continuing Operations to
reconcile to Operating Earnings. Interest |
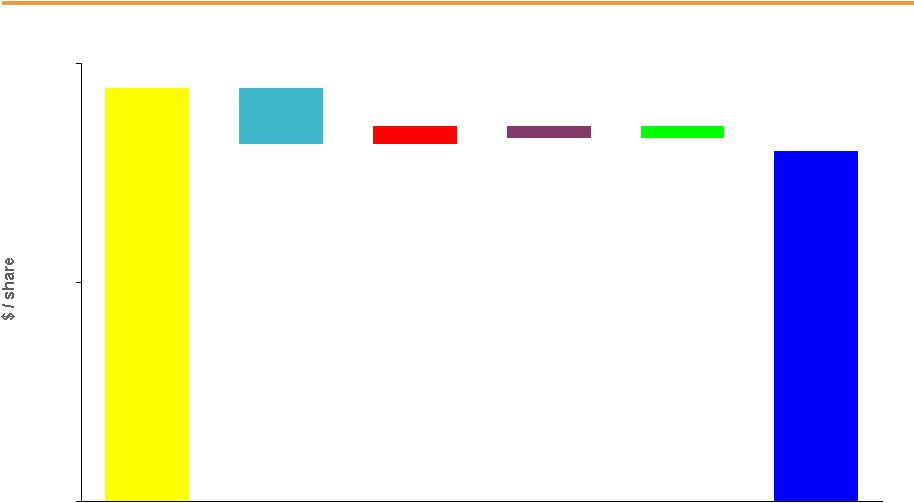
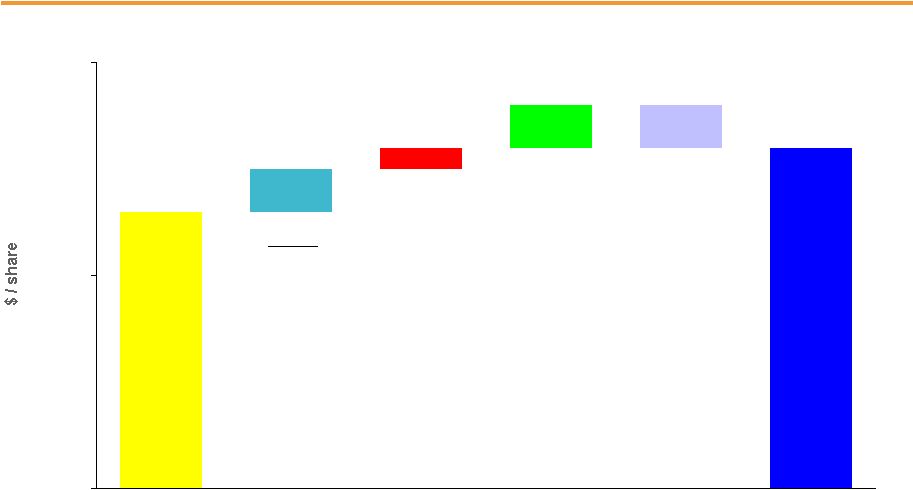
 13
$3.09
(.20)
.22
.01
.00
$3.12
0.00
0.65
1.30
1.95
2.60
3.25
PSEG EPS Reconciliation –
Full-year 2010 versus Full-
year 2009
2010
operating
earnings*
2009
operating
earnings*
2009 Debt
Exchange
Benefit
(Eliminated in
Consolidation) (.04)
Interest .04
Higher Volume
offset by Lower
Prices .00
WPT (.10)
Migration (.04)
Nuclear (.03)
O&M (.01)
Taxes (.04)
Other .02
PSEG Power
Electric & Gas
Margin
(including Rate
Increases) .12
Transmission
Margin .04
O&M .04
Weather .02
D&A (.03)
Other .03
PSE&G
PSEG Energy
Holdings
Enterprise
Lower Lease
Sales and
Impairment (.09)
2009 Debt
Exchange
Costs
(Eliminated in
Consolidation) .04
Interest .03
Other .03
* See page 34 for Items excluded from Income from Continuing Operations to
reconcile to Operating Earnings. |
 14
PSEG –
Meeting Challenges by:
Delivering superior results on our fleet of well positioned
assets
Achieving earnings targets with focus on attaining top
quartile performance across the enterprise
Investing in areas with attractive risk-adjusted returns
Maintaining a strong balance sheet |
| PSEG
Power 2010 Q4 Review
*
*
*
*
*
*
* |
 16
PSEG Power –
Q4 2010 EPS Summary
$ millions (except EPS)
Q4 2010
Q4 2009
Variance
Operating Revenues
$ 1,575
$ 1,678
($ 103)
Operating Earnings
212
260
(48)
NDT Funds Related
Activity,
Net of Tax
15
8
7
Mark-to-Market, Net of Tax
(28)
3
(31)
Income from Continuing Operations
199
271
(72)
Discontinued Operations, Net of Tax
(8)
(25)
17
Net Income
191
246
(55)
EPS from Operating Earnings*
$ 0.42
$ 0.51
($ 0.09)
* See page 34 for Items excluded from Income from Continuing Operations to
reconcile to Operating Earnings. |
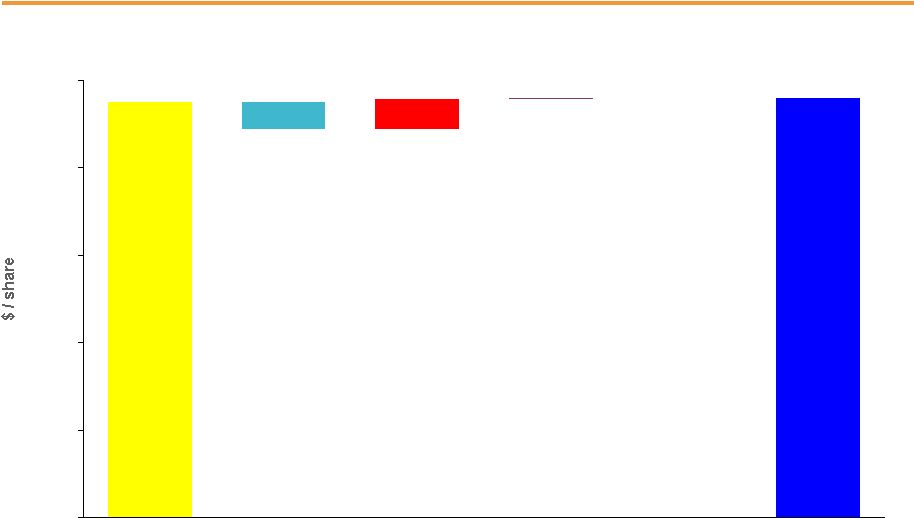
 17
$.42
(.02)
(.03)
(.04)
$.51
0.00
0.25
0.50
0.75
Higher Prices
partially offset by
Lower Volume .01
WPT (.03)
Migration (.01)
PSEG Power EPS Reconciliation –
Q4 2010 versus Q4 2009
Q4 2010
operating
earnings*
Q4 2009
operating
earnings*
O&M (.02)
* See page 34 for Items excluded from Income from Continuing Operations to
reconcile to Operating Earnings. Taxes (.04) |
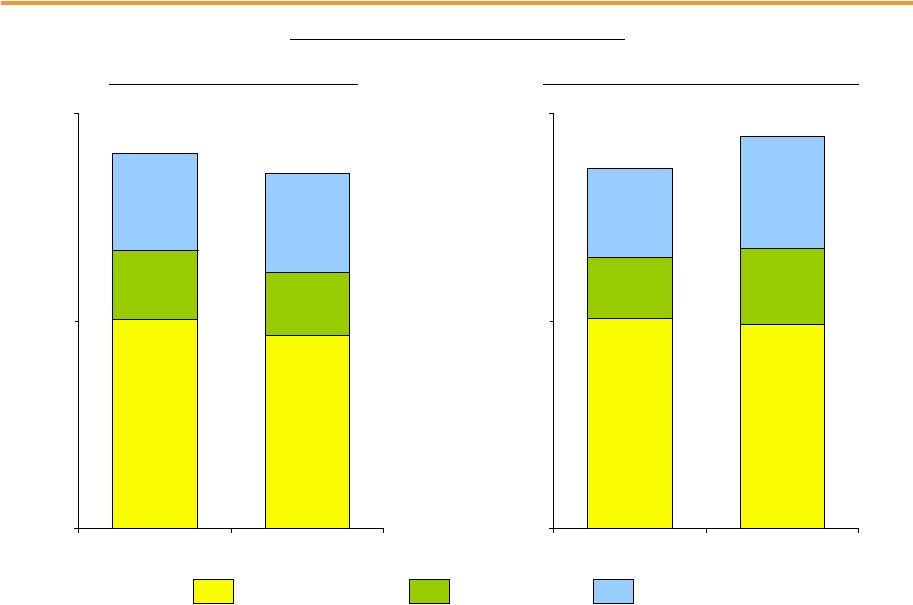 18
30,283
29,571
8,899
10,932
12,982
16,224
0
30,000
60,000
2009
2010
PSEG Power –
Generation Measures
7,531
6,993
2,509
2,286
3,547
3,532
0
7,500
15,000
2009
2010
Quarter
ended
December
31
Total Nuclear
Total Coal*
Oil & Natural Gas
–
excluding
Texas
* Includes figures for Pumped Storage
PSEG
Power
–
Generation
(GWh)
13,587
12,811
Twelve
months
ended
December
31
52,164
56,727 |
 19
PSEG Power –
Fuel Costs
Quarter ended December 31
($ millions)
2009
2010
Coal
97
82
Oil & Gas
172
160
Total Fossil
269
242
Nuclear
40
41
Total Fuel Cost
309
283
Total Generation
(GWh)
13,587
12,811
$ / MWh
23
22
PSEG Power –
Fuel Costs*
Twelve months ended
December 31
($ millions)
2009
2010
Coal
336
418
Oil & Gas
625
763
Total Fossil
961
1,181
Nuclear
150
164
Total Fuel Cost
1,111
1,345
Total Generation
(GWh)
52,164
56,727
$ / MWh
21
24
*Excludes Texas. |
 20
PSEG Power –
Gross Margin Performance
$0
$25
$50
$75
2009
2010
$0
$25
$50
$75
2009
2010
$51
$53
Quarter ended
December 31
Twelve months ended
December 31
$60
$54
4Q aided by improvement in higher wholesale prices
Hope Creek 26-day refueling outage, and planned testing for BET
Regional Performance
Region
2010 Gross
Margin ($M)
2010 Performance
PJM
$2,953
2010 contribution to gross margin
($M) declined by 1.1% versus year
ago; strong production from fossil
units combined with weather related
summer demand helped to offset the
impact of lower prices and customer
migration.
New
England
$79
Bridgeport Harbor hurt by low
contract prices.
New York
$48
Low contract prices partially offset by
an increase in generation.
PSEG Power Gross Margin ($/MWh)*
* Excludes Texas. |
 21
PSEG Power –
Q4 2010 Operating Highlights
Q4 output down 5.7%; full-year increase of 8.7%
2010 capacity factor for PS share of nuclear fleet at 91.2%
Fossil output for the year at record level
Availability of fleet in 4Q allowed Power to take advantage of higher spark
spreads Operations
Regulatory and Market
Environment
Financial
2011 BGS auction priced at $94.30/MWh versus $111.50/MWh for expiring
contract
Approximately 95% of 2011 anticipated coal and nuclear output hedged at
average price of $68/MWh
PSEG Power considering options as part of NJ procurement process
Customer migration expanded to approximately 30% at year-end 2010
BET in service on schedule at year-end 2010 meeting all Consent Decree
requirements
Texas asset sales for approximately $687 million, $343 per KW
|
| PSE&G
2010 Q4 Review
*
*
*
*
*
*
* |
 23
PSE&G –
Q4 Earnings Summary
$ millions (except EPS)
Q4 2010
Q4 2009
Variance
Operating Revenues
$ 1,882
$ 1,922
($ 40)
Operating Expenses
Energy Costs
1,083
1,165
(82)
Operation & Maintenance
358
384
(26)
Depreciation & Amortization
187
146
41
Taxes Other than Income Taxes
35
33
2
Total Operating Expenses
1,663
1,728
(65)
Operating Earnings / Net Income
83
68
15
EPS from Operating Earnings*
$ 0.16
$ 0.13
$ 0.03
* See page 34 for Items excluded from Income from Continuing Operations to
reconcile to Operating Earnings. |
 24
$.16
(.02)
.02
.01
.02
$.13
0.00
0.10
0.20
PSE&G EPS Reconciliation –
Q4 2010
versus Q4 2009
Q4 2010
operating
earnings*
Q4 2009
operating
earnings*
Margins
Electric, Gas &
Transmission
D&A
* See page 34 for Items excluded from Income from Continuing Operations to
reconcile to Operating Earnings. O&M
Rate Increase |
 25
PSE&G –
Q4 Operating Highlights
Annual transmission revenue increase of $45 million effective on
January 1, 2011
Resolved Societal Benefits Clause with NJ BPU
PSE&G’s distribution operations earned a 9.7% return on equity in
2010 Operations
Regulatory and Market
Environment
Financial
Economic recovery remains slow but commercial sales up slightly in Q4
O&M remains under control
Focused on maintaining reliability |
| PSEG
Energy Holdings 2010 Q4 Review
*
*
*
*
*
*
* |
 27
PSEG Energy Holdings –
Q4 2010 Earnings Summary
$ millions (except EPS)
Q4 2010
Q4 2009
Variance
Operating Earnings
$ 5
$ 12
($ 7)
Net Reversal of Lease Transaction
Reserves
-
29
(29)
Net Income (Loss)
$ 5
$ 41
($ 36)
EPS from Operating Earnings*
$ 0.01
$ 0.03
($ 0.02)
* See page 34 for Items excluded from Income from Continuing Operations to
reconcile to Operating Earnings. |
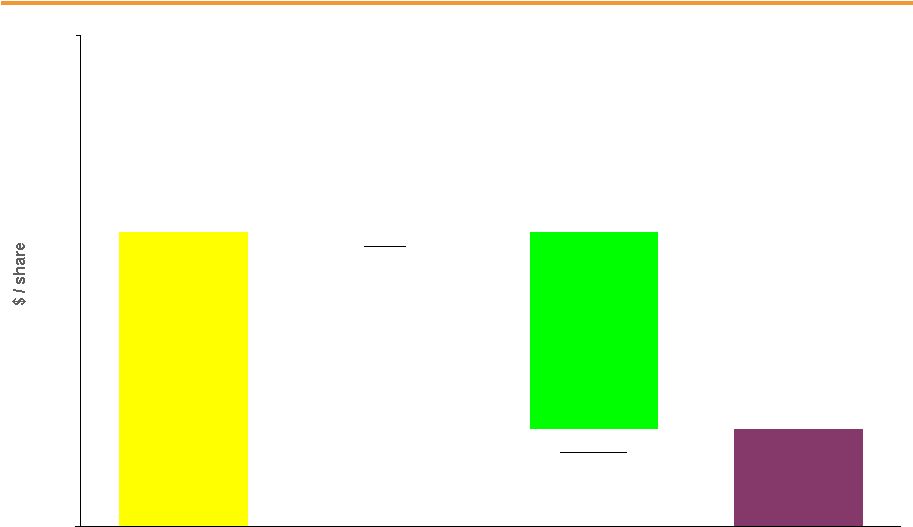 28
$.01
(.02)
.00
$.03
0.00
0.05
PSEG Energy Holdings EPS Reconciliation –
Q4 2010 versus
Q4 2009
Q4 2010
operating
earnings*
Q4 2009
operating
earnings*
2009 Lease
Sales
* See page 34 for Items excluded from Income from Continuing Operations to
reconcile to Operating Earnings. Resources
Lower Lease
Sales (.03)
Other .01
Global
GWF
(Impairment)
(.01)
Taxes & Other
.01 |
 29
PSEG Energy Holdings –
Q4 Operating Highlights
Financial
All 18 international leveraged leases have been terminated,
reducing potential cash tax liability at year-end to $260 million
$320 million on deposit with IRS to meet potential tax liability
Redeemed all outstanding recourse debt at Holdings’
level |
| PSEG
*
*
*
*
*
*
* |
 31
PSEG Financial Highlights
2011
operating
earnings
guidance
of
$2.50
-
$2.75
per
share
Guidance by operating company
Financial risk associated with international lease investments
eliminated
Financial position strengthened
All
Holdings’
long-term,
recourse
debt
eliminated
at
year-end
2010
Debt
:
capital
ratio
remained
strong
at
45%
at
year-end
2010 |
 32
PSEG 2011 Operating Earnings Guidance -
PSEG 2011 Operating Earnings Guidance -
By Subsidiary
By Subsidiary
$ millions (except EPS)
2011E
2010A
PSEG Power
$ 765 –
$ 855
$ 1,091
PSE&G
$ 495 –
$ 520
$ 430
PSEG Energy Holdings
$ 0 –
$ 5
$ 49
Enterprise
$ 5 –
$ 15
$ 14
Operating Earnings*
$ 1,265 –
$ 1,395
$ 1,584
Earnings per Share
$ 2.50 –
$ 2.75
$ 3.12
* See Page 34 for Items excluded from Income from Continuing Operations to
reconcile to Operating Earnings. |
 33
PSEG Liquidity as of January 31, 2011
Expiration
Total
Available
Company
Facility
Date
Facility
Usage
Liquidity
5-Year Credit Facility (Power)
Dec-12
$1,600
1
$144
$1,456
5-Year Credit Facility (PSEG)
Dec-12
$1,000
2
$14
$986
5-Year Bilateral Facility (Power)
Sep-15
$100
$100
$0
2-Year Credit Facility (Power)
Jul-11
$350
$0
$350
PSE&G
5-Year Credit Facility
Jun-12
$600
3
$0
$600
Total
$3,650
$3,392
1
Power Facility reduces by $75 million in 12/2011
2
PSEG Facility reduces by $47 million in 12/2011
3
PSE&G Facility reduces by $28 million in 6/2011
PSEG /
Power
($Millions) |
 34
Items Excluded from Income from Continuing Operations to
Reconcile to Operating Earnings
Please see Page 2 for an explanation of PSEG’s use of Operating Earnings as a
non-GAAP financial measure and how it differs from Net Income.
Pro-forma Adjustments, net of tax
2010
2009
2010
2009
Earnings Impact ($ Millions)
Gain (Loss) on Nuclear Decommissioning Trust (NDT)
Fund Related Activity (PSEG Power)
15
$
8
$
46
$
9
$
Gain (Loss) on Mark-to-Market (MTM) (PSEG Power)
(28)
3
(1)
(11)
Net Reversal of Lease Transaction Reserves (Energy Holdings)
-
29
-
29
Market Transition Charge Refund (PSE&G)
-
-
(72)
-
Total Pro-forma adjustments
(13)
$
40
$
(27)
$
27
$
Fully Diluted Average Shares Outstanding (in Millions)
507
507
507
507
Per Share Impact (Diluted)
Gain (Loss) on NDT Fund Related Activity (PSEG Power)
0.03
$
0.02
$
0.09
$
0.02
$
Gain (Loss) on MTM (PSEG Power)
(0.06)
0.01
-
(0.02)
Net Reversal of Lease Transaction Reserves (Energy Holdings)
-
0.05
-
0.05
Market Transition Charge Refund (PSE&G)
-
-
(0.14)
-
Total Pro-forma adjustments
(0.03)
$
0.08
$
(0.05)
$
0.05
$
For the Three Months Ended
For the Twelve Months Ended
December 31,
December 31,
PUBLIC SERVICE ENTERPRISE GROUP INCORPORATED
Reconciling Items Excluded from Continuing Operations to Compute Operating Earnings
(Unaudited) |