Attached files
| file | filename |
|---|---|
| 8-K - FORM 8-K - PUBLIC SERVICE ELECTRIC & GAS CO | d8k.htm |
| EX-99.1 - SLIDESHOW PRESENTATION - PUBLIC SERVICE ELECTRIC & GAS CO | dex991.htm |
Exhibit 99

|
Investor News | NYSE:PEG |
For further information, contact:
| • Kathleen A. Lally, Vice President – Investor Relations |
Phone: 973-430-6565 | |
| • Carlotta Chan Lane, Manager – Investor Relations |
Phone: 973-430-6596 |
February 22, 2011
PSEG ANNOUNCES 2010 RESULTS
$3.07 PER SHARE FROM CONTINUING OPERATIONS
$3.12 PER SHARE OF OPERATING EARNINGS
Results In Line With Operating Earnings Guidance of $3.00 - $3.25 Per Share
Company Guides Toward 2011 Operating Earnings of $2.50 - $2.75 Per Share
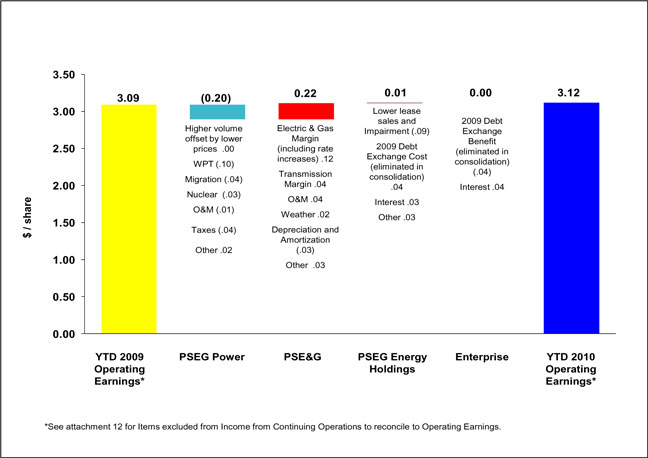
Public Service Enterprise Group (PSEG) reported today 2010 Income from Continuing Operations of $1,557 million or $3.07 per share as compared to Income from Continuing Operations of $1,594 million or $3.14 per share for 2009. Including Income from Discontinued Operations ($7 million or $0.01 per share), PSEG reported Net Income for 2010 of $1,564 million or $3.08 per share compared to Net Income for 2009 of $1,592 million or $3.14 per share. Operating Earnings for the year 2010 were $1,584 million or $3.12 per share compared to 2009 Operating Earnings of $1,567 million or $3.09 per share.
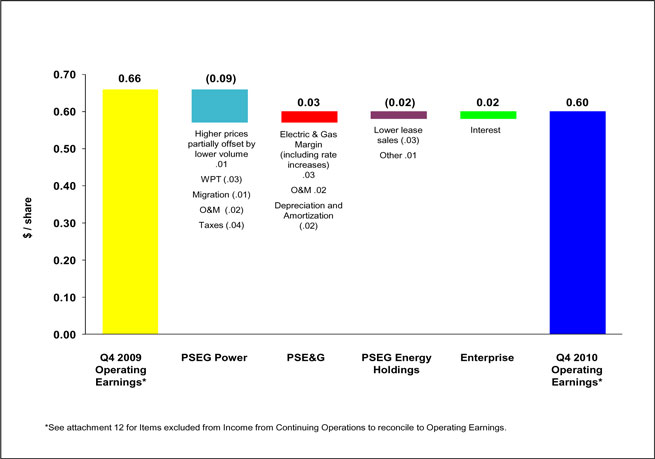
PSEG also reported Income from Continuing Operations for the fourth quarter of 2010 of $290 million, or $0.57 per share. This compares to fourth quarter 2009 results of $374 million, or $0.74 per share. Operating Earnings for the fourth quarter of 2010 were $303 million, or $0.60 per share compared to fourth quarter 2009 Operating Earnings of $334 million, or $0.66 per share. The results for the quarter and the full year have been adjusted to reflect the reclassification of the results for the Texas generating assets to discontinued operations.
“We had a successful year in 2010 despite very challenging market conditions”, said Ralph Izzo, chairman, president and chief executive officer of PSEG. He went on to say that “at Power, we completed the back-end technology work at our New Jersey coal stations that supports their operation under more stringent environmental rules, and our Hope Creek nuclear station achieved a 100 INPO rating. The resolution of PSE&G’s rate case will support its long-term growth; at Energy Holdings, we made strides in building renewables outside NJ and we terminated all of our remaining International leveraged leases. The balance sheet remains strong to fund growth.”
Izzo added “we owe a debt of gratitude to PSEG’s 10,000 strong work force. We would not have been able to achieve our operational and financial goals without their daily commitment.”
PSEG believes that the non-GAAP financial measure of “Operating Earnings” provides a consistent and comparable measure of performance of its businesses to help shareholders understand performance trends. Operating Earnings exclude the impact of returns/(losses) associated with Nuclear Decommissioning Trust (NDT) investments and Mark-To-Market accounting as well as other one-time items not related to ongoing operations. The table below provides a reconciliation of PSEG’s Net Income to Operating Earnings (a non-GAAP measure) for the full year and fourth quarter. See Attachment 12 for a complete list of items excluded from Income from Continuing Operations in the determination of Operating Earnings.
PSEG CONSOLIDATED EARNINGS (unaudited)
Full-Year Comparative Results
2010 and 2009
| Income ($millions) |
Diluted Earnings Per Share |
|||||||||||||||
| 2010 | 2009 | 2010 | 2009 | |||||||||||||
| Net Income |
$ | 1,564 | $ | 1,592 | $ | 3.08 | $ | 3.14 | ||||||||
| (Income) Loss from Discontinued Ops |
(7 | ) | 2 | (0.01 | ) | — | ||||||||||
| Income From Continuing Ops |
$ | 1,557 | $ | 1,594 | $ | 3.07 | $ | 3.14 | ||||||||
| Reconciling Items |
27 | (27 | ) | 0.05 | (0.05 | ) | ||||||||||
| Operating Earnings (Non-GAAP) |
$ | 1,584 | $ | 1,567 | $ | 3.12 | $ | 3.09 | ||||||||
| Avg. Shares | 507M | 507M | ||||||||||||||
PSEG CONSOLIDATED EARNINGS (unaudited)
Fourth Quarter Comparative Results
2010 and 2009
| Income ($millions) |
Diluted Earnings Per Share |
|||||||||||||||
| 2010 | 2009 | 2010 | 2009 | |||||||||||||
| Net Income |
$ | 282 | $ | 349 | $ | 0.56 | $ | 0.69 | ||||||||
| Loss from Discontinued Ops |
8 | 25 | 0.01 | 0.05 | ||||||||||||
| Income From Continuing Ops |
$ | 290 | $ | 374 | $ | 0.57 | $ | 0.74 | ||||||||
| Reconciling Items: |
13 | (40 | ) | 0.03 | (0.08 | ) | ||||||||||
| Operating Earnings (Non-GAAP) |
$ | 303 | $ | 334 | $ | 0.60 | $ | 0.66 | ||||||||
| Avg. Shares | 507M | 507M | ||||||||||||||
In discussing PSEG’s outlook for 2011, Izzo said that “PSEG will continue to focus on maintaining high levels of operating efficiency across all of our businesses, and deploying capital to support long-term growth. However, we will not be able to offset the effect on operating earnings in 2011 from declining market prices of power, including the effect of anticipated customer migration on our average realized price. In addition, we will have higher depreciation as the Back-End Technology went into service for our coal units. We are providing operating earnings guidance for 2011 in the range of $2.50- $2.75 per share.”
The following table outlines PSEG 2010 operating earnings by subsidiary and expectations for 2011.
2
2011 Guidance and 2010 Operating Earnings
($ millions)
| 2011E | 2010A | |||
| PSEG Power |
$765-$855 | $1,091 | ||
| PSE&G |
495-520 | 430 | ||
| PSEG Energy Holdings |
0-5 | 49 | ||
| PSEG Parent |
5-15 | 14 | ||
| Operating Earnings |
$1,265-$1,395 | $1,584 | ||
| Earnings Per Share |
$2.50-$2.75 | $3.12 |
Operating Earnings Review and Outlook by Operating Subsidiary
See Attachments 6 and 7 for detail regarding the quarter-over-quarter and year-over-year earnings reconciliations for each of PSEG’s businesses.
PSEG Power
PSEG Power reported operating earnings of $212 million ($0.42 per share) for the fourth quarter of 2010 bringing full year operating earnings to $1,091 million ($2.15 per share). On a comparative basis, PSEG Power reported operating earnings of $260 million ($0.51 per share) and $1,193 million ($2.35 per share) for the fourth quarter and full year 2009 respectively.
PSEG Power’s fourth quarter and full year operating earnings for 2010 and 2009 reflect the removal of earnings from the Texas generating assets.
PSEG Power’s results in the fourth quarter benefited from higher pricing in the wholesale market which improved earnings by $0.03 per share. The improvement in pricing offset the impact of generation volumes, which while up 8.7% for the year, were down 5.7% in the quarter, reducing earnings by $0.02 per share. Output for the quarter was affected by a 26-day refueling outage at Power’s 100%-owned Hope Creek nuclear reactor, and testing associated with the tie-in of the back-end technology at the New Jersey based coal units which reduced their availability in the quarter. Customer migration away from the BGS contract reduced earnings in the quarter by $0.01 per share. An increase in operating and maintenance expense associated with the refueling outage at Hope Creek reduced earnings in the quarter by $0.02 per share. The continued erosion in margin on certain wholesale electric energy supply contracts that Power supplies from the market reduced earnings by $0.03 per share. In addition, Power’s higher effective tax rate in the fourth quarter reduced earnings by $0.04 per share. The higher effective rate was primarily due to accelerated depreciation benefits created by the 2010 tax relief act that lowered Power’s Manufacturing Deduction.
PSEG Power’s operating earnings for 2011 are forecast at $765 million to $855 million. The decline in forecast operating earnings is due to expectations of lower energy prices in 2011 due to the roll-off of high-priced legacy hedges as well as expectations for continued customer migration. Power’s results will also be affected by increased depreciation associated with the year-end 2010 in-service of the investment in back-end technology at the Hudson and Mercer coal units, and the continued impact on the tax rate from lower Manufacturing Deduction.
3
Power continues to hedge its expected generation in future years consistent with past practice. After the recently concluded Basic Generation Service (BGS) auction in New Jersey, approximately 95% of Power’s anticipated 2011 coal and nuclear generation (40 TWh) is hedged at an average price of $68 per MWh. For 2012, approximately 45% of generation is hedged at an average price of $68 per MWh. These figures reflect assumed customer migration levels of 38-40% at the end of 2011 versus 30% at year-end 2010 and expectations for continued growth in migration in 2012.
PSE&G
PSE&G reported operating earnings of $83 million ($0.16 per share) for the fourth quarter bringing full year operating earnings to $430 million ($0.85 per share). On a comparative basis, PSE&G reported operating earnings of $68 million ($0.13 per share) and $321 million ($0.63 per share) for the fourth quarter and full year 2009 respectively.
PSE&G’s results in the quarter were driven by the electric and gas rate settlement, an increase in investment and a reduction in operating and maintenance expenses. An increase in electric and gas rates of $73.5 million and $26.5 million that went into effect on June 7, 2010 and July 9, 2010 respectively added $0.01 per share to earnings. The implementation of a gas weather normalization clause as part of the July 2010 gas rate settlement limited the impact of weather-related gas sales on earnings. An increase in revenues associated primarily with investments for capital infrastructure, renewables and transmission investments added $0.02 per share to earnings. A reduction in operating and maintenance costs of $0.02 per share was offset by an equal increase in depreciation and amortization expense.
PSE&G experienced an increase in demand from all customer classes during the fourth quarter reflecting weather that was colder than normal (and colder than last year), and more stable economic conditions. Electric and Gas sales increased 2.0% and 3.4% respectively during the fourth quarter. The increase in demand during the fourth quarter resulted in electric sales growth of 4.0% for the full year. Gas sales experienced a decline of 4.4% for the year reflecting the negative impact on sales of the warm winter weather experienced at the beginning of the year.
PSE&G’s operating earnings for 2011 are forecast at $495 million to $520 million compared to 2010’s operating earnings of $430 million. Operating earnings will be influenced by a full year of electric and gas rate relief; a $45 million increase in transmission revenues effective on January 1, 2011 and increased investment.
PSEG Energy Holdings
PSEG Energy Holdings reported operating earnings for the fourth quarter of 2010 of $5 million ($0.01 per share) compared to operating earnings of $12 million ($0.03 per share) for the fourth quarter of 2009. The results for the fourth quarter brought Energy Holdings’ full year 2010 operating earnings to $49 million ($0.10 per share). The results for 2010 compare with 2009’s operating earnings of $43 million ($0.09 per share).
The decline in operating earnings for the quarter reflects a reduction in gains recorded on lease terminations and lower project earnings ($0.03 per share) as well as the impairment of an asset ($0.01 per share) which more than offset the benefit of lower interest expense and other items ($0.02 per share).
Energy Holdings’ successfully terminated the remaining international leveraged lease during the quarter. The termination reduced Holdings’ net cash exposure to $260 million at the end of December. Holdings’ has $320 million on deposit with the IRS to defray potential interest costs associated with this disputed tax matter.
4
Energy Holdings’ operating earnings for 2011 are forecast at $0 million to $5 million. The anticipated decline in operating earnings for 2011 is influenced by the absence of $20 million ($0.04 per share) of net gains recorded in 2010 from the sale of assets after asset impairments and expenses related to the early redemption of debt. In addition, lower earnings from the remaining Holdings portfolio primarily due to asset sales and, anticipated lower investment tax credits from solar projects, are expected to lower operating earnings in 2011.
Other Items
PSEG Power expects to close on the sale of its Texas generating assets (2,000 Mw of combined cycle capacity) in early 2011. The assets are being sold in two separate transactions for $687 million.
FORWARD-LOOKING STATEMENT
Readers are cautioned that statements contained in this presentation about our and our subsidiaries’ future performance, including future revenues, earnings, strategies, prospects, consequences and all other statements that are not purely historical, are forward-looking statements for purposes of the safe harbor provisions under The Private Securities Litigation Reform Act of 1995. When used herein, the words “anticipate”, “intend”, “estimate”, “believe”, “expect”, “plan”, “should”, “hypothetical”, “potential”, “forecast”, “project”, variations of such words and similar expressions are intended to identify forward-looking statements. Although we believe that our expectations are based on reasonable assumptions, they are subject to risks and uncertainties and we can give no assurance they will be achieved. The results or developments projected or predicted in these statements may differ materially from what may actually occur. Factors which could cause results or events to differ from current expectations include, but are not limited to:
| • | Adverse changes in energy industry law, policies and regulation, including market structures and a potential shift away from competitive markets toward subsidized market mechanisms, transmission planning and cost allocation rules, including rules regarding who is permitted to build transmission going forward, and reliability standards. |
| • | Any inability of our transmission and distribution businesses to obtain adequate and timely rate relief and regulatory approvals from federal and state regulators. |
| • | Changes in federal and state environmental regulations that could increase our costs or limit operations of our generating units. |
| • | Changes in nuclear regulation and/or developments in the nuclear power industry generally that could limit operations of our nuclear generating units. |
| • | Actions or activities at one of our nuclear units located on a multi-unit site that might adversely affect our ability to continue to operate that unit or other units located at the same site. |
| • | Any inability to balance our energy obligations, available supply and trading risks. |
| • | Any deterioration in our credit quality. |
| • | Availability of capital and credit at commercially reasonable terms and conditions and our ability to meet cash needs. |
| • | Any inability to realize anticipated tax benefits or retain tax credits. |
| • | Changes in the cost of, or interruption in the supply of, fuel and other commodities necessary to the operation of our generating units. |
| • | delays in receipt of necessary permits and approvals for our construction and development activities, |
| • | Delays or unforeseen cost escalations in our construction and development activities. |
| • | Adverse changes in the demand for or price of the capacity and energy that we sell into wholesale electricity markets. |
5
| • | Increase in competition in energy markets in which we compete. |
| • | Adverse performance of our decommissioning and defined benefit plan trust fund investments and changes in discount rates and funding requirements. |
| • | Changes in technology and customer usage patterns. |
For further information, please refer to our Annual Report on Form 10-K, including Item 1A. Risk Factors, and subsequent reports on Form 10-Q and Form 8-K filed with the Securities and Exchange Commission. These documents address in further detail our business, industry issues and other factors that could cause actual results to differ materially from those indicated in this presentation. In addition, any forward-looking statements included herein represent our estimates only as of today and should not be relied upon as representing our estimates as of any subsequent date. While we may elect to update forward-looking statements from time to time, we specifically disclaim any obligation to do so, even if our internal estimates change, unless otherwise required by applicable securities laws.
6
Attachment 1
PUBLIC SERVICE ENTERPRISE GROUP INCORPORATED
Operating Earnings and Per Share Results by Subsidiary
(Unaudited)
| For the Three Months Ended December 31, |
For the Twelve Months Ended December 31, |
|||||||||||||||
| 2010 | 2009 | 2010 | 2009 | |||||||||||||
| Earnings Results ($ Millions) | ||||||||||||||||
| PSEG Power |
$ | 212 | $ | 260 | $ | 1,091 | $ | 1,193 | ||||||||
| PSE&G |
83 | 68 | 430 | 321 | ||||||||||||
| PSEG Energy Holdings |
5 | 12 | 49 | 43 | ||||||||||||
| PSEG |
3 | (6 | ) | 14 | 10 | |||||||||||
| Operating Earnings |
$ | 303 | $ | 334 | $ | 1,584 | $ | 1,567 | ||||||||
| Reconciling Items(a) |
(13 | ) | 40 | (27 | ) | 27 | ||||||||||
| Income from Continuing Operations |
$ | 290 | $ | 374 | $ | 1,557 | $ | 1,594 | ||||||||
| Discontinued Operations |
(8 | ) | (25 | ) | 7 | (2 | ) | |||||||||
| Net Income |
$ | 282 | $ | 349 | $ | 1,564 | $ | 1,592 | ||||||||
| Fully Diluted Average Shares Outstanding (in Millions) |
507 | 507 | 507 | 507 | ||||||||||||
| Per Share Results (Diluted) | ||||||||||||||||
| PSEG Power |
$ | 0.42 | $ | 0.51 | $ | 2.15 | $ | 2.35 | ||||||||
| PSE&G |
0.16 | 0.13 | 0.85 | 0.63 | ||||||||||||
| PSEG Energy Holdings |
0.01 | 0.03 | 0.10 | 0.09 | ||||||||||||
| PSEG |
0.01 | (0.01 | ) | 0.02 | 0.02 | |||||||||||
| Operating Earnings |
$ | 0.60 | $ | 0.66 | $ | 3.12 | $ | 3.09 | ||||||||
| Reconciling Items(a) |
(0.03 | ) | 0.08 | (0.05 | ) | 0.05 | ||||||||||
| Income from Continuing Operations |
$ | 0.57 | $ | 0.74 | $ | 3.07 | $ | 3.14 | ||||||||
| Discontinued Operations |
(0.01 | ) | (0.05 | ) | 0.01 | — | ||||||||||
| Net Income |
$ | 0.56 | $ | 0.69 | $ | 3.08 | $ | 3.14 | ||||||||
| (a) | See attachment 12 for details of items excluded from Income from Continuing Operations to compute Operating Earnings. |
Note:
Income from Continuing Operations includes preferred stock dividends relating to PSE&G of $1 million for the three months ended December 31, 2009.
Income from Continuing Operations includes preferred stock dividends relating to PSE&G of $1 million and $4 million for the twelve months ended December 31, 2010 and 2009, respectively.
Attachment 2
PUBLIC SERVICE ENTERPRISE GROUP INCORPORATED
Consolidating Statements of Operations
(Unaudited, $ Millions)
| For the Three Months Ended December 31, 2010 | ||||||||||||||||||||
| PSEG | OTHER (a) | PSEG POWER |
PSE&G | PSEG ENERGY HOLDINGS |
||||||||||||||||
| OPERATING REVENUES |
$ | 2,745 | $ | (734 | ) | $ | 1,575 | $ | 1,882 | $ | 22 | |||||||||
| OPERATING EXPENSES |
||||||||||||||||||||
| Energy Costs |
1,240 | (734 | ) | 891 | 1,083 | — | ||||||||||||||
| Operation and Maintenance |
642 | (8 | ) | 282 | 358 | 10 | ||||||||||||||
| Depreciation and Amortization |
239 | 3 | 45 | 187 | 4 | |||||||||||||||
| Taxes Other Than Income Taxes |
35 | — | — | 35 | — | |||||||||||||||
| Total Operating Expenses |
2,156 | (739 | ) | 1,218 | 1,663 | 14 | ||||||||||||||
| OPERATING INCOME |
589 | 5 | 357 | 219 | 8 | |||||||||||||||
| Income from Equity Method Investments |
(8 | ) | — | — | — | (8 | ) | |||||||||||||
| Other Income and Deductions |
29 | (4 | ) | 27 | 3 | 3 | ||||||||||||||
| Other Than Temporary Impairments |
(1 | ) | — | (1 | ) | — | — | |||||||||||||
| Interest Expense |
(116 | ) | 4 | (38 | ) | (79 | ) | (3 | ) | |||||||||||
| Preferred Stock Dividends |
— | — | — | — | — | |||||||||||||||
| INCOME FROM CONTINUING OPERATIONS BEFORE INCOME TAXES (b) |
493 | 5 | 345 | 143 | — | |||||||||||||||
| Income Tax Expense |
(203 | ) | (2 | ) | (146 | ) | (60 | ) | 5 | |||||||||||
| INCOME (LOSS) FROM CONTINUING OPERATIONS |
290 | 3 | 199 | 83 | 5 | |||||||||||||||
| Discontinued Operations, net of tax |
(8 | ) | — | (8 | ) | — | — | |||||||||||||
| NET INCOME |
$ | 282 | $ | 3 | $ | 191 | $ | 83 | $ | 5 | ||||||||||
| Income from Continuing Operations |
$ | 290 | $ | 3 | $ | 199 | $ | 83 | $ | 5 | ||||||||||
| Less: Reconciling Items Excluded from Continuing Operations (C): |
(13 | ) | — | (13 | ) | — | — | |||||||||||||
| OPERATING EARNINGS |
$ | 303 | $ | 3 | $ | 212 | $ | 83 | $ | 5 | ||||||||||
| For the Three Months Ended December 31, 2009 | ||||||||||||||||||||
| PSEG | OTHER (a) | PSEG POWER |
PSE&G | PSEG ENERGY HOLDINGS |
||||||||||||||||
| OPERATING REVENUES |
$ | 2,812 | $ | (813 | ) | $ | 1,678 | $ | 1,922 | $ | 25 | |||||||||
| OPERATING EXPENSES |
||||||||||||||||||||
| Energy Costs |
1,263 | (813 | ) | 911 | 1,165 | — | ||||||||||||||
| Operation and Maintenance |
648 | (7 | ) | 261 | 384 | 10 | ||||||||||||||
| Depreciation and Amortization |
198 | 4 | 45 | 146 | 3 | |||||||||||||||
| Taxes Other Than Income Taxes |
33 | — | — | 33 | — | |||||||||||||||
| Total Operating Expenses |
2,142 | (816 | ) | 1,217 | 1,728 | 13 | ||||||||||||||
| OPERATING INCOME |
670 | 3 | 461 | 194 | 12 | |||||||||||||||
| Income from Equity Method Investments |
— | — | — | — | — | |||||||||||||||
| Other Income and Deductions |
(2 | ) | (17 | ) | 13 | — | 2 | |||||||||||||
| Other Than Temporary Impairments |
— | — | — | — | — | |||||||||||||||
| Interest Expense |
(120 | ) | — | (42 | ) | (76 | ) | (2 | ) | |||||||||||
| Preferred Stock Dividends |
— | 1 | — | (1 | ) | — | ||||||||||||||
| INCOME FROM CONTINUING OPERATIONS BEFORE INCOME TAXES (b) |
548 | (13 | ) | 432 | 117 | 12 | ||||||||||||||
| Income Tax Expense |
(174 | ) | 7 | (161 | ) | (49 | ) | 29 | ||||||||||||
| INCOME (LOSS) FROM CONTINUING OPERATIONS |
374 | (6 | ) | 271 | 68 | 41 | ||||||||||||||
| Discontinued Operations, net of tax |
(25 | ) | — | (25 | ) | — | — | |||||||||||||
| NET INCOME |
$ | 349 | $ | (6 | ) | $ | 246 | $ | 68 | $ | 41 | |||||||||
| Income from Continuing Operations |
$ | 374 | $ | (6 | ) | $ | 271 | $ | 68 | $ | 41 | |||||||||
| Less: Reconciling Items Excluded from Continuing Operations (C): |
40 | — | 11 | — | 29 | |||||||||||||||
| OPERATING EARNINGS |
$ | 334 | $ | (6 | ) | $ | 260 | $ | 68 | $ | 12 | |||||||||
| (a) | Primarily includes financing activities and donations at the parent and intercompany eliminations. |
| (b) | Income from Continuing Operations before Income Taxes includes preferred stock dividends relating to PSE&G of $1 million for the three months ended December 31, 2009. |
| (c) | See attachment 12 for details of items excluded from Income from Continuing Operations to compute Operating Earnings. |
Attachment 3
PUBLIC SERVICE ENTERPRISE GROUP INCORPORATED
Consolidating Statements of Operations
(Unaudited, $ Millions)
| For the Twelve Months Ended December 31, 2010 | ||||||||||||||||||||
| PSEG | OTHER (a) | PSEG POWER |
PSE&G | PSEG ENERGY HOLDINGS |
||||||||||||||||
| OPERATING REVENUES |
$ | 11,793 | $ | (2,771 | ) | $ | 6,558 | $ | 7,869 | $ | 137 | |||||||||
| OPERATING EXPENSES |
||||||||||||||||||||
| Energy Costs |
5,261 | (2,768 | ) | 3,374 | 4,655 | — | ||||||||||||||
| Operation and Maintenance |
2,504 | (26 | ) | 1,046 | 1,442 | 42 | ||||||||||||||
| Depreciation and Amortization |
955 | 16 | 175 | 750 | 14 | |||||||||||||||
| Taxes Other Than Income Taxes |
136 | — | — | 136 | — | |||||||||||||||
| Total Operating Expenses |
8,856 | (2,778 | ) | 4,595 | 6,983 | 56 | ||||||||||||||
| OPERATING INCOME |
2,937 | 7 | 1,963 | 886 | 81 | |||||||||||||||
| Income from Equity Method Investments |
4 | — | — | — | 4 | |||||||||||||||
| Other Income and Deductions |
158 | 6 | 117 | 23 | 12 | |||||||||||||||
| Other Than Temporary Impairments |
(11 | ) | (2 | ) | (9 | ) | — | — | ||||||||||||
| Interest Expense |
(472 | ) | 14 | (157 | ) | (318 | ) | (11 | ) | |||||||||||
| Preferred Stock Dividends |
— | 1 | — | (1 | ) | — | ||||||||||||||
| INCOME FROM CONTINUING OPERATIONS BEFORE INCOME TAXES |
2,616 | 26 | 1,914 | 590 | 86 | |||||||||||||||
| Income Tax Expense |
(1,059 | ) | (12 | ) | (778 | ) | (232 | ) | (37 | ) | ||||||||||
| INCOME (LOSS) FROM CONTINUING OPERATIONS |
1,557 | 14 | 1,136 | 358 | 49 | |||||||||||||||
| Discontinued Operations, net of tax |
7 | — | 7 | — | — | |||||||||||||||
| NET INCOME |
$ | 1,564 | $ | 14 | $ | 1,143 | $ | 358 | $ | 49 | ||||||||||
| Income from Continuing Operations |
$ | 1,557 | $ | 14 | $ | 1,136 | $ | 358 | $ | 49 | ||||||||||
| Less: Reconciling Items Excluded from Continuing Operations (C): |
(27 | ) | — | 45 | (72 | ) | — | |||||||||||||
| OPERATING EARNINGS |
$ | 1,584 | $ | 14 | $ | 1,091 | $ | 430 | $ | 49 | ||||||||||
| For the Twelve Months Ended December 31, 2009 | ||||||||||||||||||||
| PSEG | OTHER (a) | PSEG POWER |
PSE&G | PSEG ENERGY HOLDINGS |
||||||||||||||||
| OPERATING REVENUES |
$ | 12,035 | $ | (3,201 | ) | $ | 6,772 | $ | 8,243 | $ | 221 | |||||||||
| OPERATING EXPENSES |
||||||||||||||||||||
| Energy Costs |
5,433 | (3,199 | ) | 3,462 | 5,170 | — | ||||||||||||||
| Operation and Maintenance |
2,534 | (32 | ) | 1,045 | 1,474 | 47 | ||||||||||||||
| Depreciation and Amortization |
819 | 16 | 184 | 608 | 11 | |||||||||||||||
| Taxes Other Than Income Taxes |
133 | — | — | 133 | — | |||||||||||||||
| Total Operating Expenses |
8,919 | (3,215 | ) | 4,691 | 7,385 | 58 | ||||||||||||||
| OPERATING INCOME |
3,116 | 14 | 2,081 | 858 | 163 | |||||||||||||||
| Income from Equity Method Investments |
17 | — | — | — | 17 | |||||||||||||||
| Other Income and Deductions |
85 | 8 | 98 | 5 | (26 | ) | ||||||||||||||
| Other Than Temporary Impairments |
(61 | ) | (1 | ) | (60 | ) | — | — | ||||||||||||
| Interest Expense |
(521 | ) | (11 | ) | (161 | ) | (312 | ) | (37 | ) | ||||||||||
| Preferred Stock Dividends |
— | 4 | — | (4 | ) | — | ||||||||||||||
| INCOME FROM CONTINUING OPERATIONS BEFORE INCOME TAXES (b) |
2,636 | 14 | 1,958 | 547 | 117 | |||||||||||||||
| Income Tax Expense |
(1,042 | ) | (4 | ) | (767 | ) | (226 | ) | (45 | ) | ||||||||||
| INCOME (LOSS) FROM CONTINUING OPERATIONS |
1,594 | 10 | 1,191 | 321 | 72 | |||||||||||||||
| Discontinued Operations, net of tax |
(2 | ) | — | (2 | ) | — | — | |||||||||||||
| NET INCOME (LOSS) |
$ | 1,592 | $ | 10 | $ | 1,189 | $ | 321 | $ | 72 | ||||||||||
| Income from Continuing Operations |
$ | 1,594 | $ | 10 | $ | 1,191 | $ | 321 | $ | 72 | ||||||||||
| Less: Reconciling Items Excluded from Continuing Operations (C): |
27 | — | (2 | ) | — | 29 | ||||||||||||||
| OPERATING EARNINGS |
$ | 1,567 | $ | 10 | $ | 1,193 | $ | 321 | $ | 43 | ||||||||||
| (a) | Primarily includes financing activities and donations at the parent and intercompany eliminations. |
| (b) | Income from Continuing Operations before Income Taxes includes preferred stock dividends relating to PSE&G of $1 million and $4 million for the twelve months ended December 31, 2010 and 2009, respectively. |
| (c) | See attachment 12 for details of items excluded from Income from Continuing Operations to compute Operating Earnings. |
Attachment 4
PUBLIC SERVICE ENTERPRISE GROUP INCORPORATED
Capitalization Schedule
(Unaudited, $ Millions)
| December 31, 2010 |
December 31, 2009 |
|||||||
| DEBT |
||||||||
| Commercial Paper and Loans |
$ | 64 | $ | 530 | ||||
| Long-Term Debt |
7,748 | 6,781 | ||||||
| Securitization Debt |
1,145 | 1,343 | ||||||
| Project Level, Non-Recourse Debt |
47 | 42 | ||||||
| Total Debt |
9,004 | 8,696 | ||||||
| SUBSIDIARY’S PREFERRED STOCK WITHOUT MANDATORY REDEMPTION |
— | 80 | ||||||
| STOCKHOLDERS’ EQUITY |
||||||||
| Common Stock |
4,807 | 4,788 | ||||||
| Treasury Stock |
(593 | ) | (588 | ) | ||||
| Retained Earnings |
5,575 | 4,704 | ||||||
| Accumulated Other Comprehensive Loss |
(156 | ) | (116 | ) | ||||
| Total Common Stockholders’ Equity |
9,633 | 8,788 | ||||||
| Noncontrolling Interests - Equity Investments |
8 | 10 | ||||||
| Total Equity |
9,641 | 8,798 | ||||||
| Total Capitalization |
$ | 18,645 | $ | 17,574 | ||||
Attachment 5
PUBLIC SERVICE ENTERPRISE GROUP INCORPORATED
CONDENSED CONSOLIDATED STATEMENTS OF CASH FLOWS
(Unaudited, $ Millions)
| For the Twelve Months Ended December 31, | ||||||||
| 2010 | 2009 | |||||||
| CASH FLOWS FROM OPERATING ACTIVITIES |
||||||||
| Net Income |
$ | 1,564 | $ | 1,592 | ||||
| Adjustments to Reconcile Net Income to Net Cash Flows From Operating Activities |
600 | 263 | ||||||
| NET CASH PROVIDED BY OPERATING ACTIVITIES |
2,164 | 1,855 | ||||||
| NET CASH USED IN INVESTING ACTIVITIES |
(1,669 | ) | (792 | ) | ||||
| NET CASH USED IN FINANCING ACTIVITIES |
(565 | ) | (1,034 | ) | ||||
| Net Increase (Decrease) in Cash and Cash Equivalents |
(70 | ) | 29 | |||||
| Cash and Cash Equivalents at Beginning of Period |
350 | 321 | ||||||
| Cash and Cash Equivalents at End of Period |
$ | 280 | $ | 350 | ||||
Attachment 6
PUBLIC SERVICE ENTERPRISE GROUP INCORPORATED
Quarter-over-Quarter EPS Reconciliation
December 31, 2010 vs. December 31, 2009
(Unaudited)
| (a) | See attachment 12 for details of items excluded from Continuing Operations to compute Operating Earnings. |
Attachment 7
PUBLIC SERVICE ENTERPRISE GROUP INCORPORATED
Year-over-Year EPS Reconciliation
December 31, 2010 vs. December 31, 2009
(Unaudited)
Attachment 8
PSEG POWER LLC
Generation Measures
(Unaudited)
| GWhr Breakdown | GWhr Breakdown | |||||||||||||||
| Three Months Ended December 31, |
Twelve Months Ended December 31, |
|||||||||||||||
| 2010 | 2009 | 2010 | 2009 | |||||||||||||
| Nuclear - NJ |
4,676 | 5,196 | 20,193 | 20,978 | ||||||||||||
| Nuclear - PA |
2,317 | 2,335 | 9,378 | 9,305 | ||||||||||||
| Total Nuclear |
6,993 | 7,531 | 29,571 | 30,283 | ||||||||||||
| Fossil - Coal - NJ* |
570 | 984 | 3,872 | 2,750 | ||||||||||||
| Fossil - Coal - PA |
1,517 | 1,133 | 5,831 | 5,141 | ||||||||||||
| Fossil - Coal - CT |
199 | 392 | 1,229 | 1,008 | ||||||||||||
| Total Coal |
2,286 | 2,509 | 10,932 | 8,899 | ||||||||||||
| Fossil - Oil & Natural Gas - NJ |
2,668 | 2,593 | 11,872 | 9,376 | ||||||||||||
| Fossil - Oil & Natural Gas - NY |
861 | 956 | 4,227 | 3,493 | ||||||||||||
| Fossil - Oil & Natural Gas - CT |
3 | (2 | ) | 125 | 113 | |||||||||||
| Total Oil & Natural Gas |
3,532 | 3,547 | 16,224 | 12,982 | ||||||||||||
| 12,811 | 13,587 | 56,727 | 52,164 | |||||||||||||
| % Generation by Fuel Type |
% Generation by Fuel Type |
|||||||||||||||
| Three Months Ended December 31, |
Twelve Months Ended December 31, |
|||||||||||||||
| 2010 | 2009 | 2010 | 2009 | |||||||||||||
| Nuclear - NJ |
36 | % | 38 | % | 36 | % | 40 | % | ||||||||
| Nuclear - PA |
18 | % | 17 | % | 16 | % | 18 | % | ||||||||
| Total Nuclear |
54 | % | 55 | % | 52 | % | 58 | % | ||||||||
| Fossil - Coal - NJ* |
4 | % | 7 | % | 7 | % | 5 | % | ||||||||
| Fossil - Coal - PA |
12 | % | 9 | % | 10 | % | 10 | % | ||||||||
| Fossil - Coal - CT |
2 | % | 3 | % | 2 | % | 2 | % | ||||||||
| Total Coal |
18 | % | 19 | % | 19 | % | 17 | % | ||||||||
| Fossil - Oil & Natural Gas - NJ |
21 | % | 19 | % | 21 | % | 18 | % | ||||||||
| Fossil - Oil & Natural Gas - NY |
7 | % | 7 | % | 8 | % | 7 | % | ||||||||
| Fossil - Oil & Natural Gas - CT |
0 | % | 0 | % | 0 | % | 0 | % | ||||||||
| Total Oil & Natural Gas |
28 | % | 26 | % | 29 | % | 25 | % | ||||||||
| 100 | % | 100 | % | 100 | % | 100 | % | |||||||||
| * | Includes Pumped Storage. Pumped Storage accounted for <1% of total generation for the three and twelve months ended December 31, 2010 and 2009. |
Attachment 9
PUBLIC SERVICE ELECTRIC & GAS COMPANY
Retail Sales and Revenues
(Unaudited)
December 31, 2010
Electric Sales and Revenues
| Three Months Ended |
Change vs. 2009 |
Twelve Months Ended |
Change vs. 2009 |
|||||||||||||
| Sales (millions kwh) |
||||||||||||||||
| Residential |
2,897 | 0.1 | % | 14,197 | 9.3 | % | ||||||||||
| Commercial & Industrial |
6,918 | 3.1 | % | 29,071 | 1.7 | % | ||||||||||
| Street Lighting |
111 | -7.7 | % | 377 | -1.5 | % | ||||||||||
| Interdepartmental |
2 | 2.8 | % | 10 | 3.0 | % | ||||||||||
| Total |
9,928 | 2.0 | % | 43,655 | 4.0 | % | ||||||||||
| Revenue (in millions) |
||||||||||||||||
| Residential |
$ | 489 | 1.8 | % | $ | 2,382 | 8.1 | % | ||||||||
| Commercial & Industrial |
532 | -3.3 | % | 2,482 | -12.0 | % | ||||||||||
| Street Lighting |
20 | -13.2 | % | 77 | -3.3 | % | ||||||||||
| Other Operating Revenues* |
84 | 26.0 | % | 361 | 30.7 | % | ||||||||||
| Total |
$ | 1,126 | 0.4 | % | $ | 5,302 | -1.5 | % | ||||||||
| Weather Data |
Quarter Ended |
Change vs. 2009 |
Twelve Months Ended |
Change vs. 2009 |
||||||||||||
| THI Hours - Actual |
243 | 150.3 | % | 20,245 | 77.2 | % | ||||||||||
| THI Hours - Normal |
329 | 15,384 | ||||||||||||||
| * | Primarily sales of Non-Utility Generator energy to PJM and Transmission related revenues. |
Attachment 10
PUBLIC SERVICE ELECTRIC & GAS COMPANY
Retail Sales and Revenues
(Unaudited)
December 31, 2010
Gas Sold and Transported
| Three Months Ended |
Change vs. 2009 |
Twelve Months Ended |
Change vs. 2009 |
|||||||||||||
| Sales (millions therms) |
||||||||||||||||
| Residential Sales |
434 | 2.1 | % | 1,319 | -6.0 | % | ||||||||||
| Commercial & Industrial - Firm Sales |
150 | 3.5 | % | 483 | -6.5 | % | ||||||||||
| Commercial & Industrial - Interr. & Cogen |
50 | 55.2 | % | 188 | 4.8 | % | ||||||||||
| Total |
634 | 5.3 | % | 1,990 | -5.2 | % | ||||||||||
| Gas Transported - Firm Sales |
153 | 6.9 | % | 477 | 2.9 | % | ||||||||||
| Gas Transported - Non-Firm |
268 | 17.9 | % | 997 | 6.5 | % | ||||||||||
| Revenue (in millions) |
||||||||||||||||
| Residential Sales |
$ | 281 | -19.9 | % | $ | 1,007 | -23.0 | % | ||||||||
| Commercial & Industrial - Firm Sales |
91 | 0.2 | % | 328 | -3.7 | % | ||||||||||
| Commercial & Industrial - Interr. & Cogen |
27 | 51.4 | % | 103 | 16.7 | % | ||||||||||
| Other Operating Revenues* |
38 | -5.9 | % | 149 | 4.9 | % | ||||||||||
| Total |
$ | 437 | -12.6 | % | $ | 1,587 | -15.6 | % | ||||||||
| Gas Transported |
319 | 6.1 | % | 979 | -0.3 | % | ||||||||||
| Weather Data |
Quarter Ended |
Change vs. 2009 |
Ended Ended | Change vs. 2009 |
||||||||||||
| Degree Days - Actual |
1,315 | 10.9 | % | 3,461 | -5.8 | % | ||||||||||
| Degree Days - Normal |
1,223 | 3,583 | ||||||||||||||
| * | Primarily Appliance Service. |
Attachment 11
PUBLIC SERVICE ENTERPRISE GROUP INCORPORATED
Statistical Measures
(Unaudited)
| For the Three Months Ended December 31 |
For the Twelve Months Ended December 31 |
|||||||||||||||
| 2010 | 2009 | 2010 | 2009 | |||||||||||||
| Weighted Average Common Shares Outstanding (000’s) |
||||||||||||||||
| Basic |
505,938 | 505,987 | 505,985 | 505,986 | ||||||||||||
| Diluted |
506,974 | 507,382 | 507,045 | 507,064 | ||||||||||||
| Stock Price at End of Period |
$ | 31.81 | $ | 33.25 | ||||||||||||
| Dividends Paid per Share of Common Stock |
$ | 0.3425 | $ | 0.3325 | $ | 1.3700 | $ | 1.3300 | ||||||||
| Dividend Payout Ratio* |
43.9 | % | 43.0 | % | ||||||||||||
| Dividend Yield |
4.3 | % | 4.0 | % | ||||||||||||
| Price/Earnings Ratio* |
10.2 | 10.8 | ||||||||||||||
| Rate of Return on Average Common Equity* |
17.1 | % | 18.7 | % | ||||||||||||
| Book Value per Common Share |
$ | 19.04 | $ | 17.37 | ||||||||||||
| Market Price as a Percent of Book Value |
167 | % | 191 | % | ||||||||||||
| Total Shareholder Return |
-2.8 | % | 6.9 | % | -0.1 | % | 19.2 | % | ||||||||
| . | ||||||||||||||||
| * | Calculation based on Operating Earnings for the 12 month period ended |
Attachment 12
PUBLIC SERVICE ENTERPRISE GROUP INCORPORATED
Reconciling Items Excluded from Continuing Operations to Compute Operating Earnings
(Unaudited)
| For the Three Months Ended December 31,` |
For the Twelve Months Ended December 31, |
|||||||||||||||
| Pro-forma Adjustments, net of tax |
2010 | 2009 | 2010 | 2009 | ||||||||||||
| Earnings Impact ($ Millions) | ||||||||||||||||
| Gain (Loss) on Nuclear Decommissioning Trust (NDT) Fund Related Activity (PSEG Power) |
$ | 15 | $ | 8 | $ | 46 | $ | 9 | ||||||||
| Gain (Loss) on Mark-to-Market (MTM) (PSEG Power) |
(28 | ) | 3 | (1 | ) | (11 | ) | |||||||||
| Net Reversal of Lease Transaction Reserves (Energy Holdings) |
— | 29 | — | 29 | ||||||||||||
| Market Transition Charge Refund (PSE&G) |
— | — | (72 | ) | — | |||||||||||
| Total Pro-forma adjustments |
$ | (13 | ) | $ | 40 | $ | (27 | ) | $ | 27 | ||||||
| Fully Diluted Average Shares Outstanding (in Millions) |
507 | 507 | 507 | 507 | ||||||||||||
| Per Share Impact (Diluted) | ||||||||||||||||
| Gain (Loss) on NDT Fund Related Activity (PSEG Power) |
$ | 0.03 | $ | 0.02 | $ | 0.09 | $ | 0.02 | ||||||||
| Gain (Loss) on MTM (PSEG Power) |
(0.06 | ) | 0.01 | — | (0.02 | ) | ||||||||||
| Net Reversal of Lease Transaction Reserves (Energy Holdings) |
— | 0.05 | — | 0.05 | ||||||||||||
| Market Transition Charge Refund (PSE&G) |
— | — | (0.14 | ) | — | |||||||||||
| Total Pro-forma adjustments |
$ | (0.03 | ) | $ | 0.08 | $ | (0.05 | ) | $ | 0.05 | ||||||