Attached files
Table of Contents
UNITED STATES
SECURITIES AND EXCHANGE COMMISSION
Washington, D.C. 20549
FORM 10-K
ANNUAL REPORT PURSUANT TO SECTION 13 OR 15(d) OF THE
SECURITIES EXCHANGE ACT OF 1934
For the fiscal year ended December 31, 2010
Commission File Number 001-34251
MEAD JOHNSON NUTRITION COMPANY
(Exact name of registrant as specified in its charter)
| Delaware | 80-0318351 | |
| (State or other jurisdiction of incorporation or organization) |
(IRS Employer Identification No.) |
2701 Patriot Blvd.
Glenview, Illinois 60026
(Address of principal executive offices)
Registrant’s telephone number: (847) 832-2420
Securities registered pursuant to Section 12(b) of the Act:
| Title of each class |
Name of each exchange on which registered | |
| Common Stock, $0.01 Par Value | New York Stock Exchange |
Securities registered pursuant to Section 12(g) of the Act: None
Indicate by check mark if the registrant is a well-known seasoned issuer, as defined in Rule 405 of the Securities Act. Yes x No ¨
Indicate by check mark if the registrant is not required to file reports pursuant to Section 13 or Section 15(d) of the Act. Yes ¨ No x
Indicate by check mark whether the registrant (1) has filed all reports required to be filed by Section 13 or 15(d) of the Securities Exchange Act of 1934 during the preceding 12 months (or for such shorter period that the registrant was required to file such reports), and (2) has been subject to such filing requirements for the past 90 days. Yes x No ¨
Indicate by check mark whether the registrant has submitted electronically and posted on its corporate Web site, if any, every Interactive Data File required to be submitted and posted pursuant to Rule 405 of Regulation S-T during the preceding 12 months (or for such shorter period that the registrant was required to submit and post such files). Yes ¨ No ¨
Indicate by check mark if disclosure of delinquent filers pursuant to Item 405 of Regulation S-K is not contained herein, and will not be contained, to the best of the registrant’s knowledge, in definitive proxy or information statements incorporated by reference in Part III of this Form 10-K or any amendment to this Form 10-K. ¨
Indicate by check mark whether the registrant is a large accelerated filer, an accelerated filer, a non-accelerated filer or a smaller reporting company. See definitions of “large accelerated filer”, “accelerated filer” and “smaller reporting company” in Rule 12b-2 of the Exchange Act.
Large accelerated filer x Accelerated filer ¨ Non-accelerated filer ¨ Smaller reporting company ¨
Indicate by check mark if the registrant is a shell company (as defined in Rule 12b-2 of the Exchange Act). Yes ¨ No x
The aggregate market value of the shares of common stock held by non-affiliates of the registrant, computed by reference to the closing price as reported on the New York Stock Exchange, as of June 30, 2010, the last business day of the registrant’s most recently completed second fiscal quarter, was approximately $10.3 billion. At February 14, 2011, there were 204,587,974 shares of common stock outstanding.
DOCUMENTS INCORPORATED BY REFERENCE
Portions of the Proxy Statement for the registrant’s 2011 Annual Meeting of Stockholders are incorporated by reference into PART III of this Annual Report on Form 10-K. Such Proxy Statement will be filed with the U.S. Securities and Exchange Commission within 120 days after the end of the fiscal year to which this report relates.
Table of Contents
| Page | ||||||
| PART I |
||||||
| Item 1. |
1 | |||||
| Item 1A. |
13 | |||||
| Item 1B. |
26 | |||||
| Item 2. |
26 | |||||
| Item 3. |
27 | |||||
| PART II |
||||||
| Item 5. |
29 | |||||
| Item 6. |
31 | |||||
| Item 7. |
MANAGEMENT’S DISCUSSION AND ANALYSIS OF FINANCIAL CONDITION AND RESULTS OF OPERATIONS |
32 | ||||
| Item 7A. |
49 | |||||
| Item 8. |
51 | |||||
| Item 9. |
CHANGES IN AND DISAGREEMENTS WITH ACCOUNTANTS ON ACCOUNTING AND FINANCIAL DISCLOSURE |
87 | ||||
| Item 9A. |
87 | |||||
| Item 9B. |
87 | |||||
| PART III |
||||||
| Item 10. |
88 | |||||
| Item 11. |
88 | |||||
| Item 12. |
SECURITY OWNERSHIP OF CERTAIN BENEFICIAL OWNERS AND MANAGEMENT AND RELATED STOCKHOLDER MATTERS |
88 | ||||
| Item 13. |
CERTAIN RELATIONSHIPS AND RELATED TRANSACTIONS, AND DIRECTOR INDEPENDENCE |
88 | ||||
| Item 14. |
88 | |||||
| PART IV |
||||||
| Item 15. |
89 | |||||
Table of Contents
PART I
| Item 1. | BUSINESS. |
In this Annual Report on Form 10-K, we refer to Mead Johnson Nutrition Company and its subsidiaries as “the Company,” “MJN,” “Mead Johnson,” “we” or “us.”
Our Company
Mead Johnson Nutrition Company is a global leader in pediatric nutrition with $3.1 billion in net sales for the year ended December 31, 2010. We are committed to being the world’s leading nutrition company for infants and children and to helping nourish the world’s children for the best start in life. Our Enfa family of brands, including Enfamil infant formula, is the world’s leading brand franchise in pediatric nutrition, based on retail sales. Our comprehensive product portfolio addresses a broad range of nutritional needs for infants, children and expectant and nursing mothers. We have over 100 years of innovation experience during which we have developed or improved many breakthrough or industry-defining products across each of our product categories. Our singular focus on pediatric nutrition and our implementation of a business model that integrates nutritional science with health care and consumer marketing expertise differentiate us from many of our competitors.
We market our portfolio of more than 70 products to mothers, health care professionals and retailers in more than 50 countries in Asia, North America, Latin America and Europe. Our two reportable segments are Asia/Latin America and North America/Europe, which comprised 61% and 39%, respectively, of our net sales for the year ended December 31, 2010. See “Item 8. Financial Statements—Note 7. Segment Information.” For the year ended December 31, 2010, 68% of our net sales were generated in countries outside of the United States.
We believe parents and health care professionals associate the Mead Johnson name and the Enfa family of brands with quality, science-based pediatric nutrition products. We believe the strength of our brands allows us to create and maintain consumer loyalty across our product portfolio and stages of pediatric development.
The two principal product categories in which we operate are infant formula and children’s nutrition, which represented 62% and 36% of our net sales for the year ended December 31, 2010, respectively.
Our History
Mead Johnson was founded in 1905 and introduced Dextri-Maltose, our first infant feeding product, in 1911. Over the next several decades, we built upon our leadership in science-based nutrition, introducing many innovative infant feeding products while expanding into vitamins, pharmaceutical products and adult and children’s nutrition. Some of our products, developed in cooperation with clinicians and leading nutrition researchers, established a partnership between Mead Johnson and the scientific community that continues to this day.
During the course of our history, we have expanded our operations into geographies outside of the United States, including Asia, Latin America and Europe and now focus solely on pediatric nutrition. Throughout our history, our deeply-held commitment to support breastfeeding and our commitment to improve the health and development of infants and children around the world have been hallmarks of our organization.
Our Brands
The Mead Johnson name has been associated with science-based nutritional products for over 100 years. In addition to the Mead Johnson name, our products are marketed around the world under brands that we have developed through our global sales and marketing efforts.
1
Table of Contents
Enfa Family of Brands
The Enfa family of brands includes several of the world’s leading infant formula and children’s nutrition brands. We have positioned the Enfa family of brands as providing unique, clinically supported health and developmental benefits. The Enfa family of brands features infant formula products that include docosahexaenoic acid (DHA) and arachidonic (ARA) support brain, visual and nervous and immune system development. Our Enfa family of brands accounted for 79% of our net sales for the year ended December 31, 2010, and is the world’s leading brand franchise in pediatric nutrition, based on retail sales.
Building upon the strength of our brand equity, we have extended the Enfa family of brands into the fast-growing children’s nutrition category. We believe we have enhanced consumer retention by creating links between age groups and leveraging brand loyalty.
Additionally, the use of the Enfa prefix in our prenatal nutrition products (such as EnfaMama A+) reinforces the scientific basis, quality and innovation that these products hold in common with our core pediatric nutrition line.
We consistently promote the brand through our global sales and marketing operations. Our studies show mothers and health care professionals often associate the Enfa family of brands with science, superior nutrition, quality and good value. Mothers often describe the Enfa family of brands as science-based, sophisticated, trustworthy, reliable and comforting. Additionally, health care professionals frequently comment on our professional and innovative approach to nutrition science.
Complementary Brands
In addition to the Enfa family of brands, we market several other powerful brands on a local, regional or global basis. These brands complement the Enfa family of brands portfolio and are designed to meet the nutritional needs of broad consumer populations (such as ChocoMilk and Cal-C-Tose) or the specific nutritional needs of infants under the supervision of health care professionals (such as Nutramigen).
Stages of Development
Generally, there are six stages of pediatric development and we produce different products for each of these stages. The general stages of pediatric development are illustrated below:
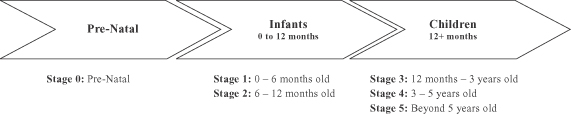
In the United States, our business is primarily focused on the infant formula category (Stages 1 and 2) and certain children’s nutrition products (Stage 3). Outside of the United States, however, we market both infant formula products (Stages 1 and 2) and an extended range of children’s nutrition products designed for the changing nutritional needs of growing toddlers and children (Stages 3, 4 and 5). This allows us to take advantage of brand loyalty developed in Stages 1 and 2 to retain consumers as they grow older.
Our Products
Our pediatric nutrition products are grouped by category of feeding: (1) infant formula products, (2) children’s nutrition products and (3) other products. Infant formula, children’s nutrition and other product sales comprised approximately 62%, 36% and 2% of our net sales for the year ended December 31, 2010, respectively.
2
Table of Contents
Infant Formula
General
Our infant formula products include formulas for routine feeding, solutions formulas for mild intolerance and specialty formula products, including formulas for severe intolerance, formulas for premature and low birth weight infants and medical nutrition products. The table below illustrates our key infant formula brands and products:
| ROUTINE INFANT FORMULA |
SOLUTIONS INFANT FORMULA FOR COMMON FEEDING PROBLEMS |
SPECIALTY INFANT FORMULAS | ||
| Stage 1 • Enfamil Premium • Enfamil Premium Newborn • Enfamil Lipil • Enfamil A+ • Enfalac A+ Stage 2 • Enfamil Premium Next Step • Enfapro A+ • Enfapro Premium |
Many available in stages 1 and 2 • Enfamil Gentlease: for gas/fussiness • Enfamil ProSobee: soy formula • Enfamil LactoFree: for lactose intolerance • Enfamil AR: for anti-regurgitation • Enfamil HA: for infants with milk protein allergy • Enfamil Comfort: for gas/fussiness |
Many available in stages 1 and 2 • Nutramigen LIPIL: for severe protein sensitivity • Nutramigen AA: for multiple food allergies • Pregestimil: for fat malabsorption • Enfamil Premature: for premature infants • Enfacare: for premature babies |
Routine Infant Formula
We design routine infant formula as a breast milk substitute for healthy, full-term infants without special nutritional needs both for use as the infant’s sole source of nutrition and as a supplement to breastfeeding. We endeavor to bring routine infant formula closer to breast milk. We also provide products within our routine formula line for healthy full-term infants who experience common feeding problems with symptoms such as mild spit-up, fussiness or gas.
Each product is referred to as a “formula”, as it is formulated for the specific nutritional needs of an infant of a given age. Generally, our routine infant formula has the following four main components: (1) protein from cow’s milk that is processed to have a profile similar to human milk, (2) a blend of vegetable fats (including DHA/ARA) to replace bovine milk fat in order to better resemble the composition of human milk, (3) a carbohydrate, generally lactose from cow’s milk and (4) a vitamin and mineral “micronutrient” pre-mix that is blended into the product to meet the specific needs of the infant at a given age. Patterned after breast milk, which changes composition to meet the infant’s changing nutritional needs, we produce two stages of infant formula. Stage 1 formula is consumed by newborn infants up to six months of age, and Stage 2 formula is generally consumed by infants aged from six to twelve months. Our most prominent product form around the world is milk-based powder, but we also produce several infant formulas in ready-to-use and concentrated liquid form for sale in the United States and Canada.
We market the same product under different names in different regions, based on regional marketing strategies and regional brand recognition. For example, our premium Stage 1 infant formulas containing DHA and ARA are sold under the brands Enfamil Premium and Enfamil Premium Newborn in the United States. Outside the United States, Enfamil Premium is sold under the brands Enfamil A+/Enfalac A+. In parts of Asia, Latin America and Europe, we use the name Enfapro for our Stage 2 products.
Routine infant formula products comprised 69%, 67%, and 65% of our infant formula net sales for the years ended December 31, 2010, 2009, and 2008, respectively.
3
Table of Contents
Solutions Infant Formulas
We design several solutions infant formulas to address common feeding tolerance problems in normal infants, including spitting-up, fussiness, gas and lactose intolerance. We market our solutions infant formulas for mild intolerance such as Gentlease and Prosobee under the Enfa family of brands name.
Solutions infant formula products comprised 16%, 18%, and 19% of our infant formula net sales for the years ended December 31, 2010, 2009, and 2008, respectively.
Specialty Infant Formulas
Our specialty infant formulas include: (1) formulas for severe intolerance, (2) formulas for premature and low birth weight infants and (3) medical nutrition products. Specialty infant formula products comprised 15%, 15%, and 16% of our infant formula net sales for the years ended December 31, 2010, 2009, and 2008, respectively.
Formulas for Severe Intolerance
We design formulas for severe intolerance to be used on the specific recommendation and under the supervision of a doctor. We specially formulate these products for use by infants displaying symptoms of certain conditions or diagnosed with special medical needs.
Nutramigen infant formula was the first infant formula to include protein hydrolysate in the United States. This ingredient is easier for infants with severe intolerance to digest because its protein is extensively hydrolyzed (or broken down into peptides, a process that would otherwise be performed in the infant’s stomach). We designed Nutramigen infant formula for use by infants with severe cow’s milk protein allergies. Nutramigen with LGG infant formula is a variant of Nutramigen we market in Europe and the United States. LGG is a probiotic ingredient that has been associated with reduced incidence of infant atopic dermatitis, a non-contagious skin disease characterized by chronic inflammation of the skin, resulting from an allergy to cow’s milk. Nutramigen AA infant formula is an amino acid formula we formulated with fully broken-down proteins that can be consumed without the need for digestion of the protein. We designed this product for infants who experience a severe allergy to cow’s milk or multiple other food allergies. Pregestimil infant formula is a variation of the Nutramigen formulation designed mainly for fat malabsorption. It contains medium chain triglycerides oil instead of fat.
Formulas for Premature and Low Birth Weight Infants
We also design products for premature and low birth weight infants to meet these infants’ unique needs under the supervision of a doctor, most often in the hospital. Typically, such infants need extra assistance obtaining the requisite nutrition. They require a higher density of nutrients and calories because they cannot take in enough volume of breast milk or routine infant formula. We designed Enfamil Human Milk Fortifier product as a supplement to a mother’s breast milk that improves nutritional density. EnfaCare infant formula, another of our products, is a hypercaloric formula available at retail for premature babies when they are able to go home. In addition, Enfamil Premature is an infant formula used primarily in the hospital.
Medical Nutrition
We also produce medical foods, or foods for special medical purposes, for nutritional management of individuals with rare, inborn errors of metabolism such as maple syrup urine disease (Mead Johnson BCAD) and phenylketonuria (Mead Johnson Phenyl-Free). Category 1 products are intended for infants and young children from zero to three years of age and Category 2 products are suitable for children and adults. We produce approximately 20 formulas targeted at specific disorders for use under the direct and continuous supervision of a physician. We market these medical nutrition products under the Mead Johnson brand name.
4
Table of Contents
Children’s Nutrition Products
Children’s nutrition products are designed to provide children with enhanced nutrition. Our children’s nutrition business is present primarily in Asia and Latin America. We separate our children’s nutrition products into two categories: (1) Enfa branded children’s nutrition products and (2) other children’s nutrition products. The table below illustrates our key children’s nutrition products:
| ENFA BRANDED CHILDREN’S NUTRITION PRODUCTS |
OTHER CHILDREN’S NUTRITION PRODUCTS | |
| Stage 3 • Enfagrow A+ • Enfagrow Premium Stage 4 • Enfakid A+ Stage 5 • EnfaSchool A+ |
Many available in stages 3, 4 and 5 • Sustagen KID: nutritious powdered milk for picky eaters • Lactum: nutritious powdered milk for picky eaters • Alacta: nutritious powdered milk • ChocoMilk: nutritious milk modifier • Cal-C-Tose: nutritious milk modifier |
Enfa Branded Children’s Nutrition Products
We market children’s nutrition products under the Enfa family of brands. We design these products to meet the changing nutrition needs of children at different stages of development. We offer products at Stages 3, 4 and 5 that are designed for children’s nutritional needs at one to three years of age, three to five years of age and beyond five years of age, respectively. These products are not breast milk substitutes and are not designed for use as the sole source of nutrition but instead are designed to be a part of a child’s appropriate diet. Our use of the Enfa prefix allows for a consistent equity across Stages 3, 4 and 5, with products such as Enfagrow offered at Stage 3 and Enfakid offered at Stage 4 and EnfaSchool at Stage 5. Enfa branded children’s nutrition products comprised 68%, 65%, and 56% of our children’s nutrition products sales for the years ended December 31, 2010, 2009, and 2008, respectively.
Other Products
We also produce a range of other products, including pre-natal and post-natal nutritional supplements for expectant and nursing mothers, including Expecta LIPIL, EnfaMama A+. Our products for expectant or nursing mothers provide the developing fetus or breastfed infant with vitamin supplements and/or an increased supply of DHA for brain, visual and nervous system development. These products also supplement the mother’s diet by providing either DHA or ARA with increased proteins, as well as 24 vitamins and minerals. Our pediatric vitamin products, such as Enfamil Poly-Vi-Sol, provide a range of benefits for infants, including multivitamins and iron supplements. These other products comprised 2%, 4%, and 3% of our net sales for the years ended December 31, 2010, 2009, and 2008, respectively.
The Special Supplemental Nutrition Program for Women, Infants and Children (WIC)
The WIC program is a U.S. Department of Agriculture (USDA) program created to provide nutritious foods, nutrition education and referrals to health care professionals and other social services to those considered to be at nutritional risk, including low-income pregnant, postpartum and breastfeeding women and infants and children up to age five. It is estimated that approximately 52% of all infants born in the United States during the 12-month period ended December 31, 2010, benefited from the WIC program. The USDA program is administered individually by each state.
Participation in the WIC program is an important part of our U.S. business based on the volume of infant formula sold under the program. Our financial results reflect net WIC sales, after taking into account the rebates we paid
5
Table of Contents
to the state WIC agencies, which represented approximately 10% of our U.S. net sales and 3% of our global net sales in the year ended December 31, 2010. In 2009, changes went into effect that resulted in less infant formula per participant being provided under the WIC program. As a result of these program changes, infant formula is made available based on the amount of an infant’s consumption; previously, fixed amounts of product were made available regardless of an infant’s age. These program changes have reduced the amount of free product available by an average of 10%.
Most state WIC programs provide vouchers that participants use at authorized food stores to obtain the products covered by the program, including infant formula. State WIC agencies enter into contracts with manufacturers, pursuant to which the state agency provides mothers with vouchers for a single manufacturer’s brand of infant formula and, in return, the manufacturer gives the state agency a rebate for each can of infant formula purchased by WIC participants. Retailers purchase infant formula directly from the manufacturer, paying the manufacturer’s published wholesale price. Mothers redeem the vouchers received from the WIC agency for infant formula at authorized retailers. The retailer is then reimbursed the full retail price by the WIC agency for redeemed vouchers. On a monthly basis, each state WIC agency invoices the contracted manufacturer for an amount equal to the number of cans of infant formula redeemed by the agency and paid to retailers during the month multiplied by the agreed rebate per can.
The bid solicitation process is determined by each state’s procurement laws, but the process is relatively standardized across the WIC program. Some states form groups and hold their bid processes jointly while other states solicit bids individually. Some states split bids between separate contracts for milk- and soy-based formulas. During the bid process, each manufacturer submits a sealed bid. The manufacturer with the lowest net price, calculated as the manufacturer’s published wholesale price less the manufacturer’s rebate bid, is awarded the contract. No other factors are considered. WIC contracts are generally three years in duration with some contracts providing for extensions. Specific contract provisions can vary significantly from state to state.
Manufacturers that choose to compete for WIC contracts must have a widely distributed infant formula brand in order to meet the requirements of the contract bidding process. As of December 31, 2010, we hold the contracts that supply approximately 41% of WIC births.
As of December 31, 2010, we hold the exclusive WIC contract for the following states and territories:
| State |
Date of Expiration |
% of Total WIC Infant Participation(1) |
||||
| Arkansas |
September 30, 2012 | 1.1 | % | |||
| California |
July 31, 2012 | 13.8 | % | |||
| Colorado(2) |
December 31, 2011 | 1.3 | % | |||
| Illinois(2) |
January 31, 2012 | 3.8 | % | |||
| Indiana |
September 30, 2011 | 2.0 | % | |||
| Louisiana |
September 30, 2012 | 1.9 | % | |||
| Michigan |
November 1, 2011 | 3.0 | % | |||
| Mississippi |
September 30, 2011 | 1.3 | % | |||
| Missouri(2) |
September 30, 2012 | 1.8 | % | |||
| Nebraska(2) |
September 30, 2012 | 0.5 | % | |||
| New Mexico |
September 30, 2012 | 0.7 | % | |||
| New York(3) |
June 30, 2011 | NA | ||||
| North Carolina |
September 30, 2012 | 3.1 | % | |||
| Puerto Rico(2) |
September 30, 2012 | 1.9 | % | |||
| South Dakota(2) |
September 30, 2012 | 0.2 | % | |||
| (1) | As of November 30, 2010, based on a two-month average as reported by the United States Department of Agriculture Food and Nutrition Service (the USDA FNS). |
| (2) | Contract contains extension provisions. |
6
Table of Contents
| (3) | The New York WIC contract is split between milk and soy products, but the USDA FNS only publishes data on a combined basis. We previously held only the milk infant formula WIC contract but, in 2010, were the successful bidder for both the milk and soy infant formula WIC contracts. Although these contract bids occurred in 2010, the contracts will commence on July 1, 2011 and expire on June 30, 2014. |
Sales and Marketing
We conduct regional marketing in North America, Europe, Asia and Latin America within a global strategic framework focused on both mothers and health care professionals in compliance with our policy with respect to the International Code of Marketing of Breast-milk Substitutes (International Code). See “—Regulatory—Global Policy and Guidance—WHO.” We maintain a health care professional sales force and retail sales organization throughout the world. Our marketing activities vary from region to region depending on our market position, consumer trends and the regulatory environment. Our marketing teams seek to anticipate market and consumer trends, and attempt to capture deep consumer insight to determine strategy for brand positioning and communication, product innovation and demand-generation programs. The marketing teams work with external agencies to create strong marketing campaigns for health care professionals, retail sales organizations and consumers, as permitted under the International Code and individual countries’ laws and regulations.
Health Care Professionals
Our health care professional sales force educates health care professionals about the benefits of our infant formula products in each of the countries where we market our infant formula products. Primary marketing efforts for infant formula products are directed toward securing the recommendation of the Enfa family of brands by physicians or other health care professionals. We focus our product detailing efforts on neonatal intensive care units, physicians and other health care professionals, hospital group purchasing organizations and other integrated buying organizations. We believe we have an industry-leading health care professional sales force.
Our health care professional sales force receives continuous training about our products and on customer service skills. We support health care professionals by organizing continuing medical education programs, symposia and other educational interfaces.
Retail Sales Organization
Our retail sales force markets our products to each of the retail channels where our products are purchased by consumers, including mass merchandisers, club stores, grocery stores, drug stores and, to a limited extent, convenience stores. The size, role and purpose of our retail sales organization varies significantly from country to country depending on our market position, the consolidation of the retail trade, consumer trends and the regulatory environment. In North America, Latin America and Asia, we focus on all retail channels, while in Europe we focus primarily on pharmacies. In most countries, we have entered into logistics partnerships with distributors and wholesalers.
Consumers
As their children grow older, mothers play an increasing role in brand selection. We participate in a variety of marketing activities intended for mothers of older children, including print and television advertising, direct mail, online/internet and promotional programs. Our marketing is evidence-based and emphasizes our superior nutritional science.
In the United States, our Enfamil Family Beginnings program provides new or prospective mothers with many resources to help them with their newborns, including free samples, nutritional and developmental information for mother and child and widely accepted instantly redeemable checks. The program also includes a direct mail
7
Table of Contents
component used to better inform mothers on nutritional and developmental topics, as well as frequent e-mail updates that provide pertinent information to program participants. The marketing materials at each of these stages are designed to develop interest in our products with respect to mothers’ current and future needs in order to drive purchase and create brand loyalty. The program’s educational materials are designed to help all mothers with their newborns while the program’s promotional aspects are focused primarily on our core consumer targets, mainly non-WIC mothers.
Global Supply Chain
We manage sourcing, manufacturing and distribution through our fully integrated global supply chain. We operate in-house production facilities at seven different locations around the world and additionally use third-party manufacturers for a portion of our requirements.
Locations
Our in-house manufacturing and finishing facilities are located in the United States, Mexico, the Netherlands, China, the Philippines and Thailand. See “Item 2. Properties” for a description of our global manufacturing facilities.
As the production process advances, regional or sub-regional teams support the global team, overseeing manufacturing activities such as the finishing of our products. Our four regional quality departments perform regional and manufacturing site quality control and assurance. These departments focus on regulatory requirements, food safety, pest control, continuous quality improvement, third-party compliance and ingredient supplier manufacturing operations.
Suppliers
We generally enter into long-term supply agreements. We source approximately 80% of our materials from approximately 30 suppliers. Through these suppliers, we obtain key raw materials and primary packaging materials.
We procure key raw materials and primary packaging materials on a global basis. Certain raw materials, while managed and contracted on a global basis, are subject to regional and local variations in price under the terms of the supply agreement. For example, milk prices vary at the local level around the world partly due to government pricing regulation. Dairy products, consisting primarily of milk powders, non-fat dry milk, lactose and whey protein concentrates, accounted for approximately 34% of our global expenditures for materials in the year ended December 31, 2010.
Distribution
We manage our distribution networks locally with regional oversight. We generally enter into distribution agreements with third-party logistics providers and distributors and maintain a small staff at the local or regional level to track performance and implement initiatives.
Customers
Our products are sold principally to wholesale and retail customers, both nationally and internationally. Sales to two of our customers, Wal-Mart Stores, Inc. (including sales to Sam’s Club) and DKSH International Ltd. (including sales to its regional affiliates), accounted for approximately 12%, 12% and 13% and approximately 12%, 11% and 11% of our gross sales for the years ended December 31, 2010, 2009, and 2008, respectively.
Competition
We compete in two primary categories, infant formula and children’s nutrition. The competitive landscape in each category is similar around the world, as the majority of the large global players are active in these
8
Table of Contents
categories. Our main global competitors for sales of infant formula and children’s nutrition products are Abbott Laboratories, Groupe Danone, Nestlé S.A. and Pfizer Inc. Groupe Danone and Pfizer do not compete with us in the United States. We also compete against significant local competitors in Asia and Europe.
Many other companies, including manufacturers of private label, store and economy brand products, manufacture and sell one or more products that are similar to those marketed by us. We believe sources of competitive advantage include product quality and clinical claims for efficacy, brand identity, image and associated value, broad distribution capabilities and consumer satisfaction. Significant expenditures for advertising, promotion and marketing are generally required to achieve acceptance of products among consumers and health care professionals.
Research and Development (R&D)
Continuing to invest in R&D capabilities is an important part of our business. Our research and development organization consists of professionals of which many have extensive industry experience and advanced educational backgrounds stationed primarily at three main research facilities. In 2010, we completed construction of a new scalable pilot plant in Evansville, Indiana, headquarters of our global R&D operations. In order to enhance our product innovation capabilities, we opened new Pediatric Nutrition Institutes (PNI) in Evansville, Indiana, and Mexico City, Mexico, and broke ground on a new PNI in Guangzhou, China. We also have R&D facilities in Mexico, Thailand and the Netherlands.
With respect to infant formula, we organize our research and development on a global scale because these science-based products address nutritional needs that are broadly common around the world. With respect to children’s nutritional products, we organize our research and development on a more regional basis to incorporate geographic-specific consumer behaviors and preferences.
We have a global formulation management system that supports our innovative portfolio management and product development process. This system provides significant benefits throughout the product development and manufacturing process.
We also have strong external development relationships that complement our internal research and development capabilities. We manage our research and development activities in collaboration with leading scientists and institutes around the world and we have an active portfolio of projects involving commercial technology suppliers. We believe this approach allows us to be at the forefront of scientific and technological developments relevant for pediatric nutrition. Research and development expense was $78.5 million, $71.9 million, and $72.8 million in the years ended December 31, 2010, 2009, and 2008, respectively.
Intellectual Property
Patents
We own or license approximately 33 active U.S. patents and 106 active non-U.S. patents and have 86 pending U.S. patent applications and 549 pending non-U.S. patent applications as of December 31, 2010.
Trademarks
We file and maintain our trademarks in those countries in which we have, or desire to have, a business presence. We hold an extensive portfolio of trademarks across our key geographies. We maintain more than 5,800 trademark registrations and applications in more than 140 countries worldwide.
9
Table of Contents
Regulatory
We are subject to the laws and regulations in each country in which we market our products. We have proven processes, systems and resources in place to manage the current regulatory requirements and to participate proactively in the shaping of future regional, country and global policy, guidance and regulations.
United States Food and Drug Administration (U.S. FDA)
The main regulatory body in the United States is the U.S. FDA. The U.S. FDA’s Center for Food Safety and Applied Nutrition is responsible for the regulation of infant formula. The Office of Nutritional Products, Labeling, and Dietary Supplements (ONPLDS) has program responsibility for infant formula while the Office of Food Additive Safety (OFAS) has program responsibility for food ingredients and packaging. The ONPLDS evaluates whether the infant formula manufacturer has met the requirements under the Federal Food, Drug and Cosmetic Act (FFDCA) and consults with the OFAS regarding the safety of ingredients in infant formula and of packaging materials for infant formula.
All manufacturers of pediatric nutrition products must begin with safe food ingredients, which are either generally recognized as safe or approved as food additives. The specific requirements for infant formula are governed by the Infant Formula Act of 1980, as amended (Formula Act). The purpose of the Formula Act is to ensure the safety and nutrition of infant formulas, including minimum, and in some cases, maximum levels of specified nutrients.
Once an infant formula product is formulated, the manufacturer must provide regulatory agencies assurance of the nutritional quality of that particular formulation before marketing the infant formula. The U.S. FDA has established requirements for certain labeling, nutrient content, manufacturer quality control procedures (to assure the nutrient content of infant formulas), as well as company records and reports. A manufacturer must notify the U.S. FDA 90 days before the first processing of any infant formula that differs fundamentally in processing or in composition from any previous formulation produced by the manufacturer. The U.S. FDA currently is finalizing incremental good manufacturing practices, quality control procedures, quality factors, notification requirements, and reports and records, for the production of infant formulas.
In addition, as part of its responsibility to implement the provisions of the FFDCA, the U.S. FDA continuously monitors infant formula products. The FFDCA requires infant formula manufacturers to test product composition during production and shelf-life, to keep records on production, testing and distribution of each batch of infant formula and to use good manufacturing practices and quality control procedures. In addition, the FFDCA requires infant formula manufacturers to maintain records of all complaints, some of which are reviewed to evaluate the possible existence of a hazard to health. The U.S. FDA conducts yearly inspections of all facilities that manufacture infant formula. The U.S. FDA also inspects new facilities during early production runs. As part of the inspection, the U.S. FDA collects and analyzes samples of infant formula.
Outside of the United States
Country-specific regulatory laws have provisions that include requirements for certain labeling, nutrient content and manufacturers quality control procedures (to assure the nutrient content of infant formulas), as well as company records and reports. With the exception of the European Union, most other countries’ regulatory agencies have not promulgated specific requirements for the testing of new and reformulated infant formulas. Other countries will generally refer to the U.S. FDA, European Food Safety Authority or the World Health Organization (WHO) in establishing standards and regulations for infant formulas.
10
Table of Contents
Global Policy and Guidance
WHO
The WHO is the directing and coordinating authority for health within the United Nations system. It is responsible for providing leadership on global health matters, shaping the health research agenda, setting norms and standards, articulating evidence-based policy options, providing technical support to countries and monitoring and assessing health trends.
In 1981, many Member States of the WHO’s World Health Assembly voted to adopt the International Code. The International Code aims to protect and promote breastfeeding and to ensure the proper use of breast-milk substitutes when they are necessary on the basis of adequate information and through appropriate marketing and distribution. Countries have taken variable action to enact legislation based on the recommendations of the International Code. In 1983, we believe we were the first U.S. infant formula manufacturer to develop internal marketing guidelines for developing countries based on the International Code. While the International Code is not international law, it is our policy to comply with all applicable laws and regulations and take guidance from the International Code in developing countries. In developed countries such as the United States and Canada, we comply with those countries’ laws and regulations.
Codex
The Codex Alimentarius (Codex) is the publication of internationally recognized standards, codes of practice, guidelines and other recommendations relating to infant formula and food production. These texts are developed and maintained by the Codex Commission, a body that was established in 1963 by the United Nations Food and Agriculture Organization and the WHO. In 2007, new comprehensive and more restrictive infant formula standards were published by the Codex Commission. It is usual practice for countries in Latin America, Africa and Asia to incorporate Codex standards directly into national law. We are in material compliance with all national laws and with new Codex standards where national regulatory requirements have not yet been enacted.
Environmental, Health and Safety
Our facilities and operations are subject to various environmental, health and safety laws and regulations in each of the jurisdictions in which we operate. Among other things, these requirements regulate the emission or discharge of materials into the environment, the use, management, treatment, storage and disposal of solid and hazardous substances and wastes, the control of combustible dust, the reduction of noise emissions and fire and explosion risks, the cleanup of contamination and the prevention of workplace exposures and injuries. Pollution controls and various permits and programs are required for many of our operations. Each of our global manufacturing facilities undergoes periodic internal audits relating to environmental, health and safety requirements and we incur operating and capital costs to improve our facilities or maintain compliance with applicable requirements on an ongoing basis. If we violate or become subject to liabilities under environmental, health and safety laws and regulations, including requirements under the permits and programs required for our operations, we could incur, among other things, substantial costs (including civil or criminal fines or penalties or clean-up costs), third-party claims for property damage or personal injury, or requirements to install additional pollution control or safety equipment.
From time to time, we may be responsible under various state, Federal and foreign laws, including the U.S. Comprehensive Environmental Response, Compensation, and Liability Act (CERCLA), for certain costs of investigating and/or remediating contamination at our current or former sites and/or at waste disposal or reprocessing facilities operated by third parties. Liability under CERCLA and analogous state or foreign laws may be imposed without regard to knowledge, fault or ownership at the time of the disposal or release. Most of our facilities have a history of industrial operations, and contaminants have been detected at some of our facilities. We also have been named as a “potentially responsible party”, or are involved in investigation and remediation, at two third-party disposal sites. As of December 31, 2010, management believes that the investigation and/or remediation costs related to our sites or third-party disposal sites that were probable and reasonably estimable, as well as any related accruals, are not material to us.
11
Table of Contents
We are not aware of any pending environmental, health or safety-related litigation or significant environmental, health or safety-related financial obligations or liabilities arising from current or former operations or properties that are likely to have a material adverse impact on our business, financial position or results of operations. Liabilities or obligations, which could require us to make significant expenditures, could arise in the future, however, as the result of, among other things, changes in, or new interpretations of, existing laws, regulations or enforcement policies, claims relating to on- or off-site contamination, or the imposition of unanticipated investigation or cleanup obligations. See “Item 3. Legal Proceedings.”
Insurance
Our business involves an inherent risk of product liability and any claims of this type could have an adverse impact on us. We will take what we believe are appropriate precautions to provide adequate coverage for possible product liability claims. Though our insurance coverage and cash flows have been adequate to provide for liability claims in the past, product liability claims could exceed our insurance coverage limits and cash flows, and insurance may not be available on commercially reasonable terms or at all. We evaluate our insurance requirements on an ongoing basis to ensure we maintain adequate levels of coverage.
Employees
As of December 31, 2010, we employed approximately 6,500 people worldwide. Our manufacturing workforces at Zeeland, Michigan; Evansville, Indiana; Guangzhou, China; and Chonburi, Thailand are not unionized. The manufacturing workforce at Delicias, Mexico, is unionized and covered by a collective bargaining agreement, with an annual negotiation process with the union. We completed a comprehensive renegotiation with the union in Delicias in March 2010. The manufacturing workforce and the non-supervised sales force at Makati, Philippines, are unionized and covered by a three-year collective bargaining agreement, which was renewed in December 2010. In addition, several of our workforces in Europe have Works Council representation.
Available Information
Our internet web site address is www.meadjohnson.com. On our web site, we make available, free of charge, our annual, quarterly and current reports, including amendments to such reports, as soon as reasonably practicable after we electronically file such material with, or furnish such material to, the U.S. Securities and Exchange Commission (SEC). Stockholders and other interested parties may request email notification of the posting of these documents through the section of our web site captioned “Investors.”
The information on our website is not, and shall not be deemed to be, a part of this Annual Report on Form 10-K or incorporated into any other filings we make with the SEC.
12
Table of Contents
| Item 1A. | RISK FACTORS |
In addition to the other information in this Annual Repot on Form 10-K, any of the factors described below could significantly and negatively affect the our business, prospects, financial condition or operating results, which could cause the trading price of our securities to decline.
Risks Relating to Our Business
Our success depends on sustaining the strength of our brands, particularly our Enfa family of brands
The Enfa family of brands accounts for a significant portion of our net sales. The willingness of consumers to purchase our products depends upon our ability to offer attractive brand value propositions. This in turn depends in part on consumers attributing a higher value to our products than to alternatives. If the difference in the value attributed to our products as compared to those of our competitors narrows, or if there is a perception of such a narrowing, consumers may choose not to buy our products. If we fail to promote and maintain the brand equity of our products across each of our markets, then consumer perception of our products’ nutritional quality may be diminished and our business could be materially adversely affected. Our ability to maintain or improve our value propositions will impact whether these circumstances will result in decreased market share and profitability.
We may experience liabilities or negative effects on our reputation as a result of real or perceived quality issues, including product recalls, injuries or other claims.
Whether real or perceived, contamination, spoilage or other adulteration, product mislabeling or product tampering could require us to recall products. From time to time we have experienced recalls of our products. While such recalls have not been material to our business on a global level in the past, we cannot assure you that such material product recalls will not occur in the future. We may also be subject to liability if our products or operations violate or are alleged to violate applicable laws or regulations or in the event our products cause, or are alleged to cause, injury, illness or death.
Powder milk products are not sterile. A substantial portion of our products must be prepared and maintained according to label instruction to retain their flavor and nutritional value and avoid contamination or deterioration. Depending on the specific type of product, a risk of contamination or deterioration may exist at each stage of the production cycle, including the purchase and delivery of raw food materials, the processing and packaging of food products and upon use and handling by health care professionals, hospital personnel and consumers. In the event that certain of our products are found, or are alleged, to have suffered contamination or deterioration, whether or not such products were under our control, our brand reputation and business could be materially adversely affected.
Whether real or perceived, reports or allegations of inadequate product quality control with respect to other manufacturers of pediatric nutrition products also could adversely impact sales of our products. Such reports or allegations could contribute to a perceived safety risk for certain pediatric nutrition products and adversely impact sales or otherwise disrupt our business. Moreover, federal, state and local governments and municipalities could propose or pass legislation banning the use of such products. Events such as these may create a perception of contamination risk among consumers with respect to all products in our industry.
In addition, we advertise our products and could be the target of claims relating to false or deceptive advertising under foreign laws and U.S. federal and state laws, including the consumer protection statutes of some states. A significant product liability or other legal claim or judgment against us or a widespread product recall may negatively impact our profitability. Even if a product liability or consumer fraud claim is unsuccessful or is not merited or fully pursued, the negative publicity surrounding such assertions regarding our products or processes could materially adversely affect our reputation and brand image and therefore our business.
13
Table of Contents
We are subject to numerous governmental regulations, and it can be costly to comply with these regulations. Changes in governmental regulations could harm our business.
As a producer of pediatric nutrition products, our activities are subject to extensive regulation by governmental authorities and international organizations, including rules and regulations with respect to the environment, employee health and safety, hygiene, quality control, advertising and tax laws. It can be costly to comply with these regulations and to develop compliant product processes. Our activities may also be subject to all kinds of barriers or sanctions imposed by countries or international organizations limiting international trade and increasingly dictating the specific content of our products and, with regard to the protection of consumer health and safety, limiting information and advertising about the health benefits of products that we market. In addition, regulatory changes or decisions that restrict the marketing, promotion and availability of our products, continued access to health care professionals, the ability to include genetically modified organisms in our products, as well as the manufacture and labeling of our products, could materially adversely affect our business. For example, regulations in the Philippines require governmental review of all advertisements for products intended for children under the age of two. In addition, certain consumer advocates, along with governmental agencies and non-governmental organizations, have lobbied against the marketing and sale of some pediatric nutrition products. These efforts could result in increased regulatory restrictions on our activities in the future. Our activities could be materially adversely affected by any significant changes in such regulations or their enforcement. Our ability to anticipate and comply with evolving global standards requires significant investment in monitoring the global regulatory environment and we may be unable to comply with changes in regulation restricting our ability to continue to operate our business or manufacture, market or sell our products.
Commodity price increases will increase our operating costs and may reduce our profitability.
Commodity prices impact our business directly through the cost of raw materials used to make our products (such as skim milk powder, whole milk powder, lactose and whey protein concentrate), the cost of inputs used to manufacture and ship our products (such as crude oil and energy) and the amount we pay to produce or purchase packaging for our products (such as cans, pouches, cardboard and plastic). Commodities such as these are susceptible to price volatility caused by conditions outside of our control, including fluctuations in commodities markets, currency fluctuations, availability of supply, weather, consumer demand and changes in governmental agricultural programs. Dairy costs are the largest component of our cost of goods sold. Increases in the price of dairy and other raw materials would negatively impact our gross margins if we were unable to offset such increases through increases in our selling price, changes in product mix or cost reduction/productivity enhancement efforts. The prices of these materials may continue to rise due to a general increase in commodities prices, especially for agricultural products. This would in turn affect the unit costs of products sold for our pediatric nutrition products. Although we monitor our exposure to commodity prices as an integral part of our overall risk management program, continued volatility in the prices of commodities we purchase could increase the costs of our products and we may experience lower profitability and be unable to maintain historical levels of productivity.
Our business is particularly vulnerable to commodity price increases in Asia, the fastest growing region in the pediatric nutrition industry. Commodity price increases in Asia could reduce our profits and limit our ability to pursue our growth strategy in that region. We employ various purchasing and pricing contract techniques in an effort to minimize commodity price volatility. Generally, these techniques include incorporating clauses setting forth unit pricing that is based on an average commodity price over a corresponding period of time. If we fail to manage our commodity price exposure adequately, our business may be materially adversely affected.
Our profitability may suffer as a result of competition in our markets.
The pediatric nutrition industry is intensely competitive. Our primary competitors, including Abbott Laboratories, Groupe Danone, Nestlé S.A. and Pfizer Inc., have substantial financial, marketing and other resources. We compete against large global companies, as well as regional and local companies, in each of the
14
Table of Contents
regions in which we operate. In most product categories, we compete not only with other widely advertised branded products, but also with private label, store and economy brand products that are generally sold at lower prices. Competition in our product categories are based on the following factors:
| • | brand recognition and loyalty; |
| • | product quality; |
| • | effectiveness of marketing, promotional activity and the ability to identify and satisfy consumer preferences; |
| • | product innovation; |
| • | price; and |
| • | distribution and availability of products. |
From time to time, in order to protect our existing market share or capture increased market share, we may need to improve our brand recognition and product value proposition, and increase our spending on marketing, advertising and new product innovation. The success of marketing, advertising and new product innovation is subject to risks, including uncertainties about trade and consumer acceptance. We may also need to reduce prices for some of our products in order to respond to competitive and customer pressures and to maintain our market share. Competitive and customer pressures, as well as price controls, may restrict our ability to increase prices, including in response to commodity and other cost increases. Our business will suffer if profit margins decrease, either as a result of a reduction in prices or an increase in costs with an inability to increase prices proportionally.
Economic downturns could cause consumers to shift their purchases from our higher-priced premium products to lower-priced products, which could materially adversely affect our business.
The willingness of consumers to purchase premium brand pediatric nutrition products depends in part on local economic conditions. In periods of economic uncertainty, consumers may shift their purchases from our higher-priced premium products to lower-priced products.
Volatility in the financial markets could adversely affect our liquidity, cash flow and financial flexibility, as well as the demand for our products.
Volatility in the financial markets could adversely affect economic activity and credit markets in the United States and other regions of the world in which we do business. This could have an adverse impact on our customers, distributors, suppliers, counterparties to certain financial instruments, financial service providers and other service providers.
Our operations face significant foreign currency exchange rate exposure that could materially negatively impact our operating results.
We hold assets, incur liabilities, earn revenue and pay expenses in a variety of currencies other than the U.S. dollar, primarily the Chinese renminbi, the Hong Kong dollar, the Philippine peso, the Mexican peso, the euro, the Malaysian ringitt, the Thai baht and the Canadian dollar. Because our financial statements are presented in U.S. dollars, we must translate our assets, liabilities, sales and expenses into U.S. dollars at the then-applicable exchange rates. Consequently, changes in the value of the U.S. dollar versus these other currencies may negatively affect the value of these items in our financial statements, even if their value has not changed in their original currency. While we attempt to mitigate some of this risk with hedging and other activities, our business will nevertheless remain subject to substantial foreign exchange risk from foreign currency translation exposures that we will not be able to manage through effective hedging or the use of other financial instruments.
15
Table of Contents
The global nature of our business subjects us to additional business risks that could cause our sales and profitability to decline.
We operate our business and market our products internationally in more than 50 countries. For the years ended December 31, 2010, 2009, and 2008, 68%, 65%, and 62%, respectively, of our net sales were generated in countries outside of the United States. The risks associated with our operations outside of the United States include:
| • | multiple regulatory requirements that are subject to change and that could restrict our ability to manufacture, market or sell our products; |
| • | inflation, recession, fluctuations in foreign currency exchange and interest rates and discriminatory fiscal policies; |
| • | adverse tax consequences from the repatriation of cash; |
| • | trade protection measures, including increased duties and taxes, and import or export licensing requirements; |
| • | price controls; |
| • | government health promotional programs intended to discourage the use of our products; |
| • | differing local product preferences and product requirements; |
| • | difficulty in establishing, staffing and managing operations; |
| • | differing labor regulations; |
| • | potentially negative consequences from changes in or interpretations of tax laws; |
| • | political and economic instability; |
| • | enforcement of remedies in various jurisdictions; |
| • | changes in foreign medical reimbursement policies and programs; and |
| • | diminished protection of intellectual property in some countries. |
These and other risks could have a material adverse effect on our business.
Our global operations are subject to political and economic risks of developing countries, and special risks associated with doing business in corrupt environments.
We operate our business and market our products internationally in more than 50 countries, and we are focusing on increasing our sales and in some cases establishing new production facilities in regions, including Asia, Latin America and India, which are less developed, have less stability in legal systems and financial markets, and are generally recognized as potentially more corrupt business environments than the United States, and therefore present greater political, economic and operational risks. We have in place policies, procedures and certain ongoing training of employees with regard to business ethics and many key legal requirements, such as applicable anti-corruption laws, including the U.S. Foreign Corrupt Practices Act (FCPA), which make it illegal for us to give anything of value to foreign officials in order to obtain or retain any business or other advantages; however, there can be no assurance that our employees will adhere to our code of business ethics or any other of our policies, applicable anti-corruption laws, including the FCPA, or other legal requirements. If we fail to enforce our policies and procedures properly or maintain adequate record-keeping and internal accounting practices to accurately record our transactions, we may be subject to regulatory sanctions. If we believe or have reason to believe that our employees have or may have violated applicable anti-corruption laws, including the FCPA, or other laws or regulations, we are required to investigate or have outside counsel investigate the relevant facts and circumstances, and if violations are found or suspected could face civil and criminal penalties, and
16
Table of Contents
significant costs for investigations, litigation, fees, settlements and judgments, which in turn could have a material adverse effect on our business. In addition, some of our competitors may not be subject to the FCPA or other anti-corruption laws.
Sales of our products are subject to changing consumer preferences, and our success depends upon our ability to predict, identify and interpret changes in consumer preferences and develop and offer new products rapidly enough to meet those changes.
Our success depends on our ability to predict, identify and interpret the tastes, dietary habits and nutritional needs of consumers and to offer products that appeal to those preferences. If we do not succeed in offering products that consumers want to buy, our sales and market share will decrease, resulting in reduced profitability. If we are unable to predict accurately which shifts in consumer preferences will be long lasting, or to introduce new and improved products to satisfy those preferences, our sales will decline. In addition, given the variety of cultures and backgrounds of consumers in our global consumer base, we must offer a sufficient array of products to satisfy the broad spectrum of consumer preferences. As such, we must be successful in developing innovative products across our product categories.
The consolidation of our retail customers and their reduction of inventory levels may put pressures on our profitability.
Our retail customers, such as mass merchandisers, club stores, grocery stores, drug stores and convenience stores, have consolidated in recent years and consolidation is expected to continue throughout the United States, Europe and other major markets. This consolidation has produced large, sophisticated customers with increased buying power, which are more capable of operating with reduced inventories, resisting price increases and demanding lower pricing, increased promotional programs and specifically tailored products. In addition to reducing their inventory levels, these customers may use shelf space currently used for our products for their private label or store brand products. Meeting demands from these customers may adversely affect our margins and, if we fail to effectively respond to these demands, our sales could decline, each of which could materially adversely affect our profitability.
We rely on third parties to provide us with materials and services in connection with the manufacturing and distribution of our products.
Unaffiliated third-party suppliers provide us with materials necessary for commercial production of our products, including certain key raw materials and primary packaging materials (such as cans). In particular, Martek Biosciences Corporation (Martek) provides us with most of the supply of DHA and ARA that we use in our products. We may be unable to manufacture our products in a timely manner, or at all, if any of our third-party suppliers, including Martek, should cease or interrupt production or otherwise fail to supply us or if the supply agreements are suspended, terminated or otherwise expire without renewal. If these suppliers are not able to supply us with the quantities of materials we need or if these suppliers are not able to provide services in the required time period, this could have a material adverse effect on our business. We also utilize third parties in several countries throughout the world to distribute our products. If any of our third-party distributors fail to distribute our products in a timely manner, or at all, or if our distribution agreements are suspended, terminated or otherwise expire without renewal, our profitability could be materially adversely affected.
The manufacture of many of our products is a highly exacting and complex process, and if we or one of our suppliers should encounter problems manufacturing products, our business could suffer.
The manufacture of many of our products is a highly exacting and complex process, in part due to strict regulatory requirements. Problems may arise during the manufacturing process for a variety of reasons, including equipment malfunction, failure to follow specific protocols and procedures, problems with raw materials,
17
Table of Contents
maintenance of our manufacturing environment, natural disasters, various contagious diseases and process safety issues. If problems arise during the production of a batch of product, that batch of product may have to be discarded. This could, among other things, lead to increased costs, lost sales, damage to customer relations, time and expenses being spent investigating the cause and, depending on the cause, similar losses with respect to other batches or products. If problems are not discovered before the affected product is released to the market, recall and product liability costs as well as reputational damage may also be incurred. To the extent that we or one of our suppliers experience significant manufacturing problems, this could have a material adverse effect on our business.
We may experience difficulties and delays inherent in the manufacturing and selling of our products.
We may experience difficulties and delays inherent in the manufacturing and selling of our products, such as: (1) seizure or recalls of products and raw materials or forced closings of manufacturing plants; (2) the failure to obtain, the imposition of limitations on the use of, or loss of, patent, trademark or other intellectual property rights; (3) our failure, or the failure of any of our vendors or suppliers, to comply with current good manufacturing practices and other applicable regulations and quality assurance guidelines that could lead to temporary manufacturing shutdowns, product shortages and delays in product manufacturing; (4) construction delays related to the construction of new facilities or the expansion of existing facilities, including those intended to support future demand for our products; (5) other manufacturing or distribution problems, including changes in manufacturing production sites and limits to manufacturing capability due to regulatory requirements, changes in types of products produced or physical limitations that could impact continuous supply; (6) availability of raw materials; and (7) restrictions associated with the transportation of raw materials or goods in and out of foreign countries.
If we fail to increase our production and manufacturing capacity, we will be unable to continue to grow and our ability to produce new products, expand within our existing markets and enter into new markets will be limited.
Global growth and demand for our products has increased the utilization of our production and manufacturing facilities, including manufacturing capacity provided by third-party manufacturers and packaging capacity with respect to our products. If we are unable to successfully expand our production and manufacturing capacity, we will be unable to continue our growth and expand within our existing markets or enter into additional geographic markets or new product categories. In addition, failure to successfully expand our production and manufacturing capacity will limit our ability to introduce and distribute new products, including our existing pipeline of innovations and product improvements, or otherwise take advantage of opportunities in new and existing markets. Further, increasing our production and manufacturing facilities requires significant investment and time to build. Delays in increasing capacity could also limit our ability to continue our growth and materially adversely affect our business.
Disruption of our global supply chain could materially adversely affect our business.
Our ability to manufacture, distribute and sell products is critical to our success. Damage or disruption to raw material supplies or our manufacturing or distribution capabilities due to weather, natural disaster, fire, terrorism, strikes, various contagious diseases or other reasons could impair our ability to manufacture or sell our products. Failure to take adequate steps to mitigate the likelihood or potential impact of such events, or to effectively manage such events if they occur, particularly when a product is sourced from a single location, could materially adversely affect our business.
Changes in WIC, or our participation in it, could materially adversely affect our business.
Participation in WIC is an important part of our U.S. business based on the volume of infant formula sold under the program. As of December 31, 2010, we hold the contracts that supply approximately 41% of WIC births. As a result, our business strategy includes bidding for new WIC contracts and maintaining current WIC
18
Table of Contents
relationships. Our failure to win bids for new contracts pursuant to the WIC program or our inability to maintain current WIC relationships could have a material adverse effect on our business. In addition, any changes to how the WIC program is administered and any changes to the eligibility requirements and/or overall participation in the WIC program could also have a material adverse effect on our business.
Our business could be harmed by a failure of our information technology, administrative or outsourcing systems.
We rely on our information technology, administrative and outsourcing systems to effectively manage our business data, communications, supply chain, order entry and fulfillment and other business processes. We are in the process of transitioning, retiring or replacing substantially all of our information technology, administrative and outsourced systems via transition services agreements over the next year as we fully separate from Bristol-Myers Squibb Company (BMS) information technology systems and shared service functions. Difficulties or failure to implement our information technology initiatives by us or our service providers or the failure of our information technology, administrative or outsourcing systems to perform as we anticipate could disrupt our business and result in transaction errors, processing inefficiencies and the loss of sales and customers, causing our business to suffer. In addition, our information technology, administrative and outsourcing systems may be vulnerable to damage or interruption from circumstances beyond our control, including fire, natural disasters, systems failures, security breaches and viruses. Any such damage or interruption could have a material adverse effect on our business and prevent us from paying our suppliers or employees, invoicing and receiving payments from our customers or performing other information technology, administrative or outsourcing services on a timely basis.
We may face difficulties as we expand our operations into countries in which we have no prior operating experience or as we expand our operations into new product categories.
We intend to continue to expand our global footprint in order to enter into new markets. This may involve expanding into countries other than those in which we currently operate. It may involve expanding into less developed countries, which may have less political, social or economic stability and less developed infrastructure and legal systems. We also intend to expand our product portfolio by adding new product categories. As we expand our business into new countries or product categories we may encounter regulatory, personnel, technological and other difficulties that increase our expenses or delay our ability to start up our operations or become profitable in such countries or product categories. This may affect our relationships with customers, suppliers and regulators and could have a material adverse effect on our business.
Resources devoted to research and development may not yield new products that achieve commercial success.
Our ability to develop new pediatric nutrition products depends on, among other factors, our ability to understand the composition and variation of breast milk. Analyzing breast milk requires significant investment in research and development and testing of new ingredients and new production processes. We devote significant resources to investment in research and development in order gain a deep understanding of the composite ingredients of breast milk, as well as the optimal nutritional requirements of infants and children. The research and development process is expensive, prolonged and entails considerable uncertainty. Development of a new product, from discovery through testing and registration to initial product launch, typically takes between five and seven years. Each of these periods varies considerably from product to product and country to country. Because of the complexities and uncertainties associated with research and development, products that we are currently developing may not complete the development process or obtain the regulatory approvals required for us to market such products successfully. In addition, new regulations or changes to existing regulations may have a negative effect on innovations in our pipeline, especially late-stage pipeline products. The development of new products may take longer and cost more to develop and may be less successful than we currently anticipate as a result of:
| • | products that may appear promising in development but fail to reach market within the expected or optimal time frame, or fail to ever reach market, for any number of reasons, including efficacy and the difficulty or excessive cost to manufacture; |
19
Table of Contents
| • | failure to enter into or successfully implement optimal alliances where appropriate for the discovery and commercialization of products, or otherwise to maintain a consistent scope and variety of promising late-stage pipeline products; or |
| • | failure of one or more of our products to achieve or maintain commercial viability. |
We cannot assure you that any of our products currently in our development pipeline will be commercially successful.
We could incur substantial costs to comply with environmental, health and safety laws and regulations and to address violations of or liabilities under these requirements.
Our facilities and operations are subject to various environmental, health and safety laws and regulations in each of the jurisdictions in which we operate. Among other things, these requirements regulate the emission or discharge of materials into the environment, the use, management, treatment, storage and disposal of solid and hazardous substances and wastes, the control of combustible dust, the reduction of noise emissions and fire and explosion risks, the cleanup of contamination and the prevention of workplace exposures and injuries. Pollution controls and various permits and programs are required for many of our operations. We could incur or be subject to, among other things, substantial costs (including civil or criminal fines or penalties or clean-up costs), third party damage claims, requirements to install additional pollution control or safety control equipment and/or permit revocations in the event of violations by us of environmental, health, and safety requirements applicable to our facilities and operations or our failure to obtain, develop or comply with required environmental permits or programs.
In addition, most of our facilities have a history of industrial operations, and contaminants have been detected at some of our facilities. We also have been named as a potentially responsible party with respect to two Superfund or state sites. We can be held responsible, in some cases without regard to knowledge, fault, or ownership at the time of the release, for the costs of investigating or remediating contamination of any real property we or our predecessors ever owned, operated, or used as a waste disposal site. In addition, we can be required to compensate public authorities or private owners for damages to natural resources or other real property, or to restore those properties, in the event of off-site migration of contamination. Changes in, or new interpretations of, existing laws, regulations or enforcement policies, could also cause us to incur additional or unexpected costs to achieve or maintain compliance. The assertion of claims relating to on- or off-site contamination, the discovery of previously unknown environmental liabilities or the imposition of unanticipated investigation or cleanup obligations, could result in potentially significant expenditures to address contamination or resolve claims or liabilities. Such costs and expenditures could have a material adverse effect on our business, financial condition or results of operations.
We may not be able to adequately protect our intellectual property rights.
Given the importance of brand recognition to our business, we have invested considerable effort in seeking trademark protection for our core brands, including the Enfa family of brands. However, we cannot be certain that the steps we have taken will be sufficient to protect our intellectual property rights in our brands adequately or that third parties will not infringe upon or misappropriate any such rights. Our trademark registrations and applications can potentially be challenged and cancelled or narrowed. Moreover, some of the countries in which we operate offer less protection for these rights, and may subject these rights to higher risks, than is the case in Europe or North America. In addition, it is costly to litigate in order to protect any of our intellectual property rights. If we are unable to prevent third parties from infringing or misappropriating these rights in our core products or brands, including our Enfa family of brands, our future financial condition and our ability to develop our business could be materially adversely affected.
Other companies have from time to time taken, and may in the future take, actions that we believe violate our intellectual property rights and we may decide to enforce (and in some cases are currently enforcing) those rights
20
Table of Contents
against such actions. Uncertainties inherent in such litigation make the outcome and associated costs difficult to predict. If unsuccessful, the legal actions could result in the invalidation of some of our intellectual property rights, which could materially adversely affect our business.
We rely on a combination of security measures, confidentiality policies, contractual arrangements and trade secret laws to protect our proprietary formulae and other valuable trade secrets. We also rely on patent, copyright and trademark laws to further protect our intellectual property rights. We cannot, however, be certain that the steps we take will prevent the development and marketing of similar, competing products and services by third parties. Our existing patents and any future patents that we obtain may not be sufficiently broad to protect us against third parties with similar products or to provide us with a competitive advantage. Moreover, our patents can potentially be challenged and narrowed or invalidated. Trade secrets are difficult to protect, and despite our efforts may become known to competitors or independently discovered. The confidentiality agreements we rely on with our employees, customers, contractors and others may be breached, and we may not have adequate remedies for such breach. Failure to adequately protect our valuable intellectual property from being infringed or misappropriated could materially adversely affect our business.
We may be required to defend ourselves against intellectual property claims from third parties, which could harm our business.
Regardless of merit, there are third-party patents that may cover our products. Third parties may obtain patents in the future and claim that use of our technologies infringes upon these patents. If a third party asserts that our products or services are infringing upon its intellectual property, these claims could cause us to incur significant expenses and, if successfully asserted against us, could require that we pay substantial damages and/or prevent us from selling our products. Even if we were to prevail against such claims, any litigation regarding intellectual property could be costly and time-consuming and could divert the attention of our management and key personnel from our business operations. Furthermore, as a result of an intellectual property challenge, we may find it necessary to enter into royalty licenses or other costly agreements, and we may not be able to obtain such agreements at all or on terms acceptable to us.
Our sales and marketing practices may be challenged by consumers and competitors, which could harm our business.
We participate in a variety of marketing activities, including print and television advertising, direct mail, online/internet and promotional programs. We work with external agencies to create strong marketing campaigns for health care professionals, retail sales organizations and consumers. Although our marketing is evidence-based and emphasizes our superior nutritional science, consumers and competitors may challenge, and have challenged, certain of our practices by claiming, among other things, false and misleading advertising with respect to advertising for certain of our products. Such challenges could result in our having to pay monetary damages or limit our ability to maintain current sales and marketing practices.
Although we cannot predict with certainty the ultimate resolution of such lawsuits, investigations and claims asserted against us, we do not believe any currently pending legal proceeding to which we are a party would have a material adverse effect on our business or financial condition, although an unfavorable outcome in excess of amounts recognized as of December 31, 2010, with respect to one or more of these proceedings could have a material adverse effect on our results of operations for the periods in which a loss would be recognized.
Increases in costs of current and post-retirement benefits may reduce our profitability.
With approximately 6,500 employees, our profitability is substantially affected by costs of current and post retirement medical and other employee benefits. These costs can vary substantially as a result of changes in health care costs, volatility in investment returns on pension plan assets and changes in discount rates used to calculate related liabilities. These factors may put upward pressure on the cost of providing medical and other
21
Table of Contents
benefits. We can provide no assurance that we will succeed in limiting future cost increases, and upward pressure would reduce our profitability.
Labor disputes may cause work stoppages, strikes and disruptions.
The manufacturing workforce at Delicias, Mexico is unionized and covered by a collective bargaining agreement with an annual negotiation process with the union. We completed a comprehensive renegotiation with the union in Delicias in March 2010. The manufacturing workforce and the non-supervised sales force at Makati, Philippines, are unionized and covered by a three-year collective bargaining agreement, which was renewed in December 2010. In addition, several of our workforces in Europe have Works Council representation. As a result, any labor disputes, including work stoppages, strikes and disruptions, could have a material adverse impact on our business.
Our success depends on attracting and retaining qualified people in a competitive environment.
Our business strategy and future success depends, in part, on our ability to attract, hire and retain, in a competitive environment, highly-skilled and diverse leaders, managers and professionals who are critical to our business functions and growth strategy. The market for highly-skilled employees is competitive in the labor markets in which we operate. Our business could be materially adversely affected if we are unable to retain key employees or recruit qualified personnel in a timely fashion, or if we are required to incur unexpected increases in compensation costs to retain key employees or meet our hiring goals. If we are not able to attract and retain the personnel that we require, or we are not able to do so on a cost-effective basis, it could be more difficult for us to sell and develop our products and services and execute our business strategy.
We derive a significant percentage of our sales from two customers. The loss of either of these customers could materially adversely affect our financial performance.
Our products are sold principally to the wholesale and retail trade, both nationally and internationally, and sales to two customers, Wal-Mart and DKSH, accounted for approximately 12% and 12%, respectively, of our gross sales for the year ended December 31, 2010. If either of these customers ceases doing business with us or if we encounter any difficulties in our relationship with either of them, our business could be materially adversely affected.
An adverse change in favorable demographic and economic trends as well as a change in scientific opinion regarding our products in any of our largest markets could materially adversely affect our business and reduce our profitability.
Our growth plan relies on favorable demographic and economic trends in various markets, including: (1) rising incomes in emerging markets, (2) increasing number of working mothers and (3) increasing consumer spending on health care and wellness worldwide. If these demographic trends change in an adverse way, our business could be materially adversely affected. In addition, an adverse change in scientific opinion regarding our products, such as the health benefits of DHA and ARA, or a continued decline in birth rates could materially adversely affect our business.
We have substantial debt, which could materially adversely affect our business and our ability to meet our obligations.
We had total indebtedness of $1,533.7 million as of December 31, 2010. See “Item 8. Financial Statements—Note 15. Short-Term Borrowings and Long-Term Debt” and “Item. 7. Management’s Discussion and Analysis of Financial Condition and Results of Operations—Financial Position, Liquidity and Capital Resources—Short-Term Borrowings and Long-Term Debt.”
22
Table of Contents
This amount of debt could have important consequences to us and our investors, including:
| • | requiring a substantial portion of our cash flow from operations to make payments on this debt; |
| • | requiring us to repay the full amount of our debt upon a change of control triggering event; |
| • | making it more difficult to satisfy other obligations; |
| • | increasing the risk of future credit rating downgrades of our debt, which could increase future debt costs; |
| • | increasing our vulnerability to general adverse economic and industry conditions; |
| • | reducing the cash flow available to fund capital expenditures and other corporate purposes and to grow our business; |
| • | limiting our flexibility in planning for, or reacting to, changes in our business and industry; |
| • | placing us at a competitive disadvantage to our competitors that may not be as leveraged as we are; |
| • | limiting our ability to borrow additional funds as needed or take advantage of business opportunities as they arise; and |
| • | limiting our ability to pay cash dividends or repurchase common stock. |
To the extent we become more leveraged, the risks described above could increase. In addition, our actual cash requirements in the future may be greater than expected. Our cash flow from operations may not be sufficient to repay at maturity all of the outstanding debt as it becomes due, and we may not be able to borrow money, sell assets or otherwise raise funds on acceptable terms, or at all, to refinance our debt.
In order to achieve a desired proportion of variable versus fixed rate debt, we have entered into interest rate swap agreements. Developing an effective strategy for dealing with risks from movements in interest rates is complex, and no strategy can completely insulate us from risks associated with such fluctuations. In addition, we are exposed to counterparty credit risk for nonperformance and, in the event of nonperformance, to market risk for changes in interest rates. Finally, our interest rate risk management activities could expose us to substantial losses if interest rates move materially differently from our expectations. As a result, our economic hedging activities may not effectively manage our interest rate sensitivity or have the desired beneficial impact on our financial condition or results of operations. Further discussion of our hedging of interest rate risk is included in “Item 7A. Quantitative and Qualitative Disclosures About Market Risk.”
We could evaluate acquisitions, joint ventures and other strategic initiatives, any of which could distract our management or otherwise have a negative effect on our sales, costs and stock price.
Our future success may depend on opportunities to buy or obtain rights to other businesses or technologies that could complement, enhance or expand our current business or products or that might otherwise offer us growth opportunities. We could evaluate potential mergers, acquisitions, joint venture investments, strategic initiatives, alliances, vertical integration opportunities and divestitures. If we attempt to engage in these transactions, we expose ourselves to various inherent risks, including:
| • | accurately assessing the value, future growth potential, strengths, weaknesses, contingent and other liabilities and potential profitability of acquisition candidates; |
| • | the potential loss of key personnel of an acquired or combined business; |
| • | our ability to achieve projected economic and operating synergies; |
| • | difficulties successfully integrating, operating, maintaining and managing newly-acquired operations or employees; |
| • | difficulties maintaining uniform standards, controls, procedures and policies; |
23
Table of Contents
| • | unanticipated changes in business and economic conditions affecting an acquired business; |
| • | the potential discovery of latent unethical business practices; |
| • | the possibility we could incur impairment charges if an acquired business performs below expectations; and |
| • | the diversion of our management’s attention from our existing business to integrate the operations and personnel of the acquired or combined business or implement the strategic initiative. |
If any of the foregoing risks materializes, our results of operations and the results of the proposed transactions would likely differ from ours, and market expectations, and our stock price could, accordingly, decline. In addition, we may not be able to complete desirable transactions for various reasons.
We depend on cash flows generated by our subsidiaries, and a failure to receive distributions from our subsidiaries may result in our inability to meet our financial obligations, or to pay dividends.
We are a holding company with no material assets other than the equity interests of our subsidiaries and certain intellectual property. Our subsidiaries conduct substantially all of our operations and own substantially all of our assets and intellectual property. Consequently, our cash flow and our ability to meet our obligations and pay dividends to our stockholders depends upon the cash flow of our subsidiaries and the payment of funds by our subsidiaries to us in the form of dividends, tax sharing payments or otherwise. There are a number of other factors that could affect our ability to pay dividends, including the following:
| • | lack of availability of cash to pay dividends due to changes in our operating cash flow, capital expenditure requirements, working capital requirements and other cash needs; |
| • | unexpected or increased operating or other expenses or changes in the timing thereof; |
| • | restrictions under Delaware law or other applicable law on the amount of dividends that we may pay; |
| • | a decision by our board of directors to modify or revoke its policy to pay dividends; and |
| • | the other risks described in this “Risk Factors” section. |
Each of our subsidiaries is a distinct legal entity and its ability to make any payments will depend on its earnings, the terms of its indebtedness and legal restrictions. Under certain circumstances, legal restrictions may limit or delay our ability to obtain cash from our subsidiaries and our subsidiaries may not be able to, or be permitted to, make distributions to us in the future. In the event that we do not receive distributions from our subsidiaries, we may be unable to meet our financial obligations.
Risks Related to Our Relationship with Our Former Parent
Restrictions in connection with the tax treatment of our split-off from BMS could adversely affect us.
In connection with our split-off from BMS on December 23, 2009, BMS and its counsel have relied on certain assumptions and representations as to factual matters from us, as well as certain covenants by us regarding the future conduct of our business and other matters, the incorrectness or violation of which could affect the qualification for non-recognition of gain and loss of our split-off from BMS. In addition, current tax law generally creates a presumption that the split-off would be taxable to BMS, but not to its stockholders, if we or our stockholders were to engage in transactions that result in a 50% or greater change in our stock ownership during the four-year period beginning two years before the split-off, unless it is established that the split-off was not part of a plan or series of related transactions to effect such a change in ownership.
As a consequence of the foregoing, BMS and we agreed to certain tax-related restrictions set forth in the Amended and Restated Tax Matters Agreement referred to herein, under which we agreed generally:
| • | for two years following the completion of the split-off, not to engage in any of the following actions unless we provide BMS with an opinion of counsel acceptable to BMS or BMS receives a private letter ruling, in each case to the effect that such actions will not cause our split-off from BMS to fail to qualify for non-recognition of gain and loss; |
24
Table of Contents
| • | cause or allow us to cease to be engaged in our current business as an active business; |
| • | take any action that could cause the conversion of Mead Johnson & Company (from a Delaware corporation to a Delaware limited liability company) to fail to qualify as a complete liquidation under Section 332 of the Internal Revenue Code by reason of the “liquidation-reincorporation” doctrine; |
| • | liquidate or partially liquidate, by way of a merger, conversion or otherwise; |
| • | sell or transfer 50% or more of our assets; |
| • | engage in certain stock redemptions or repurchases; |
| • | enter into or permit certain transactions or series of related transactions (or agreements or understandings to enter into such transactions) as a result of which one or more persons would directly or indirectly acquire 40% or more of our total value or total voting power; and |
| • | for 30 months following the qualification for non-recognition of gain and loss of our split-off from BMS, if we propose to enter into or permit certain transactions or series of related transactions as a result of which one or more persons would directly or indirectly acquire 10% or more of our total value or total voting power, to undertake in good faith to provide written notice to BMS, including an explanation as to why such transactions do not cause our split-off from BMS to fail to qualify for non-recognition of gain and loss. |
If our split-off from BMS fails to qualify for non-recognition of gain and loss, we may in certain circumstances be required to indemnify BMS for any resulting taxes and related expenses, and we believe that the payment if required could have a material adverse effect on our financial condition and results of operations.
BMS and we agreed to certain tax-related indemnities set forth in the Amended and Restated Tax Matters Agreement referred to herein. We agreed, generally, to indemnify BMS for taxes and certain related expenses resulting from the failure of our split-off from BMS to qualify for non-recognition of gain and loss to the extent attributable to (i) the failure of any of our representations to be true or the breach by us of any of our covenants, (ii) the application of Section 355(e) or Section 355(f) of the Internal Revenue Code to any acquisition of our stock or assets or any of our affiliates or (iii) certain other acts or omissions by us or our affiliates. To the extent we become obligated to make an indemnification payment under the Amended and Restated Tax Matters Agreement, we believe that the payment could have a material adverse effect on our financial condition and results of operations.
Risks Related to Our Common Stock
Future issuances of our common stock may depress the price of our common stock.
The market price of our common stock could decline significantly as a result of issuances of a large number of shares of our common stock in the market. The perception that these issuances might occur could depress the market price. The amount of shares of our common stock issued in connection with an investment or acquisition could constitute a material portion of our common stock, resulting in dilution to our stockholders. These issuances, or the possibility that these issuances may occur, also might make it more difficult for us to sell equity securities in the future at a time and at a price that we deem appropriate, for example, we may issue common stock in connection with investments or acquisitions.
Our failure to successfully execute our growth strategy could adversely affect our business and results of operations and cause our stock price to decline.
Our continued success in part depends on our ability to successfully execute our growth strategy. We intend to grow our business profitably through several strategic initiatives, including geographic and category expansion and productivity savings. There can be no assurance that we will be successful in achieving our strategic plan. If
25
Table of Contents
we fail to fully implement any material part of our strategic initiatives, or if we achieve these initiatives and they fail to yield the expected benefits, there could be an adverse affect on our business and results of operations. Any such adverse affect on our business and results of operations could result in a decline in the price of our common stock.
Anti-takeover provisions in our charter documents could discourage, delay or prevent a change of control of our company and may result in an entrenchment of management and diminish the value of our common stock.
Several provisions of our certificate of incorporation and by-laws could make it difficult for our stockholders to change the composition of our board of directors, preventing them from changing the composition of management. In addition, the same provisions may discourage, delay or prevent a merger or acquisition that our stockholders may consider favorable.
These provisions include:
| • | authorizing our board of directors to issue “blank check” preferred shares without stockholder approval; |
| • | prohibiting cumulative voting in the election of directors; |
| • | prohibiting shareholder action by written consent; |
| • | limiting the persons who may call special meetings of stockholders; and |
| • | establishing advance notice requirements for nominations for election to our board of directors or for proposing matters that can be acted on by stockholders at stockholder meetings. |
Additionally, we are subject to Section 203 of the Delaware General Corporation Law, which generally prohibits a Delaware corporation from engaging in any of a broad range of business combinations with any interested stockholder for a period of three years following the date on which the stockholder became an interested stockholder.
These anti-takeover provisions could substantially impede the ability of our common stockholders to benefit from a change of control and, as a result, could materially adversely affect the market price of our common stock and our stockholders’ ability to realize any potential change-in-control premium.
If securities or industry analysts adversely change their recommendations regarding our securities or if our operating results do not meet their expectations, our stock price could decline.
The trading market for common stock is influenced by the research and reports that industry or securities analysts publish about us or our business. If one or more of the analysts who cover us downgrades our stock or if our operating results do not meet their expectations, our stock price could decline.
| Item 1B. | UNRESOLVED STAFF COMMENTS |
None.
| Item 2. | PROPERTIES |
Our corporate headquarters are located in Glenview, Illinois, where we lease office space. We maintain our global supply chain and R&D headquarters in Evansville, Indiana, where we own office, operations and laboratory buildings comprising approximately 700,000 square feet. We also own the seven manufacturing facilities identified in the table below. For additional information related to our seven manufacturing facilities around the world, see “Item 1. Business—Global Supply Chain.” We lease the vast majority of our office facilities worldwide.
26
Table of Contents
The following table illustrates our owned global manufacturing locations, the approximate square footage of the facilities and the reportable segment served by such locations:
| Location |
Square Feet | Business Segment Served | ||||
| Zeeland, Michigan, United States(1) |
512,000 | All segments | ||||
| Evansville, Indiana, United States(1)(2) |
280,000 | All segments | ||||
| Nijmegen, The Netherlands(1) |
102,000 | All segments | ||||
| Delicias, Chihuahua, Mexico(1) |
173,000 | Asia/Latin America | ||||
| Chonburi, Thailand(1) |
125,000 | Asia/Latin America | ||||
| Guangzhou, China(1) |
100,000 | Asia/Latin America | ||||
| Makati, Philippines(1) |
96,000 | Asia/Latin America | ||||
| (1) | Powder manufacturing facility. |
| (2) | Liquid manufacturing facility. |
| Item 3. | LEGAL PROCEEDINGS |
In the ordinary course of business, we are subject to lawsuits, investigations, government inquiries and claims, including, but not limited to, product liability claims, advertising disputes and inquiries, consumer fraud suits, other commercial disputes, premises claims and employment and environmental, health and safety matters.
Our facilities and operations are subject to various environmental, health and safety laws and regulations in each of the jurisdictions in which we operate. Among other things, these requirements regulate the emission or discharge of materials into the environment, the use, management, treatment, storage and disposal of solid and hazardous substances and wastes, the control of combustible dust, the reduction of noise emissions and fire and explosion risks, the cleanup of contamination and the prevention of workplace exposures and injuries. Pollution controls and various permits and programs are required for many of our operations. Each of our global manufacturing facilities undergoes periodic internal audits relating to environmental, health, and safety requirements and we incur operating and capital costs to improve our facilities or maintain compliance with applicable requirements on an ongoing basis.
From time to time, we may be responsible under various state, federal and foreign laws, including CERCLA, for certain costs of investigating and/or remediating contamination at our current or former sites, and/or at waste disposal or reprocessing facilities operated by third parties. Liability under CERCLA and analogous state or foreign laws may be imposed without regard to knowledge, fault, or ownership at the time of the disposal or release. Most of our facilities have a history of industrial operations, and contaminants have been detected at some of our facilities. We also have been named as a “potentially responsible party”, or are involved in investigation and remediation, at two third-party disposal sites. As of December 31, 2010, management believes that those future site costs which were probable and reasonably estimable, as well as any related accruals, are not material.
We are not aware of any pending environmental, health or safety-related litigation or significant environmental, health or safety-related financial obligations or liabilities arising from current or former operations or properties that are likely to have a material adverse impact on our business, financial position or results of operations. Liabilities or obligations, which could require us to make significant expenditures, could arise in the future, however, as the result of, among other things, changes in, or new interpretations of, existing laws, regulations or enforcement policies, claims relating to on- or off-site contamination, or the imposition of unanticipated investigation or cleanup obligations.
27
Table of Contents
Significant litigation matters of which we are a party are as follows:
As previously reported, PBM Products, LLC (PBM), a manufacturer and distributor of store brand infant formulas and nutritionals, obtained a judgment in the amount of $13.5 million in a suit against the Company’s subsidiary, Mead Johnson & Company, LLC, in the U.S. District Court (Eastern District of Virginia), alleging, among other things, false and misleading advertising with respect to certain Enfamil LIPIL infant formula advertising. After post-trial briefing, the court confirmed the award and also ordered limited injunctive relief. The Company has filed an appeal with the U.S. Court of Appeals for the Fourth Circuit with respect to various aspects of the district court proceedings, including both the jury award and injunction. That appeal remains pending. In addition, six putative consumer class action suits have been filed and served against the Company’s subsidiary, Mead Johnson & Company, LLC, two of which also name the Company as a defendant. (The Company has been dismissed as a party from the other suits, and the Company either has sought or will seek to be dismissed from the remaining two.) The Company also is aware of two additional putative class actions that have been filed in the U.S. District Court (Northern District of California) that have not yet been served. All of these cases cite the PBM matter as support for allegations that certain false and misleading advertising of Enfamil LIPIL infant formula has resulted in financial injury to consumers. A class of Florida consumers was certified in one of the actions (Nelson v. Mead Johnson & Company, LLC), pending in the U.S. District Court (Southern District of Florida), but the U.S. Court of Appeals for the Eleventh Circuit has granted defendant’s petition for interlocutory appeal of that certification decision. The Company denies all allegations in the cases, which have been consolidated for adjudication in the U.S. District Court (Southern District of Florida) by the Joint Panel on Multidistrict Litigation. The Company also has entered into a memorandum of understanding with plaintiffs’ counsel in several of the cases, with the goal of presenting a stipulation of settlement and a joint motion for preliminary approval of settlement to the U.S. District Court (Southern District of Florida). Although the terms of the settlement are not finalized and remain confidential, it is expected that they will resolve all claims on a nationwide basis and not have a material adverse effect on our results of operations or financial condition.
We record accruals for such contingencies when it is probable that a liability will be incurred and the loss can be reasonably estimated. Although we cannot predict with certainty the ultimate resolution of these or other lawsuits, investigations and claims asserted against it, we do not believe any currently pending legal proceeding to which we are a party will have a material adverse effect on our business or financial condition, although an unfavorable outcome in excess of amounts recognized as of December 31, 2010, with respect to one or more of these proceedings could have a material adverse effect on our results of operations for the periods in which a loss is recognized.
28
Table of Contents
PART II
| Item 5. | MARKET FOR REGISTRANT’S COMMON STOCK, RELATED STOCKHOLDER MATTERS, AND ISSUER PURCHASES OF EQUITY SECURITIES |
Market Prices and Dividend Information
Mead Johnson Nutrition Company common stock is traded on the New York Stock Exchange (NYSE) under the symbol “MJN”. The following table describes the per share range of high and low sales prices, as reported by the NYSE, for shares of our common stock and dividends declared per share of our common stock for the quarterly periods indicated.
| Market Price
for MJN Common Stock |
Dividends Declared Per Share |
|||||||||||
| High | Low | |||||||||||
| 2009 |
||||||||||||
| First Quarter |
$ | 29.85 | $ | 26.00 | — | |||||||
| Second Quarter |
$ | 33.76 | $ | 25.72 | $ | 0.30 | * | |||||
| Third Quarter |
$ | 50.35 | $ | 31.51 | $ | 0.20 | ||||||
| Fourth Quarter |
$ | 47.75 | $ | 39.75 | $ | 0.20 | ||||||
| 2010 |
||||||||||||
| First Quarter |
$ | 52.87 | $ | 43.50 | $ | 0.225 | ||||||
| Second Quarter |
$ | 55.23 | $ | 46.19 | $ | 0.225 | ||||||
| Third Quarter |
$ | 58.01 | $ | 49.55 | $ | 0.225 | ||||||
| Fourth Quarter |
$ | 63.38 | $ | 55.58 | $ | 0.225 | ||||||
| * | On June 23, 2009, our board of directors declared a dividend of $0.20 per share for the quarter ended June 30, 2009, and a $0.10 per share dividend prorated for the period from the closing of our initial public offering through March 31, 2009. |
Holders of Common Stock
The number of record holders of common stock at December 31, 2010, was 1,655. The number of record holders is based upon the actual number of holders registered on our books at such date and does not include holders of shares held in “street name” or persons, partnerships, associations, corporations or other entities identified in security position listings maintained by depository trust companies.
Issuer Purchases of Equity Securities
None.
29
Table of Contents
Performance Graph
Comparison of 22-month Cumulative Total Return
The following graph compares the cumulative total return on our common stock for the periods indicated with the performance of the Standard & Poor’s 500 Stock Index (S&P 500) and the Mead Johnson performance peer group index. The graph assumes $100 invested on February 11, 2009, the date shares of our common stock commenced trading, or January 31, 2009, in index, and the reinvestment of all dividends for each of the reported time periods.
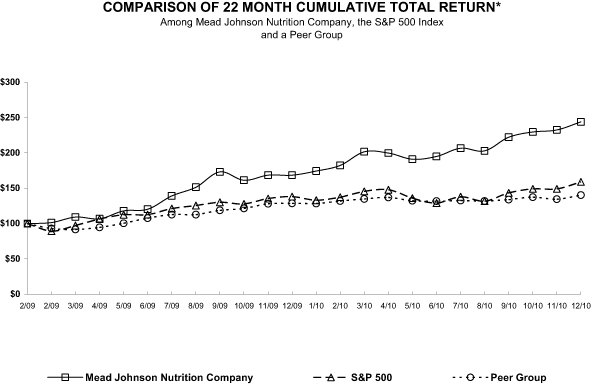
| * | $100 invested on 2/11/09, in stock or 1/31/09, in index, including reinvestment of dividends. Fiscal year ending December 31. |
| Copyright© 2011 S&P, a division of The McGraw-Hill Companies Inc. All rights reserved. |
The Mead Johnson performance peer group consists of the following corporations considered our market competitors in the food and beverage and consumer products industries on the basis of industry leadership and global focus: Campbell’s Soup Company, Colgate Palmolive Company, General Mills, Inc., H.J. Heinz Company, The Hershey Company, The J.M. Smucker Company, Kellogg Company, McCormick & Company, Incorporated and Sara Lee Corp.
30
Table of Contents
| Item 6. | SELECTED FINANCIAL DATA. |
| For the Years Ended December 31, | ||||||||||||||||||||
| (In millions, except per share data) | 2010 | 2009 | 2008 | 2007 | 2006 | |||||||||||||||
| Net Sales |
$ | 3,141.6 | $ | 2,826.5 | $ | 2,882.4 | $ | 2,576.4 | $ | 2,345.1 | ||||||||||
| Earnings before Interest and Income Taxes |
$ | 682.9 | $ | 679.6 | $ | 695.7 | $ | 663.2 | $ | 634.8 | ||||||||||
| Interest Expense—net |
$ | 48.6 | $ | 92.6 | $ | 43.3 | $ | — | $ | — | ||||||||||
| Net Earnings Attributable to Shareholders |
$ | 452.7 | $ | 399.6 | $ | 393.9 | $ | 422.5 | $ | 398.2 | ||||||||||
| Basic Earnings Per Share Attributable to Shareholders* |
$ | 2.20 | $ | 1.99 | $ | 2.32 | $ | 2.49 | $ | 2.34 | ||||||||||
| Diluted Earnings Per Share Attributable to Shareholders* |
$ | 2.20 | $ | 1.99 | $ | 2.32 | $ | 2.49 | $ | 2.34 | ||||||||||
| Cash Dividends Declared Per Share* |
$ | 0.90 | $ | 0.70 | ||||||||||||||||
| Weighted Average Shares* |
204.7 | 200.6 | 170.0 | 170.0 | 170.0 | |||||||||||||||
| Depreciation and Amortization |
$ | 64.7 | $ | 58.9 | $ | 52.1 | $ | 51.0 | $ | 49.5 | ||||||||||
| Cash Paid for Capital Expenditures |
$ | 172.4 | $ | 95.8 | $ | 81.1 | $ | 78.4 | $ | 68.9 | ||||||||||
| As of December 31, | ||||||||||||||||||||
| (In millions) | 2010 | 2009 | 2008 | 2007 | 2006 | |||||||||||||||
| Total Assets |
$ | 2,293.1 | $ | 2,070.3 | $ | 1,361.4 | $ | 1,301.9 | $ | 1,204.3 | ||||||||||
| Debt |
$ | 1,533.7 | $ | 1,604.9 | $ | 2,000.0 | $ | — | $ | — | ||||||||||
| Total Equity (Deficit) |
$ | (358.3 | ) | $ | (664.3 | ) | $ | (1,395.5 | ) | $ | 637.8 | $ | 592.4 | |||||||
| * | On February 17, 2009, we completed the offering of 34.5 million shares of common stock in an initial public offering. |
31
Table of Contents
| Item 7. | MANAGEMENT’S DISCUSSION AND ANALYSIS OF FINANCIAL CONDITION AND RESULTS OF OPERATIONS. |
This management’s discussion and analysis of financial condition and results of operations contains forward-looking statements that involve risks and uncertainties. See “Item 1A. Risk Factors” for a discussion of the uncertainties, risks and assumptions associated with those statements. The following discussion should be read in conjunction with our audited financial statements and the notes to our audited financial statements. Our results may differ materially from those discussed in the forward-looking statements as a result of various factors, including but not limited to those in “Risk Factors.”
Overview of Our Business
We are a global leader in pediatric nutrition. We are committed to creating trusted nutritional brands and products that help improve the health and development of infants and children around the world and provide them with the best start in life. Our comprehensive product portfolio addresses a broad range of nutritional needs for infants, children and expectant and nursing mothers. We have over 100 years of innovation experience during which we have developed or improved many breakthrough or industry-defining products across each of our product categories. We operate in four geographic regions: Asia, Latin America, North America and Europe. Due to similarities in the economics, products offered, production process, customer base and regulatory environment, these operating regions have been aggregated into two reportable segments: Asia/Latin America and North America/Europe.
Executive Summary
We delivered strong sales and earnings growth in 2010 while increasing investments in demand-generation activities and building our stand-alone infrastructure. Our Asia/Latin America segment continued double-digit sales growth with solid market share gains across the segment. Despite continued declines in both births and formula consumption, sales in the North America/Europe segment grew due to U.S. market share gains, lower WIC rebates, and a 2009 reduction in customer inventory in the European business. Although gross margin was pressured from increased commodity and manufacturing costs, we were able to partially mitigate the effect through productivity gains and higher pricing. During 2010, we continued to invest in our sales force and other demand-generation activities. In order to enhance our product innovation capabilities, we opened new Pediatric Nutrition Institutes (PNI) in Evansville, Indiana, and Mexico City, Mexico, and broke ground on a new PNI in Guangzhou, China. We completed the build of our new corporate functions, made significant progress on our stand-alone IT platform, and incurred a temporary duplication of costs as we transition to a new shared service provider. These increases in expense were partly offset by benefits from lower interest expense as a result of our debt refinancing and a reduced effective tax rate.
Our strong sales growth, supported by our investment in demand-generation activities, contributed to earnings growth of 13%.
32
Table of Contents
Results of Operations
Year Ended December 31, 2010 Compared to Year Ended December 31, 2009
Below is a summary of comparative results of operations for the years ended December 31, 2010 and 2009:
| % of Net Sales | ||||||||||||||||||||
| (In millions, except per share data) | 2010 | 2009 | % Change | 2010 | 2009 | |||||||||||||||
| Net Sales |
$ | 3,141.6 | $ | 2,826.5 | 11 | % | — | — | ||||||||||||
| Earnings before Interest and Income Taxes (EBIT) |
682.9 | 679.6 | 0 | % | 22 | % | 24 | % | ||||||||||||
| Interest Expense—net |
48.6 | 92.6 | (48 | %) | 2 | % | 3 | % | ||||||||||||
| Earnings before Income Taxes |
634.3 | 587.0 | 8 | % | 20 | % | 21 | % | ||||||||||||
| Provision for Income Taxes |
176.1 | 176.4 | 0 | % | 6 | % | 6 | % | ||||||||||||
| Effective Tax Rate (ETR) |
27.8 | % | 30.1 | % | ||||||||||||||||
| Net Earnings |
458.2 | 410.6 | 12 | % | 15 | % | 15 | % | ||||||||||||
| Less: Net Earnings attributable to noncontrolling interests |
5.5 | 11.0 | (50 | %) | 0 | % | 0 | % | ||||||||||||
| Net Earnings Attributable to Shareholders |
452.7 | 399.6 | 13 | % | 14 | % | 14 | % | ||||||||||||
| Weighted Average Common Shares—Diluted |
205.1 | 200.7 | ||||||||||||||||||
| Earnings per Common Share—Diluted |
$ | 2.20 | $ | 1.99 | 11 | % | ||||||||||||||
The results for the years ended December 31, 2010 and 2009 included several items that affect the comparability of our results. These items include significant expenses not indicative of on-going results (Specified Items) and are listed in the table below.
| Year Ended December 31, |
||||||||
| (In millions) | 2010 | 2009 | ||||||
| IT and other separation costs |
$ | 57.1 | $ | 19.2 | ||||
| Severance and other costs |
5.1 | 25.3 | ||||||
| Legal, settlements and related costs |
9.2 | 17.5 | ||||||
| IPO-related costs |
— | 31.0 | ||||||
| Gain on asset sale |
— | (11.9 | ) | |||||
| Specified Items before income taxes |
$ | 71.4 | $ | 81.1 | ||||
| Income tax impact on items above |
(25.9 | ) | (24.4 | ) | ||||
| Specified Items after taxes |
$ | 45.5 | $ | 56.7 | ||||
Net Sales
Our net sales by reportable segments are shown in the table below:
| Year Ended December 31, |
% Change | % Change Due to | ||||||||||||||||||||||
| (Dollars in millions) | 2010 | 2009 | Volume | Price | Foreign Exchange |
|||||||||||||||||||
| Asia/Latin America |
$ | 1,927.1 | $ | 1,625.5 | 19 | % | 10 | % | 6 | % | 3 | % | ||||||||||||
| North America/Europe |
1,214.5 | 1,201.0 | 1 | % | 0 | % | 0 | % | 1 | % | ||||||||||||||
| Net Sales |
$ | 3,141.6 | $ | 2,826.5 | 11 | % | 5 | % | 4 | % | 2 | % | ||||||||||||
Our Asia/Latin America segment continues to have significant sales growth and represented 61% of sales for the year ended December 31, 2010, compared with 58% for the year ended December 31, 2009. Our success in Asia/Latin America comes from market growth and share gains driven by our investments in advertising and promotion, sales force, and product innovation. The most notable sales gains were achieved in China,
33
Table of Contents
Hong Kong, Mexico and Brazil. Our strongest performance continues to be in China, primarily reflecting market growth, increased market share and geographic expansion. The segment was adversely affected by sales declines in Venezuela primarily due to the devaluation of the bolivar.
For the year ended December 31, 2010, sales in the North America/Europe segment grew slightly compared with the prior year. The U.S. business improvements from market share gains, due to successful new product launches and a competitor’s temporary product recall, and lower WIC rebates were offset by the contraction in the U.S. market from lower births. The European business grew due to a 2009 reduction in customer inventory in the European business in preparation for the eventual move from Bristol-Myers Squibb Co. (BMS) as our primary distributor.
Our net sales by product category are shown in the table below:
| Year Ended December 31, |
% Change | |||||||||||
| (Dollars in millions) | 2010 | 2009 | ||||||||||
| Infant Formula |
$ | 1,945.4 | $ | 1,805.6 | 8 | % | ||||||
| Children’s Nutrition |
1,119.2 | 919.0 | 22 | % | ||||||||
| Other |
77.0 | 101.9 | (24 | %) | ||||||||
| Net Sales |
$ | 3,141.6 | $ | 2,826.5 | 11 | % | ||||||
Infant formula sales increased 8%, including a favorable foreign exchange impact of 1%, reflecting results in the North America/Europe segment, which are predominantly infant formula markets, and growth in the Asia/Latin America segment. Children’s nutrition sales increased 22%, including a favorable foreign exchange impact of 4%, reflecting the strength of the Asia/Latin America segment where over 90% of our children nutrition sales are generated. The decline in other products is primarily driven by the expiration of a 2009 marketing services agreement under which we sold pharmaceutical products in two Asia markets on behalf of BMS.
We recognize revenue net of various sales adjustments to arrive at net sales as reported on the statements of earnings. These adjustments are referred to as gross-to-net sales adjustments. The reconciliation of our gross sales to net sales is as follows:
| Year Ended December 31, | % of Gross Sales |
|||||||||||||||
| (Dollars in millions) | 2010 | 2009 | 2010 | 2009 | ||||||||||||
| Gross Sales |
$ | 4,151.2 | $ | 3,864.6 | 100 | % | 100 | % | ||||||||
| Gross-to-Net Sales Adjustments |
||||||||||||||||
| WIC Rebates |
680.8 | 735.7 | 16 | % | 19 | % | ||||||||||
| Sales Discounts |
118.4 | 100.4 | 3 | % | 3 | % | ||||||||||
| Returns |
84.3 | 72.0 | 2 | % | 2 | % | ||||||||||
| Cash Discounts |
44.0 | 45.1 | 1 | % | 1 | % | ||||||||||
| Prime Vendor Charge-Backs |
34.8 | 38.5 | 1 | % | 1 | % | ||||||||||
| Coupons and Other Adjustments |
47.3 | 46.4 | 1 | % | 1 | % | ||||||||||
| Total Gross-to-Net Sales Adjustments |
1,009.6 | 1,038.1 | 24 | % | 27 | % | ||||||||||
| Total Net Sales |
$ | 3,141.6 | $ | 2,826.5 | 76 | % | 73 | % | ||||||||
Gross-to-net sales adjustments declined as a percentage of gross sales due to a decline in WIC rebates. The decline in WIC rebates was due to a reduction in the amount of infant formula provided under the program and a reduction in WIC participants due to lower birth rates.
34
Table of Contents
Gross Profit
| Year Ended December 31, | % Change | |||||||||||
| (Dollars in millions) | 2010 | 2009 | ||||||||||
| Net Sales |
$ | 3,141.6 | $ | 2,826.5 | 11 | % | ||||||
| Cost of Products Sold |
1,149.6 | 974.7 | 18 | % | ||||||||
| Gross Profit |
$ | 1,992.0 | $ | 1,851.8 | 8 | % | ||||||
| Gross Margin |
63.4 | % | 65.5 | % | ||||||||
Gross margin declined compared to a year ago due to increased commodity and manufacturing costs, partially offset by productivity gains and higher product pricing.
Expenses
| Year Ended December 31, |
% Change | % of Net Sales | ||||||||||||||||||
| (Dollars in millions) | 2010 | 2009 | 2010 | 2009 | ||||||||||||||||
| Selling, General and Administrative |
$ | 762.7 | $ | 665.3 | 15 | % | 24 | % | 24 | % | ||||||||||
| Advertising and Promotion |
438.7 | 401.9 | 9 | % | 14 | % | 14 | % | ||||||||||||
| Research and Development |
78.5 | 71.9 | 9 | % | 2 | % | 3 | % | ||||||||||||
| Other Expenses/(Income)—net |
29.2 | 33.1 | (12 | %) | 1 | % | 1 | % | ||||||||||||
Selling, General and Administrative Expenses (SG&A)
The increase in SG&A expenses reflected sales force growth, primarily in China and Brazil, the temporary duplication of costs as we transition to a new shared service provider for IT, accounting and indirect procurement (Shared Service Overlap) and new stand-alone corporate costs.
Advertising and Promotion Expenses
Our advertising spending primarily includes television and other consumer media. Promotion activities primarily include product trial and education provided to both health care professionals and consumers, where permissible by regulation. The increase in advertising and promotion expenses reflected continued investment in demand-generation activities in support of our strategic growth initiatives.
Research and Development Expenses
The increase in research and development expenses reflected our continued investment in our innovation capability and product pipeline.
Other Expense/(Income)—net (OIE)
For the year ended December 31, 2010, OIE included $10.6 million in pension settlement costs for defined benefit plans, an $8.5 million foreign currency loss from the initial balance sheet remeasurement of our Venezuela subsidiary upon the devaluation of the bolivar and the application of highly inflationary accounting, and severance costs. For the year ended December 31, 2009, OIE included litigation costs, severance costs, and currency losses on assets held in non-functional currencies, partially offset by a gain on sale of a non-strategic intangible asset and a favorable patent settlement.
35
Table of Contents
Earnings before Interest and Income Taxes
EBIT from our two reportable segments, Asia/Latin America and North America/Europe, is reduced by Corporate and Other expenses. Corporate and Other consists of unallocated general and administrative expenses and global business support activities, including research and development, marketing and supply chain costs.
| Years Ended December 31, |
% Change | |||||||||||
| (Dollars in millions) | 2010 | 2009 | ||||||||||
| Asia/Latin America |
$ | 646.1 | $ | 577.0 | 12 | % | ||||||
| North America/Europe |
357.7 | 391.8 | (9 | %) | ||||||||
| Corporate and Other |
(320.9 | ) | (289.2 | ) | 11 | % | ||||||
| EBIT |
$ | 682.9 | $ | 679.6 | 0 | % | ||||||
The increase in EBIT for Asia/Latin America was due to sales growth partially offset by increased expenses, primarily higher advertising and promotion costs, along with sales force growth, and a lower gross margin, primarily due to higher commodity and manufacturing costs, partially offset by productivity gains.
The decrease in EBIT for North America/Europe was primarily due to a lower gross margin reflecting higher commodity and manufacturing costs, partly offset by productivity gains.
Corporate and Other expenses increased due to increased IT and other separation costs, the Shared Service Overlap, new stand-alone corporate costs and the absence of a gain in 2009 on the sale of a non-strategic intangible asset, partly offset by the elimination of IPO-related costs.
Interest Expense—net
Interest expense for the year ended December 31, 2010 primarily represented interest incurred on $1.5 billion of notes. Interest expense declined by $44.0 million due to lower interest rates resulting from our November 2009 debt refinancing, combined with the benefit from fixed-to-floating interest rate swaps on a portion of that debt, and a reduction in debt. For the year ended December 31, 2009, interest expense primarily represented interest incurred on $1.7 billion of notes. The average interest rate on our long-term debt, including the impact of the swaps, was 3.6% and 5.3% for the years ended December 31, 2010 and 2009, respectively.
Income Taxes
The ETR for the years ended December 31, 2010 and 2009, was 27.8% and 30.1%, respectively. The difference in the rates was primarily attributable to the benefits of a tax ruling in the Netherlands, management’s assertion that certain foreign earnings and profits are permanently invested abroad, and a favorable change in our geographic earnings mix.
Net Earnings Attributable to Noncontrolling Interests
Net earnings attributable to noncontrolling interests consisted of an 11% interest in our China legal entity and a 10% interest in our Indonesia legal entity held by third parties.
Net Earnings Attributable to Shareholders
For the foregoing reasons, net earnings attributable to shareholders for the year ended December 31, 2010 increased 13% to $452.7 million compared with the year ended December 31, 2009.
36
Table of Contents
Results of Operations
Year Ended December 31, 2009 Compared to Year Ended December 31, 2008
Below is a summary of comparative results of operations for the years ended December 31, 2009 and 2008:
| % of Net Sales | ||||||||||||||||||||
| (In millions, except per share data) | 2009 | 2008 | % Change | 2009 | 2008 | |||||||||||||||
| Net Sales |
$ | 2,826.5 | $ | 2,882.4 | (2 | %) | — | — | ||||||||||||
| Earnings before Interest and Income Taxes (EBIT) |
679.6 | 695.7 | (2 | %) | 24 | % | 24 | % | ||||||||||||
| Interest Expense—net |
92.6 | 43.3 | 114 | % | 3 | % | 2 | % | ||||||||||||
| Earnings before Income Taxes |
587.0 | 652.4 | (10 | %) | 21 | % | 23 | % | ||||||||||||
| Provision for Income Taxes |
176.4 | 251.4 | (30 | %) | 6 | % | 9 | % | ||||||||||||
| Effective Tax Rate (ETR) |
30.1 | % | 38.5 | % | ||||||||||||||||
| Net Earnings |
410.6 | 401.0 | 2 | % | 15 | % | 14 | % | ||||||||||||
| Less: Net Earnings attributable to noncontrolling interests |
11.0 | 7.1 | 55 | % | 0 | % | 0 | % | ||||||||||||
| Net Earnings Attributable to Shareholders |
399.6 | 393.9 | 1 | % | 14 | % | 14 | % | ||||||||||||
| Weighted Average Common Shares—Diluted |
200.7 | 170.0 | ||||||||||||||||||
| Earnings per Common Share—Diluted |
$ | 1.99 | $ | 2.32 | (14 | %) | ||||||||||||||
Factors Affecting Comparability
Included in the above table are the following significant expenses that affect comparability in 2009 and 2008.
| Year Ended December 31, | ||||||||
| 2009 | 2008 | |||||||
| IPO-related costs |
$ | 31.0 | $ | 44.8 | ||||
| IT and other separation costs |
19.2 | — | ||||||
| Gain on asset sale |
(11.9 | ) | — | |||||
| Severance and other costs |
25.3 | — | ||||||
| Legal, settlements and related costs |
17.5 | — | ||||||
| Total |
$ | 81.1 | $ | 44.8 | ||||
The results for the year ended December 31, 2009, include several items that affect the comparability of the company’s financial results between 2009 and 2008. These items include significant expenses not indicative of on-going results, interest expense, operating model changes, the ETR and the number of shares outstanding.
In 2009 we incurred $81.1 million of expense for significant items not indicative of on-going results including IPO-related costs, IT separation costs, gain on asset sale, severance and relocation costs and legal costs and settlements. In 2008 we incurred $44.8 million in IPO-related costs.
Interest expense increased $49.3 million in 2009 due to the addition of debt to our capital structure beginning in the third quarter of 2008. On August 26, 2008, we issued a $2.0 billion intercompany note to BMS. The note was restructured at the IPO date reducing the related-party debt to approximately $1.7 billion. In November 2009, we repaid these notes to BMS in full through the net proceeds from the private placement of three tranches of notes, totaling $1.5 billion, along with borrowings under our three-year syndicated credit facility agreement (Credit Facility) and cash on hand. Net interest expense during the year ended December 31, 2009, was $92.6 million compared with $43.3 million for the year ended December 31, 2008.
Our 2009 results include operating model changes primarily in Brazil and Europe. In Brazil, our ability to operate as a new stand-alone subsidiary was delayed from February to late in September 2009. During that time, BMS distributed and recorded sales for our products and we conducted marketing activities. In Europe, we have
37
Table of Contents
transitioned to a third-party distributor model with BMS temporarily serving as our distributor. This reduced net sales by the amount of the distributors’ margin and lowered costs for the distribution-related expenses.
For the year ended December 31, 2009, the ETR was 30.1% compared with 38.5% for the year ended December 31, 2008. The lower rate was driven primarily by our new legal entity structure to facilitate the IPO, one-time restructuring benefits, and earnings mix.
Prior to February 10, 2009, there were 170.0 million shares of common stock outstanding, all held by BMS. We issued an additional 34.5 million shares of common stock in the IPO. On November 15, 2009, BMS announced an exchange offer whereby BMS shareholders could exchange shares of BMS common stock for shares of MJN stock held by BMS. Prior to the completion of the exchange offer, BMS converted all its MJN Class B common stock into MJN Class A common stock. The exchange offer was completed on December 23, 2009, resulting in the split-off of MJN from BMS, after which BMS had no equity or voting interest in us.
In addition to these items that affect the comparability of the 2009 results of operations to 2008, there are several adjustments to the balance sheet related to our separation from BMS including the recognition of pension, inclusion of cash balances and restructuring divisional equity. See “Item 8. Financial Statements and Supplementary Data.”
Net Sales
Our net sales by reportable segments are shown in the table below:
| Year Ended December 31, | % Change | % Change Due to | ||||||||||||||||||||||
| (Dollars in millions) |
2009 | 2008 | Volume | Price | Foreign Exchange |
|||||||||||||||||||
| Asia/Latin America |
$ | 1,625.5 | $ | 1,516.9 | 7 | % | 3 | % | 10 | % | (6 | %) | ||||||||||||
| North America/Europe |
1,201.0 | 1,365.5 | (12 | %) | (10 | %) | 0 | % | (2 | %) | ||||||||||||||
| Net Sales |
$ | 2,826.5 | $ | 2,882.4 | (2 | %) | (3 | %) | 5 | % | (4 | %) | ||||||||||||
Our Asia/Latin America segment represented 58% of net sales for the year ended December 31, 2009, compared to 53% for the year ended December 31, 2008. Our success in the Asia/Latin America segment comes from the benefit of price increases, geographic expansion and new product launches. Sales growth in China, our second largest market, was the highest of the major markets in which we operate, and many other Asian and Latin American countries increased sales by double digits, excluding the impact of foreign exchange. Volume growth in the segment was adversely affected by approximately two percentage points due to the temporary operating model change in Brazil, in place during most of 2009, pending the transfer of certain permits and registrations previously held by BMS.
The decrease in North America/Europe sales was primarily due to weaker performance in the United States driven by share losses, the contraction in the U.S. market from lower births, and the impact of planned reductions in inventories held by BMS who is temporarily serving as our distributor in Europe. A number of new products were introduced in the United States in 2009, which were supported by increased marketing, advertising and promotion spending.
38
Table of Contents
Our net sales by product category are shown in the table below:
| Year Ended December 31, | % Change | |||||||||||
| (Dollars in millions) | 2009 | 2008 | ||||||||||
| Infant Formula |
$ | 1,805.6 | $ | 1,931.6 | (7 | %) | ||||||
| Children’s Nutrition |
919.0 | 855.9 | 7 | % | ||||||||
| Other |
101.9 | 94.9 | 7 | % | ||||||||
| Net Sales |
$ | 2,826.5 | $ | 2,882.4 | (2 | %) | ||||||
Excluding foreign exchange, infant formula sales decreased 4% reflecting the decline in the North America/Europe segment, which is predominantly an infant formula market. Excluding foreign exchange, children’s nutrition sales increased 14%, reflecting the strength of the business in Asia/Latin America.
We recognize revenue net of various sales adjustments to arrive at net sales as reported on the statements of earnings. These adjustments are referred to as gross-to-net sales adjustments. The reconciliation of our gross sales to net sales is as follows:
| Year Ended December 31, | % of Gross Sales | |||||||||||||||
| (Dollars in millions) | 2009 | 2008 | 2009 | 2008 | ||||||||||||
| Gross Sales |
$ | 3,864.6 | $ | 3,974.2 | 100 | % | 100 | % | ||||||||
| Gross-to-Net Sales Adjustments |
||||||||||||||||
| WIC Rebates |
735.7 | 796.0 | 19 | % | 20 | % | ||||||||||
| Sales Discounts |
100.4 | 87.9 | 3 | % | 2 | % | ||||||||||
| Returns |
72.0 | 64.7 | 2 | % | 2 | % | ||||||||||
| Cash Discounts |
45.1 | 46.9 | 1 | % | 1 | % | ||||||||||
| Prime Vendor Charge-Backs |
38.5 | 42.2 | 1 | % | 1 | % | ||||||||||
| Coupons and Other Adjustments |
46.4 | 54.1 | 1 | % | 1 | % | ||||||||||
| Total Gross-to-Net Sales Adjustments |
1,038.1 | 1,091.8 | 27 | % | 27 | % | ||||||||||
| Total Net Sales |
$ | 2,826.5 | $ | 2,882.4 | 73 | % | 73 | % | ||||||||
The decline in WIC rebates was due to a decline in U.S. births and a United States Department of Agriculture (USDA) change that resulted in a reduction in the amount of free infant formula provided by WIC agencies to infants. The change in sales discounts was due to promotional mix and new product launches in 2009. The relative increase in returns was due to an abnormally low amount of returns during fiscal 2008, and the impact of 2009 new product launches with resulting product discontinuations. The reduction in coupons and other adjustments is due to a shift from consumer coupons to sales discounts, primarily driven by the U.S. market.
Gross Profit
| Year Ended December 31, | % Change | |||||||||||
| (Dollars in millions) | 2009 | 2008 | ||||||||||
| Net Sales |
$ | 2,826.5 | $ | 2,882.4 | (2 | %) | ||||||
| Cost of Products Sold |
974.7 | 1,079.8 | (10 | %) | ||||||||
| Gross Profit |
$ | 1,851.8 | $ | 1,802.6 | 3 | % | ||||||
| Gross Margin |
65.5 | % | 62.5 | % | ||||||||
39
Table of Contents
The improvement in gross margin was driven by reduced commodity costs, primarily dairy, higher product pricing and productivity initiatives, partially offset by the adverse effect of foreign exchange, product mix, plant deleveraging and manufacturing inflation.
Expenses
| Year Ended December 31, | % Change | % of Net Sales | ||||||||||||||||||
| (Dollars in millions) | 2009 | 2008 | 2009 | 2008 | ||||||||||||||||
| Selling, General and Administrative |
$ | 665.3 | $ | 651.7 | 2 | % | 24 | % | 23 | % | ||||||||||
| Advertising and Promotion |
401.9 | 369.3 | 9 | % | 14 | % | 13 | % | ||||||||||||
| Research and Development |
71.9 | 72.8 | (1 | %) | 3 | % | 3 | % | ||||||||||||
| Other Expenses—net |
33.1 | 13.1 | — | 1 | % | 0 | % | |||||||||||||
Selling, General and Administrative Expenses
The increase in selling, general and administrative expenses was mostly due to higher IPO-related costs, IT separation costs and additional corporate expenses that we now carry as a public company, partly offset by the impact of foreign exchange.
Advertising and Promotion Expenses
Our advertising and promotion expenses are influenced by the timing of our key product launches and promotions and have increased to 14% of sales as we continue to invest in growing our business.
Research and Development Expenses
Research and development expenses decreased slightly compared to prior year due to the adverse effect of foreign exchange.
Other Expenses—net
Other expenses—net for the year ended December 31, 2009, increased by $20.0 million due primarily to severance and related costs, litigation costs and settlements—net, partly offset by a gain on the sale of a non-strategic intangible asset.
Earnings before Interest and Income Taxes
EBIT from our two reportable segments, Asia/Latin America and North America/Europe, is reduced by Corporate and Other expenses. Corporate and Other expenses consist of unallocated general and administrative activities and associated expenses, including in part, executive, legal, finance, information technology, human resources, research and development, marketing and supply chain costs.
| Years Ended December 31, |
% Change | |||||||||||
| (Dollars in millions) | 2009 | 2008 | ||||||||||
| Asia/Latin America |
$ | 577.0 | $ | 462.9 | 25 | % | ||||||
| North America/Europe |
391.8 | 467.3 | (16 | %) | ||||||||
| Corporate and Other |
(289.2 | ) | (234.5 | ) | 23 | % | ||||||
| EBIT |
$ | 679.6 | $ | 695.7 | (2 | %) | ||||||
The increase in EBIT for Asia/Latin America was driven by higher net sales and improved gross margin.
40
Table of Contents
The decrease in EBIT for North America/Europe was primarily due to lower net sales partially offset by improved gross margins, lower distribution costs and sales force productivity initiatives.
The increase in expenses for the Corporate and Other segment was principally due to the significant expenses that affect comparability described in the table above and the additional corporate expenses that we now carry as a public company.
Interest Expense—net
Interest expense—net for the year ended December 31, 2009, primarily represented interest incurred on three notes payable to BMS totaling $1.7 billion repaid in November 2009 and, to a lesser extent, interest incurred on the three tranches of notes totaling $1.5 billion that were issued in a private placement to third parties in November 2009. For the year ended December 31, 2008, interest expense—net represented interest incurred on the previously outstanding $2.0 billion note payable to BMS issued in August 2008.
Income Taxes
The ETR for the year ended December 31, 2009, decreased to 30.1% from 38.5% for the year ended December 31, 2008. The lower rate was driven primarily by our new legal entity structure to facilitate the IPO, one-time restructuring benefits, and earnings mix.
Net Earnings Attributable to Noncontrolling Interests
Net earnings attributable to noncontrolling interests consisted of an 11% interest in our China legal entity and a 10% interest in our Indonesia legal entity held by third parties.
Net Earnings Attributable to Shareholders
For the year ended December 31, 2009, net earnings attributable to shareholders increased by $5.7 million to $399.6 million compared with $393.9 million for the year ended December 31, 2008. The increase was primarily due to a reduction in the ETR and an improvement in gross margin, offset by the unfavorable impact of foreign exchange and higher interest expense.
Liquidity and Capital Resources
Overview
Our primary sources of liquidity are cash from operations, cash on hand and available borrowings under our $410.0 million revolving credit facility (Credit Facility). Cash flows from operating activities represent the inflow of cash from our customers and the outflow of cash for inventory purchases, manufacturing, operating expenses, interest and taxes. Cash flows used in investing activities primarily represent capital expenditures for equipment, buildings and computer software. Cash flows used in financing activities primarily represent proceeds and repayments of short-term borrowings and dividend payments.
Cash and cash equivalents totaled $595.6 million at December 31, 2010. Cash and cash equivalents held outside the United States were $482.9 million at December 31, 2010, and are either determined to be permanently invested to fund non-U.S. operations or are planned to be repatriated to the United States. Tax expense on planned cash repatriations to the United States have previously been recognized but will not be paid until the repatriation event. Cash repatriations are subject to meeting regulatory requirements in certain jurisdictions and may be subject to withholding and other taxes.
41
Table of Contents
The declaration and payment of dividends is at the discretion of our board of directors and depends on many factors, including our financial condition, earnings, legal requirements, restrictions under the terms of our debt agreements and other factors our board of directors deem relevant. Cash dividends paid for the years ended December 31, 2010 and 2009 were $179.6 million and $102.3 million, respectively. There were no cash dividends paid in 2008.
On March 16, 2010, our board of directors authorized the repurchase of up to $300 million of the Company’s stock. The repurchase program is primarily intended to offset the dilutive effect on earnings from stock-based compensation over the next two to four years. During the year ended December 31, 2010, the number of shares purchased under the program was not significant.
Cash Flows
We believe that cash from operations will be sufficient to support our working capital needs, pay our operating expenses, satisfy debt obligations, fund capital expenditures and make dividend payments. As of February 14, 2011, we have $410 million available to us under our Credit Facility.
| Years Ended December 31, | ||||||||||||
| (Dollars in millions) | 2010 | 2009 | 2008 | |||||||||
| Cash flow provided by/(used in): |
||||||||||||
| Operating Activities |
$ | 514.2 | $ | 576.6 | $ | 489.0 | ||||||
| Investing Activities |
(174.6 | ) | (81.3 | ) | (79.4 | ) | ||||||
| Financing Activities |
(306.4 | ) | 49.1 | (409.6 | ) | |||||||
| Effects of Changes in Exchange Rates on Cash and Cash Equivalents |
1.3 | 16.7 | — | |||||||||
| Net Increase in Cash and Cash Equivalents |
$ | 34.5 | $ | 561.1 | $ | — | ||||||
Year Ended December 31, 2010 Compared to Year Ended December 31, 2009
Cash flow from operating activities fell by $62.4 million in 2010 compared with 2009. Higher earnings, along with increased non-cash depreciation and amortization expense and lower cash paid for interest, were more than offset by a smaller reduction in working capital and other short-term assets and liabilities, along with increased payments for income taxes and cash contributions to our frozen U.S. defined benefit pension plan.
Cash flow used in investing activities increased $93.3 million primarily due to higher capital spending from investments in our global IT platform and new packaging lines. Cash flows used in investing activities in 2010 included a $5.5 million investment in International Pediatric Nutrition Company, our joint venture with Almarai Company in Saudi Arabia serving countries in the Gulf Cooperation Council.
Cash flow used in financing activities was $306.4 million for the year ended December 31, 2010, primarily from $179.6 million of dividend payments and the net repayment of $120.0 million of our short-term Credit Facility borrowing. Cash flow provided by financing activities was $49.1 million for the year ended December 31, 2009, and reflected $1,495.3 million from the private placement of notes and $782.3 million net cash proceeds from the IPO, partially offset by $2,348.1 million repayment of BMS debt and other items as described below.
Year Ended December 31, 2009 Compared to Year Ended December 31, 2008
Cash flow provided by operating activities increased $87.6 million for the year ended December 31, 2009, compared with the year ended December 31, 2008. The improvement primarily reflected a decline in our inventories during 2009 compared with an increase during 2008 due to lower commodity costs. The impact of the change in inventories was partially offset by an increase in receivables and changes in other current assets and liabilities as well as working capital management initiatives which also resulted in some extension in accounts payable terms.
42
Table of Contents
Cash used in investing activities increased $1.9 million due to an increase in payments for capital expenditures, partially offset by the cash inflow before taxes from the sale of a non-strategic intangible asset.
Cash provided by financing activities totaled $49.1 million in 2009 comprised of $1,495.3 million from the private placement of notes in the fourth quarter, $782.3 million net cash proceeds from the IPO, $120 million from net short-term borrowings and $137.7 million net transfers from BMS partly offset by $2,348.1 million repayment of BMS debt, $30.0 million promissory note from BMS, dividend payments of $102.3 million and distributions to noncontrolling interests of $5.8 million. The net transfer from BMS included in financing activities during 2009 consisted mainly of $316.0 million cash contribution from BMS made in connection with our IPO offset by $166.8 million settlement of related party payables. This compares to cash used in financing activities of $409.6 million in 2008 comprised of net transfers to BMS of $397.9 million and distributions to noncontrolling interests of $11.7 million.
Capital Expenditures
Capital expenditures of $143.4 million and the cash outflow for capital expenditures of $172.4 million for the year ended December 31, 2010, reflected the increased investment in our global IT platform and new packaging lines. Capital expenditures of $122.3 million and the cash outflow for capital expenditures of $95.8 million for the year ended December 31, 2009, reflected the increased investment in capacity expansion, packaging innovation, and research and development capabilities. The cash outflow for capital expenditures was $81.1 million for the year ended December 31, 2008. We expect capital expenditures in 2011 to be approximately $125 million, including our investment in our global IT platform and continued emphasis on investment in growth and innovation.
Short-Term Borrowings
Our Credit Facility is unsecured and repayable on maturity in February 2012, subject to annual extensions if sufficient lenders agree. The maximum amount of outstanding borrowings and letters of credit permitted at any one time under the Credit Facility is $410.0 million, which amount may be increased from time to time up to $500.0 million at our request and with the consent of the lenders, subject to customary conditions. The borrowings from the Credit Facility are to be used for working capital and other general corporate purposes. Our subsidiaries may become borrowers under the Credit Facility.
The Credit Facility contains customary covenants, including covenants applicable to limiting liens, substantial asset sales and mergers. Most of these restrictions are subject to certain minimum thresholds and exceptions. The Credit Facility contains financial covenants whereby the ratio of consolidated total debt to consolidated Earnings Before Interest, Income Taxes, Depreciation and Amortization (EBITDA) cannot exceed 3.25 to 1.0, and the ratio of consolidated EBITDA to consolidated interest expense cannot be less than 3.0 to 1.0.
Borrowings under the Credit Facility bear interest at a rate that is determined as a base rate plus a margin. The base rate is either (a) LIBOR for a specified interest period, or (b) a floating rate based upon JPMorgan Chase Bank’s prime rate, the Federal Funds rate or LIBOR. The margin is determined by reference to the Company’s consolidated leverage ratio. The margin can range from 1.125% to 2.65% over the base rate. In addition, we incur an annual 0.2% facility fee on the entire facility commitment of $410.0 million.
If our corporate credit rating falls below (i) Baa3 by Moody’s Investors Service, Inc. (Moody’s) and (ii) BBB- by Standard & Poor’s Ratings Service (S&P), then Mead Johnson & Company shall automatically be deemed to guarantee the obligations under the Credit Facility. The Moody’s credit rating for MJN is currently Baa1. S&P’s credit rating for MJN is currently BBB.
In addition, the Credit Facility has customary events of default, including payment default, failure to comply with covenants, material inaccuracy of representation or warranty, bankruptcy or insolvency proceedings, change of
43
Table of Contents
control, ERISA matters and cross-default to other debt agreements. We were in compliance with all debt covenants as of December 31, 2010. Short-term borrowings were $1.2 million as of December 31, 2010, and consisted of subsidiary borrowings. There were no borrowings from the Credit Facility as of December 31, 2010.
Long-Term Debt
The components of our long-term debt are detailed in the table below:
| Description |
Principal Amount | Interest Rate | Terms | |||
| 2014 Notes |
$ 500.0 million | 3.50% fixed | Interest due semi-annually, not subject to amortization, aggregate principal due on November 1, 2014 | |||
| 2019 Notes |
$ 700.0 million | 4.90% fixed | Interest due semi-annually, not subject to amortization, aggregate principal due on November 1, 2019 | |||
| 2039 Notes |
$ 300.0 million | 5.90% fixed | Interest due semi-annually, not subject to amortization, aggregate principal due on November 1, 2039 |
The notes may be prepaid at any time, in whole or in part, at a redemption price equal to the greater of par value or an amount calculated based upon the sum of the present values of the remaining scheduled payments. Upon a change of control, we may be required to repurchase the notes in an amount equal to 101% of the then outstanding principal amount plus accrued and unpaid interest.
In November 2009, we entered into interest rate swaps with a notional amount of $700.0 million. Interest rate swaps effectively swap fixed interest rate obligations for floating interest rate obligations. In November 2010, we terminated a notional amount of $200.0 million in interest rate swap agreements with a fair value of $16.8 million, to be amortized over the remaining life of the 2019 Notes.
The following table summarizes the interest rate swaps outstanding at December 31, 2010:
| (Dollars in millions) | Notional Amount of Underlying Debt |
Variable Rate Paid |
Year of Transaction |
Maturity | Fair Value |
|||||||||||||
| Swaps associated with: |
||||||||||||||||||
| 3.50% Notes due 2014 |
$ | 500.0 | 1 month U.S. $ LIBOR + 0.890% | 2009 | 2014 | $ | 20.1 | |||||||||||
For additional information on our long-term debt and interest rate swaps, see “Item 8. Financial Statements and Supplementary Data.”
Contractual Obligations
As of December 31, 2010, our significant contractual obligations and other commitments were as follows:
| Payments due by December 31, | ||||||||||||||||||||||||||||
| (In millions) | 2011 | 2012 | 2013 | 2014 | 2015 | Thereafter | Total | |||||||||||||||||||||
| Operating lease obligations |
$ | 24.5 | $ | 21.2 | $ | 17.1 | $ | 15.2 | $ | 10.8 | $ | 23.4 | $ | 112.2 | ||||||||||||||
| Capital lease obligations |
0.4 | 0.3 | 0.4 | 0.4 | 0.3 | 0.1 | 1.9 | |||||||||||||||||||||
| Purchase obligations |
182.2 | 75.7 | 67.6 | 49.9 | 43.8 | 162.2 | 581.4 | |||||||||||||||||||||
| Long-term debt |
— | — | — | 500.0 | — | 1,000.0 | 1,500.0 | |||||||||||||||||||||
| Interest on long-term debt |
58.4 | 61.7 | 66.7 | 69.7 | 52.0 | 562.0 | 870.5 | |||||||||||||||||||||
| Total |
$ | 265.5 | $ | 158.9 | $ | 151.8 | $ | 635.2 | $ | 106.9 | $ | 1,747.7 | $ | 3,066.0 | ||||||||||||||
44
Table of Contents
Our operating lease obligations are generally related to real estate leases for offices, manufacturing-related leases, and vehicle leases. Capital lease obligations relate to assets utilized for interplant transportation of materials and finished goods. Purchase obligations are for unconditional commitments related to a master service agreement with IBM for information technology, accounting and indirect procurement services, including the design and implementation of a global enterprise resource planning system, the purchase of materials used in manufacturing and for promotional services, and a transition services agreement for various corporate support services provided between us and BMS. The table above does not include $19.8 million in uncertain tax positions due to the uncertainty related to the timing of the reversal of the positions. The future interest payments on long-term debt, including the effect of our interest rate swaps, are estimated based on implied forward LIBOR rates used in the valuation of our interest rate swaps.
Off-Balance Sheet Arrangements
Pursuant to an Amended and Restated Tax Matters Agreement with BMS, we have agreed to indemnify BMS for (i) any tax payable with respect to any separate tax return that we are required to file or cause to be filed, (ii) any tax incurred as a result of any gain that may be recognized by a member of the BMS affiliated group with respect to a transfer of certain foreign affiliates by us in preparation for the IPO, and (iii) any tax arising from the failure or breach of any representation or covenant made by us which failure or breach results in the intended tax consequences of the split-off transaction not being achieved.
We do not use off-balance sheet derivative financial instruments to hedge or partially hedge interest rate exposure nor do we maintain any other off-balance sheet arrangements for the purpose of credit enhancement, hedging transactions or other financial or investment purposes.
Significant Accounting Estimates
In presenting our financial statements in accordance with accounting principles generally accepted in the United States (GAAP), we are required to make estimates and assumptions that affect the reported amounts of assets, liabilities, revenues, costs and expenses and related disclosures.
Some of the estimates and assumptions that we are required to make relate to matters that are inherently uncertain as they pertain to future events. We base these estimates and assumptions on historical experience or on various other factors that we believe to be reasonable and appropriate under the circumstances. On an on-going basis, we reconsider and evaluate our estimates and assumptions. Actual results may differ significantly from these estimates. Future results may differ from our estimates under different assumptions or conditions.
We believe that the significant accounting estimates listed below involve our more significant judgments, assumptions and estimates and, therefore, could have the greatest potential impact on our financial statements.
For information on our accounting policies, see “Item 8. Financial Statements and Supplementary Data.”
Revenue Recognition
We recognize revenue when substantially all the risks and rewards of ownership have transferred to the customer. Revenue is recognized on the date of receipt by the purchaser. Revenues are reduced at the time of recognition to reflect expected returns that are estimated based on historical experience and business trends. Additionally, provisions are made at the time of revenue recognition for discounts, WIC rebates and estimated sales allowances based on historical experience, updated for changes in facts and circumstances, as appropriate. Such provisions are recorded as a reduction of revenue. We offer sales incentives to customers and consumers through various programs consisting primarily of customer pricing allowances, merchandising funds and consumer coupons. Provisions are made at the time of revenue recognition for these items based on historical experience, updated for changes in facts and circumstances, as appropriate. Such provisions are recorded as a reduction of revenue.
45
Table of Contents
WIC Rebates—We participate on a competitive bidding basis in nutrition programs sponsored by states, tribal governments, the Commonwealth of Puerto Rico, and U.S. territories for WIC. Under these programs, we reimburse these entities for the difference between our wholesaler list price and the contract price on eligible products. We account for WIC contract rebates by establishing an accrual in an amount equal to our estimate of WIC rebate claims attributable to a sale. We determine our estimate of the WIC rebate accrual primarily based on historical experience regarding WIC rebates and current contract prices under the WIC programs. We consider levels of inventory in the distribution channel, new WIC contracts, terminated WIC contracts, changes in existing WIC contracts and WIC participation, and adjust the accrual periodically throughout the year to reflect actual expense. WIC rebate accruals were $195.3 million and $199.9 million at December 31, 2010 and 2009, respectively, and are included in accrued rebates and returns on our balance sheet. Rebates under the WIC program reduced revenues by $680.8 million, $735.7 million, and $796.0 million in the years ended December 31, 2010, 2009 and 2008, respectively.
Sales Returns—We account for sales returns by establishing an accrual in an amount equal to our estimate of sales recorded for which the related products are expected to be returned. We determine our estimate of the sales return accrual primarily based on historical experience regarding sales returns, but also consider other factors that could impact sales returns such as discontinuations and new product introductions. Sales return accruals were $43.5 million and $33.9 million at December 31, 2010 and 2009, respectively, and are included in accrued rebates and returns on our balance sheet. Returns reduced sales by $84.3 million, $72.0 million, and $64.7 million for the years ended December 31, 2010, 2009 and 2008, respectively.
Income Taxes
The effective tax rate reflects statutory tax rates in the various jurisdictions in which we operate, including tax rulings, management’s assertion that certain foreign earnings and profits are permanently invested abroad and management’s estimate of appropriate reserves against uncertain tax positions. Significant judgment is required in determining the effective tax rate and in evaluating the uncertainty in tax positions.
The income tax provision prepared in the post split-off period reflects a separate return methodology based on the legal structure where we are a separate taxpayer in the respective jurisdictions. The income tax provision prepared in the period following the IPO but preceding the split-off reflects a separate return methodology based on the actual legal entity structure as if we were a separate taxpayer in the respective jurisdictions with certain accommodations pursuant to a tax matters agreement as noted below. This is in contrast to the pre-IPO period in which the income tax provision was prepared on a separate return stand-alone methodology reflecting a hypothetical legal entity structure in which we were included in the tax grouping of other BMS entities within the respective entity’s tax jurisdiction.
The provision for income taxes has been determined using the asset and liability approach of accounting for income taxes. Under this approach, deferred taxes represent the future tax consequences expected to occur when the reported amounts of assets and liabilities are recovered or paid. The provision for income taxes represents income taxes paid or payable for the current year plus the change in deferred taxes during the year. Deferred taxes result from differences between the financial and tax basis of our assets and liabilities. Deferred tax assets and liabilities are measured using the currently enacted tax rates that apply to taxable earnings in effect for the years in which those tax attributes are expected to be recovered or paid, and are adjusted for changes in tax rates and tax laws when changes are enacted. The ultimate liability incurred by us may differ from the provision estimates based on a number of factors, including interpretations of tax laws and the resolution of examinations by the taxing authorities.
Valuation allowances are recorded to reduce deferred tax assets when it is more likely than not that a tax benefit will not be realized. The assessment of whether or not a valuation allowance is required often requires significant judgment including the long-range forecast of future taxable earnings and the evaluation of tax planning initiatives. Adjustments to the deferred tax valuation allowances are made to earnings in the period when such assessments are made.
46
Table of Contents
Changes in recognized tax benefits and changes in valuation allowances could be material to our results of operations for any period, but are not expected to be material to our financial position.
Pension and Other Post Retirement Benefits
Our pension plans and post retirement benefit plans are accounted for using actuarial valuations. Management, in consultation with our actuaries, is required to make significant subjective judgments about a number of actuarial assumptions, including discount rates, long term returns on plan assets, retirement, salary growth, turnover, health care cost trend rates and mortality rates. Depending on the assumptions and estimates used, the pension and post retirement benefit expense could vary within a range of outcomes and have a material effect on reported earnings, projected benefit obligations and future cash funding. Our key assumptions used in calculating the cost of pension benefits are the discount rate and expected long term returns on plan assets. Actual results in any given year may differ from those estimated because of economic and other factors.
The discount rate assumptions used to value the pension and post retirement benefit obligations reflect the yield to maturity of high quality corporate bonds that coincides with the cash flows of the plans’ estimated payouts. The U.S. plans’ pension expense for 2010 was determined using a discount rate of 5.75% and assumed salary growth rate of 3.56% and the benefit obligation at December 31, 2010, was determined using a discount rate of 5.50% and assumed salary growth rate of 4.00%. In developing the expected rate of return on pension plan assets, we estimate returns for individual asset classes with input from external advisors. We also consider long term historical returns on the asset classes, the investment mix of plan assets, investment manager performance and projected future returns of the asset classes. The U.S. plans’ pension expense for 2010 was determined using an expected long term rate of return on plan assets of 7.72% and will be 7.75% for 2011.
The following table shows the impact on pension expense of hypothetical changes in the rates assumed for the U.S. pension plan:
| Increase/(Decrease) in Expense |
Increase/(Decrease) in Obligation |
|||||||||||||||||||
| (Dollars in millions) | Change in Rate | Increase in Rate |
Decrease in Rate |
Increase in Rate |
Decrease in Rate |
|||||||||||||||
| Impact of change in rates: |
||||||||||||||||||||
| Discount rate |
+/-25 basis points | $ | — | $ | — | $ | (4.8 | ) | $ | 5.0 | ||||||||||
| Expected long-term rate of return on plan assets |
+/-100 basis points | $ | (1.8 | ) | $ | 1.8 | N/A | N/A | ||||||||||||
See “Item 8. Financial Statements and Supplementary Data” for additional information on our pension and post retirement benefits.
Special Note Regarding Forward-Looking Statements
This Annual Report on Form 10-K and other written and oral statements we make from time to time contain certain “forward-looking” statements within the meaning of Section 27A of the Securities Act of 1933 and Section 21E of the Securities Exchange Act of 1934. You can identify these forward-looking statements by the fact they use words such as “should,” “expect,” “anticipate,” “estimate,” “target,” “may,” “project,” “guidance,” “intend,” “plan,” “believe” and other words and terms of similar meaning and expression in connection with any discussion of future operating or financial performance. You can also identify forward-looking statements by the fact that they do not relate strictly to historical or current facts. Such forward-looking statements are based on current expectations and involve inherent risks, uncertainties, and assumptions including factors that could delay, divert or change any of them, and could cause actual outcomes to differ materially from current expectations. These statements are likely to relate to, among other things, our goals, plans and projections regarding its financial position, results of operations, cash flows, market position, product development, product approvals, sales efforts, expenses, performance or results of current and anticipated products and the outcome of
47
Table of Contents
contingencies such as legal proceedings and financial results, which are based on current expectations that involve inherent risks and uncertainties, including internal or external factors that could delay, divert or change any of them in the next several years. We have included important factors in the cautionary statements included in “Item 1A. Risk Factors,” that we believe could cause actual results to differ materially from any forward-looking statement.
Although we believe we have been prudent in our plans and assumptions, we can give no assurance that any goal or plan set forth in forward-looking statements can be achieved and we caution readers not to place undue reliance on such statements, which speak only as of the date made. We undertake no obligation to release publicly any revisions to forward-looking statements as a result of new information, future events or otherwise.
48
Table of Contents
| Item 7A. | QUANTITATIVE AND QUALITATIVE DISCLOSURES ABOUT MARKET RISK. |
We are exposed to certain market risks which exist as part of our on-going business operations. In addition to our costs for materials, compensation, media, distribution and other purchased services being subject to inflationary pressures, we are exposed to changes in currency exchange rates, price volatility for certain commodities and changes in interest rates. To reduce our exposure to these risks, we utilize a variety of contract techniques and financial instruments as described below. As a policy, we do not engage in speculative or leveraged transactions, nor do we hold or issue financial instruments for trading purposes.
Foreign Exchange Risk
We are exposed to market risk due to changes in currency exchange rates. Our primary net foreign currency translation exposures are the Chinese renminbi, the Hong Kong dollar, the Philippine peso, the Mexican peso, the euro, the Malaysian ringitt, the Thai baht, and the Canadian dollar. In addition to these primary exposures, as a global business, we are exposed to foreign currency translation risk in all countries in which we do business whose local reporting currency is not the U.S. dollar. For example, in Venezuela, the application of hyperinflationary accounting coupled with the government-directed devaluation of the local currency and prohibitive currency controls negatively impacted our 2010 results.
We use foreign currency contracts to hedge anticipated transactions on certain foreign currencies and designate these derivative instruments as foreign currency cash flow hedges when appropriate. If the derivative is designated as a cash flow hedge, the change in the fair value of the derivative is initially recorded in other comprehensive income and then recognized in our statement of earnings when the corresponding hedged item impacts our earnings. The foreign currency derivatives resulted in losses of $7.8 million, $5.0 million, and $0.9 million in the years ended December 31, 2010, 2009 and 2008, respectively. The impact of hedge ineffectiveness on our earnings was not material.
We enter into hedging and other foreign exchange management arrangements to reduce the risk of foreign currency exchange rate fluctuations to the extent that cost-effective derivative financial instruments or other non-derivative financial instrument approaches are available. Derivative financial instruments will not be used for speculative purposes. The intent of gains and losses on hedging transactions is to offset the respective gains and losses on the underlying exposures being hedged. While we attempt to mitigate some of this risk with hedging and other activities, our business will nevertheless remain subject to substantial foreign exchange risk from foreign currency translation exposures that we will not be able to manage through effective hedging or the use of other financial instruments.
The Company utilizes foreign exchange forward purchases to hedge exposures and the total notional amount of these contracts was $142.0 million at December 31, 2010, representing a net settlement payable of $2.3 million.
The following table summarizes the foreign exchange forward contracts outstanding and the related weighted-average contract exchange rates as of December 31, 2010:
| Contract Amount (in millions) |
Average Contractual Exchange Rate |
|||||||
| Receive United States dollar/Pay Canadian dollar |
$ | 32.3 | 1.02 | |||||
| Receive United States dollar/Pay Mexican peso |
$ | 70.7 | 12.78 | |||||
| Receive United States dollar/Pay Philippine peso |
$ | 39.0 | 43.60 | |||||
All of these derivatives were hedges of anticipated transactions and mature within 15 months. Assuming an unfavorable 10% change in year-end exchange rates, the settlement payable would have increased by $16.0 million. The unfavorable changes would generally have been offset by favorable changes in the values of the underlying exposures.
49
Table of Contents
Commodity Risk
We purchase certain products in the normal course of business, including dairy, agricultural oils, and packaging materials, the costs of which are affected by global commodity changes. Therefore, we are exposed to some price volatility related to market conditions outside of our control.
We employ various purchasing and pricing contract techniques in an effort to reduce volatility. Generally, these techniques include unit pricing that is based on an average of commodity prices over a contractually defined period of time and setting fixed prices with suppliers. We do not generally make use of financial instruments to hedge commodity prices, partially because of these contract pricing techniques. As of December 31, 2010, we had no outstanding commodity derivative instruments.
Interest Rate Risk
We are exposed to changes in interest rates primarily as a result of our borrowing and investing activities used to maintain liquidity and fund business operations. Primary exposures include movements in U.S Treasury rates, LIBOR, and commercial paper rates. The nature and amount of our short-term and long-term debt can be expected to vary as a result of future business requirements, market conditions and other factors. Our debt obligations totaled $1.5 billion, including a fair value of interest rate swaps adjustment of $20.1 million. For information on our debt obligations, see Item 8. “Financial Statements and Supplementary Data.”
In order to manage interest rate expense and to achieve a desired proportion of variable versus fixed rate debt, we have entered into interest rate swaps agreements. These derivatives are accounted for as fair value hedges. Accordingly, changes in the fair value of these derivatives, along with changes in the fair value of the hedged debt obligations that are attributed to the hedged risk, are recognized in current period earnings. The Company had interest rate swaps with a total notional amount of $500.0 million at December 31, 2010. Assuming year end cash balances and debt levels, a one percentage point increase in LIBOR would increase interest expense by $4.0 million. See Note 16 for discussion on the Company’s interest rate swaps.
50
Table of Contents
| Item 8. | FINANCIAL STATEMENTS AND SUPPLEMENTARY DATA. |
| 52 | ||||
| Audited Consolidated Financial Statements of Mead Johnson Nutrition Company: |
||||
| Consolidated Statements of Earnings for the Years Ended December 31, 2010, 2009 and 2008 |
54 | |||
| Consolidated Balance Sheets as of December 31, 2010 and 2009 |
55 | |||
| 56 | ||||
| Consolidated Statements of Cash Flows for the Years Ended December 31, 2010, 2009 and 2008 |
57 | |||
| 58 | ||||
| 86 | ||||
51
Table of Contents
REPORT OF INDEPENDENT REGISTERED PUBLIC ACCOUNTING FIRM
To the Board of Directors and Stockholders of
Mead Johnson Nutrition Company
Glenview, Illinois
We have audited the accompanying consolidated balance sheets of Mead Johnson Nutrition Company and subsidiaries (the “Company”) as of December 31, 2010 and 2009, and the related consolidated statements of earnings, comprehensive income and equity (deficit), and cash flows for each of the three years in the period ended December 31, 2010. Our audits also included the financial statement schedule listed in the Index at Item 8. These financial statements and financial statement schedule are the responsibility of the Company’s management. Our responsibility is to express an opinion on the financial statements and financial statement schedule based on our audits.
We conducted our audits in accordance with the standards of the Public Company Accounting Oversight Board (United States). Those standards require that we plan and perform the audit to obtain reasonable assurance about whether the financial statements are free of material misstatement. An audit includes examining, on a test basis, evidence supporting the amounts and disclosures in the financial statements. An audit also includes assessing the accounting principles used and significant estimates made by management, as well as evaluating the overall financial statement presentation. We believe that our audits provide a reasonable basis for our opinion.
In our opinion, such consolidated financial statements present fairly, in all material respects, the financial position of Mead Johnson Nutrition Company and subsidiaries as of December 31, 2010 and 2009, and the results of their operations and their cash flows for each of the three years in the period ended December 31, 2010, in conformity with accounting principles generally accepted in the United States of America. Also, in our opinion, such financial statement schedule, when considered in relation to the basic consolidated financial statements taken as a whole, presents fairly, in all material respects, the information set forth therein.
As discussed in Note 20 to the consolidated financial statements, the financial statements include allocations of expenses from Bristol-Myers Squibb Company for the year ended December 31, 2008. These allocations may not be reflective of the actual level of costs or debt which would have been incurred had the Company operated as a separate entity apart from Bristol-Myers Squibb Company.
We have also audited, in accordance with the standards of the Public Company Accounting Oversight Board (United States), the Company’s internal control over financial reporting as of December 31, 2010, based on the criteria established in Internal Control—Integrated Framework issued by the Committee of Sponsoring Organizations of the Treadway Commission and our report dated February 16, 2011 expressed an unqualified opinion on the Company’s internal control over financial reporting.
/s/ DELOITTE & TOUCHE LLP
Chicago, Illinois
February 16, 2011
52
Table of Contents
REPORT OF INDEPENDENT REGISTERED PUBLIC ACCOUNTING FIRM
To the Board of Directors and Stockholders of
Mead Johnson Nutrition Company
Glenview, Illinois
We have audited the internal control over financial reporting of Mead Johnson Nutrition Company and subsidiaries (the “Company”) as of December 31, 2010, based on criteria established in Internal Control — Integrated Framework issued by the Committee of Sponsoring Organizations of the Treadway Commission. The Company’s management is responsible for maintaining effective internal control over financial reporting and for its assessment of the effectiveness of internal control over financial reporting, included in the accompanying Management’s Report on Internal Control Over Financial Reporting. Our responsibility is to express an opinion on the Company’s internal control over financial reporting based on our audit.
We conducted our audit in accordance with the standards of the Public Company Accounting Oversight Board (United States). Those standards require that we plan and perform the audit to obtain reasonable assurance about whether effective internal control over financial reporting was maintained in all material respects. Our audit included obtaining an understanding of internal control over financial reporting, assessing the risk that a material weakness exists, testing and evaluating the design and operating effectiveness of internal control based on the assessed risk, and performing such other procedures as we considered necessary in the circumstances. We believe that our audit provides a reasonable basis for our opinion.
A company’s internal control over financial reporting is a process designed by, or under the supervision of, the company’s principal executive and principal financial officers, or persons performing similar functions, and effected by the company’s board of directors, management, and other personnel to provide reasonable assurance regarding the reliability of financial reporting and the preparation of financial statements for external purposes in accordance with generally accepted accounting principles. A company’s internal control over financial reporting includes those policies and procedures that (1) pertain to the maintenance of records that, in reasonable detail, accurately and fairly reflect the transactions and dispositions of the assets of the company; (2) provide reasonable assurance that transactions are recorded as necessary to permit preparation of financial statements in accordance with generally accepted accounting principles, and that receipts and expenditures of the company are being made only in accordance with authorizations of management and directors of the company; and (3) provide reasonable assurance regarding prevention or timely detection of unauthorized acquisition, use, or disposition of the company’s assets that could have a material effect on the financial statements.
Because of the inherent limitations of internal control over financial reporting, including the possibility of collusion or improper management override of controls, material misstatements due to error or fraud may not be prevented or detected on a timely basis. Also, projections of any evaluation of the effectiveness of the internal control over financial reporting to future periods are subject to the risk that the controls may become inadequate because of changes in conditions, or that the degree of compliance with the policies or procedures may deteriorate.
In our opinion, the Company maintained, in all material respects, effective internal control over financial reporting as of December 31, 2010, based on the criteria established in Internal Control — Integrated Framework issued by the Committee of Sponsoring Organizations of the Treadway Commission.
We have also audited, in accordance with the standards of the Public Company Accounting Oversight Board (United States), the consolidated financial statements and financial statement schedule as of and for the year ended December 31, 2010 of the Company and our report dated February 16, 2011 expressed an unqualified opinion on those financial statements and financial statement schedule.
/s/ DELOITTE & TOUCHE LLP
Chicago, Illinois
February 16, 2011
53
Table of Contents
AUDITED CONSOLIDATED FINANCIAL STATEMENTS OF MEAD JOHNSON NUTRITION COMPANY
MEAD JOHNSON NUTRITION COMPANY
CONSOLIDATED STATEMENTS OF EARNINGS
YEARS ENDED DECEMBER 31, 2010, 2009, AND 2008
(Dollars and shares in millions, except per share data)
| December 31, | ||||||||||||
| 2010 | 2009 | 2008 | ||||||||||
| NET SALES |
$ | 3,141.6 | $ | 2,826.5 | $ | 2,882.4 | ||||||
| COST OF PRODUCTS SOLD |
1,149.6 | 974.7 | 1,079.8 | |||||||||
| GROSS PROFIT |
1,992.0 | 1,851.8 | 1,802.6 | |||||||||
| EXPENSES: |
||||||||||||
| SELLING, GENERAL AND ADMINISTRATIVE |
762.7 | 665.3 | 651.7 | |||||||||
| ADVERTISING AND PROMOTION |
438.7 | 401.9 | 369.3 | |||||||||
| RESEARCH AND DEVELOPMENT |
78.5 | 71.9 | 72.8 | |||||||||
| OTHER EXPENSES/(INCOME)—NET |
29.2 | 33.1 | 13.1 | |||||||||
| EARNINGS BEFORE INTEREST AND INCOME TAXES |
682.9 | 679.6 | 695.7 | |||||||||
| INTEREST EXPENSE—NET |
48.6 | 92.6 | 43.3 | |||||||||
| EARNINGS BEFORE INCOME TAXES |
634.3 | 587.0 | 652.4 | |||||||||
| PROVISION FOR INCOME TAXES |
176.1 | 176.4 | 251.4 | |||||||||
| NET EARNINGS |
458.2 | 410.6 | 401.0 | |||||||||
| Less Net Earnings attributable to noncontrolling interests |
5.5 | 11.0 | 7.1 | |||||||||
| NET EARNINGS ATTRIBUTABLE TO SHAREHOLDERS |
$ | 452.7 | $ | 399.6 | $ | 393.9 | ||||||
| Earnings per share—basic |
||||||||||||
| Net Earnings attributable to shareholders |
$ | 2.20 | $ | 1.99 | $ | 2.32 | ||||||
| Earnings per share—diluted |
||||||||||||
| Net Earnings attributable to shareholders |
$ | 2.20 | $ | 1.99 | $ | 2.32 | ||||||
| Weighted average shares |
204.7 | 200.6 | 170.0 | |||||||||
| Dividends declared per share |
$ | 0.90 | $ | 0.70 | ||||||||
The accompanying notes are an integral part of these financial statements.
54
Table of Contents
MEAD JOHNSON NUTRITION COMPANY
CONSOLIDATED BALANCE SHEETS
DECEMBER 31, 2010 AND 2009
(Dollars and shares in millions, except per share data)
| December 31, | ||||||||
| 2010 | 2009 | |||||||
| ASSETS |
||||||||
| CURRENT ASSETS: |
||||||||
| Cash and Cash Equivalents |
$ | 595.6 | $ | 561.1 | ||||
| Receivables—net of allowances of $8.3 and $6.2, respectively |
352.0 | 317.6 | ||||||
| Note Receivable |
— | 30.0 | ||||||
| Inventories |
356.7 | 309.9 | ||||||
| Deferred Income Taxes—net of valuation allowance |
97.9 | 89.4 | ||||||
| Income Taxes Receivable |
15.6 | 5.6 | ||||||
| Prepaid Expenses and Other Assets |
31.2 | 22.5 | ||||||
| Total Current Assets |
1,449.0 | 1,336.1 | ||||||
| Property, Plant, and Equipment—net |
550.5 | 501.4 | ||||||
| Goodwill |
117.5 | 117.5 | ||||||
| Other Intangible Assets—net |
80.3 | 50.5 | ||||||
| Deferred Income Taxes—net of valuation allowance |
13.4 | 16.0 | ||||||
| Other Assets |
82.4 | 48.8 | ||||||
| TOTAL |
$ | 2,293.1 | $ | 2,070.3 | ||||
| LIABILITIES AND EQUITY (DEFICIT) |
||||||||
| CURRENT LIABILITIES: |
||||||||
| Short-Term Borrowings |
$ | 1.2 | $ | 120.0 | ||||
| Accounts Payable |
365.8 | 361.3 | ||||||
| Dividends Payable |
46.3 | 41.0 | ||||||
| Accrued Expenses |
208.7 | 206.6 | ||||||
| Accrued Rebates and Returns |
278.9 | 268.2 | ||||||
| Deferred Income—current |
37.0 | 19.9 | ||||||
| Income Taxes—payable and deferred |
38.2 | 83.2 | ||||||
| Total Current Liabilities |
976.1 | 1,100.2 | ||||||
| Long-Term Debt |
1,532.5 | 1,484.9 | ||||||
| Deferred Income—noncurrent |
2.1 | 2.8 | ||||||
| Deferred Income Taxes—noncurrent |
42.6 | 5.1 | ||||||
| Pension, Post Retirement and Post Employment Liabilities |
71.7 | 123.6 | ||||||
| Other Liabilities |
26.4 | 18.0 | ||||||
| Total Liabilities |
2,651.4 | 2,734.6 | ||||||
| COMMITMENTS AND CONTINGENCIES |
||||||||
| EQUITY (DEFICIT) |
||||||||
| Shareholders’ Equity |
||||||||
| Common Stock, $0.01 par value: 4,200 authorized, 204.8 and 204.5 issued, respectively |
2.0 | 2.0 | ||||||
| Additional Paid-in (Distributed) Capital |
(775.6 | ) | (797.4 | ) | ||||
| Retained Earnings |
474.0 | 206.1 | ||||||
| Treasury Stock—at cost |
(3.2 | ) | — | |||||
| Accumulated Other Comprehensive Income (Loss) |
(64.6 | ) | (85.6 | ) | ||||
| Total Shareholders’ Equity (Deficit) |
(367.4 | ) | (674.9 | ) | ||||
| Noncontrolling Interests |
9.1 | 10.6 | ||||||
| Total Equity (Deficit) |
(358.3 | ) | (664.3 | ) | ||||
| TOTAL |
$ | 2,293.1 | $ | 2,070.3 | ||||
The accompanying notes are an integral part of these financial statements.
55
Table of Contents
MEAD JOHNSON NUTRITION COMPANY
CONSOLIDATED STATEMENTS OF COMPREHENSIVE INCOME AND EQUITY (DEFICIT)
YEARS ENDED DECEMBER 31, 2010, 2009, AND 2008
(Dollars in millions)
| Total Equity (Deficit) |
BMS Investment |
Common Stock |
Additional Paid-in (Distributed) Capital |
Retained Earnings |
Treasury Stock |
Non-controlling Interests |
Accumulated Other Comprehensive Income (Loss) |
Comprehensive Income |
||||||||||||||||||||||||||||
| BALANCE—January 1, 2008 |
$ | 637.8 | $ | 609.4 | $ | — | $ | — | $ | — | $ | — | $ | 7.0 | $ | 21.4 | ||||||||||||||||||||
| Net transfers (to) from BMS |
(388.7 | ) | (388.7 | ) | ||||||||||||||||||||||||||||||||
| Related party debt |
(2,000.0 | ) | (2,000.0 | ) | ||||||||||||||||||||||||||||||||
| Distributions to noncontrolling interest |
(11.7 | ) | (11.7 | ) | ||||||||||||||||||||||||||||||||
| Comprehensive income: |
||||||||||||||||||||||||||||||||||||
| Net earnings |
401.0 | 393.9 | 7.1 | $ | 401.0 | |||||||||||||||||||||||||||||||
| Foreign currency translation adjustment, net of tax, $6.5 |
(39.1 | ) | 3.0 | (42.1 | ) | (42.1 | ) | |||||||||||||||||||||||||||||
| Deferred gains (losses) on derivatives qualifying as hedges, net of tax of $(1.9) |
5.2 | 5.2 | 5.2 | |||||||||||||||||||||||||||||||||
| Total comprehensive income |
364.1 | |||||||||||||||||||||||||||||||||||
| Less: comprehensive income attributable to noncontrolling interests |
7.1 | |||||||||||||||||||||||||||||||||||
| Comprehensive income attributable to shareholders |
$ | 357.0 | ||||||||||||||||||||||||||||||||||
| BALANCE—December 31, 2008 |
$ | (1,395.5 | ) | $ | (1,385.4 | ) | $ | — | $ | — | $ | — | $ | — | $ | 5.4 | $ | (15.5 | ) | |||||||||||||||||
| Net transfers (to) from BMS |
(241.5 | ) | (290.2 | ) | 48.7 | |||||||||||||||||||||||||||||||
| Conversion of BMS investment in Common Stock |
— | 1,624.2 | 1.7 | (1,644.6 | ) | 18.7 | ||||||||||||||||||||||||||||||
| Issuance of Common Stock in connection with initial public offering, net of offering costs |
782.3 | 0.3 | 782.0 | |||||||||||||||||||||||||||||||||
| Stock-based compensation awards |
17.7 | 1.2 | 16.5 | |||||||||||||||||||||||||||||||||
| Distributions to noncontrolling interests |
(5.8 | ) | (5.8 | ) | ||||||||||||||||||||||||||||||||
| Assumptions of accumulated unrealized gains (losses) on pension and other post retirement benefits, net of tax of $54.7 |
(97.5 | ) | (97.5 | ) | ||||||||||||||||||||||||||||||||
| Cash dividends declared |
(143.3 | ) | (143.3 | ) | ||||||||||||||||||||||||||||||||
| Comprehensive income: |
||||||||||||||||||||||||||||||||||||
| Net earnings, January 1, 2009 – February 10, 2009 |
50.2 | 50.2 | $ | 50.2 | ||||||||||||||||||||||||||||||||
| Net earnings, February 11, 2009 – December 31, 2009 |
360.4 | 349.4 | 11.0 | 360.4 | ||||||||||||||||||||||||||||||||
| Foreign currency translation adjustment, net of tax of $(2.8) |
25.9 | 25.9 | 25.9 | |||||||||||||||||||||||||||||||||
| Deferred gains (losses) on derivatives qualifying as hedges, net of tax of $2.9 |
(8.1 | ) | (8.1 | ) | (8.1 | ) | ||||||||||||||||||||||||||||||
| Deferred gains (losses) on pension and other post retirement benefits, net of tax of $6.4 |
(9.1 | ) | (9.1 | ) | (9.1 | ) | ||||||||||||||||||||||||||||||
| Total comprehensive income |
419.3 | |||||||||||||||||||||||||||||||||||
| Less: comprehensive income attributable to noncontrolling interests |
11.0 | |||||||||||||||||||||||||||||||||||
| Comprehensive income attributable to shareholders |
$ | 408.3 | ||||||||||||||||||||||||||||||||||
| BALANCE—December 31, 2009 |
$ | (664.3 | ) | $ | — | $ | 2.0 | $ | (797.4 | ) | $ | 206.1 | $ | — | $ | 10.6 | $ | (85.6 | ) | |||||||||||||||||
| Stock-based compensation awards |
21.8 | 21.8 | ||||||||||||||||||||||||||||||||||
| Treasury Stock Acquired |
(3.2 | ) | (3.2 | ) | ||||||||||||||||||||||||||||||||
| Distributions to noncontrolling interests |
(6.7 | ) | (6.7 | ) | ||||||||||||||||||||||||||||||||
| Cash dividends declared |
(184.8 | ) | (184.8 | ) | ||||||||||||||||||||||||||||||||
| Comprehensive income: |
||||||||||||||||||||||||||||||||||||
| Net earnings |
458.2 | 452.7 | 5.5 | $ | 458.2 | |||||||||||||||||||||||||||||||
| Foreign currency translation adjustment, net of tax, of $(9.5) |
5.2 | (0.3 | ) | 5.5 | 5.5 | |||||||||||||||||||||||||||||||
| Deferred gains (losses) on derivatives qualifying as hedges, net of tax of $(0.4) |
1.1 | 1.1 | 1.1 | |||||||||||||||||||||||||||||||||
| Deferred gains (losses) on pension and other post retirement benefits, net of tax of $(4.5) |
14.4 | 14.4 | 14.4 | |||||||||||||||||||||||||||||||||
| Total comprehensive income |
479.2 | |||||||||||||||||||||||||||||||||||
| Less: comprehensive income attributable to noncontrolling interests |
5.5 | |||||||||||||||||||||||||||||||||||
| Comprehensive income attributable to shareholders |
$ | 473.7 | ||||||||||||||||||||||||||||||||||
| BALANCE—December 31, 2010 |
$ | (358.3 | ) | $ | — | $ | 2.0 | $ | (775.6 | ) | $ | 474.0 | $ | (3.2 | ) | $ | 9.1 | $ | (64.6 | ) | ||||||||||||||||
The accompanying notes are an integral part of these consolidated financial statements.
56
Table of Contents
MEAD JOHNSON NUTRITION COMPANY
CONSOLIDATED STATEMENTS OF CASH FLOWS
YEARS ENDED DECEMBER 31, 2010, 2009, AND 2008
(Dollars in millions)
| December 31, | ||||||||||||
| 2010 | 2009 | 2008 | ||||||||||
| CASH FLOWS FROM OPERATING ACTIVITIES: |
||||||||||||
| Net Earnings |
$ | 458.2 | $ | 410.6 | $ | 401.0 | ||||||
| Adjustments to Reconcile Net Earnings to Net Cash Provided by Operating Activities: |
||||||||||||
| Depreciation and Amortization |
64.7 | 58.9 | 52.1 | |||||||||
| Stock-Based Compensation Expense |
19.7 | 17.7 | 9.2 | |||||||||
| Deferred Income Tax |
19.2 | (20.5 | ) | 6.0 | ||||||||
| Gain on Sale of Intangible Assets |
— | (11.9 | ) | — | ||||||||
| Exchange Loss from Devaluation |
8.5 | — | — | |||||||||
| Other |
6.9 | 1.1 | 0.5 | |||||||||
| Change in Assets and Liabilities: |
||||||||||||
| Receivables |
(34.8 | ) | (31.8 | ) | (0.9 | ) | ||||||
| Inventories |
(40.4 | ) | 45.9 | (79.9 | ) | |||||||
| Accounts Payable |
78.6 | 19.3 | 47.0 | |||||||||
| Accrued Expenses, Rebates and Returns |
21.2 | 73.8 | 48.2 | |||||||||
| Income Taxes Payable |
(69.5 | ) | 37.5 | 4.4 | ||||||||
| Other Assets and Liabilities |
37.4 | 3.2 | 1.4 | |||||||||
| Pension and Other Post Retirement Benefits Contributions |
(55.5 | ) | (27.2 | ) | — | |||||||
| Net Cash Provided by Operating Activities |
514.2 | 576.6 | 489.0 | |||||||||
| CASH FLOWS FROM INVESTING ACTIVITIES: |
||||||||||||
| Payments for Capital Expenditures |
(172.4 | ) | (95.8 | ) | (81.1 | ) | ||||||
| Proceeds from Sale of Property, Plant and Equipment |
3.3 | 2.6 | 1.7 | |||||||||
| Proceeds from Sale of Intangible Asset |
— | 11.9 | — | |||||||||
| Investment in Other Companies |
(5.5 | ) | — | — | ||||||||
| Net Cash Used in Investing Activities |
(174.6 | ) | (81.3 | ) | (79.4 | ) | ||||||
| CASH FLOWS FROM FINANCING ACTIVITIES: |
||||||||||||
| Proceeds from Short-term Borrowings |
134.7 | 200.0 | — | |||||||||
| Repayments of Short-term Borrowings |
(253.5 | ) | (80.0 | ) | — | |||||||
| Payment for Capital Lease Termination |
(47.0 | ) | — | — | ||||||||
| Payments of Dividends |
(179.6 | ) | (102.3 | ) | — | |||||||
| Proceeds from Stock Option Exercises |
2.1 | — | — | |||||||||
| Purchases of Treasury Stock |
(2.0 | ) | — | — | ||||||||
| Proceeds from Termination of Interest Rate Swaps |
15.6 | — | — | |||||||||
| Proceeds from Initial Public Offering, net of offering costs |
— | 782.3 | — | |||||||||
| Repayment of Related Party Debt and Lease |
— | (2,348.1 | ) | — | ||||||||
| Promissory Note from BMS |
30.0 | (30.0 | ) | — | ||||||||
| Net Transfers (to) from BMS, excluding non-cash items |
— | 137.7 | (397.9 | ) | ||||||||
| Long-term Debt Borrowings, net of original issue discount |
— | 1,495.3 | — | |||||||||
| Distributions to Noncontrolling Interests |
(6.7 | ) | (5.8 | ) | (11.7 | ) | ||||||
| Net Cash Provided by (Used in) Financing Activities |
(306.4 | ) | 49.1 | (409.6 | ) | |||||||
| Effects of Changes in Exchange Rates on Cash and Cash Equivalents |
1.3 | 16.7 | — | |||||||||
| NET INCREASE IN CASH AND CASH EQUIVALENTS |
34.5 | 561.1 | — | |||||||||
| CASH AND CASH EQUIVALENTS: |
||||||||||||
| Beginning of Year |
561.1 | — | — | |||||||||
| End of Year |
$ | 595.6 | $ | 561.1 | $ | — | ||||||
| SUPPLEMENTAL DISCLOSURES OF CASH FLOW INFORMATION: |
||||||||||||
| Noncash Financing Activities—Related Party Debt Issuance/(Reduction) |
$ | — | $ | (250.0 | ) | $ | 2,000.0 | |||||
The accompanying notes are an integral part of these financial statements.
57
Table of Contents
MEAD JOHNSON NUTRITION COMPANY
NOTES TO CONSOLIDATED FINANCIAL STATEMENTS
AS OF DECEMBER 31, 2010 AND 2009 AND FOR THE YEARS ENDED
DECEMBER 31, 2010, 2009, AND 2008
| 1. | ORGANIZATION |
Mead Johnson Nutrition Company manufactures, distributes and sells infant formulas, children’s nutrition and other nutritional products. Mead Johnson Nutrition Company has a broad product portfolio, which extends across routine and specialty infant formulas, children’s milks and milk modifiers, pediatric vitamins, dietary supplements for pregnant and breastfeeding mothers, and products for metabolic disorders. These products are generally sold to wholesalers and retailers and are promoted to healthcare professionals, and, where permitted by regulation or policy, directly to consumers.
| 2. | INITIAL PUBLIC OFFERING AND SEPARATION ACTIVITIES |
On February 17, 2009, Mead John Nutrition Company completed the initial public offering (IPO) of 34.5 million shares of Class A common stock at a price of $24.00 per share. The net proceeds from the IPO, after deducting a total of $45.7 million of underwriting discounts, commissions and offering expenses, totaled $782.3 million. All of the net proceeds of the IPO were used to settle pre-existing obligations to the Company’s former parent, Bristol-Myers Squibb Company (BMS).
Immediately following the IPO, there were 76.8 million outstanding shares of Class A common stock and 127.7 million outstanding shares of Class B common stock. Of the Class A and Class B common stock outstanding immediately following the IPO, BMS beneficially owned 42.3 million shares of Class A common stock and all of the Class B common stock. This represented 83.1% of the total outstanding shares of combined common stock, and 97.5% of the combined voting power.
On November 15, 2009, BMS announced an exchange offer whereby BMS shareholders could exchange a portion of BMS common stock for Mead Johnson Nutrition Company stock. Prior to the completion of the exchange offer, BMS converted all the Class B common stock into Class A common stock. The exchange offer was completed on December 23, 2009, resulting in the split-off of Mead Johnson Nutrition Company and the disposal of BMS’s entire ownership and voting interest.
Expensed transaction costs for the IPO recorded within selling, general, and administrative expense for the years ended December 31, 2009 and 2008, were $31.0 million and $41.8 million, respectively.
| 3. | ACCOUNTING POLICIES |
Basis of Presentation—The financial statements present the results of operations, financial position, and cash flows of Mead Johnson Nutrition Company and its majority-owned and controlled subsidiaries (MJN or the Company). Intercompany transactions and accounts are eliminated in consolidation. Prior to the IPO, the financial statements were derived from the consolidated financial statements and records of BMS, principally from statements and records representing the MJN business. The Company prepared the accompanying consolidated financial statements in accordance with accounting principles generally accepted in the United States of America (GAAP).
Use of Estimates—The preparation of financial statements in conformity with GAAP requires the use of estimates and assumptions that affect the reported amounts of assets and liabilities, the disclosure of contingent assets and contingent liabilities at the date of the financial statements and the reported amounts of revenues and expenses during the reporting period. Estimates are used in revenue recognition, including sales rebate and return accruals, goodwill, income tax assets and liabilities, income tax expense, and legal liabilities, as well as the accounting for stock-based compensation costs and retirement and post retirement benefits, including the actuarial assumptions. Actual results may or may not differ from estimated results.
58
Table of Contents
Revenue Recognition—MJN recognizes revenue when substantially all the risks and rewards of ownership have transferred to the customer. Revenue is recognized on the date of receipt by the purchaser. Revenues are reduced at the time of recognition to reflect expected returns that are estimated based on historical experience and business trends. Additionally, provisions are made at the time of revenue recognition for discounts, Women, Infants and Children (WIC) rebates and estimated sales allowances based on historical experience, updated for changes in facts and circumstances, as appropriate. Such provisions are recorded as a reduction of revenue. The Company offers sales incentives to customers and consumers through various programs consisting primarily of customer pricing allowances, merchandising funds and consumer coupons. Provisions are made at the time of revenue recognition for these items based on historical experience, updated for changes in facts and circumstances, as appropriate. Such provisions are recorded as a reduction of revenue.
WIC rebate accruals were $195.3 million and $199.9 million at December 31, 2010 and 2009, respectively, and are included in accrued rebates and returns on the Company’s balance sheet. MJN participates on a competitive bidding basis in nutrition programs sponsored by states, tribal governments, the Commonwealth of Puerto Rico, and U.S. territories for WIC. Under these programs, MJN reimburses these entities for the difference between wholesaler list price and the contract price on eligible products. The Company accounts for WIC rebates by establishing an accrual in an amount equal to the Company’s estimate of WIC rebate claims attributable to a sale. MJN determines its estimate of the WIC rebate accrual primarily based on historical experience regarding WIC rebates and current contract prices under the WIC programs. The Company considers levels of inventory in the distribution channel, new WIC contracts, terminated WIC contracts, changes in existing WIC contracts and WIC participation, and adjusts the accrual periodically throughout the year to reflect actual expense. Rebates under the WIC program reduced revenues by $680.8 million, $735.7 million, and $796.0 million in the years ended December 31, 2010, 2009, and 2008, respectively.
Sales return accruals were $43.5 million and $33.9 million at December 31, 2010 and 2009, respectively, and are included in accrued rebates and returns on the Company’s balance sheet. The Company accounts for sales returns by establishing an accrual in an amount equal to its estimate of sales recorded for which the related products are expected to be returned. The Company determines its estimate of the sales return accrual primarily based on historical experience regarding sales returns, but also considers other factors that could impact sales returns such as discontinuations and new product introductions. Returns reduced sales by $84.3 million, $72.0 million, and $64.7 million for the years ended December 31, 2010, 2009 and 2008, respectively.
Income Taxes—The income tax provision prepared in the post split-off period reflects a separate return methodology based on the legal entity structure where the Company is a separate taxpayer in the respective jurisdictions. The income tax provision prepared in the period following the IPO but preceding the split-off reflects a separate return methodology based on the legal entity structure as if the Company were a separate taxpayer in the respective jurisdictions with certain accommodations pursuant to a tax matters agreement as noted below. This is in contrast to the pre-IPO period in which the income tax provision was prepared on a separate return stand-alone methodology reflecting a hypothetical legal entity structure in which the Company was included in the tax grouping of other BMS entities within the respective entity’s tax jurisdiction.
The provision for income taxes has been determined using the asset and liability approach of accounting for income taxes. Under this approach, deferred taxes represent the future tax consequences expected to occur when the reported amounts of assets and liabilities are recovered or paid. The provision for income taxes represents income taxes paid or payable for the current year plus the change in deferred taxes during the year. Deferred taxes result from differences between the financial and tax basis of the Company’s assets and liabilities. Deferred tax assets and liabilities are measured using the currently enacted tax rates that apply to taxable earnings in effect for the years in which those tax attributes are expected to be recovered or paid, and are adjusted for changes in tax rates and tax laws when changes are enacted.
Valuation allowances are recorded to reduce deferred tax assets when it is more likely than not that a tax benefit will not be realized. The assessment of whether or not a valuation allowance is required often requires significant judgment. Adjustments to the deferred tax valuation allowances are made to earnings in the period when such assessments are made.
59
Table of Contents
In the pre-IPO period, with the exception of MJN-dedicated entities, the Company did not maintain taxes payable to or from BMS as the Company was deemed to settle the annual current tax balances immediately with the tax paying legal entities in the respective jurisdictions. These settlements were reflected as changes in equity (deficit).
On February 10, 2009, MJN entered into a tax matters agreement with BMS. This agreement governs the tax relationship between the Company and BMS for the tax periods through the December 23, 2009 split-off of the Company from BMS. Under this agreement, responsibility is allocated between BMS and MJN for the payment of taxes resulting from filing (i) tax returns on a combined, consolidated or unitary basis and (ii) single entity tax returns for entities that have both MJN and non-MJN operations. Accordingly, BMS prepares returns for MJN for all periods during which MJN was included in a combined, consolidated or unitary group with BMS for federal, state, local or foreign tax purposes, as if MJN itself were filing as a combined, consolidated or unitary group. BMS also prepares returns for the Company for all periods during which a single-entity tax return was filed for an entity that has both MJN and non-MJN operations. MJN makes payments to BMS and BMS makes payments to the Company with respect to such returns, as if such returns were actually required to be filed under the laws of the applicable taxing jurisdiction and BMS were the relevant taxing authority of such jurisdiction.
On December 18, 2009, the Company and BMS entered into an Amended and Restated Tax Matters Agreement in anticipation of the split-off from BMS. With respect to the period before the split-off, the Amended and Restated Tax Matters Agreement allocates the responsibility of BMS and MJN for the payment of taxes in the same manner as discussed above with respect to the tax matters agreement. Pursuant to the Amended and Restated Tax Matters Agreement, the Company has consented to join BMS in electing to allocate items ratably between the portion of the taxable year in which the Company was included in the BMS consolidated tax group, and the short period beginning after the split-off and ending on December 31, 2009, when the Company was a separate taxpayer. Additionally under the Amended and Restated Tax Matters Agreement, BMS has agreed to indemnify the Company for (i) any tax attributable to a MJN legal entity for any taxable period ending on or before December 31, 2008, (ii) any tax arising solely as a result of the IPO and the restructuring preceding the IPO, and (iii) any transaction tax associated with the split-off transaction. The Company has agreed to indemnify BMS for (i) any tax payable with respect to any separate return that the Company is required to file or cause to be filed, (ii) any tax incurred as a result of any gain which may be recognized by a member of the BMS affiliated group with respect to a transfer of certain foreign affiliates by the Company in preparation for the IPO, and (iii) any tax arising from the failure or breach of any representation or covenant made by the Company which failure or breach results in the intended tax consequences of the split-off transaction not being achieved. The Company recorded as an equity contribution certain deferred tax assets received from BMS as a result of the split-off.
Cash and Cash Equivalents—Cash and cash equivalents consist of bank deposits, time deposits and money market funds. The Company maintains cash and cash equivalent balances in U.S. dollars and foreign currencies, which are subject to currency rate risk. Cash equivalents are primarily highly liquid investments with original maturities of three months or less at the time of purchase and are recorded at cost, which approximates fair value. Money market funds, which totaled $246.8 million and $275.1 million as of December 31, 2010 and 2009, respectively, are classified as level two in the fair value hierarchy.
Inventory Valuation—Inventories are stated at average cost, not in excess of market.
Capital Assets and Depreciation—Expenditures for additions and improvements are capitalized at cost. Depreciation is generally computed on a straight-line method based on the estimated useful lives of the related assets. The estimated useful lives of the major classes of depreciable assets are 50 years for buildings and 3 to 40 years for machinery, equipment, and fixtures. Maintenance and repair costs are expensed as incurred.
Capitalized Software—Certain costs to obtain internal use software for significant systems projects are capitalized and amortized on a straight-line basis over the estimated useful life of the software, which ranges from 3 to 7 years. Costs to obtain software for projects that are not significant are expensed as incurred.
60
Table of Contents
Impairment of Long-Lived Assets—The Company periodically evaluates whether current facts or circumstances indicate that the carrying value of its depreciable assets to be held and used may not be recoverable. If such circumstances are determined to exist, an estimate of undiscounted future cash flows produced by the long-lived asset, or the appropriate grouping of assets, is compared to the carrying value to determine whether impairment exists. If an asset is determined to be impaired, the loss is measured based on the difference between the asset’s fair value and its carrying value. An estimate of the asset’s fair value is based on quoted market prices in active markets, if available. If quoted market prices are not available, the estimate of fair value is based on various valuation techniques, including a discounted value of estimated future cash flows. The Company reports an asset to be disposed of at the lower of its cost less accumulated depreciation or its estimated net realizable value.
Goodwill—Goodwill is tested for impairment using a two-step process on an annual basis or when current facts or circumstances indicate that a potential impairment may exist. The first step is to identify a potential impairment, and the second step measures the amount of the impairment loss, if any. Goodwill is deemed to be impaired if the carrying amount of a reporting unit’s goodwill exceeds its estimated fair value. The Company completes its annual goodwill impairment assessment during the first quarter and monitors for any potential impairment in the remaining quarters, none of which indicated an impairment of goodwill in 2010, 2009 or 2008.
Contingencies—In the ordinary course of business, the Company is subject to loss contingencies, such as lawsuits, investigations, government inquiries and claims, including, but not limited to, product liability claims, advertising disputes and inquiries, consumer fraud suits, other commercial disputes, premises claims and employment and environmental, health, and safety matters. The Company records accruals for such loss contingencies when it is probable that a liability will be incurred and the amount of loss can be reasonably estimated. The Company does not recognize gain contingencies until realized. Legal costs are expensed as incurred.
Derivative Financial Instruments—Derivative financial instruments are used by the Company principally in the management of its foreign currency and interest rate exposures. The Company does not hold or issue derivative financial instruments for speculative purposes.
The Company records all derivative instruments on the balance sheet at fair value. If the derivative is designated as a cash flow hedge, the effective portion of changes in the fair value is temporarily reported in accumulated other comprehensive income (loss) and is recognized in earnings when the hedged item affects earnings, in cost of products sold, or is deemed ineffective, in other expenses/income—net; cash flows are classified consistent with the underlying hedged item. The Company assesses effectiveness at the inception of the hedge and on a quarterly basis. These assessments determine whether derivatives designated as qualifying hedges continue to be highly effective in offsetting changes in the cash flows of hedged items. Any ineffective portion of the change in fair value is included in current period earnings. The Company will discontinue cash flow hedge accounting when the forecasted transaction is no longer probable of occurring on the originally forecasted date, or 60 days thereafter, or when the hedge is no longer effective. If the derivative is designated as a fair value hedge, both the changes in the fair value of the derivative and of the hedged item attributable to the hedged risk are recognized in the consolidated statements of earnings; cash flows are classified consistent with the underlying hedged item.
The Company designates and assigns derivatives as hedges of forecasted transactions, specific assets or specific liabilities. When hedged assets or liabilities are sold or extinguished or the forecasted transactions being hedged are no longer expected to occur, the Company immediately recognizes the gain or loss on the designated hedging financial instruments in the consolidated statements of earnings.
Pension and Other Post Retirement Benefits—The funded status of the Company’s defined pension and post retirement benefit plans is measured as the difference between the fair value of plan assets and the benefit obligation. For the defined benefit plans, the benefit obligation is the projected benefit obligation; for any other defined benefit post retirement plans, the benefit obligation is the accumulated post retirement benefit obligation.
61
Table of Contents
The net over- or under-funded status is recognized as an asset or a liability on the balance sheet. Any unrecognized actuarial gain or loss, or service cost or benefit is reported as a component of accumulated other comprehensive income (loss).
Shipping and Handling Costs—The Company typically does not charge customers for shipping and handling costs. Shipping and handling costs, including warehousing expenses, were $75.8 million, $68.5 million, and $82.9 million in the years ended December 31, 2010, 2009, and 2008, respectively, and are included in selling, general and administrative expenses.
Advertising Costs—Advertising costs are expensed as incurred and were $155.3 million, $136.9 million, and $115.3 million in the years ended December 31, 2010, 2009, and 2008, respectively.
Research and Development—Research and development costs are expensed as incurred.
Foreign Currency Translation—The statements of earnings of the Company’s foreign subsidiaries whose functional currencies are other than the U.S. dollar are translated into U.S. dollars using average exchange rates for the period. The net assets of the Company’s foreign subsidiaries whose functional currencies are other than the U.S. dollar are translated into U.S. dollars using exchange rates as of the balance sheet date. The U.S. dollar effects that arise from translating the net assets of these subsidiaries at changing rates are recorded in the foreign currency translation adjustment account, which is included in accumulated other comprehensive income (loss).
Recently Issued Accounting Standards—Effective January 1, 2010, the Company adopted Accounting Standards Update (ASU) No. 2009-17, Consolidations (Topic 810), requiring companies to identify the primary beneficiary of a variable interest entity as the enterprise that has both the power to direct the activities of a variable interest entity that most significantly impacts the entity’s economic performance, and the obligation to absorb losses or the right to receive benefits of the entity that could potentially be significant to the variable interest entity. The Company also adopted ASU No. 2009-17’s requirement of on-going reassessments of whether an enterprise is the primary beneficiary and the elimination of the quantitative approach previously required for determining the primary beneficiary. The Company is not a primary beneficiary of any variable interest entities.
| 4. | EARNINGS PER SHARE |
The numerator for basic and diluted earnings per share is net earnings attributable to shareholders reduced by dividends and undistributed earnings attributable to unvested shares. The denominator for basic earnings per share is the weighted average number of shares outstanding during the period. The denominator for diluted earnings per share is the weighted average shares outstanding adjusted for the effect of dilutive stock options, restricted stock units and performance share awards. On February 17, 2009, the Company completed an IPO of 34.5 million shares of common stock. Immediately prior to the IPO, 170.0 million shares of common stock were outstanding and owned by BMS. There were no Company stock options, restricted stock units, or performance shares outstanding prior to the IPO.
62
Table of Contents
The following table presents the calculation of basic and diluted earnings per share:
| Years Ended December 31, | ||||||||||||
| (In millions, except per share data) | 2010 | 2009 | 2008 | |||||||||
| Basic earnings per share: |
||||||||||||
| Weighted average shares outstanding |
204.7 | 200.6 | 170.0 | |||||||||
| Net earnings attributable to shareholders |
$ | 452.7 | $ | 399.6 | $ | 393.9 | ||||||
| Dividends and undistributed earnings attributable to unvested shares |
(1.4 | ) | (0.7 | ) | — | |||||||
| Net earnings attributable to shareholders used for basic earnings per share calculation |
$ | 451.3 | $ | 398.9 | $ | 393.9 | ||||||
| Net earnings attributable to shareholders per share |
$ | 2.20 | $ | 1.99 | $ | 2.32 | ||||||
| Diluted earnings per share: |
||||||||||||
| Weighted average shares outstanding |
204.7 | 200.6 | 170.0 | |||||||||
| Incremental shares outstanding assuming the exercise/vesting of dilutive stock options/performance shares |
0.4 | 0.1 | — | |||||||||
| Weighted average shares – diluted |
205.1 | 200.7 | 170.0 | |||||||||
| Net earnings attributable to shareholders |
$ | 452.7 | $ | 399.6 | $ | 393.9 | ||||||
| Dividends and undistributed earnings attributable to unvested shares |
(1.4 | ) | (0.7 | ) | — | |||||||
| Net earnings attributable to shareholders used for diluted earnings per share calculation |
$ | 451.3 | $ | 398.9 | $ | 393.9 | ||||||
| Net earnings attributable to shareholders per share |
$ | 2.20 | $ | 1.99 | $ | 2.32 | ||||||
Potential shares outstanding were 2.3 million and 1.7 million as of December 31, 2010 and 2009, respectively, of which 1.9 million and 1.6 million were not included in the diluted earnings per share calculation for the year ended December 31, 2010 and 2009, respectively.
| 5. | OTHER EXPENSES/(INCOME)—NET |
The components of other expenses/(income)—net were:
| Years Ended December 31, | ||||||||||||
| (In millions) | 2010 | 2009 | 2008 | |||||||||
| Loss from third-party contract manufacturing |
$ | 7.2 | $ | 7.7 | $ | 6.0 | ||||||
| Foreign exchange losses—net |
2.9 | 11.4 | 1.8 | |||||||||
| Gain on sale of non-strategic intangible asset |
— | (11.9 | ) | — | ||||||||
| Severance and other costs |
5.1 | 14.7 | — | |||||||||
| Pension Settlement |
10.6 | 10.6 | — | |||||||||
| Other—net |
3.4 | 0.6 | 5.3 | |||||||||
| Other expenses—net |
$ | 29.2 | $ | 33.1 | $ | 13.1 | ||||||
In January 2010, the Company recognized a loss of $8.5 million within other expenses/(income)—net due to both the devaluation of the Venezuela bolivar and the application of highly inflationary accounting. The Company has net monetary assets of approximately $10 million at December 31, 2010, which are exposed to further losses from devaluation of the Venezuela bolivar.
| 6. | INCOME TAXES |
A new legal entity structure was created to facilitate the IPO. As such, adjustments have been made to the income tax accounts and equity (deficit) during the year ended December 31, 2009, to reflect the impact of this restructuring.
63
Table of Contents
In the pre-IPO period, with the exception of MJN-dedicated entities, the Company did not maintain taxes payable to or from BMS as the Company was deemed to settle the annual current tax balances immediately with the tax paying legal entities in the respective jurisdictions. These settlements were reflected as changes in equity (deficit).
On February 10, 2009, the Company entered into a tax matters agreement with BMS. This agreement governs the tax relationship between the Company and BMS for the tax periods through the December 23, 2009 split-off of the Company from BMS. Under this agreement responsibility is allocated between BMS and MJN for the payment of taxes resulting from filing (i) tax returns on a combined, consolidated or unitary basis and (ii) single entity tax returns for entities that have both MJN and non-MJN operations. Accordingly, BMS prepares returns for MJN for all periods during which MJN was included in a combined, consolidated or unitary group with BMS for federal, state, local or foreign tax purposes, as if MJN itself were filing as a combined, consolidated or unitary group. BMS also prepares returns for the Company for all periods during which a single-entity tax return was filed for an entity that has both MJN and non-MJN operations. MJN makes payments to BMS and BMS makes payments to the Company with respect to such returns, as if such returns were actually required to be filed under the laws of the applicable taxing jurisdiction and BMS were the relevant taxing authority of such jurisdiction.
On December 18, 2009, the Company and BMS entered into an Amended and Restated Tax Matters Agreement in anticipation of the split-off from BMS. With respect to the period before the split-off, the Amended and Restated Tax Matters Agreement allocates the responsibility of BMS and MJN for the payment of taxes in the same manner as discussed above with respect to the tax matters agreement. Pursuant to the Amended and Restated Tax Matters Agreement, the Company has consented to join BMS in electing to allocate items ratably between the portion of the taxable year in which the Company was included in the BMS consolidated tax group, and the short period beginning after the split off and ending on December 31, 2009, when the Company is a separate taxpayer. Additionally under the Amended and Restated Tax Matters Agreement, BMS has agreed to indemnify the Company for (i) any tax attributable to a MJN legal entity for any taxable period ending on or before December 31, 2008, (ii) any tax arising solely as a result of the IPO and the restructuring preceding the IPO, and (iii) any transaction tax associated with the split-off transaction. The Company has agreed to indemnify BMS for (i) any tax payable with respect to any separate return that the Company is required to file or cause to be filed, (ii) any tax incurred as a result of any gain which may be recognized by a member of the BMS affiliated group with respect to a transfer of certain foreign affiliates by the Company in preparation for the IPO, and (iii) any tax arising from the failure or breach of any representation or covenant made by the Company which failure or breach results in the intended tax consequences of the split-off transaction not being achieved. As of December 31, 2010, the Company held a net receivable from BMS related to 2009 taxes of $0.1 million. As of December 31, 2009, the Company held a net payable to BMS of $12.0 million.
The components of earnings before income taxes were:
| Years Ended December 31, | ||||||||||||
| (In millions) | 2010 | 2009 | 2008 | |||||||||
| U.S. |
$ | 108.4 | $ | 134.0 | $ | 154.7 | ||||||
| Non-U.S. |
525.9 | 453.0 | 497.7 | |||||||||
| $ | 634.3 | $ | 587.0 | $ | 652.4 | |||||||
The above amounts are categorized based on the location of the taxing authorities.
64
Table of Contents
The provision (benefit) for income taxes attributable to operations consisted of:
| Years Ended December 31, | ||||||||||||
| (In millions) | 2010 | 2009 | 2008 | |||||||||
| Current: |
||||||||||||
| U.S. federal |
$ | 38.0 | $ | 79.2 | $ | 102.6 | ||||||
| U.S. states |
4.0 | 13.5 | 18.1 | |||||||||
| Non-U.S. |
114.9 | 104.2 | 124.7 | |||||||||
| 156.9 | 196.9 | 245.4 | ||||||||||
| Deferred: |
||||||||||||
| U.S. federal |
21.8 | (12.2 | ) | 1.2 | ||||||||
| U.S. states |
(0.8 | ) | (0.9 | ) | — | |||||||
| Non-U.S. |
(1.8 | ) | (7.4 | ) | 4.8 | |||||||
| 19.2 | (20.5 | ) | 6.0 | |||||||||
| $ | 176.1 | $ | 176.4 | $ | 251.4 | |||||||
Effective Tax Rate—MJN’s provision for income taxes in the years ended December 31, 2010, 2009 and 2008 was different from the amount computed by applying the statutory U.S. federal income tax rate to earnings before income taxes as a result of the following:
| (Dollars in millions) | 2010 | 2009 | 2008 | |||||||||||||||||||||
| U.S. statutory rate |
$ | 222.0 | 35.0% | $ | 205.4 | 35.0% | $ | 228.3 | 35.0% | |||||||||||||||
| State and local taxes |
1.5 | 0.2 | 8.9 | 1.5 | 10.8 | 1.7 | ||||||||||||||||||
| Foreign income taxed at different rates |
(25.5 | ) | (4.0 | ) | (49.9 | ) | (8.5 | ) | (23.3 | ) | (3.6 | ) | ||||||||||||
| Repatriation of foreign income |
16.6 | 2.7 | 29.3 | 5.0 | 37.4 | 5.7 | ||||||||||||||||||
| Tax rulings |
(42.1 | ) | (6.7 | ) | (21.5 | ) | (3.7 | ) | (4.5 | ) | (0.7 | ) | ||||||||||||
| Disallowed transaction cost |
0.5 | 0.1 | 4.0 | 0.7 | 8.8 | 1.4 | ||||||||||||||||||
| U.S. manufacturing deduction |
(2.8 | ) | (0.4 | ) | (4.3 | ) | (0.7 | ) | (3.7 | ) | (0.6 | ) | ||||||||||||
| Other |
5.9 | 0.9 | 4.5 | 0.8 | (2.4 | ) | (0.4 | ) | ||||||||||||||||
| Total provision / effective tax rate |
$ | 176.1 | 27.8% | $ | 176.4 | 30.1% | $ | 251.4 | 38.5% | |||||||||||||||
The effective tax rate for the year ended December 31, 2010, decreased to 27.8% from 30.1% compared to the year ended December 31, 2009. The decrease in the effective tax rate was primarily attributable to the benefits of a tax ruling in the Netherlands, management’s assertion that certain foreign earnings and profits are permanently invested abroad, and a favorable change in the geographic earnings mix.
The Company has negotiated a tax ruling effective from January 1, 2010, under which certain profits in the Netherlands are exempt from taxation through the year ending December 31, 2019; this agreement succeeds a prior agreement which expired on December 31, 2009.
65
Table of Contents
Deferred Taxes and Valuation Allowance—The components of current and noncurrent deferred income tax assets (liabilities) were:
| December 31, | ||||||||
| (In millions) | 2010 | 2009 | ||||||
| Deferred tax assets: |
||||||||
| Accrued expenses |
$ | 27.1 | $ | 22.2 | ||||
| Accrued rebates and returns |
43.9 | 38.7 | ||||||
| Pension, post retirement and post employment liabilities |
23.0 | 43.1 | ||||||
| Stock-based compensation |
8.6 | 8.0 | ||||||
| Intercompany profit and other inventory items |
24.6 | 21.8 | ||||||
| Net operating loss carryforwards |
4.6 | 1.6 | ||||||
| Others—net |
8.8 | 10.0 | ||||||
| Valuation allowance |
(3.3 | ) | — | |||||
| Total deferred tax assets |
137.3 | 145.4 | ||||||
| Deferred tax liabilities: |
||||||||
| Depreciation and amortization |
(42.0 | ) | (38.2 | ) | ||||
| Outside basis |
(26.6 | ) | (7.0 | ) | ||||
| Total deferred tax liabilities |
(68.6 | ) | (45.2 | ) | ||||
| Deferred tax assets (liabilities)—net |
$ | 68.7 | $ | 100.2 | ||||
| Recognized as: |
||||||||
| Deferred income taxes—current—net |
$ | 97.9 | $ | 89.3 | ||||
| Deferred income taxes—noncurrent—net |
(29.2 | ) | 10.9 | |||||
| Total |
$ | 68.7 | $ | 100.2 | ||||
As of December 31, 2010, the Company had gross foreign net operating loss (NOL) carryforwards of $16.3 million. These NOL carryforwards will begin to expire in 2011. The valuation allowance recorded for these NOL carryforwards increased (decreased) by $3.3 million, $(16.6) million, and $(1.6) million in the years ended December 31, 2010, 2009, and 2008, respectively. In the years ended December 31, 2010 and 2009, the valuation allowance relates to foreign NOL carryforwards incurred in the post-IPO period that are not more likely than not to be realized.
Current and noncurrent deferred income tax assets totaled $68.7 million and $100.2 million as of December 31, 2010 and 2009, respectively. The change in the balance between periods is primarily driven by current year pension contributions, U.S. residual tax on unremitted earnings, and cumulative translation adjustments on foreign subsidiaries.
Income taxes paid were $217.7 million, $167.1 million, and $227.8 million in the years ended December 31, 2010, 2009, and 2008, respectively. The income taxes were paid to federal, state and foreign taxing authorities and pursuant to the terms of the tax matters agreement, as well as taxes deemed paid to BMS prior to the date of the IPO.
The uncertain tax positions have been recorded as part of other liabilities with no reversal being expected in the next twelve months. The uncertain tax benefits as of December 31, 2010 and 2009 are recorded against the Company’s deferred tax assets to the extent the uncertainty directly related to that asset; otherwise they are recorded as either current or noncurrent income tax payable. As of December 31, 2010 and 2009, approximately $17.1 million and $14.0 million, respectively, of gross noncurrent income tax payable was included in other liabilities on the balance sheet.
66
Table of Contents
Interest and penalties related to unrecognized tax benefits were $6.2 million, $4.1 million, and $6.2 million for the years ended December 31, 2010, 2009 and 2008, respectively, and are included as a component of other liabilities. The Company classifies interest and penalties related to unrecognized tax benefits as a component of provision for income taxes. The amount of interest and penalties included as a component of provision for income taxes for the year ended December 31, 2010, was $0.3 million. No interest or penalties were included as a component of provision for income taxes for the years ended December 31, 2009 and 2008 pursuant to the tax matters agreement.
The Company’s tax returns are routinely audited by federal, state and foreign tax authorities and these tax audits are at various stages of completion at any given time. The Internal Revenue Service has completed examinations of the Company’s U.S. income tax returns through December 31, 2004. At December 31, 2010, tax years remaining open to examination outside the U.S. include 2003 and forward.
A reconciliation of the Company’s changes in uncertain tax positions is as follows:
| Years Ended December 31, | ||||||||||||
| (In millions) | 2010 | 2009 | 2008 | |||||||||
| Balance at January 1: |
$ | 12.8 | $ | 11.7 | $ | 10.3 | ||||||
| Increases based on current period tax positions |
0.1 | 4.0 | 1.4 | |||||||||
| Decreases based on current period tax positions |
— | — | — | |||||||||
| Increases based on prior period tax positions |
1.1 | 2.7 | — | |||||||||
| Decreases based on prior period tax positions |
(0.3 | ) | — | — | ||||||||
| Settlements |
(0.4 | ) | — | — | ||||||||
| Cumulative translation adjustment |
0.3 | — | — | |||||||||
| Adjustments to opening balances pursuant to BMS tax matters agreement |
— | (5.6 | ) | — | ||||||||
| Balance at December 31: |
$ | 13.6 | $ | 12.8 | $ | 11.7 | ||||||
The amounts of unrecognized tax benefits that, if recognized, would impact the effective tax rate were $3.0 million, $2.4 million, and $11.7 million as of December 31, 2010, 2009 and 2008, respectively.
The Company believes that it has provided adequately for all uncertain tax positions. Pursuant to the tax matters agreement dated February 10, 2009, BMS maintains responsibility for all uncertain tax positions which may exist in the pre-IPO period or which may exist as a result of the IPO transaction. Pursuant to the Amended and Restated Tax Matters Agreement dated December 18, 2009, the Company continues to maintain responsibility for all uncertain tax positions which may exist in the post-IPO period. MJN anticipates that it is reasonably possible that new issues may be raised by tax authorities and that these issues may require increases in the balance of unrecognized tax benefits.
| 7. | SEGMENT INFORMATION |
MJN operates in four geographic operating segments: Asia, Europe, Latin America and North America. This operating segmentation is how the chief operating decision maker regularly assesses information for decision making purposes, including allocation of resources. Due to similarities in the economics, products offered, production process, customer base, and regulatory environment, these operating segments have been aggregated into two reportable segments: Asia/Latin America and North America/Europe.
Corporate and Other consists of unallocated general and administrative expenses and global business support activities, including research and development, marketing and supply chain costs.
67
Table of Contents
The Company’s products are sold principally to the wholesale and retail trade. One customer (including its related entities) of both the Asia/Latin America and North America/Europe segments accounted for 12%, 12%, and 13% of the Company’s gross sales for the years ended December 31, 2010, 2009, and 2008, respectively; one customer of the Asia/Latin America segment accounted for 12%, 11%, and 11% of the Company’s gross sales for the years ended December 31, 2010, 2009, and 2008, respectively.
| (In millions) | Net Sales | Earnings Before Interest and Income Taxes |
Year-End Assets |
Payments for Capital Expenditures |
Depreciation and Amortization |
|||||||||||||||
| Year ended December 31, 2010 |
||||||||||||||||||||
| Asia/Latin America |
$ | 1,927.1 | $ | 646.1 | $ | 1,272.2 | $ | 59.9 | $ | 20.9 | ||||||||||
| North America/Europe |
1,214.5 | 357.7 | 763.7 | 60.3 | 35.9 | |||||||||||||||
| Total operating segments |
3,141.6 | 1,003.8 | 2,035.9 | 120.2 | 56.8 | |||||||||||||||
| Corporate and Other |
— | (320.9 | ) | 257.2 | 52.2 | 7.9 | ||||||||||||||
| Total |
$ | 3,141.6 | $ | 682.9 | $ | 2,293.1 | $ | 172.4 | $ | 64.7 | ||||||||||
| Year ended December 31, 2009 |
||||||||||||||||||||
| Asia/Latin America |
$ | 1,625.5 | $ | 577.0 | $ | 1,072.0 | $ | 23.5 | $ | 11.6 | ||||||||||
| North America/Europe |
1,201.0 | 391.8 | 661.1 | 56.8 | 39.3 | |||||||||||||||
| Total operating segments |
2,826.5 | 968.8 | 1,733.1 | 80.3 | 50.9 | |||||||||||||||
| Corporate and Other |
— | (289.2 | ) | 337.2 | 15.5 | 8.0 | ||||||||||||||
| Total |
$ | 2,826.5 | $ | 679.6 | $ | 2,070.3 | $ | 95.8 | $ | 58.9 | ||||||||||
| Year ended December 31, 2008 |
||||||||||||||||||||
| Asia/Latin America |
$ | 1,516.9 | $ | 462.9 | $ | 26.8 | $ | 14.1 | ||||||||||||
| North America/Europe |
1,365.5 | 467.3 | 33.5 | 34.1 | ||||||||||||||||
| Total operating segments |
2,882.4 | 930.2 | 60.3 | 48.2 | ||||||||||||||||
| Corporate and Other |
— | (234.5 | ) | 20.8 | 3.9 | |||||||||||||||
| Total |
$ | 2,882.4 | $ | 695.7 | $ | 81.1 | $ | 52.1 | ||||||||||||
| Net Sales (in millions) |
Infant Formula |
Children’s Nutrition |
Other | Total | ||||||||||||
| Year ended December 31, 2010 |
$ | 1,945.4 | $ | 1,119.2 | $ | 77.0 | $ | 3,141.6 | ||||||||
| Year ended December 31, 2009 |
$ | 1,805.6 | $ | 919.0 | $ | 101.9 | $ | 2,826.5 | ||||||||
| Year ended December 31, 2008 |
$ | 1,931.6 | $ | 855.9 | $ | 94.9 | $ | 2,882.4 | ||||||||
| Geographic (in millions) |
United States |
China/ Hong Kong |
Mexico | Other | Total | |||||||||||||||
| Year ended December 31, 2010 |
||||||||||||||||||||
| Net Sales |
$ | 992.3 | $ | 745.3 | $ | 295.0 | $ | 1,109.0 | $ | 3,141.6 | ||||||||||
| Long-Lived Assets |
439.9 | 44.3 | 176.5 | 170.0 | 830.7 | |||||||||||||||
| Year ended December 31, 2009 |
||||||||||||||||||||
| Net Sales |
$ | 992.1 | $ | 570.5 | $ | 252.3 | $ | 1,011.6 | $ | 2,826.5 | ||||||||||
| Long-Lived Assets |
393.6 | 35.7 | 161.4 | 127.5 | 718.2 | |||||||||||||||
| Year ended December 31, 2008 |
||||||||||||||||||||
| Net Sales |
$ | 1,108.4 | $ | 432.2 | $ | 285.4 | $ | 1,056.4 | $ | 2,882.4 | ||||||||||
Beginning in 2010, the net sales and long-lived assets of Hong Kong are no longer reflected in Other. All periods presented reflect this change.
68
Table of Contents
| 8. | EMPLOYEE STOCK BENEFIT PLANS |
MJN 2009 Stock Award and Incentive Plan—The MJN 2009 Stock Award and Incentive Plan (MJN 2009 Plan) provides for the grant of options, performance awards, restricted stock units and other stock-based awards. Executive officers and other employees of MJN or one of its subsidiaries or affiliates, and non-employee directors and others who provide substantial services to MJN, are eligible to be granted awards under the MJN 2009 Plan. Twenty-five million shares of stock were approved and registered with the SEC for grants to participants under the MJN 2009 Plan. Shares used for awards assumed in an acquisition or combination will not count against the shares reserved under the MJN 2009 Plan. The shares reserved may be used for any type of award under the MJN 2009 Plan. Stock-based compensation expense is based on awards ultimately expected to vest. Forfeitures are estimated based on the historical experience of participants in the stock-based compensation plans of our former parent, BMS.
Under the MJN 2009 Plan, executive officers and key employees of MJN may be granted options to purchase common stock at no less than 100% of the market price on the date the option is granted. Stock options generally become exercisable in installments of either 25% per year on each of the first through the fourth anniversaries of the grant date or 33% per year on each of the first through the third anniversaries of the grant date. Stock options have a maximum term of 10 years. Generally, MJN will issue shares for the stock option exercises from treasury stock, if available, or will issue new shares.
The MJN 2009 Plan also incorporates performance awards, which are delivered in the form of a target number of performance shares and have a three-year performance cycle. The performance awards have annual goals set at the beginning of each year, at which time the awards are considered granted. The maximum payout is 165%. If threshold targets are not met for a performance period, no payment is made under the plan for that annual period.
The MJN 2009 Plan provides for the granting of restricted stock units to key employees, subject to restrictions as to continuous employment, and non-employee directors. Restrictions generally expire over a two to five year period from the date of grant. Stock-based compensation expense is recognized over the restricted period. A restricted stock unit is a right to receive stock at the end of the specified vesting period. A restricted stock unit has nonforfeitable rights to dividends and has no voting rights.
MJN Stock Options—The fair value of stock options granted in 2010 was estimated on the date of grant using the Black-Scholes option pricing model. No stock options with market conditions were granted in 2010. The fair value of stock options granted in 2009 was estimated on the date of grant using the Black-Scholes option pricing model for stock options with a service condition, and the Monte Carlo simulation model for options with service and market conditions. The following assumptions were used in the valuations:
| 2010 | 2009 | |||||||||||
| Black-Scholes Model |
Black-Scholes Model |
Monte Carlo Model |
||||||||||
| Expected volatility |
23.2% | 23.8% | 28.7% | |||||||||
| Risk-free interest rate |
2.7% | 2.3% | 3.0% | |||||||||
| Dividend yield |
1.8% | 2.9% | 2.9% | |||||||||
| Expected life |
6.0 years | 6.3 years | 6.8 years | |||||||||
The 2010 expected volatility assumption required in the Black-Scholes model was calculated based on a combination of peer group analysis of stock price volatility and implied volatility from publicly-traded options on the Company’s stock. The 2010 expected volatility assumption required in the Black-Scholes model was calculated based on a 6.0-year look back period ending on the grant date. The 2009 expected volatility assumption required in the Black-Scholes model and Monte Carlo model was calculated based on peer group analysis of stock price volatility with a 6.3-year and 10-year look back period ending on the grant date, respectively.
69
Table of Contents
The risk-free interest rate assumption in the Black-Scholes model is based upon the U.S. Treasury yield curve in effect at the time of grant. The risk-free interest rate assumption in the Monte Carlo model is based upon the 10-year U.S. Treasury yield curve. The dividend yield assumption is based on MJN’s expectation of dividend payouts. The expected life is based on the vesting period and the contractual term for each grant, or for each vesting tranche for awards with graded vesting. The selection of this approach was based on MJN’s assessment that this simplified method is appropriate given the terms of the stock option plans and given that there is not sufficient historical stock option exercise experience upon which to estimate expected terms.
Stock option activity under the 2009 MJN plan is as follows:
| Shares (in thousands) |
Weighted Average Exercise Price of Shares |
Average Remaining Contractual Term (in years) |
Aggregate Intrinsic Value (in millions) |
|||||||||||||
| Outstanding—January 1, 2009 |
— | $ | — | |||||||||||||
| Granted |
1,030 | 26.80 | ||||||||||||||
| Exercised |
— | — | ||||||||||||||
| Forfeited or expired |
(33 | ) | 27.24 | |||||||||||||
| Balance—December 31, 2009 |
997 | 26.79 | 9.2 | $ | 26.7 | |||||||||||
| Granted |
550 | 46.71 | ||||||||||||||
| Exercised |
(80 | ) | 26.96 | $ | 2.1 | |||||||||||
| Forfeited or expired |
(63 | ) | 31.82 | |||||||||||||
| Balance—December 31, 2010 |
1,404 | 34.36 | 8.6 | $ | 48.2 | |||||||||||
| Vested—December 31, 2010 |
189 | 26.87 | 8.2 | $ | 5.1 | |||||||||||
| Vested and expected to vest—December 31, 2010 |
1,330 | 34.36 | 8.6 | $ | 45.7 | |||||||||||
Cash proceeds received from options exercised during the year ended December 31, 2010 were $2.2 million. No cash proceeds were received from options exercised during the year ended December 31, 2009.
At December 31, 2010, there was $4.9 million of total unrecognized compensation cost related to stock options that is expected to be recognized over a weighted average period of 2.2 years.
MJN Performance Share Awards—The fair value of performance awards is based on the closing trading price of MJN’s stock on the date of the grant. Information related to performance share awards activity under the 2009 MJN Plan is summarized as follows:
| Grant Date |
Performance Cycle Measurement Date |
Shares Granted and Earned (in thousands) |
Weighted- Average Grant- Date Fair Value |
Performance Shares Outstanding at December 31, 2010 |
||||||||||||
| February 24, 2010 |
Annually on 12/31 | 212 | $ | 44.38 | 198 | |||||||||||
| March 11, 2009 |
Annually on 12/31 | 153 | $ | 26.58 | 145 | |||||||||||
Shares granted and earned in the table above assumes 100% plan performance adjusted for the actual plan achievement level for completed performance periods. At December 31, 2010, there was $6.7 million of total unrecognized compensation cost related to the performance share awards granted that is expected to be recognized over a weighted-average period of 1.4 years.
70
Table of Contents
MJN Restricted Stock Units—The fair value of restricted stock units is determined based on the closing trading price of MJN’s common stock on the grant date. A summary of restricted stock unit activity is as follows:
| Shares (in thousands) |
Weighted- Average Grant Date Fair Value |
|||||||
| Nonvested restricted stock units—January 1, 2009 |
— | $ | — | |||||
| Granted |
677 | 34.09 | ||||||
| Vested |
(4 | ) | 44.12 | |||||
| Forfeited |
(11 | ) | 25.02 | |||||
| Nonvested restricted stock units—December 31, 2009 |
662 | 34.18 | ||||||
| Granted |
150 | 47.53 | ||||||
| Vested |
(172 | ) | 42.16 | |||||
| Forfeited |
(52 | ) | 35.37 | |||||
| Nonvested restricted stock units—December 31, 2010 |
588 | 35.15 | ||||||
At December 31, 2010, there was $16.5 million of total unrecognized compensation cost related to nonvested restricted stock units that is expected to be recognized over a weighted-average period of 2.3 years.
BMS Employee Stock Benefit Plans—Prior to the split-off, BMS sponsored employee stock plans in which certain MJN employees participated. Expense recognized for these stock-based compensation plans resulted in an increase of equity (deficit). As part of the split-off from BMS, all participation in the BMS employee stock benefit plans by MJN employees was terminated. All outstanding BMS stock options, BMS restricted stock units and BMS long-term performance awards held by MJN employees were either accelerated or pro-rata vested, or forfeited based on the type of award. For the year ended December 31, 2009, the accelerated and pro-rata vesting increased expense by $3.3 million. Non-retirement eligible MJN employees had a limited time to exercise the BMS stock options that had accelerated vesting. To compensate for the lost value in the BMS sponsored employee stock plans, these employees were awarded MJN restricted stock units totaling 0.3 million units included in the table above.
Stock-Based Compensation Expense—The following table summarizes stock-based compensation expense related to MJN stock options, MJN performance share awards, MJN restricted stock units, and BMS stock benefit plan awards for the years ended December 31, 2010, 2009, and 2008:
| Years Ended December 31, | ||||||||||||
| (In millions) | 2010 | 2009 | 2008 | |||||||||
| MJN stock options |
$ | 3.8 | $ | 2.6 | $ | — | ||||||
| MJN performance share awards |
5.6 | 1.3 | — | |||||||||
| MJN restricted stock units |
10.3 | 1.4 | — | |||||||||
| BMS stock benefit plans |
— | 12.4 | 9.2 | |||||||||
| Total stock-based compensation expense |
$ | 19.7 | $ | 17.7 | $ | 9.2 | ||||||
| Net tax benefit related to stock-based compensation expense |
$ | (6.8 | ) | $ | (5.6 | ) | $ | (3.2 | ) | |||
Stock-based compensation expense was recognized in the consolidated statements of earnings as follows:
| Years Ended December 31, | ||||||||||||
| (Dollars in millions) | 2010 | 2009 | 2008 | |||||||||
| Cost of products sold |
$ | 2.0 | $ | 1.8 | $ | 0.9 | ||||||
| Selling, general and administrative |
15.7 | 14.1 | 7.4 | |||||||||
| Research and development |
2.0 | 1.8 | 0.9 | |||||||||
| Total stock-based compensation expense |
$ | 19.7 | $ | 17.7 | $ | 9.2 | ||||||
There were no costs related to stock-based compensation that were capitalized.
71
Table of Contents
Accuracy of Fair Value Estimates
The Company’s determination of fair value of stock-based payment awards on the date of grant using an option-pricing model is affected by the Company’s stock price, as well as assumptions regarding a number of highly complex and subjective variables. These variables include, but are not limited to, the Company’s expected stock price volatility over the term of the awards and actual and projected employee stock option exercise behaviors. Option-pricing models were developed for use in estimating the value of traded options that have no vesting or hedging restrictions and are fully transferable. Because the Company’s employee stock options have certain characteristics that are significantly different from traded options, and because changes in the subjective assumptions can affect the estimated value, the value may not be indicative of the fair value observed in a willing buyer/willing seller market transaction.
| 9. | EMPLOYEE BENEFITS |
Pension and Other Post Retirement Benefits
Pension—The principal pension plan is the Mead Johnson & Company Retirement Plan in the United States (U.S. Pension Plan) which represents approximately 80% of the Company’s total pension assets and obligations. The benefits of this plan are frozen and benefits are no longer accrued for service.
Prior to the IPO, employees who met certain eligibility requirements participated in various defined benefit pension plans administered and sponsored by BMS, and the pension plans for MJN were accounted for under a multi-employer plan. MJN specifically identified the pension expense attributable to MJN participants for the pension plans in the Philippines, Indonesia and the Netherlands. For the pension plans in the United States, Canada, Taiwan and Mexico, costs associated with the pension plans were allocated to MJN on the basis of pensionable wages. The pension expense was $19.4 million for the year ended December 31, 2008.
Other post retirement benefits—The Company also provides comprehensive medical and group life benefits for substantially all U.S. and Canadian retirees who elect to participate in its comprehensive medical and group life plans. The retiree medical plan is contributory. Contributions are adjusted periodically and vary by date of retirement. The retiree life insurance plan is non-contributory.
Prior to the IPO, employees who met certain eligibility requirements participated in post retirement plans administered and sponsored by BMS. The costs associated with these plans were allocated to MJN based upon a ratio of participant headcount. The amount of expense allocated to MJN from BMS for MJN employees participating in the U.S. and Canadian BMS medical and life plans was $2.0 million for the year ended December 31, 2008.
Prior to the IPO, the Company offered medical continuation and income replacement benefits to employees on long-term disability in the United States. For the Long Term Disability (LTD) medical continuation benefits in the United States, BMS allocated costs associated with the LTD medical continuation benefits to MJN based upon a ratio of the postemployment benefit obligation. For the LTD income replacement benefits in the United States, BMS allocated expense based on an allocation rate times base salary. The allocation rate represented the percentage required to recoup the full income replacement liability. The amount of expense allocated to MJN from BMS for MJN employees participating in the U.S. BMS LTD medical continuation and income replacement plans was $1.1 million for the year ended December 31, 2008.
72
Table of Contents
Changes in benefit obligations, plan assets, funded status and amounts recognized in the balance sheet were as follows:
| Pension Benefits | Other Benefits | |||||||||||||||
| (In millions) | 2010 | 2009 | 2010 | 2009 | ||||||||||||
| Beginning benefit obligations |
$ | 309.5 | $ | 270.6 | $ | 20.7 | $ | 15.1 | ||||||||
| Service cost—benefits earned during the year |
2.9 | 2.4 | 1.0 | 0.7 | ||||||||||||
| Interest cost on projected benefit obligations |
17.8 | 16.9 | 1.1 | 1.0 | ||||||||||||
| Settlements |
(21.4 | ) | (22.7 | ) | — | — | ||||||||||
| Actuarial assumptions losses |
5.2 | 40.3 | 1.8 | 3.8 | ||||||||||||
| Plan amendments and other |
— | (0.3 | ) | (0.1 | ) | — | ||||||||||
| Benefits paid |
(1.1 | ) | (0.2 | ) | (0.1 | ) | (0.1 | ) | ||||||||
| Exchange rate changes |
(0.5 | ) | 2.5 | — | 0.2 | |||||||||||
| Benefit obligations at end of year |
$ | 312.4 | $ | 309.5 | $ | 24.4 | $ | 20.7 | ||||||||
| Beginning fair value of plan assets |
$ | 209.1 | $ | 174.4 | $ | — | $ | — | ||||||||
| Actual return on plan assets |
27.7 | 28.4 | — | — | ||||||||||||
| Employer contributions |
55.4 | 27.1 | 0.1 | 0.1 | ||||||||||||
| Settlements |
(21.4 | ) | (22.8 | ) | — | — | ||||||||||
| Benefits paid |
(1.1 | ) | (0.1 | ) | (0.1 | ) | (0.1 | ) | ||||||||
| Exchange rate changes |
(0.3 | ) | 2.1 | — | — | |||||||||||
| Fair value of plan assets at end of year |
$ | 269.4 | $ | 209.1 | $ | — | $ | — | ||||||||
| Underfunded status at end of year |
$ | (43.0 | ) | $ | (100.4 | ) | $ | (24.4 | ) | $ | (20.7 | ) | ||||
| Amounts in the consolidated balance sheets include: |
||||||||||||||||
| Other assets |
$ | 4.3 | $ | 2.5 | $ | — | $ | — | ||||||||
| Pension, post retirement and post employment liabilities |
(47.3 | ) | (102.9 | ) | (24.4 | ) | (20.7 | ) | ||||||||
| Balance in the consolidated balance sheet at end of year |
$ | (43.0 | ) | $ | (100.4 | ) | $ | (24.4 | ) | $ | (20.7 | ) | ||||
| Amounts in accumulated other comprehensive loss include: |
||||||||||||||||
| Net actuarial loss |
$ | 134.9 | $ | 154.3 | $ | 14.4 | $ | 13.9 | ||||||||
| Prior service (benefit) |
— | — | (0.9 | ) | (0.9 | ) | ||||||||||
| Transition obligation |
0.4 | 0.4 | — | — | ||||||||||||
| Balance in accumulated other comprehensive loss at end of year |
$ | 135.3 | $ | 154.7 | $ | 13.5 | $ | 13.0 | ||||||||
| Accumulated benefit obligation |
$ | 296.0 | $ | 285.0 | ||||||||||||
The Company’s defined benefit pension and post retirement benefit plans with an accumulated benefit obligation in excess of plan assets were as follows:
| (In millions) | 2010 | 2009 | ||||||
| Projected benefit obligation |
$ | 298.6 | $ | 295.2 | ||||
| Accumulated benefit obligation |
267.9 | 259.6 | ||||||
| Fair value of plan assets |
227.4 | 174.2 | ||||||
73
Table of Contents
The net periodic benefit cost of the Company’s defined benefit pension and post retirement benefit plans includes:
| Pension Benefits | Other Benefits | |||||||||||||||
| (In millions) | 2010 | 2009 | 2010 | 2009 | ||||||||||||
| Service cost—benefits earned during the period |
$ | 2.9 | $ | 2.4 | $ | 1.0 | $ | 0.7 | ||||||||
| Interest cost on projected benefit obligations |
17.8 | 16.9 | 1.1 | 1.0 | ||||||||||||
| Expected return on plan assets |
(16.1 | ) | (15.9 | ) | — | — | ||||||||||
| Amortization of prior service (benefit) |
— | — | (0.2 | ) | (0.1 | ) | ||||||||||
| Amortization of net actuarial loss |
3.0 | 1.4 | 1.2 | 0.8 | ||||||||||||
| Amortization of transition cost |
— | — | — | — | ||||||||||||
| Net periodic benefit cost |
$ | 7.6 | $ | 4.8 | $ | 3.1 | $ | 2.4 | ||||||||
| Settlements |
10.6 | 10.6 | — | — | ||||||||||||
| Total net periodic benefit cost |
$ | 18.2 | $ | 15.4 | $ | 3.1 | $ | 2.4 | ||||||||
The estimated net actuarial loss and prior service cost that will be amortized from accumulated other comprehensive income into net periodic benefit cost in 2011 are:
| (In millions) | Pension Benefits |
Other Benefits |
||||||
| Amortization of net actuarial loss |
$ | 3.3 | $ | 1.7 | ||||
| Amortization of prior service (benefit) |
— | (0.2 | ) | |||||
| $ | 3.3 | $ | 1.5 | |||||
Actuarial assumptions
Weighted-average assumptions used to determine benefit obligations were as follows:
| Pension Benefits | Other Benefits | |||||||||||||||
| 2010 | 2009 | 2010 | 2009 | |||||||||||||
| Discount rate |
5.59 | % | 5.86 | % | 5.28 | % | 5.53 | % | ||||||||
| Rate of compensation increase |
4.02 | % | 3.65 | % | 3.94 | % | 3.53 | % | ||||||||
The discount rate was determined based on the yield to maturity of high-quality corporate bonds and considering the duration of the pension plan obligations. The Citigroup Pension Discount Curve is used in developing the discount rate for the U.S. Pension Plan.
Weighted-average assumptions used to determine net periodic benefit cost were as follows:
| Pension Benefits | Other Benefits | |||||||||||||||
| 2010 | 2009 | 2010 | 2009 | |||||||||||||
| Discount rate |
5.88 | % | 7.08 | % | 5.53 | % | 7.28 | % | ||||||||
| Expected long term return on plan assets |
7.38 | % | 8.34 | % | — | — | ||||||||||
| Rate of compensation increase |
3.67 | % | 3.72 | % | 3.53 | % | 3.58 | % | ||||||||
The yield on high-quality corporate bonds that matches the duration of the benefit obligations was used in determining the discount rate. The Citigroup Pension Discount Curve is used in developing the discount rate for the U.S. plans. The expected long-term return on plan assets was determined based on the target asset allocation, expected rate of return by each asset class, and estimated future inflation.
74
Table of Contents
For the U.S. Pension Plan, the expected long-term return on plan assets assumption to be used to determine net periodic benefit cost for the year ended December 31, 2011 is 7.75%. The expected long-term return on plan assets was determined based on the Company’s target asset allocation, expected rate of return by each asset class, and estimated future inflation.
Gains and losses have resulted from changes in actuarial assumptions, such as changes in the discount rate, and from differences between assumed and actual experience, such as differences between actual and assumed returns on plan assets. These gains and losses are adjusted for the difference between the fair value and the market-related value of the plan assets and are amortized to the extent they exceed 10% of the higher of the market-related value or the projected benefit obligation for each respective plan. The majority of the remaining actuarial losses are amortized over the life expectancy of the plans’ participants for U.S. plans and expected remaining service periods for most other plans.
Assumed health care cost trend rates were as follows:
| 2010 | 2009 | |||||||
| Health care cost trend rate assumed for next year |
7.9% | 8.9% | ||||||
| Rate to which the cost trend rate is assumed to decline (the ultimate trend rate) |
5.0% | 4.5% | ||||||
| Year that the rate reaches the ultimate trend rate |
2017 | 2018 | ||||||
Assumed health care cost trend rates have a significant effect on the amounts reported for the retiree medical plans. A one-percentage-point change in assumed health care cost trend rates would have the following effects:
| (In millions) | 1-Percentage-Point Increase |
1-Percentage-Point Decrease |
||||||
| Effect on total of service and interest cost |
$ | — | $ | 0.1 | ||||
| Increase/(decrease) in post retirement benefit obligation |
(0.5 | ) | 0.7 | |||||
Plan assets
The Company’s investment strategy for the U.S. Pension Plan assets consists of a mix of equities and fixed income in order to achieve returns over a market cycle which reduces contribution and expense at an acceptable level of risk. The target asset allocation of 50% public equity and 50% fixed income is maintained and cash flow (i.e., cash contributions, benefit payments) is used to rebalance back to the targets as necessary. Investments are well diversified within each of the two major asset categories. All of the U.S. equity investments are actively managed. Investment strategies for international pension plans are typically similar, although the asset allocations are usually more conservative.
The fair values of the Company’s pension plan assets by asset category were as follows:
| December 31, 2010 | December 31, 2009 | |||||||||||||||||||||||
| (In millions) | Total | Level 1 | Level 2 | Total | Level 1 | Level 2 | ||||||||||||||||||
| Cash and cash equivalents |
$ | 41.0 | $ | 40.0 | $ | 1.0 | $ | 24.8 | $ | 17.1 | $ | 7.7 | ||||||||||||
| Equity securities: |
||||||||||||||||||||||||
| U.S. large-cap |
16.0 | — | 16.0 | 47.4 | 47.4 | — | ||||||||||||||||||
| U.S. mid-cap growth |
4.8 | — | 4.8 | 13.1 | 13.1 | — | ||||||||||||||||||
| U.S. small-cap growth |
2.7 | — | 2.7 | 5.4 | 5.4 | — | ||||||||||||||||||
| Emerging markets |
4.6 | — | 4.6 | 36.6 | 36.6 | — | ||||||||||||||||||
| Real estate investment trusts |
16.6 | — | 16.6 | — | — | — | ||||||||||||||||||
| International large-cap value |
24.9 | — | 24.9 | — | — | — | ||||||||||||||||||
| Fixed income securities: |
||||||||||||||||||||||||
| Government bonds |
124.9 | 8.8 | 116.1 | 45.3 | 45.3 | — | ||||||||||||||||||
| Corporate bonds |
33.9 | — | 33.9 | 36.5 | 36.5 | — | ||||||||||||||||||
| Total |
$ | 269.4 | $ | 48.8 | $ | 220.6 | $ | 209.1 | $ | 201.4 | $ | 7.7 | ||||||||||||
75
Table of Contents
The Company invests in money market, equity, and fixed income funds that are valued at calculated net asset value per share and are not quoted on active markets. As such, these plan assets were classified as level two in the fair value hierarchy at December 31, 2010. Equity securities classified as level one are calculated at daily net asset value per share and are quoted in active markets. With the exception of money market funds and short-term fixed income funds, cash and cash equivalents were classified as level one and were calculated based on the closing prices in the active markets as of the measurement date.
Contributions
In 2011, the funding policy for the pension plans is to contribute amounts to provide for current service and to fund past service liability. MJN contributed $55.4 million and $27.1 million to the pension plans in 2010 and 2009, respectively. The Company is not required to make any contributions to its pension plans in 2011, however may elect to do so. There will be no cash funding for other post retirement benefits in 2011.
Estimated Future Benefit Payments
The following benefit payments, which reflect expected future service, as appropriate, are expected to be paid:
| (In millions) | Pension Benefits |
Other Benefits |
||||||
| 2011 |
$ | 19.0 | $ | 0.4 | ||||
| 2012 |
22.5 | 0.8 | ||||||
| 2013 |
24.9 | 1.1 | ||||||
| 2014 |
26.7 | 1.4 | ||||||
| 2015 |
27.2 | 1.7 | ||||||
| Years 2016 - 2020 |
133.9 | 11.5 | ||||||
Defined Contribution Benefits
Employees who meet certain eligibility requirements may participate in various defined contribution plans. The principal defined contribution plan is the Mead Johnson & Company Retirement Savings Plan in which the Company provides a base contribution in addition to a match of certain employee contributions. Contributions to this plan totaled $14.1 million, $7.2 million, and $5.5 million for the years ended December 31, 2010, 2009, and 2008, respectively, and are expensed as incurred.
| 10. | NONCONTROLLING INTERESTS |
Net earnings attributable to noncontrolling interests consists of an 11% interest in the Company’s China legal entity and a 10% interest in the Company’s Indonesia legal entity held by third parties.
| 11. | RECEIVABLES |
The major categories of receivables were as follows:
| December 31, | ||||||||
| (In millions) | 2010 | 2009 | ||||||
| Trade receivables |
$ | 314.1 | $ | 262.2 | ||||
| Miscellaneous receivables |
46.2 | 61.6 | ||||||
| Less allowances |
(8.3 | ) | (6.2 | ) | ||||
| Receivables—net |
$ | 352.0 | $ | 317.6 | ||||
76
Table of Contents
Miscellaneous receivables as of December 31, 2010 and 2009, includes receivables in connection with manufacturing services provided to a third-party. In addition, miscellaneous receivables includes $6.7 million and $31.1 million of accounts receivables from BMS as of December 31, 2010 and 2009, respectively.
| 12. | INVENTORIES |
The major categories of inventories were as follows:
| December 31, | ||||||||
| (In millions) | 2010 | 2009 | ||||||
| Finished goods |
$ | 201.5 | $ | 166.0 | ||||
| Work in process |
73.1 | 26.5 | ||||||
| Raw and packaging materials |
82.1 | 117.4 | ||||||
| Inventories |
$ | 356.7 | $ | 309.9 | ||||
| 13. | LONG-LIVED ASSETS |
Property, Plant, and Equipment
The major categories of property, plant, and equipment were as follows:
| December 31, | ||||||||
| (In millions) | 2010 | 2009 | ||||||
| Land |
$ | 4.2 | $ | 4.3 | ||||
| Buildings |
469.3 | 404.3 | ||||||
| Machinery, equipment, and fixtures |
558.8 | 498.6 | ||||||
| Construction in progress |
44.5 | 77.5 | ||||||
| Accumulated depreciation |
(526.3 | ) | (483.3 | ) | ||||
| Property, plant, and equipment—net |
$ | 550.5 | $ | 501.4 | ||||
Depreciation expense was $54.6 million, $50.3 million and $44.1 million for the years ended December 31, 2010, 2009 and 2008, respectively, and is primarily included in costs of products sold. Capitalized interest was $2.6 million and $0.9 million for the years ended December 31, 2010 and 2009, respectively. There was no capitalized interest for the year ended December 31, 2008.
Other Intangible Assets
Other intangible assets primarily consist of computer software.
| December 31, | ||||||||
| (In millions) | 2010 | 2009 | ||||||
| Gross intangible assets |
$ | 135.4 | $ | 96.6 | ||||
| Less accumulated amortization |
(55.1 | ) | (46.1 | ) | ||||
| Total other intangible assets—net |
$ | 80.3 | $ | 50.5 | ||||
The increase in other intangible assets reflected the global IT platform investment as part of the separation from the Company’s former parent. Amortization expense for other intangible assets was $10.1 million, $8.6 million and $8.0 million for the years ended December 31, 2010, 2009 and 2008, respectively.
77
Table of Contents
Expected amortization expense related to computer software is as follows:
| (In millions) Years Ending December 31, |
||||
| 2011 |
$ | 15.8 | ||
| 2012 |
15.1 | |||
| 2013 |
14.2 | |||
| 2014 |
10.2 | |||
| 2015 |
9.2 | |||
| Later years |
12.9 | |||
Accrued capital expenditures were $20.7 million, $48.7 million and $22.3 million at December 31, 2010, 2009 and 2008, respectively. The Company’s liability for asset retirement obligations was $1.6 million and $1.5 million at December 31, 2010 and 2009, respectively.
| 14. | GOODWILL |
The carrying amount of goodwill was $117.5 million at December 31, 2010 and 2009. Of the total carrying amount of goodwill, $115.8 million is related to the Asia /Latin America segment and $1.7 million is related to the North America/Europe segment at December 31, 2010 and 2009.
| 15. | SHORT-TERM BORROWINGS AND LONG-TERM DEBT |
Short-Term Borrowings
Short-term borrowings were $1.2 million as of December 31, 2010, and consisted of short-term loans. Short-term borrowings were $120.0 million as of December 31, 2009, and consisted of borrowings under the Company’s revolving credit facility agreement (Credit Facility). There were no borrowings from the Credit Facility as of December 31, 2010. The borrowings from the Credit Facility are to be used for working capital and other general corporate purposes. The Credit Facility is unsecured and repayable on maturity in February 2012, subject to annual extensions if a sufficient number of lenders agree. The maximum amount of outstanding borrowings and letters of credit permitted at any one time under the Credit Facility is $410.0 million, which amount may be increased from time to time up to $500.0 million at the Company’s request and with the consent of the lenders, subject to satisfaction of customary conditions. The Credit Facility contains customary covenants, including covenants applicable to limiting liens, substantial asset sales and mergers. The Credit Facility contains financial covenants whereby the ratio of consolidated total debt to consolidated Earnings Before Interest, Income Taxes, Depreciation and Amortization (EBITDA) cannot exceed 3.25 to 1.0, and the ratio of consolidated EBITDA to consolidated interest expense cannot be less than 3.0 to 1.0. The Company has been in compliance with these covenants since the inception of the Credit Facility.
Borrowings under the Credit Facility bear interest at a rate that is determined as a base rate plus a margin. The base rate is either (a) LIBOR for a specified interest period, or (b) a floating rate based upon JPMorgan Chase Bank’s prime rate, the Federal Funds rate or LIBOR. The margin is determined by reference to the Company’s consolidated leverage ratio. The margin can range from 1.125% to 2.65% over the base rate. In addition, the Company incurs an annual 0.2% facility fee on the entire facility commitment of $410.0 million. The borrowings from the Credit Facility had a weighted average interest rate of 2.73% and 2.59% as of December 31, 2010 and 2009, respectively.
78
Table of Contents
Long-Term Debt
The components of long-term debt were as follows:
| December 31, | ||||||||
| (Dollars in millions) | 2010 | 2009 | ||||||
| Principal Value: |
||||||||
| 3.50% Notes due 2014 |
$ | 500.0 | $ | 500.0 | ||||
| 4.90% Notes due 2019 |
700.0 | 700.0 | ||||||
| 5.90% Notes due 2039 |
300.0 | 300.0 | ||||||
| Subtotal |
1,500.0 | 1,500.0 | ||||||
| Adjustments to Principal Value: |
||||||||
| Basis adjustment for fair value of outstanding interest rate swaps |
20.1 | (10.4 | ) | |||||
| Unamortized basis adjustment for terminated interest rate swaps |
16.5 | — | ||||||
| Unamortized bond discount |
(4.1 | ) | (4.7 | ) | ||||
| Long-term debt |
$ | 1,532.5 | $ | 1,484.9 | ||||
Based on the Company’s assessment of current market conditions for debt of similar maturity, structure and risk, the estimated fair value of the Company’s debt was $1,568.3 million and $1,489.5 million as of December 31, 2010 and 2009, respectively.
In November 2009, the Company entered into interest rate swaps with a notional amount of $700.0 million. In November 2010, the Company terminated a notional amount of $200.0 million in interest rate swaps with a fair value of $16.8 million, to be amortized over the remaining life of the 4.90% Notes due 2019. Cash payments received and paid on the interest rate swap agreements for the year ended December 31, 2010 were $27.0 million and $9.1 million, respectively. There were no payments received or made related to interest rate swaps in 2009. See Note 16 for discussion on the Company’s interest rate swaps.
Interest expense and interest income for the year ended December 31, 2010, was $53.2 million and $4.6 million, respectively, compared with $95.9 million and $3.3 million, respectively, for the same period in 2009. Cash payments for interest were $51.5 million and $131.0 million for the years ended December 31, 2010 and 2009, respectively. Interest expense for the year ended December 31, 2008, was $43.3 million. There were no cash payments for interest in 2008.
| 16. | DERIVATIVES |
The Company is exposed to market risk due to changes in currency exchange rates, commodities pricing and interest rates. To manage that risk, the Company enters into certain derivative financial instruments, when available on a cost-effective basis, to hedge its underlying economic exposure. These financial instruments are measured using inputs based on quoted market prices for similar assets and liabilities in active markets, i.e. level two of the fair value hierarchy for both periods presented. Derivative financial instruments are not used for speculative purposes.
79
Table of Contents
The following table summarizes the Company’s fair value of outstanding derivatives designated as hedging instruments:
| (In millions) | Balance Sheet Location | December 31, 2010 |
December 31, 2009 |
|||||||||
| Derivatives designated as hedging instruments: |
||||||||||||
| Cash flow hedges: |
||||||||||||
| Foreign exchange contracts |
Other assets | $ | — | $ | 0.3 | |||||||
| Foreign exchange contracts |
Accrued expenses | (2.3 | ) | (3.6 | ) | |||||||
| Fair value hedges: |
||||||||||||
| Interest rate swaps |
Other assets | 20.1 | — | |||||||||
| Interest rate swaps |
Accrued expenses | — | (10.4 | ) | ||||||||
| Net asset/(liability) of derivatives designated as hedging instruments |
$ | 17.8 | $ | (13.7 | ) | |||||||
The Company’s derivative financial instruments present certain market and counterparty risks; however, concentration of counterparty risk is mitigated as the Company deals with a variety of major banks worldwide whose long-term debt is rated A or higher by Standard & Poor’s Rating Service and Moody’s Investors Service, Inc. In addition, only conventional derivative financial instruments are used. The Company would not be materially impacted if any of the counterparties to the derivative financial instruments outstanding at December 31, 2010 failed to perform according to the terms of its agreement. At this time, the Company does not require collateral or any other form of securitization to be furnished by the counterparties to its derivative financial instruments.
Cash Flow Hedges
The Company uses foreign exchange contracts to hedge forecasted transactions, primarily intercompany purchases for up to 18 months, on certain foreign currencies and designates these derivative instruments as foreign currency cash flow hedges when appropriate. For the contracts that qualify as hedges of probable forecasted cash flows, the effective portion of changes in fair value is temporarily reported in accumulated other comprehensive income (loss) and recognized in earnings when the hedged item affects earnings.
Foreign Exchange Contracts—The effective portion of changes in the fair value of foreign exchange contracts, the majority of which qualify as hedges of probable forecasted cash flows, is recognized in earnings when the hedged item affects earnings, in cost of products sold or deemed ineffective, in other expenses/(income)—net.
The table below summarizes the Company’s outstanding foreign exchange forward contracts at December 31, 2010. The fair value of all foreign exchange forward contracts is based on quarter-end forward currency rates. The fair value of foreign exchange forward contracts should be viewed in relation to the fair value of the underlying hedged transactions and the overall reduction in exposure to fluctuations in foreign currency exchange rates.
| (Dollars in millions) | Weighted Average Forward Rate |
Notional Amount |
Fair Value Liability |
Maturity | ||||||||||||
| Foreign exchange forwards: |
||||||||||||||||
| Cash flow hedges: |
||||||||||||||||
| Canadian dollar |
1.02 | $ | 32.3 | $ | (0.7 | ) | 2011 | |||||||||
| Mexican peso |
12.78 | 70.7 | (1.4 | ) | 2012 | |||||||||||
| Philippine peso |
43.60 | 39.0 | (0.2 | ) | 2011 | |||||||||||
| Total foreign exchange forwards |
$ | 142.0 | $ | (2.3 | ) | |||||||||||
80
Table of Contents
At December 31, 2010, the balance of the effective portion of changes in fair value on foreign exchange forward contracts that qualified for cash flow hedge accounting included in accumulated other comprehensive income (loss) was $(1.8) million, $(1.7) million of which is expected to be reclassified into earnings within the next 12 months.
The Company assesses effectiveness at the inception of the hedge and on a quarterly basis. These assessments determine whether derivatives designated as qualifying hedges continue to be highly effective in offsetting changes in the cash flows of hedged items. Any ineffective portion of the change in fair value is included in current period earnings. For the years ended December 31, 2010, 2009, and 2008, the impact of hedge ineffectiveness on earnings was not significant.
The Company will discontinue cash flow hedge accounting when the forecasted transaction is no longer probable of occurring on the originally forecasted date, or 60 days thereafter, or when the hedge is no longer effective. For the years ended December 31, 2010 and 2009, the Company did not discontinue any cash flow hedges of this nature.
Natural Gas Contracts—There were no natural gas contracts outstanding during the year ended December 31, 2010 and as of December 31, 2009, and no earnings impact from discontinued natural gas hedges for the year ended December 31, 2009.
The change in accumulated other comprehensive income (loss) and the impact on earnings from foreign exchange and natural gas forwards that qualified as cash flow hedges for the years ended December 31, 2010 and 2009, were as follows:
| Foreign Exchange |
Natural Gas Contracts |
Total Cash Flow Hedges |
||||||||||||||||||||||
| (In millions) | 2010 | 2009 | 2010 | 2009 | 2010 | 2009 | ||||||||||||||||||
| Balance—January 1: |
$ | (2.9 | ) | $ | 6.6 | $ | — | $ | (1.4 | ) | $ | (2.9 | ) | $ | 5.2 | |||||||||
| Derivatives qualifying as cash flow hedges deferred in other comprehensive income |
(6.3 | ) | (8.2 | ) | — | (1.0 | ) | (6.3 | ) | (9.2 | ) | |||||||||||||
| Derivatives qualifying as cash flow hedges reclassified to cost of products sold (effective portion) |
7.8 | (5.0 | ) | — | 3.2 | 7.8 | (1.8 | ) | ||||||||||||||||
| Change in deferred taxes |
(0.4 | ) | 3.7 | — | (0.8 | ) | (0.4 | ) | 2.9 | |||||||||||||||
| Balance—December 31: |
$ | (1.8 | ) | $ | (2.9 | ) | $ | — | $ | — | $ | (1.8 | ) | $ | (2.9 | ) | ||||||||
Fair Value Hedges
The Company uses fixed-to-floating interest rate swaps as part of an interest rate management strategy. For the interest rate swaps that are designated and qualify as a fair value hedge, the gain or loss on the swap as well as the offsetting loss or gain on the hedged item attributable to the hedged risk are recognized in current earnings. The swaps are recorded at fair value. The fair value of the interest rate swaps is the present value of the future cash flows calculated based on forecasted LIBOR rates from a third party bank including credit value adjustments. Interest rate swaps are intended to create a targeted balance of fixed- and floating-rate debt for the Company. There were no ineffective fair value hedges for the years ended December 31, 2010 and 2009.
Interest Rate Swaps—In November 2009, the Company executed several interest rate swaps to convert $700.0 million of the Company’s newly-issued fixed rate debt to be paid in 2014 and 2019 to variable rate debt. In November 2010, the Company terminated $200.0 million notional amount of fixed-to-floating interest rate swaps for a fair value of $16.8 million. The fair value adjustment to the underlying debt from the terminated swap is being recognized as a reduction of interest expense over the remaining life of the underlying debt. The total notional amounts of outstanding interest rate swaps were $500.0 million at December 31, 2010.
81
Table of Contents
The following table summarizes the interest rate swaps outstanding at December 31, 2010:
| (Dollars in millions) | Notional Amount of Underlying Debt |
Variable Rate Paid | Year of Transaction |
Maturity | Fair Value |
|||||||||||||||
| Swaps associated with: |
||||||||||||||||||||
| 3.50% Notes due 2014 |
$ | 500.0 | 1 month U.S. $ | LIBOR + 0.890 | % | 2009 | 2014 | $ | 20.1 | |||||||||||
Gain (loss) on marked to market of fair value hedges during the years ended December 31, 2010 and 2009 was as follows:
| Gain (Loss) on Marked to Market of Swaps |
Gain (Loss) on Marked to Market of Hedged Items |
|||||||||||||||
| (In millions) | 2010 | 2009 | 2010 | 2009 | ||||||||||||
| Interest expense—net |
$ | 20.1 | $ | (10.4 | ) | $ | (20.1 | ) | $ | 10.4 | ||||||
The impact on earnings from interest rate swaps that qualified as fair value hedges was as follows:
| (In millions) | 2010 | 2009 | ||||||
| Recognized in interest expense |
$ | (17.1 | ) | $ | (2.8 | ) | ||
| Amortization of basis adjustment for terminated interest rate swaps recognized in interest expense |
(0.3 | ) | — | |||||
| Total |
$ | (17.4 | ) | $ | (2.8 | ) | ||
See Note 15 for discussion on the Company’s long-term debt.
Non-Qualifying Foreign Currency Forward Contract
The Company uses foreign currency forward contracts to hedge foreign currency denominated monetary assets and liabilities. The primary objective of these contracts is to protect the U.S. dollar value of foreign currency denominated monetary assets and liabilities from the effects of volatility in foreign exchange rates that might occur prior to their receipt or settlement in U.S. dollars. These contracts are not designated as hedges and are adjusted to fair value through other expenses/(income)—net, other assets and accrued expenses as they occur and substantially offset the change in fair value of the underlying foreign currency denominated monetary asset or liability. For the year ended December 31, 2010, the impact on earnings from foreign currency forward contracts of this nature was a gain of $1.0 million. There were no foreign currency forward contracts of this nature as of December 31, 2010 and 2009.
| 17. | EQUITY |
Changes in common shares and treasury stock were as follows:
| (In millions) | Common Shares Issued |
Treasury Stock |
Cost of Treasury Stock |
|||||||||
| Balance—January 1, 2009 |
— | — | $ | — | ||||||||
| IPO |
204.5 | — | — | |||||||||
| Balance—December 31, 2009 |
204.5 | — | — | |||||||||
| Stock-based compensation |
0.3 | 0.1 | 3.1 | |||||||||
| Treasury stock purchases |
— | — | 0.1 | |||||||||
| Balance—December 31, 2010 |
204.8 | 0.1 | $ | 3.2 | ||||||||
82
Table of Contents
Treasury stock is recognized at the cost to reacquire the shares. Shares issued from treasury are recognized utilizing the first-in first-out method.
| 18. | LEASES |
Minimum rental commitments under all non-cancelable operating leases, primarily real estate leases for offices, manufacturing-related leases and vehicle leases, in effect at December 31, 2010, are:
| (In millions) Years ending December 31, |
||||
| 2011 |
$ | 24.5 | ||
| 2012 |
21.2 | |||
| 2013 |
17.1 | |||
| 2014 |
15.2 | |||
| 2015 |
10.8 | |||
| Later Years |
23.4 | |||
| Total Minimum Payments |
$ | 112.2 | ||
Operating lease rental expenses were $24.1 million, $23.0 million and $11.5 million in the years ended December 31, 2010, 2009, and 2008, respectively. At December 31, 2010 and 2009, MJN had capital lease obligations outstanding in the amount of $1.7 million and $1.9 million, respectively.
| 19. | CONTINGENCIES |
In the ordinary course of business, the Company is subject to lawsuits, investigations, government inquiries and claims, including, but not limited to, product liability claims, advertising disputes and inquiries, consumer fraud suits, other commercial disputes, premises claims and employment and environmental, health, and safety matters.
The Company is not aware of any environmental, health or safety-related litigation or significant environmental, health and safety-related financial obligations or liabilities arising from current or former operations or properties that are likely to have a material adverse impact on the Company’s business, financial position or results of operations. Liabilities or obligations, which could require the Company to make significant expenditures, could arise in the future, however, as the result of, among other things, changes in, or new interpretations of, existing laws, regulations or enforcement policies, claims relating to on-or off-site contamination, or the imposition of unanticipated investigation or cleanup obligations.
As previously reported, PBM Products, LLC (PBM), a manufacturer and distributor of store brand infant formulas and nutritionals, obtained a judgment in the amount of $13.5 million in a suit against the Company’s subsidiary, Mead Johnson & Company, LLC, in the U.S. District Court (Eastern District of Virginia), alleging, among other things, false and misleading advertising with respect to certain Enfamil LIPIL infant formula advertising. After post-trial briefing, the court confirmed the award and also ordered limited injunctive relief. The Company has filed an appeal with the U.S. Court of Appeals for the Fourth Circuit with respect to various aspects of the district court proceedings, including both the jury award and injunction. That appeal remains pending. In addition, six putative consumer class action suits have been filed and served against the Company’s subsidiary, Mead Johnson & Company, LLC, two of which also name the Company as a defendant. (The Company has been dismissed as a party from the other suits, and the Company either has sought or will seek to be dismissed from the remaining two.) The Company also is aware of two additional putative class actions that have been filed in the U.S. District Court (Northern District of California) that have not yet been served. All of these cases cite the PBM matter as support for allegations that certain false and misleading advertising of Enfamil LIPIL infant formula has resulted in financial injury to consumers. A class of Florida consumers was certified in one of the actions (Nelson v. Mead Johnson & Company, LLC), pending in the U.S. District Court
83
Table of Contents
(Southern District of Florida), but the U.S. Court of Appeals for the Eleventh Circuit has granted defendant’s petition for interlocutory appeal of that certification decision. The Company denies all allegations in the cases, which have been consolidated for adjudication in the U.S. District Court (Southern District of Florida) by the Joint Panel on Multidistrict Litigation. The Company also has entered into a memorandum of understanding with plaintiffs’ counsel in several of the cases, with the goal of presenting a stipulation of settlement and a joint motion for preliminary approval of settlement to the U.S. District Court (Southern District of Florida). Although the terms of the settlement are not finalized and remain confidential, it is expected that they will resolve all claims on a nationwide basis and not have a material adverse effect on our results of operations or financial condition.
The Company records accruals for such contingencies when it is probable that a liability will be incurred and the loss can be reasonably estimated. Although MJN cannot predict with certainty the ultimate resolution of these or other lawsuits, investigations and claims asserted against the Company, MJN does not believe any currently pending legal proceeding to which MJN is a party will have a material adverse effect on the Company’s business or financial condition, although an unfavorable outcome in excess of amounts recognized as of December 31, 2010, with respect to one or more of these proceedings could have a material adverse effect on the Company’s results of operations or the periods in which a loss is recognized.
| 20. | RELATED-PARTY TRANSACTIONS |
The Company is engaged in transactions with its former parent, BMS. These transactions primarily consist of sales to BMS, as it serves as the primary distributor in the European region and will do so through 2011, and fees for services under a Transitional Services Agreement (TSA). The Company had related-party transactions with BMS from the time of the IPO in February 2009 through the split-off from BMS on December 23, 2009. As of the split-off, BMS is no longer a related party. Activities while BMS was a related party are detailed below.
MJN entered into transactions with BMS and its subsidiaries for the sale of inventory and services provided to and received from BMS pharmaceutical divisions in various markets worldwide, as well as corporate services provided by BMS. For the year ended December 31, 2009, MJN had related-party sales to BMS of $84.2 million. There were no sales to BMS in 2008. Purchases of goods from BMS were $13.6 million, and $27.0 million for the years ended December 31, 2009 and 2008, respectively.
Prior to the IPO, the Company was allocated costs for various services from BMS. On January 31, 2009, MJN entered into a TSA with BMS whereby BMS agreed to provide MJN with various corporate support services (the BMS Services) and MJN agreed to provide BMS with certain services (the MJN Services). The TSA was amended and restated on December 18, 2009, in anticipation of the split-off from BMS. The BMS Services and the MJN Services will continue for a specified initial term, which will vary with the types of services to be provided, unless earlier terminated or extended according to the terms of the TSA, none of which extend beyond December 31, 2011. MJN pays BMS mutually agreed-upon fees for the BMS Services and BMS pays MJN mutually agreed-upon fees for the MJN Services. The statement of earnings for the year ended December 31, 2009, includes one month of costs allocated from BMS and eleven months of expenses related to the TSA. Total net costs for the years ended December 31, 2009 and 2008, were $58.3 million and $112.1 million, respectively. Additionally, for the year ended December 31, 2008, MJN allocated charges of $19.6 million to BMS in various markets worldwide and was allocated charges of $20.2 million from BMS.
84
Table of Contents
| 21. | SELECTED QUARTERLY FINANCIAL DATA (UNAUDITED) |
| Dollars in Millions, Except Per Share Data |
First Quarter |
Second Quarter |
Third Quarter |
Fourth Quarter |
Year | |||||||||||||||
| 2010: |
||||||||||||||||||||
| Net sales |
$ | 763.5 | $ | 764.2 | $ | 810.2 | $ | 803.7 | $ | 3,141.6 | ||||||||||
| Gross profit |
$ | 491.7 | $ | 485.5 | $ | 513.9 | $ | 500.9 | $ | 1,992.0 | ||||||||||
| Net earnings attributable to shareholders |
$ | 125.6 | $ | 121.4 | $ | 106.1 | $ | 99.6 | $ | 452.7 | ||||||||||
| Basic earnings per share |
$ | 0.61 | $ | 0.59 | $ | 0.52 | $ | 0.49 | $ | 2.20 | ||||||||||
| Diluted earnings per share |
$ | 0.61 | $ | 0.59 | $ | 0.52 | $ | 0.48 | $ | 2.20 | ||||||||||
| 2009: |
||||||||||||||||||||
| Net sales |
$ | 693.0 | $ | 719.3 | $ | 699.8 | $ | 714.4 | $ | 2,826.5 | ||||||||||
| Gross profit |
$ | 445.4 | $ | 483.2 | $ | 455.2 | $ | 468.0 | $ | 1,851.8 | ||||||||||
| Net earnings attributable to shareholders |
$ | 103.5 | $ | 134.5 | $ | 97.6 | $ | 64.0 | $ | 399.6 | ||||||||||
| Basic and diluted earnings per share |
$ | 0.55 | $ | 0.66 | $ | 0.48 | $ | 0.31 | $ | 1.99 | ||||||||||
85
Table of Contents
MEAD JOHNSON NUTRITION COMPANY
MEAD JOHNSON NUTRITION
VALUATION AND QUALIFYING ACCOUNTS
| Description |
Balance at beginning of period |
Provisions for bad debts |
Bad debts written off |
Other | Balance at end of period |
|||||||||||||||
| (In millions) | ||||||||||||||||||||
| Allowances for Doubtful Accounts |
||||||||||||||||||||
| For the year ended December 31, 2010 |
$ | 6.2 | $ | 0.4 | $ | — | $ | 1.7 | $ | 8.3 | ||||||||||
| For the year ended December 31, 2009 |
7.0 | 0.4 | (0.6 | ) | (0.6 | ) | 6.2 | |||||||||||||
| For the year ended December 31, 2008 |
29.9 | 0.6 | (19.5 | ) | (4.0 | ) | 7.0 | |||||||||||||
| Description |
Balance at beginning of period |
Provision for valuation allowance |
Release of valuation allowance/ other |
Balance at end of period |
||||||||||||
| (In millions) | ||||||||||||||||
| Valuation Allowance on Deferred Tax Assets |
||||||||||||||||
| For the year ended December 31, 2010 |
$ | — | $ | 3.3 | $ | — | $ | 3.3 | ||||||||
| For the year ended December 31, 2009 |
16.6 | — | (16.6 | ) | — | |||||||||||
| For the year ended December 31, 2008 |
18.2 | 1.3 | (2.9 | ) | 16.6 | |||||||||||
86
Table of Contents
| Item 9. | CHANGES IN AND DISAGREEMENTS WITH ACCOUNTANTS ON ACCOUNTING AND FINANCIAL DISCLOSURE |
None.
| Item 9A. | CONTROLS AND PROCEDURES |
Conclusion Regarding the Effectiveness of Disclosure Controls and Procedures
Under the supervision and with the participation of our management, including the Chief Executive Officer and the Chief Financial Officer of the company (its principal executive officer and principal financial officer, respectively), we have evaluated our disclosure controls and procedures (as defined in the Securities Exchange Act of 1934 Rule 13a -15(e) and 15d-15(e)) as of December 31, 2010. Based upon that evaluation, the Chief Executive Officer and Chief Financial Officer have concluded that our disclosure controls and procedures were effective.
Management’s Report on Internal Control Over Financial Reporting
Management is responsible for establishing and maintaining adequate internal control over financial reporting. Under the supervision and with the participation of management, including the Chief Executive Officer and Chief Financial Officer, management assessed the effectiveness of internal control over financial reporting as of December 31, 2010, based on the framework in “Internal Control-Integrated Framework” issued by the Committee of Sponsoring Organizations of the Treadway Commission. Based on that assessment, management has concluded that our internal control over financial reporting was effective at December 31, 2010, to provide reasonable assurance regarding the reliability of our financial reporting and the preparation of our financial statements for external purposes in accordance with U.S. generally accepted accounting principles. Due to its inherent limitations, internal control over financial reporting may not prevent or detect misstatements.
Deloitte & Touche LLP, an independent registered public accounting firm, has audited our financial statements included in this Annual Report on Form 10-K and issued its report on the effectiveness of our internal control over financial reporting as of December 31, 2010, which is included herein.
Changes in Internal Control Over Financial Reporting
In 2010, we began a phased global implementation of a new Enterprise Resource Planning (“ERP”) system and transaction processing services. The new ERP system and transaction processing services are part of a global initiative to transition, replace or retire the ERP and transaction processing services provided to us by BMS under various transition services agreements. During the quarter ended December 31, 2010, we transitioned most of the processes and procedures for our North America operations to the new ERP system and service provider. The implementation of this phase of the project has involved changes to certain internal controls over financial reporting, which we believe were material. We expect this global transition to be completed in 2011.
Except as noted above, there has been no change in our internal control over financial reporting during the quarter ended December 31, 2010, that has materially affected, or is reasonably likely to materially affect, our internal control over financial reporting.
| Item 9B. | OTHER INFORMATION |
None.
87
Table of Contents
PART III
| Item 10. | DIRECTORS, EXECUTIVE OFFICERS AND CORPORATE GOVERNANCE |
The information required by this Item is set forth under the heading “Directors, Executive Officers and Corporate Governance” in our 2011 Proxy Statement to be filed with the U.S. Securities and Exchange Commission (the “SEC”) in connection with the solicitation of proxies for our 2011 Annual Meeting of Stockholders (the “2011 Proxy Statement”) and is incorporated herein by reference. Such Proxy Statement will be filed with the SEC within 120 days after the end of the fiscal year to which this report relates.
| Item 11. | EXECUTIVE COMPENSATION |
The information required by this Item is set forth under the headings “Executive Compensation” and “Compensation Discussion and Analysis” in our 2011 Proxy Statement and is incorporated herein by reference.
| Item 12. | SECURITY OWNERSHIP OF CERTAIN BENEFICIAL OWNERS AND MANAGEMENT AND RELATED STOCKHOLDER MATTERS |
The information required by this Item is set forth under the headings “Security Ownership of Certain Beneficial Owners and Management” and “Securities Authorized for Issuance under Equity Compensation Plans” in our 2011 Proxy Statement and is incorporated herein by reference.
| Item 13. | CERTAIN RELATIONSHIPS AND RELATED TRANSACTIONS, AND DIRECTOR INDEPENDENCE |
The information required by this Item is set forth under the headings “Review, Approval or Ratification of Transactions with Related Persons” and “Director Independence” in our 2011 Proxy Statement and is incorporated herein by reference.
| Item 14. | PRINCIPAL ACCOUNTANT FEES AND SERVICES |
The information required by this Item is set forth under the heading “Fees Paid to Auditors” in our 2011 Proxy Statement and is incorporated herein by reference.
88
Table of Contents
PART IV
| Item 15. | EXHIBITS AND FINANCIAL STATEMENT SCHEDULE |
The financial statements and schedule filed as part of this Annual Report on Form 10-K are listed in the accompanying Index to Financial Statements and Financial Statement Schedule on page 51. The exhibits filed as a part of this Annual Report on Form 10-K are listed in the accompanying Exhibit Index on page 91.
89
Table of Contents
SIGNATURES
Pursuant to the requirements of Section 13 or 15(d) of the Securities Exchange Act of 1934, the registrant has duly caused this report to be signed on its behalf by the undersigned, thereunto duly authorized.
| MEAD JOHNSON NUTRITION COMPANY | ||||||||
| Date: February 16, 2010 | By: | /S/ STANLEY D. BURHANS | ||||||
| Stanley D. Burhans | ||||||||
| Vice President and Controller | ||||||||
Pursuant to the requirements of the Securities Exchange Act of 1934, this report has been signed below by the following persons on behalf of the registrant and in the capacities and on the date indicated.
| Date: February 16, 2010 | By: | /S/ STEPHEN W. GOLSBY | ||||||
| Stephen W. Golsby | ||||||||
| President and Chief Executive Officer | ||||||||
| (Principal Executive Officer) | ||||||||
| Date: February 16, 2010 | By: | /S/ PETER G. LEEMPUTTE | ||||||
| Peter G. Leemputte | ||||||||
| Senior Vice President and Chief Financial Officer | ||||||||
| (Principal Financial Officer) | ||||||||
| Date: February 16, 2010 | By: | /S/ STANLEY D. BURHANS | ||||||
| Stanley D. Burhans | ||||||||
| Vice President and Controller | ||||||||
| (Principal Accounting Officer) | ||||||||
| Date: February 16, 2010 | By: | /S/ JAMES M. CORNELIUS | ||||||
| James M. Cornelius | ||||||||
| Chairman of the Board of Directors | ||||||||
| Date: February 16, 2010 | By: | /S/ STEVEN M. ALTSCHULER, M.D. | ||||||
| Steven M. Altschuler, M.D. | ||||||||
| Director | ||||||||
| Date: February 16, 2010 | By: | /S/ HOWARD B. BERNICK | ||||||
| Howard B. Bernick | ||||||||
| Director | ||||||||
| Date: February 16, 2010 | By: | /S/ KIMBERLY A. CASIANO | ||||||
| Kimberly A. Casiano | ||||||||
| Director | ||||||||
| Date: February 16, 2010 | By: | /S/ ANNA C. CATALANO | ||||||
| Anna C. Catalano | ||||||||
| Director | ||||||||
| Date: February 16, 2010 | By: | /S/ PETER G. RATCLIFFE | ||||||
| Peter G. Ratcliffe | ||||||||
| Director | ||||||||
| Date: February 16, 2010 | By: | /S/ ELLIOTT SIGAL, M.D., PH.D. | ||||||
| Elliott Sigal, M.D., Ph.D. | ||||||||
| Director | ||||||||
| Date: February 16, 2010 | By: | /S/ ROBERT S. SINGER | ||||||
| Robert S. Singer | ||||||||
| Director | ||||||||
90
Table of Contents
EXHIBIT INDEX
| Exhibit Number |
Description | |
| 3 |
Articles of Incorporation and Bylaws | |
| 3.1 |
Second Amended and Restated Certificate of Incorporation of Mead Johnson Nutrition Company (incorporated by reference to Exhibit 3.1 to current report on Form 8-K filed on January 8, 2010) | |
| 3.2 |
Amended and Restated By-laws of Mead Johnson Nutrition Company (incorporated by reference to Exhibit 3.1 to current report on Form 8-K filed on March 31, 2010) | |
| 4 |
Instruments defining the rights of the security holders, including indentures | |
| 4.1 |
Specimen Common Stock Certificate | |
| 4.2 |
Indenture, dated as of November 1, 2009, by and between Mead Johnson Nutrition Company and The Bank of New York Mellon Trust Company, N.A., as trustee (incorporated by reference to Exhibit 4.1 to current report on Form 8-K filed on November 12, 2009) | |
| 4.3 |
First Supplemental Indenture, dated as of November 5, 2009, by and among Mead Johnson Nutrition Company, Mead Johnson & Company and The Bank of New York Mellon Trust Company, N.A., as trustee (including forms of the 3.50% Notes due 2014, 4.90% Notes due 2019 and 5.90% Notes due 2039 Notes) (incorporated by reference to Exhibit 4.2 to current report on Form 8-K filed on November 12, 2009) | |
| 10 |
Material Contracts | |
| 10.1 |
Separation Agreement by and between Bristol-Myers Squibb Company and Mead Johnson Nutrition Company, dated January 31, 2009 (incorporated by reference to Exhibit 10.1 to annual report on Form 10-K for the fiscal year ended December 31, 2008 filed on March 27, 2009) | |
| 10.2 |
Employee Matters Agreement between Bristol-Myers Squibb Company and Mead Johnson Nutrition Company, dated January 31, 2009 (incorporated by reference to Exhibit 10.2 to annual report on Form 10-K for the fiscal year ended December 31, 2008 filed on March 27, 2009) | |
| 10.3 |
Second Amended and Restated Transitional Services Agreement between Bristol-Myers Squibb Company and Mead Johnson Nutrition, dated December 18, 2009 (incorporated by reference to Exhibit 10.4 to annual report on Form 10-K for the fiscal year ended December 31, 2009 filed on February 25, 2010) | |
| 10.4 |
Amended and Restated Tax Matters Agreement between Bristol-Myers Squibb Company and Mead Johnson Nutrition Company dated December 18, 2009 (incorporated by reference to Exhibit 10.1 to current report on Form 8-K filed on December 23, 2009) | |
| 10.5 |
Amended and Restated China Services Agreement between Bristol-Myers Squibb Company and Mead Johnson Nutrition Company, dated December 18, 2009 (incorporated by reference to Exhibit 10.2 to current report on Form 8-K filed on December 23, 2009) | |
| 10.6 |
Three Year Revolving Credit Facility Agreement, dated February 17, 2009 (incorporated by reference to Exhibit 10.1 to current report on Form 8-K filed on February 20, 2009) | |
| 10.7 |
First Amendment and Consent to the Three Year Revolving Credit Facility Agreement, dated as of November 5, 2009, among Mead Johnson Nutrition Company, Mead Johnson & Company, various financial institutions and JPMorgan Chase Bank, N.A., as Administrative Agent (incorporated by reference to Exhibit 4.4 to current report on Form 8-K filed on November 12, 2009) | |
91
Table of Contents
| Exhibit Number |
Description | |
| 10.8 |
Third Amendment to the Three Year Revolving Credit Facility, dated as of December 17, 2009, among Mead Johnson Nutrition Company, Mead Johnson & Company, various financial institutions and JPMorgan Chase Bank, N.A., as Administrative Agent (incorporated by reference to Exhibit 10.1 to current report on Form 8-K filed on December 17, 2009) | |
| 10.9† |
Supply Agreement by and between Mead Johnson & Company and Martek Biosciences Corporation, dated as of January 1, 2006 (incorporated by reference to Exhibit 10.18 to registration statement on Form S-1 (Registration No. 333-156298) filed on December 19, 2008) | |
| 10.10† |
Amendment No. 1 to Supply Agreement by and between Mead Johnson & Company, LLC and Martek Biosciences Corporation, made and entered into effective as of June 1, 2010 (incorporated by reference to Exhibit 10.1 to quarterly report on Form 10-Q for the quarter ended June 30, 2010 filed on July 29, 2010) | |
| 10.11* |
Offer Letter to Peter G. Leemputte, dated September 2, 2008 (incorporated by reference to Exhibit 10.11 to registration statement on Form S-1 (Registration No. 333-156298) filed on December 19, 2008) | |
| 10.12* |
Bristol-Myers Squibb Company 2007 Stock Award and Incentive Plan, as amended and restated, effective as of June 10, 2008 (incorporated by reference to Exhibit 10.14 to registration statement on Form S-1 (Registration No. 333-156298) filed on December 19, 2008) | |
| 10.13* |
Mead Johnson Nutrition Company 2009 Amended and Restated Stock Award and Incentive Plan (incorporated by reference to Addendum A to definitive proxy statement on Schedule 14A filed on April 2, 2010) | |
| 10.14* |
Mead Johnson Nutrition Company 2009 Senior Executive Performance Incentive Plan (incorporated by reference to Exhibit 10.29 to annual report on Form 10-K for the fiscal year ended December 31, 2008 filed on March 27, 2009) | |
| 10.15* |
Mead Johnson & Company Benefit Equalization Plan-Retirement Plan (incorporated by reference to Exhibit 10.31 to annual report on Form 10-K for the fiscal year ended December 31, 2008 filed on March 27, 2009) | |
| 10.16* |
Mead Johnson & Company Benefit Equalization Plan-Retirement Savings Plan (incorporated by reference to Exhibit 10.32 to annual report on Form 10-K for the fiscal year ended December 31, 2008 filed on March 27, 2009) | |
| 10.17* |
Mead Johnson & Company Key International Pension Plan (incorporated by reference to Exhibit 10.33 to annual report on Form 10-K for the fiscal year ended December 31, 2008 filed on March 27, 2009) | |
| 10.18* |
Mead Johnson & Company LLC Senior Executive Severance Plan (incorporated by reference to Exhibit 10.3 to current report on Form 8-K filed on December 23, 2009) | |
| 10.19* |
Mead Johnson & Company LLC Senior Executive Change In Control Severance Plan (incorporated by reference to Exhibit 10.4 to current report on Form 8-K filed on December 23, 2009) | |
| 10.20* |
Form of Nonqualified Stock Option Agreement (incorporated by reference to Exhibit 10.34 to annual report on Form 10-K for the fiscal year ended December 31, 2008 filed on March 27, 2009) | |
| 10.21* |
Form of Performance Shares Agreement (incorporated by reference to Exhibit 10.35 to annual report on Form 10-K for the fiscal year ended December 31, 2008 filed on March 27, 2009) | |
| 10.22* |
Form of Director Restricted Stock Units Agreement (incorporated by reference to Exhibit 10.36 to annual report on Form 10-K for the fiscal year ended December 31, 2008 filed on March 27, 2009) | |
92
Table of Contents
| Exhibit Number |
Description | |
| 10.23* |
Form of Employee Restricted Stock Units Agreement (incorporated by reference to Exhibit 10.37 to annual report on Form 10-K for the fiscal year ended December 31, 2008 filed on March 27, 2009) | |
| 10.24* |
Form of Restricted Stock Units Agreement (incorporated by reference to Exhibit 10.5 to current report on Form 8-K filed on December 23, 2009) | |
| 21 |
Subsidiaries of the Registrant | |
| 21.1 |
Subsidiaries of the Registrant | |
| 23 |
Consents of experts and counsel | |
| 23.1 |
Consent of Deloitte & Touche LLP | |
| 31 |
Rule 13a-14(a) Certifications | |
| 31.1 |
Certification of the Chief Executive Officer | |
| 31.2 |
Certification of the Chief Financial Officer | |
| 32 |
Section 1350 Certifications | |
| 32.1 |
Certification of the Chief Executive Officer | |
| 32.2 |
Certification of the Chief Financial Officer | |
| † | Confidential treatment has been granted for certain portions which are omitted in the copy of the exhibit electronically filed with the SEC. The omitted information has been filed separately with the SEC pursuant to our application for confidential treatment. |
| * | Compensatory plan or arrangement |
93