Attached files
| file | filename |
|---|---|
| 8-K - 8-K - CBRE GROUP, INC. | a11-5917_18k.htm |
| EX-99.1 - EX-99.1 - CBRE GROUP, INC. | a11-5917_1ex99d1.htm |
Exhibit 99.2
|
|
CB Richard Ellis Group, Inc. ING REIM Presentation February 2011 |
|
|
Forward Looking Statements This presentation contains statements that are forward looking within the meaning of the Private Securities Litigation Reform Act of 1995, and involve risks and uncertainties including, but not limited to, the ability to consummate a transaction with substantially all of the ING REIM assets, as contemplated; to integrate the real estate investment management operations of ING REIM with CBRE Investors; and to leverage the integrated platform to capture a larger share of the global real estate investment market as well as other risks and uncertainties discussed in CB Richard Ellis’ filings with the SEC. Except to the extent required by applicable securities laws, we undertake no obligation to update or publicly revise any of the forward-looking statements that you may hear today. We may make certain statements during the course of this presentation which include references to “non-GAAP financial measures,” as defined by SEC regulations. As required by these regulations, we have provided reconciliations of these measures to what we believe are the most directly comparable GAAP measures, which are attached hereto within the appendix. |
|
|
Participants Brett White Chief Executive Officer Gil Borok Chief Financial Officer Jim Groch Chief Investment Officer Nick Kormeluk Investor Relations |
|
|
Transaction Overview |

|
|
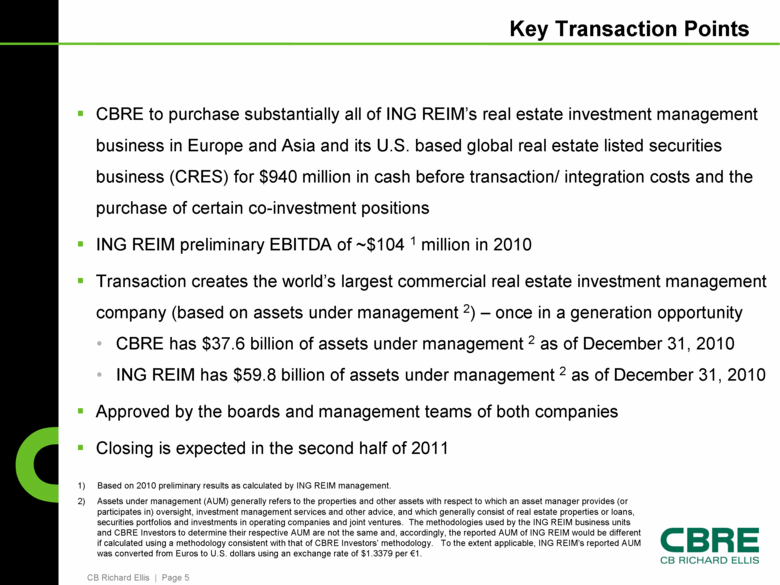
Key Transaction Points CBRE to purchase substantially all of ING REIM’s real estate investment management business in Europe and Asia and its U.S. based global real estate listed securities business (CRES) for $940 million in cash before transaction/ integration costs and the purchase of certain co-investment positions ING REIM preliminary EBITDA of ~$104 1 million in 2010 Transaction creates the world’s largest commercial real estate investment management company (based on assets under management 2) – once in a generation opportunity CBRE has $37.6 billion of assets under management 2 as of December 31, 2010 ING REIM has $59.8 billion of assets under management 2 as of December 31, 2010 Approved by the boards and management teams of both companies Closing is expected in the second half of 2011 1) Based on 2010 preliminary results as calculated by ING REIM management. 2) Assets under management (AUM) generally refers to the properties and other assets with respect to which an asset manager provides (or participates in) oversight, investment management services and other advice, and which generally consist of real estate properties or loans, securities portfolios and investments in operating companies and joint ventures. The methodologies used by the ING REIM business units and CBRE Investors to determine their respective AUM are not the same and, accordingly, the reported AUM of ING REIM would be different if calculated using a methodology consistent with that of CBRE Investors’ methodology. To the extent applicable, ING REIM’s reported AUM was converted from Euros to U.S. dollars using an exchange rate of $1.3379 per €1. |
|
|
Global Investment Management Combination |
|
|
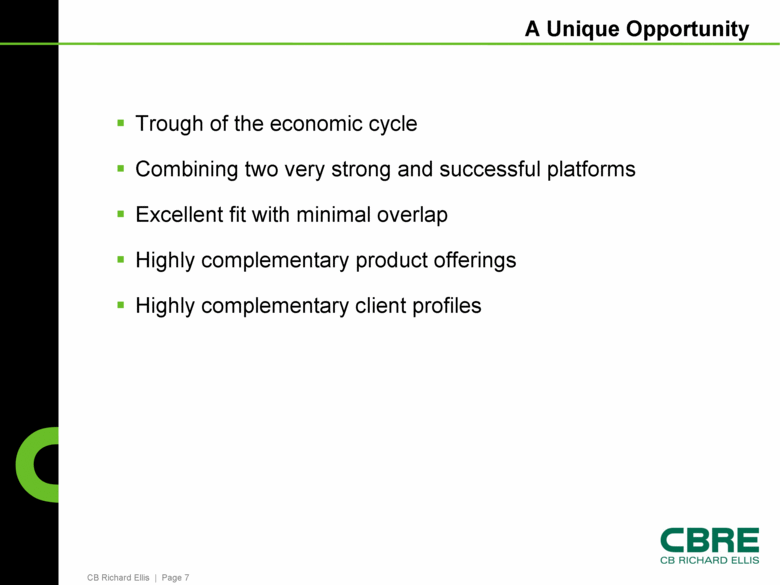
A Unique Opportunity Trough of the economic cycle Combining two very strong and successful platforms Excellent fit with minimal overlap Highly complementary product offerings Highly complementary client profiles |
|
|
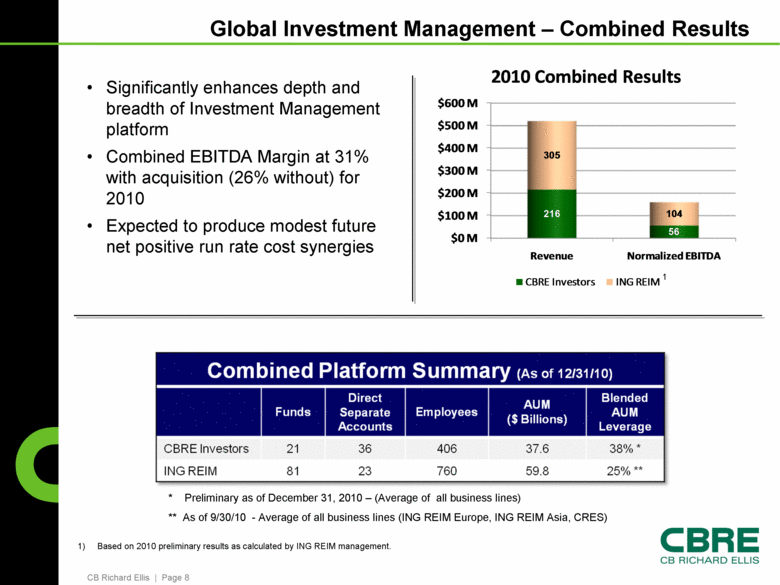
Global Investment Management – Combined Results Significantly enhances depth and breadth of Investment Management platform Combined EBITDA Margin at 31% with acquisition (26% without) for 2010 Expected to produce modest future net positive run rate cost synergies * Preliminary as of December 31, 2010 – (Average of all business lines) ** As of 9/30/10 - Average of all business lines (ING REIM Europe, ING REIM Asia, CRES) 1) Based on 2010 preliminary results as calculated by ING REIM management. 1 $0 M $100 M $200 M $300 M $400 M $500 M $600 M Revenue Normalized EBITDA 216 56 305 104 2010 Combined Results CBRE Investors ING REIM Combined Platform Summary (As of 12/31/10) Funds Direct Separate Accounts Employees AUM ($ Billions) Blended AUM Leverage CBRE Investors 21 36 406 37.6 38% * ING REIM 81 23 760 59.8 25% ** |
|
|
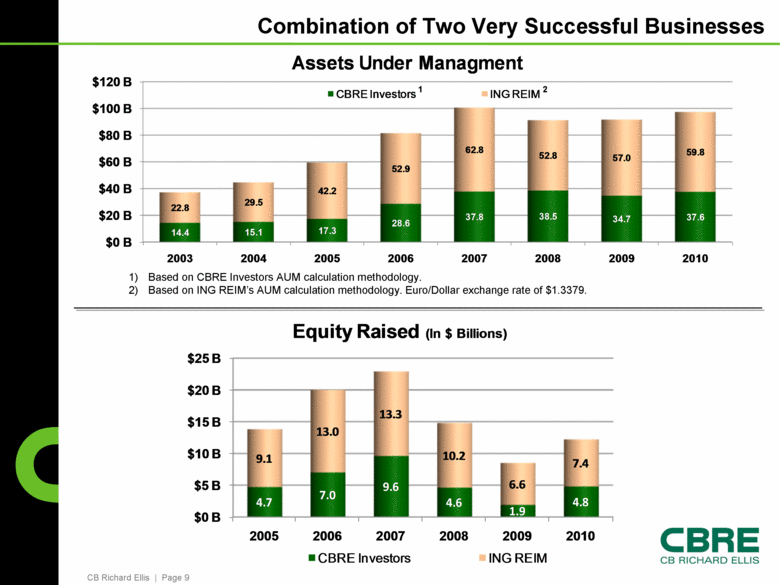
Combination of Two Very Successful Businesses Based on CBRE Investors AUM calculation methodology. Based on ING REIM’s AUM calculation methodology. Euro/Dollar exchange rate of $1.3379. 1) 2) $0 B $5 B $10 B $15 B $20 B $25 B 2005 2006 2007 2008 2009 2010 4.7 7.0 9.6 4.6 1.9 4.8 9.1 13.0 13.3 10.2 6.6 7.4 Equity Raised (In $ Billions) CBRE Investors ING REIM $0 B $20 B $40 B $60 B $80 B $100 B $120 B 2003 2004 2005 2006 2007 2008 2009 2010 14.4 15.1 17.3 28.6 37.8 38.5 34.7 37.6 22.8 29.5 42.2 52.9 62.8 52.8 57.0 59.8 Assets Under Managment CBRE Investors 1 ING 2 REIM |
|
|
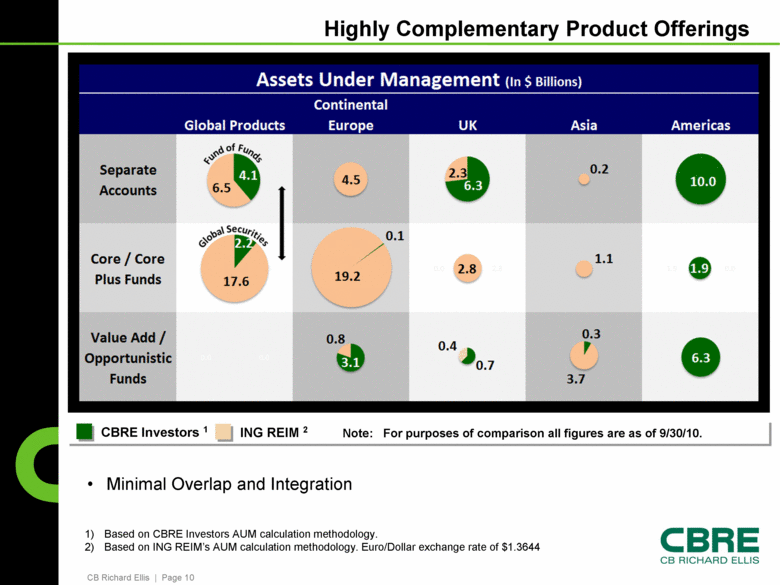
Highly Complementary Product Offerings ING REIM 2 CBRE Investors 1 Note: For purposes of comparison all figures are as of 9/30/10. Minimal Overlap and Integration 1) Based on CBRE Investors AUM calculation methodology. 2) Based on ING REIM’s AUM calculation methodology. Euro/Dollar exchange rate of $1.3644 |
|
|
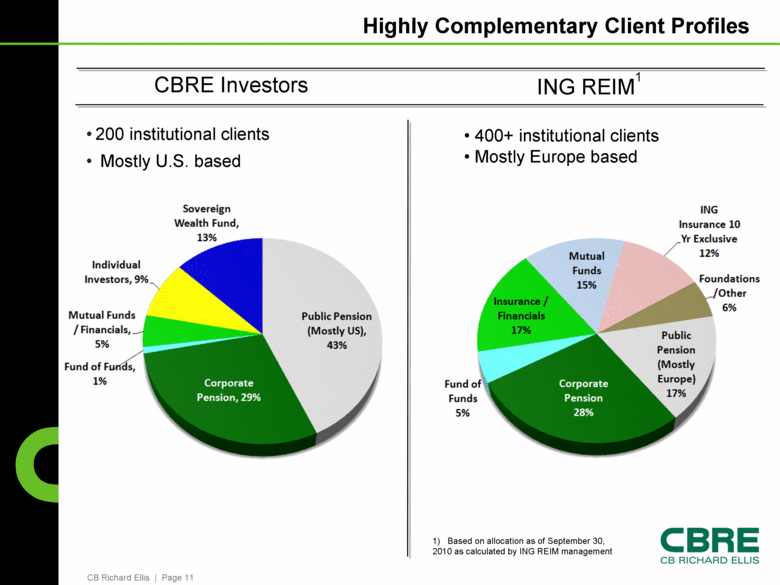
Highly Complementary Client Profiles 200 institutional clients Mostly U.S. based ING REIM 1) Based on allocation as of September 30, 2010 as calculated by ING REIM management 400+ institutional clients Mostly Europe based CBRE Investors 1 |
|
|
Total Company Combined |
|
|
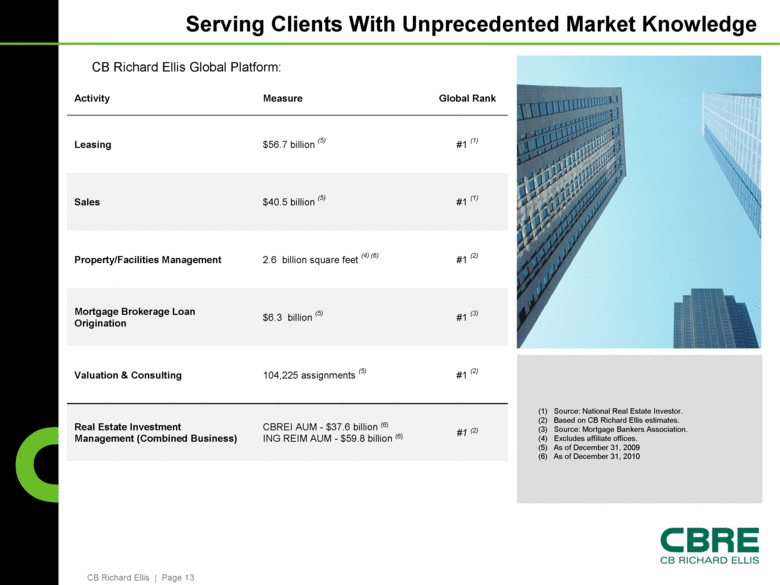
Serving Clients With Unprecedented Market Knowledge Activity Measure Global Rank Leasing $56.7 billion (5) #1 (1) Sales $40.5 billion (5) #1 (1) Property/Facilities Management 2.6 billion square feet (4) (6) #1 (2) Mortgage Brokerage Loan Origination $6.3 billion (5) #1 (3) Valuation & Consulting 104,225 assignments (5) #1 (2) Real Estate Investment Management (Combined Business) CBREI AUM - $37.6 billion (6) ING REIM AUM - $59.8 billion (6) #1 (2) (1) Source: National Real Estate Investor. (2) Based on CB Richard Ellis estimates. (3) Source: Mortgage Bankers Association. (4) Excludes affiliate offices. (5) As of December 31, 2009 (6) As of December 31, 2010 CB Richard Ellis Global Platform: |
|
|
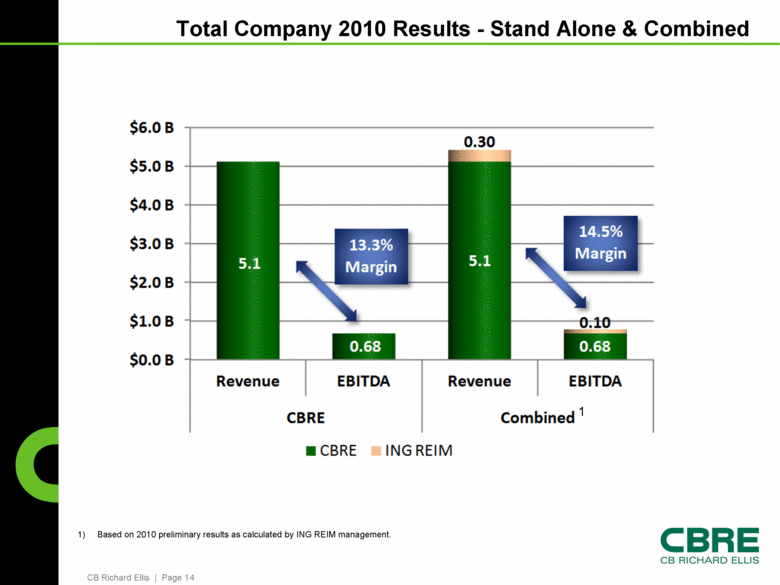
Total Company 2010 Results - Stand Alone & Combined Based on 2010 preliminary results as calculated by ING REIM management. 1) |
|
|
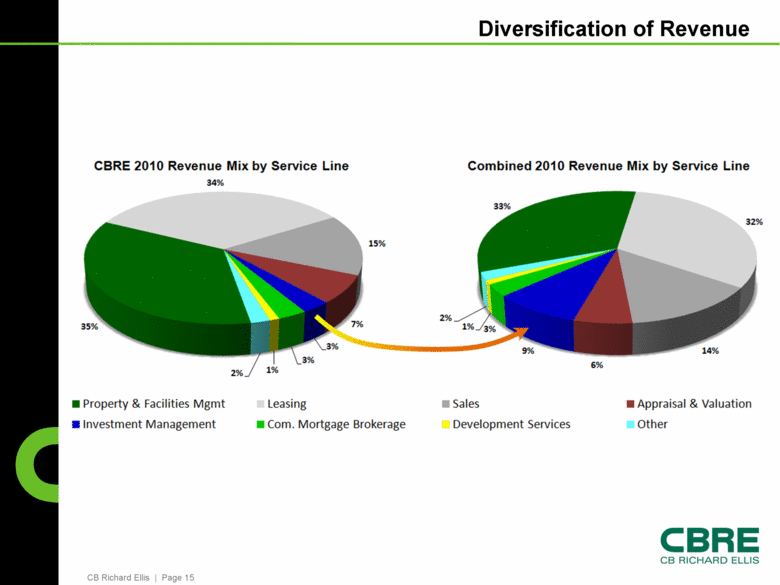
Diversification of Revenue |
|
|
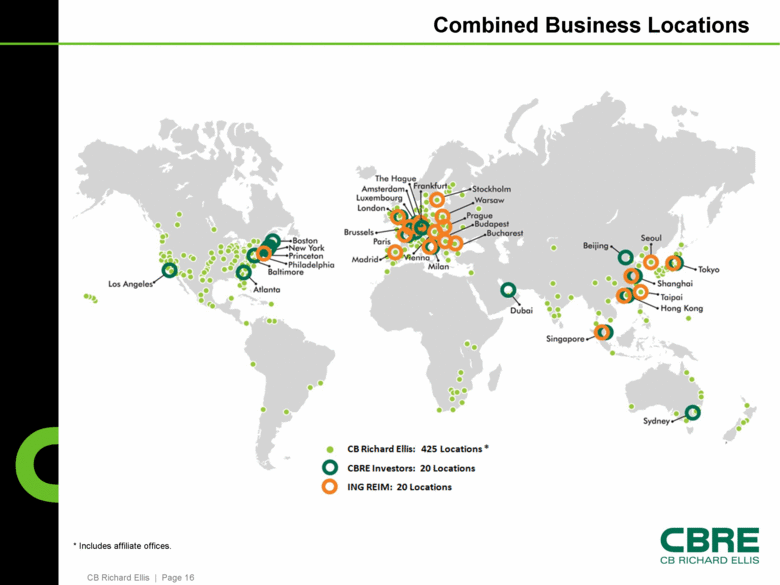
Combined Business Locations * Includes affiliate offices. |
|
|
Financing |
|
|
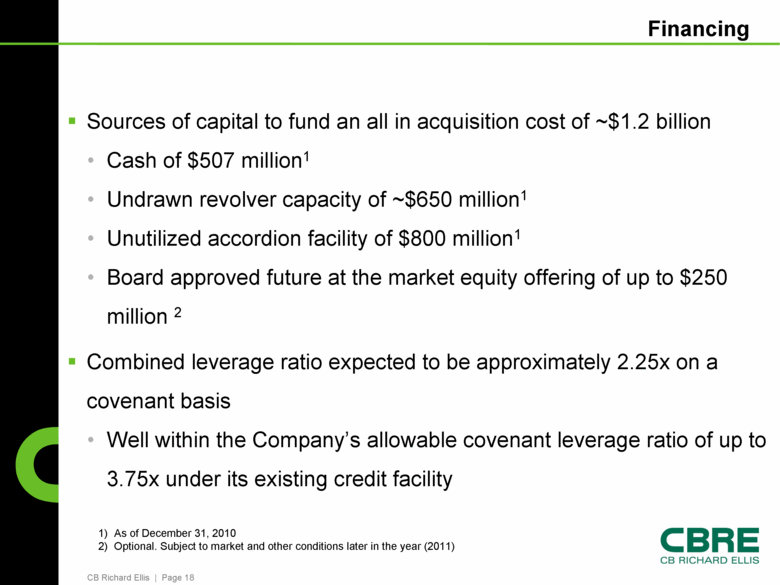
Financing Sources of capital to fund an all in acquisition cost of ~$1.2 billion Cash of $507 million1 Undrawn revolver capacity of ~$650 million1 Unutilized accordion facility of $800 million1 Board approved future at the market equity offering of up to $250 million 2 Combined leverage ratio expected to be approximately 2.25x on a covenant basis Well within the Company’s allowable covenant leverage ratio of up to 3.75x under its existing credit facility 1) As of December 31, 2010 2) Optional. Subject to market and other conditions later in the year (2011) |
|
|
Appendix |

|
|
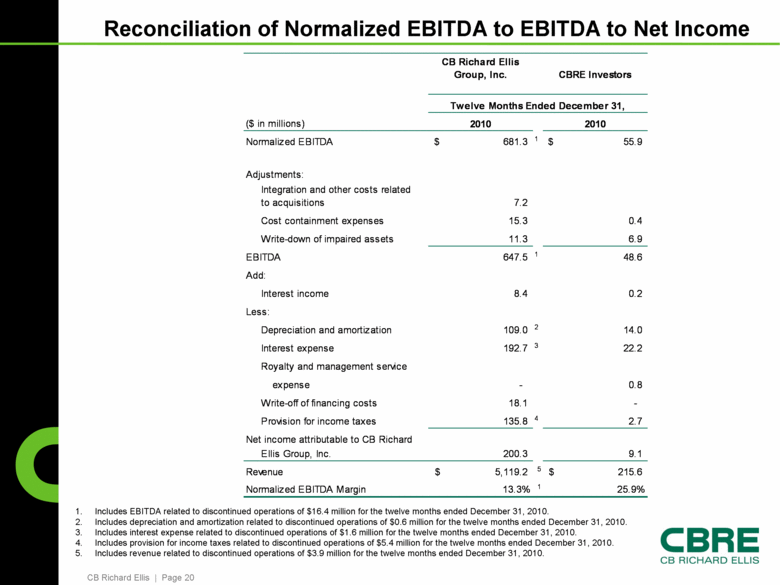
Reconciliation of Normalized EBITDA to EBITDA to Net Income Includes EBITDA related to discontinued operations of $16.4 million for the twelve months ended December 31, 2010. Includes depreciation and amortization related to discontinued operations of $0.6 million for the twelve months ended December 31, 2010. Includes interest expense related to discontinued operations of $1.6 million for the twelve months ended December 31, 2010. Includes provision for income taxes related to discontinued operations of $5.4 million for the twelve months ended December 31, 2010. Includes revenue related to discontinued operations of $3.9 million for the twelve months ended December 31, 2010. |