Attached files
Table of Contents
UNITED STATES
SECURITIES AND EXCHANGE COMMISSION
Washington, D.C. 20549
FORM 10-K
(Mark One)
| x | ANNUAL REPORT PURSUANT TO SECTION 13 OR 15(d) OF THE SECURITIES EXCHANGE ACT OF 1934 |
For the fiscal year ended November 30, 2010
OR
| ¨ | TRANSITION REPORT PURSUANT TO SECTION 13 OR 15(d) OF THE SECURITIES EXCHANGE ACT OF 1934 |
For the transition period from to
Commission File Number: 001-31892
SYNNEX CORPORATION
(Exact name of registrant as specified in its charter)
| Delaware | 94-2703333 | |
| (State or other jurisdiction of incorporation or organization) |
(IRS Employer Identification No.) | |
| 44201 Nobel Drive Fremont, California |
94538 | |
| (Address of principal executive offices) | (Zip Code) | |
(510) 656-3333
(Registrant’s telephone number, including area code)
Securities registered to Section 12(b) of the Act:
Common Stock, par value $0.001 per share
New York Stock Exchange
Securities registered pursuant to Section 12(g) of the Act: None
Indicate by check mark if the registrant is a well-known seasoned issuer, as defined in Rule 405 of the Securities Act. Yes ¨ No x
Indicate by check mark if the registrant is not required to file reports pursuant to Section 13 or Section 15(d) of the Act. Yes ¨ No x
Indicate by check mark whether the registrant (1) has filed all reports required to be filed by Section 13 or 15(d) of the Securities Exchange Act of 1934 during the preceding 12 months (or for such shorter period that the registrant was required to file such reports), and (2) has been subject to such filing requirements for the past 90 days. Yes x No ¨
Indicate by check mark whether the registrant has submitted electronically and posted on its corporate Web site, if any, every Interactive Data File required to be submitted and posted pursuant to Rule 405 of Regulation S-T (§232.405 of this chapter) during the preceding 12 months (or for such shorter period that the registrant was required to submit and post such files). Yes ¨ No ¨
Indicate by check mark if disclosure of delinquent filers pursuant to Item 405 of Regulation S-K is not contained herein, and will not be contained, to the best of registrant’s knowledge, in definitive proxy or information statements incorporated by reference in Part III of this Form 10-K or any amendment to this Form 10-K x
Indicate by check mark whether the registrant is a large accelerated filer, an accelerated filer, or a non-accelerated filer, or a smaller reporting company. See the definitions of “large accelerated filer,” “accelerated filer” and “smaller reporting company” in Rule 12b-2 of the Exchange Act. (Check one).
Large accelerated filer ¨ Accelerated filer x Non-accelerated filer ¨ Smaller reporting company ¨
Indicate by check mark whether the registrant is a shell company (as defined in Rule 12b-2 of the Exchange Act). Yes ¨ No x
The aggregate market value of Common Stock held by non-affiliates of the registrant (based upon the closing sale price on the New York Stock Exchange as of the last business day of the registrant’s most recently completed second fiscal quarter May 31, 2010) was $636,555,170. Shares held by each executive officer, director and by each person who owns 10% or more of the outstanding Common Stock have been excluded in that such persons may be deemed to be affiliates. This determination of affiliate status is not necessarily a conclusive determination for other purposes.
As of January 31, 2011, there were 36,294,297 shares of Common Stock, $0.001 per share par value, outstanding.
DOCUMENTS INCORPORATED BY REFERENCE
Items 10 (as to directors and Section 16(a) Beneficial Ownership Reporting Compliance), 11, 12 (as to Beneficial Ownership), 13 and 14 of Part III incorporate by reference information from the registrant’s proxy statement to be filed with the Securities and Exchange Commission in connection with the solicitation of proxies for the registrant’s 2011 Annual Meeting of Stockholders to be held on March 21, 2011.
Table of Contents
SYNNEX CORPORATION
2010 FORM 10-K
Table of Contents
When used in this Annual Report on Form 10-K (the “Report”), the words “believes,” “plans,” “estimates,” “anticipates,” “expects,” “intends,” “allows,” “can,” “may,” “designed,” “will,” and similar expressions are intended to identify forward-looking statements. These are statements that relate to future periods and include statements about our business model and our services, our market strategy, including expansion of our product lines, our infrastructure, our investment in our IT systems, anticipated benefits of our acquisitions, anticipated increase in fourth quarter seasonality, impact of our disposition of certain assets to MiTAC International Corporation, or MiTAC International, our revenue and operating results, our gross margins, competition with Synnex Technology International Corp., our future needs for additional financing, concentration of customers, adequacy of our facilities, our legal proceedings, expansion of our operations, our international operations, our strategic acquisitions of businesses and assets, adequacy of our cash resources to meet our capital needs, the settlement of our convertible notes, adequacy of our disclosure controls and procedures, dependency on personnel, pricing pressures, competition, impact of rules and regulations affecting public companies, impact of our pricing policies, our dividend policy, impact of our accounting policies, and statements regarding our securitization programs and revolving credit lines. Forward-looking statements are subject to risks and uncertainties that could cause actual results to differ materially from those projected. These risks and uncertainties include, but are not limited to, those risks discussed below, as well as the seasonality of the buying patterns of our customers, concentration of sales to large customers, dependence upon and trends in capital spending budgets in the IT industry, fluctuations in general economic conditions and risks set forth below under Part I, Item 1A, “Risk Factors.” These forward-looking statements speak only as of the date hereof. We expressly disclaim any obligation or undertaking to release publicly any updates or revisions to any forward-looking statements contained herein to reflect any change in our expectations with regard thereto or any change in events, conditions or circumstances on which any such statement is based.
In the sections of this Report entitled “Business Overview” and “Management’s Discussion and Analysis of Financial Condition and Results of Operations,” all references to “SYNNEX,” “we,” “us,” “our” or the “Company” mean SYNNEX Corporation and our subsidiaries, except where it is made clear that the term means only the parent company or one of its segments.
SYNNEX, the SYNNEX Logo, CONCENTRIX, the CONCENTRIX Logo, EMJ, NEW AGE ELECTRONICS, PC WHOLESALE, ASPIRE, ENCOVER, and all other SYNNEX company, product and services names and slogans are trademarks or registered trademarks of SYNNEX Corporation. SYNNEX and the SYNNEX Logo Reg. U.S. Pat. & Tm. Off. Other names and marks are the property of their respective owners.
| Item 1. | Business Overview |
We are a Fortune 500 corporation and a leading business process services company, servicing resellers, retailers and original equipment manufacturers, or OEMs, in multiple regions around the world. Our primary business process services are distribution and business process outsourcing, or BPO. We operate in two segments: distribution services and global business services, or GBS. Our distribution services segment distributes IT systems, peripherals, system components, software, networking equipment, consumer electronics, or CE, and complementary products. We also provide contract assembly services within our distribution segment. Our GBS segment offers a range of BPO services to our customers that include customer management, renewal management, back office processing and information technology outsourcing, or ITO, on a global platform. To further enhance our BPO solutions, we provide value-added support services such as demand generation, pre-sales support, product marketing, print and fulfillment, back office outsourcing and post-sales technical support.
We combine our core strengths in distribution with our BPO services to help our customers achieve greater efficiencies in time to market, cost minimization, real-time linkages in the supply chain and aftermarket product support. We distribute more than 20,000 technology products (as measured by SKUs) from more than 100 IT, CE
1
Table of Contents
and OEM suppliers to more than 15,000 resellers, system integrators, and retailers throughout the United States, Canada and Mexico. Our GBS segment provides outsourced services to customers in multiple, geographic locations and in multiple languages. As of November 30, 2010, we had over 8,000 full-time and temporary employees in both segments worldwide. From a geographic perspective, approximately 98% of our total revenue was from North America for each of the fiscal years ended November 30, 2010, 2009 and 2008.
We purchase IT systems, peripherals, system components, software, networking equipment, CE and complementary products from our primary suppliers such as Hewlett-Packard Company, or HP, Acer, Panasonic, Lenovo and Seagate and sell them to our reseller and retail customers. We perform a similar function for our distribution of licensed software products. Our reseller customers include VARs, corporate and government resellers, system integrators, direct marketers, and national and regional retailers.
Our distribution segment operates in the distribution and contract assembly services industries, which are characterized by low gross profit as a percentage of revenue, or gross margin, and low income from operations as a percentage of revenue, or operating margin. The market for IT and CE products and services is generally characterized by declining unit prices and short product life cycles. We set our sales price based on the market supply and demand characteristics for each particular product or bundle of products we distribute and services we provide.
In our distribution segment, we are highly dependent on the end-market demand for IT and CE products and services. This end-market demand is influenced by many factors including the introduction of new IT and CE products and software by OEMs, replacement cycles for existing IT and CE products, overall economic growth and general business activity. A difficult and challenging economic environment may also lead to consolidation or decline in the IT and CE industries and increased price-based competition.
Our GBS segment includes a variety of technologies and concentrations of employees. Any shift in business or size of the market and any failure of technology may impact the business offerings and programs. Generally, the employee turnover rate in this business and the risk of losing the experienced employees are high. Higher turnover rates can increase costs and decrease the operating efficiencies and productivity.
We have been in business since 1980 and are headquartered in Fremont, California. Our distribution segment has operations in the United States, Canada, Japan, and Mexico. Our GBS segment has operations in the United States, China, Costa Rica, India, the Philippines, and the United Kingdom. We were originally incorporated in the State of California as COMPAC Microelectronics, Inc. in November 1980, and we changed our name to SYNNEX Information Technologies, Inc. in February 1994. We later reincorporated in the State of Delaware under the name of SYNNEX Corporation in October 2003.
Our Products and Suppliers
We distribute a broad line of IT products, including IT systems, peripherals, system components, software and networking equipment for more than 100 OEM suppliers, enabling us to offer comprehensive solutions to our reseller and retail customers.
During fiscal year 2010, our product mix by category was in the following ranges:
| Product Category: |
||
| Peripherals |
32% - 36% | |
| IT Systems |
29% - 33% | |
| System Components |
14% - 18% | |
| Software |
11% - 15% | |
| Networking Equipment |
4% - 8% |
2
Table of Contents
Our suppliers include leading IT systems, networking equipment and CE suppliers. Our primary OEM suppliers are HP, Acer, Panasonic, Lenovo, Seagate, Lexmark, Microsoft, Intel, Xerox, and Symantec.
Our largest OEM supplier is HP. Revenue from the sale of HP products and services represented approximately 38%, 36%, and 32% of our revenue for fiscal years 2010, 2009, and 2008, respectively. We entered into a U.S. Business Development Partner Agreement with HP on November 6, 2003, which governs our relationship with HP in the United States. The agreement remains in effect until May 31, 2011 unless terminated earlier in accordance with its terms. Historically, the agreement has been renewed before expiration. As is typical with our OEM supplier agreements, either party may terminate the agreement upon 30 days written notice. In addition, either party may terminate the agreement with cause upon 15 days written notice. “Cause” is not defined in the agreement. In the event of any breach of the agreement by us, HP may terminate the agreement and we may be required to refund HP any discounts or program payments paid during the period we were in breach of the agreement and reimburse HP for reasonable attorneys’ fees. In the event the agreement is terminated for cause or if we fail to perform our obligations under the agreement, our agreements with HP for the resale of products, support and services will automatically terminate upon such default or termination. If either party becomes insolvent or bankrupt, the other party may terminate the agreement without notice and cancel any unfulfilled obligations, except for payment obligations. Our subsidiaries in Canada and Mexico have territorial supplier agreements with subsidiaries of HP located in the respective countries.
In addition to HP, we have distribution agreements with most of our suppliers. These agreements usually provide for nonexclusive distribution rights and pertain to specific geographic territories. The agreements are also generally short-term, subject to periodic renewal, and often contain provisions permitting termination by either our supplier or us without cause upon relatively short notice. An OEM supplier that elects to terminate a distribution agreement will generally repurchase its products carried in our inventory.
Our distribution and contract assembly business subjects us to the risk that the value of our inventory will be affected adversely by suppliers’ price reductions or by technological changes affecting the usefulness or desirability of the products comprising our inventory. Many of our OEM suppliers offer us limited protection from the loss in value of our inventory due to technological change or a supplier’s price reductions. Under many of these agreements, we have a limited period of time to return or exchange products or claim price protection credits. We monitor our inventory levels and attempt to time our purchases to maximize our protection under supplier programs.
Our Customers
We distribute IT products to more than 15,000 resellers, system integrators and retailers. Resellers are classified primarily by the end-users to whom they sell as well as the services they provide. End-users include large corporations or enterprises, federal, state and local governments, small/medium sized businesses, or SMBs, and individual consumers. In addition, resellers vary greatly in size and geographic reach. Our reseller customers buy from us and other distributors. Our larger reseller customers also buy certain products directly from OEM suppliers. Systems integrators offer services in addition to product resale, primarily in systems customization, integration, and deployment. Retailers serve mostly end-users and to a small degree, small office/home office customers.
In fiscal year 2010, one customer accounted for 11% of our total revenue. No customer accounted for more than 10% of our total revenue in fiscal years 2009 and 2008. Some of our largest customers include CDW Corporation, Iron Bow Technologies, Staples Business Depot, Systemax, Inc., and Insight Enterprises, Inc.
In our GBS segment, our customers are primarily manufacturers of hardware and CE devices and publishers of software.
3
Table of Contents
Our Services
We offer a variety of business process services to our customers. These services can be purchased individually or they can be purchased in combination with others in the form of supply chain solutions and aftermarket product support. The two major categories of services include the following:
Distribution Services. We have sophisticated pick, pack and ship operations, which allows us to efficiently receive shipments from our OEM suppliers and quickly fill orders for our reseller and retail customers. We generally stock or otherwise have access to the inventory of our OEM suppliers to satisfy the demands of our reseller and retail customers.
BPO Services. We provide BPO services to our customers that help them market and support their products in multiple geographies and languages. These services include customer management, renewal management, back office processing and ITO on a global platform, including technical support, demand generation and marketing and administration functions. We deliver these services through various methods including voice, chat, web, email, and digital print.
The above major categories of services are complemented by the following:
Contract Assembly Services. We provide our OEM contract assembly customers with systems design and build-to-order, or BTO, and configure-to-order, or CTO, assembly capabilities. BTO assembly consists of building a group of systems with the same pre-defined specifications, generally for our OEM customers’ inventory. CTO assembly consists of building a customized system for an OEM customer’s individual order specifications. We also offer production value-added services such as kitting, reconfiguration, asset tagging and hard drive imaging.
Logistics Services. We provide logistics support to our reseller customers such as outsourced fulfillment, virtual distribution and direct ship to end-users. Other logistics support activities we provide include generation of customized shipping documents, multi-level serial number tracking for customized, configured products and online order and shipment tracking. We also offer full turn-key logistics solutions designed to address the needs of large volume or specialty logistics services. Our full turn-key service offering is modular in nature and is designed to cover all aspects of the logistics lifecycle including, transportation management, inventory optimization, complementary product matching, reverse logistics, asset refurbishment and disposal and strategic procurement.
Online Services. We maintain electronic data interchange, or EDI, and web-based communication links with many of our reseller and retail customers. These links improve the speed and efficiency of our transactions with our customers by enabling them to search for products, check inventory availability and prices, configure systems, place and track orders, receive invoices, review account status and process returns. We also have web-based application software that allows our customers or their end-user customers to order software and take delivery online.
Financing Services. We offer our reseller customers a wide range of financing options, including net terms, third party leasing, floor plan financing, letters of credit backed financing and arrangements where we collect payments directly from the end-user. The availability and terms of our financing services are subject to our credit policies or those of third party financing providers to our customers.
Marketing Services. We offer our OEM suppliers a full range of marketing activities targeting resellers, system integrators and retailers including direct mail, external media advertising, reseller product training, targeted telemarketing campaigns, national and regional trade shows, database analysis, print on demand services and web-based marketing.
Technical Solutions Services. We provide our reseller customers technical support services, including pre-sales and post-sales support.
4
Table of Contents
For a discussion of our business by segments, please see Note 17—Segment Information in the Notes to the Consolidated Financial Statements.
Sales and Marketing
As of November 30, 2010, we employed 4,971 sales, marketing, contact center and demand generation services professionals. For distribution, we serve our large commercial, government reseller and retail customers through dedicated sales professionals. We market to smaller resellers and OEMs through dedicated regional sales teams. In addition, we have dedicated product management and sales specialists that focus on the sale and promotion of the products and services of selected suppliers or for specific end-market verticals. These specialists are also directly involved in establishing new relationships with leading OEMs to create demand for their products and services and with resellers for their customers’ needs. Our sales and marketing professionals are complemented by members of our executive management team who are integral in identifying potential new customer opportunities, promoting sales growth and ensuring customer satisfaction. We have sales and marketing professionals in close geographic proximity to our reseller, retail and OEM customers.
In addition, as part of our GBS segment, we have sales teams dedicated to cultivating new BPO opportunities in customer management, renewal management and back office processing on a global platform.
Our Operations
We operate over 20 distribution facilities in the United States, Canada and Mexico. Our distribution processes are highly automated to reduce errors, ensure timely order fulfillment and enhance the efficiency of our warehouse operations and back office administration. Our distribution facilities are geographically dispersed to be near reseller customers and their end-users. This decentralized, regional strategy enables us to benefit from lower shipping costs and shorter delivery lead times to our customers. Furthermore, we track several performance measurements to continuously improve the efficiency and accuracy of our distribution operations. Our regional locations also enable us to make local deliveries and provide will-call fulfillment to more customers than if our distribution operations were more centralized, resulting in better service to our customers. Our workforce is comprised of permanent and temporary employees, enabling us to respond to short-term changes in order activity.
Our proprietary IT systems and processes enable us to automate many of our distribution operations. We use radio frequency and bar code scanning technologies in all of our warehouse operations to maintain real-time inventory records, facilitate frequent cycle counts and improve the accuracy of order fulfillment. We use hand-held devices to capture real-time labor cost data, enabling efficient management of our daily labor costs.
To enhance the accuracy of our distribution order fulfillment and protect our inventory from shrinkage, our distribution systems also incorporate numerous controls. These controls include order weight checks, bar code scanning, and serial number profile verification that the product shipped matches the customer order. We also use digital video imaging to record our small package shipping activities by order. These images and other warehouse and shipping data are available online to our customer service representatives, enabling us to quickly respond to order inquiries by our customers.
We operate our principal contract assembly facilities in the United States. We generally assemble IT systems, including servers and IT appliances, by incorporating system components from our distribution inventory and other sources. Additionally, we perform production value-added services, including kitting, asset tagging, hard drive imaging and reconfiguration. Our contract assembly facilities are ISO 9001:2008 and ISO 14001:2004 certified.
In our GBS segment, we provide a comprehensive range of services to enhance the customer lifecycle and acquire, support, retain and renew customer relationships. These services primarily consist of technical support,
5
Table of Contents
customer service, renewal management, demand generation, back office support for sales, marketing and administrative functions, ITO services and solutions. Services are provided from multiple global locations to customers worldwide in multiple languages. The GBS services platform is supported by proprietary technology to enable efficient and secure customer contact through various methods including voice, chat, web, e-mail and digital print.
International Operations
Approximately 17% of our total revenue for both fiscal years 2010 and 2009, and approximately 20% for fiscal year 2008, originated outside of the United States. Approximately 15% for both fiscal years 2010 and 2009, and 18% for fiscal year 2008, of our total revenue was generated in Canada. A key element in our business strategy has been to locate our services in markets that are cost beneficial, but low risk. For a discussion of our net revenue by geographic region, please see Note 17—Segment Information in the Notes to the Consolidated Financial Statements.
Purchasing
Product costs represent our single largest expense and IT and CE product inventory is one of our largest working capital investments. Furthermore, product procurement from our OEM suppliers is a highly complex process that involves incentive programs, rebate programs, price protection, volume and early payment discounts and other arrangements. Consequently, efficient and effective purchasing operations are critical to our success.
Our purchasing group works closely with many areas of our organization, especially our product managers who work closely with our OEM suppliers and our sales force, to understand the volume and mix of IT products that should be purchased. In addition, the purchasing group utilizes an internally developed, proprietary information systems application tool, which further aids in forecasting future product demand based on several factors, including historical sales levels, expected product life cycle and current and projected economic conditions. Our information system tools also track warehouse and channel inventory levels and open purchase orders on a real-time basis enabling us to stock inventory at a regional level closer to the customer as well as to actively manage our working capital resources. This level of automation promotes greater efficiencies of inventory management by replenishing and turning inventory, as well as placing purchase orders on a more frequent basis. Furthermore, our system tools also allow for automated checks and controls to prevent the generation of inaccurate orders.
Managing our OEM supplier incentive programs is another critical function of our purchasing group. We attempt to maximize the benefits of incentives, rebates and volume and early payment discounts that our OEM suppliers offer us from time to time. We carefully evaluate these supplier incentive benefits relative to our product handling and carrying costs so that we do not overly invest in our inventory. We also closely monitor inventory levels on a product-by-product basis and plan purchases to take advantage of OEM supplier provided price protection. By managing inventory levels and customer purchase patterns at each of our regional distribution facilities, we can minimize our shipping costs by stocking products near to our resellers, retailers, and their end-user customers.
Financial Services
We offer various financing options to our customers as well as prepayment, credit card and cash on delivery terms. We also collect outstanding accounts receivable on behalf of our reseller customers in certain situations. In issuing credit terms to our reseller and retail customers, we closely and regularly monitor their creditworthiness through our information systems, credit ratings information and periodic detailed credit file reviews by our financial services staff. We have also purchased credit insurance in some geographies to further control credit risks. Finally, we establish reserves for estimated credit losses in the normal course of business based on the overall quality and aging of the accounts receivable portfolio, the existence of a limited amount of credit insurance and specifically identified customer risks.
6
Table of Contents
We also sell to certain reseller customers pursuant to third party floor plan financing. The expenses charged by these financing companies are subsidized either by our OEM suppliers or paid by us. We generally receive payment from these financing companies within 15 to 30 days from the date of sale, depending on the specific arrangement.
Information Technology
Our IT systems manage the entire order cycle, including processing customer orders, production planning, customer billing and payment tracking. These internally developed IT systems make our operations more efficient and provide visibility into our operations. We believe our IT infrastructure is scalable to support further growth. Continuous enhancement of our IT systems improves product and inventory management, streamlines order and fulfillment processes, and increases operational flexibility.
To allow our customers and suppliers to communicate and transact business with us in an efficient and consistent manner, we have implemented a mix of proprietary and off-the-shelf software programs, which integrate our IT systems with those of our customers and suppliers. In particular, we maintain EDI and web-based communication links with many of our reseller and retail customers to enable them to search for products, check real-time pricing, inventory availability and specifications, place and track orders, receive invoices and process returns. We plan to continue making significant investments in our IT systems to facilitate the flow of information, increase our efficiency and lower transaction costs.
Competition
We operate in a highly competitive environment, both in the United States and internationally. The IT product industry is characterized by intense competition, based primarily on product availability, credit terms, price, speed and accuracy of delivery, effectiveness of sales and marketing programs, ability to tailor specific solutions to customer needs, quality and depth of product lines, pre-sale and post-sale technical support, flexibility and timely response to design changes, technological capabilities and product quality, service and support. We compete with a variety of regional, national and international IT product distributors and manufacturers.
Our major competitors in IT product distribution include Arrow Electronics, Inc., Avnet, Inc., Ingram Micro, Inc., ScanSource, Inc., Westcon Group and Tech Data Corporation and, to a lesser extent, regional distributors. We also face competition from our OEM suppliers, which also sell directly to resellers, retailers and end-users. The distribution industry has historically undergone, and continues to undergo, consolidation. Over the years, a number of providers within the IT distribution industry exited or merged with other providers. We have participated in this consolidation through our acquisitions of Merisel Canada, Inc., Gates/Arrow, EMJ Data Systems Limited, Azerty United Canada, PC Wholesale, New Age Electronics, Jack of All Games, and Marubeni Infotec Corporation, and we continue to evaluate other new opportunities. Our major competitors in our global business services include Teleperformance, TeleTech Holdings, Inc. and Accenture, and other global and regional service providers.
We constantly seek to expand our business into areas primarily related to our core distribution business as well as other support, logistics, BPO and related value-added services. As we enter new business areas, we may encounter increased competition from our current competitors and/or new competitors.
Some of our competitors are substantially larger and may have greater financial, operating, manufacturing and marketing resources than us. Some of our competitors may have broader geographic breadth and range of services than us. Some may have more developed relationships with their existing customers. We attempt to offset our comparative scale differences by focusing on a limited number of leading OEMs in the distribution segment and by running a more efficient and low cost operation, and by offering a high level of value-add and customer service in both the distribution and GBS segments.
7
Table of Contents
Employees
As of November 30, 2010, we had 7,454 full-time employees, including 4,971 professionals in sales, marketing, contact center, renewal management, and demand generation services, 1,735 in operations, and 748 in executive, finance, IT and administration. Given the variability in our business and the quick response time required by customers, it is critical that we are able to rapidly ramp-up and ramp-down our distribution capabilities to maximize efficiency. As a result, we frequently use a significant number of temporary or contract workers, which totaled 651, on a full-time equivalent basis, as of November 30, 2010. Our employees are not represented by a labor union, nor are they covered by a collective bargaining agreement. We consider our employee relations to be good.
Available Information
Our website is http://www.synnex.com. We make available free of charge, on or through our website, our Annual Report on Form 10-K, quarterly reports on Form 10-Q, current reports on Form 8-K and amendments to those reports, if any, or other filings filed or furnished pursuant to Section 13(a) or 15(d) of the Exchange Act as soon as reasonably practicable after electronically filing or furnishing these reports with the Securities and Exchange Commission, or SEC. Information contained on our website is not a part of this report. We have adopted a code of ethics applicable to our employees including our principal executive, financial and accounting officers, and it is available free of charge, on our website’s investor relations page.
The SEC maintains an Internet site at http://www.sec.gov that contains the Annual Report on Form 10-K, quarterly reports on Form 10-Q, current reports on Form 8-K and amendments to those reports, if any, or other filings filed or furnished pursuant to Section 13(a) or 15(d) of the Exchange Act, proxy and information statements of ours. All reports that we file with the SEC may be read and copied at the SEC’s Public Reference Room at 100 F Street, N.E., Washington, DC, 20549. Information about the operation of the Public Reference Room can be obtained by calling the SEC at 1-800-SEC-0330.
| Item 1A. | Risk Factors |
The following are certain risk factors that could affect our business, financial results and results of operations. These risk factors should be considered in connection with evaluating the forward-looking statements contained in this Annual Report on Form 10-K because these factors could cause the actual results and conditions to differ materially from those projected in the forward-looking statements. Before you invest in our Company, you should know that making such an investment involves some risks, including the risks described below. The risks that have been highlighted here are not the only ones that we face. If any of the risks actually occur, our business, financial condition or results of operations could be negatively affected. In that case, the trading price of our common stock could decline, and you may lose all or part of your investment.
Risks Related to Our Business
We anticipate that our revenue and operating results will fluctuate, which could adversely affect the enterprise value of our Company and our securities.
Our operating results have fluctuated and will fluctuate in the future as a result of many factors, including:
| • | general economic conditions and level of IT and CE spending; |
| • | the loss or consolidation of one or more of our significant OEM suppliers or customers; |
| • | market acceptance, product mix and useful life of the products we distribute; |
| • | market acceptance, quality, pricing and availability of our services; |
| • | competitive conditions in our industries that impact our margins; |
8
Table of Contents
| • | pricing, margin and other terms with our OEM suppliers; |
| • | decline in inventory value as a result of product obsolescence and market acceptance; |
| • | variations in our levels of excess inventory and doubtful accounts, and changes in the terms of OEM supplier-inventory protections, such as price protection and return rights; and |
| • | the impact of the business acquisitions and dispositions we make. |
Although we attempt to control our expense levels, these levels are based, in part, on anticipated revenue. Therefore, we may not be able to control spending in a timely manner to compensate for any unexpected revenue shortfall.
Our operating results also are affected by the seasonality of the IT and CE products and services industry. We have historically experienced higher sales in our fourth fiscal quarter due to patterns in the capital budgeting, federal government spending and purchasing cycles of end-users. These patterns may not be repeated in subsequent periods. You should not rely on period-to-period comparisons of our operating results as an indication of future performance. The results of any quarterly period are not indicative of results to be expected for a full fiscal year. In future quarters, our operating results may be below our expectations or those of our public market analysts or investors, which would likely cause our share price to decline.
We depend on a small number of OEMs to supply the IT and CE products and services that we sell and the loss of, or a material change in, our business relationship with a major OEM supplier could adversely affect our business, financial position and operating results.
Our future success is highly dependent on our relationships with a small number of OEM suppliers. Sales of HP products and services represented approximately 38%, 36%, and 32% of our total revenue in fiscal years 2010, 2009, and 2008, respectively. Our OEM supplier agreements typically are short-term and may be terminated without cause upon short notice. For example, our agreement with HP will expire on May 31, 2011. The loss or deterioration of our relationships with a major OEM supplier, the authorization by OEM suppliers of additional distributors, the sale of products by OEM suppliers directly to our reseller and retail customers and end-users, or our failure to establish relationships with new OEM suppliers or to expand the distribution and supply chain services that we provide OEM suppliers could adversely affect our business, financial position and operating results. For example in fiscal year 2008, International Business Machines Corporation, or IBM, terminated its approval to market IBM System X and related products and services. In addition, OEM suppliers may face liquidity or solvency issues that in turn could negatively affect our business and operating results.
Our business is also highly dependent on the terms provided by our OEM suppliers. Generally, each OEM supplier has the ability to change the terms and conditions of its distribution agreements, such as reducing the amount of price protection and return rights or reducing the level of purchase discounts, rebates and marketing programs available to us. From time to time we may conduct business with a supplier without a formal agreement because the agreement has expired or otherwise. In such case, we are subject to additional risk with respect to products, warranties and returns, and other terms and conditions. If we are unable to pass the impact of these changes through to our reseller and retail customers, our business, financial position and operating results could be adversely affected.
Our gross margins are low, which magnifies the impact of variations in revenue, operating costs and bad debt on our operating results.
As a result of significant price competition in the IT and CE products and services industry, our gross margins are low, and we expect them to continue to be low in the future. Increased competition arising from industry consolidation and low demand for certain IT and CE products and services may hinder our ability to maintain or improve our gross margins. These low gross margins magnify the impact of variations in revenue, operating costs and bad debt on our operating results. A portion of our operating expenses is relatively fixed, and
9
Table of Contents
planned expenditures are based in part on anticipated orders that are forecasted with limited visibility of future demand. As a result, we may not be able to reduce our operating expenses as a percentage of revenue to mitigate any further reductions in gross margins in the future. If we cannot proportionately decrease our cost structure in response to competitive price pressures, our business and operating results could suffer.
We also receive purchase discounts and rebates from OEM suppliers based on various factors, including sales or purchase volume and breadth of customers. A decrease in net sales could negatively affect the level of volume rebates received from our OEM suppliers and thus, our gross margins. Because some rebates from OEM suppliers are based on percentage increases in sales of products, it may become more difficult for us to achieve the percentage growth in sales required for larger discounts due to the current size of our revenue base. A decrease or elimination of purchase discounts and rebates from our OEM suppliers would adversely affect our business and operating results.
Because we sell on a purchase order basis, we are subject to uncertainties and variability in demand by our reseller, retail and contract assembly services customers, which could decrease revenue and adversely affect our operating results.
We sell to our reseller, retail and contract assembly services customers on a purchase order basis, rather than pursuant to long-term contracts or contracts with minimum purchase requirements. Consequently, our sales are subject to demand variability by our reseller, retail and contract assembly services customers. The level and timing of orders placed by our customers vary for a variety of reasons, including seasonal buying by end-users, the introduction of new hardware and software technologies and general economic conditions. Customers submitting a purchase order may cancel, reduce or delay their orders. If we are unable to anticipate and respond to the demands of our reseller, retail and contract assembly services customers, we may lose customers because we have an inadequate supply of products, or we may have excess inventory, either of which may harm our business, financial position and operating results.
The success of our contact center business is subject to the terms and conditions of our customer contracts.
We provide contact center support services to our customers under contracts with provisions that could impact our profitability. Many of our contracts have short termination provisions that could cause fluctuations in our revenue and operating results from period to period. For example, some contracts have performance related bonus or penalty provisions, whereby we could receive a bonus if we satisfy certain performance levels or have to pay a penalty for failing to do so. In addition, our customers may not guarantee a minimum call volume; however, we hire employees based on anticipated average call volumes. The reduction of call volume, loss of any customers, payment of any penalties for failure to meet performance levels or inability to terminate any unprofitable contracts may have an adverse impact on our operations and financial results.
We are subject to the risk that our inventory value may decline, and protective terms under our OEM supplier agreements may not adequately cover the decline in value, which in turn may harm our business, financial position and operating results.
The IT and CE products industry is subject to rapid technological change, new and enhanced product specification requirements, and evolving industry standards. These changes may cause inventory on hand to decline substantially in value or to rapidly become obsolete. Most of our OEM suppliers offer limited protection from the loss in value of inventory. For example, we can receive a credit from many OEM suppliers for products held in inventory in the event of a supplier price reduction. In addition, we have a limited right to return a certain percentage of purchases to most OEM suppliers. These policies are often subject to time restrictions and do not protect us in all cases from declines in inventory value. In addition, our OEM suppliers may become unable or unwilling to fulfill their protection obligations to us. The decrease or elimination of price protection or the inability of our OEM suppliers to fulfill their protection obligations could lower our gross margins and cause us to record inventory write-downs. If we are unable to manage our inventory with our OEM suppliers with a high
10
Table of Contents
degree of precision, we may have insufficient product supplies or we may have excess inventory, resulting in inventory write-downs, either of which may harm our business, financial position and operating results.
We depend on OEM suppliers to maintain an adequate supply of products to fulfill customer orders on a timely basis, and any supply shortages or delays could cause us to be unable to timely fulfill orders, which in turn could harm our business, financial position and operating results.
Our ability to obtain particular products in the required quantities and to fulfill reseller and retail customer orders on a timely basis is critical to our success. In most cases, we have no guaranteed price or delivery agreements with our OEM suppliers. We occasionally experience a supply shortage of certain products as a result of strong demand or problems experienced by our OEM suppliers. If shortages or delays persist, the price of those products may increase, or the products may not be available at all. In addition, our OEM suppliers may decide to distribute, or to substantially increase their existing distribution business, through other distributors, their own dealer networks, or directly to resellers, retailers or end-users. Accordingly, if we are not able to secure and maintain an adequate supply of products to fulfill our reseller and retail customer orders on a timely basis, our business, financial position and operating results may be adversely affected.
The market for our video game titles and video game hardware is characterized by short product life cycles. Increased competition for limited shelf space, decreased promotional support from resellers or retailers or increased popularity of downloadable or online games could adversely impact our revenue.
The market for video games is characterized by short product life cycles and frequent introductions of new products. The life cycle of a video game generally involves a relatively high level of sales during the first few months after introduction followed by a rapid decline in sales and may result in product obsolescence. Therefore, the markets in which we compete frequently introduce new products. As a result, competition is intense for resellers’ and retailers’ limited shelf space and promotions. If our vendors’ new products are not introduced in a timely manner or do not achieve significant market acceptance, we may not generate sufficient sales or profitability. Further, if we are unable to successfully compete for resellers’ or retailers’ space and promotional resources, this could negatively impact market acceptance of our products and negatively impact our business and operating results.
In addition to competing with video game manufacturers, we compete with downloadable and online gaming providers and used video game resellers. The popularity of downloadable and online games has increased and continued increases in downloadable and online gaming may result in a reduced level of over the counter retail video games sales. In addition, certain of our video game reseller and retail customers sell used video games that are generally priced lower than new video games, which could result in an increase in pricing pressure. If such customers increase their mix of sales of used video games relative to new video games, it could negatively impact our sales of new video games.
Because we conduct substantial operations in China, risks associated with economic, political and social events in China could negatively affect our business and operating results.
A substantial portion of our IT systems operations, including our IT systems support and software development operations is located in China. In addition, we also conduct general and administrative activities from our facility in China. As of November 30, 2010, we had 928 support personnel located in China. Our operations in China are subject to a number of risks relating to China’s economic and political systems, including:
| • | a government controlled foreign exchange rate and limitations on the convertibility of the Chinese Renminbi; |
| • | extensive government regulation; |
| • | changing governmental policies relating to tax benefits available to foreign-owned businesses; |
11
Table of Contents
| • | the telecommunications infrastructure; |
| • | a relatively uncertain legal system; and |
| • | uncertainties related to continued economic and social reform. |
Our IT systems are an important part of our global operations. Any significant interruption in service, whether resulting from any of the above uncertainties, natural disasters or otherwise, could result in delays in our inventory purchasing, errors in order fulfillment, reduced levels of customer service and other disruptions in operations, any of which could cause our business and operating results to suffer.
We may have higher than anticipated tax liabilities.
We conduct business globally and file income tax returns in various tax jurisdictions. Our effective tax rate could be adversely affected by several factors, many of which are outside of our control, including:
| • | changes in income before taxes in various jurisdictions in which we operate that have differing statutory tax rates; |
| • | changing tax laws, regulations, and/or interpretations of such tax laws in multiple jurisdictions; |
| • | effect of tax rate on accounting for acquisitions and dispositions; |
| • | resolution of issues arising from tax audit or examinations and any related interest or penalties; and |
| • | uncertainty in obtaining tax holiday extensions, expiration or loss of tax holidays in various jurisdictions. |
We report our results of operations based on our determination of the amount of taxes owed in various tax jurisdictions in which we operate. The determination of our worldwide provision for income taxes and other tax liabilities requires estimation, judgment and calculations where the ultimate tax determination may not be certain. Our determination of tax liability is always subject to review or examination by tax authorities in various tax jurisdictions. Any adverse outcome of such review or examination could have a negative impact on our operating results and financial condition. The results from various tax examinations and audit may differ from the liabilities recorded in our financial statements and may adversely affect our financial results and cash flows.
We have pursued and intend to continue to pursue strategic acquisitions or investments in new markets and may encounter risks associated with these activities, which could harm our business and operating results.
We have in the past pursued and in the future expect to pursue acquisitions of, or investments in, businesses and assets in new markets, either within or outside the IT and CE products and services industry, that complement or expand our existing business. Our acquisition strategy involves a number of risks, including:
| • | difficulty in successfully integrating acquired operations, IT systems, customers, and OEM supplier relationships, products and services and businesses with our operations; |
| • | loss of key employees of acquired operations or inability to hire key employees necessary for our expansion; |
| • | diversion of our capital and management attention away from other business issues; |
| • | increase in our expenses and working capital requirements; |
| • | in the case of acquisitions that we may make outside of the United States, difficulty in operating in foreign countries and over significant geographical distances; and |
| • | other financial risks, such as potential liabilities of the businesses we acquire. |
12
Table of Contents
We may incur additional costs and consolidate certain redundant expenses in connection with our acquisitions and investments, which may have an adverse impact on our operating margins. Future acquisitions may result in dilutive issuances of equity securities, the incurrence of additional debt, large write-offs, a decrease in future profitability, or future losses. The incurrence of debt in connection with any future acquisitions could restrict our ability to obtain working capital or other financing necessary to operate our business. Our recent and future acquisitions or investments may not be successful, and if we fail to realize the anticipated benefits of these acquisitions or investments, our business and operating results could be harmed.
Because of the capital-intensive nature of our business, we need continued access to capital, which, if not available to us or if not available on favorable terms, could harm our ability to operate or expand our business.
Our business requires significant levels of capital to finance accounts receivable and product inventory that is not financed by trade creditors. If cash from available sources is insufficient, proceeds from our accounts receivable securitization and revolving credit programs are limited or cash is used for unanticipated needs, we may require additional capital sooner than anticipated. In the event we are required, or elect, to raise additional funds, we may be unable to do so on favorable terms, or at all, and may incur expenses in raising the additional funds. Our current and future indebtedness could adversely affect our operating results and severely limit our ability to plan for, or react to, changes in our business or industry. We could also be limited by financial and other restrictive covenants in any securitization or credit arrangements, including limitations on our borrowing of additional funds and issuing dividends. Furthermore, the cost of securitization or debt financing could significantly increase in the future, making it cost prohibitive to securitize our accounts receivable or borrow, which could force us to issue new equity securities. If we issue new equity securities, existing stockholders may experience dilution, or the new equity securities may have rights, preferences or privileges senior to those of existing holders of common stock. If we cannot raise funds on acceptable terms, we may not be able to take advantage of future opportunities or respond to competitive pressures or unanticipated requirements. Any inability to raise additional capital when required could have an adverse effect on our business and operating results.
The terms of our debt arrangements impose significant restrictions on our ability to operate which in turn could negatively affect our ability to respond to business and market conditions and therefore could have an adverse effect on our business and operating results.
As of November 30, 2010, we had $386.3 million in outstanding short and long-term borrowings under term loans, convertible senior notes and lines of credit, excluding trade payables. The terms of one or more of the agreements under which this indebtedness was incurred may limit or restrict, among other things, our ability to:
| • | incur additional indebtedness; |
| • | pay dividends or make certain other restricted payments; |
| • | consummate certain asset sales or acquisitions; |
| • | enter into certain transactions with affiliates; and |
| • | merge, consolidate or sell, assign, transfer, lease, convey or otherwise dispose of all or substantially all of our assets. |
We are also required to maintain specified financial ratios and satisfy certain financial condition tests, including a minimum net worth and a fixed charge coverage ratio as outlined in our senior secured revolving line of credit arrangement. Our inability to meet these ratios and tests could result in the acceleration of the repayment of the related debt, the termination of the facility, the increase in our effective cost of funds or the cross-default of other credit and securitization arrangements. As a result, our ability to operate may be restricted and our ability to respond to business and market conditions may be limited, which could have an adverse effect on our business and operating results.
13
Table of Contents
We may not be able to generate sufficient cash to service all of our indebtedness and may be forced to take other actions to satisfy our obligations under our indebtedness or we may experience a financial failure, which may hinder the repayment of our convertible debt.
Our ability to make scheduled debt payments or to refinance our debt obligations depends on our financial and operating performance, which is subject to prevailing economic and competitive conditions and to certain financial, business and other factors beyond our control. We cannot be certain that we will maintain a level of cash flows from operating activities sufficient to permit us to pay the principal, premium, if any, and interest on our indebtedness.
If our cash flows and capital resources are insufficient to fund our debt service obligations, we may be forced to reduce or delay capital expenditures, sell assets or operations, seek additional capital or restructure or refinance our indebtedness. We cannot be certain that we would be able to take any of these actions, that these actions would be successful and permit us to meet our scheduled debt service obligations or that these actions would be permitted under the terms of our existing or future debt agreements. In the absence of such operating results and resources, we could face substantial liquidity problems and might be required to dispose of material assets or operations to meet our debt service and other obligations. Some of our credit facilities restrict our ability to dispose assets and use the proceeds from the disposition. We may not be able to consummate those dispositions or to obtain the proceeds which we could realize from them and these proceeds may not be adequate to meet any debt service obligations then due.
If we cannot make scheduled payments on our debt, we will be in default and, as a result:
| • | our debt holders could declare all outstanding principal and interest to be due and payable; |
| • | the lenders under our credit agreement could terminate their commitments to loan us money and foreclose against the assets securing their borrowings; and |
| • | we could be forced into bankruptcy or liquidation, which is likely to result in delays in the payment of our indebtedness and in the exercise of enforcement remedies related to our indebtedness. |
A portion of our revenue is financed by floor plan financing companies and any termination or reduction in these financing arrangements could increase our financing costs and harm our business and operating results.
A portion of our product distribution revenue is financed by floor plan financing companies. Floor plan financing companies are engaged by our customers to finance, or floor, the purchase of products from us. In exchange for a fee, we transfer the risk of loss on the sale of our products to the floor plan companies. We currently receive payment from these financing companies within approximately 15 to 30 days from the date of the sale, which allows our business to operate at much lower relative working capital levels than if such programs were not available. If these floor plan arrangements are terminated or substantially reduced, the need for more working capital and the increased financing cost could harm our business and operating results.
We have significant credit exposure to our customers, and negative trends in their businesses could cause us significant credit loss and negatively impact our cash flow and liquidity position.
We extend credit to our customers for a significant portion of our sales to them and they have a period of time, generally 30 days after the date of invoice, to make payment. As a result, we are subject to the risk that our customers will not pay on time or at all. The majority of our customers are small and medium sized businesses. Our credit exposure risk may increase due to financial difficulties or liquidity or solvency issues experienced by our customers, resulting in their inability to repay us. The liquidity or solvency issues may increase as a result of an economic downturn or a decrease in IT or CE spending by end-users. If we are unable to collect payments in a timely manner from our customers due to changes in financial or economic conditions, or for other reasons, and we are unable to collect under our credit insurance policies, we may write off the amount due from the
14
Table of Contents
customers. These write-offs may result in more expensive credit insurance and negatively impact our ability to utilize accounts receivable-based financing. These circumstances could negatively impact our cash flow and liquidity position. Further, we are exposed to higher collection risk as we continue to expand internationally, where the payment cycles are generally longer and the credit rating process may not be as robust as in the United States.
In addition, our Mexico operations primarily focus on various long-term projects with government and other local agencies, which often involve extended payment terms and could expose us to additional collection risks.
We may suffer adverse consequences from changing interest rates.
Our borrowings and securitization arrangements are variable-rate obligations that could expose us to interest rate risks. As of November 30, 2010, we had $245.3 million in such variable-rate obligations. If interest rates increase, our interest expense would increase, which would negatively affect our net income. An increase in interest rates may increase our future borrowing costs and restrict our access to capital.
Additionally, current market conditions, the subprime mortgage crisis, and overall credit conditions could limit our availability of capital, which could cause increases in interest margin spreads over underlying indices, effectively increasing the cost of our borrowing. While some of our credit facilities have contractually negotiated spreads, terms such as these are subject to ongoing negotiations.
We may experience theft of product from our warehouses, water damage to our properties and other casualty events which could harm our operating results.
From time to time we have experienced incidents of theft at various facilities, water damages to our properties and other casualty events. These types of incidents may make it more difficult or expensive for us to obtain insurance coverage in the future. Also, the same or similar incidents may occur in the future for which we may not have sufficient insurance coverage or policy limits to be fully compensated for the loss, which may have an adverse effect on our business and financial results. For example, in fiscal year 2010, we experienced a loss of product as a result of a train derailment.
We are dependent on a variety of IT and telecommunications systems, and any failure of these systems could adversely impact our business and operating results.
We depend on IT and telecommunications systems for our operations. These systems support a variety of functions including inventory management, order processing, shipping, shipment tracking, billing, and contact center support.
Failures or significant downtime of our IT or telecommunications systems could prevent us from taking customer orders, printing product pick-lists, shipping products, billing customers and handling call volume. Sales also may be affected if our reseller and retail customers are unable to access our pricing and product availability information. We also rely on the Internet, and in particular electronic data interchange, or EDI, for a large portion of our orders and information exchanges with our OEM suppliers and reseller and retail customers. The Internet and individual websites have experienced a number of disruptions and slowdowns, some of which were caused by organized attacks. In addition, some websites have experienced security breakdowns. If we were to experience a security breakdown, disruption or breach that compromised sensitive information, it could harm our relationship with our OEM suppliers and reseller and retail customers. Disruption of our website or the Internet in general could impair our order processing or more generally prevent our OEM suppliers and reseller and retail customers from accessing information. Our contact call center is dependent upon telephone and data services provided by third party telecommunications service vendors and our IT and telecommunications system. Any significant increase in our IT and telecommunications costs or temporary or permanent loss of our IT or telecommunications systems could harm our relationships with our customers. The occurrence of any of these events could have an adverse effect on our operations and financial results.
15
Table of Contents
We rely on independent shipping companies for delivery of products, and price increases or service interruptions from these carriers could adversely affect our business and operating results.
We rely almost entirely on arrangements with independent shipping companies, such as FedEx and UPS, for the delivery of our products from OEM suppliers and delivery of products to reseller and retail customers. Freight and shipping charges can have a significant impact on our gross margin. As a result, an increase in freight surcharges due to rising fuel cost or general price increases will have an immediate adverse effect on our margins, unless we are able to pass the increased charges to our reseller and retail customers or renegotiate terms with our OEM suppliers. In addition, in the past, UPS has experienced work stoppages due to labor negotiations with management. An increase in freight or shipping charges, the termination of our arrangements with one or more of these independent shipping companies, the failure or inability of one or more of these independent shipping companies to deliver products, or the unavailability of their shipping services, even temporarily, could have an adverse effect on our business and operating results.
Changes in foreign exchange rates and limitations on the convertibility of foreign currencies could adversely affect our business and operating results.
In both the fiscal years ended November 30, 2010 and 2009, approximately 17% of our total revenue was generated outside the United States. Most of our international revenue, cost of revenue and operating expenses are denominated in foreign currencies. We presently have currency exposure arising from both sales and purchases denominated in foreign currencies. Changes in exchange rates between foreign currencies and the U.S. dollar may adversely affect our operating margins. For example, if these foreign currencies appreciate against the U.S. dollar, it will make it more expensive in terms of U.S. dollars to purchase inventory or pay expenses with foreign currencies. This could have a negative impact to us if revenue related to these purchases is transacted in U.S. dollars. In addition, currency devaluation can result in a loss to us if we hold deposits of that currency and make our products, which are usually purchased by us with U.S. dollars, relatively more expensive than products manufactured locally. We currently conduct only limited hedging activities, which involve the use of currency forward contracts. Hedging foreign currencies can be risky. There is also additional risk if the currency is not freely or actively traded. Some currencies, such as the Chinese Renminbi, Indian Rupee and Philippines Peso, are subject to limitations on conversion into other currencies, which can limit our ability to hedge or to otherwise react to rapid foreign currency devaluations. We cannot predict the impact of future exchange rate fluctuations on our business and operating results.
Because of the experience of our key personnel in the IT and CE industries and their technological and industry expertise, if we were to lose any of our key personnel, it could inhibit our ability to operate and grow our business successfully.
We operate in the highly competitive IT and CE industries. We are dependent in large part on our ability to retain the services of our key senior executives and other technical and industry experts and personnel. Except for Kevin Murai, our President and Chief Executive Officer, our employees and executives generally do not have employment agreements. Furthermore, we do not carry “key person” insurance coverage for any of our key executives. We compete for qualified senior management and technical personnel. The loss of, or inability to hire, key executives or qualified employees could inhibit our ability to operate and grow our business successfully.
We may become involved in intellectual property or other disputes that could cause us to incur substantial costs, divert the efforts of our management, and require us to pay substantial damages or require us to obtain a license, which may not be available on commercially reasonable terms, if at all.
We may from time to time receive notifications alleging infringements of intellectual property rights allegedly held by others relating to our business or the products we sell or assemble for our OEM suppliers and others. Litigation with respect to patents or other intellectual property matters could result in substantial costs and diversion of management and other resources and could have an adverse effect on our business. Although we
16
Table of Contents
generally have various levels of indemnification protection from our OEM suppliers and contract assembly services customers, in many cases any indemnification to which we may be entitled is subject to maximum limits or other restrictions. In addition, we have developed proprietary IT systems that play an important role in our business. If any infringement claim is successful against us and if indemnification is not available or sufficient, we may be required to pay substantial damages or we may need to seek and obtain a license of the other party’s intellectual property rights. We may be unable to obtain such a license on commercially reasonable terms, if at all.
We are from time to time involved in other litigation in the ordinary course of business. We may not be successful in defending these or other claims. Regardless of the outcome, litigation could result in substantial expense and could divert the efforts of our management.
We have significant operations concentrated in the United States, Canada, China, Costa Rica, India, Japan, Mexico, the Philippines, and the United Kingdom, and any disruption in the operations of our facilities could harm our business and operating results.
Our worldwide operations could be subject to natural disasters and other business disruptions, which could seriously harm our revenue and financial condition and increase our costs and expenses. We have significant operations in our facilities located in the United States, Canada, China, Costa Rica, India, Japan, Mexico, the Philippines, and the United Kingdom. As a result, any prolonged disruption in the operations of our facilities, whether due to technical difficulties, power failures, break-ins, destruction or damage to the facilities as a result of a natural disaster, fire or any other reason, could harm our operating results. In addition, our Philippines operation is at greater risk due to adverse weather conditions, such as typhoons. We currently do not have a formal disaster recovery plan and may not have sufficient business interruption insurance to compensate for losses that could occur.
Global health, economic, political and social conditions may harm our ability to do business, increase our costs and negatively affect our stock price.
Worldwide economic conditions have experienced a significant downturn due to the credit conditions impacted by the subprime mortgage crisis and other factors, including slower economic activity which may impact our results of operations. External factors such as potential terrorist attacks, acts of war, geopolitical and social turmoil or epidemics and other similar outbreaks, in many parts of the world could prevent or hinder our ability to do business, increase our costs and negatively affect our stock price, which in turn, may require us to record an impairment in the carrying value of our goodwill in accordance with Accounting Standards Codification, or ASC 350, “Intangibles—Goodwill and Other.” More generally, these geopolitical social and economic conditions could result in increased volatility in the United States and worldwide financial markets and economy. For example, increased instability may adversely impact the desire of employees and customers to travel, the reliability and cost of transportation and our ability to obtain adequate insurance at reasonable rates and may require us to incur increased costs for security measures for our domestic and international operations. We are predominantly uninsured for losses and interruptions caused by terrorism, acts of war and similar events. These uncertainties make it difficult for us and our customers to accurately plan future business activities. While general economic conditions have recently begun to improve, there is no assurance that this trend will continue or at what rate.
Part of our business is conducted outside of the United States, exposing us to additional risks that may not exist in the United States, which in turn could cause our business and operating results to suffer.
We have international operations in Canada, China, Costa Rica, India, Japan, Mexico, the Philippines and the United Kingdom. For both the fiscal years ended November 30, 2010 and 2009, approximately 17% of our total revenue was generated outside the United States. Our international operations are subject to risks, including:
| • | political or economic instability; |
| • | changes in governmental regulation; |
17
Table of Contents
| • | changes in import/export duties; |
| • | trade restrictions; |
| • | difficulties and costs of staffing and managing operations in certain foreign countries; |
| • | work stoppages or other changes in labor conditions; |
| • | difficulties in collecting of accounts receivable on a timely basis or at all; |
| • | taxes; and |
| • | seasonal reductions in business activity in some parts of the world. |
We may continue to expand internationally to respond to competitive pressure and customer and market requirements. Establishing operations in any other foreign country or region presents risks such as those described above and risks specific to the particular country or region. In addition, until a payment history is established over time with customers in a new geography or region, the likelihood of collecting accounts receivable generated by such operations could be less than our expectations. As a result, there is a greater risk that reserves set with respect to the collection of such accounts receivable may be inadequate. In addition, our Mexico operations primarily focus on various long-term projects with government and other local agencies, which involve extended payment terms and could expose us to additional collection risks. Furthermore, if our international expansion efforts in any foreign country are unsuccessful, we may decide to cease operations, which would likely cause us to incur additional expenses and losses.
In addition, changes in policies or laws of the United States or foreign governments resulting in, among other things, higher taxation, currency conversion limitations, restrictions on fund transfers or the expropriation of private enterprises, could reduce the anticipated benefits of our international expansion. Furthermore, any actions by countries in which we conduct business to reverse policies that encourage foreign trade or investment could adversely affect our business. If we fail to realize the anticipated revenue growth of our future international operations, our business and operating results could suffer.
Our investments in our contact center business could adversely affect our operating results as a result of operation execution risks related to managing and communicating with remote resources, technologies, customer satisfaction and employee turnover.
Our contact center business in India and the Philippines may be adversely impacted if we are unable to manage and communicate with these remote resources. Service quality may be placed at risk and our ability to optimize our resources may be more complicated if we are unable to manage our resources remotely. Contact centers use a wide variety of technologies to allow them to manage a large volume of work. These technologies ensure that employees are kept productive. Any failure in technology may impact the business adversely. The success of our contact center business primarily depends on performance of our employees and resulting customer satisfaction. Any increase in average waiting time or handling time or lack of promptness or technical expertise of our employees will directly impact customer satisfaction. Any adverse customer satisfaction may impact the overall business. Generally, the employee turnover rate in the contact center business and the risk of losing experienced employees to competitors are high. Higher turnover rates increase recruiting and training costs and decrease operating efficiencies and productivity. If we are unable to successfully manage our contact centers, our results of operations could be adversely affected and we may not fully realize the anticipated benefits of our recent acquisitions.
Our renewal management business is subject to dynamic changes in the business model and competition, which in turn could cause our GBS operations to suffer.
The software and hardware renewal management and the customer management operations of our GBS segment represent emerging markets that are vulnerable to numerous changes that could cause a shift in the business and size of the market. For example, if software and hardware customers move to a utility or fee for
18
Table of Contents
service based business model, this business model change could significantly impact operations or cause a significant shift in the way business is currently conducted. If OEMs put more focus in this area and start to internalize opportunities, then this could also cause a significant reduction in the size of the available market for third party service providers. Similarly, if competitors offer their services at below market margin rates to “buy” business, or use other lines of business to subsidize the renewal management business, then this could cause a significant reduction in the size of the available market. In addition, if a cloud-based solution or some other technology were introduced, this new technology could cause an adverse shift in the way our renewal management operations are conducted or decrease the size of the available market.
Risks Related to Our Relationship with MiTAC International Corporation
As of November 30, 2010, our executive officers, directors and principal stockholders owned approximately 31% of our common stock and this concentration of ownership could allow them to influence all matters requiring stockholder approval and could delay or prevent a change in control of SYNNEX.
As of November 30, 2010, our executive officers, directors and principal stockholders owned approximately 31% of our outstanding common stock. In particular, MiTAC International and its affiliates owned approximately 29% of our common stock.
In addition, MiTAC International’s interests and ours may increasingly conflict. For example, until July 31, 2010, we relied on MiTAC International for certain manufacturing and supply services and for relationships with certain key customers. In July 2010, we announced that we had signed a definitive sale agreement to sell certain assets related to our contract assembly business to MiTAC International. The transaction included the sale of inventory and customer contracts, primarily related to customers then being jointly served by MiTAC International and us. Also, as part of the transaction, we provide MiTAC International with certain transition services for the business on a fee basis over the next several quarters. After the completion of the transition services, MiTAC International and we will no longer be jointly serving any current customers. In addition, we may solicit the same contract assembly customers in the future.
There could be potential conflicts of interest between us and MiTAC International and its affiliates, which could impact our business and operating results.
MiTAC International’s and its affiliates’ continuing beneficial ownership of our common stock could create conflicts of interest with respect to a variety of matters, such as potential acquisitions, competition, issuance or disposition of securities, election of directors, payment of dividends and other business matters. Similar risks could exist as a result of Matthew Miau’s positions as our Chairman Emeritus, the Chairman of MiTAC International and as a director or officer of MiTAC International’s affiliates. For fiscal years 2010 and 2009, Mr. Miau received the same compensation as other independent directors. Mr. Miau’s compensation as one of our directors is based upon the approval of the Nominating and Corporate Governance Committee, which is solely composed of independent members of the Board. We also have adopted a policy requiring material transactions in which any of our directors has a potential conflict of interest to be approved by our Audit Committee, which is also composed of independent members of the Board.
Synnex Technology International Corp., or Synnex Technology International, a publicly-traded company based in Taiwan and affiliated with MiTAC International, currently provides distribution and fulfillment services to various markets in Asia and Australia, and is also a potential competitor of ours. As of November 30, 2010, MiTAC Incorporated, a privately-held company based in Taiwan and a separate entity from MiTAC International, directly and indirectly owned approximately 14.6% of Synnex Technology International and approximately 8.0% of MiTAC International. As of November 30, 2010, MiTAC International directly and indirectly owned 0.1% of Synnex Technology International and Synnex Technology International directly and indirectly owned approximately 0.9% of MiTAC International. In addition, MiTAC International directly and
19
Table of Contents
indirectly owned approximately 8.7% of MiTAC Incorporated and Synnex Technology International directly and indirectly owned approximately 18.4% of MiTAC Incorporated as of November 30, 2010. Synnex Technology International indirectly through its ownership of Peer Developments Limited owned approximately 12.3% of our outstanding common stock as of November 30, 2010. Neither MiTAC International, nor Synnex Technology International is restricted from competing with us. In the future, we may increasingly compete with Synnex Technology International, particularly if our business in Asia expands or Synnex Technology International expands its business into geographies or customers we serve. Although Synnex Technology International is a separate entity from us, it is possible that there will be confusion as a result of the similarity of our names. Moreover, we cannot limit or control the use of the Synnex name by Synnex Technology International in certain geographies and our use of the Synnex name may be restricted as a result of registration of the name by Synnex Technology International or the prior use in jurisdictions where it currently operates.
Risks Related to Our Industry
Volatility in the IT and CE industries could have a material adverse effect on our business and operating results.
The IT and CE industries in which we operate have experienced decreases in demand. Softening demand for our products and services caused by an ongoing economic downturn and over-capacity may impact our revenue, as well the salability of inventory and collection of reseller and retail customer accounts receivable.
While in the past, we may have benefited from consolidation in our industry resulting from delays or reductions in IT or CE spending in particular, and economic weakness in general, any such volatility in the IT and CE industries could have an adverse effect on our business and operating results.
Our business may be adversely affected by some OEM suppliers’ strategies to increase their direct sales, which in turn could cause our business and operating results to suffer.
Consolidation of OEM suppliers has resulted in fewer sources for some of the products and services that we distribute. This consolidation has also resulted in larger OEM suppliers that have significant operating and financial resources. Some OEM suppliers, including some of the leading OEM suppliers that we service, have been selling products and services directly to reseller and retail customers and end-users, thereby limiting our business opportunities. If large OEM suppliers increasingly sell directly to end-users or our resellers and retailers, rather than use us as the distributor of their products and services, our business and operating results will suffer.
OEMs could limit the number of supply chain service providers with which they do business, which in turn could negatively impact our business and operating results.
The termination of our contract by HP with us would have a significant negative effect on our revenue and operating results. A determination by any of our primary OEMs to consolidate their business with other distributors or contract assemblers would negatively affect our business and operating results. For example, IBM recently consolidated its business with distributors, including SYNNEX, and, as a result, we no longer distribute certain IBM products and services.
The IT and CE industries are subject to rapidly changing technologies and process developments, and we may not be able to adequately adjust our business to these changes, which in turn would harm our business and operating results.
Dynamic changes in the IT and CE industries, including the consolidation of OEM suppliers and reductions in the number of authorized distributors used by OEM suppliers, have resulted in new and increased responsibilities for management personnel and have placed, and continue to place, a significant strain upon our
20
Table of Contents
management, operating and financial systems and other resources. We may be unable to successfully respond to and manage our business in light of industry developments and trends. Also crucial to our success in managing our operations will be our ability to achieve additional economies of scale. Our failure to achieve these additional economies of scale or to respond to changes in the IT and CE industries could adversely affect our business and operating results.
We are subject to intense competition in the IT and CE industries, both in the United States and internationally, and if we fail to compete successfully, we will be unable to gain or retain market share.
We operate in a highly competitive environment, both in the United States and internationally. The IT and CE product and service distribution, BPO and contract assembly services industries are characterized by intense competition, based primarily on product and service availability, credit availability, price, speed of delivery, ability to tailor specific solutions to customer needs, quality and depth of product and service lines, pre-sale and post-sale technical support, flexibility and timely response to design changes, and technological capabilities, service and support. We compete with a variety of regional, national and international IT and CE product and service distributors and contract manufacturers and assemblers. In some instances, we also compete with our own customers, our own OEM suppliers and MiTAC International and its affiliates.
Our primary competitors are substantially larger and have greater financial, operating, manufacturing and marketing resources than us. Some of our competitors may have broader geographic breadth and range of services than us and may have more developed relationships with their existing customers. We may lose market share in the United States or in international markets, or may be forced in the future to reduce our prices in response to the actions of our competitors and thereby experience a reduction in our gross margins.
In addition, in our contact center business, we also face competition from our customers. For example, some of our customers may have internal capabilities and resources to provide their own call centers. Furthermore, pricing pressures and quality of services could impact our business adversely. Our ability to provide a high quality of service is dependent on our ability to retain and properly train our employees and to continue investing in our infrastructure, including IT and telecommunications systems.
We may initiate other business activities, including the broadening of our supply chain capabilities, and may face competition from companies with more experience in those new areas. In addition, as we enter new areas of business, we may also encounter increased competition from current competitors or from new competitors, including some who may once have been our OEM suppliers or reseller and retail customers. Increased competition and negative reaction from our OEM suppliers or reseller and retail customers resulting from our expansion into new business areas may harm our business and operating results.
Compliance with changing regulation of corporate governance and public disclosure may result in additional expenses.
Changing laws, regulations and standards relating to corporate governance and public disclosure, including the Dodd-Frank Wall Street Reform and Consumer Protection Act, Securities and Exchange Commission, or SEC, regulations and New York Stock Exchange, or NYSE, rules, are creating uncertainty for companies such as ours. These new or changed laws, regulations and standards are subject to varying interpretations in many cases due to their lack of specificity, and as a result, their application in practice may evolve over time as new guidance is provided by regulatory and governing bodies, which could result in continuing uncertainty regarding compliance matters and higher costs necessitated by ongoing revisions to disclosure and corporate governance practices. As a result, our efforts to comply with evolving laws, regulations and standards have resulted in, and are likely to continue to result in, increased general and administrative expenses and a diversion of management time and attention from revenue-generating activities to compliance activities. If our efforts to comply with new or changed laws, regulations and standards differ from the activities intended by regulatory or governing bodies due to ambiguities related to practice, our reputation may be harmed.
21
Table of Contents
If we are unable to maintain effective internal control over financial reporting, our ability to report our financial results on a timely and accurate basis may be adversely affected, which in turn could cause the market price of our common stock to decline.
Section 404 of the Sarbanes-Oxley Act of 2002 requires our management to report on, and our independent registered public accounting firm to attest to, the effectiveness of our internal control structure and procedures for financial reporting. We completed an evaluation of the effectiveness of our internal control over financial reporting for the fiscal year ended November 30, 2010, and we have an ongoing program to perform the system and process evaluation and testing necessary to continue to comply with these requirements. In the past, however, our internal controls have not eliminated all error. For example, in fiscal year 2007, we made a reclassification adjustment to our Consolidated Financial Statements and we were unable to timely file a Form 8-K relating to an acquisition. We expect to continue to incur increased expense and to devote additional management resources to Section 404 compliance. In the event that one of our Chief Executive Officer, Chief Financial Officer or independent registered public accounting firm determines that our internal control over financial reporting is not effective as defined under Section 404, investor perceptions and our reputation may be adversely affected and the market price of our stock could decline.
Changes to financial accounting standards may affect our results of operations and cause us to change our business practices.
We prepare our financial statements to conform to generally accepted accounting principles in the United States. These accounting principles are subject to interpretation by the Financial Accounting Standards Board, American Institute of Certified Public Accountants, the SEC and various bodies formed to interpret and create appropriate accounting policies. A change in those policies can have a significant effect on our reported results and may affect our reporting of transactions completed before a change is announced. Changes to those rules or the questioning of current practices may adversely affect our reported financial results or the way we conduct our business.
| Item 1B. | Unresolved Staff Comments |
None.
| Item 2. | Properties |
Our principal executive office is located in Fremont, California, which is owned by us. We operate distribution, assembly services, contact center and administrative facilities in different countries.
Our distribution business segment occupies over 35 facilities covering approximately 4 million square feet and includes warehouse, logistics and administrative facilities. We own approximately 1 million square feet of property and lease the remainder.
Our GBS business segment occupies over 22 facilities comprising of administrative buildings, service facilities and call centers covering approximately 490 thousand square feet. We own approximately 168 thousand square feet and lease the remainder.
We have sublet unused portions of some of our facilities. We believe our facilities are well maintained and adequate for current operating needs. Leases for our current facilities expire between March 2011 and November 2015.
| Item 3. | Legal Proceedings |
We are from time to time involved in legal proceedings in the ordinary course of business. We do not believe that these proceedings will have a material adverse effect on our results of operations, financial position or cash flows of our business.
22
Table of Contents
In addition, we have been involved in various bankruptcy preference actions where we were a supplier to the companies now in bankruptcy. These preference actions are filed by the bankruptcy trustee on behalf of the bankrupt estate and generally seek to have payments made by the debtor within 90 days prior to the bankruptcy returned to the bankruptcy estate for allocation among all of the bankruptcy estate’s creditors. We are not currently involved in any material preference proceedings.
| Item 4. | (Removed and Reserved) |
Executive Officers of the Registrant
The following table sets forth information regarding our executive officers as of November 30, 2010:
| Name |
Age | Position | ||||
| Kevin Murai |
47 | President, Chief Executive Officer and a Director | ||||
| Peter Larocque |
49 | President, U.S. Distribution | ||||
| Dennis Polk |
44 | Chief Operating Officer | ||||
| Thomas Alsborg |
48 | Chief Financial Officer | ||||
| Simon Leung |
45 | Senior Vice President, General Counsel and Corporate Secretary | ||||
Kevin Murai, our President and Chief Executive Officer and a Director, joined us in March 2008. He served as Co-Chief Executive Officer until Robert Huang’s retirement in December 2008. Prior to SYNNEX, Mr. Murai was employed for 19 years at Ingram Micro, Inc. where he served in several executive management positions, including President and Chief Operating Officer. He holds a Bachelor of Applied Science degree in Electrical Engineering from the University of Waterloo in Ontario, Canada.
Peter Larocque is our President, U.S. Distribution since July 2006 and previously served as Executive Vice President of Distribution since June 2001 and Senior Vice President of Sales and Marketing from September 1997 until June 2001. Mr. Larocque is responsible for our U.S. distribution business. Mr. Larocque received a Bachelor of Science degree in Economics from the University of Western Ontario, Canada.
Dennis Polk is our Chief Operating Officer and has served in this capacity since July 2006. He previously served as Chief Financial Officer and Senior Vice President of Corporate Finance since joining us in February 2002. Mr. Polk received a Bachelor of Science degree in Accounting from Santa Clara University.
Thomas Alsborg is our Chief Financial Officer. He joined us in March 2007. Prior to SYNNEX, Mr. Alsborg was with Solectron Corporation where he served in various accounting and finance capacities over his ten-year tenure including Vice President and Chief Financial Officer of Solectron Global Services and Vice President of Finance and Vice President, Investor Relations. Prior to Solectron, Mr. Alsborg was with McDonald’s Corporation and a CPA with Ernst & Young LLP. Mr. Alsborg received a Bachelor of Science degree in Accounting from the Oral Roberts University, a Master in Business Administration, Finance and International Business from Santa Clara University.
Simon Leung is our Senior Vice President, General Counsel and Corporate Secretary and has served in this capacity since May 2001. Mr. Leung joined us in November 2000 as Corporate Counsel. Prior to SYNNEX, Mr. Leung was an attorney at the law firm of Paul, Hastings, Janofsky & Walker LLP. Mr. Leung received a Bachelor of Arts degree from the University of California, Davis and his Juris Doctor degree from the University of Minnesota Law School.
23
Table of Contents
| Item 5. | Market for Registrant’s Common Equity and Related Stockholder Matters |
Our common stock, par value $0.001, is traded on the New York Stock Exchange, or NYSE, under the symbol “SNX.” The following table sets forth the range of high and low sales prices for our common stock for each of the periods listed, as reported by the NYSE.
| Price Range of Common Stock |
||||||||
| Low | High | |||||||
| Fiscal Year 2009 |
||||||||
| First Quarter |
$ | 8.70 | $ | 17.98 | ||||
| Second Quarter |
$ | 13.23 | $ | 26.00 | ||||
| Third Quarter |
$ | 22.51 | $ | 32.57 | ||||
| Fourth Quarter |
$ | 24.98 | $ | 33.02 | ||||
| Fiscal Year 2010 |
||||||||
| First Quarter |
$ | 25.51 | $ | 32.43 | ||||
| Second Quarter |
$ | 25.10 | $ | 32.17 | ||||
| Third Quarter |
$ | 22.62 | $ | 28.04 | ||||
| Fourth Quarter |
$ | 23.34 | $ | 30.43 | ||||
As of January 31, 2011, our common stock was held by 944 stockholders of record. Because many of the shares of our common stock are held by brokers and other institutions on behalf of stockholders, we are unable to estimate the total number of beneficial owners represented by these stockholders of record. We have not declared or paid any cash dividends since our inception. We currently intend to retain future earnings, if any, for use in our operations and the expansion of our business. If we elect to pay cash dividends in the future, payment will depend on our financial condition, results of operations and capital requirements, as well as other factors deemed relevant by our Board of Directors. In addition, our credit facilities place restrictions on our ability to pay dividends.
24
Table of Contents
Stock Price Performance Graph
The stock price performance graph below, which assumes a $100 investment on November 30, 2005, compares our cumulative total shareowner return, the NYSE Composite Index and the Standard Industrial Classification, or SIC, Code Index (SIC Code 5045—Computer and Computer Peripheral Equipment and Software) for the period beginning November 30, 2005 through November 30, 2010. The closing price per share of our common stock was $28.66 on November 30, 2010. No cash dividends have been declared on our common stock since the initial public offering. The comparisons in the table are required by the SEC and are not intended to forecast or be indicative of possible future performance of our common stock.
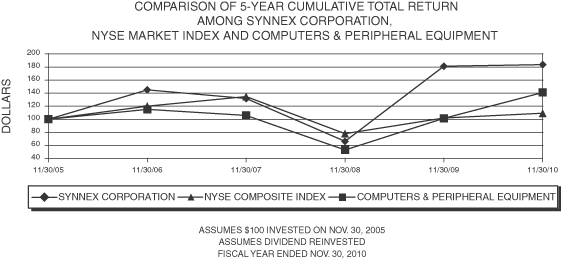
| Fiscal Years Ended | ||||||||||||||||||||||||
| 11/30/2005 | 11/30/2006 | 11/30/2007 | 11/30/2008 | 11/30/2009 | 11/30/2010 | |||||||||||||||||||
| SYNNEX Corporation |
100.00 | 145.11 | 132.01 | 66.84 | 180.89 | 183.13 | ||||||||||||||||||
| NYSE Market Index |
100.00 | 119.92 | 134.59 | 78.50 | 102.30 | 109.65 | ||||||||||||||||||
| Computers & Peripheral Equipment |
100.00 | 115.40 | 105.86 | 53.65 | 101.82 | 141.30 | ||||||||||||||||||
Securities Authorized for Issuance under Equity Compensation Plans
Information regarding the Securities Authorized for Issuance under Equity Compensation Plans can be found under Item 12 of this Report.
25
Table of Contents
| Item 6. | Selected Consolidated Financial Data |
The following selected consolidated financial data are qualified by reference to, and should be read together with, “Management’s Discussion and Analysis of Financial Condition and Results of Operations” included in Item 7 of this Report and the Consolidated Financial Statements and related Notes included in Item 8 of this Report. The selected consolidated statements of operations and cash flow data presented below for the fiscal years ended November 30, 2010, 2009 and 2008 and the consolidated balance sheet data as of November 30, 2010 and 2009 have been derived from our audited Consolidated Financial Statements included elsewhere in this Report. The consolidated statements of operations and other data for the fiscal years ended November 30, 2007 and 2006 and the consolidated balance sheet data as of November 30, 2008, 2007 and 2006 have been derived from our Consolidated Financial Statements that are not included in this Report. The amounts as of November 30, 2009 and 2008 and for the fiscal years ended November 30, 2009 and 2008 have been adjusted for the adoption of new accounting standards as explained in Note 2 to our Consolidated Financial Statements. The consolidated statements of operations data include the operating results from our acquisitions from the closing date of each acquisition. Historical operating results are not necessarily indicative of the results that may be expected for any future period. Please see “Management’s Discussion and Analysis of Financial Condition and Results of Operations” and Note 2 and Note 18 to our Consolidated Financial Statements included elsewhere in this Report for a discussion of factors, such as business combinations, that affect the comparability of the following selected consolidated financial data.
| Fiscal Years Ended November 30, | ||||||||||||||||||||
| 2010 | 2009 | 2008 | 2007 | 2006 | ||||||||||||||||
| (As Adjusted - See Note 2) |
(As Adjusted - See Note 2) |
|||||||||||||||||||
| Statements of Operations Data: (in thousands, except per share amounts) |
|
|||||||||||||||||||
| Revenue |
$ | 8,614,141 | $ | 7,719,197 | $ | 7,736,726 | $ | 6,986,714 | $ | 6,343,514 | ||||||||||
| Cost of revenue |
(8,122,525 | ) | (7,296,167 | ) | (7,322,862 | ) | (6,640,295 | ) | (6,058,155 | ) | ||||||||||
| Gross profit |
491,616 | 423,030 | 413,864 | 346,419 | 285,359 | |||||||||||||||
| Selling, general and administrative expenses |
(292,466 | ) | (273,381 | ) | (267,498 | ) | (236,938 | ) | (189,117 | ) | ||||||||||
| Income from continuing operations before non-operating items, income taxes, noncontrolling interest |
199,150 | 149,649 | 146,366 | 109,481 | 96,242 | |||||||||||||||
| Interest expense and finance charges, net |
(17,114 | ) | (18,032 | ) | (17,206 | ) | (15,054 | ) | (16,659 | ) | ||||||||||
| Other income (expense), net |
1,550 | 3,036 | (7,812 | ) | 1,429 | 570 | ||||||||||||||
| Income from continuing operations before income taxes and noncontrolling interest |
183,586 | 134,653 | 121,348 | 95,856 | 80,153 | |||||||||||||||
| Provision for income taxes |
(66,910 | ) | (49,028 | ) | (44,811 | ) | (35,216 | ) | (28,320 | ) | ||||||||||
| Income from continuing operations before noncontrolling interest, net of tax |
116,676 | 85,625 | 76,537 | 60,640 | 51,833 | |||||||||||||||
| Income from discontinued operations, net of tax |
75 | 5,199 | 6,647 | 2,859 | — | |||||||||||||||
| Gain on sale of discontinued operations, net of tax |
11,351 | — | — | — | — | |||||||||||||||
| Net income |
128,102 | 90,824 | 83,184 | 63,499 | 51,833 | |||||||||||||||
| Net income attributable to noncontrolling interest |
(154 | ) | (1,157 | ) | (693 | ) | (372 | ) | (448 | ) | ||||||||||
| Net income attributable to SYNNEX Corporation |
$ | 127,948 | $ | 89,667 | $ | 82,491 | $ | 63,127 | $ | 51,385 | ||||||||||
| Amounts attributable to SYNNEX Corporation: |
||||||||||||||||||||
| Income from continuing operations, net of tax |
116,538 | 85,758 | 76,762 | 60,640 | 51,385 | |||||||||||||||
| Discontinued operations: |
||||||||||||||||||||
| Income from discontinued operations, net of tax |
59 | 3,909 | 5,729 | 2,487 | — | |||||||||||||||
| Gain on sale of discontinued operations, net of tax |
11,351 | — | — | — | — | |||||||||||||||
| Net income attributable to SYNNEX Corporation |
$ | 127,948 | $ | 89,667 | $ | 82,491 | $ | 63,127 | $ | 51,385 | ||||||||||
| Earnings per share attributable to SYNNEX Corporation: |
||||||||||||||||||||
| Basic: |
||||||||||||||||||||
| Income from continuing operations |
$ | 3.35 | $ | 2.62 | $ | 2.43 | $ | 1.96 | $ | 1.73 | ||||||||||
| Discontinued operations |
0.33 | 0.12 | 0.18 | 0.08 | — | |||||||||||||||
| Net income per common share—basic |
$ | 3.68 | $ | 2.74 | $ | 2.61 | $ | 2.04 | $ | 1.73 | ||||||||||
| Diluted: |
||||||||||||||||||||
| Income from continuing operations |
$ | 3.26 | $ | 2.53 | $ | 2.31 | $ | 1.86 | $ | 1.61 | ||||||||||
| Discontinued operations |
0.32 | 0.11 | 0.17 | 0.07 | — | |||||||||||||||
| Net income per common share—diluted |
$ | 3.58 | $ | 2.64 | $ | 2.48 | $ | 1.93 | $ | 1.61 | ||||||||||
26
Table of Contents
| As of November 30, | ||||||||||||||||||||
| 2010 | 2009 | 2008 | 2007 | 2006 | ||||||||||||||||
| (As Adjusted - See Note 2) |
(As Adjusted - See Note 2) |
|||||||||||||||||||
| Balance Sheet Data: (in thousands) |
||||||||||||||||||||
| Cash and cash equivalents |
$ | 88,038 | $ | 37,816 | $ | 35,147 | $ | 21,925 | $ | 27,881 | ||||||||||
| Working capital |
895,185 | 762,305 | 590,094 | 419,708 | 416,865 | |||||||||||||||
| Total assets |
2,499,861 | 2,099,910 | 2,032,386 | 1,887,103 | 1,382,734 | |||||||||||||||
| Current borrowings under term loans and lines of credit |
245,973 | 150,740 | 340,466 | 351,142 | 50,834 | |||||||||||||||
| Long-term borrowings |
140,333 | 136,195 | 131,157 | 37,537 | 47,967 | |||||||||||||||
| Total equity |
992,827 | 838,735 | 696,887 | 605,512 | 511,546 | |||||||||||||||
| Fiscal Years Ended November 30, | ||||||||||||||||||||
| 2010 | 2009 | 2008 | 2007 | 2006 | ||||||||||||||||
| Other Data: (in thousands) |
||||||||||||||||||||
| Depreciation and amortization from continuing operations |
$ | 16,285 | $ | 17,803 | $ | 16,811 | $ | 14,512 | $ | 9,781 | ||||||||||
27
Table of Contents
| Item 7. | Management’s Discussion and Analysis of Financial Condition and Results of Operations |
The following discussion and analysis of our financial condition and results of operations should be read in conjunction with “Selected Consolidated Financial Data” and the Consolidated Financial Statements and related Notes included elsewhere in this Report.
When used in this Annual Report on Form 10-K or the Report, the words “believes,” “plans,” “estimates,” “anticipates,” “expects,” “intends,” “allows,” “can,” “may,” “designed,” “will,” and similar expressions are intended to identify forward-looking statements. These are statements that relate to future periods and include statements about our business model and our services, our market strategy, including expansion of our product lines, our infrastructure, our investment in our IT systems, anticipated benefits of our acquisitions, anticipated increase in fourth quarter seasonality, impact of our disposition of certain assets to MiTAC International Corporation, or MiTAC International, our revenue and operating results, our gross margins, competition with Synnex Technology International Corp., our future needs for additional financing, concentration of customers, our international operations, expansion of our operations, our strategic acquisitions of businesses and assets, effects of future expansion of our operations, adequacy of our cash resources to meet our capital needs, the settlement of our convertible notes, adequacy of our disclosure controls and procedures, pricing pressures, competition, impact of our accounting policies, and statements regarding our securitization programs and revolving credit lines. Forward-looking statements are subject to risks and uncertainties that could cause actual results to differ materially from those projected. These risks and uncertainties include, but are not limited to, those risks discussed, as well as the seasonality of the buying patterns of our customers, concentration of sales to large customers, dependence upon and trends in capital spending budgets in the IT industry, fluctuations in general economic conditions and risks set forth under Part I, Item 1A, “Risk Factors.” These forward-looking statements speak only as of the date hereof. We expressly disclaim any obligation or undertaking to release publicly any updates or revisions to any forward-looking statements contained herein to reflect any change in our expectations with regard thereto or any change in events, conditions or circumstances on which any such statement is based.
Overview
We are a Fortune 500 corporation and a leading business process services company, servicing resellers, retailers and original equipment manufacturers, or OEMs, in multiple regions around the world. Our primary business process services are distribution and business process outsourcing, or BPO. We operate in two segments: distribution services and global business services, or GBS. Our distribution services segment distributes IT systems, peripherals, system components, software, networking equipment, consumer electronics, or CE, and complementary products. We also provide contract assembly services within our distribution segment. Our GBS segment offers a range of BPO services to our customers that include customer management, renewal management, back office processing and information technology outsourcing, or ITO, on a global platform. To further enhance our BPO solutions, we provide value-added support services such as demand generation, pre-sales support, product marketing, print and fulfillment, back office outsourcing and post-sales technical support.
We combine our core strengths in distribution with our BPO services to help our customers achieve greater efficiencies in time to market, cost minimization, real-time linkages in the supply chain and aftermarket product support. We distribute more than 20,000 technology products (as measured by SKUs) from more than 100 IT, CE and OEM suppliers to more than 15,000 resellers, system integrators, and retailers throughout the United States, Canada and Mexico. Our GBS segment provides outsourced services to customers in multiple, geographic locations and in multiple languages. As of November 30, 2010, we had over 8,000 full-time and temporary employees in both segments worldwide. From a geographic perspective, approximately 98% of our total revenue was from North America for each of the fiscal years ended November 30, 2010, 2009 and 2008.
We purchase IT systems, peripherals, system components, software, networking equipment, CE and complementary products from our primary suppliers such as Hewlett-Packard Company, or HP, Acer, Panasonic,
28
Table of Contents
Lenovo and Seagate and sell them to our reseller and retail customers. We perform a similar function for our distribution of licensed software products. Our reseller customers include VARs, corporate resellers, government resellers, system integrators, direct marketers, and national and regional retailers.
Revenue and Cost of Revenue
We derive our revenue primarily through the distribution of IT systems, peripherals, system components, software, networking equipment, CE, contract assembly services and BPO. For products, we recognize revenue generally as products are shipped, if a purchase order exists, the sale price is fixed or determinable, collection of the resulting accounts receivable is reasonably assured, risk of loss and title have transferred and product returns are reasonably estimable. Shipping terms are typically F.O.B. our warehouse. Provisions for sales returns are estimated based on historical data and are recorded concurrently with the recognition of revenue. We review and adjust these provisions periodically. Revenue is reduced for early payment discounts and volume incentive rebates offered to customers. We provide our BPO services in our GBS segment to customers under contracts that typically consist of a master services agreement or statement of work, which contains the terms and conditions of each program and service we offer. Our agreements are usually short-term in nature, subject to early termination by our customers or us for any reason, typically with 30 to 90 days notice. Revenue is recognized as services are performed and if collection is reasonably assured.
In fiscal year 2010, one customer accounted for 11% of our total revenue. None of our customers accounted for more than 10% of our total revenue in fiscal years 2009 or 2008. Approximately 38%, 36%, and 32% of our total revenue in fiscal years 2010, 2009 and 2008, respectively, was derived from the sale of HP products and services.
The market for IT products and services is generally characterized by declining unit prices and short product life cycles. Our overall business is also highly competitive on the basis of price. We set our sales price based on the market supply and demand characteristics for each particular product or bundle of products we distribute and services we provide. From time to time, we also participate in the incentive and rebate programs of our OEM suppliers. These programs are important determinants of the final sales price we charge to our reseller customers. To mitigate the risk of declining prices and obsolescence of our distribution inventory, our OEM suppliers generally offer us limited price protection and return rights for products that are marked down or discontinued by them. We carefully manage our inventory to maximize the benefit to us of these supplier provided protections.
In our distribution segment, we are highly dependent on the end-market demand for IT and CE products and services. This end-market demand is influenced by many factors including the introduction of new IT and CE products and software by OEMs, replacement cycles for existing IT and CE products, overall economic growth and general business activity. A difficult and challenging economic environment may also lead to consolidation or decline in the IT and CE industries and increased price-based competition.
A significant portion of our cost of revenue is the purchase price we pay our OEM suppliers for the products we sell, net of any rebates and purchase discounts received from our OEM suppliers. Cost of product distribution revenue also consists of provisions for inventory losses and write-downs, freight expenses associated with the receipt in and shipment out of our inventory, and royalties due to OEM vendors. In addition, cost of revenue includes the cost of materials, labor and overhead for our contract assembly and GBS services.
Margins
The distribution and contract assembly services industries in which we operate are characterized by low gross profit as a percentage of revenue, or gross margin, and low income from operations as a percentage of revenue, or operating margin. Our gross margin has fluctuated annually due to changes in the mix of products and services we offer, customers we sell to, incentives and rebates received from our OEM suppliers, competition, seasonality and replacement of less profitable business with investments in higher margin, more
29
Table of Contents
profitable lines and lower costs associated with increased efficiencies. Increased competition arising from industry consolidation and low demand for IT products may hinder our ability to maintain or improve our gross margin. Generally, when our revenue becomes more concentrated on limited products or customers, our gross margin tends to decrease due to increased pricing pressure from OEM suppliers or reseller customers. Our operating margin from continuing operations has also fluctuated annually over the past three years, based primarily on our ability to achieve economies of scale, the management of our operating expenses, changes in the relative mix of our distribution, contract assembly and BPO revenue, and the timing of our acquisitions and investments.
In addition, beginning in the first fiscal quarter of 2010, we recognized revenue on certain service contracts, post-contract software support services, and extended warranty contracts, where we are not a primary obligor, on a net basis, which favorably impacted our gross and operating margins.
Recent Acquisitions and Divestitures
We seek to augment our services offering expansion with strategic acquisitions of businesses and assets that complement and expand our global BPO capabilities. We also divest businesses that we deem no longer strategic to our ongoing operations. Our historical acquisitions have brought us new reseller and retail customers, OEM suppliers, and product lines, have extended the geographic reach of our operations, particularly in targeted markets, and have diversified and expanded the services we provide to our OEM suppliers and customers. We account for acquisitions using the purchase method of accounting and include acquired entities within our consolidated financial statements from the closing date of the acquisition.
Acquisitions during the fiscal year ended November 30, 2010
On February 26, 2010, we purchased substantially all of the North American assets of Jack of All Games, Inc., a distributor of video game hardware and software. During the fiscal year ended November 30, 2010, we made certain adjustments to the fair value of inventories and other assets acquired, and liabilities assumed, related to this transaction. These adjustments had the impact of lowering the purchase price by $5.3 million. The total consideration, as adjusted, was $37.4 million. The net tangible assets acquired were $27.2 million and we recognized $4.5 million of intangible assets and $5.6 million in goodwill. The acquisition is fully integrated into our distribution segment and we expect it will continue to expand our CE product offerings.
On November 17, 2010 we acquired 100% of the stock of Aspire Technology Limited for $16.0 million, including $3.2 million in earn-out payments payable upon the achievement of certain milestones during the three years following the date of the acquisition. Aspire Technology Limited is based in the United Kingdom and provides renewal management through its proprietary software. We recognized $13.0 million in goodwill and $4.8 million in intangible assets. The determination of the fair value of the purchase price and the net assets acquired is preliminary.
On November 18, 2010, we acquired 100% of the stock of Encover, Inc. for $24.0 million, including $5.5 million in earn-out payments payable after one year following the acquisition date upon the achievement of certain milestones. Encover, Inc. is based in the United States and provides warranty and license renewal services and software. We recognized $9.0 million in goodwill and $7.0 million in intangible assets. The determination of the fair value of the purchase price and the net assets acquired is preliminary. The purchase price is subject to a holdback of $1.9 million for a period of twenty-four months from the purchase date.
Aspire Technology Limited and Encover, Inc. are being fully integrated into our GBS segment and are expected to enhance our BPO service offerings through their proprietary, scalable warranty and license renewal management capabilities and services.
The above acquisitions individually and in the aggregate, did not meet the conditions of a material business combination and were not subject to the disclosure requirements of accounting guidance for business combinations utilizing the purchase method of accounting.
30
Table of Contents
Acquisitions subsequent to fiscal year ended November 30, 2010
On December 1, 2010, we acquired 70% of the capital stock of Marubeni Infotec Corporation, a subsidiary of Marubeni Corporation, while SB Pacific Corporation Limited, or SB Pacific, our equity-method investee, acquired the remaining 30% noncontrolling interest. Please see “Related Party Transactions” section for more information on our investment in SB Pacific. Marubeni Infotec Corporation, now known as SYNNEX Infotec Corporation, is a distributor of IT equipment, electronic components and software in Japan. The aggregate consideration for the transaction was JP¥700.0 million or approximately US$8.4 million, of which our direct share was US$5.9 million. The purchase consideration is subject to certain adjustments based on SYNNEX Infotec Corporation’s balance sheet at closing, and the assumption of certain liabilities totaling JP¥10.3 billion, or approximately US$125.8 million. We own 80% of SYNNEX Infotec Corporation, inclusive of our investment in SB Pacific. This acquisition is in the distribution segment and will enable our expansion into Japan.
During the first quarter of fiscal year 2011, we acquired the assets of the e4e, Inc., a privately-held company that provides BPO services, for $23.0 million in cash, of which $1.0 million is payable upon the achievement of certain post closing conditions. This acquisition is in our GBS segment and is expected to bring additional BPO scale, complement our service offerings and expand our customer base and geographic presence.
Divestitures during the fiscal year ended November 30, 2010
On December 28, 2009, we sold our controlling interest in China Civilink (Cayman), the results of which are presented in discontinued operations. Please see the section “Discontinued Operations” for a detailed discussion on this transaction.
On July 31, 2010, we sold to MiTAC International inventory and certain customer contracts primarily related to contract assembly customers jointly served by us and MiTAC International. The sale agreement includes earn-out and profit-sharing provisions, which are based on operating performance metrics, achieved over a period of twelve to eighteen months from closing date, for the defined customers included in the transaction. Also, we will provide MiTAC International certain transition services on a fee basis. Please see the section “Related Party Transactions” for a detailed discussion on this transaction.
On August 31, 2010, we sold our controlling interest in Nihon Daikou Shouji Co., Ltd., or NDS, for $3.1 million to SB Pacific, a newly formed company led by our founder and former Chairman, Robert Huang. Concurrently, we invested in a 33.3% noncontrolling interest in SB Pacific.
Acquisitions during the fiscal year ended November 30, 2009
During the fiscal year ended November 30, 2009, we completed two acquisitions in our GBS segment. Through these acquisitions, we acquired web development services and complementary products for a total consideration of $6.6 million. One of the acquisitions is reported under discontinued operations. These acquisitions, individually and in the aggregate, did not meet the conditions of a material business combination and were not subject to the disclosure requirements of accounting for business combinations utilizing the purchase method of accounting.
Building Acquisition
On July 30, 2009, we completed the purchase of a previously leased administrative and warehouse facility in Fremont, California. The facility is approximately one hundred and twenty eight thousand square feet. The total purchase price for this facility was $12.2 million.
Restructuring Charges
In fiscal year 2007, in connection with the acquisition of the Redmond Group of Companies, or RGC, we announced a restructuring program in Canada. During the fiscal year ended November 30, 2010, we made
31
Table of Contents
payments of $0.7 million, which is included in selling, general and administrative expenses, for the remaining lease obligations on the RGC facility. During the fiscal year ended November 30, 2010, we accrued an additional $0.8 million for the remaining lease obligations on the facility. The remaining balances outstanding on facility and exit costs as of both November 30, 2010 and 2009 were $0.6 million. The lease obligations are expected to be completed by June 2011.
In conjunction with this restructuring program, we had recorded an impairment loss of $0.8 million for a property located in Ontario, Canada that was held for sale based on the fair value less costs to sell in accordance with Financial Accounting Standards Board, or FASB, ASC 360, “Property, Plant and Equipment,” section, “Subsequent Measurement.” In fiscal year 2009, this property was sold for $1.6 million at a loss of $.05 million.
Economic and Industry Trends
Our revenue is highly dependent on the end-market demand for IT products. This end-market demand is influenced by many factors including the introduction of new IT products and software by OEMs, replacement cycles for existing IT products and overall economic growth and general business activity. A difficult and challenging economic environment may also lead to consolidation or decline in the IT distribution industry and increased price-based competition. The GBS industry is also extremely competitive. The customers’ performance measures are based on competitive pricing terms and quality of services. Accordingly, we could be subject to pricing pressure and may experience a decline in our average selling prices for our services.
Seasonality
Our operating results are affected by the seasonality of the IT and CE products industries. We have historically experienced higher sales in our fourth fiscal quarter due to patterns in the capital budgeting, federal government spending and purchasing cycles of our customers and end-users. In addition, with the addition of New Age Electronics in 2008 and Jack of All Games in 2010, which have higher concentrations of CE sales, we expect our fourth quarter seasonal spike may be larger. These patterns may not be repeated in subsequent periods.
Deferred Compensation Plan
We have a deferred compensation plan for a limited number of our directors and employees. We maintain a liability on our balance sheet for salary and bonus amounts deferred by participants and we accrue interest expense on uninvested amounts. Interest expense on the deferred amounts is classified in selling, general and administrative expenses on our consolidated statements of operations. The participant may designate one or more investments as the measure of investment return on the participant’s account. The equity securities are either classified as trading securities or cost securities. Generally, the gains (losses) on the deferred compensation securities are recorded in other income (expense), net and an equal amount is charged (or credited if losses) to selling, general and administrative expenses relating to compensation amounts which are payable to the plan participants. For the deferred compensation investments, we recorded a gain of $0.2 million, a gain of $2.7 million and a loss of $5.9 million, in the fiscal years ended 2010, 2009 and 2008, respectively.
Critical Accounting Policies and Estimates
The discussions and analyses of our consolidated financial condition and results of operations are based on our Consolidated Financial Statements, which have been prepared in conformity with generally accepted accounting principles in the United States. The preparation of these financial statements requires us to make estimates and assumptions that affect the reported amounts of assets and liabilities, disclosure of any contingent assets and liabilities at the financial statement date, and reported amounts of revenue and expenses during the reporting period. On an ongoing basis, we review and evaluate our estimates and assumptions, including those that relate to accounts receivable, vendor programs, inventories, goodwill and intangible assets, and income taxes. Our estimates are based on our historical experience and a variety of other assumptions that we believe to
32
Table of Contents
be reasonable under the circumstances, the results of which form the basis for making our judgment about the carrying values of assets and liabilities that are not readily available from other sources. Actual results could differ from these estimates under different assumptions or conditions.
We believe the following critical accounting policies are affected by our judgment, estimates and/or assumptions used in the preparation of our Consolidated Financial Statements.
Revenue Recognition. We generally recognize revenue as hardware and software products are shipped and as services are performed, if a purchase order exists, the sale price is fixed or determinable, collection of the resulting accounts receivable is reasonably assured, risk of loss and title have transferred and product returns are reasonably estimable. Shipping terms are typically F.O.B. our warehouse. Provisions for sales returns are estimated based on historical data and are recorded concurrently with the recognition of revenue. These provisions are reviewed and adjusted periodically by us. Revenue is reduced for early payment discounts and volume incentive rebates offered to customers.
We recognize revenue on certain service contracts, post-contract software support services, and extended warranty contracts, where we are not a primary obligor, on a net basis beginning in the first fiscal quarter of 2010. Approximately 4% of revenue was recorded on a net basis for the fiscal year ended November 30, 2010.
Our Mexico operation primarily focuses on projects with the Mexican government and other local agencies that are long-term in nature. Under the agreements, the payments are due on a monthly basis and are contingent upon performing certain services and meeting certain conditions. We recognize product revenue and cost of revenue on a straight-line basis over the term of the contract.
We provide our BPO services to our customers under contracts that typically consist of a master services agreement or statement of work, which contains the terms and conditions of each program and service we offer. These agreements are usually short-term in nature and subject to early termination by the customers or us for any reason, typically with 30 to 90 days notice. Typically the contracts are time-based or transactions based. Revenue is generally recognized over the term of the contract if the service has already been rendered, the sales price is fixed or determinable and collection of the resulting accounts receivable is reasonably assured.
Allowance for Doubtful Accounts. We provide allowances for doubtful accounts on our accounts receivable for estimated losses resulting from the inability of our customers to make payments for outstanding balances. In estimating the required allowance, we take into consideration the overall quality and aging of the accounts receivable, credit evaluations of customers’ financial condition and existence of credit insurance. We also evaluate the collectability of accounts receivable based on specific customer circumstances, current economic trends, historical experience with collections and value and adequacy of collateral received from customers.
OEM Supplier Programs. We receive funds from OEM suppliers for inventory price protection, product rebates, marketing and infrastructure reimbursement, and promotion programs. Product rebates are recorded as a reduction of cost of revenue. Marketing, infrastructure and promotion programs are recorded, net of direct costs, in selling, general and administrative expense. Any excess funds associated with these programs are recorded in cost of revenue. We accrue rebates based on the terms of the program and sales of qualifying products. Some of these programs may extend over one or more quarterly reporting periods. Amounts received or receivable from OEM suppliers that are not yet earned are deferred on our balance sheet. Actual rebates may vary based on volume or other sales achievement levels, which could result in an increase or reduction in the estimated amounts previously accrued. In addition, OEM suppliers may seek to change the terms of some or all of these programs or cease them altogether. Any such change could lower our gross margins on products we sell or revenue earned. We also provide reserves for receivables on OEM supplier programs for estimated losses resulting from OEM suppliers’ inability to pay, or rejections of such claims by OEM suppliers.
Inventories. Our inventory levels are based on our projections of future demand and market conditions. Any sudden decline in demand and/or rapid product improvements and technological changes can cause us to have
33
Table of Contents
excess and/or obsolete inventories. On an ongoing basis, we review for estimated obsolete or unmarketable inventories and write-down our inventories to their estimated net realizable value based upon our forecasts of future demand and market conditions. These write-downs are reflected in our cost of revenue. If actual market conditions are less favorable than our forecasts, additional inventory reserves may be required. Our estimates are influenced by the following considerations: sudden decline in demand due to economic downturns, rapid product improvements and technological changes, our ability to return to OEM suppliers a certain percentage of our purchases, and protection from loss in value of inventory under our OEM supplier agreements.
Goodwill and Intangible Assets. Goodwill represents the excess of the purchase price over the fair value of the identifiable net assets acquired in an acquisition. We assess potential impairment of our goodwill and intangible assets when there is evidence that recent events or changes in circumstances have made recovery of an asset’s carrying value unlikely. We also assess potential impairment of our goodwill and intangible assets on an annual basis during our fourth quarter, regardless if there is evidence or suspicion of impairment. If indicators of impairment were present in intangible assets used in operations and future undiscounted cash flows were not expected to be sufficient to recover the assets’ carrying amount, an impairment loss would be charged to expense in the period identified. The amount of an impairment loss would be recognized as the excess of the asset’s carrying value over its fair value. Factors we consider important, which may cause impairment, include: significant changes in the manner of use of the acquired asset, negative industry or economic trends, and significant underperformance relative to historical or projected operating results. No impairment loss was recorded for the periods presented.
In accordance with ASC 350, “Intangible—Goodwill and Other,” a two-step impairment test is required to identify potential goodwill impairment and measure the amount of the goodwill impairment loss to be recognized. In the first step, the fair value of each reporting unit is compared to its carrying value to determine if the goodwill is impaired. If the fair value of the reporting unit exceeds the carrying value of the net assets assigned to that unit, then goodwill is not impaired and no further testing is required. If the carrying value of the net assets assigned to the reporting unit were to exceed its fair value, then the second step is performed in order to determine the implied fair value of the reporting unit’s goodwill and an impairment loss is recorded for an amount equal to the difference between the implied fair value and the carrying value of the goodwill.
For the purpose of goodwill analysis, we have two reporting units, as defined by ASC 350, “Intangible—Goodwill and Other.” Our distribution services business segment is comprised of one Distribution Services reporting unit and the GBS business segment is comprised of one Contact Center reporting unit. We conducted our annual impairment analysis in the fourth quarter of fiscal year 2010. Our goodwill impairment analysis did not result in an impairment charge for the fiscal years ended 2010, 2009 or 2008.
Determining the fair value of a reporting unit, intangible asset or a long-lived asset is judgmental and involves the use of significant estimates and assumptions. We base our fair value estimates on assumptions that we believe are reasonable but are uncertain and subject to changes in market conditions.
Long-lived assets. We review the recoverability of our long-lived assets, such as property and equipment, when events or changes in circumstances occur that indicate the carrying value of the asset group may not be recoverable. The assessment of possible impairment is based on our ability to recover the carrying value of the asset or asset group from the expected future pre-tax cash flows, undiscounted and without interest charges, of the related operations. If these cash flows are less than the carrying value of such assets, an impairment loss is recognized for the difference between estimated fair value and carrying value. The measurement of impairment requires management to estimate future cash flows and the fair value of long-lived assets. In the fiscal year ended November 30, 2010, we recorded an impairment of $0.2 million on our long-lived assets.
Income Taxes. As part of the process of preparing our Consolidated Financial Statements, we estimate our income taxes in each of the tax jurisdictions in which we operate. This process involves estimating our current tax expense together with assessing any temporary differences resulting from the different treatment of certain items, such as the timing for recognizing revenue and expenses, for tax and accounting purposes, as well as
34
Table of Contents
estimating foreign tax credits. These differences may result in deferred tax assets and liabilities, which are included in our consolidated balance sheet. We assess the likelihood that our deferred tax assets, which include net operating loss carry forwards and temporary differences that are expected to be deductible in future years, will be recoverable from future taxable income or other tax planning strategies. If recovery is not likely, we provide a valuation allowance based on our estimates of future taxable income in the various taxing jurisdictions, and the amount of deferred taxes in excess of amounts that are ultimately considered more likely than not realizable. The provision for current and deferred taxes involves evaluations and judgments of uncertainties in the interpretation of complex tax regulations by various taxing authorities. Actual results could differ from our estimates.
Results of Operations
The following table sets forth, for the indicated periods, data as percentages of revenue:
| Fiscal Years Ended November 30, | ||||||||||||
| 2010 | 2009 | 2008 | ||||||||||
| (As Adjusted- See Note 2) |
(As Adjusted- See Note 2) |
|||||||||||
| Statements of Operations Data: |
||||||||||||
| Revenue |
100.00 | % | 100.00 | % | 100.00 | % | ||||||
| Cost of revenue |
(94.29 | ) | (94.52 | ) | (94.65 | ) | ||||||
| Gross profit |
5.71 | 5.48 | 5.35 | |||||||||
| Selling, general and administrative expenses |
(3.40 | ) | (3.54 | ) | (3.46 | ) | ||||||
| Income from continuing operations before non-operating items, income taxes and noncontrolling interest |
2.31 | 1.94 | 1.89 | |||||||||
| Interest expense and finance charges, net |
(0.20 | ) | (0.24 | ) | (0.22 | ) | ||||||
| Other income (expense), net |
0.02 | 0.04 | (0.10 | ) | ||||||||
| Income from continuing operations before income taxes and noncontrolling interest |
2.13 | 1.74 | 1.57 | |||||||||
| Provision for income taxes |
(0.77 | ) | (0.63 | ) | (0.58 | ) | ||||||
| Income from continuing operations before noncontrolling interest, net of taxes |
1.36 | 1.11 | 0.99 | |||||||||
| Income from discontinued operations, net of tax |
— | 0.07 | 0.09 | |||||||||
| Gain on sale of discontinued operations, net of tax |
0.13 | — | — | |||||||||
| Net income |
1.49 | 1.18 | 1.08 | |||||||||
| Net income attributable to noncontrolling interest |
— | (0.02 | ) | (0.01 | ) | |||||||
| Net income attributable to SYNNEX Corporation |
1.49 | % | 1.16 | % | 1.07 | % | ||||||
Fiscal Years Ended November 30, 2010, 2009 and 2008 from Continuing Operations
Revenue
| Fiscal Years Ended November 30, | Percent Change | |||||||||||||||||||
| 2010 | 2009 | 2008 | 2010 to 2009 | 2009 to 2008 | ||||||||||||||||
| (in thousands) | ||||||||||||||||||||
| Revenue |
$ | 8,614,141 | $ | 7,719,197 | $ | 7,736,726 | 11.6 | % | -0.2 | % | ||||||||||
| Distribution Revenue |
8,526,309 | 7,639,094 | 7,674,048 | 11.6 | % | -0.5 | % | |||||||||||||
| GBS Revenue |
112,380 | 101,138 | 82,494 | 11.1 | % | 22.6 | % | |||||||||||||
| Inter-Segment Elimination |
(24,548 | ) | (21,035 | ) | (19,816 | ) | 16.7 | % | 6.2 | % | ||||||||||
35
Table of Contents
In our distribution business, we sell in excess of 20,000 technology products (as measured by active SKUs) from more than 100 IT, CE and OEM suppliers to more than 15,000 resellers. The prices of our products are highly dependent on the volumes purchased within a product category. The products we sell from one period to the next are often not comparable because of rapid changes in product models and features. The revenue generated in our GBS segment relates to BPO services such as demand generation, pre-sales support, product marketing, print and fulfillment, back office support, ITO, renewal management and post-sales technical support. The inter-segment eliminations relate to the inter-segment back-office support services provided by our GBS segment to our distribution segment. GBS revenue to third parties is net of inter-segment eliminations. The GBS programs and customer service requirements change frequently from one period to the next and are often not comparable.
Our revenue in the distribution segment increased year over year because of the improvement in overall market conditions in both the US and Canada following the economic recession in fiscal year 2009 which had impacted our channel sales volumes. Our sales also benefitted from our acquisition of Jack of All Games, Inc., new vendors and sales initiatives. By product line, in comparison to fiscal year 2009, our networking product sales increased 37%, system component sales increased 24%, systems sales increased 19% and peripheral sales increased 12%. Our revenue from software sales benefitted from the sales of gaming products but decreased by 9% as compared to the prior year period because of the presentation of revenue generated from certain service contracts, post-contract software support services, and extended warranty contracts on a net basis beginning in fiscal first quarter of 2010. See Note 2—Revenue Recognition. Revenue also benefitted from the foreign exchange translation of our Canadian operations as compared to the prior year.
In fiscal year 2010, revenue in the GBS segment increased as compared to the prior year because of revenue from new customers and increased call volumes in our BPO service contact centers.
Our decrease in distribution revenue for the fiscal year ended November 30, 2009 from the fiscal year ended November 30, 2008 was primarily attributable to the slow economic environment which had caused a 10% to 15% decline in overall channel volumes. Revenue was also adversely impacted by the foreign exchange translation of our Canadian distribution operations. These declines were offset by market share gains and the full year impact of the New Age Electronics acquisition.
Our increase in GBS revenue for the fiscal year ended November 30, 2009 from the fiscal year ended November 30, 2008 was mainly due to increased business, higher call volumes in our contact centers and additional revenue generated from our smaller acquisitions.
Gross Profit
| Fiscal Years Ended November 30, | Percent Change | |||||||||||||||||||
| 2010 | 2009 | 2008 | 2010 to 2009 | 2009 to 2008 | ||||||||||||||||
| (in thousands) | ||||||||||||||||||||
| Gross Profit |
$ | 491,616 | $ | 423,030 | $ | 413,864 | 16.2 | % | 2.2 | % | ||||||||||
| Percentage of Revenue |
5.71 | % | 5.48 | % | 5.35 | % | ||||||||||||||
Our gross profit is affected by a variety of factors, including competition, average selling prices, the variety of products and services we sell, the customers to whom we sell, our sources of revenue by segments, rebate and discount programs from our suppliers, freight costs, reserves for inventory losses, acquisitions and divestitures of business units, fluctuations in revenue, and our mix of business including our GBS services.
Our gross profit as a percentage of revenue in fiscal year 2010 increased by 23 basis points over fiscal year 2009. Gross profit as a percentage of revenue for fiscal year 2010 was approximately 25 basis points higher as a result of accounting for certain service contracts, post-contract software support services, and extended warranty contracts on a net basis in fiscal year 2010. Our gross profit was impacted by the sale of inventory and customer contracts to MiTAC International, our acquisitions and changes in our mix of business.
36
Table of Contents
Our gross profit as a percentage of revenue increased by 13 basis points in fiscal year 2009 over 2008 primarily due to net changes in our product mix, expansion of our GBS services, greater success in maximizing our variable incentives and pricing policies, and continued focus on costs and freight management.
No specific customers, or changes in pricing strategy, individually or in the aggregate, contributed significantly to the change in gross profit.
Selling, General and Administrative Expenses
| Fiscal Years Ended November 30, | Percent Change | |||||||||||||||||||
| 2010 | 2009 | 2008 | 2010 to 2009 | 2009 to 2008 | ||||||||||||||||
| (in thousands) | ||||||||||||||||||||
| Selling, General and Administrative Expenses |
$ | 292,466 | $ | 273,381 | $ | 267,498 | 7.0 | % | 2.2 | % | ||||||||||
| Percentage of Revenue |
3.40 | % | 3.54 | % | 3.46 | % | ||||||||||||||
Approximately two-thirds of our selling, general and administrative expenses consist of personnel costs such as salaries, commissions, bonuses, share-based compensation, deferred compensation expense or income, and temporary personnel costs. Selling, general and administrative expenses also include costs of our facilities, utility expense, professional fees, depreciation expense on our capital equipment, bad debt expense, amortization expense on our intangible assets, and marketing expenses, offset in part by reimbursements from OEM suppliers.
Selling, general and administrative expenses increased in fiscal year 2010 from fiscal year 2009, due to higher headcount and increase in personnel costs of $19.8 million and higher operating overhead costs of $6.6 million. These increases were offset in part by a $4.8 million decrease in bad debt expense, a $2.3 million decrease in intangible amortization costs and a $1.0 million decrease in deferred compensation expenses. The increase in our personnel costs and operating overhead is due to the growth of our business, investments in strategic initiatives and our recent acquisitions, including of Jack of All Games, Inc. Our selling, general and administrative expenses were also adversely impacted by the fluctuations in foreign exchange rates during the year.
Selling, general and administrative expenses increased in fiscal year 2009 from fiscal year 2008, both on a dollar basis as well as percentage of revenue due to an increase in our deferred compensation cost accrual of $8.6 million, and an increase in depreciation and amortization expenses, mainly due to the acquisitions, and leasehold improvements of $0.9 million. These increases were offset in part by a reduction of $3.8 million for personnel and professional expenses and a reduction of $2.3 million in overhead, travel and communication costs as a result of cost control efforts.
37
Table of Contents
Income from Continuing Operations before Non-Operating Items, Income Taxes and Noncontrolling Interests
| Fiscal Years Ended November 30, | Percent Change | |||||||||||||||||||
| 2010 | 2009 | 2008 | 2010 to 2009 | 2009 to 2008 | ||||||||||||||||
| (in thousands) | ||||||||||||||||||||
| Income from continuing operations before non-operating items, income taxes and noncontrolling interest |
$ | 199,150 | $ | 149,649 | $ | 146,366 | 33.1 | % | 2.2 | % | ||||||||||
| Percentage of Total Revenue |
2.31 | % | 1.94 | % | 1.89 | % | ||||||||||||||
| Distribution income from continuing operations before non-operating items, income taxes and noncontrolling interest |
187,478 | 137,724 | 138,826 | 36.1 | % | -0.8 | % | |||||||||||||
| Percentage of Distribution Revenue |
2.20 | % | 1.80 | % | 1.81 | % | ||||||||||||||
| GBS income from continuing operations before non-operating items, income taxes and noncontrolling interest |
11,672 | 11,925 | 7,540 | -2.1 | % | 58.2 | % | |||||||||||||
| Percentage of GBS Revenue |
10.39 | % | 11.79 | % | 9.14 | % | ||||||||||||||
Our income from continuing operations before non-operating items, income taxes and noncontrolling interest as a percentage of revenue increased to 2.31% in fiscal year 2010 from 1.94% and 1.89% in fiscal years 2009 and 2008, respectively, due to improvements in gross margins in our distribution segment, partially offset by higher selling, general and administrative expenses. These margins were also higher as a result of accounting for revenue from certain service contracts, post-contract software support services, and extended warranty contracts on a net basis beginning in fiscal year 2010.
Our distribution segment income from continuing operations before non-operating items, income taxes and noncontrolling interest as a percentage of distribution revenue improved 40 basis points to 2.20% in fiscal year 2010 from 1.80% in fiscal year 2009. The margins were higher as a result of accounting for certain service contracts, post-contract software support services, and extended warranty contracts on a net basis in fiscal year 2010. In addition, the improvement in margins was due to higher gross profit dollars and lower selling, general and administrative costs as a percentage of revenue, due to increased leverage of fixed costs included in selling, general and administrative expenses.
Our distribution segment income from continuing operations before non-operating items, income taxes and noncontrolling interest as a percentage of distribution revenue decreased to 1.80% for fiscal year 2009 from 1.81% for fiscal year 2008 primarily due to higher selling, general and administrative expenses offset by higher gross profit due to changes in the mix of our business, foreign exchange impact on inventory purchases, greater success in maximizing our variable incentives, and other cost reductions.
Our GBS segment income from continuing operations before non-operating items, income taxes and noncontrolling interest as a percentage of GBS revenue decreased 140 basis points to 10.39% for fiscal year 2010 from 11.79% in the prior year due to the impact of fluctuations in foreign currency exchange rates on operating costs and higher administrative costs. The increase in administrative expenses was due to initiatives undertaken to support the business growth in this segment, and higher non-billable personnel costs incurred for contact center agents in their training period. In addition, we recorded a $2.1 million accrual for a statutory business expense.
38
Table of Contents
Our GBS segment income from continuing operations before non-operating items, income taxes and noncontrolling interest as a percentage of revenue increased 265 basis points from 9.1% in fiscal year 2008 to 11.8% in fiscal year 2009 primarily due to increased volume of business and better utilization of resources in our contact centers.
Interest Expense and Finance Charges, Net
| Fiscal Years Ended November 30, | Percent Change | |||||||||||||||||||
| 2010 | 2009 | 2008 | 2010 to 2009 | 2009 to 2008 | ||||||||||||||||
| (As Adjusted - See Note 2) |
(As Adjusted - See Note 2) |
|||||||||||||||||||
| (in thousands) | ||||||||||||||||||||
| Interest expense and finance charges, net |
$ | 17,114 | $ | 18,032 | $ | 17,206 | -5.1 | % | 4.8 | % | ||||||||||
| Percentage of revenue |
0.20 | % | 0.24 | % | 0.22 | % | ||||||||||||||
Amounts recorded in interest expense and finance charges, net, consist primarily of interest expense paid on our lines of credit and other debt, fees associated with third party accounts receivable flooring arrangements, non-cash interest expense on our convertible debt and the pledge of accounts receivable through our securitization facilities, offset by income earned on our cash investments and financing income from our multi-year distribution service contracts in our Mexico operation.
The decrease in interest expense and finance charges, net, in fiscal year 2010 from fiscal year 2009, was due to lower interest rates, and lower finance charges resulting from lower flooring sales. This decrease in expense was offset by $2.5 million lower interest income primarily relating to our Mexico distribution service contract.
The change in interest expense and finance charges, net, in fiscal year 2009 from fiscal year 2008 was mainly due to lower finance charges of $6.8 million as a result of lower borrowings, lower flooring sales, and lower interest rates. This decrease was partially offset by $5.7 million of lower interest income primarily from our Mexico operation.
Other Income (Expense), Net
| Fiscal Years Ended November 30, | Percent Change | |||||||||||||||||||
| 2010 | 2009 | 2008 | 2010 to 2009 | 2009 to 2008 | ||||||||||||||||
| (in thousands) | ||||||||||||||||||||
| Other income (expense), net |
$ | 1,550 | $ | 3,036 | $ | (7,812 | ) | -48.9 | % | 138.9 | % | |||||||||
| Percentage of revenue |
0.02 | % | 0.04 | % | -0.10 | % | ||||||||||||||
Amounts recorded as other income (expense), net include foreign currency transaction gains and losses, investment gains and losses (including those in our deferred compensation plan) and other non-operating gains and losses.
The change in other income (expense), net, in fiscal year 2010 from fiscal year 2009, was primarily due to gains from our trading securities being lower by $2.0 million than in the prior year; foreign exchange losses that were $0.8 million more than in the prior year; and a charge of $0.4 million for other-than-temporary impairment on our cost method and available-for-sale investments. These reductions were offset by the gains of $0.8 million and $0.5 million recognized on the sale of the BDG division of SYNNEX Canada Limited, or SYNNEX Canada, and NDS, respectively.
The increase in other income, net, in fiscal year 2009 from fiscal year 2008, was primarily due to gains of $9.6 million on deferred compensation investments and foreign exchange gains of $1.0 million.
39
Table of Contents
Provision for Income Taxes
Income taxes consist of our current and deferred tax expense resulting from our income earned in domestic and foreign jurisdictions.
Our effective tax rate in both the fiscal years 2010 and 2009 was 36.4%. The effective tax rate in fiscal year 2010 benefitted from the release of certain tax reserves resulting from the conclusion of the Internal Revenue Service, or IRS, tax audits and the expiration of certain statute of limitations. This was offset by the loss of tax holidays in a foreign location and the changes in the mix of income in the different tax jurisdictions in which we operate. Our effective tax rate was 36.4% in fiscal year 2009 as compared with an effective tax rate of 36.9% in fiscal year 2008. The effective tax rate in fiscal year 2009 was slightly lower than in fiscal year 2008, primarily due to higher profit contributions from lower tax jurisdictions as well as certain favorable permanent differences and an impact on deferred tax assets in certain foreign jurisdictions.
Our future effective tax rates could be adversely affected by earnings being lower than anticipated in countries where we have lower statutory rates and earnings being higher than anticipated in countries where we have higher statutory rates, by changes in the valuations of our deferred tax assets or liabilities, or by changes or interpretations in tax laws, regulations or accounting principles. In addition, we are subject to the continuous examination of our income tax returns by the IRS and other tax authorities. We regularly assess the likelihood of adverse outcomes resulting from these examinations to determine the adequacy of our provision for income taxes.
Net Income Attributable to Noncontrolling Interests
Net income attributable to noncontrolling interests represents the share of net income attributable to others, which is recognized for the portion of subsidiaries’ equity not owned by us. In April 2007, we acquired a controlling interest in China Civilink (Cayman), which operates in China as HiChina Web Solutions. HiChina Web Solutions was sold in December 2009 and is presented in discontinued operations in our Consolidated Statements of Operations.
In March 2008, we acquired a controlling interest in Nihon Daikou Shouji Co., Ltd., or NDS, which operates in Japan. On August 31, 2010, we sold our controlling interest in NDS to SB Pacific Corporation Limited, a newly formed company led by our founder and former Chairman Robert Huang, and in which we own a noncontrolling interest.
On September 30, 2010, we acquired a controlling interest in Occidental Business Services, S.A., which provides call center services in Costa Rica.
The above noncontrolling interests are contained within our GBS segment.
Discontinued Operations
On December 28, 2009, China Civilink (Cayman), which operates in China as HiChina Web Solutions, was sold to Alibaba.com Limited. HiChina Web Solutions provides domain name registration, web site hosting and design. HiChina Web Solution was a subsidiary of SYNNEX Investment Holdings Corporation, a wholly-owned, subsidiary company of SYNNEX Corporation. Under the terms of the agreement, we received $65.4 million for our estimated 79% controlling ownership in HiChina Web Solutions. The total gain recorded on the sale was $11.4 million, net of $1.2 million income taxes. We, the ultimate parent, have agreed to guarantee the obligations of SYNNEX Investment Holdings Corporation up to $35.0 million in connection with the sale of HiChina Web Solutions. HiChina Web Solutions was a part of our GBS segment. We have no significant continuing involvement in the operations of HiChina Web Solutions. In conjunction with the sale of HiChina Web Soution, we recorded a contingent liability of $3.1 million.
40
Table of Contents
Under the provisions of FASB ASC 360, “Property, Plant and Equipment,” the sale of HiChina Web Solutions qualified as a discontinued operation. Accordingly, we have excluded results of HiChina Web Solution’s operations from our consolidated statements of continuing operations for the fiscal years ended November 30, 2010, 2009 and 2008 to present this business in discontinued operations.
The following table shows the results of operations of HiChina Web Solutions for fiscal years ended November 30, 2010, 2009 and 2008, which are included in the earnings from discontinued operations:
| Fiscal Years Ended November 30, | ||||||||||||
| 2010* | 2009 | 2008 | ||||||||||
| (in thousands) | ||||||||||||
| Revenue |
$ | 2,959 | $ | 37,081 | $ | 31,504 | ||||||
| Cost of revenue |
(1,706 | ) | (16,078 | ) | (13,450 | ) | ||||||
| Gross profit |
1,253 | 21,003 | 18,054 | |||||||||
| Selling, general and administrative expenses |
(1,199 | ) | (15,736 | ) | (12,573 | ) | ||||||
| Income from operations before non-operating items, income taxes and noncontrolling interest |
54 | 5,267 | 5,481 | |||||||||
| Interest income (expense and finance charges), net |
17 | 413 | 575 | |||||||||
| Other income (expense), net |
5 | (7 | ) | (19 | ) | |||||||
| Income before income taxes and noncontrolling interest |
76 | 5,673 | 6,037 | |||||||||
| (Provision for) benefit from income taxes |
(1 | ) | (474 | ) | 610 | |||||||
| Income from discontinued operations |
75 | 5,199 | 6,647 | |||||||||
| Income from discontinued operations attributable to noncontrolling interest |
(16 | ) | (1,290 | ) | (918 | ) | ||||||
| Income from discontinued operations attributable to SYNNEX Corporation |
$ | 59 | $ | 3,909 | $ | 5,729 | ||||||
| * | Includes the results of operations from December 1, 2009 to the disposition date of December 28, 2009. |
The following are the carrying amounts of major classes of assets and liabilities of HiChina Web Solution’s discontinued operations which were classified as held for sale as of November 30, 2009:
| As of November 30, 2009 | ||||
| (in thousands) | ||||
| Assets |
||||
| Cash and Cash equivalents |
$ | 21,590 | ||
| Short-term investments |
8,952 | |||
| Property and equipment, net |
6,256 | |||
| Goodwill |
29,920 | |||
| Intangible assets |
3,670 | |||
| Other assets |
3,797 | |||
| Total assets held for sale |
$ | 74,185 | ||
| Liabilities |
||||
| Current deferred liabilities |
$ | 10,198 | ||
| Other liabilities |
7,950 | |||
| Total liabilities related to assets held for sale |
$ | 18,148 | ||
| Noncontrolling interest |
$ | 7,403 | ||
41
Table of Contents
Liquidity and Capital Resources
Cash Flows
Our business is working capital intensive. Our working capital needs are primarily to finance accounts receivable and inventory. We rely heavily on debt, accounts receivable flooring programs, our securitization program and our revolver program for our working capital needs.
We have financed our growth and cash needs to date primarily through working capital financing facilities, convertible debt, bank credit lines and cash generated from operations. The primary uses of cash have been to fund working capital, for acquisitions and for the generation of increased sales.
To increase our market share and better serve our customers, we may further expand our operations through investments or acquisitions. We expect that such expansion would require an initial investment in personnel, facilities and operations. These investments or acquisitions would likely be funded primarily by additional borrowings or issuing common stock.
Net cash used in operating activities was $65.9 million in fiscal year 2010 compared to net cash provided by operating activities of $262.0 million in fiscal year 2009. Net cash used in operating activities in the fiscal year ended November 30, 2010 was mainly due to the purchase of inventory as business levels increased resulting in $240.1 million higher inventory; higher accounts receivable of $156.8 million due to higher sales year over year in the U.S. and Canada; and higher vendor receivable balance of $29.6 million due to higher volume and the timing of payments. The above increases were partially offset by higher accounts payable of $220.2 million; net income of $128.1 million; and collections on our receivables from affiliates of $12.9 million.
Net cash provided by operating activities was $262.0 million in fiscal year 2009. Cash provided by operating activities in fiscal year 2009 was primarily due to an increase in accounts payable of $103.0 million; net income of $90.8 million; decrease in other assets of $44.7 million, which was mainly due to a decrease in deferred costs of the multi-year contracts from our Mexico operation; offset by decrease in deferred liabilities of $24.8 million; and an increase in accounts receivable of $6.5 million.
In May 2009, our Canadian revolving accounts receivable securitization program was refinanced with a secured revolving credit arrangement. As a result, the related accounts receivable was brought on-balance sheet as compared to off-balance sheet under the prior arrangement. At the time of refinancing, $53.1 million of accounts receivable was recorded on-balance sheet.
Net cash provided by operating activities was $52.6 million in fiscal year 2008. Cash provided by operating activities in fiscal year 2008 was primarily due to $83.1 million of net income; a decrease in other assets of $41.6 million; offset by an increase in accounts receivable of $45.0 million; increase in inventories of $16.4 million; decrease in accounts payable of $36.6 million; and a decrease in deferred liabilities of $29.2 million. The decrease in other assets and deferred liabilities resulted from the decrease in deferred revenue and deferred costs of the multi-year contracts from our Mexico operation.
Net cash provided by investing activities was $1.1 million in fiscal year 2010, which includes $37.8 million cash received from the sale of our businesses; $9.7 million in proceeds from our held-to-maturity term deposits, net of purchases; and a $15.2 million decrease in our restricted cash; partially offset by $47.4 million cash used for the acquisition of Jack of All Games and the fourth quarter acquisitions in our GBS segment and $12.7 million investment in capital expenditures. Cash received from the sales of our businesses includes $33.1 million from the sale of HiChina Web Solutions, $3.2 million from the sale of the BDG division of SYNNEX Canada, and $1.5 million from the sale of NDS.
Net cash used in investing activities was $69.6 million and $65.7 million in fiscal years 2009 and 2008, respectively. Cash used in investing activities in fiscal year 2009 was primarily for capital expenditures of $25.0 million, which includes the purchase of a previously leased administrative and warehouse building in Fremont,
42
Table of Contents
California for $12.2 million, increase in restricted cash of $15.7 million which primarily relates to lockbox collections under our borrowing arrangements, and also for our future payments to our vendors relating to the long-term projects at our Mexico operation and purchase of short-term investments net of proceeds of $12.7 million. Cash used in investing activities in fiscal year 2008 was primarily for the acquisition of New Age Electronics and others for $28.0 million in total (net of cash acquired of $16.9 million) and capital expenditures of $33.5 million, which was primarily for the construction of a new logistics facility in Olive Branch, Mississippi and the expansion of our sales and marketing headquarters in Greenville, South Carolina.
In 2009, investments with maturities from the date of purchase greater than three months and less than one year were corrected to classify such amounts as short-term investments rather than cash equivalents. The impact as of November 30, 2008 was a $3.0 million reduction in cash and a corresponding increase in short-term investments. The impact to cash flow from investing activities for fiscal year 2008 was not material; accordingly, no amounts were revised. We concluded that the correction was not material to prior period annual consolidated financial statements and to the interim consolidated financial statements for fiscal 2009 based on SEC Staff Accounting Bulletin No. 99: Materiality. We presented corrected consolidated statements of cash flows for each of the interim periods in fiscal 2009 in the fiscal 2010 comparative interim consolidated financial statements.
Net cash provided by financing activities was $93.8 million in fiscal year 2010, consisting primarily of net receipts from our securitization arrangements and our revolving line of credit, proceeds from the issuance of common stock, and the excess tax benefit from share-based compensation which was partially offset by lower book overdraft. Net cash used by financing activities was $183.3 million in the fiscal year 2009 and was primarily related to net payments on our securitization arrangements, bank loans and our revolving line of credit, partially offset by proceeds from the issuance of common stock.
Our consolidated statements of cash flow for the fiscal years 2009 and 2008 include the cash balances and cash-flow activities of our discontinued operations.
We believe the unused portions of the lines of credit on our arrangements are sufficient to support our operating activities.
Interest paid in fiscal years 2010, 2009 and 2008 was $13.5 million, $18.0 million and $9.6 million, respectively. It increased by $8.4 million from 2008 to 2009 due to all financing arrangements being treated as on-balance sheet arrangements in 2009.
Capital Resources
Our cash and cash equivalents totaled $88.0 million and $37.8 million as of November 30, 2010 and 2009, respectively. We believe we will have sufficient resources to meet our present and future working capital requirements for the next twelve months, based on our financial strength and performance, existing sources of liquidity, available cash resources and funds available under our various borrowing arrangements.
In May 2008, we issued $143.8 million of aggregate principal amount of our 4.0% Convertible Senior Notes due 2018, or the Notes, in a private placement. However, under certain circumstances we may redeem the Notes, in whole or in part, for cash on or after May 20, 2013, at a redemption price equal to 100% of principal amount plus any accrued and unpaid interest. In addition, if certain triggering events are met, the Notes can be converted into shares of common stock at any time before their maturity. Because we currently intend to settle the Notes using cash at some future date, we maintain within our Amended and Restated U.S. Arrangement and the Amended and Restated Revolver ongoing features that allow us to utilize cash from these facilities to cash settle the Notes, if desired. (See On-Balance Sheet Arrangements). These borrowing arrangements are renewable on their expiration dates. We have no reason to believe that these arrangements will not be renewed as we continue to be in good credit standing with the participating financial institutions. We have had similar borrowing arrangements with various financial institutions throughout our years as a public company. We also retain the ability to issue equity securities and utilize the proceeds to cash-settle the Convertible Senior Notes. See Note 14.
43
Table of Contents
On-Balance Sheet Arrangements
We primarily finance our U.S. operations with an accounts receivable securitization program, or the U.S. Arrangement. On November 12, 2010, we amended and restated the U.S. Arrangement replacing the lenders and the lead agent, or the Amended and Restated U.S. Arrangement. We can now pledge up to a maximum of $400.0 million in U.S. trade accounts receivable, or the U.S. Receivables, as compared to a maximum of $350.0 million under the previous agreement. The maturity date of the Amended and Restated U.S. Arrangement is November 12, 2013. The effective borrowing cost under the Amended and Restated U.S. Arrangement is a blend of the prevailing dealer commercial paper rates plus a program fee of 0.60% per annum based on the used portion of the commitment, and a facility fee of 0.60% per annum payable on the aggregate commitment of the lenders. Prior to the amendment, the effective borrowing cost was a blend of the prevailing dealer commercial paper rates, plus a program fee of 0.65% per annum based on the used portion of the commitment and a facility fee of 0.65% per annum payable on the aggregate commitment. The balance outstanding on the Amended and Restated U.S. Arrangement as of November 30, 2010 was $209.1 million. The balance outstanding under the U.S. Arrangement as of November 30, 2009 was $119.0 million.
Under the terms of the Amended and Restated U.S. Arrangement, we sell, on a revolving basis, our U.S. Receivables to a wholly-owned, bankruptcy-remote subsidiary. The borrowings are funded by pledging all of the rights, title and interest in and to the U.S. Receivables as security. Any borrowings under the Amended and Restated U.S. Arrangement are recorded as debt on our consolidated balance sheet. As is customary in trade accounts receivable securitization arrangements, a credit rating agency’s downgrade of the third party issuer of commercial paper or of a back-up liquidity provider (which provides a source of funding if the commercial paper market cannot be accessed) could result in an increase in our cost of borrowing or loss of our financing capacity under these programs if the commercial paper issuer or liquidity back-up provider is not replaced. Loss of such financing capacity could have a material adverse effect on our financial condition and results of operations.
We have a senior secured revolving line of credit arrangement, or the Revolver, with a financial institution. On November 12, 2010, we amended and restated the revolver, or the Amended and Restated Revolver, to remove one of the lenders and increase the maximum commitment of the remaining lender from $80.0 million to $100.0 million. The Amended and Restated Revolver retains an accordion feature to increase the maximum commitment by an additional $50.0 million to $150.0 million at our request, in the event the current lender consents to such increase or another lender participates in the Revolver. Interest on borrowings under the Amended and Restated Revolver is based on a base rate or LIBOR rate, at our option. The margin on our LIBOR rate is determined in accordance with our fixed charge coverage ratio under the Revolver and is currently 2.25%. Our base rate is determined based on the higher of (i) the financial institution’s prime rate, (ii) the overnight federal funds rate plus 0.50% or (iii) one month LIBOR plus 1.0%. An unused line fee of 0.50% per annum is payable if the outstanding principal amount of the Amended and Restated Revolver is less than half of the lender’s commitment, however, that fee is reduced to 0.35% if the outstanding principal amount of the Revolver is greater than half of the lender’s commitment. The Amended and Restated Revolver is secured by our inventory and other assets and expires on November 12, 2013. It would be an event of default under the Amended and Restated Revolver if (1) a lender under the Amended and Restated U.S. Arrangement declines to extend the maturity date at any point within 60 days prior to the maturity date of the Amended and Restated U.S. Arrangement, unless availability under the Amended and Restated Revolver exceeds $60.0 million or we have a binding commitment in place to renew or replace the Amended and Restated U.S. Arrangement or (2) at least 20 days prior to the maturity date of the Amended and Restated U.S. Arrangement we do not have in place a binding commitment to renew or replace the Amended and Restated U.S. Arrangement on substantially similar terms and conditions, unless we have no amounts outstanding under the Amended and Restated Revolver at such time. There was no borrowing outstanding as of November 30, 2010 and 2009, respectively.
SYNNEX Canada replaced its C$30.0 million revolving line of credit arrangement, or Canadian Arrangement, and replaced its C$110.0 million accounts receivable securitization program with a secured revolving credit arrangement, or the Canadian Revolving Arrangement in May 2009, having a maximum commitment of C$125.0 million. The Canadian Revolving Arrangement provides a sublimit of $5.0 million for
44
Table of Contents
the issuance of standby letters of credit. As of November 30, 2010, there were outstanding standby letters of credit totaling $3.3 million. SYNNEX Canada has granted a security interest on substantially all of its assets in favor of the lender under this revolving credit facility. In addition, we pledged our stock in SYNNEX Canada as collateral for the Canadian Revolving Arrangement. The Canadian Revolving Arrangement expires in May 2012. The interest rate applicable is equal to (i) a minimum rate of 2.5% plus a margin of 1.25% for a Base Rate Loan in Canadian Dollars, (ii) a minimum rate of 3.25% plus a margin of 2.50% for a Base Rate Loan in U.S. Dollars, and (iii) a minimum of 1.0% plus a margin of 2.75% for a BA (Bankers Acceptance) Rate Loan. A fee of 0.375% per annum is payable with respect to the unused portion of the commitment. The balances outstanding under our Canadian Revolving Arrangement as of November 30, 2010 and 2009 were $36.2 million and $29.1 million, respectively.
SYNNEX Canada had a credit facility with a financial institution in Canada which allowed SYNNEX Canada to issue documentary letters of credit. The limit on this facility was C$0.4 million with 180 days validity. The limit had been reduced in February 2010, as a result of the sale of the BDG division from C$30.0 million to C$0.4 million. In connection with this credit facility, we had issued a guarantee of SYNNEX Canada’s obligations in favor of the financial institution in Canada, which was reduced to C$7.0 million from C$20.0 million. The facility was terminated on October 5, 2010 and we were released from the guarantee on January 5, 2011.
As of November 30, 2010, we had outstanding letters of credit amounting to $0.8 million under a letter of credit facility and as of November 30, 2009, we had $2.1 million borrowings outstanding under other lines of credit.
We also have a term loan and mortgage facility in Canada with a financial institution with balances of $9.7 million and $10.0 million as of November 30, 2010 and 2009, respectively, which expires in 2017. Future principal payments due after November 30, 2010 under our borrowing arrangements, the term loan and mortgage in Canada, and payments due under our operating lease arrangements are as follows (in thousands):
| Payments Due by Period | ||||||||||||||||||||
| Total | Less than 1 Year |
1 - 3 Years |
3 - 5 Years | > 5 Years |
||||||||||||||||
| (in thousands) | ||||||||||||||||||||
| Contractual Obligations: |
||||||||||||||||||||
| Principal debt payments |
$ | 255,017 | $ | 245,973 | $ | 1,372 | $ | 1,526 | $ | 6,146 | ||||||||||
| Interest on debt |
3,828 | 1,075 | 893 | 739 | 1,121 | |||||||||||||||
| Non-cancelable operating leases |
43,146 | 16,566 | 19,826 | 6,754 | — | |||||||||||||||
| Total |
$ | 301,991 | $ | 263,614 | $ | 22,091 | $ | 9,019 | $ | 7,267 | ||||||||||
Due to the uncertainty of the timing and amount that may be settled in cash, the convertible senior notes described in Note 14 have not been included in the table above.
We have also issued guarantees to certain vendors and lenders of our subsidiaries for an aggregate amount of $108.5 million as of November 30, 2010 and $105.1 million as of November 30, 2009. We are obligated under these guarantees to pay amounts due should our subsidiaries not pay valid amounts owed to their vendors or lenders. As of November 30, 2010 we had a liability of $10.5 million for unrecognized tax benefits under certain tax positions. As we are unable to reasonably predict the timing of settlement of these liabilities, the table above excludes such liabilities.
Off-Balance Sheet Arrangements
Our Canadian subsidiary, SYNNEX Canada, replaced our accounts receivable securitization program in Canada, with a secured revolving credit arrangement, or the Canadian Revolving Arrangement, in May 2009. Prior to its replacement, the Canadian accounts receivable securitization program was accounted for as an off-balance sheet transaction because we funded the advances by selling our rights, title and interest in U.S. and
45
Table of Contents
Canadian trade receivables, or Canadian Receivables, to the financial institution on a fully-serviced basis. The Canadian Revolving Arrangement is accounted for as an on-balance sheet transaction.
Covenants Compliance
In relation to our Amended and Restated U.S. Arrangement, the Amended and Restated Revolver and the Canadian Revolving Arrangement, we have a number of covenants and restrictions that, among other things, require us to comply with certain financial and other covenants and restrict our ability to incur additional debt. These covenants require us to maintain specified financial ratios and satisfy certain financial condition tests, including minimum net worth and fixed charge coverage ratio. They also limit our ability to make or forgive intercompany loans, pay dividends and make distributions, make certain acquisitions, repurchase our stock, create liens, cancel debt owed to us, enter into agreements with affiliates, modify the nature of our business, enter into sale-leaseback transactions, make certain investments, enter into new real estate leases, transfer and sell assets, cancel or terminate any material contracts and merge or consolidate. The covenants also limit our ability to pay cash upon conversion, redemption or repurchase of the Notes, as defined below, subject to certain liquidity tests. As of November 30, 2010, we were in compliance with all material covenants for the above arrangements.
Convertible Debt
In May 2008, we issued $143.8 million of aggregate principal amount of our 4.0% Convertible Senior Notes due 2018, or the Notes, in a private placement. The Notes have a cash coupon interest rate of 4.0% per annum. Interest on the Notes is payable in cash semi-annually in arrears on May 15 and November 15 of each year, beginning November 15, 2008. In addition, we will pay contingent interest in respect of any six-month period from May 15 to November 14 or from November 15 to May 14, with the initial six-month period commencing May 15, 2013, if the trading price of the Notes for each of the ten trading days immediately preceding the first day of the applicable six-month period equals 120% or more of the principal amount of the Notes. During any interest period when contingent interest is payable, the contingent interest payable per Note is equal to 0.55% of the average trading price of the Notes during the ten trading days immediately preceding the first day of the applicable six-month interest period. The Notes mature on May 15, 2018, subject to earlier redemption, repurchase or conversion.
Holders may convert their Notes at their option at any time prior to the close of business on the business day immediately preceding the maturity date for such Notes under the following circumstances: (1) during any fiscal quarter after the fiscal quarter ended August 31, 2008 (and only during such fiscal quarter), if the last reported sale price of our common stock for at least 20 trading days in the period of 30 consecutive trading days ending on the last trading day of the immediately preceding fiscal quarter is equal to or more than 130% of the conversion price of the Notes on the last day of such preceding fiscal quarter, (2) during the five business-day period after any five consecutive trading-day period, or the Measurement Period, in which the trading price per $1,000 principal amount of the Notes for each day of that Measurement Period was less than 98% of the product of the last reported sale price of the common stock and the conversion rate of the Notes on each such day; (3) if we have called the particular Notes for redemption, until the close of business on the business day prior to the redemption date; or (4) upon the occurrence of certain corporate transactions. In addition, holders may also convert their Notes at their option at any time beginning on November 15, 2017, and ending at the close of business on the business day immediately preceding the maturity date for the Notes, without regard to the foregoing circumstances. Upon conversion, we will pay or deliver, as the case may be, cash, shares of the common stock or a combination thereof at our election. The initial conversion rate for the Notes will be 33.9945 shares of common stock per $1,000 principal amount of Notes, equivalent to an initial conversion price of $29.42 per share of common stock. Such conversion rate will be subject to adjustment in certain events but will not be adjusted for accrued interest, including any additional interest and any contingent interest.
We may not redeem the Notes prior to May 20, 2013. We may redeem the Notes, in whole or in part, for cash on or after May 20, 2013, at a redemption price equal to 100% of the principal amount of the Notes to be redeemed, plus any accrued and unpaid interest to (including any additional interest and any contingent interest), but excluding, the redemption date.
46
Table of Contents
Holders may require us to repurchase all or a portion of their Notes for cash on May 15, 2013 at a purchase price equal to 100% of the principal amount of the Notes to be repurchased, plus any accrued and unpaid interest to (including any additional interest and any contingent interest), but excluding, the repurchase date. If we undergo a fundamental change, holders may require us to purchase all or a portion of their Notes for cash at a price equal to 100% of the principal amount of the Notes to be purchased, plus any accrued and unpaid interest to (including any additional interest and any contingent interest), but excluding, the fundamental change repurchase date.
The Notes are senior unsecured obligations of ours and rank equally in right of payment with other senior unsecured debt and rank senior to subordinated notes, if any. The Notes effectively rank junior to any of our secured indebtedness to the extent of the assets securing such indebtedness. The Notes are also structurally subordinated in right of payment to all indebtedness and other liabilities and commitments (including trade payables) of our subsidiaries. The net proceeds from the Notes were used for general corporate purposes and to reduce outstanding balances under the U.S. Arrangement and the Revolver.
The Notes are governed by an indenture, dated as of May 12, 2008, between us and U.S. Bank National Association, as trustee, which contains customary events of default.
The Notes as hybrid instruments are accounted as convertible debt and are recorded at carrying value. The right of the holders of the Notes to require us to repurchase the Notes in the event of a fundamental change and the contingent interest feature would require separate measurement from the Notes; however, the amount is insignificant. The additional shares issuable following certain corporate transactions do not require bifurcation and separate measurement from the Notes.
In the first quarter of fiscal year 2010, we adopted new standards effective December 1, 2009, that changed the accounting for the Notes. Under the previous standards the Notes were recognized entirely as a liability at historical value. In accordance with the provisions of the new standards, we retrospectively recognized both a liability and an equity component of the Notes in a manner that reflects our non-convertible debt borrowing rate at the date of issuance of 8.0%. The value assigned to the debt component which is the estimated fair value, as of the issuance date, of a similar note without the conversion feature was determined to be $120.3 million. The difference between the Note cash proceeds and this estimated fair value was estimated to be $23.4 million and was retroactively recorded as a debt discount and will be amortized to interest expense and finance charges, net over the five year period to the first put date, utilizing the effective interest method. The corresponding offset was recorded to additional paid-in capital and was adjusted for deferred taxes of $9.2 million. Underlying debt issuance costs of $3.6 million associated with the Notes were allocated between the liability and equity components of the debt in accordance with the provisions of the new standard.
As of November 30, 2010, the remaining amortization period is approximately 29 months assuming the redemption of the debentures at the first purchase date of May 20, 2013. Based on a cash coupon interest rate of 4.0%, we recorded contractual interest expense of $6.5 million, $6.6 million and $3.6 million during the fiscal years ended November 30, 2010, 2009 and 2008, respectively. Based on an effective rate of 8.0%, we recorded non-cash interest expense of $4.5 million, $4.0 million and $2.2 million during the fiscal years ended November 30, 2010, 2009 and 2008, respectively. As of both November 30, 2010 and 2009, the carrying value of the equity component of the Notes, net of allocated issuance costs, was $22.8 million. As of November 30, 2010, the if-converted value of the Notes did not exceed the principal balance.
Related Party Transactions
We have a business relationship with MiTAC International Corporation, or MiTAC International, a publicly-traded company in Taiwan that began in 1992 when it became our primary investor through its affiliates. As of November 30, 2010, MiTAC International and its affiliates beneficially owned approximately 29% of our common stock. In addition, Matthew Miau, the Chairman Emeritus of our Board of Directors, is the Chairman of MiTAC International and a director or officer of MiTAC International’s affiliates. As a result,
47
Table of Contents
MiTAC International generally has significant influence over us and over the outcome of all matters submitted to stockholders for consideration, including any of our mergers or acquisitions. Among other things, this could have the effect of delaying, deterring or preventing a change of control over us with the loss of any premium that stockholders otherwise might receive in connection with such a transaction.
Until July 31, 2010, we worked with MiTAC International on OEM outsourcing and jointly marketed MiTAC International’s design and electronic manufacturing services and our contract assembly capabilities. This relationship enabled us to build relationships with MiTAC International’s customers. On July 31, 2010, MiTAC International purchased certain assets related to our contract assembly business including inventory and customer contracts, primarily related to customers then being jointly served by MiTAC International and us. The value of the inventory sold was $68.1 million. No gain or loss was recognized on this transaction during the fiscal year ended November 30, 2010. As part of this transaction, we provide MiTAC International certain transition services for the business for a fee of $0.3 million per month over a period of twelve months. During the fiscal year ended November 30, 2010, we received $1.0 million in service fees. In addition, during the fiscal year ended November 30, 2010, we received $1.0 million in reimbursements for facilities and overhead costs. The sale agreement also includes earn-out and profit sharing provisions, which are based on operating performance metrics, achieved over twelve to eighteen months from the closing date, for the defined customers included in this transaction.
We purchased inventories, including notebook computers, motherboards and other peripherals, from MiTAC International and its affiliates totaling $157.1 million, $312.4 million and $261.6 million during fiscal years 2010, 2009 and 2008, respectively. Our sales to MiTAC International and its affiliates during fiscal years 2010, 2009 and 2008 totaled $5.6 million, $2.8 million and $2.0 million, respectively. Most of these purchases and sales were pursuant to our Master Supply Agreement with MiTAC International and Sun Microsystems, formerly one of our contract assembly customers. In fiscal year 2010, Oracle Corporation acquired Sun Microsystems and all of our contract assembly services to Oracle Corporation were covered by this Master Supply Agreement.
Our business relationship with MiTAC International had been informal and was not governed by long-term commitments or arrangements with respect to pricing terms, revenue or capacity commitments.
During the period of time that we worked with MiTAC International, we negotiated manufacturing, pricing and other material terms on a case-by-case basis with MiTAC International and our contract assembly customers for a given project. While MiTAC International is a related party and a controlling stockholder, we believe that the significant terms under these agreements, including pricing, would not materially differ from the terms we could have negotiated with unaffiliated third parties, and we have adopted a policy requiring that material transactions with MiTAC International or its related parties be approved by our Audit Committee, which is composed solely of independent directors. In addition, Matthew Miau’s compensation is approved by the Nominating and Corporate Governance Committee, which is also composed solely of independent directors. As MiTAC International’s ownership interest in us decreases as a result of sales of our stock and additional dilution, its interest in the success of the business and operations may decrease as well.
Beneficial Ownership of Our Common Stock by MiTAC International
As noted above, MiTAC International and our affiliates in the aggregate beneficially owned approximately 29% of our common stock as of November 30, 2010. These shares are owned by the following entities:
| November 30, 2010 | ||||
| (shares in thousands) | ||||
| MiTAC International (1) |
6,178 | |||
| Synnex Technology International Corp. (2) |
4,427 | |||
| Total |
10,605 | |||
48
Table of Contents
| (1) | Shares are held via Silver Star Developments Ltd., a wholly-owned subsidiary of MiTAC International. Excludes 786 thousand shares (of which 389 thousand shares are directly held and 397 thousand shares are subject to exercisable options) held by Matthew Miau. |
| (2) | Synnex Technology International Corp., or Synnex Technology International, is a separate entity from us and is a publicly-traded corporation in Taiwan. Shares are held via Peer Development Ltd, a wholly-owned subsidiary of Synnex Technology International. MiTAC International owns a noncontrolling interest of 8.7% in MiTAC Incorporated, a privately-held Taiwanese company, which in turn holds a noncontrolling interest of 14.6% in Synnex Technology International. Neither MiTAC International nor Mr. Miau is affiliated with any person(s), entity, or entities that hold a majority interest in MiTAC Incorporated. |
While the ownership structure of MiTAC International and its affiliates is complex, it has not had a material adverse effect on our business in the past, and we do not expect it to do so in the future.
During fiscal years 2007 and 2008, we purchased shares of MiTAC International and one of its affiliates related to the deferred compensation plan of Robert Huang, our founder and former Chairman. As of November 30, 2010, the value of the investment was $0.9 million. Except as described herein, none of our officers or directors has an interest in MiTAC International or its affiliates.
Synnex Technology International is a publicly-traded corporation in Taiwan that currently provides distribution and fulfillment services to various markets in Asia and Australia, and is also our potential competitor. Neither MiTAC International nor Synnex Technology International is restricted from competing with us.
Others
On August 31, 2010, we sold our controlling interests in Nihon Daikou Shouji Co., Ltd., or NDS for $3.1 million to SB Pacific, a newly formed company, led by our founder and former Chairman, Robert Huang. Concurrently, we acquired a 33.3% noncontrolling interest in SB Pacific. A gain of $0.5 million was recorded on the sale of NDS in Other income (expense), net during the fiscal year ended November 30, 2010. On December 1, 2010, we and SB Pacific acquired 70% and 30%, respectively, of the capital stock of Marubeni Infotec Corporation, now known as SYNNEX Infotec Corporation, for an aggregate of US$8.4 million subject to certain post closing adjustments. This acquisition is in the distribution segment and is expected to enable expansion into Japan. Mr. Huang is the Chief Executive Officer of SYNNEX Infotec Corporation.
Our investment in SB Pacific, which was accounted for as an equity-method investment, was included in “Other assets.” We regard SB Pacific to be a variable interest entity and as of November 30, 2010, our maximum exposure was limited to $1.1 million. During the 2010 fiscal year, we paid $0.2 million in management fees to SB Pacific.
Recent Accounting Pronouncements
In October 2009, the FASB issued an update to the existing multiple-element revenue arrangements guidance. This revised guidance primarily provides two significant changes: (1) eliminates the need for objective and reliable evidence of the fair value for the undelivered element in order for a delivered item to be treated as a separate unit of accounting, and (2) eliminates the residual method to allocate the arrangement consideration. This accounting update is effective for the first annual reporting period beginning on or after June 15, 2010, with early adoption permitted provided that the revised guidance is retroactively applied to the beginning of the year of adoption. This standard is applicable to us beginning December 1, 2010. The guidance is not expected to have a material impact on our consolidated financial statements.
In October 2009, the FASB issued an accounting standard addressing how entities account for revenue arrangements that contain both hardware and software elements. Due to the significant difference in the level of evidence required for separation of multiple deliverables within different accounting standards, this particular
49
Table of Contents
accounting standard will modify the scope of accounting guidance for software revenue recognition. Many tangible products containing software and non-software components that function together to deliver the tangible products’ essential functionality will be accounted for under the revised multiple-element arrangement revenue recognition guidance disclosed above. This accounting standard is effective for the first annual reporting period beginning on or after June 15, 2010, with early adoption permitted provided that the revised guidance is retroactively applied to the beginning of the year of adoption. This standard is applicable to us beginning December 1, 2010. The guidance is not expected to have a material impact on our consolidated financial statements.
During the fiscal year 2010, we adopted the following accounting standards:
In December 2007, the FASB issued a new accounting pronouncement for business combinations which establishes principles and requirements for how an acquirer recognizes and measures in its financial statements the identifiable assets acquired, the liabilities assumed, any noncontrolling interest in the acquiree and the goodwill acquired. This also establishes disclosure requirements to enable the evaluation of the nature and financial effects of the business combination. In April 2009, the FASB issued additional guidance to require that assets acquired and liabilities assumed in a business combination that arise from contingencies be recognized at fair value if fair value can be reasonably estimated. If the fair value cannot be reasonably estimated, the asset or liability will be recognized in accordance with ASC 450, “Contingencies.” The new standard is effective for fiscal years that begin after December 15, 2008, and was adopted by us in the first quarter of fiscal year 2010. We began accounting for business combinations under the new standard effective December 1, 2009.
In December 2007, the FASB issued accounting and reporting standards for ownership interests in subsidiaries held by parties other than the parent, the amount of consolidated net income attributable to the parent and to the noncontrolling interest, changes in a parent’s ownership interest and the valuation of retained noncontrolling equity investments when a subsidiary is deconsolidated. This standard also establishes disclosure requirements that clearly identify and distinguish between the interests of the parent and the interests of the noncontrolling owners. This standard is effective as of the beginning of an entity’s fiscal years that begins after December 15, 2008, and was adopted by us in the first quarter of fiscal year 2010 with retrospective application of presentation and disclosure requirements.
In April 2008, the FASB issued a new accounting pronouncement which amends the factors that should be considered in developing renewal or extension assumptions used to determine the useful life of a recognized intangible asset under ASC 350, “Intangibles—Goodwill and Other.” The intent of the position is to improve the consistency between the useful life of a recognized intangible asset under this standard and the period of expected cash flows used to measure the fair value of the asset under ASC 805, “Business Combinations.” This new standard is effective for fiscal years beginning after December 15, 2008 and was adopted by us in the first quarter of fiscal year 2010 with no material impact on our consolidated results of operations and financial condition.
In May 2008, the FASB issued a new accounting pronouncement which requires an issuer of certain convertible debt instruments that may be settled in cash (or other assets) on conversion to separately account for the liability (debt) and equity (conversion option) components of the instrument in a manner that reflects the issuer’s non-convertible debt borrowing rate. This is effective for fiscal years beginning after December 15, 2008 on a retroactive basis and was adopted by us in the first quarter of fiscal year 2010. The accounting pronouncement is applicable to our Notes which were issued in May 2008. Although the adoption of this pronouncement did not impact our actual past or future cash flows, it resulted in an increase in non-cash interest expense. The accompanying comparative consolidated financial statements and footnotes have been adjusted for all periods presented to reflect the retrospective application of the new standard. See Note 14.
50
Table of Contents
The following financial statement line items for the fiscal years ended November 30, 2009 and 2008 and as of November 30, 2009, were impacted as a result of applying the new standard retrospectively:
| Fiscal Year Ended November 30, 2009 | ||||||||||||
| As previously reported | As adjusted | Effect of Change increase /(decrease) |
||||||||||
| (in thousands except per share amounts) | ||||||||||||
| Consolidated Statement of Operations: |
||||||||||||
| Interest expense and finance charges, net |
$ | (13,983 | ) | $ | (18,032 | ) | $ | 4,049 | ||||
| Income from continuing operations before income taxes and noncontrolling interest |
138,702 | 134,653 | (4,049 | ) | ||||||||
| Provision for income taxes |
(50,656 | ) | (49,028 | ) | 1,628 | |||||||
| Income from continuing operations before noncontrolling interest, net of tax |
88,046 | 85,625 | (2,421 | ) | ||||||||
| Net income attributable to SYNNEX Corporation |
92,088 | 89,667 | (2,421 | ) | ||||||||
| Earnings per share attributable to SYNNEX Corporation: |
||||||||||||
| Net income per common share-basic |
$ | 2.82 | $ | 2.74 | $ | (0.08 | ) | |||||
| Net income per common share-diluted |
$ | 2.70 | $ | 2.64 | $ | (0.06 | ) | |||||
| Fiscal Year Ended November 30, 2008 | ||||||||||||
| As previously reported | As adjusted | Effect of Change increase / (decrease) |
||||||||||
| (in thousands except per share amounts) | ||||||||||||
| Consolidated Statement of Operations: |
||||||||||||
| Interest expense and finance charges, net |
$ | (15,006 | ) | $ | (17,206 | ) | $ | 2,200 | ||||
| Income from continuing operations before income taxes and noncontrolling interest |
123,548 | 121,348 | (2,200 | ) | ||||||||
| Provision for income taxes |
(45,705 | ) | (44,811 | ) | 894 | |||||||
| Income from continuing operations before noncontrolling interest, net of tax |
77,843 | 76,537 | (1,306 | ) | ||||||||
| Net income attributable to SYNNEX Corporation |
83,797 | 82,491 | (1,306 | ) | ||||||||
| Earnings per share attributable to SYNNEX Corporation: |
||||||||||||
| Net income per common share-basic |
$ | 2.65 | $ | 2.61 | $ | (0.04 | ) | |||||
| Net income per common share-diluted |
$ | 2.52 | $ | 2.48 | $ | (0.04 | ) | |||||
| As of November 30, 2009 | ||||||||||||
| As previously reported | As adjusted | Effect of Change increase / (decrease) |
||||||||||
| (in thousands) | ||||||||||||
| Consolidated Balance Sheet: |
||||||||||||
| Other current assets |
$ | 40,352 | $ | 39,974 | $ | (378 | ) | |||||
| Convertible debt |
143,750 | 126,785 | (16,965 | ) | ||||||||
| Deferred tax liabilities |
1,442 | 8,077 | 6,635 | |||||||||
| Additional paid-in capital |
236,213 | 249,892 | 13,679 | |||||||||
| Retained earnings |
554,972 | 551,245 | (3,727 | ) | ||||||||
51
Table of Contents
The following financial statement line items for the fiscal year ended November 30, 2010 and as of November 30, 2010, were impacted as a result of applying the new standard:
| Fiscal Year Ended November 30, 2010 | ||||||||||||
| Amounts as currently reported |
Amounts as would have been reported prior to adoption of new standard |
Effect of adoption - increase / (decrease) on current period |
||||||||||
| (in thousands except per share amounts) | ||||||||||||
| Consolidated Statement of Operations: |
||||||||||||
| Income from continuing operations before income taxes and noncontrolling interest |
$ | 183,586 | $ | 187,976 | $ | (4,390 | ) | |||||
| Net income attributable to SYNNEX Corporation |
127,948 | 130,576 | (2,628 | ) | ||||||||
| Earnings per share attributable to SYNNEX Corporation: |
||||||||||||
| Net income per common share-basic |
$ | 3.68 | $ | 3.76 | $ | (0.08 | ) | |||||
| Net income per common share-diluted |
$ | 3.58 | $ | 3.65 | $ | (0.07 | ) | |||||
| As of November 30, 2010 | ||||||||||||
| Amounts as currently reported |
Amounts as would have been reported prior to adoption of new standard |
Effect of Change increase / (decrease) |
||||||||||
| (in thousands) | ||||||||||||
| Consolidated Balance Sheet: |
||||||||||||
| Other current assets |
$ | 40,030 | $ | 40,292 | $ | (262 | ) | |||||
| Convertible debt |
131,289 | 143,750 | (12,461 | ) | ||||||||
| Deferred tax liabilities |
3,262 | (1,612 | ) | 4,874 | ||||||||
| Additional paid-in capital |
285,406 | 271,727 | 13,679 | |||||||||
| Retained earnings |
679,193 | 685,548 | (6,355 | ) | ||||||||
In June 2008, the FASB ratified guidance for determining whether an equity-linked financial instrument, or embedded feature, is indexed to an entity’s own stock. This is effective for fiscal years beginning after December 15, 2008, and interim periods within those fiscal years. The ratification of this new standard did not have a material impact on our consolidated results of operations and financial condition.
In November 2008, the FASB clarified guidance that the initial carrying value of an equity method investment should be determined in accordance with ASC 805, “Business Combinations.” Other-than-temporary impairment of an equity method investment should be recognized in accordance with ASC 323, “Investments—Equity Method and Joint Ventures” (“ASC 323”). ASC 323 is effective on a prospective basis in fiscal years beginning on or after December 15, 2008 and interim periods within those fiscal years, and was adopted by us in the first quarter of fiscal year 2010. We account for our equity method investment in accordance with ASC 323.
In November 2008, the FASB ratified the standard that applies to defensive assets that are acquired intangible assets which the acquirer does not intend to actively use, but intends to hold to prevent its competitors from obtaining access to the asset. This standard clarifies that defensive intangible assets are separately identifiable and should be accounted for as a separate unit of accounting in accordance with ASC 805, “Business Combinations” and ASC 820, “Fair Value Measurements and Disclosures.” This standard is effective for intangible assets acquired in fiscal years beginning on or after December 15, 2008 and was adopted by us in the first quarter of fiscal year 2010. Intangible assets acquired in fiscal year 2010 and later will be accounted for in accordance with this standard. The ratification of this standard did not have a material impact on our consolidated results of operations and financial condition. We did not hold any defensive assets as of November 30, 2010.
52
Table of Contents
In November 2008, the FASB ratified the standard that clarifies whether a financial instrument for which the payoff to the counterparty is based, in whole or in part, on the stock of an entity’s consolidated subsidiary is indexed to the reporting entity’s own stock. This standard is effective for fiscal years beginning on or after December 15, 2008 and interim periods within those fiscal years and was adopted by us in the first quarter of fiscal year 2010. We did not have any such financial instruments as of November 30, 2010.
In June 2009, the FASB issued a new accounting pronouncement that eliminates the concept of a qualifying special-purpose entity, creates more stringent conditions for reporting a transfer of a portion of a financial asset as a sale, clarifies other sale-accounting criteria, and changes the initial measurement of a transferor’s interest in transferred financial assets. This standard will be effective for transfers of financial assets in annual reporting periods beginning after November 15, 2009 and in interim periods within those first annual reporting periods with earlier adoption prohibited. This standard was adopted by us during the first quarter of fiscal year 2010. The adoption of this standard did not have a material impact on our consolidated results of operations and financial condition.
In June 2009, the FASB issued a new accounting pronouncement to require an enterprise to perform an analysis to determine whether the enterprise’s variable interest or interests give it a controlling financial interest in a variable interest entity. This analysis identifies the primary beneficiary of a variable interest entity as one with the power to direct the activities of a variable interest entity that most significantly impact the entity’s economic performance and the obligation to absorb losses of the entity that could potentially be significant to the variable interest. This new standard will be effective as of the beginning of the annual reporting period commencing after November 15, 2009 and was adopted by us in the first quarter of fiscal year 2010.
In January 2010, the FASB issued an update to existing standards on fair value measurements, which requires new disclosures about inputs and valuation techniques used in recurring and non-recurring fair value measurements and about significant transfers between the three levels of fair value measurements. The new disclosure requirements are effective for interim and annual periods beginning after December 15, 2009 and were adopted by us in the second quarter of fiscal year 2010. The accounting update did not have a material impact on our consolidated financial statements.
| Item 7A. | Quantitative and Qualitative Disclosures about Market Risk |
Foreign Currency Risk
We are exposed to foreign currency risk in the ordinary course of business. We hedge cash flow exposures for our major countries using a combination of forward contracts. Principal currencies hedged are the Canadian dollar, Chinese Renminbi, Japanese Yen, Philippines peso, Mexican peso and British pound. These instruments are generally short-term in nature, with typical maturities of less than one year. We do not hold or issue derivative financial instruments for trading purposes.
The following table presents the hypothetical changes in fair values of our outstanding derivative instruments as of November 30, 2010 and 2009, arising from an instantaneous strengthening or weakening of the U.S. dollar by 5%, 10% and 15% (in thousands).
| Loss on Derivative Instruments Given a Weakening of U.S. dollar by X Percent |
Gain (Loss) Assuming No Change in Exchange Rate |
Gain on Derivative Instruments Given a Strengthening of U.S. dollar by X Percent |
||||||||||||||||||||||||||
| 15% | 10% | 5% | 5% | 10% | 15% | |||||||||||||||||||||||
| Forward contracts at November 30, 2010 |
$ | (9,168 | ) | $ | (5,636 | ) | $ | (2,476 | ) | $ | 367 | $ | 2,940 | $ | 5,279 | $ | 7,415 | |||||||||||
| Forward contracts at November 30, 2009 |
$ | (13,865 | ) | $ | (8,967 | ) | $ | (4,571 | ) | $ | (69 | ) | $ | 3,010 | $ | 6,311 | $ | 9,347 | ||||||||||
53
Table of Contents
We do not apply hedge accounting to our forward contracts, our foreign exchange contracts are marked-to-market and any material gains and losses on our hedge contracts resulting from a hypothetical, instantaneous change in the strength of the U.S. dollar would be significantly offset by mark-to-market gains and losses on the corresponding assets and liabilities being hedged.
Interest Rate Risk
During the last two years, the majority of our debt obligations have been short-term in nature and the associated interest obligations have floated relative to major interest rate benchmarks. While we have not used derivative financial instruments to alter the interest rate characteristics of our investment holdings or debt instruments in the past, we may do so in the future.
A 1.5% increase or decrease in rates as of November 30, 2010 would not result in any material change in the fair value of our obligations. The following tables present the hypothetical interest expense related to our outstanding borrowings for the years ended November 30, 2010 and 2009, arising from hypothetical parallel shifts in the respective countries’ yield curves, of plus or minus 5%, 10% and 15% (in thousands).
| Interest Expense Given an Interest Rate Decrease by X Percent |
Actual Interest Expense Assuming No Change in Interest Rate |
Interest Expense Given an Interest Rate Increase by X Percent |
||||||||||||||||||||||||||
| 15% | 10% | 5% | 5% | 10% | 15% | |||||||||||||||||||||||
| SYNNEX US |
$ | 4,143 | $ | 4,386 | $ | 4,630 | $ | 4,874 | $ | 5,117 | $ | 5,361 | $ | 5,605 | ||||||||||||||
| SYNNEX Canada |
1,566 | 1,658 | 1,750 | 1,843 | 1,935 | 2,027 | 2,119 | |||||||||||||||||||||
| Total for the year ended November 30, 2010 |
$ | 5,709 | $ | 6,044 | $ | 6,380 | $ | 6,717 | $ | 7,052 | $ | 7,388 | $ | 7,724 | ||||||||||||||
| Interest Expense Given an Interest Rate Decrease by X Percent |
Actual Interest Expense Assuming No Change in Interest Rate |
Interest Expense Given an Interest Rate Increase by X Percent |
||||||||||||||||||||||||||
| 15% | 10% | 5% | 5% | 10% | 15% | |||||||||||||||||||||||
| SYNNEX US |
$ | 5,805 | $ | 6,146 | $ | 6,488 | $ | 6,829 | $ | 7,171 | $ | 7,512 | $ | 7,853 | ||||||||||||||
| SYNNEX Canada |
1,242 | 1,315 | 1,388 | 1,461 | 1,534 | 1,607 | 1,680 | |||||||||||||||||||||
| Total for the year ended November 30, 2009 |
$ | 7,047 | $ | 7,461 | $ | 7,876 | $ | 8,290 | $ | 8,705 | $ | 9,119 | $ | 9,533 | ||||||||||||||
Equity Price Risk
The equity price risk associated with our marketable equity securities as of November 30, 2010 and 2009 is not material in relation to our consolidated financial position, results of operations or cash flow. Marketable equity securities include shares of common stock. The investments are classified as either trading or available-for-sale securities. Securities classified as trading are recorded at fair market value, based on quoted market prices and unrealized gains and losses are included in results of operations. Securities classified as available-for-sale are recorded at fair market value, based on quoted market prices and unrealized gains and losses are included in other comprehensive income. Realized gains and losses, which are calculated based on the specific identification method, are recorded in operations as incurred.
54
Table of Contents
| Item 8. | Financial Statements and Supplementary Data |
| Page | ||||
| Consolidated Financial Statements of SYNNEX Corporation |
||||
| Management’s Report on Internal Control over Financial Reporting |
56 | |||
| 57 | ||||
| Consolidated Balance Sheets as of November 30, 2010 and 2009 |
58 | |||
| Consolidated Statements of Operations for the Fiscal Years ended November 30, 2010, 2009 and 2008 |
59 | |||
| 60 | ||||
| 61 | ||||
| Consolidated Statements of Cash Flows for the Fiscal Years ended November 30, 2010, 2009 and 2008 |
62 | |||
| 63 | ||||
| 108 | ||||
| Financial Statement Schedule |
||||
| 109 | ||||
Financial statement schedules not listed above are either omitted because they are not applicable or the required information is shown in the Consolidated Financial Statements or in the Notes thereto.
55
Table of Contents
Management’s Report on Internal Control over Financial Reporting
Our management is responsible for establishing and maintaining adequate internal control over financial reporting, as such term is defined in Exchange Act Rules 13a-15(f). Our internal control over financial reporting is designed to provide reasonable assurance regarding the reliability of financial reporting and the preparation of financial statements for external purposes in accordance with generally accepted accounting principles. Our internal control over financial reporting includes those policies and procedures that (i) pertain to the maintenance of records that, in reasonable detail, accurately and fairly reflect the transactions and dispositions of our assets; (ii) provide reasonable assurance that transactions are recorded as necessary to permit preparation of financial statements in accordance with generally accepted accounting principles, and that receipts and expenditures of ours are being made only in accordance with authorizations of management and directors of us; and (iii) provide reasonable assurance regarding prevention or timely detection of unauthorized acquisition, use, or disposition of our assets that could have a material effect on the financial statements.
Because of its inherent limitations, internal control over financial reporting may not prevent or detect misstatements. Also, projections of any evaluation of effectiveness to future periods are subject to the risk that controls may become inadequate because of changes in conditions, or that the degree of compliance with the policies or procedures may deteriorate.
Under the supervision and with the participation of our management, including our principal executive officer and principal financial officer, we conducted an evaluation of the effectiveness of our internal control over financial reporting based on the framework in Internal Control—Integrated Framework issued by the Committee of Sponsoring Organizations of the Treadway Commission. Based on this assessment, our management concludes that, as of November 30, 2010, our internal control over financial reporting was effective based on those criteria.
The effectiveness of our internal control over financial reporting as of November 30, 2010 has been audited by PricewaterhouseCoopers LLP, an independent registered public accounting firm, as stated in its report which appears in Item 8 of this Annual Report on Form 10-K.
56
Table of Contents
Report of Independent Registered Public Accounting Firm
To the Board of Directors and Stockholders of SYNNEX Corporation:
In our opinion, the consolidated financial statements listed in the accompanying index present fairly, in all material respects, the financial position of SYNNEX Corporation and its subsidiaries at November 30, 2010 and 2009, and the results of their operations and their cash flows for each of the three years in the period ended November 30, 2010 in conformity with accounting principles generally accepted in the United States of America. In addition, in our opinion, the financial statement schedule listed in the accompanying index present fairly, in all material respects, the information set forth therein when read in conjunction with the related consolidated financial statements. Also in our opinion, the Company maintained, in all material respects, effective internal control over financial reporting as of November 30, 2010, based on criteria established in Internal Control—Integrated Framework issued by the Committee of Sponsoring Organizations of the Treadway Commission (COSO). The Company’s management is responsible for these financial statements and financial statement schedule, for maintaining effective internal control over financial reporting and for its assessment of the effectiveness of internal control over financial reporting, included in Management’s Report on Internal Control over Financial Reporting appearing under Item 9A. Our responsibility is to express opinions on these financial statements, on the financial statement schedule, and on the Company’s internal control over financial reporting based on our integrated audits. We conducted our audits in accordance with the standards of the Public Company Accounting Oversight Board (United States). Those standards require that we plan and perform the audits to obtain reasonable assurance about whether the financial statements are free of material misstatement and whether effective internal control over financial reporting was maintained in all material respects. Our audits of the financial statements included examining, on a test basis, evidence supporting the amounts and disclosures in the financial statements, assessing the accounting principles used and significant estimates made by management, and evaluating the overall financial statement presentation. Our audit of internal control over financial reporting included obtaining an understanding of internal control over financial reporting, assessing the risk that a material weakness exists, and testing and evaluating the design and operating effectiveness of internal control based on the assessed risk. Our audits also included performing such other procedures as we considered necessary in the circumstances. We believe that our audits provide a reasonable basis for our opinions.
As discussed in Notes 2 and 7 to the consolidated financial statements, the Company changed the manner in which it accounts for business combinations, noncontrolling interests, and convertible instruments that may be settled in cash upon conversion in 2010, and for uncertain tax positions in 2008.
A company’s internal control over financial reporting is a process designed to provide reasonable assurance regarding the reliability of financial reporting and the preparation of financial statements for external purposes in accordance with generally accepted accounting principles. A company’s internal control over financial reporting includes those policies and procedures that (i) pertain to the maintenance of records that, in reasonable detail, accurately and fairly reflect the transactions and dispositions of the assets of the company; (ii) provide reasonable assurance that transactions are recorded as necessary to permit preparation of financial statements in accordance with generally accepted accounting principles, and that receipts and expenditures of the company are being made only in accordance with authorizations of management and directors of the company; and (iii) provide reasonable assurance regarding prevention or timely detection of unauthorized acquisition, use, or disposition of the company’s assets that could have a material effect on the financial statements.
Because of its inherent limitations, internal control over financial reporting may not prevent or detect misstatements. Also, projections of any evaluation of effectiveness to future periods are subject to the risk that controls may become inadequate because of changes in conditions, or that the degree of compliance with the policies or procedures may deteriorate.
/s/ PricewaterhouseCoopers LLP
PricewaterhouseCoopers LLP
San Jose, California
February 11, 2011
57
Table of Contents
CONSOLIDATED BALANCE SHEETS
(in thousands, except for par value)
| November 30, 2010 |
November 30, 2009 |
|||||||
| (As Adjusted - See Note 2) |
||||||||
| ASSETS |
||||||||
| Current assets: |
||||||||
| Cash and cash equivalents |
$ | 88,038 | $ | 37,816 | ||||
| Short-term investments |
11,419 | 21,219 | ||||||
| Accounts receivable, net |
986,917 | 820,633 | ||||||
| Receivable from vendors, net |
132,409 | 99,610 | ||||||
| Receivable from affiliates |
5,080 | 5,144 | ||||||
| Inventories |
912,237 | 713,813 | ||||||
| Current deferred tax assets |
33,063 | 27,787 | ||||||
| Other current assets |
40,030 | 39,974 | ||||||
| Assets held for sale |
— | 74,185 | ||||||
| Total current assets |
2,209,193 | 1,840,181 | ||||||
| Property and equipment, net |
91,995 | 94,725 | ||||||
| Goodwill |
139,580 | 107,563 | ||||||
| Intangible assets, net |
28,271 | 18,066 | ||||||
| Deferred tax assets |
605 | 2,849 | ||||||
| Other assets |
30,217 | 36,526 | ||||||
| Total assets |
$ | 2,499,861 | $ | 2,099,910 | ||||
| LIABILITIES AND EQUITY |
||||||||
| Current liabilities: |
||||||||
| Borrowings under securitization, term loans and lines of credit |
$ | 245,973 | $ | 150,740 | ||||
| Accounts payable |
896,401 | 687,432 | ||||||
| Payables to affiliates |
3,195 | 82,728 | ||||||
| Accrued liabilities |
166,861 | 136,397 | ||||||
| Income taxes payable |
1,578 | 2,431 | ||||||
| Liabilities related to assets held for sale |
— | 18,148 | ||||||
| Total current liabilities |
1,314,008 | 1,077,876 | ||||||
| Long-term borrowings |
9,044 | 9,410 | ||||||
| Convertible debt |
131,289 | 126,785 | ||||||
| Long-term liabilities |
49,431 | 39,027 | ||||||
| Deferred tax liabilities |
3,262 | 8,077 | ||||||
| Total liabilities |
1,507,034 | 1,261,175 | ||||||
| Commitments and contingencies (Note 21) |
||||||||
| SYNNEX Corporation’s stockholders’ equity: |
||||||||
| Preferred stock, $0.001 par value, 5,000 shares authorized, no shares issued or outstanding |
— | — | ||||||
| Common stock, $0.001 par value, 100,000 shares authorized, 35,570 and 33,602 shares issued and outstanding |
36 | 34 | ||||||
| Additional paid-in capital |
285,406 | 249,892 | ||||||
| Accumulated other comprehensive income |
28,035 | 27,151 | ||||||
| Retained earnings |
679,193 | 551,245 | ||||||
| Total SYNNEX Corporation stockholders’ equity |
992,670 | 828,322 | ||||||
| Noncontrolling interest |
157 | 10,413 | ||||||
| Total equity |
992,827 | 838,735 | ||||||
| Total liabilities and equity |
$ | 2,499,861 | $ | 2,099,910 | ||||
The accompanying Notes are an integral part of these Consolidated Financial Statements.
58
Table of Contents
CONSOLIDATED STATEMENTS OF OPERATIONS
(in thousands, except for per share amounts)
| Fiscal Years Ended November 30, | ||||||||||||
| 2010 | 2009 | 2008 | ||||||||||
| (As Adjusted - See Note 2) |
(As Adjusted - See Note 2) |
|||||||||||
| Revenue |
$ | 8,614,141 | $ | 7,719,197 | $ | 7,736,726 | ||||||
| Cost of revenue |
(8,122,525 | ) | (7,296,167 | ) | (7,322,862 | ) | ||||||
| Gross profit |
491,616 | 423,030 | 413,864 | |||||||||
| Selling, general and administrative expenses |
(292,466 | ) | (273,381 | ) | (267,498 | ) | ||||||
| Income from continuing operations before non-operating items, income taxes and noncontrolling interest |
199,150 | 149,649 | 146,366 | |||||||||
| Interest expense and finance charges, net |
(17,114 | ) | (18,032 | ) | (17,206 | ) | ||||||
| Other income (expense), net |
1,550 | 3,036 | (7,812 | ) | ||||||||
| Income from continuing operations before income taxes and noncontrolling interest |
183,586 | 134,653 | 121,348 | |||||||||
| Provision for income taxes |
(66,910 | ) | (49,028 | ) | (44,811 | ) | ||||||
| Income from continuing operations before noncontrolling interest, net of tax |
116,676 | 85,625 | 76,537 | |||||||||
| Income from discontinued operations, net of tax |
75 | 5,199 | 6,647 | |||||||||
| Gain on sale of discontinued operations, net of tax |
11,351 | — | — | |||||||||
| Net income |
$ | 128,102 | $ | 90,824 | $ | 83,184 | ||||||
| Net income attributable to noncontrolling interest |
(154 | ) | (1,157 | ) | (693 | ) | ||||||
| Net income attributable to SYNNEX Corporation |
$ | 127,948 | $ | 89,667 | $ | 82,491 | ||||||
| Amounts attributable to SYNNEX Corporation: |
||||||||||||
| Income from continuing operations, net of tax |
$ | 116,538 | $ | 85,758 | $ | 76,762 | ||||||
| Discontinued operations: |
||||||||||||
| Income from discontinued operations, net of tax |
59 | 3,909 | 5,729 | |||||||||
| Gain on sale of discontinued operations, net of tax |
11,351 | — | — | |||||||||
| Net income attributable to SYNNEX Corporation |
$ | 127,948 | $ | 89,667 | $ | 82,491 | ||||||
| Earnings per share attributable to SYNNEX Corporation: |
||||||||||||
| Basic: |
||||||||||||
| Income from continuing operations |
$ | 3.35 | $ | 2.62 | $ | 2.43 | ||||||
| Discontinued operations |
0.33 | 0.12 | 0.18 | |||||||||
| Net income per common share—basic |
$ | 3.68 | $ | 2.74 | $ | 2.61 | ||||||
| Diluted: |
||||||||||||
| Income from continuing operations |
$ | 3.26 | $ | 2.53 | $ | 2.31 | ||||||
| Discontinued operations |
0.32 | 0.11 | 0.17 | |||||||||
| Net income per common share—diluted |
$ | 3.58 | $ | 2.64 | $ | 2.48 | ||||||
| Weighted-average common shares outstanding—basic |
34,737 | 32,711 | 31,619 | |||||||||
| Weighted-average common shares outstanding—diluted |
35,757 | 34,013 | 33,263 | |||||||||
The accompanying Notes are an integral part of these Consolidated Financial Statements.
59
Table of Contents
CONSOLIDATED STATEMENTS OF COMPREHENSIVE INCOME
(in thousands)
| Fiscal Years Ended November 30, | ||||||||||||
| 2010 | 2009 | 2008 | ||||||||||
| (As Adjusted - See Note 2) |
(As Adjusted - See Note 2) |
|||||||||||
| Net income |
$ | 128,102 | $ | 90,824 | $ | 83,184 | ||||||
| Other comprehensive income (loss): |
||||||||||||
| Unrealized gain on available-for-sale securities |
62 | 24 | 578 | |||||||||
| Foreign currency translation adjustment |
4,732 | 21,997 | (20,150 | ) | ||||||||
| Total other comprehensive income (loss): |
4,794 | 22,021 | (19,572 | ) | ||||||||
| Comprehensive income: |
132,896 | 112,845 | 63,612 | |||||||||
| Comprehensive income attributable to noncontrolling interest |
(154 | ) | (5,394 | ) | (693 | ) | ||||||
| Comprehensive income attributable to SYNNEX Corporation |
$ | 132,742 | $ | 107,451 | $ | 62,919 | ||||||
The accompanying Notes are an integral part of these Consolidated Financial Statements.
60
Table of Contents
CONSOLIDATED STATEMENTS OF STOCKHOLDERS’ EQUITY
AND COMPREHENSIVE INCOME (in thousands)
| SYNNEX Corporation Shareholders | Noncontrolling interest |
Comprehensive income |
Total equity | |||||||||||||||||||||||||||||
| Common stock | Additional paid-in capital |
Accumulated other comprehensive income (loss) |
Retained earnings |
|||||||||||||||||||||||||||||
| Shares | Amount | |||||||||||||||||||||||||||||||
| (As adjusted - See Note 2) |
(As adjusted - See Note 2) |
(As adjusted - See Note 2) |
||||||||||||||||||||||||||||||
| Balances, November 30, 2007 |
31,328 | $ | 31 | $ | 196,128 | $ | 28,939 | $ | 379,456 | $ | 958 | $ | — | $ | 605,512 | |||||||||||||||||
| Share-based compensation |
— | — | 6,637 | — | — | — | — | 6,637 | ||||||||||||||||||||||||
| Tax benefits from exercise of non-qualified stock options |
— | — | 2,091 | — | — | — | — | 2,091 | ||||||||||||||||||||||||
| Issuance of common stock on exercise of options and restricted stock |
587 | 1 | 3,149 | — | — | — | — | 3,150 | ||||||||||||||||||||||||
| Issuance of common stock for employee stock purchase plan |
39 | — | 741 | — | — | — | — | 741 | ||||||||||||||||||||||||
| Cumulative effect of adopting uncertain tax position |
— | — | (1,188 | ) | — | (369 | ) | — | — | (1,557 | ) | |||||||||||||||||||||
| Equity component of Convertible debt |
— | — | 13,679 | — | — | — | — | 13,679 | ||||||||||||||||||||||||
| Contribution by noncontrolling interest |
— | — | — | — | — | 3,022 | — | 3,022 | ||||||||||||||||||||||||
| Change in unrealized gains/losses on available-for-sale securities |
— | — | — | 578 | — | — | 578 | 578 | ||||||||||||||||||||||||
| Foreign currency translation adjustment |
— | — | — | (20,150 | ) | — | — | (20,150 | ) | (20,150 | ) | |||||||||||||||||||||
| Net income |
— | — | — | — | 82,491 | 693 | 83,184 | 83,184 | ||||||||||||||||||||||||
| Balances, November 30, 2008 |
31,954 | 32 | 221,237 | 9,367 | 461,578 | 4,673 | 63,612 | 696,887 | ||||||||||||||||||||||||
| Share-based compensation |
— | — | 8,193 | — | — | — | — | 8,193 | ||||||||||||||||||||||||
| Tax benefits from exercise of non-qualified stock options |
— | — | 7,018 | — | — | — | — | 7,018 | ||||||||||||||||||||||||
| Issuance of common stock on exercise of options and restricted stock |
1,596 | 2 | 11,663 | — | — | — | — | 11,665 | ||||||||||||||||||||||||
| Issuance of common stock for employee stock purchase plan |
52 | — | 751 | — | — | — | — | 751 | ||||||||||||||||||||||||
| Changes in equity for HiChina Web Solutions |
— | — | 1,030 | — | — | — | — | 1,030 | ||||||||||||||||||||||||
| Changes in equity for noncontrolling interests |
— | — | — | — | — | 346 | — | 346 | ||||||||||||||||||||||||
| Change in unrealized gains/losses on available-for-sale securities |
— | — | — | 24 | — | — | 24 | 24 | ||||||||||||||||||||||||
| Foreign currency translation adjustment |
— | — | — | 17,760 | — | 4,237 | 21,997 | 21,997 | ||||||||||||||||||||||||
| Net income |
— | — | — | — | 89,667 | 1,157 | 90,824 | 90,824 | ||||||||||||||||||||||||
| Balances, November 30, 2009 |
33,602 | 34 | 249,892 | 27,151 | 551,245 | 10,413 | 112,845 | 838,735 | ||||||||||||||||||||||||
| Share-based compensation |
— | — | 8,725 | — | — | — | — | 8,725 | ||||||||||||||||||||||||
| Tax benefits from exercise of non-qualified stock options |
— | — | 12,226 | — | — | — | — | 12,226 | ||||||||||||||||||||||||
| Issuance of common stock on exercise of options and restricted stock |
1,935 | 2 | 15,005 | — | — | — | — | 15,007 | ||||||||||||||||||||||||
| Issuance of common stock for employee stock purchase plan |
33 | — | 878 | — | — | — | — | 878 | ||||||||||||||||||||||||
| Changes in tax reserve |
— | — | 1,189 | — | — | — | — | 1,189 | ||||||||||||||||||||||||
| Changes in equity from sale of HiChina Web Solutions |
— | — | (2,509 | ) | (3,437 | ) | — | (7,418 | ) | — | (13,364 | ) | ||||||||||||||||||||
| Changes in equity from sale of Nihon Daikou Shouji |
— | — | — | (473 | ) | — | (3,148 | ) | — | (3,621 | ) | |||||||||||||||||||||
| Changes in ownership of noncontrolling interests |
— | — | — | — | — | 156 | — | 156 | ||||||||||||||||||||||||
| Change in unrealized gains/losses on available-for-sale securities |
— | — | — | 62 | — | — | 62 | 62 | ||||||||||||||||||||||||
| Foreign currency translation adjustment |
— | — | — | 4,732 | — | — | 4,732 | 4,732 | ||||||||||||||||||||||||
| Net income |
— | — | — | — | 127,948 | 154 | 128,102 | 128,102 | ||||||||||||||||||||||||
| Balances, November 30, 2010 |
35,570 | $ | 36 | $ | 285,406 | $ | 28,035 | $ | 679,193 | $ | 157 | $ | 132,896 | $ | 992,827 | |||||||||||||||||
The accompanying Notes are an integral part of these Consolidated Financial Statements.
61
Table of Contents
CONSOLIDATED STATEMENTS OF CASH FLOWS
(in thousands)
| Fiscal Years Ended November 30, | ||||||||||||
| 2010 | 2009 | 2008 | ||||||||||
| (As Adjusted - See Note 2) |
(As Adjusted - See Note 2) |
|||||||||||
| Cash flows from operating activities: |
||||||||||||
| Net income |
$ | 128,102 | $ | 90,824 | $ | 83,184 | ||||||
| Adjustments to reconcile net income to net cash provided by (used in) operating activities: |
||||||||||||
| Depreciation expense |
11,189 | 11,701 | 11,010 | |||||||||
| Amortization of intangible assets |
5,096 | 7,925 | 7,754 | |||||||||
| Accretion of convertible notes discount |
4,504 | 4,049 | 2,200 | |||||||||
| Share-based compensation |
8,725 | 8,193 | 6,637 | |||||||||
| Provision for doubtful accounts |
6,527 | 12,235 | 10,304 | |||||||||
| Tax benefits from employee stock plans |
12,226 | 7,018 | 2,091 | |||||||||
| Excess tax benefit from share-based compensation |
(9,798 | ) | (6,135 | ) | (1,815 | ) | ||||||
| Realized/Unrealized (gain) loss on investments |
(744 | ) | (2,724 | ) | 5,659 | |||||||
| Loss (gain) on disposal of assets and businesses |
(12,905 | ) | 167 | 25 | ||||||||
| Other-than-temporary impairment on securities and assets |
640 | 94 | 1,288 | |||||||||
| Changes in assets and liabilities, net of acquisition of businesses: |
||||||||||||
| Accounts receivable |
(156,806 | ) | (6,455 | ) | (45,013 | ) | ||||||
| Receivables from vendors |
(29,648 | ) | (2,509 | ) | 2,760 | |||||||
| Receivables from affiliates |
12,894 | (485 | ) | 5,130 | ||||||||
| Inventories |
(240,056 | ) | 1,926 | (16,379 | ) | |||||||
| Other assets |
1,278 | 44,725 | 41,632 | |||||||||
| Payable to affiliates |
(24,287 | ) | 9,097 | 6,297 | ||||||||
| Accounts payable |
220,182 | 103,008 | (36,622 | ) | ||||||||
| Accrued liabilities |
12,459 | 4,190 | (4,332 | ) | ||||||||
| Deferred liabilities |
(15,479 | ) | (24,804 | ) | (29,217 | ) | ||||||
| Net cash provided by (used in) operating activities |
(65,901 | ) | 262,040 | 52,593 | ||||||||
| Cash flows from investing activities: |
||||||||||||
| Purchase of trading investments |
(5,914 | ) | (17,696 | ) | (14,005 | ) | ||||||
| Proceeds from sale of trading investments |
9,166 | 16,629 | 14,692 | |||||||||
| Investment in held-to-maturity term deposits |
(11,396 | ) | (16,725 | ) | — | |||||||
| Proceeds from redemption of held-to-maturity term deposits |
21,126 | 5,049 | — | |||||||||
| Acquisition of businesses, net of cash acquired |
(47,376 | ) | (16,121 | ) | (28,015 | ) | ||||||
| Purchase of property and equipment |
(12,653 | ) | (25,011 | ) | (33,521 | ) | ||||||
| Proceeds from sale of businesses |
37,802 | — | — | |||||||||
| Loans and deposits to third parties, net |
(4,856 | ) | — | — | ||||||||
| Purchase of intangible asset |
— | — | (1,432 | ) | ||||||||
| Changes in restricted cash |
15,168 | (15,715 | ) | (3,412 | ) | |||||||
| Net cash provided by (used in) investing activities |
1,067 | (69,590 | ) | (65,693 | ) | |||||||
| Cash flows from financing activities: |
||||||||||||
| Proceeds from securitization and revolving line of credit |
3,990,574 | 2,713,857 | 1,756,514 | |||||||||
| Payment of securitization and revolving line of credit |
(3,897,547 | ) | (2,890,255 | ) | (1,853,720 | ) | ||||||
| Payment of bank loans |
(596 | ) | (20,489 | ) | (23,515 | ) | ||||||
| Proceeds from the issuance of convertible debt (net of issuance costs of $3,575) |
— | — | 140,175 | |||||||||
| Excess tax benefit from share-based compensation |
9,798 | 6,135 | 1,815 | |||||||||
| Book overdraft |
(24,367 | ) | (4,980 | ) | (4,742 | ) | ||||||
| Proceeds from issuance of common stock and contribution by noncontolling interest |
15,984 | 12,416 | 3,890 | |||||||||
| Net cash provided by (used in) financing activities |
93,846 | (183,316 | ) | 20,417 | ||||||||
| Effect of exchange rate changes on cash and cash equivalents |
(380 | ) | (5,754 | ) | 10,889 | |||||||
| Net increase in cash and cash equivalents |
28,632 | 3,380 | 18,206 | |||||||||
| Cash and cash equivalents at beginning of period |
59,406 | 56,026 | 37,820 | |||||||||
| Cash and cash equivalents at end of period |
$ | 88,038 | $ | 59,406 | $ | 56,026 | ||||||
| Supplemental disclosures of cash flow information: |
||||||||||||
| Interest paid |
$ | 13,528 | $ | 18,012 | $ | 9,639 | ||||||
| Income taxes paid |
$ | 56,217 | $ | 44,409 | $ | 44,492 | ||||||
The accompanying Notes are an integral part of these Consolidated Financial Statements.
62
Table of Contents
NOTES TO CONSOLIDATED FINANCIAL STATEMENTS
(in thousands except per share amounts)
NOTE 1—ORGANIZATION AND BASIS OF PRESENTATION:
SYNNEX Corporation (together with its subsidiaries, herein referred to as “SYNNEX” or the “Company”) is a business process services company offering a comprehensive range of services to resellers, retailers, and original equipment manufacturers (“OEMs”) worldwide. SYNNEX’s business process services include distribution and business process outsourcing (“BPO”) services. SYNNEX is headquartered in Fremont, California and has operations in the United States, Canada, China, Costa Rica, India, Japan, Mexico, the Philippines and the United Kingdom (“UK”).
NOTE 2—SUMMARY OF SIGNIFICANT ACCOUNTING POLICIES:
Use of estimates
The preparation of financial statements in conformity with generally accepted accounting principles (“GAAP”) in the United States requires management to make estimates and assumptions that affect the reported amounts of assets and liabilities and disclosure of contingent assets and liabilities at the date of the financial statements and the reported amounts of revenue and expense during the reporting period. The Company evaluates these estimates on a regular basis and bases them on historical experience and on various assumptions that the Company believes are reasonable. Actual results could differ from the estimates.
Principles of consolidation
The Consolidated Financial Statements include the accounts of the Company and its wholly-owned subsidiaries and majority-owned subsidiaries in which no substantive participating rights are held by minority stockholders. All intercompany accounts and transactions have been eliminated.
The Consolidated Financial Statements include 100% of the assets and liabilities of these majority-owned subsidiaries and the ownership interest of minority investors is recorded as noncontrolling interest. Investments in 20% through 50% owned affiliated companies are accounted under the equity method where the Company exercises significant influence over operating and financial affairs of the investee and is not the primary beneficiary. Investments in less than 20% owned companies or investments in 20% through 50% owned companies where the Company does not exercise significant influence over operating and financial affairs of the investee are recorded under the cost method.
Consolidation of variable interest entity
In fiscal year 2007, the Company acquired a majority interest in China Civilink (Cayman). China Civilink operated in China as HiChina Web Solutions. HiChina Web Solutions provided internet and webhosting services. People’s Republic of China (“PRC”) law limits foreign ownership of companies that provided internet content and advertising services. To comply with these foreign ownership restrictions, the Company operated in China with PRC citizens through contractual arrangements. The Company had the ability to substantially influence the daily operations and financial affairs. As a result of these contractual arrangements, which enabled the Company to control HiChina Web Solutions and its affiliates, the Company regarded HiChina Web Solutions as a variable interest entity under Accounting Standards Codification (“ASC”) 810, “Consolidation.” On December 22, 2009 the Company sold its interest in HiChina Web Solutions to Alibaba.com Ltd. and its results are presented as a discontinued operation.
63
Table of Contents
SYNNEX CORPORATION
NOTES TO CONSOLIDATED FINANCIAL STATEMENTS—(continued)
(in thousands except per share amounts)
Segment reporting
Operating segments are based on products and services provided by each segment, internal organization structure, manner in which operations are managed, criteria used by the Chief Operating Decision Maker (“CODM”) to assess the segment performance as well as resources allocation and the availability of discrete financial information. During fiscal year 2008, the Company changed its business strategy on managing its operations which prompted changes to its internal organization structure, resource allocation and measurement of its financial performance. The change in the business strategy has enabled the Company to focus on providing a full range of distribution and GBS offerings to its customers which resulted in two segments.
The distribution services segment distributes IT systems, peripherals, system components, software, networking equipment, consumer electronics (“CE”), and complementary products to a variety of customers, including value-added resellers, system integrators and retailers, as well as provides assembly services to OEMs, including integrated supply chain management, build-to-order and configure-to-order system configurations, materials management and logistics.
The GBS services segment provides a range of BPO services that include customer management, renewal management, back office processing, and information technology outsourcing on a global platform. The services are delivered via voice, chat, web, email and digital print.
Cash and cash equivalents
The Company considers all highly liquid debt instruments purchased with an original maturity or remaining maturity at date of purchase of three months or less to be cash equivalents. Cash equivalents consist principally of money market deposit accounts that are stated at cost, which approximates fair value. The Company is exposed to credit risk in the event of default by financial institutions to the extent that cash balances with financial institutions are in excess of amounts that are insured.
Restricted cash
As of November 30, 2010 and 2009, the Company had restricted cash in the amounts of $17,472 and $31,319. A portion of the restricted cash balance relates to temporary restrictions caused by the timing of lockbox collections under the Company’s borrowing arrangements, amounts held to cover outstanding letters of credit and miscellaneous deposits. The remaining amount of the restricted cash relates to future payments to contractors for the long-term projects at the Company’s Mexico operation. The Company receives the payments from the Mexican government for the equipment and services on a monthly basis. A portion of the payments to the contractors are withheld per the agreement and will be paid upon completion of the projects.
The following table summarizes the restricted cash balances as of November 30, 2010 and 2009 and the location where these amounts are recorded on the Consolidated Balance Sheet.
| As of November 30, | ||||||||
| 2010 | 2009 | |||||||
| Related to borrowing arrangements and others: |
||||||||
| Other current assets |
$ | 11,865 | $ | 17,015 | ||||
| Related to long-term projects: |
||||||||
| Other current assets |
3,153 | — | ||||||
| Other assets |
2,454 | 14,304 | ||||||
| Total restricted cash |
$ | 17,472 | $ | 31,319 | ||||
64
Table of Contents
SYNNEX CORPORATION
NOTES TO CONSOLIDATED FINANCIAL STATEMENTS—(continued)
(in thousands except per share amounts)
Investments
The Company classifies its investments in marketable securities as trading and available-for-sale. Marketable securities related to its deferred compensation plan are classified as trading and are recorded at fair value, based on quoted market prices, and unrealized gains and losses are included in “Other income (expense), net” in the Company’s financial statements. All other securities are classified as available-for-sale and are recorded at fair market value, based on quoted market prices, and unrealized gains and losses are included in “Accumulated other comprehensive income,” a component of stockholders’ equity. Realized gains and losses on available-for-sale securities, which are calculated based on the specific identification method, and declines in value judged to be other-than-temporary, if any, are recorded in “Other income (expense), net” as incurred.
To determine whether a decline in value is other-than-temporary, the Company evaluates several factors, including the current economic environment, market conditions, operational and financial performance of the investee, and other specific factors relating to the business underlying the investment, including business outlook of the investee, future trends in the investee’s industry and the Company’s intent to carry the investment for a sufficient period of time for any recovery in fair value. If a decline in value is deemed as other-than-temporary, the Company records reductions in carrying values to estimated fair values, which are determined based on quoted market prices if available or on one or more of the valuation methods such as pricing models using historical and projected financial information, liquidation values, and values of other comparable public companies.
The Company classifies its term deposits with financial institutions, with maturities from the date of purchase greater than three months and less than one year, as held-to-maturity investments. These term deposits are held until the maturity date and are not traded.
The Company has investments in equity instruments of privately-held companies and investments for which there are not readily determinable fair values. The investments that are included in “Short-term investments” are accounted for under the cost method of accounting. The long-term investments, which the Company has the ability and intent to hold for more than twelve months, are included in “Other assets” and are accounted for under the cost and equity methods of accounting. The Company monitors its cost and equity method investments for impairment by considering current factors, including the economic environment, market conditions, operational performance and other specific factors relating to the business underlying the investment, and records reductions in carrying values when necessary.
For the fiscal years ended November 30, 2010, 2009 and 2008 the Company recorded an other-than-temporary impairment in the value of its available-for-sale and cost method investments of $418, $94 and $1,288, respectively.
Allowance for doubtful accounts
The allowance for doubtful accounts is an estimate to cover the losses resulting from the inability of customers to make payments for outstanding balances. In estimating the required allowance, the Company takes into consideration the overall quality and aging of the accounts receivable, credit evaluations of customers’ financial condition and existence of credit insurance. The Company also evaluates the collectability of accounts receivable based on specific customer circumstances, current economic trends, historical experience with collections and any value and adequacy of collateral received from customers.
65
Table of Contents
SYNNEX CORPORATION
NOTES TO CONSOLIDATED FINANCIAL STATEMENTS—(continued)
(in thousands except per share amounts)
Inventories
Inventories are stated at the lower of cost or market. Cost is computed based on the weighted-average method. Inventories consist of finished goods purchased from various manufacturers for distribution resale and components used for assembly services. The Company adjusts the inventory carrying value for cost in excess of market value and product obsolescence.
Property and equipment
Property and equipment are stated at cost, less accumulated depreciation and amortization. Depreciation and amortization are computed using the straight-line method based upon the shorter of the estimated useful lives of the assets, or the lease term of the respective assets, if applicable. Maintenance and repairs are charged to expense as incurred, and improvements are capitalized. When assets are retired or otherwise disposed of, the cost and accumulated depreciation and amortization are removed from the accounts and any resulting gain or loss is reflected in operations in the period realized. The ranges of estimated useful lives for property and equipment categories are as follows:
| Equipment and Furniture |
3-7 years | |||
| Software |
3-7 years | |||
| Leasehold Improvements |
2-12 years | |||
| Buildings |
39 years |
Goodwill and intangible assets
The values assigned to goodwill and intangible assets are based on estimates and judgment regarding expectations for the success and life cycle of products and technologies acquired in a business combination. The Company assesses potential impairment of its goodwill and intangible assets when there is evidence that recent events or changes in circumstances have made recovery of an asset’s carrying value unlikely. The Company also assesses potential impairment of its goodwill and assets on an annual basis during its fourth quarter, regardless if there is evidence of impairment. If indicators of impairment were to be present in intangible assets used in operations and future undiscounted cash flows were not expected to be sufficient to recover the assets’ carrying amount, an impairment loss would be charged to expense in the period identified. The amount of an impairment loss would be recognized as the excess of the asset’s carrying value over its fair value. Factors the Company considers important, which may cause impairment include, among others, significant changes in the manner of use of the acquired asset, negative industry or economic trends, and significant underperformance relative to historical or projected operating results.
For the purpose of its goodwill analysis, the Company has two reporting units, as defined by ASC 350, “Intangible—Goodwill and Other.” The Company’s distribution services business segment is comprised of one Distribution Services reporting unit and the GBS business segment is comprised of the Contact Center reporting unit. The Company conducted their annual impairment analysis in the fourth quarter of fiscal year 2010. Each annual goodwill impairment analysis did not result in an impairment charge for the fiscal years ended 2010, 2009 and 2008, respectively.
Purchased intangible assets are amortized over the useful lives based on the estimate of the use of economic benefit of the asset or on the straight-line amortization method.
66
Table of Contents
SYNNEX CORPORATION
NOTES TO CONSOLIDATED FINANCIAL STATEMENTS—(continued)
(in thousands except per share amounts)
Intangible assets primarily consist of vendor lists and customer lists. Intangible assets are amortized as follows:
| Customer Lists |
4-8 years | |||
| Vendor Lists |
4-10 years | |||
| Other Intangible Assets |
3-10 years |
Impairment of long-lived assets
The Company reviews the recoverability of its long-lived assets, such as property and equipment and intangible assets, when events or changes in circumstances occur that indicate the carrying value of the asset or asset group may not be recoverable. The assessment of possible impairment is based on the Company’s ability to recover the carrying value of the asset or asset group from the expected future pre-tax cash flows, undiscounted and without interest charges, of the related operations. If these cash flows are less than the carrying value of such assets, an impairment loss is recognized for the difference between estimated fair value and carrying value. The measurement of impairment requires management to estimate future cash flows and the fair value of long-lived assets. In the fiscal year ended November 30, 2010, the Company recorded an impairment of $222 on its long-lived assets. No impairment was recorded in the fiscal years ended November 30, 2009 and 2008.
Software costs
The Company develops software platforms for internal use and for resale. The Company capitalizes costs incurred to develop software for resale subsequent to the software product reaching technological feasibility. The capitalized costs are amortized over the economic life of the product using the greater of the straight-line amortization or using the ratio of current revenue to future expected revenue.
The costs incurred to develop software for internal use were not capitalized since these costs were not material for the periods presented. The majority of development costs include payroll and other related costs, such as costs of support, maintenance and training functions that are not subject to capitalization. If internal software development costs become material, the Company will capitalize the costs based on the defined criteria for capitalization in accordance with ASC 350, “Intangibles—Goodwill and Other,” subtopic 40, “Internal—Use Software.”
Concentration of credit risk
Financial instruments that potentially subject the Company to significant concentration of credit risk consist principally of accounts receivable, cash and cash equivalents. The Company’s cash and cash equivalents are maintained with high quality institutions, the compositions and maturities of which are regularly monitored by management. Through November 30, 2010, the Company had not experienced any losses on such deposits.
Accounts receivable include amounts due from customers primarily in the technology industry. The Company performs ongoing credit evaluations of its customers’ financial condition and limits the amount of credit extended when deemed necessary, but generally requires no collateral. The Company also maintains allowances for potential credit losses. In estimating the required allowances, the Company takes into consideration the overall quality and aging of the receivable portfolio, the existence of a limited amount of credit insurance and specifically identified customer risks. Through November 30, 2010, such losses have been within management’s expectations.
67
Table of Contents
SYNNEX CORPORATION
NOTES TO CONSOLIDATED FINANCIAL STATEMENTS—(continued)
(in thousands except per share amounts)
In the fiscal year 2010, one customer accounted for 11% of the Company’s total revenue. In the fiscal years 2009 and 2008, no single customer exceeded 10% of the Company’s total revenue. As of November 30, 2010 and 2009, one customer accounted for approximately 16% and 11% of the total consolidated accounts receivable balance, respectively. Products purchased from the Company’s largest OEM supplier, Hewlett-Packard Company (“HP”), accounted for approximately 38%, 36% and 32% of the total revenue for the fiscal years ended November 30, 2010, 2009 and 2008, respectively.
Revenue recognition
The Company generally recognizes revenue on hardware and software products when they are shipped and on services when they are performed, if a purchase order exists, the sale price is fixed or determinable, collection of resulting accounts receivable is reasonably assured, risk of loss and title have transferred and product returns are reasonably estimable. Shipping terms are typically F.O.B. the Company’s warehouse. Provisions for sales returns are estimated based on historical data and are recorded concurrently with the recognition of revenue. These provisions are reviewed and adjusted periodically by the Company. Revenue is reduced for early payment discounts and volume incentive rebates offered to customers.
Effective in the first quarter of fiscal year 2010, the Company began recognizing revenue on certain service contracts, post-contract software support services, and extended warranty contracts, where it is not a primary obligor, on a net basis. Approximately 4% of revenue was recorded on a net basis for the fiscal year ended November 30, 2010.
The Company’s Mexico operation primarily focuses on projects with the Mexican government and other local agencies that are long-term in nature. The Company sells the computers and equipment to the contractors who provide services to the Mexican government. Under the agreements, the payments are due on a monthly basis and contingent upon the contractors performing certain services, fulfillment of certain obligations and meeting certain conditions. The Company recognizes product revenue and cost of revenue on a straight-line basis over the term of the contract, which coincides with payments no longer being contingent.
The Company provides GBS services to its customers under contracts that typically consist of a master services agreement or statement of work, which contains the terms and conditions of each program and service it offers. These agreements are usually short-term in nature and subject to early termination by the customers or the Company for any reason, typically with 30 to 90 days notice. Typically the contracts are time-based or transactions based. Revenue is generally recognized over the term of the contract if the service has already been rendered, the sales price is fixed or determinable and collection of the resulting accounts receivable is reasonably assured.
Shipping and handling costs
Costs related to shipping and handling are included in “Cost of revenue.”
OEM supplier programs
Funds received from OEM suppliers for inventory volume promotion programs, price protection and product rebates are recorded as adjustments to cost of revenue and the carrying value of inventories, as appropriate. Where there is a binding agreement, the Company tracks vendor promotional programs for volume discounts on a program-by-program basis and records them as a reduction of cost of revenue based on a
68
Table of Contents
SYNNEX CORPORATION
NOTES TO CONSOLIDATED FINANCIAL STATEMENTS—(continued)
(in thousands except per share amounts)
systematic and rational allocation. The Company monitors the balances of vendor receivables on a quarterly basis and adjusts the balances due for differences between expected and actual sales volume. Vendor receivables are generally collected through reductions authorized by the vendor, to accounts payable. Funds received for specific marketing and infrastructure reimbursements, net of direct costs, are recorded as adjustments to “Selling, general and administrative expenses,” and any excess reimbursement amount is recorded as an adjustment to cost of revenue.
Royalties
The Company purchases licensed software products from OEM vendors, which it subsequently distributes to resellers. Royalties to OEM vendors are accrued and recorded in cost of revenue when software products are shipped and revenue is recognized.
Warranties
The Company’s OEM suppliers generally warrant the products distributed by the Company and allow returns of defective products. The Company generally does not independently warrant the products it distributes; however, the Company does warrant the following: (1) its services with regard to products that it assembles for its customers, and (2) products that it builds to order from components purchased from other sources. To date neither warranty expense, nor the accrual for warranty costs has been material to the Company’s Consolidated Financial Statements.
Advertising
Costs related to advertising and product promotion expenditures are charged to “Selling, general and administrative expenses” as incurred and are primarily offset by OEM marketing reimbursements. To date, net costs related to advertising and promotion expenditures have not been material.
Income taxes
The asset and liability method is used in accounting for income taxes. Under this method, deferred tax assets and liabilities are recognized for the expected tax consequences of temporary differences between the tax bases of assets and liabilities and their reported amounts in the financial statements using enacted tax rates and laws that will be in effect when the difference is expected to reverse. Valuation allowances are provided against deferred tax assets that are not likely to be realized.
Foreign currency translations
The functional currencies of the Company’s foreign subsidiaries are their respective local currencies, with the exception of the Company’s operations in the UK, the Philippines and Costa Rica, for which the functional currencies are the U.S. dollar. The financial statements of the foreign subsidiaries, other than the operations in the UK, the Philippines, and Costa Rica are translated into U.S. dollars for consolidation as follows: assets and liabilities at the exchange rate as of the balance sheet date, stockholders’ equity at the historical rates of exchange, and income and expense amounts at the average exchange rate for the month. Translation adjustments resulting from the translation of the subsidiaries’ accounts are included in “Accumulated other comprehensive income.” Gains and losses resulting from foreign currency transactions are included within “Other income (expense), net.” Such amounts are not significant to any of the periods presented.
69
Table of Contents
SYNNEX CORPORATION
NOTES TO CONSOLIDATED FINANCIAL STATEMENTS—(continued)
(in thousands except per share amounts)
Comprehensive income
Comprehensive income is defined as the change in equity of a business enterprise during a period from transactions and other events and circumstances from non-owner sources. The primary components of comprehensive income for the Company include net income, foreign currency translation adjustments arising from the consolidation of the Company’s foreign subsidiaries and unrealized gains and losses on the Company’s available-for-sale securities.
Share-based compensation
ASC 718, “Compensation—Stock Compensation” requires the recognition of the fair value of share-based compensation. Under the fair value recognition provisions of ASC 718, “Compensation—Stock Compensation,” share-based compensation is estimated at the grant date based on the fair value of the awards expected to vest and recognized as expense ratably over the requisite service period of the award. The Company has used the Black-Scholes valuation model to estimate fair value of share-based awards, which requires various assumptions including estimating stock price volatility and expected life.
Net income per common share
Net income per common share-basic is computed by dividing the net income attributable to SYNNEX Corporation for the period by the basic weighted-average number of outstanding common shares.
Net income per common share—diluted is computed by adding the dilutive effect of in-the-money employee stock options, non-vested restricted stock awards, restricted stock units and similar equity instruments granted by the Company to the basic weighted-average number of outstanding common shares. The Company uses the treasury stock method, under which, the amount the employee must pay for exercising stock options, the amount of compensation cost for future services that the Company has not yet recognized and the amount of tax benefits that would be recorded in “Additional paid-in capital” when the award becomes deductible are assumed to be used to repurchase shares.
With respect to the Company’s convertible debt, the Company intends to settle its conversion spread (i.e., the intrinsic value of convertible debt based on the conversion price and current market price) in shares. The Company accounts for its conversion spread using the treasury stock method. It is the Company’s intent to cash-settle the principal amount of the convertible debt; accordingly, the principal amount has been excluded from the determination of diluted earnings per share.
The calculation of net income per common share attributable to SYNNEX Corporation is presented in Note 15.
Reclassifications
Certain reclassifications have been made to prior period amounts to conform to current period presentation. Such reclassifications have no effect on net income as previously reported.
Recent accounting pronouncements
In October 2009, the Financial Accounting Standards Board (“FASB”) issued an update to the existing multiple-element revenue arrangements guidance. This revised guidance primarily provides two significant changes: (1) eliminates the need for objective and reliable evidence of the fair value for the undelivered element
70
Table of Contents
SYNNEX CORPORATION
NOTES TO CONSOLIDATED FINANCIAL STATEMENTS—(continued)
(in thousands except per share amounts)
in order for a delivered item to be treated as a separate unit of accounting, and (2) eliminates the residual method to allocate the arrangement consideration. This accounting update is effective for the first annual reporting period beginning on or after June 15, 2010, with early adoption permitted provided that the revised guidance is retroactively applied to the beginning of the year of adoption. This standard is applicable to the Company beginning December 1, 2010. The guidance is not expected to have a material impact on its consolidated financial statements.
In October 2009, the FASB issued an accounting standard addressing how entities account for revenue arrangements that contain both hardware and software elements. Due to the significant difference in the level of evidence required for separation of multiple deliverables within different accounting standards, this particular accounting standard will modify the scope of accounting guidance for software revenue recognition. Many tangible products containing software and non-software components that function together to deliver the tangible products’ essential functionality will be accounted for under the revised multiple-element arrangement revenue recognition guidance disclosed above. This accounting standard is effective for the first annual reporting period beginning on or after June 15, 2010, with early adoption permitted provided that the revised guidance is retroactively applied to the beginning of the year of adoption. This standard is applicable to the Company beginning December 1, 2010. The guidance is not expected to have a material impact on its consolidated financial statements.
During the fiscal year 2010, the Company adopted the following accounting standards:
In December 2007, the FASB issued a new accounting pronouncement for business combinations which establishes principles and requirements for how an acquirer recognizes and measures in its financial statements the identifiable assets acquired, the liabilities assumed, any noncontrolling interest in the acquiree and the goodwill acquired. This also establishes disclosure requirements to enable the evaluation of the nature and financial effects of the business combination. In April 2009, the FASB issued additional guidance to require that assets acquired and liabilities assumed in a business combination that arise from contingencies be recognized at fair value if fair value can be reasonably estimated. If the fair value cannot be reasonably estimated, the asset or liability will be recognized in accordance with ASC 450, “Contingencies.” The new standard is effective for fiscal years that begin after December 15, 2008, and was adopted by the Company in the first quarter of fiscal year 2010. The Company began accounting for business combinations under the new standard effective December 1, 2009.
In December 2007, the FASB issued accounting and reporting standards for ownership interests in subsidiaries held by parties other than the parent, the amount of consolidated net income attributable to the parent and to the noncontrolling interest, changes in a parent’s ownership interest and the valuation of retained noncontrolling equity investments when a subsidiary is deconsolidated. This standard also establishes disclosure requirements that clearly identify and distinguish between the interests of the parent and the interests of the noncontrolling owners. This standard is effective as of the beginning of an entity’s fiscal years that begins after December 15, 2008, and was adopted by the Company in the first quarter of fiscal year 2010 with retrospective application of presentation and disclosure requirements.
In April 2008, the FASB issued a new accounting pronouncement which amends the factors that should be considered in developing renewal or extension assumptions used to determine the useful life of a recognized intangible asset under ASC 350, “Intangibles—Goodwill and Other.” The intent of the position is to improve the consistency between the useful life of a recognized intangible asset under this standard and the period of expected cash flows used to measure the fair value of the asset under ASC 805, “Business Combinations.” This
71
Table of Contents
SYNNEX CORPORATION
NOTES TO CONSOLIDATED FINANCIAL STATEMENTS—(continued)
(in thousands except per share amounts)
new standard is effective for fiscal years beginning after December 15, 2008 and was adopted by the Company in the first quarter of fiscal year 2010 with no material impact on its consolidated results of operations and financial condition.
In May 2008, the FASB issued a new accounting pronouncement which requires an issuer of certain convertible debt instruments that may be settled in cash (or other assets) on conversion to separately account for the liability (debt) and equity (conversion option) components of the instrument in a manner that reflects the issuer’s non-convertible debt borrowing rate. This is effective for fiscal years beginning after December 15, 2008 on a retroactive basis and was adopted by the Company in the first quarter of fiscal year 2010. The accounting pronouncement is applicable to the Company’s 4% Convertible Senior Notes due 2018, which were issued in May 2008. Although the adoption of this pronouncement did not impact the Company’s actual past or future cash flows, it resulted in an increase in non-cash interest expense. The accompanying comparative consolidated financial statements and footnotes have been adjusted for all periods presented to reflect the retrospective application of the new standard. See Note 14.
The following financial statement line items for the fiscal years ended November 30, 2009 and 2008 and as of November 30, 2009, were impacted as a result of applying the new standard retrospectively:
| Fiscal Year Ended November 30, 2009 | ||||||||||||
| As previously reported | As adjusted | Effect of Change increase / (decrease) |
||||||||||
| Consolidated Statement of Operations: |
||||||||||||
| Interest expense and finance charges, net |
$ | (13,983 | ) | $ | (18,032 | ) | $ | 4,049 | ||||
| Income from continuing operations before income taxes and noncontrolling interest |
138,702 | 134,653 | (4,049 | ) | ||||||||
| Provision for income taxes |
(50,656 | ) | (49,028 | ) | 1,628 | |||||||
| Income from continuing operations before noncontrolling interest, net of tax |
88,046 | 85,625 | (2,421 | ) | ||||||||
| Net income attributable to SYNNEX Corporation |
92,088 | 89,667 | (2,421 | ) | ||||||||
| Earnings per share attributable to SYNNEX Corporation: |
||||||||||||
| Net income per common share—basic |
$ | 2.82 | $ | 2.74 | $ | (0.08 | ) | |||||
| Net income per common share—diluted |
$ | 2.70 | $ | 2.64 | $ | (0.06 | ) | |||||
| Fiscal Year Ended November 30, 2008 | ||||||||||||
| As previously reported | As adjusted | Effect of Change increase / (decrease) |
||||||||||
| Consolidated Statement of Operations: |
||||||||||||
| Interest expense and finance charges, net |
$ | (15,006 | ) | $ | (17,206 | ) | $ | 2,200 | ||||
| Income from continuing operations before income taxes and noncontrolling interest |
123,548 | 121,348 | (2,200 | ) | ||||||||
| Provision for income taxes |
(45,705 | ) | (44,811 | ) | 894 | |||||||
| Income from continuing operations before noncontrolling interest, net of tax |
77,843 | 76,537 | (1,306 | ) | ||||||||
| Net income attributable to SYNNEX Corporation |
83,797 | 82,491 | (1,306 | ) | ||||||||
| Earnings per share attributable to SYNNEX Corporation: |
||||||||||||
| Net income per common share—basic |
$ | 2.65 | $ | 2.61 | $ | (0.04 | ) | |||||
| Net income per common share—diluted |
$ | 2.52 | $ | 2.48 | $ | (0.04 | ) | |||||
72
Table of Contents
SYNNEX CORPORATION
NOTES TO CONSOLIDATED FINANCIAL STATEMENTS—(continued)
(in thousands except per share amounts)
| As of November 30, 2009 | ||||||||||||
| As previously reported | As adjusted | Effect of Change increase / (decrease) |
||||||||||
| Consolidated Balance Sheet: |
||||||||||||
| Other current assets |
$ | 40,352 | $ | 39,974 | $ | (378 | ) | |||||
| Convertible debt |
143,750 | 126,785 | (16,965 | ) | ||||||||
| Deferred tax liabilities |
1,442 | 8,077 | 6,635 | |||||||||
| Additional paid-in capital |
236,213 | 249,892 | 13,679 | |||||||||
| Retained earnings |
554,972 | 551,245 | (3,727 | ) | ||||||||
The following financial statement line items for the fiscal year ended November 30, 2010 and as of November 30, 2010, were impacted as a result of applying the new standard:
| Fiscal Year Ended November 30, 2010 | ||||||||||||
| Amounts as currently reported |
Amounts as would have been reported prior to adoption of new standard |
Effect of adoption - increase / (decrease) on current period |
||||||||||
| Consolidated Statement of Operations: |
||||||||||||
| Income from continuing operations before income taxes and noncontrolling interest |
$ | 183,586 | $ | 187,976 | $ | (4,390 | ) | |||||
| Net income attributable to SYNNEX Corporation |
127,948 | 130,576 | (2,628 | ) | ||||||||
| Earnings per share attributable to SYNNEX Corporation: |
||||||||||||
| Net income per common share—basic |
$ | 3.68 | $ | 3.76 | $ | (0.08 | ) | |||||
| Net income per common share—diluted |
$ | 3.58 | $ | 3.65 | $ | (0.07 | ) | |||||
| As of November 30, 2010 | ||||||||||||
| Amounts as currently reported |
Amounts as would have been reported prior to adoption of new standard |
Effect of Change increase / (decrease) |
||||||||||
| Consolidated Balance Sheet: |
||||||||||||
| Other current assets |
$ | 40,030 | $ | 40,292 | $ | (262 | ) | |||||
| Convertible debt |
131,289 | 143,750 | (12,461 | ) | ||||||||
| Deferred tax liabilities |
3,262 | (1,612 | ) | 4,874 | ||||||||
| Additional paid-in capital |
285,406 | 271,727 | 13,679 | |||||||||
| Retained earnings |
679,193 | 685,548 | (6,355 | ) | ||||||||
In June 2008, the FASB ratified guidance for determining whether an equity-linked financial instrument, or embedded feature, is indexed to an entity’s own stock. This is effective for fiscal years beginning after December 15, 2008, and interim periods within those fiscal years. The ratification of this new standard did not have a material impact on the Company’s consolidated results of operations and financial condition.
In November 2008, the FASB clarified guidance that the initial carrying value of an equity method investment should be determined in accordance with ASC 805, “Business Combinations.” Other-than-temporary impairment of an equity method investment should be recognized in accordance with ASC 323, “Investments—Equity Method and Joint Ventures” (“ASC 323”). ASC 323 is effective on a prospective basis in fiscal years
73
Table of Contents
SYNNEX CORPORATION
NOTES TO CONSOLIDATED FINANCIAL STATEMENTS—(continued)
(in thousands except per share amounts)
beginning on or after December 15, 2008 and interim periods within those fiscal years, and was adopted by the Company in the first quarter of fiscal year 2010. The Company accounts for its equity method investment in accordance with ASC 323.
In November 2008, the FASB ratified the standard that applies to defensive assets that are acquired intangible assets which the acquirer does not intend to actively use, but intends to hold to prevent its competitors from obtaining access to the asset. This standard clarifies that defensive intangible assets are separately identifiable and should be accounted for as a separate unit of accounting in accordance with ASC 805, “Business Combinations” and ASC 820, “Fair Value Measurements and Disclosures.” This standard is effective for intangible assets acquired in fiscal years beginning on or after December 15, 2008 and was adopted by the Company in the first quarter of fiscal year 2010. Intangible assets acquired in fiscal year 2010 and later will be accounted for in accordance with this standard. The ratification of this standard did not have a material impact on the Company’s consolidated results of operations and financial condition. The Company did not hold any defensive assets as of November 30, 2010.
In November 2008, the FASB ratified the standard that clarifies whether a financial instrument for which the payoff to the counterparty is based, in whole or in part, on the stock of an entity’s consolidated subsidiary is indexed to the reporting entity’s own stock. This standard is effective for fiscal years beginning on or after December 15, 2008 and interim periods within those fiscal years and was adopted by the Company in the first quarter of fiscal year 2010. The Company did not have any such financial instruments as of November 30, 2010.
In June 2009, the FASB issued a new accounting pronouncement that eliminates the concept of a qualifying special-purpose entity, creates more stringent conditions for reporting a transfer of a portion of a financial asset as a sale, clarifies other sale-accounting criteria, and changes the initial measurement of a transferor’s interest in transferred financial assets. This standard will be effective for transfers of financial assets in annual reporting periods beginning after November 15, 2009 and in interim periods within those first annual reporting periods with earlier adoption prohibited. This standard was adopted by the Company during the first quarter of fiscal year 2010. The adoption of this standard did not have a material impact on the Company’s consolidated results of operations and financial condition.
In June 2009, the FASB issued a new accounting pronouncement to require an enterprise to perform an analysis to determine whether the enterprise’s variable interest or interests give it a controlling financial interest in a variable interest entity. This analysis identifies the primary beneficiary of a variable interest entity as one with the power to direct the activities of a variable interest entity that most significantly impact the entity’s economic performance and the obligation to absorb losses of the entity that could potentially be significant to the variable interest. This new standard will be effective as of the beginning of the annual reporting period commencing after November 15, 2009 and was adopted by the Company in the first quarter of fiscal year 2010.
In January 2010, the FASB issued an update to existing standards on fair value measurements, which requires new disclosures about inputs and valuation techniques used in recurring and non-recurring fair value measurements and about significant transfers between the three levels of fair value measurements. The new disclosure requirements are effective for interim and annual periods beginning after December 15, 2009 and were adopted by the Company in the second quarter of fiscal year 2010. The accounting update did not have a material impact on the Company’s consolidated financial statements.
74
Table of Contents
SYNNEX CORPORATION
NOTES TO CONSOLIDATED FINANCIAL STATEMENTS—(continued)
(in thousands except per share amounts)
NOTE 3—STOCKHOLDERS’ EQUITY:
Amended and Restated 2003 Stock Incentive Plan
The Company’s 2003 Stock Incentive Plan was adopted by its Board of Directors and approved by its stockholders in 2003 and amended and approved by its stockholders again in 2008. The plan provides for the direct award or sale of shares of common stock, restricted stock awards and restricted stock units, the grant of options to purchase shares of common stock and the award of stock appreciation rights to employees and non-employee directors, advisors and consultants.
The 2003 Stock Incentive Plan is administered by the Company’s Compensation Committee. The Compensation Committee determines which eligible individuals are to receive awards under the plan, the number of shares subject to the awards, the vesting schedule applicable to the awards and other terms of the award, subject to the limits of the plan. The Compensation Committee may delegate its administrative authority, subject to certain limitations, with respect to individuals who are not officers.
The Board of Directors may amend or modify the 2003 Stock Incentive Plan at any time, subject to any required stockholder approval. The plan will terminate no later than September 1, 2013. The number of shares granted, issued, retainable or vested under an award may be subject to the attachment of individual, divisional or Company-wide performance goals.
The number of authorized shares under the 2003 Stock Incentive Plan will not exceed fourteen million one hundred and twelve thousand shares of common stock. No participant in the 2003 Stock Incentive Plan may receive option grants or stock appreciation rights, restricted shares or restricted stock units for more than one million five hundred thousand shares per calendar year, or more than two million five hundred thousand shares in the participant’s first calendar year of service.
Under the 2003 Stock Incentive Plan
Qualified employees are eligible for the grant of incentive stock options to purchase shares of common stock. Qualified employees and non-employee directors, advisors and consultants are eligible for the grant of nonstatutory stock options, stock appreciation rights, restricted stock grants and restricted stock units. The outstanding stock options and restricted stock awards granted to qualified employees generally vest over a five-year period and the stock options have a contractual term of ten years.
Prior to January 4, 2007, qualified non-employee directors who first joined the Board of Directors after the plan was effective received an initial option grant of twenty-five thousand shares, and all non-employee directors were eligible for annual option grants of five thousand shares for each year they continued to serve. The exercise price of these option grants was equal to 100% of the fair market value of those shares on the date of the grant.
Amended and Restated 2003 Stock Incentive Plan, on and after January 4, 2007
After January 4, 2007, qualified non-employee directors who first join the Board of Directors after the plan is effective receive an initial option grant of ten thousand shares and two thousand shares of restricted stock. All non-employee directors are eligible for annual grants of two thousand shares of restricted stock for each year they continue to serve. The exercise price of these option grants is equal to 100% of the fair market value of those shares on the date of the grant. In addition, one third of the restricted stock grants vest on each anniversary date of the grant over a period of three years. One third of the stock options shall vest on the first anniversary
75
Table of Contents
SYNNEX CORPORATION
NOTES TO CONSOLIDATED FINANCIAL STATEMENTS—(continued)
(in thousands except per share amounts)
date of the grant and the remaining shall vest monthly over a two year period starting one month after the first anniversary of the date of grant. The annual grants of restricted stock vest in full upon the director’s retirement with the consent of the Board of Directors
Amended and Restated 2003 Stock Incentive Plan, after November 21, 2008
After November 21, 2008, the vesting schedule for qualified non-employee directors’ annual grants of two thousand shares of restricted stock was amended for newly issued grants. One quarter of the restricted shares shall vest on the last day of each quarter thereafter following the date of the grant over a period of one year.
The Compensation Committee determines the exercise price of options or the purchase price of restricted stock grants, but the option price for incentive stock options will not be less than 100% of the fair market value of the stock on the date of grant and the option price for nonstatutory stock options will not be less than 85% of the fair market value of the stock on the date of grant.
The following table summarizes the stock options outstanding and exercisable under the Company’s option plans as of November 30, 2010 and 2009:
| Number of options as of November 30, 2010 |
Number of options as of November 30, 2009 |
|||||||||||||||
| Outstanding | Exercisable | Outstanding | Exercisable | |||||||||||||
| Amended and Restated 2003 Stock Incentive Plan |
2,120 | 1,725 | 3,729 | 3,208 | ||||||||||||
2003 Employee Stock Purchase Plan
The Company’s 2003 Employee Stock Purchase Plan (“ESPP”) permits eligible employees to purchase common stock through payroll deductions. The plan was approved by the Company’s stockholders and approved by its Board of Directors in 2003 and certain amendments were approved by the Board of Directors in March 2005. A total of seven hundred and fifty thousand shares of common stock have been reserved for issuance under the ESPP. The participant purchase price discount is 5%. In a calendar year, there are four offering periods of three months each. The maximum number of shares a participant may purchase during a single accumulation period is one thousand two hundred fifty subject to a maximum purchase limit of ten thousand dollars per calendar year. Employees of associate vice president level and above are not eligible to participate in the plan.
The weighted-average per share ESPP enrollment date fair value of ESPP purchases during the fiscal years ended November 30, 2010 and 2009 was $2.57 and $1.80, respectively.
NOTE 4—SHARE-BASED COMPENSATION:
The Company recognizes share-based compensation expense under the provisions of ASC 718, “Compensation—Stock Compensation,” which requires the measurement and recognition of compensation expense for all share-based payment awards made to employees and directors, including employee stock options, restricted stock awards, restricted stock units and employee stock purchases, based on estimated fair values.
76
Table of Contents
SYNNEX CORPORATION
NOTES TO CONSOLIDATED FINANCIAL STATEMENTS—(continued)
(in thousands except per share amounts)
The Company recorded share-based compensation expense for the fiscal years ended November 30, 2010, 2009 and 2008 as follows:
| Fiscal Years Ended November 30, | ||||||||||||
| 2010 | 2009 | 2008 | ||||||||||
| Share-based compensation expense by type of award: |
||||||||||||
| Employee stock options |
$ | 2,759 | $ | 2,730 | $ | 2,833 | ||||||
| Restricted stock |
5,889 | 4,735 | 3,723 | |||||||||
| Employee stock purchase plan |
77 | 100 | 81 | |||||||||
| Total share-based compensation |
8,725 | 7,565 | 6,637 | |||||||||
| Tax effect on share-based compensation |
(3,180 | ) | (2,763 | ) | (2,309 | ) | ||||||
| Net effect on net income |
$ | 5,545 | $ | 4,802 | $ | 4,328 | ||||||
Share-based compensation expense for the fiscal year ended November 30, 2010 was higher than the prior year periods due to $1,005 one time recognition of costs for the modification and accelerated vesting of stock options and restricted awards, primarily on the retirement of the Company’s founder and former Chairman, Robert Huang.
Valuation Assumptions
ASC 718, “Compensation—Stock Compensation,” requires companies to estimate the fair value of share-based payment awards on the date of grant using an option-pricing model. The value of the portion of the award that is ultimately expected to vest is recognized as expense over the requisite service period in the Company’s financial statements. Share-based compensation expense recognized during the period is based on the value of the portion of share-based payment awards that is ultimately expected to vest during the period.
The Company uses the Black-Scholes valuation model to estimate fair value of share-based awards. The Black-Scholes option-pricing model was developed for use in estimating the fair value of short-lived exchange traded options that have no vesting restrictions and are fully transferable. In addition, option-pricing models require the input of highly subjective assumptions, including the option’s expected life and the price volatility of the underlying stock. The expected stock price volatility assumption was determined using historical volatility of the Company’s common stock. The following assumptions were used in the Black-Scholes valuation model in the fiscal years 2010, 2009 and 2008:
| Fiscal Years Ended November 30, | ||||||||||||
| 2010 | 2009 | 2008 | ||||||||||
| Stock option plan: |
||||||||||||
| Expected life (years) |
5.6 | 5.7 | 5.8 | |||||||||
| Risk free interest rate |
1.3 | % | 2.6 | % | 2.2 | % | ||||||
| Expected volatility |
42.0 | % | 43.6 | % | 39.7 | % | ||||||
| Dividend yield |
0 | % | 0 | % | 0 | % | ||||||
| Stock purchase plan: |
||||||||||||
| Expected life (years) |
0.3 | 0.3 | 0.3 | |||||||||
| Risk free interest rate |
0.2 | % | 0.1 | % | 0.9 | % | ||||||
| Expected volatility |
32.4 | % | 65.1 | % | 50.0 | % | ||||||
| Dividend yield |
0 | % | 0 | % | 0 | % | ||||||
77
Table of Contents
SYNNEX CORPORATION
NOTES TO CONSOLIDATED FINANCIAL STATEMENTS—(continued)
(in thousands except per share amounts)
A summary of the activity under the Company’s stock option plans is set forth below:
| Shares Available For Grant |
Options outstanding | |||||||||||
| Number of Shares |
Weighted-Average Exercise Price Per Share |
|||||||||||
| Balances, November 30, 2007 |
3,109 | 5,261 | $ | 11.27 | ||||||||
| Restricted stock granted |
(331 | ) | — | — | ||||||||
| Restricted stock cancelled/forfeited |
20 | — | — | |||||||||
| Options granted |
(264 | ) | 264 | 19.73 | ||||||||
| Options exercised |
— | (446 | ) | 8.87 | ||||||||
| Options forfeited |
35 | (35 | ) | 16.81 | ||||||||
| Balances, November 30, 2008 |
2,569 | 5,044 | $ | 11.89 | ||||||||
| Restricted stock granted |
(211 | ) | — | — | ||||||||
| Restricted stock cancelled/forfeited |
32 | — | — | |||||||||
| Options granted |
(157 | ) | 157 | 27.31 | ||||||||
| Options exercised |
— | (1,406 | ) | 9.41 | ||||||||
| Options forfeited |
66 | (66 | ) | 18.11 | ||||||||
| Balances, November 30, 2009 |
2,299 | 3,729 | $ | 13.37 | ||||||||
| Restricted stock awards granted |
(267 | ) | — | — | ||||||||
| Restricted stock units granted |
(100 | ) | — | — | ||||||||
| Restricted stock cancelled/forfeited |
38 | — | — | |||||||||
| Options granted |
(123 | ) | 123 | 28.52 | ||||||||
| Options exercised |
— | (1,710 | ) | 9.93 | ||||||||
| Options forfeited |
22 | (22 | ) | 7.14 | ||||||||
| Balances, November 30, 2010 |
1,869 | 2,120 | $ | 17.08 | ||||||||
Employee Stock Options
The weighted-average grant-date fair value of the stock options granted during the fiscal years 2010, 2009 and 2008 were as follows:
| Fiscal Years Ended November 30, | ||||||||||||
| 2010 | 2009 | 2008 | ||||||||||
| Number of options granted |
123 | 157 | 264 | |||||||||
| Weighted-average grant-date fair value per share |
$ | 12.02 | $ | 11.28 | $ | 8.03 | ||||||
78
Table of Contents
SYNNEX CORPORATION
NOTES TO CONSOLIDATED FINANCIAL STATEMENTS—(continued)
(in thousands except per share amounts)
The options outstanding and exercisable as of November 30, 2010 were in the following exercise price ranges:
| Options Outstanding | Options Vested and Exercisable | |||||||||||||||||||||||
| Range of Exercise Prices Per Share |
Shares | Weighted- Average Life (Years) |
Weighted- Average Exercise Price Per Share |
Shares | Weighted- Average Life (Years) |
Weighted- Average Exercise Price Per Share |
||||||||||||||||||
| $9.00 - $10.00 |
373 | 1.38 | $ | 10.00 | 373 | 1.38 | $ | 10.00 | ||||||||||||||||
| $12.00 - $15.54 |
407 | 2.64 | $ | 12.10 | 407 | 2.64 | $ | 12.10 | ||||||||||||||||
| $16.10 - $17.17 |
479 | 4.24 | $ | 16.51 | 479 | 4.24 | $ | 16.51 | ||||||||||||||||
| $18.25 - $30.96 |
861 | 7.32 | $ | 22.81 | 466 | 6.46 | $ | 21.35 | ||||||||||||||||
| $9.00 - $30.96 |
2,120 | 4.68 | $ | 17.08 | 1,725 | 3.85 | $ | 15.37 | ||||||||||||||||
The aggregate pre-tax intrinsic value of the options outstanding as of November 30, 2010 was $24,830 based on the Company’s closing stock price of $28.66 as of November 30, 2010, which would have been received by the option holders had all option holders exercised their options on that date. The aggregate pre-tax intrinsic value of the vested and exercisable options outstanding as of November 30, 2010 was $22,993.
The cash received from the exercise of options and the intrinsic values of options exercised during the fiscal years 2010, 2009 and 2008 were as follows:
| Fiscal Years Ended November 30, | ||||||||||||
| 2010 | 2009 | 2008 | ||||||||||
| Intrinsic value of options exercised |
$ | 32,504 | $ | 20,839 | $ | 6,017 | ||||||
| Cash received from exercise of options |
16,980 | 13,221 | 3,951 | |||||||||
The Company settles employee stock option exercises with newly issued common shares.
As of November 30, 2010, the unamortized share-based compensation related to nonvested stock options under the Amended and Restated 2003 Stock Incentive Plan was $3,973 which will be recognized over an estimated weighted-average amortization period of 3.44 years.
Restricted Stock Awards and Restricted Stock Units
A summary of the status of the Company’s non-vested restricted stock awards and stock units as of November 30, 2010, is presented below:
| Number of shares |
Weighted-average, grant-date fair value per share |
|||||||
| Nonvested as of November 30, 2007 |
693 | $ | 20.53 | |||||
| Awards granted |
331 | 19.74 | ||||||
| Awards vested |
(178 | ) | 20.31 | |||||
| Awards cancelled/forfeited |
(20 | ) | 21.12 | |||||
| Nonvested as of November 30, 2008 |
826 | $ | 20.25 | |||||
| Awards granted |
211 | 30.20 | ||||||
| Awards vested |
(245 | ) | 15.30 | |||||
| Awards cancelled/forfeited |
(32 | ) | 20.44 | |||||
| Nonvested as of November 30, 2009 |
760 | $ | 24.60 | |||||
| Awards granted |
267 | 28.18 | ||||||
| Units granted |
100 | 29.04 | ||||||
| Awards vested |
(299 | ) | 22.21 | |||||
| Awards cancelled/forfeited |
(38 | ) | 24.07 | |||||
| Nonvested as of November 30, 2010 |
790 | $ | 25.78 | |||||
79
Table of Contents
SYNNEX CORPORATION
NOTES TO CONSOLIDATED FINANCIAL STATEMENTS—(continued)
(in thousands except per share amounts)
As of November 30, 2010, there was $17,968 of total unamortized share-based compensation related to nonvested restricted stock awards and stock units granted under the Amended and Restated 2003 Stock Incentive Plan. That cost is expected to be recognized over an estimated weighted-average amortization period of 4.10 years.
NOTE 5—EMPLOYEE BENEFITS PLAN:
The Company has a 401(k) Plan (the “Plan”) under which eligible employees may contribute up to the maximum amount as provided by law. Employees become eligible to participate in the Plan on the first day of the month after their employment date. The Company may make discretionary contributions under the Plan. During fiscal years 2010, 2009 and 2008, the Company contributed $852, $734 and $710, respectively.
NOTE 6—DEFERRED COMPENSATION PLAN:
The Company has a deferred compensation plan for certain directors and officers. The plan is designed to permit eligible officers and directors to accumulate additional income through a non-qualified deferred compensation plan that enables the officer or director to make elective deferrals of compensation to which he or she will become entitled in the future.
An account is maintained for each participant for the purpose of recording the current value of his or her elective contributions, including earnings credited thereto. The participant may designate one or more investments as the measure of investment return on the participant’s account. The participant’s account is adjusted monthly to reflect earnings and losses on the participant’s designated investments. The Company pays interest on the uninvested portion of deferred compensation.
The amount credited to the participant’s account will be distributed as soon as practicable after the earlier of the participant’s termination of employment or attainment of age sixty-five. The distribution of benefits to the participant will be made in accordance with the election made by the participant in a lump sum or in equal monthly or annual installments over a period not to exceed fifteen years. The distribution of account balances subject to Section 409A of the Tax Code upon termination of employment of an officer is subject to a six-month delay.
In the event the participant requests an early distribution other than a hardship distribution, a 10% withdrawal penalty will be levied. Such distribution will be in the form of a lump sum cash payment. Such early distribution elections are available only with respect to vested account balances as of December 31, 2004.
As of November 30, 2010 and 2009, the deferred compensation liability balances were $16,737 and $16,553, respectively. Of the balances deferred, $10,407 and $13,322 have been invested in equity securities, hedge funds and private equity funds as of November 30, 2010 and 2009, respectively. The Company has recorded a gain of $176 and $2,670 for the years ended November 30, 2010 and 2009, respectively and a loss of $5,674 for the year ended November 30, 2008 in “Other income (expense), net.”
80
Table of Contents
SYNNEX CORPORATION
NOTES TO CONSOLIDATED FINANCIAL STATEMENTS—(continued)
(in thousands except per share amounts)
NOTE 7—INCOME TAXES:
The sources of income from continuing operations before the provision for income taxes and noncontrolling interest are as follows:
| Fiscal Years Ended November 30, | ||||||||||||
| 2010 | 2009 | 2008 | ||||||||||
| (As Adjusted - See Note 2) |
(As Adjusted - See Note 2) |
|||||||||||
| United States |
$ | 142,972 | $ | 96,331 | $ | 90,535 | ||||||
| Foreign |
40,614 | 38,322 | 30,813 | |||||||||
| $ | 183,586 | $ | 134,653 | $ | 121,348 | |||||||
The provisions for income taxes consist of:
| Fiscal Years Ended November 30, | ||||||||||||
| 2010 | 2009 | 2008 | ||||||||||
| (As Adjusted - See Note 2) |
(As Adjusted - See Note 2) |
|||||||||||
| Current tax provision: |
||||||||||||
| Federal |
$ | 50,411 | $ | 35,158 | $ | 37,309 | ||||||
| State |
9,883 | 6,438 | 6,287 | |||||||||
| Foreign |
8,217 | 8,415 | 6,674 | |||||||||
| $ | 68,511 | $ | 50,011 | $ | 50,270 | |||||||
| Deferred tax provision (benefit): |
||||||||||||
| Federal |
$ | (2,237 | ) | $ | (918 | ) | $ | (5,236 | ) | |||
| State |
(329 | ) | (292 | ) | (688 | ) | ||||||
| Foreign |
965 | 227 | 465 | |||||||||
| $ | (1,601 | ) | $ | (983 | ) | $ | (5,459 | ) | ||||
| Total tax provision |
$ | 66,910 | $ | 49,028 | $ | 44,811 | ||||||
The following presents the breakdown between current and non-current net deferred tax assets:
| As of November 30, | ||||||||
| 2010 | 2009 | |||||||
| (As Adjusted - See Note 2) |
||||||||
| Deferred tax assets- current |
$ | 33,063 | $ | 27,787 | ||||
| Deferred tax assets- non-current |
605 | 2,849 | ||||||
| Deferred tax liabilities- current |
(294 | ) | (41 | ) | ||||
| Deferred tax liabilities- non-current |
(3,262 | ) | (8,077 | ) | ||||
| Total net deferred tax assets |
$ | 30,112 | $ | 22,518 | ||||
81
Table of Contents
SYNNEX CORPORATION
NOTES TO CONSOLIDATED FINANCIAL STATEMENTS—(continued)
(in thousands except per share amounts)
Net deferred tax assets and liabilities consist of the following:
| As of November 30, | ||||||||
| 2010 | 2009 | |||||||
| (As Adjusted - See Note 2) |
||||||||
| Assets: |
||||||||
| Inventory reserves |
$ | 9,182 | $ | 8,216 | ||||
| Bad debt and sales return reserves |
10,155 | 10,788 | ||||||
| Other reserves and accruals |
8,765 | 3,042 | ||||||
| State tax deduction |
460 | 102 | ||||||
| Deferred compensation |
4,880 | 6,675 | ||||||
| Net operating losses |
10,532 | 3,322 | ||||||
| Deferred revenue |
(86 | ) | 766 | |||||
| Foreign tax credit |
2,516 | 2,363 | ||||||
| Share-based compensation expense |
4,225 | 3,639 | ||||||
| Unrealized losses on investments |
1,119 | 1,223 | ||||||
| Other |
458 | 523 | ||||||
| Gross deferred tax assets |
52,206 | 40,659 | ||||||
| Valuation allowance |
(3,862 | ) | (5,825 | ) | ||||
| Total deferred tax assets |
$ | 48,344 | $ | 34,834 | ||||
| Liabilities: |
||||||||
| Depreciation and amortization |
$ | (2,781 | ) | $ | (1,255 | ) | ||
| Convertible debt interest |
(11,383 | ) | (11,061 | ) | ||||
| Intangible assets |
(4,068 | ) | — | |||||
| Total deferred tax liabilities |
$ | (18,232 | ) | $ | (12,316 | ) | ||
| Net deferred tax assets |
$ | 30,112 | $ | 22,518 | ||||
The valuation allowance relates primarily to foreign tax credits and certain net operating losses. The Company’s assessment is that it is not more likely than not that these deferred tax assets will be realized. The valuation allowance decreased by $1,963 during fiscal year 2010, of which $668 increase was recorded to the provision for income taxes and a $2,631 decrease was primarily from the Company’s sale of its controlling interest in Nihon Daikou Shouji Co., Ltd. (“NDS”).
A reconciliation of the statutory U.S. federal income tax rate to the Company’s effective income tax rate is as follows:
| Fiscal Years Ended November 30, | ||||||||||||
| 2010 | 2009 | 2008 | ||||||||||
| (As Adjusted - See Note 2) |
(As Adjusted - See Note 2) |
|||||||||||
| Federal statutory income tax rate |
35.0 | % | 35.0 | % | 35.0 | % | ||||||
| State taxes, net of federal income tax benefit |
3.5 | 2.9 | 3.1 | |||||||||
| Foreign taxes |
(1.9 | ) | (2.4 | ) | (2.1 | ) | ||||||
| Other |
(0.2 | ) | 0.9 | 0.9 | ||||||||
| Effective income tax rate |
36.4 | % | 36.4 | % | 36.9 | % | ||||||
The Company’s U.S. business has sufficient cash flow and liquidity to fund its operating requirements and the Company expects and intends that profits earned outside the United States will be fully utilized and
82
Table of Contents
SYNNEX CORPORATION
NOTES TO CONSOLIDATED FINANCIAL STATEMENTS—(continued)
(in thousands except per share amounts)
reinvested to fund international expansion. Accordingly, the Company has not provided U.S. taxes and foreign withholding taxes on non-U.S. subsidiaries for which the earnings are permanently reinvested. Determination of the income tax liability that might be incurred if these earnings were to be distributed is not practicable.
As of November 30, 2010, the Company had $3,985 in net operating loss carry forwards for the Company’s UK subsidiary that do not expire. In addition, the Company had $2,515 of foreign tax credit carry forwards available to offset future federal tax liabilities, which will expire in varying amounts from November 30, 2015 to November 30, 2020. The Company had $24,942 in federal net operating loss carry forwards attributable to the acquisition of Encover, Inc. for which the Company recognized $9,400 of deferred tax assets. These carry forwards will expire in varying amounts from November 30, 2019 to November 30, 2027.
In fiscal year 2010, the Company recorded a one-time adjustment of $3,118 resulting from the conclusion of an Internal Revenue Service (“IRS”) tax audit and the expiration of the statute of limitations in certain jurisdictions. The reassessment benefited the Company with a $1,929 reduction of total income tax expenses and a $1,189 increase in “Additional paid-in capital.”
The Company enjoys tax holidays in certain jurisdictions of China and the Philippines. The tax holidays provide for lower rates of taxation and require various thresholds of investment and business activities in those jurisdictions. These tax holidays are in effect currently and expire over periods ranging from 2011 to 2012. The estimated range of tax benefits from the above tax holidays on diluted earnings per share for fiscal years 2010, 2009, and 2008 are approximately $0.01 to $0.02, $0.03 to $0.04 and $0.03 to $0.04, respectively.
Effective December 1, 2007, the Company adopted the new provisions related to uncertain tax positions, which clarifies the accounting for uncertainty in income taxes recognized in an enterprise’s financial statements and prescribes a recognition threshold and measurement attribute for the financial statement recognition and measurement of a tax position taken or expected to be taken in a tax return. These provisions also provide guidance on derecognition, classification, interest and penalties, accounting in interim periods, disclosure and transition.
In adopting uncertain tax positions, the Company has reclassified liabilities for unrecognized tax benefits for which the Company does not anticipate payment within one year to long-term income taxes payable. In addition, the Company has presented long-term deferred tax assets for certain benefits associated with the uncertain tax position liability on a gross basis.
The adoption of uncertain tax positions resulted in the reduction of the Company’s consolidated beginning retained earnings by $369.
83
Table of Contents
SYNNEX CORPORATION
NOTES TO CONSOLIDATED FINANCIAL STATEMENTS—(continued)
(in thousands except per share amounts)
The aggregate changes in the balances of gross unrecognized tax benefits during fiscal years 2008, 2009 and 2010 were as follows:
| Balance as of December 1, 2007 |
$ | 7,141 | ||
| Additions based on tax positions related to the current year |
1,360 | |||
| Reductions for tax positions of prior years |
(139 | ) | ||
| Balance as of November 30, 2008 |
8,362 | |||
| Additions based on tax positions related to the current year |
1,462 | |||
| Additions for tax positions of prior years |
309 | |||
| Balance as of November 30, 2009 |
10,133 | |||
| Additions based on tax positions related to the current year |
2,713 | |||
| Additions for tax positions of prior years |
749 | |||
| Reductions for tax positions of prior years |
(185 | ) | ||
| Settlements |
(337 | ) | ||
| Lapse of statute of limitations |
(2,559 | ) | ||
| Balance as of November 30, 2010 |
$ | 10,514 | ||
The Company conducts business globally and files income tax returns in various U.S. and foreign tax jurisdictions. The Company is subject to continuous examination and audits by various tax authorities. In the United States, the Company is subject to examination and audits by tax authorities for tax years after fiscal year 2006.
As of November 30, 2010, $10,514 of the unrecognized tax benefits would affect the effective tax rate if realized. The Company’s policy to include interest and penalties related to income taxes, including unrecognized tax benefits, within the provision for income taxes did not change as a result of implementing uncertain tax positions. As of November 30, 2010 and 2009, the Company had accrued $1,060 and $1,429, respectively, in income taxes payable for the accrual of interest, of which ($369), primarily related to the IRS audit release, and $414 were recorded to the provision for income taxes during fiscal years 2010 and 2009, respectively. The Company is no longer subject to U.S. federal income tax audit for returns covering tax years through fiscal year 2006. With limited exceptions, the Company is no longer subject to U.S. state and local income tax audits for returns covering tax years through fiscal year 2003 while the Company is no longer subject to Canada income tax audits for years before 2006. Although timing of the resolution of audits is highly uncertain, the Company does not believe it is reasonably possible that the total amount of unrecognized tax benefits as of November 30, 2010 will materially change in the next twelve months.
84
Table of Contents
SYNNEX CORPORATION
NOTES TO CONSOLIDATED FINANCIAL STATEMENTS—(continued)
(in thousands except per share amounts)
NOTE 8—BALANCE SHEET COMPONENTS:
| As of November 30, | ||||||||
| 2010 | 2009 | |||||||
| Short-term investments |
||||||||
| Trading securities |
$ | 7,909 | $ | 10,301 | ||||
| Available-for-sale securities |
102 | 112 | ||||||
| Held-to-maturity securities |
910 | 7,785 | ||||||
| Cost method investments |
2,498 | 3,021 | ||||||
| $ | 11,419 | $ | 21,219 | |||||
| Accounts receivable, net |
||||||||
| Trade accounts receivable |
$ | 1,039,850 | $ | 864,895 | ||||
| Less: Allowance for doubtful accounts |
(20,408 | ) | (23,780 | ) | ||||
| Less: Allowance for sales returns |
(32,525 | ) | (20,482 | ) | ||||
| $ | 986,917 | $ | 820,633 | |||||
| Receivable from vendors, net |
||||||||
| Receivables from vendors |
$ | 137,887 | $ | 105,429 | ||||
| Less: Allowance for doubtful accounts |
(5,478 | ) | (5,819 | ) | ||||
| $ | 132,409 | $ | 99,610 | |||||
| Inventories |
||||||||
| Components |
$ | 6,134 | $ | 59,364 | ||||
| Finished goods |
906,103 | 654,449 | ||||||
| $ | 912,237 | $ | 713,813 | |||||
| Property and equipment, net |
||||||||
| Land |
$ | 14,246 | $ | 15,721 | ||||
| Equipment and computers |
61,842 | 62,691 | ||||||
| Furniture and fixtures |
9,746 | 10,152 | ||||||
| Buildings, leasehold improvements |
81,119 | 80,864 | ||||||
| Construction in progress |
151 | 882 | ||||||
| Total property and equipment, gross |
167,104 | 170,310 | ||||||
| Less: Accumulated depreciation |
(75,109 | ) | (75,585 | ) | ||||
| $ | 91,995 | $ | 94,725 | |||||
85
Table of Contents
SYNNEX CORPORATION
NOTES TO CONSOLIDATED FINANCIAL STATEMENTS—(continued)
(in thousands except per share amounts)
The allowance for doubtful accounts as of November 30, 2009 was higher because of allowances made in the fiscal year ended November 30, 2009 for certain specific receivables on a limited number of customer accounts, the majority of which were attributed to prior years.
| Allowance for doubtful trade receivables |
||||
| Balance at November 30, 2007 |
$ | 13,258 | ||
| Additions |
10,304 | |||
| Write-offs and deductions |
(5,742 | ) | ||
| Balance at November 30, 2008 |
17,820 | |||
| Additions |
12,235 | |||
| Write-offs and deductions |
(6,275 | ) | ||
| Balance at November 30, 2009 |
23,780 | |||
| Additions |
6,614 | |||
| Write-offs and deductions |
(9,986 | ) | ||
| Balance at November 30, 2010 |
$ | 20,408 | ||
| Allowance for doubtful vendor receivables |
||||
| Balance at November 30, 2007 |
$ | 2,702 | ||
| Additions |
2,959 | |||
| Write-offs and deductions |
(728 | ) | ||
| Balance at November 30, 2008 |
4,933 | |||
| Additions |
995 | |||
| Write-offs and deductions |
(109 | ) | ||
| Balance at November 30, 2009 |
5,819 | |||
| Additions |
922 | |||
| Write-offs and deductions |
(1,263 | ) | ||
| Balance at November 30, 2010 |
$ | 5,478 | ||
Goodwill
| As of November 30, 2010 | As of November 30, 2009 | |||||||||||||||||||||||
| Distribution | GBS | Total | Distribution | GBS | Total | |||||||||||||||||||
| Beginning balance |
$ | 82,415 | $ | 25,148 | $ | 107,563 | $ | 65,159 | $ | 22,549 | $ | 87,708 | ||||||||||||
| Goodwill additions during the period |
5,410 | 25,700 | 31,110 | 13,747 | — | 13,747 | ||||||||||||||||||
| Adjustments |
— | — | — | (2,599 | ) | 2,599 | — | |||||||||||||||||
| Translation |
1,206 | (299 | ) | 907 | 6,108 | — | 6,108 | |||||||||||||||||
| Ending balance |
$ | 89,031 | $ | 50,549 | $ | 139,580 | $ | 82,415 | $ | 25,148 | $ | 107,563 | ||||||||||||
In the distribution segment, goodwill increased as of November 30, 2010 compared to November 30, 2009, by $5,649 for the acquisition of Jack of All Games, Inc., which was offset by the sale of the BDG division of SYNNEX Canada.
86
Table of Contents
SYNNEX CORPORATION
NOTES TO CONSOLIDATED FINANCIAL STATEMENTS—(continued)
(in thousands except per share amounts)
In the GBS segment, goodwill increased by $22,880 due to the acquisitions of Aspire Technology Limited, Encover, Inc. and Occidental Business Services, S.A. In addition, the Company recorded an accrual of $2,820 for the earn-out relating to the Company’s 2009 acquisition, which is scheduled to be paid in the fiscal year ended November 30, 2012.
Intangible assets, net
| As of November 30, 2010 | As of November 30, 2009 | |||||||||||||||||||||||
| Gross Amounts |
Accumulated Amortization |
Net Amounts |
Gross Amounts |
Accumulated Amortization |
Net Amounts |
|||||||||||||||||||
| Vendor lists |
$ | 36,815 | $ | (25,564 | ) | $ | 11,251 | $ | 34,315 | $ | (24,104 | ) | $ | 10,211 | ||||||||||
| Customer lists |
32,196 | (18,005 | ) | 14,191 | 21,440 | (15,024 | ) | 6,416 | ||||||||||||||||
| Other intangible assets |
6,453 | (3,624 | ) | 2,829 | 4,734 | (3,295 | ) | 1,439 | ||||||||||||||||
| $ | 75,464 | $ | (47,193 | ) | $ | 28,271 | $ | 60,489 | $ | (42,423 | ) | $ | 18,066 | |||||||||||
Amortization expense was $5,096, $7,127 and $6,981 for the fiscal years ended November 30, 2010, 2009 and 2008, respectively. The increase in intangible assets as of November 30, 2010 compared to November 30, 2009 is due to the acquisition of Jack of All Games, Inc. in the distribution segment and the acquisitions of Encover, Inc. and Aspire Technology Limited in the GBS segment. These additions were offset by the sale of intangible assets related to the BDG division in the distribution segment, which resulted in a gain of $785. Estimated future amortization expense is as follows:
| Fiscal years ending November 30, |
||||
| 2011 |
$ | 6,078 | ||
| 2012 |
5,649 | |||
| 2013 |
5,355 | |||
| 2014 |
3,984 | |||
| 2015 |
2,580 | |||
| thereafter |
4,625 | |||
| $ | 28,271 | |||
| As of November 30, | ||||||||
| 2010 | 2009 | |||||||
| Accrued liabilities: |
||||||||
| Payroll related accruals |
$ | 34,542 | $ | 30,707 | ||||
| Deferred compensation liability |
10,733 | 16,553 | ||||||
| Sales tax/Value-added-tax accrual |
7,517 | 14,526 | ||||||
| Deferred vendor incentives |
27,795 | 13,284 | ||||||
| Royalty and warranty accruals |
3,054 | 3,945 | ||||||
| Purchase price payable |
16,427 | — | ||||||
| Current deferred liabilities |
8,648 | 18,798 | ||||||
| Other accrued liabilities |
58,145 | 38,584 | ||||||
| $ | 166,861 | $ | 136,397 | |||||
87
Table of Contents
SYNNEX CORPORATION
NOTES TO CONSOLIDATED FINANCIAL STATEMENTS—(continued)
(in thousands except per share amounts)
Other accrued liabilities include, principally, accrued expenses, customer credit balances and various vendor and third-party liabilities.
NOTE 9—INVESTMENTS:
The carrying amount of the Company’s investments is shown in the table below:
| As of November 30, | ||||||||||||||||||||||||
| 2010 | 2009 | |||||||||||||||||||||||
| Cost Basis | Unrealized (Losses)/ Gains |
Carrying Value |
Cost Basis | Unrealized (Losses)/ Gains |
Carrying Value |
|||||||||||||||||||
| Short-Term: |
||||||||||||||||||||||||
| Trading |
$ | 9,324 | $ | (1,415 | ) | $ | 7,909 | $ | 11,631 | $ | (1,330 | ) | $ | 10,301 | ||||||||||
| Available-for-sale |
55 | 47 | 102 | 147 | (35 | ) | 112 | |||||||||||||||||
| Held-to-maturity |
910 | — | 910 | 7,785 | — | 7,785 | ||||||||||||||||||
| Cost method securities |
2,498 | — | 2,498 | 3,021 | — | 3,021 | ||||||||||||||||||
| $ | 12,787 | $ | (1,368 | ) | $ | 11,419 | $ | 22,584 | $ | (1,365 | ) | $ | 21,219 | |||||||||||
Short-term trading securities generally consist of equity securities relating to the Company’s deferred compensation plan. Short-term available-for-sale securities primarily consist of investments in other companies’ equity securities. Held-to-maturity investments primarily consist of term deposits with maturities from the date of purchase greater than three months and less than one year. These term deposits are held until the maturity date and are not traded. Cost method securities primarily consist of investments in a hedge fund and a private equity fund under the Company’s deferred compensation plan.
Trading securities and available-for-sale securities are recorded at fair value in each reporting period and therefore the carrying value of these securities equals their fair value. For cost method securities, the Company records an impairment charge when the decline in fair value is determined to be other-than-temporary.
The following table summarizes the total realized and unrealized gains and losses recorded on the Company’s trading investments and the other-than-temporary losses recorded on cost and available-for-sale securities:
| Fiscal Years Ended November 30, | ||||||||||||
| 2010 | 2009 | 2008 | ||||||||||
| Realized and unrealized gain (loss) on trading investments |
$ | 539 | $ | 2,670 | $ | (5,674 | ) | |||||
| Other-than-temporary loss on cost securities |
(363 | ) | (53 | ) | (658 | ) | ||||||
| Other-than-temporary loss on available-for-sale securities |
(55 | ) | (39 | ) | (630 | ) | ||||||
In fiscal year 2009, investments with maturities from the date of purchase greater than three months and less than one year have been corrected to classify such amounts as short-term investments rather than cash equivalents. The impact as of November 30, 2008 was a $3,003 reduction in cash and a corresponding increase in short-term investments. The impact to cash flow from investing activities for fiscal 2008 was not material; accordingly, no amounts have been revised. The Company concluded that the correction was not material to prior period annual consolidated financial statements and to the interim consolidated financial statements for fiscal year 2009 based on SEC Staff Accounting Bulletin No. 99: Materiality. The Company presented corrected consolidated statements of cash flows for each of the interim periods in fiscal year 2009 in the fiscal year 2010 comparative interim consolidated financial statements.
88
Table of Contents
SYNNEX CORPORATION
NOTES TO CONSOLIDATED FINANCIAL STATEMENTS—(continued)
(in thousands except per share amounts)
NOTE 10—DERIVATIVE INSTRUMENTS:
In the ordinary course of business, the Company is exposed to foreign currency risk, interest risk, equity risk and credit risk. The Company’s transactions in its foreign operations are denominated in the British Pound, Canadian Dollar, Chinese Renminbi, Costa Rican Colon, Japanese Yen, Mexican Peso, and Philippine Peso. The Company’s foreign locations enter into transactions, and own monetary assets and liabilities, that are denominated in currencies other than their functional currency. As part of its risk management strategy, the Company uses short-term forward contracts in most of the above mentioned currencies to minimize its balance sheet exposure to foreign currency risk. These derivatives are not designated as hedging instruments as the Company uses forward contracts to hedge foreign currency balance sheet exposures. The forward exchange contracts are recorded at fair value in each reporting period and any gains or losses, resulting from the changes in fair value, are recorded in earnings in the period of change. Generally, the Company does not use derivative instruments to cover interest rate risk, equity risk and credit risk. The Company’s policy is not to allow the use of derivatives for trading or speculative purposes. The fair value of the Company’s forward exchange contracts are also disclosed in Note 11. These contracts are not designated as hedging instruments under ASC 815, “Derivatives and Hedging.” The following table summarizes the fair value of the Company’s foreign exchange forward contracts as of November 30, 2010 and 2009 and the total realized and unrealized gain (loss) recorded in the fiscal years ended November 30, 2010 and 2009:
| Fiscal Years Ended November 30, |
||||||||||||
| Location | 2010 | 2009 | ||||||||||
| Realized and unrealized loss |
|
Other income/ (expense), net |
|
$ | (2,173 | ) | $ | (7,628 | ) | |||
| Total |
$ | (2,173 | ) | $ | (7,628 | ) | ||||||
| Fair Value as of November 30, | ||||||||||||
|
Location |
2010 | 2009 | ||||||||||
| Other Current Assets |
$ | 537 | $ | — | ||||||||
| Accrued Liabilities |
(170 | ) | (113 | ) | ||||||||
| Total |
$ | 367 | $ | (113 | ) | |||||||
NOTE 11—FAIR VALUE MEASUREMENTS:
The Company adopted ASC 820, “Fair Value Measurements and Disclosures,” effective December 1, 2007 for financial assets and liabilities measured on a recurring basis. The Company adopted ASC 820, “Fair Value Measurements and Disclosures,” effective December 1, 2008 for non-financial assets and liabilities. ASC 820, “Fair Value Measurements and Disclosures,” applies to all financial assets and financial liabilities that are being measured and reported on a fair value basis. ASC 820, “Fair Value Measurements and Disclosures,” establishes a framework for measuring fair value and expands disclosure about fair value measurements. The statement requires fair value measurements to be classified and disclosed in one of the following three categories:
Level 1: Unadjusted quoted prices in active markets that are accessible at the measurement date for identical, unrestricted assets or liabilities;
Level 2: Quoted prices in markets that are not active, or inputs which are observable, either directly or indirectly, for substantially the full term of the asset or liability;
89
Table of Contents
SYNNEX CORPORATION
NOTES TO CONSOLIDATED FINANCIAL STATEMENTS—(continued)
(in thousands except per share amounts)
Level 3: Prices or valuation techniques that require inputs that are both significant to the fair value measurement and unobservable (i.e., supported by little or no market activity).
There was no impact for the adoption of ASC 820, “Fair Value Measurements and Disclosures,” to the Consolidated Financial Statements. The following table summarizes the valuation of the Company’s short-term investments and financial instruments by the above ASC 820, “Fair Value Measurements and Disclosures,” categories as of November 30, 2010 and 2009:
| As of November 30, 2010 | As of November 30, 2009 | |||||||||||||||||||||||||||||||
| Total | Fair value measurement category | Total | Fair value measurement category | |||||||||||||||||||||||||||||
| Level 1 | Level 2 | Level 3 | Level 1 | Level 2 | Level 3 | |||||||||||||||||||||||||||
| Trading securities |
$ | 7,909 | $ | 7,909 | $ | — | $ | — | $ | 10,301 | $ | 10,301 | $ | — | $ | — | ||||||||||||||||
| Available-for-sale securities |
102 | 102 | — | — | 112 | 112 | — | — | ||||||||||||||||||||||||
| Gain (loss) on open forward contracts |
367 | — | 367 | — | (113 | ) | — | (113 | ) | — | ||||||||||||||||||||||
The Company’s investments in trading and available-for-sale securities are recorded at fair value based on quoted market prices. The fair value of forward exchange contracts are measured based on the foreign currency spot and forward rates quoted by the banks or foreign currency dealers. There were no transfers between the Level 1 and Level 2 investments and financial instruments during the fiscal year ended November 30, 2010.
The following table summarizes the realized and unrealized gains and losses recorded in “Other income (expense), net” in the consolidated statements of operations for the changes in the fair value of its financial instruments for trading securities and forward foreign currency contracts:
| Fiscal Years Ended November 30, | ||||||||||||
| 2010 | 2009 | 2008 | ||||||||||
| Realized gain (loss) |
$ | (2,255 | ) | $ | (7,986 | ) | $ | 15,380 | ||||
| Unrealized gain (loss) |
623 | (382 | ) | (3,157 | ) | |||||||
| Total realized and unrealized gain (loss) |
$ | (1,632 | ) | $ | (8,368 | ) | $ | 12,223 | ||||
The following table presents the financial instruments that are not carried at fair value but which require fair value disclosure:
| As of November 30, 2010 | As of November 30, 2009 | |||||||||||||||
| Carrying Value |
Fair Value | Carrying Value |
Fair Value | |||||||||||||
| (As Adjusted - See Note 2) |
||||||||||||||||
| Cost method investments in short-term investments |
$ | 2,498 | $ | 3,878 | $ | 3,021 | $ | 2,496 | ||||||||
| Long-term accounts receivable |
6,539 | 6,539 | 7,169 | 7,169 | ||||||||||||
| SYNNEX Canada term loan |
9,677 | 9,677 | 9,994 | 9,994 | ||||||||||||
| Convertible debt |
131,289 | 168,821 | 126,785 | 168,788 | ||||||||||||
The Company’s cost method securities in short-term investments consist of investments in a hedge fund and a private equity fund. The fair value of the cost method investments is based on either (i) the published fund values or (ii) a valuation model developed internally to measure impairment primarily based on the published value of the securities held by the fund. The Company records an impairment charge when the decline in fair
90
Table of Contents
SYNNEX CORPORATION
NOTES TO CONSOLIDATED FINANCIAL STATEMENTS—(continued)
(in thousands except per share amounts)
value is determined to be other-than-temporary. During the fiscal years ended November 30, 2010, 2009 and 2008, the Company recorded an other-than-temporary impairment of $363, $53 and $658, respectively, on its cost method securities. The fair value of long-term accounts receivable is based on customer rating and creditworthiness. The carrying value of the SYNNEX Canada term loan approximates its fair value since interest rates offered to the Company for debt of similar terms and maturities are approximately the same. The fair value of convertible debt is based on the closing price of the convertible debt traded in a limited trading market.
The cost method investments in “Other assets” consist of investments in equity securities of private entities. The carrying value of the investments was $3,400 as of November 30, 2010 and $3,550 as of November 30, 2009. As of November, 2010, the fair value of these cost method investments is greater than the carrying value.
The Company’s 33.3% noncontrolling investment in SB Pacific Corporation Limited is recorded under the equity method of accounting and is included in “Other assets.” The investment was made in the fiscal year 2010 and the carrying value of the investment as of November 30, 2010 was $1,095. As of November 30, 2010, the fair value of this investment is equal to its carrying value.
The carrying value of other financial instruments, including cash, held-to-maturity securities, accounts receivable, accounts payable and short-term debt approximate fair value due to their short maturities or variable-rate nature of the respective borrowings.
The Company monitors its investments for impairment by considering current factors, including the economic environment, market conditions, operational performance and other specific factors relating to the business underlying the investment, and records reductions in carrying values when necessary. Any impairment loss is reported under “Other income (expense), net” in the consolidated statements of operations.
NOTE 12—ACCOUNTS RECEIVABLE ARRANGEMENTS:
The Company primarily finances its U.S. operations with an accounts receivable securitization program (the “U.S. Arrangement”). On November 12, 2010, the Company amended and restated the U.S. Arrangement replacing the lenders and the lead agent (“Amended and Restated U.S. Arrangement”). The Company can now pledge up to a maximum of $400,000 in U.S. trade accounts receivable (“U.S. Receivables”) as compared to a maximum of $350,000 under the previous agreement. The maturity date of the Amended and Restated U.S. Arrangement is November 12, 2013. The effective borrowing cost under the Amended and Restated U.S. Arrangement is a blend of the prevailing dealer commercial paper rates plus a program fee of 0.60% per annum based on the used portion of the commitment, and a facility fee of 0.60% per annum payable on the aggregate commitment of the lenders. Prior to the amendment, the effective borrowing cost was a blend of the prevailing dealer commercial paper rates, plus a program fee of 0.65% per annum based on the used portion of the commitment and a facility fee of 0.65% per annum payable on the aggregate commitment. The balance outstanding on the Amended and Restated U.S. Arrangement as of November 30, 2010 was $209,100. The balance outstanding under the U.S. Arrangement as of November 30, 2009 was $119,000.
Under the terms of the Amended and Restated U.S. Arrangement, the Company sells, on a revolving basis, its U.S. Receivables to a wholly-owned, bankruptcy-remote subsidiary. The borrowings are funded by pledging all of the rights, title and interest in and to the U.S. Receivables as security. Any borrowings under the Amended and Restated U.S. Arrangement are recorded as debt on the Company’s consolidated balance sheet. As is customary in trade accounts receivable securitization arrangements, a credit rating agency’s downgrade of the third party issuer of commercial paper or of a back-up liquidity provider (which provides a source of funding if
91
Table of Contents
SYNNEX CORPORATION
NOTES TO CONSOLIDATED FINANCIAL STATEMENTS—(continued)
(in thousands except per share amounts)
the commercial paper market cannot be accessed) could result in an increase in the Company’s cost of borrowing or loss of the Company’s financing capacity under these programs if the commercial paper issuer or liquidity back-up provider is not replaced. Loss of such financing capacity could have a material adverse effect on the Company’s financial condition and results of operations.
SYNNEX Canada Limited (“SYNNEX Canada”) replaced its renewable revolving accounts receivable securitization program in Canada, with a secured revolving credit arrangement (“Canadian Revolving Arrangement”) in May 2009. Prior to its replacement, the Canadian accounts receivable securitization program was accounted for as an off-balance sheet transaction because the Company funded the advances by selling its rights, title and interest in U.S. and Canadian trade accounts receivables (“Canadian Receivables”) to the financial institution on a fully-serviced basis. The Canadian Revolving Arrangement is accounted for as an on-balance sheet transaction. Please see Note 13—Borrowings.
The Company also has other financing agreements with various financial institutions (“Flooring Companies”) to allow certain customers of the Company to finance their purchases directly with the Flooring Companies. Under these agreements, the Flooring Companies pay to the Company the selling price of products sold to various customers, less a discount, within approximately 15 to 30 days from the date of sale. The Company is contingently liable to repurchase inventory sold under flooring agreements in the event of any default by its customers under the agreement and such inventory being repossessed by the Flooring Companies. Please see Note 21 for further information. The following table summarizes the net sales financed through the flooring agreements and the flooring fees incurred:
| Fiscal Years Ended November 30, | ||||||||||||
| 2010 | 2009 | 2008 | ||||||||||
| Net Sales Financed |
$ | 665,024 | $ | 678,380 | $ | 912,671 | ||||||
| Flooring Fees (1) |
2,857 | 3,331 | 4,013 | |||||||||
| (1) | Flooring fees are included within “Interest expense and finance charges, net.” |
As of November 30, 2010 and 2009, accounts receivable subject to flooring agreements were $53,985 and $47,219, respectively
NOTE 13—BORROWINGS:
Borrowings consist of the following:
| As of November 30, | ||||||||
| 2010 | 2009 | |||||||
| (As Adjusted - See Note 2) |
||||||||
| Convertible debt |
$ | 131,289 | $ | 126,785 | ||||
| SYNNEX U.S. securitization |
209,100 | 119,000 | ||||||
| SYNNEX U.S. senior secured revolving line of credit |
— | — | ||||||
| SYNNEX Canada revolving line of credit |
36,240 | 29,097 | ||||||
| SYNNEX Canada term loan |
9,677 | 9,994 | ||||||
| Others |
— | 2,059 | ||||||
| Total borrowings |
386,306 | 286,935 | ||||||
| Less: Current portion |
(245,973 | ) | (150,740 | ) | ||||
| Non-current portion |
$ | 140,333 | $ | 136,195 | ||||
92
Table of Contents
SYNNEX CORPORATION
NOTES TO CONSOLIDATED FINANCIAL STATEMENTS—(continued)
(in thousands except per share amounts)
Convertible debt
In May 2008, the Company issued $143,750 of aggregate principal amount of its 4.0% Convertible Senior Notes due 2018 (the “Notes”) in a private placement. The carrying amount of the convertible debt, net of the unamortized debt discount, was $131,289 and $126,785 as of November 30, 2010 and 2009, respectively. The Notes are senior unsecured obligations of the Company and have a cash coupon interest rate of 4.0% per annum. The Company may redeem the Notes, in whole or in part, for cash on or after May 20, 2013, at a redemption price equal to 100% of the principal amount of the Notes to be redeemed, plus any accrued and unpaid interest to (including any additional interest and any contingent interest), but excluding, the redemption date. See Note 14. Also, the Notes contain various features which under certain circumstances could allow the holders to convert the Notes into shares before their ten-year maturity.
SYNNEX U.S. securitization
The effective borrowing costs under the Amended and Restated U.S. Arrangement is a blend of the prevailing dealer commercial paper rates, plus a program fee on the used portion of the commitment and a facility fee payable on the aggregate commitment. After the amendment the program fee was reduced from 0.65% to 0.60% and the facility fee was reduced from 0.65% to 0.60%.
SYNNEX U.S. senior secured revolving line of credit
The Company has a senior secured revolving line of credit arrangement (the “Revolver”) with a financial institution. On November 12, 2010, the Company amended and restated the revolver (the “Amended and Restated Revolver”) to remove one of the lenders and increase the maximum commitment of the remaining lender from $80,000 to $100,000. The Amended and Restated Revolver retains an accordion feature to increase the maximum commitment by an additional $50,000 to $150,000 at the Company’s request, in the event the current lender consents to such increase or another lender participates in the Revolver. Interest on borrowings under the Amended and Restated Revolver is based on a base rate or LIBOR rate, at the Company’s option. The margin on the Company’s LIBOR rate is determined in accordance with its fixed charge coverage ratio under the Revolver and is currently 2.25%. The Company’s base rate is determined based on the higher of (i) the financial institution’s prime rate, (ii) the overnight federal funds rate plus 0.50% or (iii) one month LIBOR plus 1.0%. An unused line fee of 0.50% per annum is payable if the outstanding principal amount of the Amended and Restated Revolver is less than half of the lender’s commitment, however, that fee is reduced to 0.35% if the outstanding principal amount of the Revolver is greater than half of the lender’s commitment. The Amended and Restated Revolver is secured by the Company’s inventory and other assets and expires on November 12, 2013. It would be an event of default under the Amended and Restated Revolver if (1) a lender under the Amended and Restated U.S. Arrangement declines to extend the maturity date at any point within 60 days prior to the maturity date of the Amended and Restated U.S. Arrangement, unless availability under the Amended and Restated Revolver exceeds $60,000 or the Company has a binding commitment in place to renew or replace the Amended and Restated U.S. Arrangement or (2) at least 20 days prior to the maturity date of the Amended and Restated U.S. Arrangement the Company does not have in place a binding commitment to renew or replace the Amended and Restated U.S. Arrangement on substantially similar terms and conditions, unless the Company has no amounts outstanding under the Amended and Restated Revolver at such time. There was no borrowing outstanding as of November 30, 2010 and 2009, respectively.
SYNNEX Canada revolving line of credit
SYNNEX Canada replaced its C$30,000 revolving line of credit arrangement (the “Canadian Arrangement”), and replaced its C$110,000 accounts receivable securitization program with a secured revolving
93
Table of Contents
SYNNEX CORPORATION
NOTES TO CONSOLIDATED FINANCIAL STATEMENTS—(continued)
(in thousands except per share amounts)
credit arrangement (“Canadian Revolving Arrangement”) in May 2009, having a maximum commitment of C$125,000. The Canadian Revolving Arrangement provides a sublimit of $5,000 for the issuance of standby letters of credit. As of November 30, 2010, the outstanding standby letters of credit totaled $3,337. SYNNEX Canada has granted a security interest on substantially all of its assets in favor of the lender under this revolving credit facility. In addition, the Company pledged its stock in SYNNEX Canada as collateral for the Canadian Revolving Arrangement. The Canadian Revolving Arrangement expires in May 2012. The interest rate applicable is equal to (i) a minimum rate of 2.5% plus a margin of 1.25% for a Base Rate Loan in Canadian Dollars, (ii) a minimum of 3.25% plus a margin of 2.50% for a Base Rate Loan in U.S. Dollars, and (iii) a minimum of 1.0% plus a margin of 2.75% for a BA (Bankers Acceptance) Rate Loan. A fee of 0.375% per annum is payable with respect to the unused portion of the commitment.
SYNNEX Canada term loan
SYNNEX Canada has a term loan associated with the purchase of its logistics facility in Guelph, Canada. The interest rate for any unpaid principal amount is a fixed rate of 5.374% per annum. The final maturity date for repayment of any unpaid principal is April 1, 2017.
Others
As of November 30, 2010, the Company had outstanding letters of credit amounting to $750 under a letter of credit facility and as of November 30, 2009, the Company had $2,059 borrowings outstanding under other lines of credit.
SYNNEX Canada credit facility
SYNNEX Canada had a credit facility with a financial institution in Canada which allowed SYNNEX Canada to issue documentary letters of credit. The limit on this facility was C$390 with 180 days validity. The limit had been reduced in February 2010, as a result of the sale of the BDG division from C$30,000 to C$390. In connection with this credit facility, the Company had issued a guarantee of SYNNEX Canada’s obligations in favor of the financial institution in Canada, which was reduced to C$7,000 from C$20,000 in February 2010. The facility was terminated on October 5, 2010 and the Company was released from the guarantee on January 5, 2011.
Interest expense and finance charges
For the fiscal years ended November 30, 2010, 2009 and 2008, the total interest expense and finance charges for accounts receivable securitization, the Revolver, the Notes and all other debt and lines of credit were $22,589, $25,924 and $30,862, respectively, including non-cash debt accretion expense of $4,504, $4,049 and $2,200, respectively, for the Notes. The interest expense and finance charges are included in “Interest expense and finance charges, net” in the consolidated statements of operations. The interest expense for the fiscal year ended November 30, 2010 includes $235 partial write off of unamortized debt costs relating to the November 2010 amendment of the US Arrangement and Revolver. The interest expense for the fiscal year ended November 30, 2009, includes the partial write off of $929 in unamortized debt costs relating to the amendment of the U.S. Arrangement and the Revolver and the termination of the Canadian Arrangement and the Canadian accounts receivable securitization program. The variable interest rates ranged between 0.90% and 4.25% in the fiscal year ended November 30, 2010 and between 1.04% and 10.77% in the fiscal year ended November 30, 2009.
94
Table of Contents
SYNNEX CORPORATION
NOTES TO CONSOLIDATED FINANCIAL STATEMENTS—(continued)
(in thousands except per share amounts)
Future principal payments
Future principal payments under the above loans as of November 30, 2010 are as follows:
| Fiscal Years Ending November 30, |
||||
| 2011 |
$ | 245,973 | ||
| 2012 |
668 | |||
| 2013 |
704 | |||
| 2014 |
743 | |||
| 2015 |
783 | |||
| Thereafter |
6,146 | |||
| $ | 255,017 | |||
Due to the uncertainty of the timing and amount that may be settled in cash, the principal amount of $143,750 of the convertible senior notes described in Note 14 has not been included in the table above.
Covenants compliance
In relation to the Amended and Restated U.S. Arrangement, the Amended and Restated Revolver and the Canadian Revolving Arrangement, the Company has a number of covenants and restrictions that, among other things, require the Company to comply with certain financial and other covenants and restrict its ability to incur additional debt. These covenants require the Company to maintain specified financial ratios and satisfy certain financial condition tests, including minimum net worth and fixed charge coverage ratio. They also limit the Company’s ability to make or forgive intercompany loans, pay dividends and make distributions, make certain acquisitions, repurchase the Company’s stock, create liens, cancel debt owed to the Company, enter into agreements with affiliates, modify the nature of the Company’s business, enter into sale-leaseback transactions, make certain investments, enter into new real estate leases, transfer and sell assets, cancel or terminate any material contracts and merge or consolidate. The covenants also limit the Company’s ability to pay cash upon conversion, redemption or repurchase of the Notes subject to certain liquidity tests.
As of November 30, 2010, the Company was in compliance with all material covenants for the above arrangements.
Guarantees
The Company has issued guarantees to certain vendors and lenders of its subsidiaries’ for trade credit lines and loans, totaling $108,497 and $105,097 as of November 30, 2010 and 2009, respectively. The Company is obligated under these guarantees to pay amounts due should its subsidiaries not pay valid amounts owed to their vendors or lenders.
NOTE 14—CONVERTIBLE DEBT:
| As of November 30, | ||||||||
| 2010 | 2009 | |||||||
| (As Adjusted - See Note 2) |
||||||||
| Convertible debt |
||||||||
| Principal amount |
$ | 143,750 | $ | 143,750 | ||||
| Less: Unamortized debt discount |
(12,461 | ) | (16,965 | ) | ||||
| Net carrying amount |
$ | 131,289 | $ | 126,785 | ||||
95
Table of Contents
SYNNEX CORPORATION
NOTES TO CONSOLIDATED FINANCIAL STATEMENTS—(continued)
(in thousands except per share amounts)
In May 2008, the Company issued $143,750 of aggregate principal amount of the Notes in a private placement. The Notes have a cash coupon interest rate of 4.0% per annum. Interest on the Notes is payable in cash semi-annually in arrears on May 15 and November 15 of each year, beginning November 15, 2008. In addition, the Company will pay contingent interest in respect of any six-month period from May 15 to November 14 or from November 15 to May 14, with the initial six-month period commencing May 15, 2013, if the trading price of the Notes for each of the ten trading days immediately preceding the first day of the applicable six-month period equals 120% or more of the principal amount of the Notes. During any interest period when contingent interest is payable, the contingent interest payable per Note is equal to 0.55% of the average trading price of the Notes during the ten trading days immediately preceding the first day of the applicable six-month interest period. The Notes mature on May 15, 2018, subject to earlier redemption, repurchase or conversion.
Holders may convert their Notes at their option at any time prior to the close of business on the business day immediately preceding the maturity date for such Notes under the following circumstances: (1) during any fiscal quarter after the fiscal quarter ended August 31, 2008 (and only during such fiscal quarter), if the last reported sale price of the Company’s common stock for at least 20 trading days in the period of 30 consecutive trading days ending on the last trading day of the immediately preceding fiscal quarter is equal to or more than 130% of the conversion price of the Notes on the last day of such preceding fiscal quarter; (2) during the five business-day period after any five consecutive trading-day period (the “Measurement Period”) in which the trading price per $1 principal amount of the Notes for each day of that Measurement Period was less than 98% of the product of the last reported sale price of the common stock and the conversion rate of the Notes on each such day; (3) if the Company has called the particular Notes for redemption, until the close of business on the business day prior to the redemption date; or (4) upon the occurrence of certain corporate transactions. In addition, holders may also convert their Notes at their option at any time beginning on November 15, 2017, and ending at the close of business on the business day immediately preceding the maturity date for the Notes, without regard to the foregoing circumstances. Upon conversion, the Company will pay or deliver, as the case may be, cash, shares of the common stock or a combination thereof at the Company’s election. The initial conversion rate for the Notes will be 33.9945 shares of common stock per $1 principal amount of Notes, equivalent to an initial conversion price of $29.42 per share of common stock. Such conversion rate will be subject to adjustment in certain events but will not be adjusted for accrued interest, including any additional interest and any contingent interest.
The Company may not redeem the Notes prior to May 20, 2013. The Company may redeem the Notes, in whole or in part, for cash on or after May 20, 2013, at a redemption price equal to 100% of the principal amount of the Notes to be redeemed, plus any accrued and unpaid interest to (including any additional interest and any contingent interest), but excluding, the redemption date.
Holders may require the Company to repurchase all or a portion of their Notes for cash on May 15, 2013 at a purchase price equal to 100% of the principal amount of the Notes to be repurchased, plus any accrued and unpaid interest to (including any additional interest and any contingent interest), but excluding, the repurchase date. If the Company undergoes a fundamental change, holders may require it to purchase all or a portion of their Notes for cash at a price equal to 100% of the principal amount of the Notes to be purchased, plus any accrued and unpaid interest to (including any additional interest and any contingent interest), but excluding, the fundamental change repurchase date.
The Notes are senior unsecured obligations of the Company and rank equally in right of payment with other senior unsecured debt and rank senior to subordinated notes, if any. The Notes effectively rank junior to any of the Company’s secured indebtedness to the extent of the assets securing such indebtedness. The Notes are also
96
Table of Contents
SYNNEX CORPORATION
NOTES TO CONSOLIDATED FINANCIAL STATEMENTS—(continued)
(in thousands except per share amounts)
structurally subordinated in right of payment to all indebtedness and other liabilities and commitments (including trade payables) of the Company’s subsidiaries. The net proceeds from the Notes were used for general corporate purposes and to reduce outstanding balances under the U.S. Arrangement and the Revolver.
The Notes are governed by an indenture, dated as of May 12, 2008, between the Company and U.S. Bank National Association, as trustee, which contains customary events of default.
The Notes as hybrid instruments are accounted as convertible debt and are recorded at carrying value. The right of the holders of the Notes to require the Company to repurchase the Notes in the event of a fundamental change and the contingent interest feature would require separate measurement from the Notes; however, the amount is insignificant. The additional shares issuable following certain corporate transactions do not require bifurcation and separate measurement from the Notes.
As previously discussed in Note 2, the Company adopted new standards effective December 1, 2009, that changed the accounting for the Notes. Under the previous standards the Notes were recognized entirely as a liability at historical value. In accordance with the provisions of the new standards, the Company retrospectively recognized both a liability and an equity component of the Notes in a manner that reflects its non-convertible debt borrowing rate at the date of issuance of 8.0%. The value assigned to the debt component, which is the estimated fair value, as of the issuance date, of a similar note without the conversion feature, was determined to be $120,332. The difference between the Note cash proceeds and this estimated fair value was estimated to be $23,418 and was retroactively recorded as a debt discount and will be amortized to “Interest expense and finance charges, net” over the five year period to the first put date, utilizing the effective interest method. The corresponding offset was recorded to “Additional paid-in capital” and was adjusted for deferred taxes of $9,157. Underlying debt issuance costs of $3,575 associated with the Notes were allocated between the liability and equity components of the debt in accordance with the provisions of the new standard.
As of November 30, 2010, the remaining amortization period is approximately 29 months assuming the redemption of the debentures at the first purchase date of May 20, 2013. Based on a cash coupon interest rate of 4.0%, the Company recorded contractual interest expense of $6,497, $6,610 and $3,587, during the fiscal years ended November 30, 2010, 2009 and 2008 respectively. Based on an effective rate of 8.0%, the Company recorded non-cash interest expense of $4,504, $4,049 and $2,201 during the fiscal years ended November 30, 2010, 2009 and 2008, respectively. As of both November 30, 2010 and 2009, the carrying value of the equity component of the Notes, net of allocated issuance costs, was $22,836. As of November 30, 2010, the if-converted value of the Notes did not exceed the principal balance.
The Notes contain various features which under certain circumstances could allow the holders to convert the Notes into shares before their ten-year maturity. Further, the date of settlement of the Notes is uncertain due to the various features of the Notes including put and call features. Because the Company currently intends to settle the Notes using cash at some future date, the Company maintains within its Amended and Restated U.S. Arrangement and the Amended and Restated Revolver ongoing features that allow the Company to utilize cash from these facilities to cash settle the Notes, if desired.
97
Table of Contents
SYNNEX CORPORATION
NOTES TO CONSOLIDATED FINANCIAL STATEMENTS—(continued)
(in thousands except per share amounts)
NOTE 15—NET INCOME PER COMMON SHARE:
The following table sets forth the computation of basic and diluted net income per common share for the period indicated:
| Fiscal Years Ended November 30, | ||||||||||||
| 2010 | 2009 | 2008 | ||||||||||
| (As Adjusted - See Note 2) |
(As Adjusted - See Note 2) |
|||||||||||
| Amounts attributable to SYNNEX Corporation: |
||||||||||||
| Income from continuing operations, net of tax |
$ | 116,538 | $ | 85,758 | $ | 76,762 | ||||||
| Discontinued operations: |
||||||||||||
| Income from discontinued operations, net of tax |
59 | 3,909 | 5,729 | |||||||||
| Gain on sale of discontinued operations, net of tax |
11,351 | — | — | |||||||||
| Net income attributable to SYNNEX Corporation |
$ | 127,948 | $ | 89,667 | $ | 82,491 | ||||||
| Weighted-average common shares-basic |
34,737 | 32,711 | 31,619 | |||||||||
| Effect of dilutive securities: |
||||||||||||
| Stock options and restricted stock |
1,020 | 1,302 | 1,644 | |||||||||
| Weighted-average common shares-diluted |
35,757 | 34,013 | 33,263 | |||||||||
| Earnings per share attributable to SYNNEX Corporation: |
||||||||||||
| Basic: |
||||||||||||
| Income from continuing operations |
$ | 3.35 | $ | 2.62 | $ | 2.43 | ||||||
| Discontinued operations |
0.33 | 0.12 | 0.18 | |||||||||
| Net income per common share—basic |
$ | 3.68 | $ | 2.74 | $ | 2.61 | ||||||
| Diluted: |
||||||||||||
| Income from continuing operations |
$ | 3.26 | $ | 2.53 | $ | 2.31 | ||||||
| Discontinued operations |
0.32 | 0.11 | 0.17 | |||||||||
| Net income per common share—diluted |
$ | 3.58 | $ | 2.64 | $ | 2.48 | ||||||
Options to purchase 53, 205 and 113 shares of common stock as of November 30, 2010, 2009 and 2008, respectively, have not been included in the computation of diluted net income per share as their effect would have been anti-dilutive.
NOTE 16—RELATED PARTY TRANSACTIONS:
The Company has a business relationship with MiTAC International Corporation (“MiTAC International”), a publicly-traded company in Taiwan that began in 1992 when it became its primary investor through its affiliates. As of November 30, 2010, MiTAC International and its affiliates beneficially owned approximately 29% of the Company’s common stock. In addition, Matthew Miau, the Company’s Chairman Emeritus of the Board of Directors, is the Chairman of MiTAC International and a director or officer of MiTAC International’s affiliates. As a result, MiTAC International generally has significant influence over the Company and over the outcome of all matters submitted to stockholders for consideration, including any merger or acquisition of the Company. Among other things, this could have the effect of delaying, deterring or preventing a change of control over the Company with the loss of any premium that stockholders otherwise might receive in connection with such a transaction.
98
Table of Contents
SYNNEX CORPORATION
NOTES TO CONSOLIDATED FINANCIAL STATEMENTS—(continued)
(in thousands except per share amounts)
Until July 31, 2010, the Company worked with MiTAC International on OEM outsourcing and jointly marketed MiTAC International’s design and electronic manufacturing services and its contract assembly capabilities. This relationship enabled the Company to build relationships with MiTAC International’s customers. On July 31, 2010, MiTAC International purchased certain assets related to the Company’s contract assembly business, including inventory and customer contracts, primarily related to customers then being jointly served by MiTAC International and the Company. The value of the inventory sold was $68,076. No gain or loss was recognized on this transaction during the fiscal year ended November 30, 2010. As part of this transaction, the Company provides MiTAC International certain transition services for the business for a fee of $250 per month over a period of twelve months. During the fiscal year ended November 30, 2010, the Company received $1,000 in service fees. In addition, during the fiscal year ended November 30, 2010, the Company received $960 in reimbursements for facilities and overhead costs. The sale agreement also includes earn-out and profit sharing provisions, which are based on operating performance metrics, achieved over twelve to eighteen months from the closing date, for the defined customers included in this transaction.
The Company purchased inventories, including notebook computers, motherboards and other peripherals, from MiTAC International and its affiliates totaling $157,149, $312,364 and $261,579 during fiscal years 2010, 2009 and 2008, respectively. The Company’s sales to MiTAC International and its affiliates during fiscal years 2010, 2009 and 2008 totaled $5,565, $2,755 and $1,994, respectively. Most of these purchases and sales were pursuant to its Master Supply Agreement with MiTAC International and Sun Microsystems, formerly one of its contract assembly customers. In fiscal year 2010, Oracle Corporation acquired Sun Microsystems and all of the Company’s contract assembly services to Oracle Corporation were covered by this Master Supply Agreement.
The Company’s business relationship with MiTAC International had been informal and was not governed by long-term commitments or arrangements with respect to pricing terms, revenue or capacity commitments.
During the period of time that the Company worked with MiTAC International, the Company negotiated manufacturing, pricing and other material terms on a case-by-case basis with MiTAC International and its contract assembly customers for a given project. While MiTAC International is a related party and a controlling stockholder, the Company believes that the significant terms under these agreements, including pricing, would not materially differ from the terms it could have negotiated with unaffiliated third parties, and it has adopted a policy requiring that material transactions with MiTAC International or its related parties be approved by its Audit Committee, which is composed solely of independent directors. In addition, Matthew Miau’s compensation is approved by the Nominating and Corporate Governance Committee, which is also composed solely of independent directors. As MiTAC International’s ownership interest in the Company decreases as a result of sales of the Company’s stock and additional dilution, its interest in the success of the business and operations may decrease as well.
Beneficial Ownership of the Company’s Common Stock by MiTAC International
As noted above, MiTAC International and its affiliates in the aggregate beneficially owned approximately 29% of the Company’s common stock as of November 30, 2010. These shares are owned by the following entities:
| As of November 30, 2010 | ||||
| (shares in thousands) | ||||
| MiTAC International (1) |
6,178 | |||
| Synnex Technology International Corp. (2) |
4,427 | |||
| Total |
10,605 | |||
99
Table of Contents
SYNNEX CORPORATION
NOTES TO CONSOLIDATED FINANCIAL STATEMENTS—(continued)
(in thousands except per share amounts)
| (1) | Shares are held via Silver Star Developments Ltd., a wholly-owned subsidiary of MiTAC International. Excludes 786 thousand shares (of which 389 thousand shares are directly held and 397 thousand shares are subject to exercisable options) held by Matthew Miau. |
| (2) | Synnex Technology International Corp. (Synnex Technology International) is a separate entity from the Company and is a publicly-traded corporation in Taiwan. Shares are held via Peer Development Ltd, a wholly-owned subsidiary of Synnex Technology International. MiTAC International owns a noncontrolling interest of 8.7% in MiTAC Incorporated, a privately-held Taiwanese company, which in turn holds a noncontrolling interest of 14.6% in Synnex Technology International. Neither MiTAC International nor Mr. Miau is affiliated with any person(s), entity, or entities that hold a majority interest in MiTAC Incorporated. |
While the ownership structure of MiTAC International and its affiliates is complex, it has not had a material adverse effect on the Company’s business in the past, and it is not expected to do so in the future.
During fiscal years 2007 and 2008, the Company purchased shares of MiTAC International and one of its affiliates related to the deferred compensation plan of Robert Huang, the Company’s founder and former Chairman. As of November 30, 2010, the value of the investment was $900. Except as described herein, none of the Company’s officers or directors has an interest in MiTAC International or its affiliates.
Synnex Technology International is a publicly-traded corporation in Taiwan that currently provides distribution and fulfillment services to various markets in Asia and Australia, and is also a potential competitor of the Company. Neither MiTAC International nor Synnex Technology International is restricted from competing with the Company.
Others
On August 31, 2010, the Company sold its controlling interests in NDS for $3,072 to SB Pacific Corporation Limited (“SB Pacific”), a newly formed company, led by the Company’s founder and former Chairman, Robert Huang. Concurrently, the Company acquired a 33.3% noncontrolling interest in SB Pacific. A gain of $493 was recorded on the sale of NDS in “Other income (expense), net” during the fiscal year ended November 30, 2010. On December 1, 2010, the Company and SB Pacific acquired 70% and 30%, respectively, of the capital stock of Marubeni Infotec Corporation, now known as SYNNEX Infotec Corporation, for an aggregate of US$8,392, subject to certain post closing adjustments. This acquisition is in the distribution segment and is expected to enable expansion into Japan. Mr. Huang is the Chief Executive Officer of SYNNEX Infotec Corporation.
The Company’s investment in SB Pacific, which was accounted for as an equity-method investment, was included in “Other assets.” The Company regards SB Pacific to be a variable interest entity and as of November 30, 2010, its maximum exposure was limited to $1,095. During the 2010 fiscal year, the Company paid $150 in management fees to SB Pacific.
NOTE 17—SEGMENT INFORMATION:
Description of Segments
Operating segments are based on products and services provided by each segment, internal organization structure, the manner in which operations are managed, the criteria used by the Chief Operating Decision Maker (“CODM”) to assess the segment performance as well as resources allocation and the availability of discrete financial information.
100
Table of Contents
SYNNEX CORPORATION
NOTES TO CONSOLIDATED FINANCIAL STATEMENTS—(continued)
(in thousands except per share amounts)
The distribution services segment distributes IT systems, peripherals, system components, software, networking equipment, CE, and complementary products and video games to a variety of customers, including value-added resellers, system integrators, retailers, as well as provides assembly services to OEMs, including integrated supply chain management, build-to-order and configure-to-order system configurations, materials management and logistics.
The GBS services segment offers a range of services to the Company’s customers that include customer management, renewal management, and back office processing on a global platform. The Company delivers these services through various methods including voice, chat, web, email, and digital print. The Company also sells products complementary to these service offerings in China.
Summarized financial information related to the Company’s reportable business segments is shown below:
| Distribution | GBS | Inter-Segment Elimination |
Consolidated | |||||||||||||
| Fiscal Year ended November 30, 2008: |
||||||||||||||||
| Revenue |
$ | 7,674,048 | $ | 82,494 | $ | (19,816 | ) | $ | 7,736,726 | |||||||
| Income from continuing operations before non-operating items, income taxes and noncontrolling interest |
138,826 | 7,540 | — | 146,366 | ||||||||||||
| Depreciation and amortization expense |
11,676 | 5,135 | — | 16,811 | ||||||||||||
| Total assets (as adjusted—see Note 2) |
1,950,530 | 165,648 | (83,792 | ) | 2,032,386 | |||||||||||
| Fiscal Year ended November 30, 2009: |
||||||||||||||||
| Revenue |
$ | 7,639,094 | $ | 101,138 | $ | (21,035 | ) | $ | 7,719,197 | |||||||
| Income from continuing operations before non-operating items, income taxes and noncontrolling interest |
137,724 | 11,925 | — | 149,649 | ||||||||||||
| Depreciation and amortization expense |
11,980 | 5,823 | — | 17,803 | ||||||||||||
| Total assets (as adjusted—see Note 2) |
2,002,750 | 184,667 | (87,507 | ) | 2,099,910 | |||||||||||
| Fiscal Year ended November 30, 2010: |
||||||||||||||||
| Revenue |
$ | 8,526,309 | $ | 112,380 | $ | (24,548 | ) | $ | 8,614,141 | |||||||
| Income from continuing operations before non-operating items, income taxes and noncontrolling interest |
187,478 | 11,672 | — | 199,150 | ||||||||||||
| Depreciation and amortization expense |
10,846 | 5,439 | — | 16,285 | ||||||||||||
| Total assets |
2,409,998 | 224,677 | (134,814 | ) | 2,499,861 | |||||||||||
The inter-segment eliminations relate to the inter-segment back-office support services provided by the GBS segment to the distribution segment, inter-segment investments and inter-segment receivables. In fiscal year 2010, the Company recorded a statutory business expense of $2,059 in the GBS segment. Total assets in the GBS segment as of November 30, 2009 include assets held for sale.
101
Table of Contents
SYNNEX CORPORATION
NOTES TO CONSOLIDATED FINANCIAL STATEMENTS—(continued)
(in thousands except per share amounts)
Segment by Geography
The Company primarily operates in North America. The United States and Canada are included in the “North America” operations and China, Costa Rica, Mexico, Japan, the Philippines and the UK are included in “Other” operations. The revenues attributable to countries are based on geography of entities from where the products are distributed or services are provided. Shown below is summarized financial information related to the geographic areas is shown below:
| Fiscal Years Ended November 30, | ||||||||||||
| 2010 | 2009 | 2008 | ||||||||||
| Revenue |
||||||||||||
| North America |
$ | 8,467,173 | $ | 7,570,604 | $ | 7,576,536 | ||||||
| Other |
146,968 | 148,593 | 160,190 | |||||||||
| $ | 8,614,141 | $ | 7,719,197 | $ | 7,736,726 | |||||||
| As of November 30, | ||||||||||||
| 2010 | 2009 | |||||||||||
| Long-lived assets |
||||||||||||
| North America |
$ | 84,666 | $ | 70,610 | ||||||||
| Other |
27,487 | 50,005 | ||||||||||
| $ | 112,153 | $ | 120,615 | |||||||||
Revenue in the United States was approximately 83% of the total revenue for both the fiscal years ended November 30, 2010 and 2009 and 80% for the fiscal year ended November 30, 2008. Revenue in Canada was approximately 15% of total revenue for both the fiscal years ended November 30, 2010 and 2009 and 18% for the fiscal year ended November 30, 2008. No other geographical location accounted for more than 10% of the Company’s total revenue.
Long-lived assets in the United States were approximately 58% and 42% of total long-lived assets as of November 30, 2010 and 2009, respectively. Long-lived assets in Canada were approximately 17% of total long-lived assets as of both November 30, 2010 and 2009.
NOTE 18—ACQUISITIONS AND DIVESTITURES:
Fiscal year 2010 acquisitions
On February 26, 2010, the Company purchased substantially all of the North American assets of Jack of All Games, Inc., a distributor of video game hardware and software. The Company expects this acquisition to expand its CE product offerings. The acquisition is fully integrated into the Company’s distribution segment. During the fiscal year ended November 30, 2010, the Company made certain adjustments to the fair value of inventories and other assets acquired, and liabilities assumed, related to this transaction. These adjustments had the impact of lowering the purchase price by $5,299. The total consideration as adjusted is $37,354. The net tangible assets acquired were $27,205 and the Company recognized $4,500 of intangible assets and $5,649 in goodwill.
102
Table of Contents
SYNNEX CORPORATION
NOTES TO CONSOLIDATED FINANCIAL STATEMENTS—(continued)
(in thousands except per share amounts)
The preliminary purchase price allocation based on the estimated fair value of the assets acquired and liabilities assumed is as follows:
| Fair Value | ||||
| Purchase Consideration: |
||||
| Cash Payment |
$ | 37,248 | ||
| Less: Amount due from seller (1) |
(2,685 | ) | ||
| Accrual subject to post closing conditions (1) |
2,791 | |||
| $ | 37,354 | |||
| Allocation: |
||||
| Accounts receivable, net |
$ | 10,466 | ||
| Receivable from vendors, net |
2,679 | |||
| Inventories |
23,736 | |||
| Other current assets |
290 | |||
| Goodwill |
5,649 | |||
| Intangible assets, net (2) |
4,500 | |||
| Accounts payable |
(8,700 | ) | ||
| Accrued liabilities |
(1,266 | ) | ||
| $ | 37,354 | |||
| (1) | Based on agreed-upon changes to the acquisition price. |
| (2) | Intangibles will be amortized over a period of 3 to 10 years. |
On November 17, 2010 the Company acquired 100% of the stock of Aspire Technology Limited for $16,047, including $3,209 in earn-out payments payable upon the achievement of certain milestones during the three years following the date of the acquisition. Aspire Technology Limited is based in the UK and provides renewal management through its proprietary software. The Company recognized $12,999 in goodwill and $4,761 in intangible assets. The determination of the fair value of the purchase price and the net assets acquired is preliminary.
On November 18, 2010, the Company acquired 100% of the stock of Encover, Inc. for $24,000, including $5,500 in earn-out payments payable after one year following the acquisition date upon the achievement of certain milestones. Encover, Inc. is based in the United States and provides warranty and license renewal services and software. The Company recognized $9,017 in goodwill and $6,965 in intangible assets. The determination of the fair value of the purchase price and the net assets acquired is preliminary. The purchase price is subject to a holdback of $1,850 for a period of twenty-four months from the purchase date.
Aspire Technology Limited and Encover, Inc. are being fully integrated into the GBS segment and are expected to enhance the business process outsourcing service offerings through their proprietary, scalable platform warranty and license renewal management capabilities and services.
The above acquisitions in the fiscal year 2010, individually and in the aggregate, did not meet the conditions of a material business combination and were not subject to the disclosure requirements of accounting for business combinations utilizing the purchase method of accounting.
103
Table of Contents
SYNNEX CORPORATION
NOTES TO CONSOLIDATED FINANCIAL STATEMENTS—(continued)
(in thousands except per share amounts)
Fiscal year 2010 divestitures
On December 28, 2009, the Company sold its controlling interest in China Civilink (Cayman), the results of which are presented in discontinued operations. Please see Note 19—Discontinued Operations for a detailed discussion on this transaction.
On July 31, 2010, the Company sold to MiTAC International, inventory and certain customer contracts, primarily related to contract assembly customers jointly served by the Company and MiTAC International. The sale agreement includes earn-out and profit-sharing provisions, which are based on operating performance metrics, achieved over a period of twelve to eighteen months after the closing date, for the defined customers included in the transaction. The Company will provide MiTAC International certain transition services on a fee basis. Please see Note 16—Related Party Transactions for more information on this transaction.
On August 31, 2010, the Company sold its controlling interests in NDS for $3,072 to SB Pacific, a newly formed company led by the Company’s founder and former Chairman, Robert Huang. Concurrently, the Company invested in a 33.3% noncontrolling interest in SB Pacific. A gain of $493 was recorded on the sale of NDS in “Other income (expense), net” during the fiscal year ended November 30, 2010.
Fiscal year 2009 acquisitions
In the first quarter of fiscal year 2009, the Company completed two acquisitions in the GBS segment. Through these acquisitions, the Company acquired web development services and complementary products for total consideration of $6,579. In the fiscal year ended November 30, 2010, the Company recorded additional goodwill and accrued $2,820 for the earn-out payment related to one of these acquisitions. The other acquisition is reported under discontinued operations. The above acquisitions in fiscal year 2009, individually and in the aggregate, did not meet the conditions of a material business combination and were not subject to the disclosure requirements of accounting for business combinations utilizing the purchase method of accounting.
Building Acquisition
In July 2009, the Company completed the purchase of a previously leased administrative and warehouse facility in Fremont, California. The facility is approximately one hundred and twenty eight thousand square feet. The total purchase price for this facility was $12,154.
NOTE 19—DISCONTINUED OPERATIONS:
On December 28, 2009, China Civilink (Cayman), which operates in China as HiChina Web Solutions, was sold to Alibaba.com Limited. HiChina Web Solutions provides domain name registration, web site hosting and design. HiChina Web Solution was a subsidiary of SYNNEX Investment Holdings Corporation, a wholly-owned subsidiary company of SYNNEX Corporation. The Company received $65,395 for its estimated 79% controlling ownership in HiChina Web Solutions. The total gain recorded on the sale was $11,351, net of $1,154 income taxes. The Company, as the ultimate parent, has agreed to guarantee the obligations of SYNNEX Investment Holdings Corporation up to $35,035 in connection with the sale of HiChina Web Solutions. HiChina Web Solutions was a part of the Company’s GBS segment. The Company has no significant continuing involvement in the operations of HiChina Web Solutions. In conjunction with the sale of HiChina Web Solutions, the Company recorded a contingent liability of $3,076.
Under the provisions of FASB ASC 360, “Property, Plant and Equipment,” the sale of HiChina Web Solutions qualified as a discontinued operation component of the Company. Accordingly, the Company has excluded results of HiChina Web Solution’s operations from its consolidated statements of continuing operations to present this business in discontinued operations.
104
Table of Contents
SYNNEX CORPORATION
NOTES TO CONSOLIDATED FINANCIAL STATEMENTS—(continued)
(in thousands except per share amounts)
The following table shows the results of operations of HiChina Web Solutions:
| Fiscal Years Ended November 30, | ||||||||||||
| 2010* | 2009 | 2008 | ||||||||||
| Revenue |
$ | 2,959 | $ | 37,081 | $ | 31,504 | ||||||
| Cost of revenue |
(1,706 | ) | (16,078 | ) | (13,450 | ) | ||||||
| Gross profit |
1,253 | 21,003 | 18,054 | |||||||||
| Selling, general and administrative expenses |
(1,199 | ) | (15,736 | ) | (12,573 | ) | ||||||
| Income from operations before non-operating items, income taxes and noncontrolling interest |
54 | 5,267 | 5,481 | |||||||||
| Interest income (expense and finance charges), net |
17 | 413 | 575 | |||||||||
| Other income (expense), net |
5 | (7 | ) | (19 | ) | |||||||
| Income before income taxes and noncontrolling interest |
76 | 5,673 | 6,037 | |||||||||
| (Provision for) benefit from income taxes |
(1 | ) | (474 | ) | 610 | |||||||
| Income from discontinued operations |
75 | 5,199 | 6,647 | |||||||||
| Income from discontinued operations attributable to noncontrolling interest |
(16 | ) | (1,290 | ) | (918 | ) | ||||||
| Income from discontinued operations attributable to SYNNEX Corporation |
$ | 59 | $ | 3,909 | $ | 5,729 | ||||||
* Includes the results of operations from December 1, 2009 to the disposition date of December 28, 2009.
The following are the carrying amounts of major classes of assets and liabilities of HiChina Web Solution’s discontinued operations:
| As of November 30, 2009 |
||||
| Assets |
||||
| Cash and cash equivalents |
$ | 21,590 | ||
| Short-term investments |
8,952 | |||
| Property and equipment, net |
6,256 | |||
| Goodwill |
29,920 | |||
| Intangible assets |
3,670 | |||
| Other assets |
3,797 | |||
| Total assets held for sale |
$ | 74,185 | ||
| Liabilities |
||||
| Current deferred liabilities |
$ | 10,198 | ||
| Other liabilities |
7,950 | |||
| Total liabilities related to assets held for sale |
$ | 18,148 | ||
| Noncontrolling interest |
$ | 7,403 | ||
105
Table of Contents
SYNNEX CORPORATION
NOTES TO CONSOLIDATED FINANCIAL STATEMENTS—(continued)
(in thousands except per share amounts)
NOTE 20—RESTRUCTURING CHARGES:
In fiscal year 2007, in connection with the acquisition of the Redmond Group of Companies (“RGC”), the Company announced a restructuring program in Canada. During the fiscal years ended November 30, 2010 and 2009, the Company accrued charges for the remaining lease obligations on the RGC facility. The charges are included in “Selling, general and administrative expenses” in the Statement of Operations. The unpaid portion of the restructuring charges is included in the consolidated balance sheet under the caption “Accrued liabilities.”
| Facility and Exit Costs |
||||
| Balance of accrual as of November 30, 2008 |
$ | 302 | ||
| Additional accrual |
860 | |||
| Cash payments |
(303 | ) | ||
| Non-cash charges |
(302 | ) | ||
| Balance of accrual as of November 30, 2009 |
$ | 557 | ||
| Additional accrual |
807 | |||
| Cash payments |
(734 | ) | ||
| Non-cash charges |
— | |||
| Balance of accrual as of November 30, 2010 |
$ | 630 | ||
The above restructuring charges are incurred in the distribution segment. The remaining lease obligations are expected to be completed by June 2011.
NOTE 21—COMMITMENTS AND CONTINGENCIES:
The Company leases certain of its facilities under operating lease agreements, which expire in various periods through 2015. Future minimum rental obligations under non-cancellable lease agreements as of November 30, 2010 were as follows:
| Fiscal Years Ending November 30, |
||||
| 2011 |
$ | 16,566 | ||
| 2012 |
12,263 | |||
| 2013 |
7,563 | |||
| 2014 |
4,245 | |||
| 2015 |
2,509 | |||
| thereafter |
— | |||
| Total minimum lease payments |
$ | 43,146 | ||
Rent expense for the years ended November 30, 2010, 2009 and 2008 amounted to $16,340, $17,579 and $15,212, respectively.
The Company was contingently liable as of November 30, 2010, under agreements to repurchase repossessed inventory acquired by Flooring Companies as a result of default on floor plan financing arrangements by the Company’s customers. These arrangements are described in Note 12—Accounts Receivable Arrangements. Losses, if any, would be the difference between the repossession cost and the resale value of the
106
Table of Contents
SYNNEX CORPORATION
NOTES TO CONSOLIDATED FINANCIAL STATEMENTS—(continued)
(in thousands except per share amounts)
inventory. There have been no repurchases through November 30, 2010 under these agreements, nor is the Company aware of any pending customer defaults or repossession obligations.
The Company is from time to time involved in various bankruptcy preference actions where the Company was a supplier to the companies now in bankruptcy. These preference actions are filed by the bankruptcy trustee on behalf of the bankrupt estate and generally seek to have payments made by the debtor within 90 days prior to the bankruptcy returned to the bankruptcy estate for allocation among all of the bankrupt estate’s creditors. The Company is not currently involved in any material preference proceedings.
In conjunction with the sale of HiChina Web Solutions, which is described in Note 19— Discontinued Operations, the Company recorded a contingent liability of $3,076.
The Company does not believe that the above commitments and contingencies will have a material adverse effect on the Company’s results of operations, financial position or cash flows.
NOTE 22—SUBSEQUENT EVENTS:
On December 1, 2010, the Company acquired 70% of the capital stock of Marubeni Infotec Corporation, a subsidiary of Marubeni Corporation, while SB Pacific, the Company’s equity-method investee, acquired the remaining 30% noncontrolling interest. Marubeni Infotec Corporation, now known as SYNNEX Infotec Corporation, is a distributor of IT equipment, electronic components and software in Japan. The aggregate consideration for the transaction was JP¥700,000, or approximately US$8,392, of which the Company’s direct share was US$5,888. The purchase consideration is subject to certain adjustments based on SYNNEX Infotec Corporation’s balance sheet at closing, and the assumption of certain liabilities totaling JP¥10,342,000, or approximately US$125,800. The Company owns 80% of SYNNEX Infotec Corporation, inclusive of its investment in SB Pacific. This acquisition is in the distribution segment and will enable the Company’s expansion into Japan.
On December 1, 2010, the Company refinanced the debt that was assumed through the acquisition of Marubeni Infotec Corporation with a newly formed working capital facility with a financial institution. The financing facility consists of a term loan facility of JP¥ 6,000,000, or approximately US$71,485, and a revolving line facility of JP¥ 4,000,000, or approximately US$47,657. The interest rate on the loans will be the TIBOR rate plus the applicable margins. The Company issued a guarantee to the financial institution in relation to these borrowing agreements on December 1, 2010.
During the first quarter of fiscal year 2011, the Company acquired the assets of the e4e, Inc., a privately-held company that provides BPO services, for $23,000 in cash, of which $1,000 is payable upon the achievement of certain post closing conditions. This acquisition is in the GBS segment and is expected to bring additional BPO scale, complement the Company’s service offerings and expand its customer base and geographic presence.
107
Table of Contents
SELECTED QUARTERLY CONSOLIDATED FINANCIAL DATA (Unaudited)
The following table presents selected unaudited consolidated financial results for each of the eight quarters in the two-year period ended November 30, 2010. In the Company’s opinion, this unaudited information has been prepared on the same basis as the audited information and includes all adjustments (consisting of only normal recurring adjustments) necessary for a fair statement of the financial information for the periods presented.
| Fiscal Year 2010 Three Months Ended |
Fiscal Year 2009 Three Months Ended |
|||||||||||||||||||||||||||||||
| Feb. 28, 2010 |
May 31, 2010 |
Aug. 31, 2010 |
Nov. 30, 2010 |
Feb. 28, 2009 |
May 31, 2009 |
Aug. 31, 2009 |
Nov. 30, 2009 |
|||||||||||||||||||||||||
| (As Adjusted - See Note 2) |
(As Adjusted - See Note 2) |
(As Adjusted - See Note 2) |
(As Adjusted - See Note 2) |
|||||||||||||||||||||||||||||
| Statement of Operations Data: (in thousands except per share amounts) |
||||||||||||||||||||||||||||||||
| Revenue |
$ | 1,936,038 | $ | 2,032,812 | $ | 2,177,066 | $ | 2,468,225 | $ | 1,720,370 | $ | 1,802,705 | $ | 1,998,060 | $ | 2,198,062 | ||||||||||||||||
| Cost of revenue |
(1,826,877 | ) | (1,916,145 | ) | (2,052,197 | ) | (2,327,306 | ) | (1,619,523 | ) | (1,701,765 | ) | (1,892,083 | ) | (2,082,796 | ) | ||||||||||||||||
| Gross profit |
109,161 | 116,667 | 124,869 | 140,919 | 100,847 | 100,940 | 105,977 | 115,266 | ||||||||||||||||||||||||
| Selling, general and administrative expenses |
(70,208 | ) | (73,233 | ) | (72,715 | ) | (76,310 | ) | (67,060 | ) | (70,947 | ) | (67,778 | ) | (67,596 | ) | ||||||||||||||||
| Income from continuing operations before non-operating items, income taxes and noncontrolling interest |
38,953 | 43,434 | 52,154 | 64,609 | 33,787 | 29,993 | 38,199 | 47,670 | ||||||||||||||||||||||||
| Interest expense and finance charges, net |
(3,809 | ) | (3,736 | ) | (4,585 | ) | (4,984 | ) | (5,099 | ) | (4,178 | ) | (4,220 | ) | (4,535 | ) | ||||||||||||||||
| Other income (expense), net |
1,163 | (93 | ) | (300 | ) | 780 | (388 | ) | 1,417 | 729 | 1,278 | |||||||||||||||||||||
| Income from continuing operations before income taxes and noncontrolling interest |
36,307 | 39,605 | 47,269 | 60,405 | 28,300 | 27,232 | 34,708 | 44,413 | ||||||||||||||||||||||||
| Provision for income taxes |
(13,067 | ) | (14,651 | ) | (16,319 | ) | (22,873 | ) | (10,322 | ) | (9,944 | ) | (13,200 | ) | (15,562 | ) | ||||||||||||||||
| Income from continuing operations before noncontrolling interest, net of tax |
23,240 | 24,954 | 30,950 | 37,532 | 17,978 | 17,288 | 21,508 | 28,851 | ||||||||||||||||||||||||
| Income from discontinued operations, net of tax |
75 | — | — | — | 1,074 | 1,586 | 1,192 | 1,347 | ||||||||||||||||||||||||
| Gain on sale of discontinued operations, net of tax |
11,351 | — | — | — | — | — | — | — | ||||||||||||||||||||||||
| Net Income |
34,666 | 24,954 | 30,950 | 37,532 | 19,052 | 18,874 | 22,700 | 30,198 | ||||||||||||||||||||||||
| Net income attributable to noncontrolling interest |
(7 | ) | (110 | ) | (36 | ) | (1 | ) | (161 | ) | (241 | ) | (235 | ) | (520 | ) | ||||||||||||||||
| Net income attributable to SYNNEX Corporation |
34,659 | 24,844 | 30,914 | 37,531 | 18,891 | 18,633 | 22,465 | 29,678 | ||||||||||||||||||||||||
| Amounts attributable to SYNNEX Corporation: |
||||||||||||||||||||||||||||||||
| Income from continuing operations, net of tax |
23,249 | 24,844 | 30,914 | 37,531 | 18,020 | 17,402 | 21,501 | 28,835 | ||||||||||||||||||||||||
| Discontinued operations: |
||||||||||||||||||||||||||||||||
| Income from discontinued operations, net of tax |
59 | — | — | — | 871 | 1,231 | 964 | 843 | ||||||||||||||||||||||||
| Gain on sale of discontinued operations, net of tax |
11,351 | — | — | — | — | — | — | — | ||||||||||||||||||||||||
| Net income attributable to SYNNEX Corporation |
$ | 34,659 | $ | 24,844 | $ | 30,914 | $ | 37,531 | $ | 18,891 | $ | 18,633 | $ | 22,465 | $ | 29,678 | ||||||||||||||||
| Earnings per share attributable to SYNNEX Corporation: |
||||||||||||||||||||||||||||||||
| Basic: |
||||||||||||||||||||||||||||||||
| Income from continuing operations |
$ | 0.69 | $ | 0.72 | $ | 0.88 | $ | 1.06 | $ | 0.56 | $ | 0.53 | $ | 0.65 | $ | 0.86 | ||||||||||||||||
| Discontinued operations |
0.33 | — | — | — | 0.03 | 0.04 | 0.03 | 0.03 | ||||||||||||||||||||||||
| Net income per common share—basic |
$ | 1.02 | $ | 0.72 | $ | 0.88 | $ | 1.06 | $ | 0.59 | $ | 0.57 | $ | 0.68 | $ | 0.89 | ||||||||||||||||
| Diluted: |
||||||||||||||||||||||||||||||||
| Income from continuing operations |
$ | 0.66 | $ | 0.70 | $ | 0.86 | $ | 1.04 | $ | 0.55 | $ | 0.51 | $ | 0.62 | $ | 0.83 | ||||||||||||||||
| Discontinued operations |
0.32 | — | — | — | 0.03 | 0.04 | 0.03 | 0.02 | ||||||||||||||||||||||||
| Net income per common share—diluted |
$ | 0.98 | $ | 0.70 | $ | 0.86 | $ | 1.04 | $ | 0.58 | $ | 0.55 | $ | 0.65 | $ | 0.85 | ||||||||||||||||
| Weighted-average common shares outstanding-basic |
33,880 | 34,624 | 35,083 | 35,351 | 32,113 | 32,475 | 32,837 | 33,419 | ||||||||||||||||||||||||
| Weighted-average common shares outstanding-diluted |
35,255 | 35,703 | 35,910 | 36,149 | 32,764 | 33,731 | 34,595 | 34,963 | ||||||||||||||||||||||||
Earnings per share (“EPS”) for each quarter are computed using the weighted-average number of shares outstanding during that quarter, while EPS for the fiscal year is computed using the weighted-average of shares outstanding during the fiscal year. Thus, the sum of EPS for each of the four quarters may not equal the EPS for the fiscal year.
108
Table of Contents
SCHEDULE II—VALUATION AND QUALIFYING ACCOUNTS
For the Fiscal Years Ended November 30, 2010, 2009 and 2008
(in thousands)
| Description |
Balances at Beginning of Fiscal Year |
Additions Charged to Revenue and COGS and Expense |
Additions from Acquisitions |
Reclassifications, Write-offs and Deductions |
Balances at Fiscal Year End |
|||||||||||||||
| Fiscal Year Ended November 30, 2008 |
||||||||||||||||||||
| Allowance for sales returns |
$ | 20,668 | $ | 974 | $ | — | $ | — | $ | 21,642 | ||||||||||
| Allowance for deferred tax assets |
2,252 | 370 | 1,351 | — | 3,973 | |||||||||||||||
| Fiscal Year Ended November 30, 2009 |
||||||||||||||||||||
| Allowance for sales returns |
$ | 21,642 | $ | (1,977 | ) | $ | — | $ | 817 | $ | 20,482 | |||||||||
| Allowance for deferred tax assets |
3,973 | 1,610 | — | 242 | 5,825 | |||||||||||||||
| Fiscal Year Ended November 30, 2010 |
||||||||||||||||||||
| Allowance for sales returns |
$ | 20,482 | $ | 11,861 | $ | — | $ | 182 | $ | 32,525 | ||||||||||
| Allowance for deferred tax assets |
5,825 | 668 | — | (2,631 | ) | 3,862 | ||||||||||||||
| Item 9. | Changes in and Disagreements with Accountants on Accounting and Financial Disclosure |
None.
| Item 9A. | Controls and Procedures |
Evaluation of Disclosure Controls and Procedures
We maintain “disclosure controls and procedures,” as such term is defined in Rule 13a-15(e) under the Securities Exchange Act of 1934 (the “Exchange Act”), that are designed to ensure that information required to be disclosed by us in reports that we file or submit under the Exchange Act is recorded, processed, summarized, and reported within the time periods specified in Securities and Exchange Commission rules and forms, and that such information is accumulated and communicated to our management, including our Chief Executive Officer and Chief Financial Officer, as appropriate, to allow timely decisions regarding required disclosure. In designing and evaluating our disclosure controls and procedures, management recognized that disclosure controls and procedures, no matter how well conceived and operated, can provide only reasonable, not absolute, assurance that the objectives of the disclosure controls and procedures are met. Our disclosure controls and procedures have been designed to meet reasonable assurance standards. Additionally, in designing disclosure controls and procedures, our management necessarily was required to apply its judgment in evaluating the cost-benefit relationship of possible disclosure controls and procedures. The design of any disclosure controls and procedures also is based in part upon certain assumptions about the likelihood of future events, and there can be no assurance that any design will succeed in achieving its stated goals under all potential future conditions.
Based on their evaluation as of the end of the period covered by this Annual Report on Form 10-K, our Chief Executive Officer and Chief Financial Officer have concluded that, as of such date, our disclosure controls and procedures were effective at the reasonable assurance level.
Management’s Report on Internal Control over Financial Reporting
Management’s Report on Internal Control over Financial Reporting on page 56 is incorporated herein by reference.
109
Table of Contents
Changes in Internal Control over Financial Reporting
There was no change in our internal control over financial reporting (as defined in Rule 13a-15(f) under the Exchange Act) identified in connection with management’s evaluation during our last fiscal year that has materially affected, or is reasonably likely to materially affect, our internal control over financial reporting.
| Item 9B. | Other Information |
None.
110
Table of Contents
| Item 10. | Directors and Executive Officers of the Registrant |
The information required by this item (with respect to Directors) is incorporated by reference from the information under the caption “Election of Directors” contained in our Proxy Statement to be filed with the Securities and Exchange Commission in connection with the solicitation of proxies for our 2011 Annual Meeting of Stockholders to be held on March 21, 2011 (the “Proxy Statement”). Certain information required by this item concerning executive officers is set forth in Part I of this Report under the caption “Executive Officers of the Registrant.”
Item 405 of Regulation S-K calls for disclosure of any known late filing or failure by an insider to file a report required by Section 16(a) of the Exchange Act. This information is contained in the section called “Section 16(a) Beneficial Ownership Reporting Compliance” in the Proxy Statement and is incorporated herein by reference.
We have adopted a code of ethics that applies to all of our employees, including our principal executive officer, our principal financial officer, our controller and persons performing similar functions. This code of ethics, called a Code of Ethics and Business Conduct for Employees, Officers and Directors, is available free of charge on our public website (www.synnex.com) on the investor relations webpage. Future amendments or waivers relating to the code of ethics will be disclosed on the webpage referenced in this paragraph within five (5) business days following the date of such amendment or waiver.
| Item 11. | Executive Compensation |
The information required by this item is incorporated by reference from the information under the captions “Election of Directors—Directors’ Compensation,” “Executive Compensation,” and “Election of Directors—Compensation Committee Interlocks and Insider Participation” contained in the Proxy Statement.
| Item 12. | Security Ownership of Certain Beneficial Owners and Management and Related Stockholder Matters |
The information required by this item with respect to security ownership of certain beneficial owners and management is incorporated by reference from the information under the caption “Security Ownership of Certain Beneficial Owners and Management” contained in the Proxy Statement.
Equity Compensation Plan Information
The following table sets forth certain information regarding our equity compensation plans as of November 30, 2010:
| Plan Category |
Number of securities to be issued upon exercise of outstanding options (a) |
Weighted-average exercise price of outstanding options (b) |
Number of securities remaining available for future issuance under equity compensation plans (excluding securities reflected in column (a)) (c) |
|||||||||
| Equity compensation plans approved by security holders |
2,120,228 | $ | 17.08 | 2,049,693(1)(2) | ||||||||
| (1) | Includes the number of shares reserved for issuance under our Amended and Restated 2003 Stock Incentive Plan. The number of shares authorized for issuance under our Amended and Restated 2003 Stock Incentive Plan will not exceed the sum of (1) the number of shares subject to outstanding options granted under our 1997 Stock Option Plan/Stock Issuance Plan, our Special Executive Stock Option/Stock Issuance Plan and our 1993 Stock Option Plan outstanding, to the extent those options expire, terminate or are cancelled for any reason |
111
Table of Contents
| prior to being exercised, plus (2) 5,506,649 shares of common stock; provided, however, that the number of authorized shares under our Amended and Restated 2003 Stock Incentive Plan will not exceed 14,111,761 shares of common stock. Please see Note 3 of the Notes to the Consolidated Financial Statements for further information regarding the Amended and Restated 2003 Stock Incentive Plan. |
| (2) | Includes 750,000 shares available-for-sale pursuant to our 2003 Employee Stock Purchase Plan (as amended). Shares of common stock will be purchased at a price equal to 95% of the fair market value per share of common stock on either the first trading day of the offering period or on the last trading day of the accumulation period, whichever is less. Please see Note 3 of the Notes to the Consolidated Financial Statements for further information regarding the 2003 Employee Stock Purchase Plan. |
| Item 13. | Certain Relationships and Related Transactions |
The information required by this item is incorporated by reference from the information contained under the caption “Certain Relationships and Related Party Transactions” contained in the Proxy Statement.
| Item 14. | Principal Accountant Fees and Services |
The information required by this item is incorporated by reference from the information contained under the caption “Ratification of the Appointment of Independent Registered Public Accountants” contained in the Proxy Statement.
112
Table of Contents
| Item 15. | Exhibits and Financial Statement Schedules |
(a) Documents filed as part of this report:
| (1) | Financial Statements |
See Index under Item 8.
| (2) | Financial Statements Schedule |
See Index under Item 8.
| (3) | Exhibits |
See Item 15(b) below. Each compensatory plan required to be filed has been identified.
(b) Exhibits.
| Exhibit Number |
Description of Document | |
| 2.1 | Acquisition Agreement, dated March 27, 2007, by and among RGC Canada Ltd., Redmond Group of Companies LP, 2064862 Ontario Inc., AVS Technologies Limited Partnership and SYNNEX Canada Limited (incorporated by reference to Exhibit 2.1 to the Company’s Current Report on Form 8-K filed on October 10, 2007). | |
| 2.2 | Amending Agreement, dated April 30, 2007, by and among RGC Canada Ltd., Redmond Group of Companies LP, 2064862 Ontario Inc., AVS Technologies Limited Partnership and SYNNEX Canada Limited (incorporated by reference to Exhibit 2.2 to the Company’s Current Report on Form 8-K filed on October 10, 2007). | |
| 3(i).1 | Restated Certificate of Incorporation (incorporated by reference to Exhibit 3(i).3 to Amendment No. 1 to the Company’s Registration Statement on Form S-1 (File No. 333-108543)). | |
| 3(ii).2 | Amended and Restated Bylaws (incorporated by reference to Exhibit 3(ii).1 to the Company’s Current Report on Form 8-K filed on April 2, 2008). | |
| 4.1 | Form of Common Stock Certificate (incorporated by reference to the exhibit of the same number to Amendment No. 2 to the Company’s Registration Statement on Form S-1 (File No. 333-108543)). | |
| 4.2 | Indenture related to the 4.0% Convertible Senior Notes due 2018, dated as of May 12, 2008, between SYNNEX Corporation and U.S. Bank National Association, as trustee (including form of 4.0% Convertible Senior Note due 2018) (incorporated by reference to Exhibit 4.1 to the Company’s Current Report on Form 8-K filed on May 16, 2008). | |
| 10.1# | Amended and Restated 2003 Stock Incentive Plan and form of agreements thereunder (incorporated by reference to Exhibit 10.1 to the Company’s Quarterly Report on Form 10-Q for the quarter ended August 31, 2008). | |
| 10.2# | Amended and Restated 2003 Employee Stock Purchase Plan (incorporated by reference to Exhibit 10.2 to the Company’s Quarterly Report on Form 10-Q for the quarter ended August 31, 2008). | |
| 10.3# | Amendment to Amended and Restated 2003 Employee Stock Purchase Plan (incorporated by reference to Exhibit 10.2 to the Company’s Quarterly Report on Form 10-Q for the quarter ended August 31, 2008). | |
| 10.4 | Form of Indemnification Agreement between the Company and its officers and directors (incorporated by reference to Exhibit 10.6 to the Company’s Registration Statement on Form S-1 (File No. 333-108543)). | |
113
Table of Contents
| Exhibit Number |
Description of Document | |
| 10.5 | Registration Rights Agreement dated as of July 1, 2002 (incorporated by reference to Exhibit 10.7 to the Company’s Registration Statement on Form S-1 (File No. 333-108543)). | |
| 10.6# | Form of Change of Control Severance Plan (incorporated by reference to Exhibit 10.13 to Amendment No. 1 to the Company’s Registration Statement on Form S-1 (File No. 333-108543)). | |
| 10.7 | HP U.S. Business Development Partner Agreement dated November 6, 2003, between the Company and Hewlett-Packard Company (incorporated by reference to Exhibit 10.14 to Amendment No. 2 to the Company’s Registration Statement on Form S-1 (File No. 333-108543)). | |
| 10.8 | Master External Manufacturing Agreement, dated August 28, 1999, by and among the Company, MiTAC International Corporation and Sun Microsystems, Inc., including amendments thereto (incorporated by reference to Exhibit 10.15 to Amendment No. 2 to the Company’s Registration Statement on Form S-1 (File No. 333-108543)). | |
| 10.9 | Joint Sales and Marketing Agreement, dated May 6, 2002, between the Company and MiTAC International Corporation (incorporated by reference to Exhibit 10.16 to Amendment No. 2 to the Company’s Registration Statement on Form S-1 (File No. 333-108543)). | |
| 10.10 | Master Agreement and Plan of Reorganization among the Company, SYNNEX, K.K. and MCJ Co., Ltd. dated March 29, 2005 (incorporated by reference to Exhibit 10.2 to the Company’s Quarterly Report on Form 10-Q for the quarter ended May 31, 2005). | |
| 10.11# | Settlement and Release, dated March 24, 2009, by and between SYNNEX Canada Limited and Jim Estill (incorporated by reference to Exhibit 10.1 to the Company’s Quarterly Report in Form 10-Q for the quarter ended May 31, 2009). | |
| 10.12 | Fourth Amended and Restated Credit Agreement, dated as of November 12, 2010, by and among the Company, the lenders signatories thereto from time to time, and Bank of America, N.A. (incorporated by reference to Exhibit 10.1 to the Company’s Current Report in Form 8-K filed on November 18, 2010). | |
| 10.13 | Third Amended and Restated Receivables Sale and Servicing Agreement, dated as of January 23, 2009, among the Originator, the Servicer and SIT Funding Corporation (incorporated by reference to Exhibit 10.34 to the Company’s Annual Report in Form 10-K for the year ended November 30, 2008). | |
| 10.14 | Fourth Amended and Restated Receivables Funding and Administration Agreement, dated as November 12, 2010, among SIT Funding Corporation, the lenders party thereto and The Bank of Nova Scotia (incorporated by reference to Exhibit 10.3 to the Company’s Current Report in Form 8-K filed on November 18, 2010). | |
| 10.15# | Offer Letter, dated as of March 23, 2007, between Thomas C. Alsborg and the Company (incorporated by reference to Exhibit 10.1 to the Company’s Current Report filed on Form 8-K on March 28, 2007). | |
| 10.16# | Amendment to SYNNEX Corporation Change of Control Severance Plan (incorporated by reference to Exhibit 10.21 to the Company’s Annual Report on Form 10-K for the fiscal year ended November 30, 2007). | |
| 10.17# | SYNNEX Corporation Deferred Compensation Plan, as amended and restated effective January 1, 2005 (incorporated by reference to Exhibit 10.22 to the Company’s Annual Report on Form 10-K for the fiscal year ended November 30, 2007). | |
| 10.18# | Offer Letter, dated as of March 27, 2008, by and between the Company and Kevin Murai (incorporated by reference to Exhibit 10.1 to the Company’s Current Report on Form 8-K filed on April 2, 2008). | |
114
Table of Contents
| Exhibit Number |
Description of Document | |
| 10.19 | First Amendment to Asset Purchase Agreement dated March 31, 2008, by and among the Company and New Age Electronics, Inc., a California corporation (incorporated by reference to Exhibit 10.4 to the Company’s Quarterly Report on Form 10-Q for the quarter ended February 29, 2008). | |
| 10.20# | Amendment to the Amended and Restated 2003 Stock Incentive Plan, dated November 21, 2008 (incorporated by reference to Exhibit 10.32 to the Company’s Annual Report on Form 10-K for the year ended November 30, 2008). | |
| 10.21# | Form of Notice of Stock Option Grant (incorporated by reference to Exhibit 10.2 to the Company’s Quarterly Report on Form 10-Q for the quarter ended May 31, 2009). | |
| 10.22# | Amendment to Amended and Restated 2003 Employee Stock Purchase Plan (incorporated by reference to Exhibit 10.3 to the Company’s Quarterly Report on Form 10-Q for the quarter ended May 31, 2009). | |
| 10.23# | 2009 Executive Profit Sharing Plan (incorporated by reference to Exhibit 10.4 to the Company’s Quarterly Report on Form 10-Q for the quarter ended May 31, 2009). | |
| 10.24# | Form of Restricted Stock Award (Directors) (incorporated by reference to Exhibit 10.5 to the Company’s Quarterly Report on Form 10-Q for the quarter ended May 31, 2009). | |
| 10.25# | Form of Notice of Restricted Stock Unit Award (Performance Vesting) (incorporated by reference to Exhibit 10.1 to the Company’s Current Report on Form 8-K filed on November 4, 2010). | |
| 10.26 | Stock Purchase Agreement dated as of November 11, 2010, by and among the Registrant, SB Pacific Corporation Limited, a Hong Kong corporation and Marubeni Corporation, a Japanese corporation. | |
| 10.27 | Fourth Omnibus Amendment, dated as of January 11, 2010 (incorporated by reference to Exhibit 10.1 to the Company’s Current Report on Form 8-K filed on January 15, 2010). | |
| 10.28 | Fifth Amendment to Third Amended and Restated Receivables Sale and Servicing Agreement, dated as of January 23, 2009, among the Originator, the Servicer and SIT Funding Corporation (incorporated by reference to Exhibit 10.2 to the Company’s Current Report on Form 8-K filed on November 18, 2010). | |
| 21.1 | Subsidiaries of the Company. | |
| 23.1 | Consent of PricewaterhouseCoopers LLP, Independent Registered Public Accounting Firm. | |
| 24.1 | Power of Attorney (see page 116 of this Form 10-K). | |
| 31.1 | Rule 13a-14(a) Certification of Chief Executive Officer. | |
| 31.2 | Rule 13a-14(a) Certification of Chief Financial Officer. | |
| 32.1* | Statement of the Chief Executive Officer and Chief Financial Officer under Section 906 of the Sarbanes-Oxley Act of 2002 (18 U.S.C. Section 1350). | |
| # | Indicates management contract or compensatory plan or arrangement. |
| * | In accordance with Item 601(b)(32)(ii) of Regulation S-K and SEC Release Nos. 33-8238 and 34-47986, Final Rule: Management’s Reports on Internal Control Over Financial Reporting and Certification of Disclosure in Exchange Act Periodic Reports, the certifications furnished in Exhibit 32.1 hereto are deemed to accompany this Form 10-K and will not be deemed “filed” for purpose of Section 18 of the Exchange Act. Such certifications will not be deemed to be incorporated by reference into any filing under the Securities Act or the Exchange Act, except to the extent that the registrant specifically incorporates it by reference. |
(c) Financial Statement Schedules.
See Index under Item 8.
115
Table of Contents
SIGNATURES
Pursuant to the requirements of Section 13 or 15(d) of the Securities Exchange Act of 1934, the registrant has duly caused this report to be signed on its behalf by the undersigned, thereunto duly authorized.
Date: February 11, 2011
| SYNNEX CORPORATION | ||
| By: |
/S/ KEVIN M. MURAI | |
| Kevin M. Murai President and Chief Executive Officer | ||
POWER OF ATTORNEY
KNOW ALL MEN BY THESE PRESENTS, that each person whose signature appears below constitutes and appoints Kevin Murai and Thomas Alsborg, and each of them, his true and lawful attorneys-in-fact, each with full power of substitution, for him or her in any and all capacities, to sign any amendments to this report on Form 10-K and to file the same, with exhibits thereto and other documents in connection therewith, with the Securities and Exchange Commission, hereby ratifying and confirming all that each of said attorneys-in-fact or their substitute or substitutes may do or cause to be done by virtue hereof.
Pursuant to the requirements of the Securities Exchange Act of 1934, this report has been signed below by the following persons on behalf of the registrant and in the capacities and on the dates indicated.
| Name |
Title |
|||
| /s/ KEVIN M. MURAI Kevin M. Murai |
President and Chief Executive Officer (Principal Executive Officer) and Director | February 11, 2011 | ||
| /s/ THOMAS C. ALSBORG Thomas C. Alsborg |
Chief Financial Officer (Principal Financial and Principal Accounting Officer) | February 11, 2011 | ||
| /s/ DWIGHT A. STEFFENSEN Dwight A. Steffensen |
Chairman of the Board | February 11, 2011 | ||
| /s/ MATTHEW F.C. MIAU Matthew F.C. Miau |
Chairman Emeritus of the Board | February 11, 2011 | ||
| /s/ FRED A. BREIDENBACH Fred A. Breidenbach |
Director | February 11, 2011 | ||
| /s/ JAMES C. VAN HORNE James C. Van Horne |
Director | February 11, 2011 | ||
| /s/ GREGORY L. QUESNEL Gregory L. Quesnel |
Director | February 11, 2011 | ||
| /s/ ANDREA M. ZULBERTI Andrea M. Zulberti |
Director | February 11, 2011 | ||
| /s/ DUANE E. ZITZNER Duane E. Zitzner |
Director | February 11, 2011 | ||
116
Table of Contents
EXHIBIT INDEX
| Exhibit Number |
Description of Document | |
| 2.1 | Acquisition Agreement, dated March 27, 2007, by and among RGC Canada Ltd., Redmond Group of Companies LP, 2064862 Ontario Inc., AVS Technologies Limited Partnership and SYNNEX Canada Limited (incorporated by reference to Exhibit 2.1 to the Company’s Current Report on Form 8-K filed on October 10, 2007). | |
| 2.2 | Amending Agreement, dated April 30, 2007, by and among RGC Canada Ltd., Redmond Group of Companies LP, 2064862 Ontario Inc., AVS Technologies Limited Partnership and SYNNEX Canada Limited (incorporated by reference to Exhibit 2.2 to the Company’s Current Report on Form 8-K filed on October 10, 2007). | |
| 3(i).1 | Restated Certificate of Incorporation (incorporated by reference to Exhibit 3(i).3 to Amendment No. 1 to the Company’s Registration Statement on Form S-1 (File No. 333-108543)). | |
| 3(ii).2 | Amended and Restated Bylaws (incorporated by reference to Exhibit 3(ii).1 to the Company’s Current Report on Form 8-K filed on April 2, 2008). | |
| 4.1 | Form of Common Stock Certificate (incorporated by reference to the exhibit of the same number to Amendment No. 2 to the Company’s Registration Statement on Form S-1 (File No. 333-108543)). | |
| 4.2 | Indenture related to the 4.0% Convertible Senior Notes due 2018, dated as of May 12, 2008, between SYNNEX Corporation and U.S. Bank National Association, as trustee (including form of 4.0% Convertible Senior Note due 2018) (incorporated by reference to Exhibit 4.1 to the Company’s Current Report on Form 8-K filed on May 16, 2008). | |
| 10.1# | Amended and Restated 2003 Stock Incentive Plan and form of agreements thereunder (incorporated by reference to Exhibit 10.1 to the Company’s Quarterly Report on Form 10-Q for the quarter ended August 31, 2008). | |
| 10.2# | Amended and Restated 2003 Employee Stock Purchase Plan (incorporated by reference to Exhibit 10.2 to the Company’s Quarterly Report on Form 10-Q for the quarter ended August 31, 2008). | |
| 10.3# | Amendment to Amended and Restated 2003 Employee Stock Purchase Plan (incorporated by reference to Exhibit 10.2 to the Company’s Quarterly Report on Form 10-Q for the quarter ended August 31, 2008). | |
| 10.4 | Form of Indemnification Agreement between the Company and its officers and directors (incorporated by reference to Exhibit 10.6 to the Company’s Registration Statement on Form S-1 (File No. 333-108543)). | |
| 10.5 | Registration Rights Agreement dated as of July 1, 2002 (incorporated by reference to Exhibit 10.7 to the Company’s Registration Statement on Form S-1 (File No. 333-108543)). | |
| 10.6# | Form of Change of Control Severance Plan (incorporated by reference to Exhibit 10.13 to Amendment No. 1 to the Company’s Registration Statement on Form S-1 (File No. 333-108543)). | |
| 10.7 | HP U.S. Business Development Partner Agreement dated November 6, 2003, between the Company and Hewlett-Packard Company (incorporated by reference to Exhibit 10.14 to Amendment No. 2 to the Company’s Registration Statement on Form S-1 (File No. 333-108543)). | |
| 10.8 | Master External Manufacturing Agreement, dated August 28, 1999, by and among the Company, MiTAC International Corporation and Sun Microsystems, Inc., including amendments thereto (incorporated by reference to Exhibit 10.15 to Amendment No. 2 to the Company’s Registration Statement on Form S-1 (File No. 333-108543)). | |
| 10.9 | Joint Sales and Marketing Agreement, dated May 6, 2002, between the Company and MiTAC International Corporation (incorporated by reference to Exhibit 10.16 to Amendment No. 2 to the Company’s Registration Statement on Form S-1 (File No. 333-108543)). | |
117
Table of Contents
| Exhibit Number |
Description of Document | |
| 10.10 | Master Agreement and Plan of Reorganization among the Company, SYNNEX, K.K. and MCJ Co., Ltd. dated March 29, 2005 (incorporated by reference to Exhibit 10.2 to the Company’s Quarterly Report on Form 10-Q for the quarter ended May 31, 2005). | |
| 10.11# | Settlement and Release, dated March 24, 2009, by and between SYNNEX Canada Limited and Jim Estill (incorporated by reference to Exhibit 10.1 to the Company’s Quarterly Report in Form 10-Q for the quarter ended May 31, 2009). | |
| 10.12 | Fourth Amended and Restated Credit Agreement, dated as of November 12, 2010, by and among the Company, the lenders signatories thereto from time to time, and Bank of America, N.A. (incorporated by reference to Exhibit 10.1 to the Company’s Current Report in Form 8-K filed on November 18, 2010). | |
| 10.13 | Third Amended and Restated Receivables Sale and Servicing Agreement, dated as of January 23, 2009, among the Originator, the Servicer and SIT Funding Corporation (incorporated by reference to Exhibit 10.34 to the Company’s Annual Report in Form 10-K for the year ended November 30, 2008). | |
| 10.14 | Fourth Amended and Restated Receivables Funding and Administration Agreement, dated as November 12, 2010, among SIT Funding Corporation, the lenders party thereto and The Bank of Nova Scotia (incorporated by reference to Exhibit 10.3 to the Company’s Current Report in Form 8-K filed on November 18, 2010). | |
| 10.15# | Offer Letter, dated as of March 23, 2007, between Thomas C. Alsborg and the Company (incorporated by reference to Exhibit 10.1 to the Company’s Current Report filed on Form 8-K on March 28, 2007). | |
| 10.16# | Amendment to SYNNEX Corporation Change of Control Severance Plan (incorporated by reference to Exhibit 10.21 to the Company’s Annual Report on Form 10-K for the fiscal year ended November 30, 2007). | |
| 10.17# | SYNNEX Corporation Deferred Compensation Plan, as amended and restated effective January 1, 2005 (incorporated by reference to Exhibit 10.22 to the Company’s Annual Report on Form 10-K for the fiscal year ended November 30, 2007). | |
| 10.18# | Offer Letter, dated as of March 27, 2008, by and between the Company and Kevin Murai (incorporated by reference to Exhibit 10.1 to the Company’s Current Report on Form 8-K filed on April 2, 2008). | |
| 10.19 | First Amendment to Asset Purchase Agreement dated March 31, 2008, by and among the Company and New Age Electronics, Inc., a California corporation (incorporated by reference to Exhibit 10.4 to the Company’s Quarterly Report on Form 10-Q for the quarter ended February 29, 2008). | |
| 10.20# | Amendment to the Amended and Restated 2003 Stock Incentive Plan, dated November 21, 2008 (incorporated by reference to Exhibit 10.32 to the Company’s Annual Report on Form 10-K for the year ended November 30, 2008). | |
| 10.21# | Form of Notice of Stock Option Grant (incorporated by reference to Exhibit 10.2 to the Company’s Quarterly Report on Form 10-Q for the quarter ended May 31, 2009). | |
| 10.22# | Amendment to Amended and Restated 2003 Employee Stock Purchase Plan (incorporated by reference to Exhibit 10.3 to the Company’s Quarterly Report on Form 10-Q for the quarter ended May 31, 2009). | |
| 10.23# | 2009 Executive Profit Sharing Plan (incorporated by reference to Exhibit 10.4 to the Company’s Quarterly Report on Form 10-Q for the quarter ended May 31, 2009). | |
| 10.24# | Form of Restricted Stock Award (Directors) (incorporated by reference to Exhibit 10.5 to the Company’s Quarterly Report on Form 10-Q for the quarter ended May 31, 2009). | |
118
Table of Contents
| Exhibit Number |
Description of Document | |
| 10.25# | Form of Notice of Restricted Stock Unit Award (Performance Vesting) (incorporated by reference to Exhibit 10.1 to the Company’s Current Report on Form 8-K filed on November 4, 2010). | |
| 10.26 | Stock Purchase Agreement dated as of November 11, 2010, by and among the Registrant, SB Pacific Corporation Limited, a Hong Kong corporation and Marubeni Corporation, a Japanese corporation. | |
| 10.27 | Fourth Omnibus Amendment, dated as of January 11, 2010 (incorporated by reference to Exhibit 10.1 to the Company’s Current Report on Form 8-K filed on January 15, 2010). | |
| 10.28 | Fifth Amendment to Third Amended and Restated Receivables Sale and Servicing Agreement, dated as of January 23, 2009, among the Originator, the Servicer and SIT Funding Corporation (incorporated by reference to Exhibit 10.2 to the Company’s Current Report on Form 8-K filed on November 18, 2010). | |
| 21.1 | Subsidiaries of the Company. | |
| 23.1 | Consent of PricewaterhouseCoopers LLP, Independent Registered Public Accounting Firm. | |
| 24.1 | Power of Attorney (see page 116 of this Form 10-K). | |
| 31.1 | Rule 13a-14(a) Certification of Chief Executive Officer. | |
| 31.2 | Rule 13a-14(a) Certification of Chief Financial Officer. | |
| 32.1* | Statement of the Chief Executive Officer and Chief Financial Officer under Section 906 of the Sarbanes-Oxley Act of 2002 (18 U.S.C. Section 1350). | |
| # | Indicates management contract or compensatory plan or arrangement. |
| * | In accordance with Item 601(b)(32)(ii) of Regulation S-K and SEC Release Nos. 33-8238 and 34-47986, Final Rule: Management’s Reports on Internal Control Over Financial Reporting and Certification of Disclosure in Exchange Act Periodic Reports, the certifications furnished in Exhibit 32.1 hereto are deemed to accompany this Form 10-K and will not be deemed “filed” for purpose of Section 18 of the Exchange Act. Such certifications will not be deemed to be incorporated by reference into any filing under the Securities Act or the Exchange Act, except to the extent that the registrant specifically incorporates it by reference. |
119