Attached files
| file | filename |
|---|---|
| 8-K - FORM 8-K - MACKINAC FINANCIAL CORP /MI/ | k50060e8vk.htm |
Exhibit 99

PRESS RELEASE
For Release February 11, 2011
Contact: Investor Relations
(888) 343-8147
Website: www.bankmbank.com
Contact: Investor Relations
(888) 343-8147
Website: www.bankmbank.com
Mackinac Financial Corporation Announces
2010 Results of Operations/Asset quality
2010 Results of Operations/Asset quality
(Manistique, Michigan) — Mackinac Financial Corporation (Nasdaq: MFNC), the holding company
for mBank, reported a loss of $1.160 million or $.34 per share, for the year ended December 31,
2010, compared to a net income of $1.907 million, or $.56 per share, for 2009. Weighted average
shares outstanding for both years amounted to 3,419,736.
The loss to the Corporation this year was primarily the result of credit charges and write-downs on
an isolated pocket of older loans and pieces of other real estate owned located primarily in
Southeast Michigan. The company took an aggressive workout posture throughout 2010 to move these
assets out of the bank to eliminate on-going carrying costs and administrative expenses.
Earnings Analysis
| 2010 | 2009 | 2008 | ||||||||||
Income before tax and preferred dividends, as reported: |
$ | (3,917 | ) | $ | 3,536 | $ | 2,659 | |||||
Credit related costs: |
||||||||||||
Loan loss provision |
6,500 | 3,700 | 2,300 | |||||||||
OREO write-downs/gains and losses |
2,753 | 208 | (80 | ) | ||||||||
Noncore income: |
||||||||||||
Security gains |
215 | 1,471 | 64 | |||||||||
Gain on sale of branch offices |
— | 1,208 | — | |||||||||
“Adjusted” income before taxes and preferred dividends
(Excluding items, noted above) |
$ | 5,121 | $ | 4,765 | $ | 4,815 | ||||||
As you will note from the chart above, the company’s “core earnings” run rate outside of
extraordinary credit related charges and other one-time items has improved as the result of lowered
funding costs from the significant growth in our core deposit base, control of non-interest
expenses, and increases in non-interest income from our SBA/USDA lending programs
and secondary
market 1-4 family loan sales. It should be noted that the subsidiary bank posted a small profit for
the year of approximately $83,000.
Paul Tobias, Chairman of MFNC, commenting on the overall results for 2010, stated, “During 2010 we
recognized the losses associated with a few large credits, booked prior to the recession, that were
well secured at the time of loan origination but suffered from operating models that could not
withstand the severe recession and the deterioration of collateral values in Southeastern Michigan.
Despite the challenging times, we have made significant progress to increase our franchise value.
Our remaining portfolio continues to perform satisfactorily and asset quality matrices continue to
outperform peers. We are confident that credit related expenses will decrease in 2011 and return to
normal levels in 2012.”
Listed below are several key points relative to our 2010 results:
| • | We grew core bank deposits by $80 million. This reduced our reliance on wholesale deposits by $115.4 million, reducing balance sheet risk. We experienced core deposit growth in all of our markets, with $40 million in Northern Lower Michigan, $11 million in Southeast Michigan and $29 million in the Upper Peninsula. Most of our 2010 deposit growth occurred in low cost transactional accounts which grew by $44 million. | ||
| • | We continued to experience good loan demand with approximately $114 million of new loan production. At 2010 year-end, the Corporation’s loans stood at $383.086 million, a slight decrease from the 2009 year-end balances of $384.310 million. Our total outstanding loans declined by $1.2 million after reductions for loan sales, (both SBA/USDA and secondary market) amortization and payoffs, some associated with the elimination of problem assets. We continue to be highly successful in producing well priced high quality loans in the Upper Peninsula with 2010 loan production of $81 million. Loan production totaled $22 million in Northern Lower Michigan and $11 million in Southeast Michigan where the market have been hit the hardest by the recession. | ||
| • | In 2010 we had continued success in the origination and sales of SBA/USDA loans with total fee income of $.9 million in 2010 compared to $.5 million in fee income during 2009. We continue to be a state leader in these programs. | ||
| • | One of our initiatives for 2010 was the expansion of our consumer lending program by hiring several key mortgage loan producers and the centralization of our consumer lending processing. This was successful, with secondary market fee income of $.5 million in 2010 compared to $.3 million in 2009 and an increase in total consumer loan production from $39 million in 2009 to $60 million in 2010. We also have retained the servicing of approximately $27 million of mortgage loans which provides future refinancing opportunities and is a source of core deposits. | ||
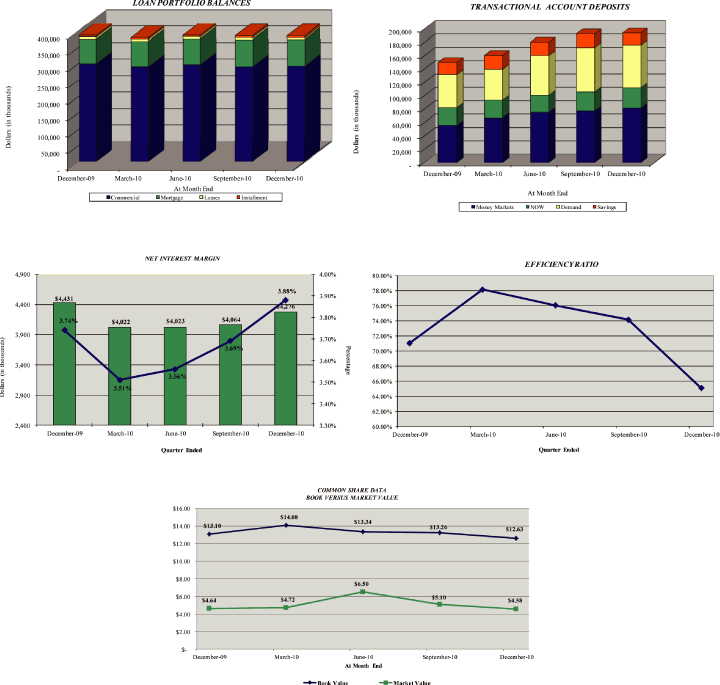
| • | We improved our net interest margin from 3.74% in the fourth quarter of 2009 to 3.88% in 2010’s fourth quarter. Given our current funding structure, we expect to see this improve throughout 2011 as well. |
2
| • | We had an overall reduction in nonperforming assets from $21.0 million at the end of 2009 to $16.1 million at the end of 2010. As noted above, the resolution of problem assets during 2010 impacted our earnings but we divested these problem loans and OREO properties so that we could eliminate holding costs and forego the opportunity cost that impacts longer-term shareholder value creation. |
Total assets of the Corporation at December 31, 2010 were $478.696 million, a decrease of $36.681
million from 2009 year end assets of $515.377 million. The decline in assets was largely attributed
to a reduction in excess liquidity which was used to pay off maturing wholesale deposits. Total
deposits decreased from $421.389 million at the end of 2009 to $386.778 million at 2010 year end.
Kelly W. George, President and Chief Executive Officer of mBank, commenting on the deposit growth,
“We continue to focus our efforts on growing the Bank’s core deposits because we believe this
translates into real franchise value and improves our overall balance sheet risk. As noted above,
in 2010, we were extremely successful in growing bank deposits in all of our markets, and this will
continue to be a primary objective of the 2011 business plan as well.”
Nonperforming assets decreased by $4.9 million, from $21.0 million at 2009 year end to $16.1
million at year end 2010. Nonperforming loans totaled $10.6 million, or 2.76% of total loans at
December 31, 2010. Nonaccrual loans now reside at 1.55%, a reduction from 3.74% at year-end 2009.
Nonperforming assets at December 31, 2010 represented 3.37% of total assets, compared to 4.08% of
total assets at December 31, 2009. Kelly W. George commented, “Our current level of nonperforming
assets, while still below peers and manageable with a Texas Ratio of 27%, continues to provide some
challenges given the time needed in terms of real estate holding periods to work through these
issues. Most of these assets are secured with some form of property and reside in areas of the
state that were hit the hardest in terms of the recession. We have updated evaluations on all our
remaining OREO pieces and larger problem assets and will continue to focus on early identification
and resolution to minimize carrying costs, collateral deterioration and incremental loss.”
Net interest income for the year ended December 31, 2010 was $16.385 million compared to $16.287
million for the year ended December 31, 2009. The margin percentage for 2010 was 3.66% compared to
3.59% in 2009.
We recognize the importance of cost control, especially in times of economic slowdown. In 2010 our
total noninterest expense was $16.597 million compared to $13.802 million in 2009. The increase in
2010 was primarily attributable to costs associated with higher levels of nonperforming assets. As
stated previously, OREO write-downs totaled $2.753 million in 2010 compared to $.208 million in
2009, an increase of $2.545 million.
Shareholders’ equity totaled $53.882 million at December 31, 2010, compared to $55.299 million at
the end of 2009, a decrease of $1.417 million. This decrease includes the consolidated net loss of
$1.160 million, the capital contribution impact of stock options and amortization of preferred
stock issue costs along with the decrease in equity due to the decline in the market value of
held-for-sale investments, which amounted to $.5 million.
3
The capital position remains strong at the Corporation with a Tier 1 ratio of 9.25% and Total Risk
Based Capital of 12.62%. The Bank is also well capitalized with a Tier 1 ratio of 8.09% and Total
Risk Based Capital of 11.18%.
Mr. Tobias concluded, “As we enter 2011, we are focusing on organic growth. We will continue to be
granular and selective in our lending activities, focusing on SBA/USDA loans. We will continue to
grow core deposits and control expenses. We are confident that as 2011 evolves we will show
continuous improvement and by 2012 show increased earnings potential of this franchise. We are
proud that we have been able to build shareholders equity to $12.63 per share and are eager to
build an earnings record that will allow our stock to reflect its intrinsic value”
Mackinac Financial Corporation is a registered bank holding company formed under the Bank Holding
Company Act of 1956 with assets in excess of $450 million and whose common stock is traded on the
NASDAQ stock market as “MFNC.” The principal subsidiary of the Corporation is mBank.
Headquartered in Manistique, Michigan, mBank has 11 branch locations; seven in the Upper Peninsula,
three in the Northern Lower Peninsula and one in Oakland County, Michigan. The Company’s banking
services include commercial lending and treasury management products and services geared toward
small to mid-sized businesses, as well as a full array of personal and business deposit products
and consumer loans.
Forward-Looking Statements
This release contains certain forward-looking statements. Words such as “anticipates,” “believes,”
“estimates,” “expects,” “intends,” “should,” “will,” and variations of such words and similar
expressions are intended to identify forward-looking statements: as defined by the Private
Securities Litigation Reform Act of 1995. These statements reflect management’s current beliefs as
to expected outcomes of future events and are not guarantees of future performance. These
statements involve certain risks, uncertainties and assumptions that are difficult to predict with
regard to timing, extent, likelihood, and degree of occurrence. Therefore, actual results and
outcomes may materially differ from what may be expressed or forecasted in such forward-looking
statements. Factors that could cause a difference include among others: changes in the national
and local economies or market conditions; changes in interest rates and banking regulations; the
impact of competition from traditional or new sources; and the possibility that anticipated cost
savings and revenue enhancements from mergers and acquisitions, bank consolidations, branch
closings and other sources may not be fully realized at all or within specified time frames as well
as other risks and uncertainties including but not limited to those detailed from time to time in
filings of the Company with the Securities and Exchange Commission. These and other factors may
cause decisions and actual results to differ materially from current expectations. Mackinac
Financial Corporation undertakes no obligation to revise, update, or clarify forward-looking
statements to reflect events or conditions after the date of this release.
4
MACKINAC FINANCIAL CORPORATION AND SUBSIDIARIES
SELECTED FINANCIAL HIGHLIGHTS
SELECTED FINANCIAL HIGHLIGHTS
| For The Years Ended December 31, | ||||||||
| (Dollars in thousands, except per share data) | 2010 | 2009 | ||||||
| (Unaudited) | (Unaudited) | |||||||
Selected Financial Condition Data (at end of period): |
||||||||
Assets |
$ | 478,696 | $ | 515,377 | ||||
Loans |
383,086 | 384,310 | ||||||
Investment securities |
33,860 | 46,513 | ||||||
Deposits |
386,779 | 421,389 | ||||||
Borrowings |
36,069 | 36,140 | ||||||
Shareholders’ equity |
53,882 | 55,299 | ||||||
Selected Statements of Income Data: |
||||||||
Net interest income |
$ | 16,385 | $ | 16,287 | ||||
Income before taxes and preferred dividend |
(3,917 | ) | 3,536 | |||||
Net income |
(1,160 | ) | 1,907 | |||||
Income per common share — Basic |
(.34 | ) | .56 | |||||
Income per common share — Diluted |
(.34 | ) | .56 | |||||
Weighted average shares outstanding |
3,419,736 | 3,419,736 | ||||||
Selected Financial Ratios and Other Data: |
||||||||
Performance Ratios: |
||||||||
Net interest margin |
3.66 | % | 3.59 | % | ||||
Efficiency ratio |
72.57 | 72.24 | ||||||
Return on average assets |
(.23 | ) | .39 | |||||
Return on average equity |
(2.06 | ) | 3.77 | |||||
Average total assets |
$ | 502,993 | $ | 493,652 | ||||
Average total shareholders’ equity |
56,171 | 50,531 | ||||||
Average loans to average deposits ratio |
94.36 | % | 92.99 | % | ||||
Common Share Data at end of period: |
||||||||
Market price per common share |
$ | 4.58 | $ | 4.64 | ||||
Book value per common share |
$ | 12.63 | $ | 13.10 | ||||
Common shares outstanding |
3,419,736 | 3,419,736 | ||||||
Other Data at end of period: |
||||||||
Allowance for loan losses |
$ | 6,613 | $ | 5,225 | ||||
Non-performing assets |
$ | 16,125 | $ | 21,041 | ||||
Allowance for loan losses to total loans |
1.73 | % | 1.36 | % | ||||
Non-performing assets to total assets |
3.37 | % | 4.08 | % | ||||
Texas ratio |
26.66 | % | 34.77 | % | ||||
Number of: |
||||||||
Branch locations |
11 | 10 | ||||||
FTE Employees |
110 | 100 | ||||||
5
MACKINAC FINANCIAL CORPORATION AND SUBSIDIARIES
CONSOLIDATED BALANCE SHEETS
| December 31, | December 31, | |||||||
| (Dollars in thousands) | 2010 | 2009 | ||||||
| (Unaudited) | (Audited) | |||||||
ASSETS |
||||||||
Cash and due from banks |
$ | 22,719 | $ | 18,433 | ||||
Federal funds sold |
12,000 | 27,000 | ||||||
Cash and cash equivalents |
34,719 | 45,433 | ||||||
Interest-bearing deposits in other financial institutions |
713 | 678 | ||||||
Securities available for sale |
33,860 | 46,513 | ||||||
Federal Home Loan Bank stock |
3,423 | 3,794 | ||||||
Loans: |
||||||||
Commercial |
308,677 | 305,670 | ||||||
Mortgage |
68,473 | 74,350 | ||||||
Installment |
5,936 | 4,290 | ||||||
Total Loans |
383,086 | 384,310 | ||||||
Allowance for loan losses |
(6,613 | ) | (5,225 | ) | ||||
Net loans |
376,473 | 379,085 | ||||||
Premises and equipment |
9,660 | 10,165 | ||||||
Other real estate held for sale |
5,562 | 5,804 | ||||||
Other assets |
14,286 | 23,905 | ||||||
TOTAL ASSETS |
$ | 478,696 | $ | 515,377 | ||||
LIABILITIES AND SHAREHOLDERS’ EQUITY |
||||||||
Liabilities: |
||||||||
Non-interest-bearing deposits |
$ | 41,264 | $ | 35,878 | ||||
Interest-bearing deposits: |
||||||||
NOW, Money Market, Checking |
134,703 | 95,790 | ||||||
Savings |
17,670 | 18,207 | ||||||
CDs<$100,000 |
96,976 | 59,953 | ||||||
CDs>$100,000 |
22,698 | 36,385 | ||||||
Brokered |
73,467 | 175,176 | ||||||
Total deposits |
386,778 | 421,389 | ||||||
Borrowings: |
||||||||
Federal funds purchased |
— | — | ||||||
Short-term |
20,000 | 15,000 | ||||||
Long-term |
16,069 | 21,140 | ||||||
Total borrowings |
36,069 | 36,140 | ||||||
Other liabilities |
1,967 | 2,549 | ||||||
Total liabilities |
424,814 | 460,078 | ||||||
Shareholders’ equity: |
||||||||
Preferred stock — No par value: |
||||||||
Authorized 500,000 shares, no shares outstanding |
10,706 | 10,514 | ||||||
Common stock and additional paid in capital — No par value |
||||||||
Authorized - 18,000,000 shares |
||||||||
Issued and outstanding — 3,419,736 shares |
43,525 | 43,493 | ||||||
Accumulated deficit |
(961 | ) | 199 | |||||
Accumulated other comprehensive income (loss) |
612 | 1,093 | ||||||
Total shareholders’ equity |
53,882 | 55,299 | ||||||
TOTAL LIABILITIES AND SHAREHOLDERS’ EQUITY |
$ | 478,696 | $ | 515,377 | ||||
6
MACKINAC FINANCIAL CORPORATION AND SUBSIDIARIES
CONSOLIDATED STATEMENTS OF OPERATIONS
| For The Years Ended December 31, | ||||||||||||
| (Dollars in thousands, except per share data) | 2010 | 2009 | 2008 | |||||||||
| (Unaudited) | (Audited) | (Audited) | ||||||||||
INTEREST INCOME: |
||||||||||||
Interest and fees on loans: |
||||||||||||
Taxable |
$ | 21,091 | $ | 20,521 | $ | 22,555 | ||||||
Tax-exempt |
188 | 292 | 404 | |||||||||
Interest on securities: |
||||||||||||
Taxable |
1,406 | 2,783 | 1,293 | |||||||||
Tax-exempt |
28 | 19 | 5 | |||||||||
Other interest income |
127 | 93 | 305 | |||||||||
Total interest income |
22,840 | 23,708 | 24,562 | |||||||||
INTEREST EXPENSE: |
||||||||||||
Deposits |
5,607 | 6,431 | 10,115 | |||||||||
Borrowings |
848 | 990 | 1,583 | |||||||||
Total interest expense |
6,455 | 7,421 | 11,698 | |||||||||
Net interest income |
16,385 | 16,287 | 12,864 | |||||||||
Provision for loan losses |
6,500 | 3,700 | 2,300 | |||||||||
Net interest income after provision for loan losses |
9,885 | 12,587 | 10,564 | |||||||||
OTHER INCOME: |
||||||||||||
Service fees |
990 | 1,023 | 838 | |||||||||
Net security gains |
215 | 1,471 | 64 | |||||||||
Net gains on sale of secondary market loans |
1,407 | 830 | 120 | |||||||||
Proceeds from settlement of lawsuits |
— | — | 3,475 | |||||||||
Other |
183 | 1,427 | 156 | |||||||||
Total other income |
2,795 | 4,751 | 4,653 | |||||||||
OTHER EXPENSES: |
||||||||||||
Salaries and employee benefits |
6,918 | 6,583 | 6,886 | |||||||||
Occupancy |
1,313 | 1,385 | 1,374 | |||||||||
Furniture and equipment |
806 | 805 | 771 | |||||||||
Data processing |
740 | 862 | 844 | |||||||||
Professional service fees |
627 | 603 | 508 | |||||||||
Loan and deposit |
4,620 | 1,793 | 489 | |||||||||
Telephone |
193 | 187 | 170 | |||||||||
Advertising |
297 | 322 | 305 | |||||||||
Other |
1,084 | 1,262 | 1,211 | |||||||||
Total other expenses |
16,598 | 13,802 | 12,558 | |||||||||
Income before provision for income taxes |
(3,918 | ) | 3,536 | 2,659 | ||||||||
Provision for (benefit of) income taxes |
(3,500 | ) | 1,120 | 787 | ||||||||
NET INCOME |
$ | (418 | ) | $ | 2,416 | $ | 1,872 | |||||
Preferred dividend expense |
742 | 509 | — | |||||||||
NET INCOME AVAILABLE TO COMMON SHAREHOLDERS |
$ | (1,160 | ) | $ | 1,907 | $ | 1,872 | |||||
INCOME PER COMMON SHARE |
||||||||||||
Basic |
$ | (0.34 | ) | $ | .56 | $ | .55 | |||||
Diluted |
$ | (0.34 | ) | $ | .56 | $ | .55 | |||||
7
MACKINAC FINANCIAL CORPORATION AND SUBSIDIARIES
LOAN PORTFOLIO AND CREDIT QUALITY
LOAN PORTFOLIO AND CREDIT QUALITY
(Dollars in thousands)
Loan Portfolio Balances (at end of period):
| December 31, | December 31, | |||||||
| 2010 | 2009 | |||||||
| (Unaudited) | (Audited) | |||||||
Commercial Loans: |
||||||||
Real estate — operators of nonresidential
buildings |
$ | 58,114 | $ | 48,689 | ||||
Hospitality and tourism |
37,737 | 45,315 | ||||||
Operators of nonresidential buildings |
16,598 | 12,619 | ||||||
Real estate agents and managers |
15,857 | 24,242 | ||||||
Other |
135,411 | 150,214 | ||||||
Total Commercial Loans |
263,717 | 281,079 | ||||||
1-4 family residential real estate |
75,074 | 67,232 | ||||||
Consumer |
5,283 | 4,290 | ||||||
Construction |
||||||||
Commercial |
33,330 | 24,591 | ||||||
Consumer |
5,682 | 7,118 | ||||||
Total Loans |
$ | 383,086 | $ | 384,310 | ||||
Credit Quality (at end of period):
| December 31, | December 31, | |||||||
| 2010 | 2009 | |||||||
| (Unaudited) | (Audited) | |||||||
Nonperforming Assets : |
||||||||
Nonaccrual loans |
$ | 5,921 | $ | 14,368 | ||||
Loans past due 90 days or more |
— | — | ||||||
Restructured loans |
4,642 | 869 | ||||||
Total nonperforming loans |
10,563 | 15,237 | ||||||
Other real estate owned |
5,562 | 5,804 | ||||||
Total nonperforming assets |
$ | 16,125 | $ | 21,041 | ||||
Nonperforming loans as a % of loans |
2.76 | % | 3.96 | % | ||||
Nonperforming assets as a % of assets |
3.37 | % | 4.08 | % | ||||
Reserve for Loan Losses: |
||||||||
At period end |
$ | 6,613 | $ | 5,225 | ||||
As a % of average loans |
1.72 | % | 1.39 | % | ||||
As a % of nonperforming loans |
62.61 | % | 34.29 | % | ||||
As a % of nonaccrual loans |
111.69 | % | 36.37 | % | ||||
Texas Ratio |
26.66 | % | 34.77 | % | ||||
Charge-off Information (year to
date): |
||||||||
Average loans |
$ | 384,347 | $ | 374,796 | ||||
Net charge-offs |
$ | 5,112 | $ | 2,752 | ||||
Charge-offs as a % of average loans |
1.33 | % | .73 | % | ||||
8
MACKINAC FINANCIAL CORPORATION
QUARTERLY OVERVIEW
QUARTERLY OVERVIEW
| QUARTER ENDED | ||||||||||||||||||||
| (Unaudited) | ||||||||||||||||||||
| December 31, | September 30, | June 30, | March 31, | December 31, | ||||||||||||||||
| 2010 | 2010 | 2010 | 2010 | 2009 | ||||||||||||||||
BALANCE SHEET (Dollars in thousands) |
||||||||||||||||||||
Total loans |
$ | 383,086 | $ | 382,727 | $ | 384,839 | $ | 377,311 | $ | 384,310 | ||||||||||
Allowance for loan losses |
(6,613 | ) | (5,437 | ) | (6,371 | ) | (4,737 | ) | (5,225 | ) | ||||||||||
Total loans, net |
376,473 | 377,290 | 378,468 | 372,574 | 379,085 | |||||||||||||||
Intangible assets |
— | — | — | — | — | |||||||||||||||
Total assets |
478,696 | 499,006 | 500,774 | 502,427 | 515,377 | |||||||||||||||
Core deposits |
290,614 | 287,055 | 271,026 | 236,227 | 209,828 | |||||||||||||||
Noncore deposits (1) |
96,165 | 117,469 | 134,758 | 168,985 | 211,561 | |||||||||||||||
Total deposits |
386,779 | 404,524 | 405,784 | 405,212 | 421,389 | |||||||||||||||
Total borrowings |
36,069 | 36,069 | 36,140 | 36,140 | 36,140 | |||||||||||||||
Total shareholders’ equity |
53,882 | 55,987 | 56,231 | 58,722 | 55,299 | |||||||||||||||
Total shares outstanding |
3,419,736 | 3,419,736 | 3,419,736 | 3,419,736 | 3,419,736 | |||||||||||||||
AVERAGE BALANCES (Dollars in
thousands) |
||||||||||||||||||||
Assets |
$ | 488,320 | $ | 512,335 | $ | 502,942 | $ | 508,495 | $ | 514,102 | ||||||||||
Loans |
385,296 | 385,268 | 382,169 | 384,640 | 386,203 | |||||||||||||||
Deposits |
393,266 | 416,847 | 405,449 | 413,897 | 418,280 | |||||||||||||||
Equity |
55,015 | 56,668 | 57,889 | 55,109 | 55,665 | |||||||||||||||
INCOME STATEMENT (Dollars in
thousands) |
||||||||||||||||||||
Net interest income |
$ | 4,276 | $ | 4,064 | $ | 4,023 | $ | 4,022 | $ | 4,431 | ||||||||||
Provision for loan losses |
1,800 | 1,000 | 2,800 | 900 | 2,300 | |||||||||||||||
Net interest income after
provision |
2,476 | 3,064 | 1,223 | 3,122 | 2,131 | |||||||||||||||
Total noninterest income |
747 | 648 | 593 | 807 | 1,503 | |||||||||||||||
Total noninterest expense |
4,037 | 3,601 | 5,330 | 3,629 | 3,650 | |||||||||||||||
Income before taxes |
(814 | ) | 111 | (3,514 | ) | 300 | (16 | ) | ||||||||||||
Provision for income taxes |
1,093 | 30 | (1,212 | ) | (3,411 | ) | (22 | ) | ||||||||||||
Net income |
(1,907 | ) | 81 | (2,302 | ) | 3,711 | 6 | |||||||||||||
Preferred dividend expense |
185 | 185 | 186 | 185 | 186 | |||||||||||||||
Net income available to common
shareholders |
$ | (2,092 | ) | $ | (104 | ) | $ | (2,488 | ) | $ | 3,526 | $ | (180 | ) | ||||||
PER SHARE DATA |
||||||||||||||||||||
Earnings |
$ | (.61 | ) | $ | (.03 | ) | $ | (.73 | ) | $ | 1.03 | $ | (.05 | ) | ||||||
Book value per common share |
12.63 | 13.26 | 13.34 | 14.08 | 13.10 | |||||||||||||||
Market value, closing price |
4.58 | 5.10 | 6.50 | 4.72 | 4.64 | |||||||||||||||
ASSET QUALITY RATIOS |
||||||||||||||||||||
Nonperforming loans/total loans |
2.76 | % | 2.94 | % | 2.87 | % | 2.62 | % | 3.96 | % | ||||||||||
Nonperforming assets/total
assets |
3.37 | 3.41 | 3.34 | 3.51 | 4.08 | |||||||||||||||
Allowance for loan
losses/total loans |
1.73 | 1.42 | 1.66 | 1.26 | 1.36 | |||||||||||||||
Allowance for loan
losses/nonperforming loans |
62.61 | 48.34 | 57.69 | 47.87 | 34.29 | |||||||||||||||
Texas ratio (2) |
26.66 | 27.68 | 26.71 | 27.76 | 34.77 | |||||||||||||||
PROFITABILITY RATIOS |
||||||||||||||||||||
Return on average assets |
(1.70 | )% | (.08 | )% | (1.98 | )% | 2.81 | % | (.14 | )% | ||||||||||
Return on average equity |
(15.09 | ) | (0.73 | ) | (17.24 | ) | 25.95 | (1.28 | ) | |||||||||||
Net interest margin |
3.88 | 3.69 | 3.56 | 3.51 | 3.74 | |||||||||||||||
Efficiency ratio |
65.05 | 75.98 | 76.04 | 78.12 | 71.03 | |||||||||||||||
Average loans/average deposits |
97.97 | 92.42 | 94.26 | 92.93 | 92.33 | |||||||||||||||
CAPITAL ADEQUACY RATIOS |
||||||||||||||||||||
Tier 1 leverage ratio |
9.25 | % | 9.22 | % | 9.38 | % | 9.85 | % | 9.75 | % | ||||||||||
Tier 1 capital to risk
weighted assets |
11.36 | 11.73 | 11.65 | 12.48 | 11.92 | |||||||||||||||
Total capital to risk weighted
assets |
12.62 | 12.98 | 12.91 | 13.69 | 13.17 | |||||||||||||||
Average equity/average assets |
11.27 | 11.06 | 11.51 | 10.84 | 10.83 | |||||||||||||||
Tangible equity/tangible assets |
11.27 | 11.06 | 11.51 | 10.84 | 10.83 | |||||||||||||||
| (1) | Noncore deposits includesInternet CDs, brokered deposits and CDs greater than $100,000 | |
| (2) | Texas ratio equals nonperforming assets divided by shareholders’ equity plus allowance for loan losses |
9
MACKINAC FINANCIAL CORPORATION
QUARTERLY OVERVIEW
QUARTERLY OVERVIEW
10