Attached files
| file | filename |
|---|---|
| 8-K - 8-K - FAIRPOINT COMMUNICATIONS INC | a11-5790_18k.htm |
Exhibit 99.1
|
|
FairPoint Communications, Inc. Company Introduction February 2011 |
|
|
Cautionary Notes 2 The information contained herein is current only as of the date hereof. The business, prospects, financial condition or performance of FairPoint Communications, Inc. (“FairPoint”) and its subsidiaries described herein may have changed since that date. FairPoint does not intend to update or otherwise revise the information contained herein. FairPoint makes no representation or warranty, express or implied, as to the completeness of the information contained herein. If any other information is given or any other representations are made, they should not be relied upon as having been authorized by FairPoint. Market data used throughout this presentation is based on surveys and studies conducted by third parties, as well as industry and general publications. FairPoint has no obligation (express or implied) to update any or all of the information or to advise you of any changes; nor does FairPoint make any express or implied warranties or representations as to the completeness or accuracy or accept responsibility for errors. Some statements herein are known as “forward-looking statements” within the meaning of Section 27A of the Securities Act of 1933, as amended, and Section 21E of the Securities Exchange Act of 1934, as amended. These forward-looking statements include, but are not limited to, statements about our plans, objectives, expectations and intentions and other statements contained herein that are not historical facts. When used herein, the words “expects,” “anticipates,” “intends,” “plans,” “believes,” “seeks,” “estimates” and similar expressions are generally intended to identify forward looking statements. Because these forward-looking statements involve known and unknown risks and uncertainties, there are important factors that could cause actual results, events or developments to differ materially from those expressed or implied by these forward-looking statements, including our plans, objectives, expectations and intentions and other factors. You should not place undue reliance on such forward-looking statements, which are based on the information currently available to us and speak only as of the date hereof. FairPoint does not undertake any obligation to publicly update or revise any forward-looking statements, whether as a result of new information, future events or otherwise. Certain information contained herein is guidance as to projected financial results and our future performance that represents our management’s estimates as of the date hereof. This guidance, which consists of forward-looking statements, is prepared by our management and is qualified by, and subject to certain assumptions. Our guidance is not prepared with a view toward compliance with published guidelines of the American Institute of Certified Public Accountants, and neither our independent registered public accounting firm nor any other independent expert or outside party compiles or examines the guidance and, accordingly, no such person expresses any opinion or any other form of assurance with respect thereto. Guidance is based upon a number of assumptions and estimates that, while presented with numerical specificity, is inherently subject to significant business, economic and competitive uncertainties and contingencies, many of which are beyond our control and are based upon specific assumptions with respect to future business decisions, some of which will change. We generally state possible outcomes as high and low ranges which are intended to provide a sensitivity analysis as variables are changed but are not intended to represent actual results which could fall outside of the suggested ranges. The principal reason that we release this data is to provide a basis for our management to discuss our business outlook with analysts and investors. We do not accept any responsibility for any projections or reports published by any such outside analysts or investors. Guidance is necessarily speculative in nature, and it can be expected that some or all of the assumptions of the guidance furnished by us will not materialize or will vary significantly from actual results. Accordingly, our guidance is only an estimate of what management believes is realizable as of the date hereof. Actual results will vary from the guidance and the variations may be material. Investors should also recognize that the reliability of any forecasted financial data diminishes the farther in the future that the data is forecast. In light of the foregoing, investors are urged to put the guidance in context and not to place undue reliance on it. Throughout this presentation, reference is made to Consolidated EBITDAR or EBITDAR. EBITDAR is a non-GAAP financial measure. Management believes that EBITDAR may be useful in assessing our operating performance and our ability to meet our debt services requirements. EBITDAR, as used herein, however, is not necessarily comparable to similarly titled measures of other companies. Furthermore, EBITDAR has limitations as an analytical tool and should not be considered in isolation from, or as an alternative to, net income or loss, operating income, cash flow or other combined income or cash flow data prepared in accordance with GAAP. Because of these limitations, EBITDAR and related ratios should not be considered as measures of discretionary cash available to invest in business growth or reduce indebtedness. We compensate for these limitations by relying primarily on our GAAP results using EBITDAR only supplementally. The Securities and Exchange Commission (“SEC”) has adopted rules to regulate the use in filings with the SEC and public disclosures and press releases of non-GAAP financial measures, such as EBITDAR, that are derived on the basis of methodologies other than in accordance with GAAP. Our presentation of EBITDAR may not comply with these rules. Because of the forward-looking nature of the forecasted EBITDAR, specific quantifications of the amounts that are required to reconcile forecasted net income (loss) to forecasted EBITDAR are not available. FairPoint believes that providing estimates of the amounts that would be required to reconcile forecasted EBITDAR to forecasted net income (loss) would imply a degree of precision that could be confusing or misleading. |
|
|
Agenda I. Introduction II. Systems Update III. Network Update IV. Opportunity 3 |
|
|
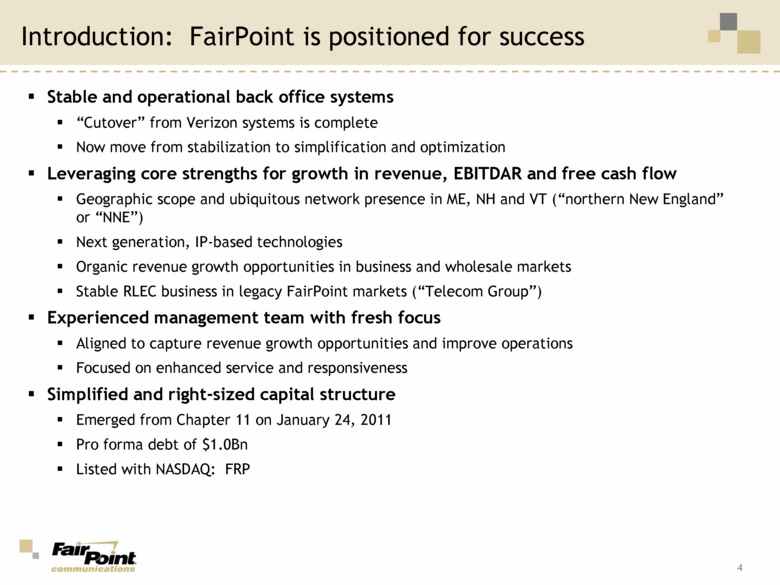
Introduction: FairPoint is positioned for success Stable and operational back office systems “Cutover” from Verizon systems is complete Now move from stabilization to simplification and optimization Leveraging core strengths for growth in revenue, EBITDAR and free cash flow Geographic scope and ubiquitous network presence in ME, NH and VT (“northern New England” or “NNE”) Next generation, IP-based technologies Organic revenue growth opportunities in business and wholesale markets Stable RLEC business in legacy FairPoint markets (“Telecom Group”) Experienced management team with fresh focus Aligned to capture revenue growth opportunities and improve operations Focused on enhanced service and responsiveness Simplified and right-sized capital structure Emerged from Chapter 11 on January 24, 2011 Pro forma debt of $1.0Bn Listed with NASDAQ: FRP 4 |
|
|
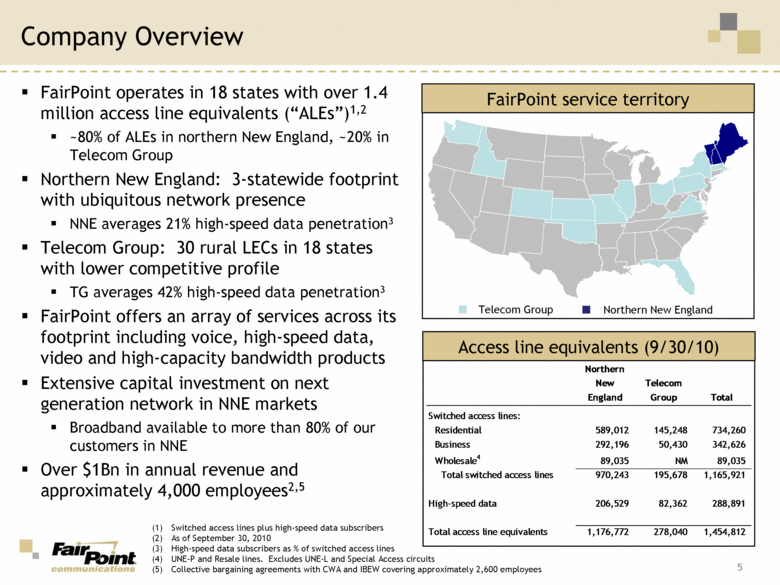
Company Overview FairPoint service territory Telecom Group Northern New England FairPoint operates in 18 states with over 1.4 million access line equivalents (“ALEs”)1,2 ~80% of ALEs in northern New England, ~20% in Telecom Group Northern New England: 3-statewide footprint with ubiquitous network presence NNE averages 21% high-speed data penetration3 Telecom Group: 30 rural LECs in 18 states with lower competitive profile TG averages 42% high-speed data penetration3 FairPoint offers an array of services across its footprint including voice, high-speed data, video and high-capacity bandwidth products Extensive capital investment on next generation network in NNE markets Broadband available to more than 80% of our customers in NNE Over $1Bn in annual revenue and approximately 4,000 employees2,5 Access line equivalents (9/30/10) 5 (1) Switched access lines plus high-speed data subscribers (2) As of September 30, 2010 (3) High-speed data subscribers as % of switched access lines (4) UNE-P and Resale lines. Excludes UNE-L and Special Access circuits (5) Collective bargaining agreements with CWA and IBEW covering approximately 2,600 employees Northern New England Telecom Group Total Switched access lines: Residential 589,012 145,248 734,260 Business 292,196 50,430 342,626 Wholesale 4 89,035 NM 89,035 Total switched access lines 970,243 195,678 1,165,921 High-speed data 206,529 82,362 288,891 Total access line equivalents 1,176,772 278,040 1,454,812 |
|
|
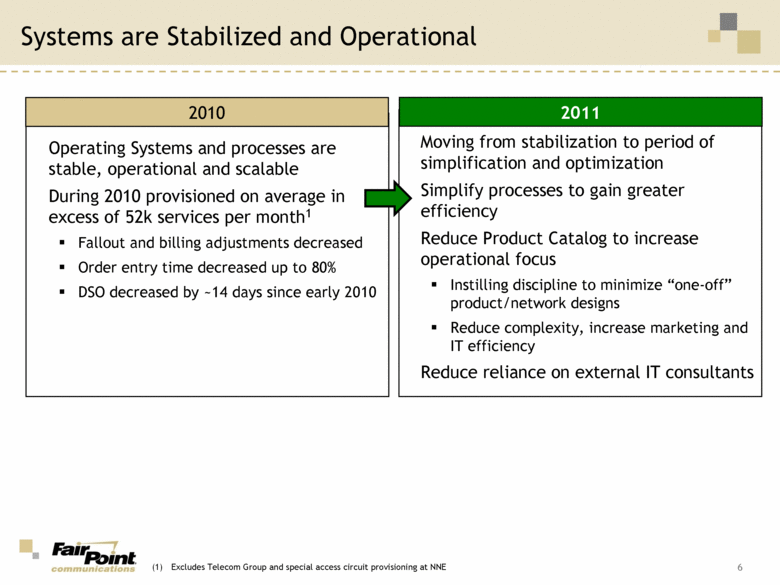
Systems are Stabilized and Operational 6 Operating Systems and processes are stable, operational and scalable During 2010 provisioned on average in excess of 52k services per month1 Fallout and billing adjustments decreased Order entry time decreased up to 80% DSO decreased by ~14 days since early 2010 2010 Moving from stabilization to period of simplification and optimization Simplify processes to gain greater efficiency Reduce Product Catalog to increase operational focus Instilling discipline to minimize “one-off” product/network designs Reduce complexity, increase marketing and IT efficiency Reduce reliance on external IT consultants 2011 (1) Excludes Telecom Group and special access circuit provisioning at NNE |
|
|
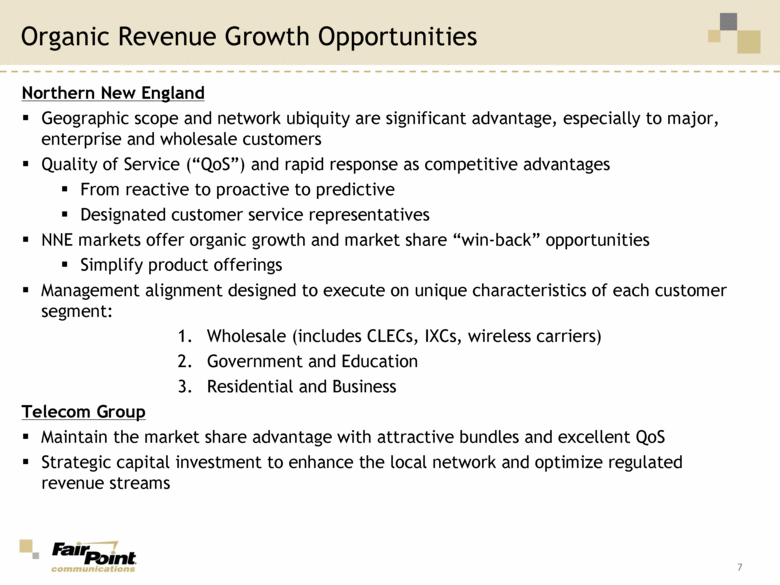
Organic Revenue Growth Opportunities 7 Northern New England Geographic scope and network ubiquity are significant advantage, especially to major, enterprise and wholesale customers Quality of Service (“QoS”) and rapid response as competitive advantages From reactive to proactive to predictive Designated customer service representatives NNE markets offer organic growth and market share “win-back” opportunities Simplify product offerings Management alignment designed to execute on unique characteristics of each customer segment: 1. Wholesale (includes CLECs, IXCs, wireless carriers) 2. Government and Education 3. Residential and Business Telecom Group Maintain the market share advantage with attractive bundles and excellent QoS Strategic capital investment to enhance the local network and optimize regulated revenue streams |
|
|
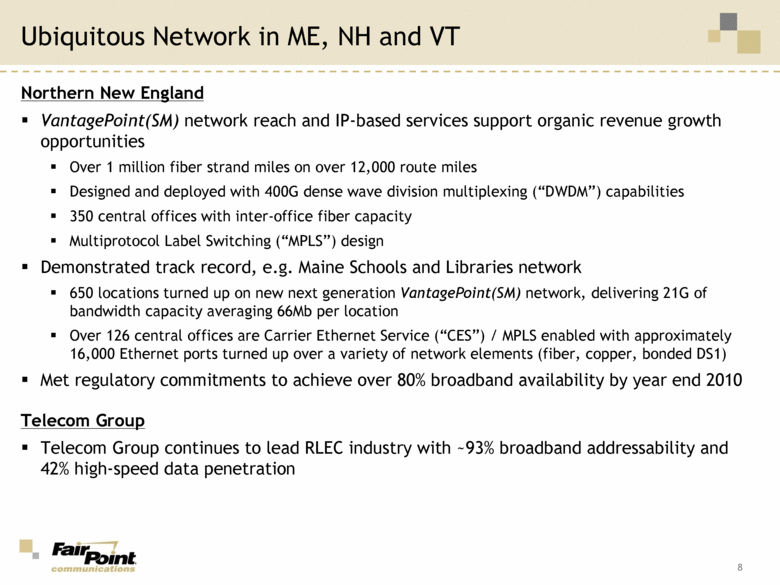
Ubiquitous Network in ME, NH and VT 8 Northern New England VantagePoint(SM) network reach and IP-based services support organic revenue growth opportunities Over 1 million fiber strand miles on over 12,000 route miles Designed and deployed with 400G dense wave division multiplexing (“DWDM”) capabilities 350 central offices with inter-office fiber capacity Multiprotocol Label Switching (“MPLS”) design Demonstrated track record, e.g. Maine Schools and Libraries network 650 locations turned up on new next generation VantagePoint(SM) network, delivering 21G of bandwidth capacity averaging 66Mb per location Over 126 central offices are Carrier Ethernet Service (“CES”) / MPLS enabled with approximately 16,000 Ethernet ports turned up over a variety of network elements (fiber, copper, bonded DS1) Met regulatory commitments to achieve over 80% broadband availability by year end 2010 Telecom Group Telecom Group continues to lead RLEC industry with ~93% broadband addressability and 42% high-speed data penetration |
|
|
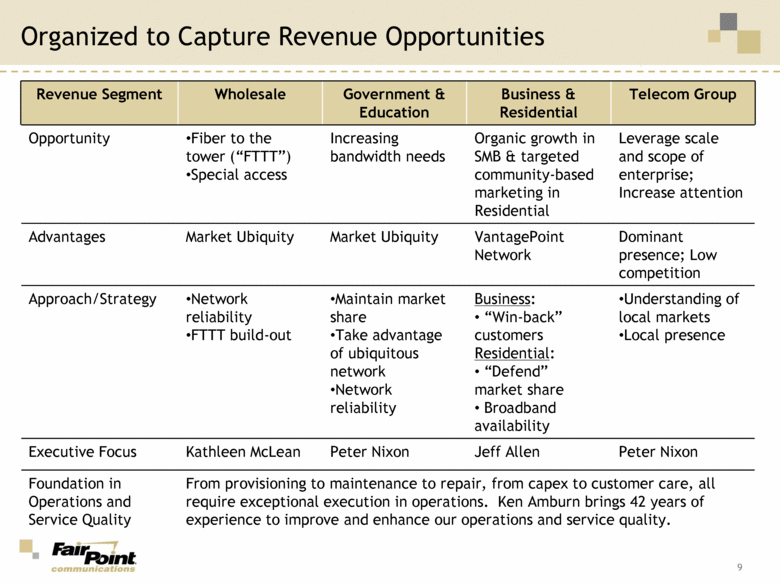
Organized to Capture Revenue Opportunities 9 Revenue Segment Wholesale Government & Education Business & Residential Telecom Group Opportunity Fiber to the tower (“FTTT”) Special access Increasing bandwidth needs Organic growth in SMB & targeted community-based marketing in Residential Leverage scale and scope of enterprise; Increase attention Advantages Market Ubiquity Market Ubiquity VantagePoint Network Dominant presence; Low competition Approach/Strategy Network reliability FTTT build-out Maintain market share Take advantage of ubiquitous network Network reliability Business: “Win-back” customers Residential: “Defend” market share Broadband availability Understanding of local markets Local presence Executive Focus Kathleen McLean Peter Nixon Jeff Allen Peter Nixon Foundation in Operations and Service Quality From provisioning to maintenance to repair, from capex to customer care, all require exceptional execution in operations. Ken Amburn brings 42 years of experience to improve and enhance our operations and service quality. |
|
|
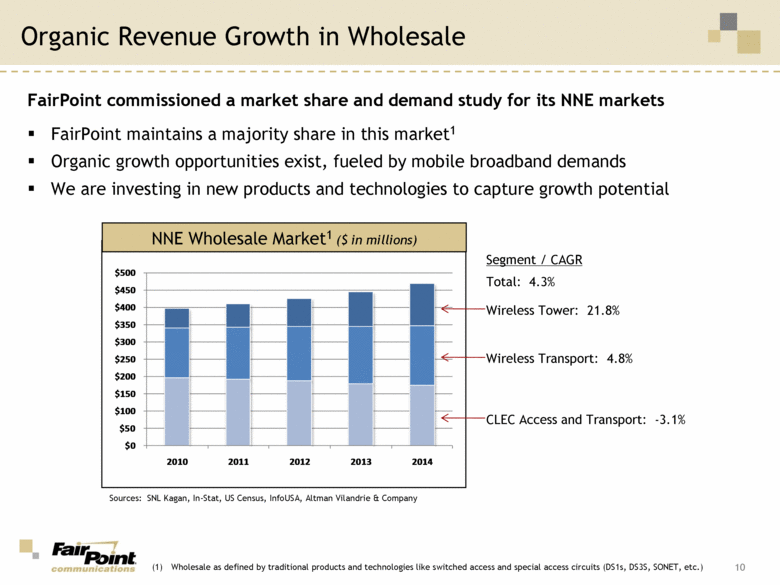
Organic Revenue Growth in Wholesale 10 Segment / CAGR Total: 4.3% Wireless Tower: 21.8% Wireless Transport: 4.8% CLEC Access and Transport: -3.1% NNE Wholesale Market1 ($ in millions) FairPoint commissioned a market share and demand study for its NNE markets FairPoint maintains a majority share in this market1 Organic growth opportunities exist, fueled by mobile broadband demands We are investing in new products and technologies to capture growth potential Sources: SNL Kagan, In-Stat, US Census, InfoUSA, Altman Vilandrie & Company (1) Wholesale as defined by traditional products and technologies like switched access and special access circuits (DS1s, DS3S, SONET, etc.) $0 $50 $100 $150 $200 $250 $300 $350 $400 $450 $500 2010 2011 2012 2013 2014 |
|
|
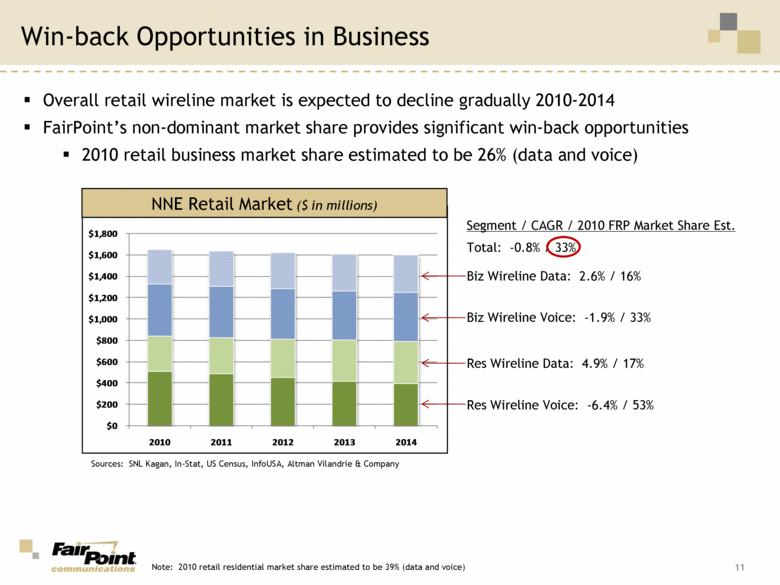
Win-back Opportunities in Business 11 Overall retail wireline market is expected to decline gradually 2010-2014 FairPoint’s non-dominant market share provides significant win-back opportunities 2010 retail business market share estimated to be 26% (data and voice) Segment / CAGR / 2010 FRP Market Share Est. Total: -0.8% / 33% Biz Wireline Data: 2.6% / 16% Biz Wireline Voice: -1.9% / 33% Res Wireline Data: 4.9% / 17% Res Wireline Voice: -6.4% / 53% NNE Retail Market ($ in millions) Sources: SNL Kagan, In-Stat, US Census, InfoUSA, Altman Vilandrie & Company Note: 2010 retail residential market share estimated to be 39% (data and voice) $0 $200 $400 $600 $800 $1,000 $1,200 $1,400 $1,600 $1,800 2010 2011 2012 2013 2014 |
|
|
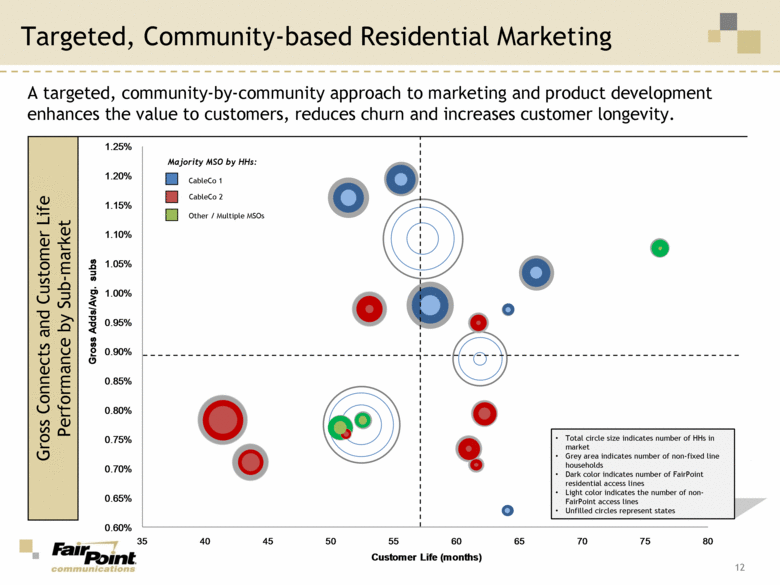
Other / Multiple MSOs Majority MSO by HHs: Total circle size indicates number of HHs in market Grey area indicates number of non-fixed line households Dark color indicates number of FairPoint residential access lines Light color indicates the number of non-FairPoint access lines Unfilled circles represent states Targeted, Community-based Residential Marketing CableCo 1 CableCo 2 A targeted, community-by-community approach to marketing and product development enhances the value to customers, reduces churn and increases customer longevity. Gross Connects and Customer Life Performance by Sub-market 12 0.60% 0.65% 0.70% 0.75% 0.80% 0.85% 0.90% 0.95% 1.00% 1.05% 1.10% 1.15% 1.20% 1.25% 35 40 45 50 55 60 65 70 75 80 Gross Adds/Avg. subs Customer Life (months) |
|
|
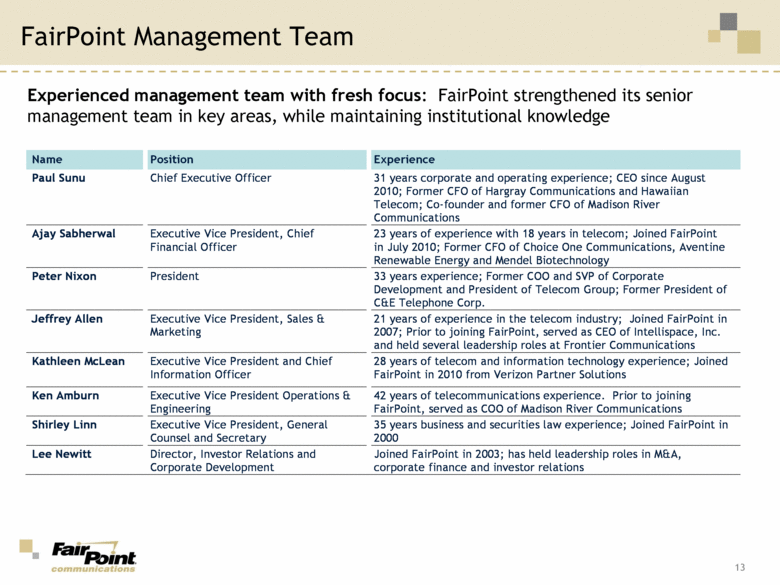
FairPoint Management Team 13 Experienced management team with fresh focus: FairPoint strengthened its senior management team in key areas, while maintaining institutional knowledge Name Position Experience Paul Sunu Chief Executive Officer 31 years corporate and operating experience; CEO since August 2010; Former CFO of Hargray Communications and Hawaiian Telecom; Co-founder and former CFO of Madison River Communications Ajay Sabherwal Executive Vice President, Chief Financial Officer 23 years of experience with 18 years in telecom; Joined FairPoint in July 2010; Former CFO of Choice One Communications, Aventine Renewable Energy and Mendel Biotechnology Peter Nixon President 33 years experience; Former COO and SVP of Corporate Development and President of Telecom Group; Former President of C&E Telephone Corp. Jeffrey Allen Executive Vice President, Sales & Marketing 21 years of experience in the telecom industry; Joined FairPoint in 2007; Prior to joining FairPoint, served as CEO of Intellispace, Inc. and held several leadership roles at Frontier Communications Kathleen McLean Executive Vice President and Chief Information Officer 28 years of telecom and information technology experience; Joined FairPoint in 2010 from Verizon Partner Solutions Ken Amburn Executive Vice President Operations & Engineering 42 years of telecommunications experience. Prior to joining FairPoint, served as COO of Madison River Communications Shirley Linn Executive Vice President, General Counsel and Secretary 35 years business and securities law experience; Joined FairPoint in 2000 Lee Newitt Director, Investor Relations and Corporate Development Joined FairPoint in 2003; has held leadership roles in M&A, corporate finance and investor relations |
|
|
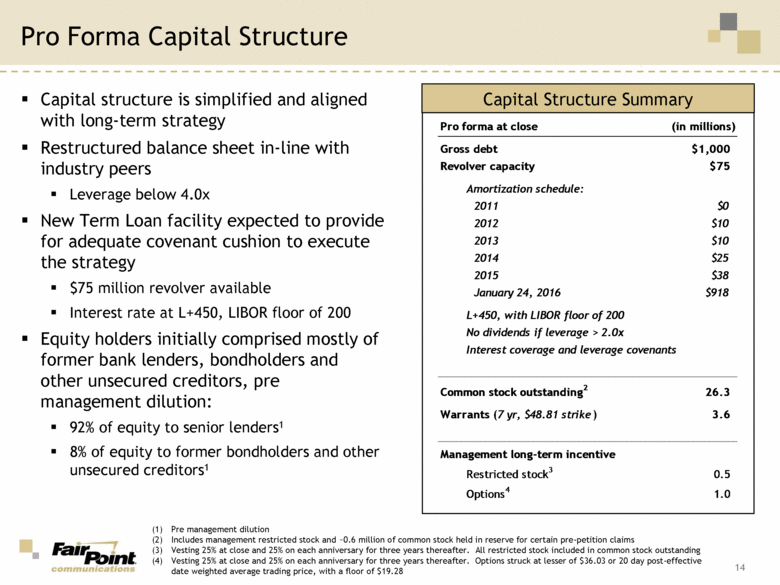
Pro Forma Capital Structure 14 Capital Structure Summary Capital structure is simplified and aligned with long-term strategy Restructured balance sheet in-line with industry peers Leverage below 4.0x New Term Loan facility expected to provide for adequate covenant cushion to execute the strategy $75 million revolver available Interest rate at L+450, LIBOR floor of 200 Equity holders initially comprised mostly of former bank lenders, bondholders and other unsecured creditors, pre management dilution: 92% of equity to senior lenders1 8% of equity to former bondholders and other unsecured creditors1 (1) Pre management dilution (2) Includes management restricted stock and ~0.6 million of common stock held in reserve for certain pre-petition claims (3) Vesting 25% at close and 25% on each anniversary for three years thereafter. All restricted stock included in common stock outstanding (4) Vesting 25% at close and 25% on each anniversary for three years thereafter. Options struck at lesser of $36.03 or 20 day post-effective date weighted average trading price, with a floor of $19.28 Pro forma at close (in millions) Gross debt $1,000 Revolver capacity $75 Amortization schedule: 2011 $0 2012 $10 2013 $10 2014 $25 2015 $38 January 24, 2016 $918 L+450, with LIBOR floor of 200 No dividends if leverage > 2.0x Interest coverage and leverage covenants Common stock outstanding 2 26.3 Warrants (7 yr, $48.81 strike) 3.6 Management long-term incentive Restricted stock 3 0.5 Options 4 1.0 |
|
|
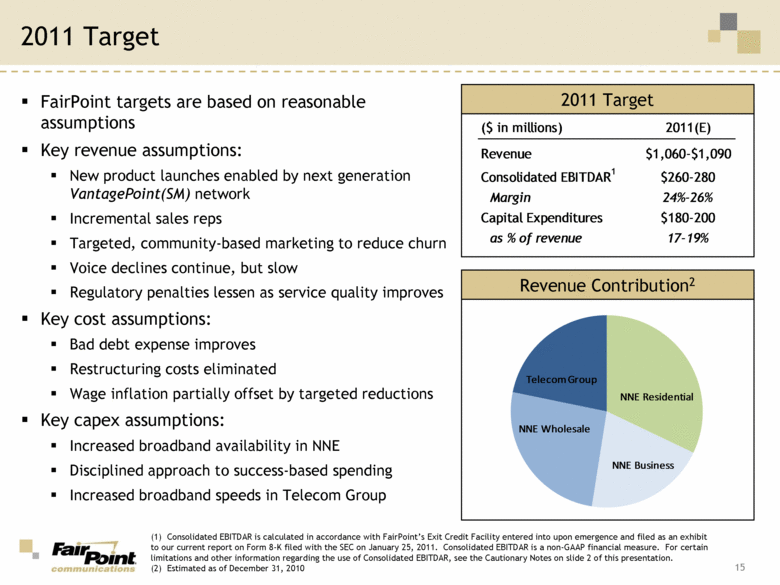
FairPoint targets are based on reasonable assumptions Key revenue assumptions: New product launches enabled by next generation VantagePoint(SM) network Incremental sales reps Targeted, community-based marketing to reduce churn Voice declines continue, but slow Regulatory penalties lessen as service quality improves Key cost assumptions: Bad debt expense improves Restructuring costs eliminated Wage inflation partially offset by targeted reductions Key capex assumptions: Increased broadband availability in NNE Disciplined approach to success-based spending Increased broadband speeds in Telecom Group 2011 Target 15 2011 Target (1) Consolidated EBITDAR is calculated in accordance with FairPoint’s Exit Credit Facility entered into upon emergence and filed as an exhibit to our current report on Form 8-K filed with the SEC on January 25, 2011. Consolidated EBITDAR is a non-GAAP financial measure. For certain limitations and other information regarding the use of Consolidated EBITDAR, see the Cautionary Notes on slide 2 of this presentation. (2) Estimated as of December 31, 2010 Revenue Contribution2 NNE Residential NNE Business NNE Wholesale Telecom Group ($ in millions) 2011(E) Revenue $1,060-$1,090 Consolidated EBITDAR1 $260-280 Margin 24%-26% Capital Expenditures $180-200 as % of revenue 17-19% |
|
|
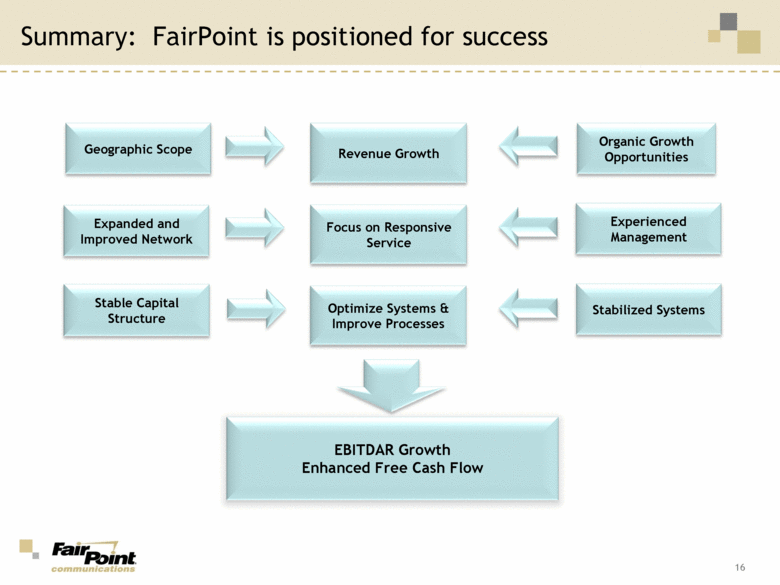
Summary: FairPoint is positioned for success 16 Revenue Growth Expanded and Improved Network Stable Capital Structure EBITDAR Growth Enhanced Free Cash Flow Experienced Management Stabilized Systems Geographic Scope Focus on Responsive Service Optimize Systems & Improve Processes Organic Growth Opportunities |

