Attached files
| file | filename |
|---|---|
| EX-10.40 - EXHIBIT 10.40 - FAIRPOINT COMMUNICATIONS INC | ex1040-frpxformoffirstamen.htm |
| EX-32.2 - EXHIBIT 32.2 - FAIRPOINT COMMUNICATIONS INC | ex322-frpx20161231.htm |
| EX-32.1 - EXHIBIT 32.1 - FAIRPOINT COMMUNICATIONS INC | ex321-frpx20161231.htm |
| EX-31.2 - EXHIBIT 31.2 - FAIRPOINT COMMUNICATIONS INC | ex312-frpx20161231.htm |
| EX-31.1 - EXHIBIT 31.1 - FAIRPOINT COMMUNICATIONS INC | ex311-frpx20161231.htm |
| EX-23.2 - EXHIBIT 23.2 - FAIRPOINT COMMUNICATIONS INC | ex232-frpxeyconsent2016.htm |
| EX-23.1 - EXHIBIT 23.1 - FAIRPOINT COMMUNICATIONS INC | ex231-frpxbdoconsent2016.htm |
| EX-21 - EXHIBIT 21 - FAIRPOINT COMMUNICATIONS INC | ex21-frpxsubsidiarylisting.htm |
| EX-10.27 - EXHIBIT 10.27 - FAIRPOINT COMMUNICATIONS INC | ex1027-frpxsecondamendment.htm |
| EX-10.24 - EXHIBIT 10.24 - FAIRPOINT COMMUNICATIONS INC | ex1024-frpxsecondamendment.htm |
| EX-2.3 - EXHIBIT 2.3 - FAIRPOINT COMMUNICATIONS INC | ex23-frpxfirstamendmentmer.htm |
UNITED STATES
SECURITIES AND EXCHANGE COMMISSION
Washington, D.C. 20549
______________________________________________________________________
Form 10-K
______________________________________________________________________
(Mark One)
x | ANNUAL REPORT PURSUANT TO SECTION 13 OR 15(d) OF THE SECURITIES EXCHANGE ACT OF 1934 |
For the fiscal year ended December 31, 2016
or
o | TRANSITION REPORT PURSUANT TO SECTION 13 OR 15(d) OF THE SECURITIES EXCHANGE ACT OF 1934 |
For the transition period from to
Commission file number 001-32408
______________________________________________________________________
FairPoint Communications, Inc.
(Exact name of registrant as specified in its charter)
______________________________________________________________________
Delaware | 13-3725229 | |
(State or other jurisdiction of | (I.R.S. Employer | |
incorporation or organization) | Identification No.) | |
521 East Morehead Street, Suite 500 | 28202 | |
Charlotte, North Carolina | (Zip Code) | |
(Address of principal executive offices) | ||
Registrant's telephone number, including area code:
(704) 344-8150
______________________________________________________________________
Securities registered pursuant to Section 12(b) of the Act:
Title of each class | Name of exchange on which registered | |
Common Stock, par value $0.01 per share | The Nasdaq Stock Market LLC (Nasdaq Capital Market) | |
Securities registered pursuant to Section 12(g) of the Act:
None
______________________________________________________________________
Indicate by check mark if the registrant is a well-known seasoned issuer, as defined in Rule 405 of the Securities Act. Yes o No x
Indicate by check mark if the registrant is not required to file reports pursuant to Section 13 or 15(d) of the Act. Yes o No x
Indicate by check mark whether the registrant (1) has filed all reports required to be filed by Section 13 or 15(d) of the Securities Exchange Act of 1934 during the preceding 12 months (or for such shorter period that the registrant was required to file such reports), and (2) has been subject to such filing requirements for the past 90 days. Yes x No o
Indicate by check mark whether the registrant has submitted electronically and posted on its corporate Web site, if any, every Interactive Data File required to be submitted and posted pursuant to Rule 405 of Regulation S-T (§ 232.405 of this chapter) during the preceding 12 months (or for such shorter period that the registrant was required to submit and post such files). Yes x No o
Indicate by check mark if disclosure of delinquent filers pursuant to Item 405 of Regulation S-K (§ 229.405 of this chapter) is not contained herein, and will not be contained, to the best of registrant's knowledge, in definitive proxy or information statements incorporated by reference in Part III of this Form 10-K or any amendment to this Form 10-K. x
Indicate by check mark whether the registrant is a large accelerated filer, an accelerated filer, a non-accelerated filer or a smaller reporting company. See the definitions of "large accelerated filer", "accelerated filer" and "smaller reporting company" in Rule 12b-2 of the Exchange Act.
Large accelerated filer | o | Accelerated filer | x | |||
Non-accelerated filer | o (Do not check if a smaller reporting company) | Smaller reporting company | o | |||
Indicate by check mark whether the registrant is a shell company (as defined in Rule 12b-2 of the Act). Yes o No x
The aggregate market value of the common stock of the registrant held by non-affiliates of the registrant as of June 30, 2016 (based on the closing price of $14.68 per share) was $384,049,851.
As of February 27, 2017, there were 27,266,570 shares of the registrant's common stock, par value $0.01 per share, outstanding.
______________________________________________________________________
FAIRPOINT COMMUNICATIONS, INC.
ANNUAL REPORT ON FORM 10-K FOR THE YEAR ENDED DECEMBER 31, 2016
TABLE OF CONTENTS | ||
Item Number | Page Number | |
1. | ||
1A. | ||
1B. | ||
2. | ||
3. | ||
4. | ||
5. | Market for Registrant's Common Equity, Related Stockholder Matters and Issuer Purchases of Equity Securities | |
6. | ||
7. | Management's Discussion and Analysis of Financial Condition and Results of Operations | |
7A. | ||
8. | ||
9. | ||
9A. | ||
9B. | ||
10. | ||
11. | ||
12. | ||
13. | ||
14. | ||
15. | ||
16. | Form 10-K Summary | |
2
CAUTIONARY NOTE REGARDING FORWARD-LOOKING STATEMENTS
Some statements in this Annual Report on Form 10-K for the fiscal year ended December 31, 2016 (this "Annual Report") are known as "forward-looking statements" within the meaning of Section 27A of the Securities Act of 1933, as amended (the "Securities Act"), and Section 21E of the Securities Exchange Act of 1934, as amended (the "Exchange Act"). These forward-looking statements include, but are not limited to, statements about our plans, objectives, expectations and intentions and other statements contained in this Annual Report that are not historical facts. When used in this Annual Report, the words “expects,” “anticipates,” “intends,” “plans,” “believes,” “seeks,” “estimates”, “should”, “could”, “may”, “will” and similar expressions are generally intended to identify forward-looking statements. Because these forward-looking statements involve known and unknown risks and uncertainties, there are important factors that could cause actual results, events or developments to differ materially from those expressed or implied by these forward-looking statements, including factors discussed under “Item 1A. Risk Factors” and other parts of this Annual Report and the factors set forth below:
• | the timing and ability to complete the Merger (as defined below) with Consolidated Communications Holdings, Inc.; |
• | the outcome of legal and regulatory proceedings that have been, or may be, instituted following the announcement of our entering into the Merger Agreement (as defined below); |
• | risks that the Merger disrupts current plans and operations including potential impairments to our ability to retain and motivate key personnel; |
• | the possibility that the Merger is not consummated, including, but not limited to, due to the failure to satisfy the closing conditions; |
• | the diversion of management's attention from ongoing business operations and opportunities as a result of the Merger; |
• | the amounts of costs, fees, and expenses relating to the Merger; |
• | future performance generally and our share price as a result thereof; |
• | changes in strategic direction, including as a result of mergers, acquisitions or dispositions; |
• | restrictions imposed by the agreements governing our indebtedness; |
• | our ability to satisfy certain financial covenants included in the agreements governing our indebtedness; |
• | financing sources and availability, and future interest expense; |
• | our ability to repay or refinance our indebtedness; |
• | our ability to fund substantial capital expenditures; |
• | anticipated business development activities and future capital expenditures; |
• | the effects of regulation and enforcement, including changes in federal and state regulatory policies, procedures and their enforcement mechanisms including but not limited to the availability and levels of regulatory support payments and penalties associated with performance; |
• | our ability to satisfy our Connect America Fund ("CAF") Phase II obligations; |
• | adverse changes in economic and industry conditions, and any resulting financial or operational impact, in the markets we serve; |
• | labor matters, including workforce levels, our workforce reduction initiatives, labor negotiations and any resulting financial or operational impact; |
• | material technological developments and changes in the communications industry, including declines in access lines; |
• | disruption of our third party suppliers' provisioning of critical products or services; |
• | change in preference and use by customers of alternative technologies; |
• | the effects of competition on our business and market share; |
• | our ability to overcome changes to or pressure on pricing and their impact on our profitability; |
• | intellectual property infringement claims by third parties; |
• | failure of, or attack on, our information technology infrastructure; |
• | risks related to our reported financial information and operating results; |
• | availability of net operating loss ("NOL") carryforwards to offset anticipated tax liabilities; |
• | the impact of changes in assumptions on our ability to meet obligations to our company-sponsored qualified pension plans and other post-employment benefit plans; |
• | the impact of lump sum payments under certain of our company-sponsored qualified pension plans on future pension |
3
contributions;
• | the effects of severe weather events, such as hurricanes, storms, tornadoes and floods, terrorist attacks, cyber-attacks or other natural or man-made disasters; and |
• | changes in accounting assumptions that regulatory agencies, including the Securities and Exchange Commission (the "SEC"), may require or that result from changes in the accounting rules or their application, which could result in an impact on earnings. |
You should not place undue reliance on such forward-looking statements, which are based on the information currently available to us and speak only as of the date on which this Annual Report is filed with the SEC. We undertake no obligation to publicly update or revise any forward-looking statements, whether as a result of new information, future events, changes in our expectations or otherwise, except as required by law. However, your attention is directed to any further disclosures made on related subjects in our subsequent reports filed with the SEC on Forms 10-K, 10-Q and 8-K.
4
PART I
ITEM 1. BUSINESS
Except as otherwise required by the context, references in this Annual Report to:
• | "FairPoint Communications" refers to FairPoint Communications, Inc., excluding its subsidiaries. |
• | "FairPoint", the "Company", "we", "us" or "our" refer to the combined business of FairPoint Communications, Inc. and all of its subsidiaries after giving effect to the merger on March 31, 2008 with Northern New England Spinco Inc., a subsidiary of Verizon Communications Inc. ("Verizon"), which transaction is referred to herein as the "Spinco Merger". |
• | "Northern New England operations" refers to the local exchange business acquired from Verizon and certain of its subsidiaries after giving effect to the Spinco Merger. |
• | "Telecom Group" refers to FairPoint, exclusive of our acquired Northern New England operations. |
• | "Verizon New England" refers to the local exchange business of Verizon New England Inc. in Maine, New Hampshire and Vermont and the customers of Verizon and its subsidiaries' (other than Cellco Partnership) related long distance and Internet service provider business in those states prior to the Spinco Merger. |
• | "Consolidated" refers to Consolidated Communications Holdings, Inc., a Delaware corporation. |
Our Business
We are a leading provider of advanced communications services to business, wholesale and residential customers within our service territories. We offer our customers a suite of advanced services including Ethernet, Session Initiation Protocol Trunking ("SIP-Trunking"), hosted Primary Branch Exchange ("hosted PBX"), managed services, data center colocation services, high capacity data transport and other IP-based services over our fiber-based network, in addition to Internet access, high-speed data ("HSD") and local and long distance voice services. Our service territory spans 17 states where we are the incumbent communications provider primarily serving rural communities and small urban markets. Many of our local exchange carriers ("LECs") have served their respective communities for more than 80 years. As of December 31, 2016, we operated with approximately 306,600 broadband subscribers, approximately 15,700 Ethernet circuits and approximately 366,100 residential voice lines.
We own and operate an extensive fiber-based Ethernet network with more than 22,000 miles of fiber optic cable, including approximately 18,000 miles of fiber optic cable in Maine, New Hampshire and Vermont, giving us capacity to support more HSD services and extend our fiber reach into more communities across the region. The IP/Multiple Protocol Label Switched ("IP/MPLS") network architecture of our fiber-based network allows us to provide Ethernet, transport and other IP-based services with the highest level of reliability at a lower cost of service. This fiber-based Ethernet network also supplies critical infrastructure for wireless carriers serving the region as their bandwidth needs increase, driven by mobile data from smartphones, tablets and other wireless devices. As of December 31, 2016, we provide cellular transport, also known as backhaul, through over 1,900 mobile Ethernet backhaul connections. We have fiber connectivity to approximately 1,300 cellular communications towers in our service footprint.
We were incorporated in New York in 1991 and reincorporated in Delaware in 1993 and grew through acquisitions. In March 2008, we completed the acquisition of the Northern New England operations from Verizon through the Spinco Merger. This acquisition significantly expanded our geographic platform in Maine, New Hampshire and Vermont.
Transformation of our Business
We have transformed our network and are aligning our communications services to meet changing customer preferences and communications requirements. Over the past few years, we have made significant capital investments in our fiber-based Ethernet network to expand our business service offerings to meet the growing data needs of our business customers and to increase broadband speeds and capacity in our consumer markets. We have also focused our sales and marketing efforts on these advanced data solutions. Specifically, we built and launched high capacity Ethernet services to allow us to meet the capacity needs of our business customers as well as supply high capacity infrastructure to our wholesale customers.
Business and wholesale customers have a growing demand for bandwidth and are converting from services such as Asynchronous Transfer Mode ("ATM") and Frame Relay and dedicated transport using T-1s to Ethernet-based products. Businesses are also looking to take advantage of the flexibility of voice services via Voice over Internet Protocol ("VoIP"). Residential customer trends have shown an increasing adoption and demand for higher speed broadband services while traditional voice services are giving way to wireless and alternative carriers. Our plan is to continue to add advanced data products and services that meet our
5
business and wholesale customers’ needs while providing higher speed HSD options, attractive pricing features, appealing bundle offers and excellent customer service to our residential customer segment.
We have been successful in meeting the needs of our wireless carrier customers through our Fiber to the Tower ("FTTT") initiative. We have seen an increase in fiber backhaul from wireless carriers since late 2010 and now have approximately 1,300 cell towers served with fiber across our footprint. Our extensive fiber network of approximately 18,000 miles of fiber optic cable in Maine, New Hampshire and Vermont is a competitive advantage in delivering FTTT services.
We believe ongoing regulatory reforms in Maine, New Hampshire and Vermont will serve to promote fair competition among communications services providers in that region. We continue to believe that there is a significant organic growth opportunity within these business markets given our extensive fiber network and IP-based product suite combined with our relatively low business market share in these areas.
Proposed Merger with Consolidated Communications Holdings, Inc.
On December 3, 2016, FairPoint Communications entered into an Agreement and Plan of Merger (the “Merger Agreement”) with Consolidated and Falcon Merger Sub, Inc., a newly formed Delaware corporation and wholly-owned subsidiary of Consolidated (“Merger Sub”), which provides for, among other things, a business combination whereby Merger Sub will merge with and into FairPoint Communications, with FairPoint Communications as the surviving entity (the “Merger”). As a result of the Merger, the separate corporate existence of Merger Sub will cease, and FairPoint Communications will survive as a wholly owned subsidiary of Consolidated. Consolidated is a leading business and broadband communications provider throughout its 11-state service area.
If the Merger is completed, under the terms of the Merger Agreement, stockholders of FairPoint Communications will receive 0.7300 shares of common stock of Consolidated for each share of FairPoint Communications common stock that they own immediately before this transaction. The Merger is expected to close around the middle of 2017 and is subject to standard closing conditions, including federal and state regulatory approvals and the approval of both Consolidated’s and FairPoint Communications’ stockholders.
Generation of Revenue
We offer a broad portfolio of services to meet the communications and technology needs of our customers, including bundling of services designed to simplify our customers' purchasing and management processes. Our basic offerings are outlined below.
See "Item 7. Management's Discussion and Analysis of Financial Condition and Results of Operations" and "Item 8. Financial Statements and Supplementary Data" included elsewhere in this Annual Report for more information regarding our revenue sources and financial results.
Data and Internet Services
We believe data and Internet services are the cornerstone of our growth strategy for our business customers who require more advanced data solutions and our wholesale customers who experience capacity demands from their end users for higher speed services. We offer an extensive array of high capacity data services including: optical, Ethernet, IP services, Ethernet virtual circuit technology for cellular backhaul and private line special access services. We work with large businesses and carriers to deliver network capacity to meet their specific needs, including migrating networks from time division multiplexing to Ethernet-based high capacity circuits. Our portfolio also includes hosted PBX service over our Ethernet network. This service provides a cloud based voice offering for business customers. The service leverages our softswitch platform and uses a set of approved vendors for on-site hardware and maintenance support. Hosted PBX service allows us to continue to expand the services we offer to business customers, while leveraging our Ethernet network.
We offer internet access to both consumer and business customers through a variety of technologies leveraging both copper and fiber infrastructure, including digital subscriber line ("DSL"), dedicated fiber and lit buildings throughout our footprint. Certain of these services provide speeds up to 1 gigabit per second. In select markets, we also offer cable modem internet service, "Fiber to the Home" and wireless internet access.
Our data center colocation services offer businesses and public entities a physically secure, reliable location equipped with network connections to manage off-site disaster recovery, computing, storage and other IT equipment. Our customer data centers are strictly controlled, secured environments with the necessary power, cooling and connectivity resiliency to provide customer business continuity. These data centers enable organizations to quickly and cost-effectively scale and consolidate their IT systems to meet demand without incurring construction or excess staffing costs while maintaining control over management of both equipment and data.
6
Voice Services
Local Calling Services. Local calling services enable the local customer to originate and receive an unlimited number of calls within a defined "exchange" area. Local calling services include basic local lines and local private lines. We provide local calling services to residential and business customers, generally for a fixed monthly charge and service charges for special calling features. In a LEC's territory, the amount that we can charge a customer for local service is generally determined by proceedings involving the appropriate state regulatory authorities.
Long Distance Services. We offer dedicated long distance services within our service areas on our network and through resale agreements with national interexchange carriers.
9-1-1 Services. We are a full service 9-1-1 provider and in the past three years have installed and now maintain two turn-key, state of the art statewide next-generation emergency 9-1-1 systems. These systems, located in Maine and Vermont, have processed over a million calls relying on the caller's location information for routing. Next-generation emergency 9-1-1 systems are an improvement over traditional 9-1-1 and provide the foundation to handle future communication modes such as texting and video.
Access
Network Transport Services. We offer network transport services to wholesale customers for their use in connecting end users to the interexchange networks of the wholesale customer. These network transport services include high speed digital services, which are primarily Ethernet-based services provisioned over fiber and copper facilities, and special access services, which are primarily DS-1 and DS-3 services.
Network Switched Access Service. Network switched access service enables long distance companies to utilize our local network to originate or terminate intrastate and interstate communications. Network switched access charges relate to long distance, or toll calls, that typically involve more than one company in the provision of telephone service, as well as to the termination of interexchange private line services. Since toll calls and private line services are generally billed to the customer originating the call or ordering the private line service, a mechanism is required to compensate each company providing services relating to the service. This mechanism is the access charge and we bill access charges to long distance companies and other customers for the use of our facilities to access the customer, as described below. Network switched access compensation is subject to the Federal Communications Commission ("FCC") CAF/intercarrier compensation ("ICC") Order (referred to hereafter as the "CAF/ICC Order"), as described below in "Regulatory and Legislative." Under the rules adopted in 2011, network switched access revenues are expected to continue to decline, but on a more predictable basis with fewer disputes.
Interstate Access Charges. We generate interstate access revenue when an interstate long distance call is originated by a customer in one of our exchanges to a customer in another state, or when such a call is terminated to a customer in one of our exchanges. We also generate interstate access revenue when an interexchange carrier orders special access to connect interexchange private line services, such as HSD services, to a customer in one of our local exchanges. We bill interstate access charges in the same manner as we bill intrastate access charges as described below; however, interstate access charges are regulated and approved by the FCC instead of the state regulatory authority.
Intrastate Access Charges. We generate intrastate access revenue when an intrastate long distance call involving an interexchange carrier is originated by a customer in one of our exchanges to a customer in another exchange in the same state, or when such a call is terminated to a customer in one of our local exchanges. We also generate intrastate access revenue when an interexchange carrier orders special access to connect interexchange private line services to a customer in one of our local exchanges. The interexchange carrier pays us an intrastate access fee for either terminating or originating the communication. We bill access charges relating to such service through our carrier access billing system and receive the access payment from the interexchange carrier. Access charges for intrastate services are regulated and approved by the state regulatory authority and are also subject to the rate transitions ordered by the FCC in its CAF/ICC order.
Regulatory Funding
We receive certain federal and state government funding that we classify as regulatory funding, which is further described in “Regulatory and Legislative” below, including: CAF Phase II support effective January 1, 2015 to build and operate broadband services; CAF Phase II transition funding (scheduled to phase down over three years); CAF Phase I frozen support (for Kansas and Colorado in 2015 and until a reverse auction is completed); CAF funding under the CAF/ICC Order and universal service fund support from certain states in which we operate.
From time to time we advocate for modifications or interpretations of state and federal regulations that could provide additional support funding to us for serving high cost areas. We do not know if any additional revenue will result from these advocacy efforts
7
or, if so, when or how much additional revenue may be available.
Other Services
We seek to capitalize on our LECs' local presence and network infrastructure by offering enhanced services to customers, including special purpose projects on behalf of third parties, video services (including cable television and video-over-DSL) and directory services, among others.
Special Purpose Projects. Upon request from customers, we provide project-based implementation support services. These services are provided on a time and materials basis at the customer location as part of a larger FairPoint solution. This capability allows us to better serve our customers and assist in filling resource gaps they may encounter when implementing new communications plans.
Our Markets
We operate 83% of our total residential voice lines in Maine, New Hampshire and Vermont. We also provide local service in portions of Alabama, Colorado, Florida, Georgia, Illinois, Kansas, Massachusetts, Missouri, New York, Ohio, Oklahoma, Pennsylvania, Virginia and Washington. Within these 17 states, most of our LECs operate as the incumbent local exchange carrier ("ILEC").
Sales and Marketing
With approximately 18,000 miles of fiber optic cable and 93% of our central offices enabled for Ethernet services we offer the largest such network in northern New England. Combined with our copper network, our infrastructure reaches approximately 95% of businesses in Maine, New Hampshire and Vermont. By investing in a dense, high-performing, scalable network, FairPoint has bandwidth and transport capacity to support enhanced applications, including fiber-based mobile and cloud-based communications, such as small cell wireless backhaul technology, VoIP, data storage, managed services and disaster recovery. Our marketing approach emphasizes the benefits of our advanced network while utilizing customer-oriented, locally-focused messages that resonate by community and by customer segment.
Our focus on the individual communities we serve in our 17 state footprint stems from the expertise of approximately 2,500 employees who predominantly work and live in the markets where we provide service, as well as our belief that many customers in our territory prefer to do business locally. We view our visible local presence as a competitive differentiator because it enables a prompt and locally relevant approach to opportunities and challenges in sales and service, operations, and marketing. As a result, we often leverage the heritage of the LECs in our service areas and the brand recognition that our long history of service provides.
We tailor our marketing offers, messaging and tactics to be effective and efficient for each customer audience using both call center and direct sales channels. Residential customers, who make up the largest part of our customer base, are directed to customer sales and service call centers based in the markets we serve. As we seek continued growth in business services, we leverage local call centers for sales and service efficiency among our small-office and home-office clientele, as well as a direct sales force that is trained to develop advanced, customized voice and data solutions. The direct sales force that focuses on small and medium businesses dedicates representatives to exclusive geographic territories and encourages involvement in the local business community during and after hours. The direct sales force that focuses on large and enterprise business utilizes both a geographic territory assignment and a named account program. The government, education and wholesale teams utilize a named account approach, focusing on specific new and existing customers.
We maintain teams of local sales support staff and experienced sales engineers who can design the right solution for each organization and guide new customers during the pre- and post-sales process. Support teams are customized based on account size and product set, and dedicated representatives are on call to answer questions, troubleshoot if necessary, and serve as a conduit to much broader resources, options and support, including our in-market Network Operations Center. We also place an emphasis on customer satisfaction and retention, with certain representatives focusing on maintaining existing customer relationships.
Information Technology and Support Systems
We have a customer-focused approach to information technology ("IT") which allows for efficient business operations and supports revenue growth. Our approach is to simplify and standardize processes in order to optimize the benefits of our back-office and operation support systems. Specifically, our "simplify and optimize" initiative targets the reduction of redundant and manual processes to reduce cycle times, improve efficiency and deliver enhanced customer service.
Our back-office and operations support systems are a combination of integrated off-the-shelf packages that have been customized to support our operations. Both our Northern New England and Telecom Group access billing operations are supported by outsourced third-party platforms.
8
Our systems are supported by a combination of employees and contractors. Our internal IT group supports data center operations, data network operations, internal help desk, desktop support and phases of the systems development life cycle. We use professional services firms for the majority of software development and maintenance.
Network Architecture and Technology
Rapid and significant changes in technology continue in the communications industry. Our success depends, in part, on our ability to anticipate and adapt to technological changes. With this in mind, we continue to evolve and expand our advanced fiber-based Ethernet network in our Northern New England operations, which is an IP/MPLS network operating on a fiber transport infrastructure that has approximately 18,000 miles of fiber optic cable. This network is the largest IP/MPLS based network in northern New England. We have made significant investments in our fiber optic network to expand our business service offerings to meet the growing needs of our customers and to increase broadband speeds and capacity in our consumer markets. We expect to continue to invest in expanding the reach of our fiber network to connect directly to customers' premises, cellular towers and data centers. We monitor the fiber-based Ethernet network utilization and augment capacity as needed to avoid network problems. We believe this network architecture will enable us to efficiently respond to these technological changes.
Our fiber-based network transport systems in our Northern New England operations and our Telecom Group are a combination of Synchronous Optical Network, Dense Wave Division Multiplexing and Ethernet transport capable of satisfying customer demand for high speed bandwidth transport services. This system supports advanced services, including carrier Ethernet services and legacy data products, such as Frame Relay and ATM, facilitating delivery of advanced services as demand warrants.
In our LEC markets, DSL-enabled access technology has been deployed to provide significant broadband capacity to our customers. As of December 31, 2016, all of our central offices are capable of providing broadband services through DSL technology, cable modem and/or wireless broadband.
Our LEC network consists of 93 host central offices and 412 remote central offices, all with digital switches. Approximately 99% of our central offices are served by fiber optic facilities, which we own. The primary interconnection with other incumbent carriers is also fiber optic. Our outside plant consists of both fiber optic and copper distribution networks.
Competition
The communications industry is comprised of companies involved in the transmission of voice, data and video communications over various media and through various types of technologies. The competitive environment continues to intensify as consumers and businesses are provided more options for a variety of services, pricing and service quality. Presently, there are four predominant types of local telephone service providers, or carriers, in the communications industry: ILECs, CLECs, cable companies and wireless carriers. ILECs, which the majority of our 32 LECs operate as, were the traditional monopoly providers of the local telephone service prior to the passage of the Telecommunications Act of 1996 (the "1996 Act"). A CLEC is a competitor to local telephone companies that has been granted permission by a state regulatory commission to offer local telephone service in an area already served by an ILEC. CLECs typically offer voice and data services to their customers. Cable companies are the traditional video distribution providers in the market and are now selling packages of voice and data services along with their video services. Wireless competitors also have a significant presence in most markets, offering local and long distance voice services, along with mobile data offerings. As a result, competition in local exchange service areas for voice and data services has increased and is expected to continue to increase from these competitors.
Overall, we face intense competition from a variety of sources for our voice and data services in most of the areas we now serve, many of whom have greater resources and access to capital, and we expect that such competition will continue to intensify in the future. This competition has had an adverse impact on our access lines, broadband subscribers and revenues.
Regulations and technology change quickly in the communications industry, and these changes have historically had, and are expected to continue in the future to have, a significant impact on competitive dynamics. For instance, the ubiquity of wireless networks, coupled with technology changes, such as VoIP and data-driven devices (e.g., smartphones and computer tablets), is creating increased competition and technology substitution, a trend we expect will continue for the foreseeable future. Public monies in the form of stimulus funds to build broadband networks are also providing a new source of competition for us. In addition, many of our competitors have access to larger workforces or have substantially greater name-brand recognition and financial, technological and other resources than we do. Moreover, some of our competitors, including wireline, wireless and cable, have formed and may continue to form strategic alliances to offer bundled services in our service areas.
We estimate that, as of December 31, 2016, most of the customers that we serve have access to voice, network transport, video services and Internet services through a cable company. Increasingly, both CLECs and cable companies have begun to penetrate the market for high capacity circuits for large businesses and carriers, including interexchange and wireless providers.
9
In most of our service areas, we face competition from wireless carriers for voice and mobile data services. A large portion of households in the United States have moved to a wireless only model. Wireless carriers, particularly those that provide unlimited wireless service plans with no additional fees for long distance, offer customers a substitution service for our access lines and are becoming an increasing threat to our local voice line business. In addition, wireless companies continue to expand their high-speed Internet offerings, which have resulted in more intense competition for our high-speed Internet customers. Additionally, traditional wireline applications, such as home security systems, are now moving to IP-based models, leveraging an Internet connection in place of a traditional phone line. Although there are unique benefits of our wireline phone service, such as land lines remaining active in the event of a home power outage, we expect continued migration to IP-based and wireless voice services.
We are actively addressing our competitive environment with a multi-faceted approach to increase our market share. This approach is comprised of acquisition programs and new product introductions, retention programs, win-back and upsell initiatives.
Our relatively low current market share provides us the opportunity to both win back business customers who have left for another carrier as well as acquire new business. In order to better address the needs of our customers and prospects, we segment them across specific channels. Our focus for residential customers is to drive increasing penetration of high speed data customers. We are upgrading our access infrastructure to provide higher speed internet access services via high capacity copper and fiber facilities to more customers and communities each year. We are focusing on promotional programs that allow us to differentiate from cable operators, including price lock and multi-year discount programs. We believe bundled services continue to provide value to customers and, as such, we package our services in a range of price points.
In the business and government segments, our fiber-based network with approximately 18,000 miles of fiber, allows us to deliver Ethernet and fiber based data services typically ranging from 1 megabit per second to 1 gigabit per second. Along with our high capacity data services, we offer competitively priced voice services through VoIP or time division multiplexing ("TDM"). Our three contiguous state footprint in northern New England, allows businesses with multi-state locations to work with one local vendor. Our geographic coverage and extensive fiber network is an attractive feature for our wholesale customers, such as wireless carriers seeking cell tower backhaul services, and national carriers seeking middle and last mile solutions.
We have a multi-channel retention team, responsible for developing and executing customer retention programs across all areas of FairPoint. In addition, we have initiated proactive programs to address customers coming off of promotions and term contracts. Through early intervention, we expect to reduce churn and retain customers longer.
See "Regulatory and Legislative" below and "Item 1A. Risk Factors" included elsewhere in this Annual Report for more information regarding the competition that we face.
Employees
As of December 31, 2016, we employed approximately 2,500 employees, approximately 1,500 of whom were covered by 13 collective bargaining agreements. Our agreements with the International Brotherhood of Electrical Workers ("IBEW") and the Communications Workers of America ("CWA") in northern New England covering approximately 1,300 employees in the aggregate expire in August 2018.
Intellectual Property
We believe we own or have the right to use all of the intellectual property that is necessary for the operation of our business as we currently conduct it.
Regulatory and Legislative
We are generally subject to common carrier regulation primarily by federal and state governmental agencies. At the federal level, the FCC generally exercises jurisdiction over common carriers, such as us, to the extent those carriers provide, originate or terminate interstate or international communications. State regulatory commissions generally exercise jurisdiction over common carriers to the extent those carriers provide, originate or terminate intrastate telecommunications. In addition, pursuant to the Telecommunications Act of 1996, which amended the Communications Act of 1934 (as amended, the "Communications Act"), state and federal regulators share responsibility for implementing and enforcing the domestic pro-competitive policies introduced by that legislation.
We are required to comply with the Communications Act, which requires, among other things, that common carriers offer communications services at just and reasonable rates and on terms and conditions that are not unreasonably discriminatory. The Communications Act also contains requirements intended to promote competition in the provision of local services and lead to deregulation as markets become more competitive.
10
The FCC's CAF/ICC Order (as defined herein and sometimes referred to in the industry as the "Transformation Order") modified regulation for us beginning January 1, 2012. Effective January 1, 2012, the FCC eliminated the rural/non-rural distinction among ILECs and treats ILECs as either price cap or rate-of-return. Effective January 1, 2012, all of our ILECs are treated as price cap companies for CAF purposes, including the Telecom Group rate-of-return companies. However, the Telecom Group rate-of-return companies continue to be treated as rate-of-return for regulation of interstate switched and special access services. In addition, the FCC has preempted certain state regulation over our ILECs, including capping all state originating and terminating switched access charges and reducing terminating state switched access charges beginning July 1, 2012, in a two-year transition to make state switched access charges equal to interstate switched access charges. Starting July 1, 2014, all terminating usage rates have begun to transition to zero over the following four to seven years. As usage rates decrease under the FCC transition rules, resulting in decreased intercarrier compensation, carriers are allowed to increase end user access recovery charges to offset a substantial portion of the revenue losses. The impact of these changes for 2016 is described further below. However, in the long run, we are uncertain of the ultimate impact as federal and state regulations continue to evolve.
Overview of FCC CAF/ICC Order to Reform Universal Service and Intercarrier Compensation
On March 16, 2010, the FCC submitted the National Broadband Plan ("NBP") to the United States Congress. The NBP is a plan to bring high-speed Internet services to the entire country, including remote and high-cost areas. In accordance with the NBP, the FCC commenced several rulemakings that concern, among other things, reforming high-cost and low-income programs to promote universal service to make those funds more efficient while promoting broadband communications in areas that otherwise would be unserved and to address changes to interstate access charges and other forms of ICC.
On November 18, 2011, the FCC released its comprehensive landmark order to modify the nationwide system of universal support and the ICC system (the "CAF/ICC Order"). In this order, the FCC replaced all existing USF for price cap carriers with its CAF. The intent of CAF is to bring high-speed affordable broadband services to all Americans. The CAF/ICC Order fundamentally reforms the ICC process that governs how communications companies bill one another for exchanging traffic, gradually phasing down these charges.
In conjunction with the CAF/ICC Order, the FCC adopted a Notice of Proposed Rulemaking to deal with related matters, including but not limited to: (i) the actual cost model to be adopted for CAF Phase II funding, (ii) treatment of originating access charges, (iii) modifications to CAF for rate-of-return ILECs, (iv) development of CAF Phase II for mobility, (v) CAF Phase II competitive bidding rules, (vi) remote areas funding and (vii) IP to IP interconnection issues. In its Order released December 18, 2014, the FCC stated its intention to extend its offer of CAF Phase II support to price cap carriers in early 2015 and to implement the CAF Phase II program for price cap carriers during 2015. On April 29, 2015, the FCC released a Public Notice extending the offer of CAF Phase II funding to price cap carriers, as described in more detail below. As of year-end 2016, the FCC has issued competitive bidding guidelines but has not finalized rules for the competitive bidding process. It is not known how these rules may impact us.
CAF Phase I and Phase II Support. Pursuant to the CAF/ICC Order, beginning in 2012, we started receiving monthly CAF Phase I frozen support, which is based on and equal to all forms of USF high-cost support we received during 2011. This support was considered transitional funding while the FCC developed its CAF Phase II program. FCC rules required that if we continued receiving CAF Phase I frozen support beyond 2012, which we have, we would have specific broadband spending obligations starting in 2013, which we did and have met. According to the FCC rules, in 2013, we were required to spend, and did spend, one-third of the frozen support to "build and operate broadband-capable networks used to offer the provider's own retail broadband service in areas substantially unserved by an unsubsidized competitor." According to the FCC rules, in 2014, we were required to spend, and did spend, two-thirds of the frozen support to "build and operate broadband-capable networks used to offer the provider's own retail broadband service in areas substantially unserved by an unsubsidized competitor." For the CAF Phase I frozen support we receive, this spending obligation increased to 100% of the frozen support received in 2015 and subsequent years to "build and operate broadband-capable networks used to offer the provider's own retail broadband service in areas substantially unserved by an unsubsidized competitor." We were in compliance with the 2016 spending obligation and expect to be in compliance in 2017.
In a Public Notice released on April 29, 2015, the FCC extended an offer of CAF Phase II support to price cap carriers to fund the building and operation of voice and broadband-capable services in their service territories. In this Public Notice, the FCC offered $38.2 million of annual funding to us for six years in return for providing broadband services to a specified number of locations in eligible census blocks specified by the FCC. This compares with $39.3 million in annual CAF Phase I frozen funding that we received in 2014. On August 18, 2015, we announced our acceptance of $37.4 million in annual CAF Phase II support, which was effective retroactive to January 1, 2015. This includes support in all our operating states except Colorado and Kansas where we declined the offered CAF Phase II support.
The specific obligations associated with CAF Phase II funding include the obligation to serve approximately 105,000 locations in approximately 16,000 census blocks by December 31, 2020 (with interim milestones of 40%, 60% and 80% completion by
11
December 2017, 2018 and 2019, respectively); to provide broadband service to those locations with speeds of 10 megabits per second down and 1 megabit per second up; to achieve latency of less than 100 milliseconds; to provide data of at least 100 gigabytes per month; and to offer pricing reasonably comparable to pricing in urban areas.
For the two states where we declined CAF Phase II support, we will continue to receive CAF Phase I frozen support until such time as the FCC conducts a competitive bidding process. We expect the FCC to conduct the competitive bidding process during 2017. The FCC has determined that price cap carriers declining CAF Phase II support can participate in the competitive bidding process along with any other interested carriers. As of December 31, 2016, the FCC has not yet adopted final rules governing the competitive bidding process.
In addition, there is a three year transition for price cap carriers that choose to accept model-based support in states where the accepted support is less than the CAF Phase I frozen support. The determination of transition funding is made at the state level. From January 1, 2015 to July 31, 2015, and as prescribed by the FCC, such carriers received 100% of the difference between the annualized amount of CAF Phase II support that they accepted and the amount of CAF Phase I frozen support that they received in 2014. Beginning August 1, 2015, transitional funding stepped down to 75% of that amount and on August 1, 2016 transitional funding stepped down to 50% of the difference. On August 1, 2017 transitional funding steps down to 25% of the difference. Transitional support will terminate as of July 31, 2018, after which time carriers will receive only CAF Phase II support.
As prescribed by the FCC’s transitional plan and the transitional funding calculation, we have recognized or expect to recognize transitional funding, in addition to the $37.4 million annual CAF Phase II funding, based on the following schedule:
• | January 1, 2015 - July 31, 2015: $824,000 per month in transitional funding |
• | August 1, 2015 - July 31, 2016: $618,000 per month in transitional funding |
• | August 1, 2016 - July 31, 2017: $412,000 per month in transitional funding |
• | August 1, 2017 - July 31, 2018: $206,000 per month in transitional funding |
• | August 1, 2018 and after: no transitional funding |
FCC Rules for ICC Process. The CAF/ICC Order reformed rules associated with local, state toll and interstate toll traffic exchanged among communications carriers including ILECs, CLECs, cable companies, wireless carriers and VoIP providers. The revised rules, the majority of which were effective beginning July 1, 2012, establish separate rules for price cap carriers and rate-of-return carriers. Although the FCC order treats our rate-of-return carriers (including companies operating under average schedules) as price cap carriers for CAF funding, it treats them as rate-of-return carriers for purposes of ICC reform. For both price cap and rate-of-return carriers, the FCC established a multi-year transition of terminating traffic compensation to "bill and keep", or zero compensation. For both price cap and rate-of-return carriers, the FCC required carriers to establish fiscal year 2011 ("FY2011") baseline compensation, which was the amount of relevant compensation billed during the period beginning October 1, 2010 and ending September 30, 2011, and collected by March 31, 2012. This FY2011 revenue was used as a starting point for revenue for the transitional period, which is six years for price cap operations and nine years for rate-of-return operations. For each FairPoint ILEC, the FY2011 baseline revenue is reduced by a specified percent during each year of the transition, resulting in a target revenue for each tariff year of the transitional period. At the same time, the FCC rules require reductions in ICC rates for specified services and jurisdictions. As the recoverable revenue declines and the rates decline, any target revenue which will not be covered by ICC revenue can be recovered, in part, from end users through an access recovery charge ("ARC"). Price cap ILECs are permitted to implement monthly end user ARCs with five annual increases of no more than $0.50 for residential/single-line business consumers, for a total monthly ARC of no more than $2.50 in the fifth year; and no more than $1.00 (per month) per line for multi-line business customers, for a total of $5.00 (per month) per line in the fifth year, provided that: (1) any such residential increases would not result in regulated residential end user rates that exceed the $30.00 residential rate ceiling; and (2) any multi-line business customer's total subscriber line charge ("SLC") plus ARC does not exceed $12.20. Rate-of-return ILECs are permitted to implement monthly end user ARCs with six annual increases of no more than $0.50 (per month) for residential/single-line business consumers, for a total ARC of no more than $3.00 in the sixth year; and no more than $1.00 (per month) per line for multi-line business customers for a total of $6.00 (per month) per line in the sixth year, provided that: (1) such increases would not result in regulated residential end user rates that exceed the $30.00 Residential Rate Ceiling; and (2) any multi-line business customer's total SLC plus ARC does not exceed $12.20. We began billing the ARC charges for our price cap and rate of return companies in July 2012 as outlined by the rules above. If the combination of ICC and ARC revenue is not sufficient to cover the targeted revenue, then additional funding will be provided by the CAF in certain circumstances, though there is no guarantee that the ILEC will be made whole.
Access Charges
Our local exchange subsidiaries receive compensation from long distance communications providers for the use of our subsidiaries' network to originate and terminate state and interstate interexchange traffic. With respect to interstate traffic, the FCC regulates the prices we may charge for this purpose, referred to as access charges, as a combination of flat monthly charges paid by end users, usage sensitive charges paid by long distance carriers and recurring monthly charges for use of dedicated facilities paid by long distance carriers. Intrastate access charges are regulated by the state commissions. The amount of access charge
12
revenue that we will receive is subject to change. The FCC has adopted, in its CAF/ICC Order, a plan to resolve certain billing disputes related to ICC and to transition all terminating state and interstate ICC to zero over a six or nine year period for price cap and rate-of-return companies, respectively.
The FCC's CAF/ICC Order significantly changes the existing rates for access charges, which, combined with the increase in competition, have generally caused the aggregate amount of switched access charges paid by long distance carriers to decrease over time. The FCC, in a separate proceeding, is considering whether to modify price cap rules as they apply to special access and whether to restrict some of the pricing flexibility enjoyed by price cap ILECs, which includes some of our Northern New England operations. We cannot predict what changes, if any, the FCC may eventually adopt and the effect that any of these changes may have on our business.
Universal Service Regulation
Universal Service Fund Support. We benefit indirectly from support to low-income users under the Lifeline and Linkup universal service programs. Effective April 1, 2012, the Linkup program was eliminated for all low-income subscribers except for Native Americans. Currently Linkup pays 100% of the non-recurring installation charges, not to exceed $100.00, associated with establishment of local telecommunications service for qualified subscribers in Tribal areas. Also effective April 1, 2012, there were major reforms to the Lifeline program. Prior to the changes, Lifeline credits were based on four tiers of support. The first three tiers of federal support were replaced by a flat credit of $9.25 per month. The fourth tier, which relates to Native Americans, is unchanged. In addition, the FCC established revised eligibility criteria effective April 1, 2012. The revised eligibility criteria established in 2012 resulted in a reduction in lines eligible for Lifeline credits. The FCC order required the Universal Service Administration Company to establish a national database, now known as the National Lifeline Accountability Database (NLAD), which is used to eliminate duplicate funding. The elimination of duplicate support could result in fewer customers choosing us for Lifeline service, with the potential that a portion of our Lifeline customers may prefer to use other carriers for this service.
Universal Service Contributions. Federal universal service programs are currently funded through a surcharge on interstate and international end user telecommunications revenues. Declining long distance revenues, the popularity of service bundles that include local and long distance services, and the growth in size of the fund, due primarily to increased funding to competitive ETCs, all prompted the FCC to consider alternative means for collecting this funding. As an interim step, the FCC has ordered that providers of certain VoIP services must contribute to federal universal service funding. The FCC also increased the percentage of revenues subject to federal universal service contribution obligations that wireless providers may use as their methodology for funding universal service. We cannot predict whether the FCC or Congress will require modification to any of the universal service contribution rules, or the ultimate impact that any such modification might have on us or our customers.
Local Service Competition
The 1996 Act provides, in general, for the removal of barriers to market entry in order to promote competition in the provision of local communications and information services. As a result, competition in our local exchange service areas will continue to increase from CLECs, wireless providers, cable companies, Internet service providers, electric companies and other providers of network services. Many of these competitors have a significant market presence and brand recognition, which could lead to more competition and a greater challenge to our future revenue growth.
Under the 1996 Act, all LECs, including both ILECs and CLECs, are required to: (i) allow others to resell their services, (ii) ensure that customers can keep their telephone numbers when changing carriers, referred to as local number portability, (iii) ensure that competitors' customers can use the same number of digits when dialing and receive nondiscriminatory access to telephone numbers, operator service, directory assistance and directory listing, (iv) ensure competitive access to telephone poles, ducts, conduits and rights of way and (v) compensate competitors for the cost of completing calls to competitors' customers from the other carrier's customers.
In addition to these obligations, ILECs are subject to additional requirements to: (i) interconnect their facilities and equipment with any requesting telecommunications carrier at any technically feasible point, (ii) unbundle and provide nondiscriminatory access to certain network elements, referred to as unbundled network elements ("UNEs"), including some types of local loops and transport facilities, at regulated rates and on nondiscriminatory terms and conditions, to competing carriers that would be "impaired" without them, (iii) offer their retail services for resale at wholesale rates, (iv) provide reasonable notice of changes in the information necessary for transmission and routing of services over the ILEC's facilities or in the information necessary for interoperability and (v) provide, at rates, terms and conditions that are just, reasonable and nondiscriminatory, for the physical co-location of equipment necessary for interconnection or access to UNEs at the ILEC's premises. Competitors are required to compensate the ILEC for the cost of providing these services. On December 28, 2015, the FCC granted forbearance from some UNE requirements, finding that ILECs may no longer be required to offer bundled access to a 64-kps-voice channel when they replace copper loops with fiber. This is intended to facilitate copper replacement but we cannot predict whether we will benefit from this rule change.
13
Our Telecom Group rural operations are exempt from the ILEC requirements until the applicable rural carrier receives a bona fide request for these additional services and the applicable state authority determines that the request is not unduly economically burdensome, is technically feasible and is consistent with the universal service objectives set forth in the 1996 Act. This exemption is effective for all of the Telecom Group operations, except in Florida where the legislature has determined that all ILECs are required to provide the additional services as prescribed in the 1996 Act. Loss of a rural exemption by one or more of the Telecom Group operating companies could be achieved if the state commission grants such a petition filed by a competitor. Loss of the rural exemption would potentially expose the operation to additional local competition.
Long Distance Operations
The FCC has required that ILECs that provide interstate long distance services originating from their local exchange service territories must do so in accordance with "non-structural separation" rules. These rules have required that our long distance affiliates (i) maintain separate books of account, (ii) not own transmission or switching facilities jointly with the local exchange affiliate and (iii) acquire any services from their affiliated LEC at tariffed rates, terms and conditions. Our Northern New England operations, which are Bell Operating Companies, are subject to a different set of rules allowing them to offer both long distance and local exchange services in the regions where they operate as Bell Operating Companies, subject to certain conditions with which we comply. Not all of our competitors must comply with these requirements. Therefore, these requirements may put us at a competitive disadvantage in the interstate long distance market.
Other Obligations under Federal Law
We are subject to a number of other statutory and regulatory obligations at the federal level. For example, the Communications Assistance for Law Enforcement Act ("CALEA") requires telecommunications carriers to modify equipment, facilities and services to allow for authorized electronic surveillance based on either industry or FCC standards. Under CALEA and other federal laws, we may be required to provide law enforcement officials with call records, content or call identifying information, pursuant to an appropriate warrant or subpoena.
The FCC limits how carriers may use or disclose customer proprietary network information ("CPNI") and specifies what carriers must do to safeguard CPNI provided to third parties. Congress, as well as some state legislatures, has enacted legislation to criminalize the unauthorized sale of call detail records and to further restrict the manner in which carriers make such information available.
The Communications Act requires all ILECs to provide competing providers of telecommunications services access to poles, ducts, conduits and rights-of-way at regulated rates. In December 2015, the FCC decided to forbear from enforcing this requirement with respect to newly deployed entrance facility conduit on commercial property. We must continue providing access where we have existing facilities.
In addition, if we seek in the future to acquire companies that hold FCC authorizations, in most instances we will be required to seek approval from the FCC prior to completing those acquisitions. Similarly, if we seek to dispose of facilities or discontinue services, in most cases we must obtain prior FCC approval. The FCC has broad authority to condition, modify, cancel, terminate or revoke operating authority for failure to comply with applicable federal laws or rules, regulations and policies of the FCC. Fines or other penalties also may be imposed for such violations.
Broadband and Internet Regulation
A Verizon petition asking the FCC to forbear from applying common carrier regulation to certain broadband services sold by LECs primarily to larger business customers was deemed granted by operation of law on March 19, 2006 when the FCC did not deny the petition by the statutory deadline. The U.S. Court of Appeals for the District of Columbia Circuit has rejected a challenge to that outcome. The forbearance deemed granted to Verizon has been extended to our Northern New England operations by the FCC in its order approving the Spinco Merger. In October 2007, the FCC stated its intention to define more precisely the scope of forbearance obtained by Verizon, but it has not yet done so. On October 4, 2011, tw telecom, inc. filed a petition with the FCC asking it to reverse the forbearance granted to Verizon by operation of law on March 19, 2006. Comments have been filed in this proceeding by us and other parties. A similar petition was filed by a group of competing LECs on November 2, 2012 and comments have been filed with the FCC. The FCC may issue an order on either or both of these petitions at any time. We do not know how this will be resolved or the impact it may have on the Company if the FCC should reverse, eliminate or modify the forbearance granted to Verizon in 2006.
The FCC has imposed particular regulatory obligations on IP-based telephony. It has concluded that interconnected VoIP providers must comply with CALEA; provide enhanced 9-1-1 emergency calling capabilities; comply with certain disability access requirements; comply with the FCC's rules protecting the privacy of customer information; provide local number portability; and pay regulatory fees. The FCC has preempted some state regulation of VoIP.
14
There have been on-going discussions among policy makers concerning "net neutrality." The FCC released a statement of net neutrality principles favoring customer choice of content and services available over broadband networks. It has adopted open Internet access rules applicable to all broadband Internet access providers. On January 14, 2014, the United States Circuit Court of Appeals for the District of Columbia (the "D.C. Circuit") vacated portions of the FCC’s December 21, 2010 Report and Order in the Manner of Preserving the Open Internet (GN Docket 09-191) (the "Open Internet Order"). In its decision, the D.C. Circuit vacated the FCC's anti-blocking and anti-discrimination rule related to Internet Service Providers, finding the FCC had failed to explain the basis of its authority in the Open Internet Order.
The FCC adopted new regulations governing "Broadband Internet Access Services" at its February 26, 2015 Open Meeting (the "Order"). "Broadband Internet access service" is now classified as a "telecommunications service" under Title II of the Communications Act. The Order prohibits "unjust and unreasonable practices" by broadband Internet access providers. The Order prohibits broadband Internet access providers from blocking access to legal content, applications, services and non-harmful devices. It prohibits broadband Internet access providers from impairing or degrading lawful Internet traffic on the basis of content, applications, services or non-harmful devices. It also prohibits broadband Internet access providers from favoring some lawful Internet traffic over other lawful traffic in exchange for consideration and from prioritizing their own content or services over those of unaffiliated entities. Other than paid prioritization which is prohibited, broadband Internet access providers are allowed to engage in reasonable network management practices. Broadband services that do not flow over the public Internet are exempt from these rules. The Order allows consumer complaints to be brought to the FCC under Title II of the Communications Act. The Title II classification could bolster universal service support for broadband services by classifying broadband services as telecommunications services and therefore subject to universal service fees assessed on telecommunications services.
In addition, several bills have been introduced in Congress to modify the FCC's rules or restrict the FCC's authority to regulate net neutrality and broadband Internet access services.
We cannot predict what impact, if any, new laws or rules may have on our business, financial condition, results of operations, liquidity or the market price of our outstanding securities or if Congress will enact legislation otherwise addressing net neutrality issues.
State Regulation
The local service rates and intrastate access charges of substantially all of our telephone subsidiaries are regulated by state regulatory commissions which typically have the power to grant and revoke authority for authorizing companies to provide telecommunications services. In some states, our intrastate long distance rates are also subject to state regulation. States typically regulate local service quality, billing practices and other aspects of our business as well. As described above, intrastate access charges are subject to the transition plan established in the recent CAF/ICC Order.
Most state commissions have traditionally regulated LEC pricing through cost-based rate-of-return regulation. In recent years, however, state legislatures and regulatory commissions in most of the states in which our telephone companies operate have either reduced the regulation of LECs or have announced their intention to do so and we expect this trend will continue. Such relief may take the form of mandatory deregulation of particular services or rates; or it may consist of optional alternative forms of regulation ("AFOR"), which may involve price caps or other flexible pricing arrangements. Some of these deregulatory measures are described in greater detail below. We believe that some AFOR plans allow us to offer new and competitive services faster than under the traditional regulatory regimes.
Regulatory and Legislative for Vermont
Effective April 6, 2016, we entered into an Incentive Regulation Plan ("IRP") governing our Vermont service territory within our Northern New England operations. The IRP includes retail service quality reporting requirements. The new IRP is similar to our previous IRP which expired on April 5, 2016 and we believe the IRP has allowed our Northern New England operations' retail rates in Vermont to compete with those competitive carriers under a relatively level regulatory scheme, while preserving certain regulatory protections for consumers seeking basic voice services in areas where competition may not be adequate. This IRP allows the same regulatory flexibility in our Telecom Group retail operations in Vermont and is scheduled to expire on December 31, 2019. On August 10, 2015, we concluded a retail service quality investigation by entering into a Memorandum of Understanding ("MOU") between us and the Vermont Department of Public Service ("VDPS"), which was approved by the Vermont Public Service Board ("VPSB") on December 18, 2015. In accordance with the August 10, 2015 MOU and the December 18, 2015 VPSB Order, on February 16, 2016, we requested the VPSB to open a new investigation to evaluate the appropriateness of certain service quality metrics and to determine whether customer service quality metrics should apply in the future to customers with access to an alternative telecommunications provider. This investigation is in progress and any outcome from this investigation will be incorporated into the new IRP, if necessary.
15
On July 15, 2016, the VPSB opened a rulemaking proceeding to consider amending VPSB Rule 3.706(D)(1) regarding the rental calculation for pole attachments. The rulemaking is in its early stages, and neither a schedule nor scope of this rulemaking has been determined.
Regulatory and Legislative for Maine
Under the Maine Public Utilities Commission ("MPUC") rules (Chapter 201), which went into effect August 1, 2014, the MPUC may open an investigation regarding the failure to meet any of the established SQI benchmarks and has the authority to impose penalties. The MPUC opened an investigation into our failure to meet some third quarter 2014 SQI benchmarks and subsequently opened an investigation into the fourth quarter of 2014 and then with respect to each of the quarterly periods in 2015. On March 29, 2016, the MPUC consolidated the investigations of the six quarters into one investigation. On September 14, 2016, a hearing examiner for the MPUC issued a report recommending that the MPUC find that FairPoint had failed to meet SQI benchmarks for the period under review and impose a $500,000 penalty as allowed by statute, and provided until October 7, 2016 for comments or exceptions to be filed by interested parties. This recommendation did not constitute MPUC action. The Company promptly filed a motion to implement adjudicatory procedures prior to entry of any final order. After the Company’s motion to implement adjudicatory procedures was briefed by the parties, the Hearing Examiner issued an order on November 30, 2016 granting the Company’s motion in part and permanently withdrawing the Examiner’s September 14, 2016 report. A case schedule was established by the Hearing Examiner, and a hearing is currently scheduled to begin May 11, 2017.
During 2014, we filed a rate case with the MPUC seeking increases in rates for POLR customers and seeking Maine Universal Service Fund ("MUSF") support for unrecovered costs associated with our obligation to provide POLR service to high cost areas. The MPUC allowed increases to the end user POLR rates, but denied MUSF support to us.
On April 13, 2016, LD 466, An Act to Increase Competition and Ensure Robust information and Telecommunications Market, was passed into law and became effective on July 28, 2016. The new law removes the regulation on POLR service in the most competitive municipalities on a phased in approach. The seven largest municipalities were deregulated effective August 28, 2016 (the POLR rate is grandfathered for one year), followed by five communities every six months until reaching a total of 22. These 22 municipalities represent approximately one third of the population and POLR customers. LD 466 provides a path forward for additional municipalities to be deregulated upon petitioning the PUC. Also included in the law is the removal of POLR tariffs statewide.
Reporting of service quality will be required only in the areas of the state where POLR is still required and will be filed and treated as confidential. The number of SQI reporting metrics has been reduced and the benchmarks are less stringent than under previous Commission rules. The Commission is empowered to investigate failures to meet a service quality requirement. If the Commission concludes after investigation that the failure to meet a service quality requirement is due to factors within the control of the price cap ILEC, the Commission shall, by order, impose such steps as the Commission determines necessary to meet the requirement. If the provider fails to comply with the order, the Commission shall impose a penalty in an amount sufficient to ensure compliance with that order.
Local Government Authorizations
We may be required to obtain from municipal authorities permits for street opening and construction or operating franchises to install and expand facilities in certain communities. If we more fully enter into video markets, municipal franchises may be required for us to operate as a cable television provider. Some of these franchises may require the payment of franchise fees. We have historically obtained municipal franchises as required. In some areas, we will not need to obtain permits or franchises because the subcontractors or electric utilities with which we will have contracts already possess the requisite authorizations to construct or expand our networks. In association with the American Recovery and Reinvestment Act of 2009 and other federal government programs, there may be an increase in our requirements associated with road move requests pursuant to new funding for roads. It is not certain whether funding will be available to us for this potential obligation.
Environmental Regulations
Like all other local telephone companies, our 32 LECs are subject to federal, state and local laws and regulations governing the use, storage, disposal of and exposure to hazardous materials, the release of pollutants into the environment and the remediation of contamination. As an owner of real property, we may be subject to environmental laws that impose liability for the entire cost of cleanup at contaminated sites, regardless of fault or the lawfulness of the activity that resulted in contamination. We believe, however, that our operations are in substantial compliance with applicable environmental laws and regulations.
16
Reorganization
On October 26, 2009, the Company and substantially all of its direct and indirect subsidiaries filed voluntary petitions for relief under chapter 11 of title 11 of the United States Code. These cases were jointly administered under the caption In re FairPoint Communications, Inc. in the United States Bankruptcy Court for the Southern District of New York. On January 24, 2011, the Company substantially consummated its reorganization through a series of transactions contemplated by its Third Amended Joint Plan of Reorganization Under Chapter 11 of the United States Code (the "Plan").
Other Information
We make available free of charge on our website, www.fairpoint.com, our reports on Forms 10-K, 10-Q and 8-K and all amendments to such reports as soon as reasonably practicable after we electronically file such material with, or furnish such material to, the SEC. Our filings with the SEC are available to the public over the Internet at the SEC's website at www.sec.gov, or at the SEC's Public Reference Room located at 100 F Street, N.E., Washington, DC 20549. Please call the SEC at 1-800-SEC-0330 for further information on the operation of the Public Reference Room.
ITEM 1A. RISK FACTORS
Any of the following risks could materially adversely affect our business, consolidated financial condition, results of operations, liquidity and/or the market price of our outstanding securities. The risks described below are not the only risks facing us. Additional risks and uncertainties not currently known to us or that we currently consider immaterial may also materially and adversely affect our business operations.
Risks Related to the Merger with Consolidated Communications Holdings, Inc.
The announcement and pendency of the Merger may have a material adverse effect on our business.
Uncertainty about the effect of the Merger on our employees, suppliers, customers and other parties may have a material adverse effect on our business. Although we intend to take steps designed to reduce any adverse effects, these uncertainties could impair our ability to retain and motivate key personnel and could cause customers, suppliers and others that deal with us to defer entering into contracts, or making other decisions, concerning doing business with us or seek to change existing business relationships with us. The pursuit of the Merger and the preparation for the integration may place a significant burden on our management and internal resources. In addition, we have diverted, and will continue to divert, significant management resources towards the completion of the Merger. The diversion of management’s attention away from day-to-day business concerns and any difficulties encountered in the transition and integration process could adversely affect our financial results. In addition, the Merger Agreement restricts us from taking certain actions without the consent of Consolidated. These uncertainties and restrictions could disrupt or adversely affect our business and prevent us from pursuing otherwise attractive business opportunities that may arise prior to the completion of the Merger or termination of the Merger Agreement.
FairPoint Communications, the members of our board of directors, Consolidated and Merger Sub have been named as defendants in a lawsuit brought by a purported stockholder of FairPoint Communications challenging the Merger and seeking, among other things, to enjoin the defendants from consummating the Merger on the agreed-upon terms or to rescind the Merger if it is completed, in addition to damages. Additional lawsuits challenging the Merger may be filed, which may name us and/or our board of directors as defendants. We cannot assure you as to the outcome of such lawsuits, including the amount of costs associated with defending any such claim or any other liabilities that may be incurred in connection with the litigation of any such claim. One of the conditions to the closing of the Merger is the absence of any order, injunction or other legal restraint by a court or other governmental entity of competent jurisdiction that prevents the consummation of the Merger. Accordingly, if any plaintiff in any lawsuit is successful in obtaining an injunction prohibiting the parties from completing the Merger on the agreed-upon terms, such an injunction may delay the consummation of the Merger in the expected timeframe, or may prevent the Merger from being consummated altogether. Whether or not any plaintiff’s claim is successful, this type of litigation may result in significant costs and diverts management’s attention and resources, which could adversely affect the operation of our business.
There may be unexpected delays in the completion of the Merger, or the Merger may not be completed at all.
The Merger is currently expected to close around the middle of 2017, assuming that all of the conditions in the Merger Agreement are satisfied or waived. Certain events may delay the completion of the Merger or result in a termination of the Merger Agreement. Some of these events are outside the control of either party. In particular, completion of the Merger requires approval by the stockholders of each of FairPoint Communications and Consolidated. If the required vote of the stockholders of FairPoint Communications is not obtained at the FairPoint Communications stockholder meeting (including any adjournments or
17
postponements thereof) at which the Merger has been voted upon, either we or Consolidated may terminate the Merger Agreement. In addition, if the required vote of the stockholders of Consolidated is not obtained by September 30, 2017, then either we or Consolidated may terminate the Merger Agreement. We may incur significant additional costs in connection with any delay in completing the Merger or the termination of the Merger Agreement, in addition to significant transaction costs, including legal, financial advisory, accounting and other costs we have already incurred.
We can neither assure you that the conditions to the completion of the Merger will be satisfied or waived or that any adverse change, effect, event, circumstance, occurrence or state of facts that could give rise to the termination of the Merger Agreement will not occur, and we cannot provide any assurances as to whether or when the Merger will be completed.
Failure to complete the Merger in a timely manner or at all could negatively affect our stock price and future business and financial results.
Delays in completing the Merger or the failure to complete the Merger at all could negatively affect our future business and financial results, and, in that event, the market price of our common stock may decline significantly, particularly to the extent that the current market price reflects a market assumption that the Merger will be completed. If the Merger is not completed for any reason, we will be subject to several risks, including the diversion of management focus and resources from operational matters and other strategic opportunities while working to implement the Merger, any of which could materially adversely affect our business, financial condition, results of operations and the value of our stock price. A failed transaction may result in negative publicity and a negative impression of us in the investment community. Further, any disruptions to our business resulting from the announcement and pendency of the Merger, including any adverse changes in our relationships with our customers, suppliers and employees, could continue or accelerate in the event of a failed transaction. In addition, if we do not complete the Merger, we may be required to pay a termination fee of $18.9 million under certain circumstances set forth in the Merger Agreement.
In addition, we have incurred, and will continue to incur, significant costs, expenses and fees for professional services and other transition costs in connection with the Merger. We will be required to pay such costs relating to the transaction whether or not the Merger is consummated.
The completion of the Merger is subject to the receipt of consents, approvals, and clearances from regulatory entities, which may impose conditions that could have an adverse effect on us or could cause either Consolidated or FairPoint Communications to abandon the Merger.
The Merger requires certain consents, approval, and clearances from regulatory entities, including approval from the FCC and approval of regulatory authorities in a number of the states in which we and Consolidated operate. Regulatory entities may oppose the Merger or impose certain requirements or obligations as conditions for their approval or in connection with their review, which may be materially adverse to us, Consolidated, or the combined company. Regulatory approvals of the Merger may not be obtained on a timely basis or at all, and such approvals may include conditions that could delay the completion of the Merger, could lessen or eliminate the anticipated potential benefits of the Merger, or could result in the abandonment of the Merger.
We will incur significant transaction and Merger-related transition costs.
We have incurred and expect that we will continue to incur significant costs in connection with completing the Merger and integrating the operations of the two companies. Some of these costs are payable regardless of whether the transaction is completed. If the Merger is not completed, we will not receive any benefit from these expenditures.
Risks Related to our Common Stock and Our Substantial Indebtedness
The price of our common stock may be volatile and may fluctuate substantially, which could negatively affect holders of our common stock.
The market price of our common stock may fluctuate widely as a result of various factors including, but not limited to, period-to-period fluctuations in our operating results, the volume of sales of our common stock, the limited number of holders of our common stock and the resulting limited liquidity in our common stock, dilution, developments in the communications industry, the failure of securities analysts to cover our common stock, changes in financial estimates by securities analysts, short interests in our common stock, competitive factors, regulatory developments, labor disruptions, economic and other external factors, general market conditions and market conditions affecting the stock of communications companies in general. Communications companies have, in the past, experienced extreme volatility in the trading prices and volumes of their securities, which has often been unrelated to operating performance. High levels of market volatility may have a significant adverse effect on the market price of our common stock. In addition, in the past, securities class action litigation has often been instituted against companies following periods of volatility in their stock prices. This type of litigation could result in substantial costs and divert management's attention and
18
resources, which could have a material adverse impact on our business, financial condition, results of operations, liquidity and/or the market price of our common stock.
We have substantial indebtedness which could have a negative impact on our financing options and liquidity position and prevent us from fulfilling our financial obligations.
As of December 31, 2016, our total gross indebtedness was approximately $918.5 million (including $2.5 million of capital leases) and $61.1 million was available for borrowing under the Revolving Facility (as defined in “Item 7. Management's Discussion and Analysis of Financial Condition and Results of Operations—Liquidity and Capital Resources—Debt”), net of $13.9 million outstanding letters of credit. See “Item 7. Management's Discussion and Analysis of Financial Condition and Results of Operations—Liquidity and Capital Resources—Debt” included elsewhere in this Annual Report for more information, including maturities. Our substantial indebtedness could have important consequences including:
• | making it more difficult for us to satisfy our financial obligations; |
• | requiring us to dedicate a significant portion of our cash flow from operations to paying the principal of and interest on our indebtedness, thereby limiting the availability of our cash flow to fund future capital expenditures, working capital and other corporate purposes; |
• | limiting our ability to obtain additional financing in the future for working capital, capital expenditures or acquisitions; |
• | limiting the amount of dividends we could pay to our stockholders; |
• | limiting our ability to refinance our indebtedness on terms acceptable to us or at all; |
• | restricting us from engaging in strategic transactions or causing us to make non-strategic divestitures; |
• | limiting our flexibility in planning for, or reacting to, changes in our business and the communications industry generally; |
• | placing us at a competitive disadvantage compared with competitors that have a less significant debt burden; and |
• | making us more vulnerable to economic downturns and limiting our ability to withstand competitive pressures. |
Our ability to continue to fund our debt service requirements and to reduce our indebtedness may be affected by general economic, financial market, competitive, legislative and regulatory factors, among other things. An inability to fund our debt service requirements, reduce our indebtedness or satisfy debt covenant requirements could have a material adverse effect on our business, financial condition, results of operations, liquidity and/or the market price of our outstanding securities.
In addition, our borrowings under our Credit Agreement (as defined in "Item 7. Management's Discussion and Analysis of Financial Condition and Results of Operations—Liquidity and Capital Resources—Debt") bear interest at a variable rate based on a British Bankers Association LIBOR rate ("LIBOR"), subject to a floor of 1.25%. We have entered into interest rate swap agreements that effectively fix the interest rate on a combined notional amount of $170.0 million of these borrowings; these agreements were effective September 30, 2015. If the relevant LIBOR increases above the level of the floor, the interest payments on our variable rate debt will increase and adversely affect our cash flow. Conversely, while LIBOR remains below 1.25%, we may incur interest costs above market rates. While our interest rate swap agreements and any future agreements we enter into may limit our exposure to higher interest rates, these agreements may not offer complete protection from this risk.
We may incur significant additional amounts of debt, which could further exacerbate the current risks associated with our substantial indebtedness.
We may incur substantial additional indebtedness in the future. Although the indenture governing our 8.75% senior secured notes due 2019 (the "Indenture") and our Credit Agreement contain restrictions on the incurrence of additional indebtedness, these restrictions are subject to a number of significant qualifications and exceptions and, under certain circumstances, the amount of indebtedness that could be incurred in compliance with these restrictions could be substantial. If new debt is added to our existing debt levels, the related risks that we now face could increase.
To operate and expand our business, service our indebtedness and meet our other cash needs, we will require a significant amount of cash, which may not be available to us. We may not be able to generate sufficient cash to repay or refinance our indebtedness at maturity or otherwise or to fund our operations, and may be forced to take other actions to satisfy such obligations, which may not be successful.
Our ability to make payments on, or repay or refinance, our indebtedness, to fund our operations and to fund planned capital expenditures, unanticipated capital expenditures and other cash needs will depend largely upon our financial condition and operating performance, including our ability to execute on our business plan. Our future operating performance, to a certain extent, is subject to general economic, financial, competitive, legislative, regulatory and other factors, such as any pension contributions required by the Employee Retirement Income Security Act of 1974, as amended ("ERISA"), that are beyond our control. For example, the
19
minimum amount of pension contributions that we are required to make, which may be substantial, are determined under ERISA.
Our ability to borrow additional amounts, including under the Revolving Facility, if necessary to meet our cash needs, will depend on our ability to remain in compliance with the covenants contained in our debt agreements. If our operating results are not adequate to meet the financial ratio tests in our debt agreements or if we are unable to generate sufficient cash to service our debt requirements, we will be required to restructure or refinance our existing indebtedness, which we may not be able to accomplish under such circumstances on commercially reasonable terms or at all. If we are unable to refinance our debt or obtain new financing under these circumstances, we may have to consider other options, including without limitation:
• | sales of assets; |
• | reduction or delay of capital expenditures, strategic acquisitions, investments and alliances; |
• | obtaining additional capital; or |
• | negotiations with our lenders to restructure or refinance the applicable debt. |
Our ability to restructure or refinance our indebtedness may depend on the condition of the capital markets and our financial condition at such time, and any such restructuring and/or refinancing may come with higher interest rates and more onerous covenants. These alternative measures may not be successful and may not permit us to meet our scheduled debt service obligations.
An inability to generate sufficient cash from operations to repay or refinance our indebtedness at maturity or otherwise or to fund our operations could have a material adverse impact on our business, financial condition, results of operations, liquidity and/or the market price of our outstanding securities.
Our debt agreements contain restrictions that limit our flexibility in operating our business.
The Credit Agreement and the Indenture contain various covenants that limit our ability to engage in specified types of transactions. These covenants, under certain circumstances, limit us and our restricted subsidiaries' ability to, among other things:
• | incur additional indebtedness; |
• | pay dividends on, repurchase or make distributions in respect of our capital stock or make other restricted payments; |
• | make certain investments; |
• | sell certain assets; |
• | create or incur liens; |
• | enter into sale and leaseback transactions; |
• | consolidate, merge, sell or otherwise dispose of all or substantially all of our assets; and |
• | enter into certain transactions with our affiliates. |
A breach of any of these covenants could result in a default under the Credit Agreement or the Indenture. In addition, any debt agreements we enter into in the future may further limit our ability to enter into certain types of transactions. A breach of any of these covenants could result in a default under one or more of these agreements, including as a result of cross default provisions. Such default may allow the creditors to accelerate the related debt and may result in the acceleration of any other debt to which a cross-acceleration or cross-default provision applies.
In addition, the restrictive covenants in the Credit Agreement require us to maintain specified financial ratios and to satisfy other financial condition tests. Our ability to meet those financial ratios and tests depends on our ongoing financial and operating performance, which, in turn, is subject to economic conditions and to financial, market, and competitive factors, many of which are beyond our control. See “Item 7. Management's Discussion and Analysis of Financial Conditions and Results of Operations —Liquidity and Capital Resources” included elsewhere in this Annual Report for more information regarding the Credit Agreement and the Indenture.
FairPoint Communications is a holding company and depends upon the cash flows of its operating subsidiaries to service its indebtedness and meet its other cash flow needs.
FairPoint Communications is a holding company and conducts no operations. Accordingly, its cash flow and its ability to make payments on, or repay or refinance, its indebtedness and to fund planned capital expenditures and other cash needs will depend largely upon the cash flows of its operating subsidiaries and the distribution of cash by those subsidiaries to it through repayment of loans, dividends, management fees or otherwise. Distributions to FairPoint Communications from its subsidiaries will depend on their respective operating results and will be subject to restrictions under, among other things:
20
• | the laws of their jurisdiction of organization; |
• | the rules and regulations of state and federal regulatory authorities; |
• | agreements of those subsidiaries, including agreements governing their indebtedness, if any; and |
• | regulatory orders. |
FairPoint Communications' subsidiaries have no obligation, contingent or otherwise, to make funds available, whether in the form of loans, dividends or other distributions, to it. Any inability to receive distributions from its subsidiaries could have a material adverse impact on our business, financial condition, results of operations, liquidity and/or the market price of our outstanding securities.
Limitations on our ability to use NOL carryforwards, and other factors requiring us to pay cash to satisfy our tax liabilities in future periods, may affect our ability to fund our operations, make capital expenditures and repay our indebtedness.
Effective December 31, 2011, our NOLs were substantially reduced by the recognition of gains on the discharge of certain debt pursuant to the Plan. In addition, our emergence from bankruptcy resulted in an ownership change for federal income tax purposes under Section 382 of the Internal Revenue Code of 1986, as amended (the "Code"). This followed previous ownership changes resulting from our initial public offering in February 2005, which resulted in an "ownership change" within the meaning of the United States federal income tax laws addressing NOL carryforwards, alternative minimum tax credits and other similar tax attributes. Moreover, the Spinco Merger resulted in a further ownership change for these purposes. As a result of these ownership changes, there are specific limitations on our ability to use these NOL carryforwards and other tax attributes from periods prior to our emergence from bankruptcy. Furthermore, additional limitations on the use of NOLs could arise in the future if a 50% or more change in ownership as defined under the Code were to occur. Although we do not expect that these limitations will materially affect our United States federal and state income tax liability in the near term, it is possible in the future if we were to generate taxable income in excess of the limitation on usage of NOL carryforwards that these limitations could limit our ability to utilize the carryforwards and, therefore, result in an increase in our United States federal and state income tax payments over the amount we otherwise would have, had we not experienced an ownership change. In addition, in the future we will be required to pay cash to satisfy our tax liabilities when all of our NOL carryforwards have been used or have expired. Limitations on our usage of NOL carryforwards, and other factors requiring us to pay cash taxes, would reduce the amount available to fund our operations, make capital expenditures and service our indebtedness in the future, which could have a material adverse impact on our business, financial condition, results of operations, liquidity and/or the market price of our outstanding securities.
Concentration of ownership among stockholders may prevent new or current investors from influencing significant corporate decisions.
Based on Schedules 13D and 13G filed by the respective holders, as of February 27, 2017, there are some institutional holders who own 5% or more of our outstanding common stock. As a result, these stockholders may be able to exercise significant control over all matters requiring stockholder approval, including the Merger, the election of directors, amendment of our certificate of incorporation and approval of corporate transactions and could gain significant control over our management and policies as a result thereof.
Future sales or the possibility of future sales of a substantial amount of our common stock may depress the price of our common stock.
Future sales, or the availability for sale in the public market, of substantial amounts of our common stock could adversely affect the prevailing market price of our common stock and could impair our ability to raise capital through future sales of equity securities. The market price of our common stock could decline as a result of sales of a large number of shares of our common stock in the market or the perception that these sales could occur. These sales, or the possibility that these sales may occur, may also make it more difficult for us to obtain additional capital by selling equity securities in the future at a time and at a price that we consider appropriate.
As of February 27, 2017, we had 27,266,570 shares of common stock outstanding. All such shares are freely traded except for any shares of our common stock that may be held or acquired by our directors, executive officers, employee insiders and other affiliates, as that term is defined in the Securities Act, which will be restricted securities under the Securities Act. Restricted securities may not be sold in the public market unless the sale is registered under the Securities Act or an exemption from registration is available. In addition, Angelo Gordon & Co., L.P. ("Angelo Gordon") and entities advised by Angelo Gordon have certain registration rights with respect to the common stock they hold or may acquire in the future.
We may issue shares of our common stock, or other securities, from time to time as consideration for future acquisitions and investments. In the event any such acquisition or investment is significant, the number of shares of our common stock, or the
21
number or aggregate principal amount, as the case may be, of other securities that we may issue may in turn be significant. We may also grant registration rights covering these shares or other securities in connection with any such acquisitions and investments.
Risks Related to Our Business
We provide services to customers over access lines, and since we have been losing access lines, if our efforts to mitigate this decline and transition to alternative revenue is not successful, our business, financial condition, results of operations, liquidity and/or the market price of our outstanding securities may be materially adversely affected.
We, along with the communications industry in general, have experienced a decline in access lines and network access revenues and will be further unfavorably impacted in the long-term by the FCC's recent CAF/ICC Order on intercarrier compensation. See "Risks Relating to Our Regulatory Environment" for specific risks associated with the impact of regulatory reform. We generate revenue primarily by delivering voice and data services over access lines. During the years ended December 31, 2016 and 2015, we continued to experience access line loss. These losses resulted mainly from competition, including competition from bundled offerings by cable companies, the use of alternate technologies, including wireless, as well as challenging economic conditions and the offering of DSL services.
We expect to continue to experience net access line losses. Our strategy of providing broadband and advanced data services, such as Ethernet over fiber and copper plant, may not be sufficient to offset the revenue impact of continued access line loss. Our inability to retain access lines and successfully offset such losses with alternative revenue could adversely affect our business, financial condition, results of operations, liquidity and/or the market price of our outstanding securities.
We provide access services to other communications companies, and if these companies were to find alternative means of providing services, become insolvent or experience substantial financial difficulties, our business, financial condition, results of operations, liquidity and/or the market price of our outstanding securities may be materially adversely affected.
We originate and terminate calls on behalf of long distance carriers and other interexchange carriers over our network in exchange for payment of switched access charges. Interstate and intrastate access charges represented approximately 29% of our total revenues during the twelve months ended December 31, 2016. Terminating switched access rates are scheduled to decline under the FCC's recent CAF/ICC Order. See "Risks Relating to Our Regulatory Environment" for specific risks associated with the impact of regulatory reform. We may not be successful in offsetting these declines through regulatory replacement mechanisms or operational means. Further, should one or more of these carriers find alternative means of providing services, loss of revenues from these carriers could have a material adverse impact on our business, financial condition, results of operations, liquidity and/or the market price of our outstanding securities. In addition, should one or more of the carriers that we do business with become insolvent or experience substantial financial difficulties, our inability to timely collect access charges from them could have a material adverse impact on our business, financial condition, results of operations, liquidity and/or the market price of our outstanding securities.
We are subject to competition that may materially adversely impact our business, financial condition, results of operations, liquidity and/or the market price of our outstanding securities.
We face intense competition from a variety of sources for our voice, network transport and Internet services in nearly all of the areas we now serve. Regulations and technology change quickly in the communications industry and changes in these factors historically have had, and in the future may have, a significant impact on competitive dynamics. In most of our service areas, we currently face competition from wireless carriers for voice services and increasingly for Internet services. As technology and economies of scale have improved, competition from wireless carriers has increased and is expected to further increase. We also face increasing competition from wireline and cable television companies for our voice and Internet services. We estimate that most of the customers that we serve have access to voice, network transport and Internet services through a cable television company. Wireline and cable television companies have the ability to bundle their services, which has and is expected to continue to intensify the competition we face from these providers. VoIP providers, Internet service providers and satellite companies also compete with our services and such competition has increased and is expected to continue to increase in the future. In addition, many of our competitors have access to a larger workforce and have substantially greater name-brand recognition and financial, technological and other resources including, in the case of cable television providers, free advertising on their video services.
In addition, consolidation and strategic alliances within the communications industry and the development of new technologies have had and may continue to have an effect on our competitive position. We cannot predict the number of competitors that will emerge, particularly in light of possible regulatory or legislative actions that could facilitate or impede market entry, but increased competition from existing and new entities could have a material adverse effect on our business, financial condition, results of operations, liquidity and/or the market price of our outstanding securities.
22
Competition may lead to loss of revenues and profitability as a result of numerous factors, including:
• | loss of customers (given the likelihood that when we lose customers for local service, we will also lose them for all related services); |
• | reduced network usage by existing customers who may use alternative providers for voice and data services; |
• | reductions in the prices we charge to meet competition; and |
• | increases in marketing expenditures and discount and promotional campaigns to incent customers to choose our services. |
Price increases or price retention for certain products and customers may result in an acceleration of access line losses or an unanticipated decline in our growth-oriented products, which may materially adversely affect our business, financial condition, results of operations, liquidity and/or the market price of our outstanding securities.
From time to time, we expect to implement price increases for certain products and customers. Although we intend for the price increase to provide a net revenue benefit, it is possible that customers will disconnect at a faster rate than they otherwise would have, which could negate the benefit of the price increase. Additionally, a weaker economic environment can result in increased demand by our customers for price reductions at the same or better level of service. In some of our more competitive markets, we may need to offer more favorable terms to our customers for contract renewal, which could result in reduced profitability. Despite continuous efforts by our sales force to retain customers, we cannot provide assurance that we will be able to renew customers dissatisfied with our contract renewal terms.
We may not be able to successfully integrate new technologies, respond effectively to customer requirements or provide new services.
Rapid and significant changes in technology and new service introductions occur frequently in the communications industry and industry standards evolve continually, including but not limited to a transition in the industry from primarily voice products to data services. We cannot predict the effect of these changes on our competitive position, profitability or the industry. Technological developments may reduce the competitiveness of our networks and require unbudgeted upgrades or the procurement of additional products that could be expensive and time consuming. In addition, new products and services arising out of technological developments may reduce the attractiveness of our existing services. If we fail to adapt successfully to technological changes or obsolescence or fail to obtain access to important new technologies, we could lose customers and be limited in our ability to attract new customers and sell new services to our existing customers, which could have a material adverse impact on our business, financial condition, results of operations, liquidity and/or the market price of our outstanding securities.
The geographic concentration of our operations in Maine, New Hampshire and Vermont make our business susceptible to local economic and regulatory conditions and consumer trends, and an economic downturn, recession or unfavorable regulatory action in any of those states may materially adversely affect our business, financial condition, results of operations, liquidity and/or the market price of our outstanding securities.
Our service territory spans 17 states. As of December 31, 2016, 83% of our total residential voice lines were located in Maine, New Hampshire and Vermont (including certain of our Telecom Group service companies). As a result of this geographic concentration, our financial results will depend significantly upon economic conditions and consumer trends in these markets. Deterioration in economic conditions in any of these markets could result in a further decrease in demand for our services and resulting loss of access line equivalents which could have a material adverse effect on our business, financial condition, results of operations, liquidity and/or the market price of our outstanding securities.
In certain areas of our service territory, the need for our services is seasonal (including either winter or summer), which may result in revenue fluctuations quarter over quarter. While we attempt to forestall seasonal disconnects or seasonal suspends, some revenue fluctuations continue to occur and once a customer disconnects or suspends, he or she may not return as a customer.
In addition, if state regulators or legislators in Maine, New Hampshire or Vermont were to take an action that is adverse to our operations in those states, we could suffer greater harm from that action than we would from action in other states because of the concentration of our operations in those states.
We may need to defend ourselves against claims that we infringe upon others' intellectual property rights or may need to seek third-party licenses to expand our product offerings.
From time to time, we receive notices from third parties or are named in lawsuits filed by third parties claiming we have infringed or are infringing upon their intellectual property rights. We may receive similar notices or be involved in similar lawsuits in the future. Responding to these claims may require us to expend significant time and money defending our use of affected technology, may require us to enter into licensing agreements requiring license payments that we would not otherwise have to pay
23
or may require us to pay damages. If we are required to take one or more of these actions, our operating expenses may increase. In addition, in responding to these claims, we may be required to stop selling or redesign one or more of our products or services, which could significantly and adversely affect the way we conduct business.
Similarly, from time to time, we may need to obtain the right to use certain patents or other intellectual property from third parties to be able to offer new products and services. If we cannot license or otherwise obtain rights to use any required technology from a third party on reasonable terms, our ability to offer new products and services may be restricted, made more costly or delayed.
We depend on third party providers for certain of our billing functions, IT services, including network support and improvements, and for the provision of our long distance and bandwidth services.
We have agreements with outside service providers to perform a portion of our billing functions and for our provision of long distance and bandwidth services. We also rely on certain third parties for IT services, including network support and improvements.
If these service providers are unable to adequately perform such services or if one of them experiences a significant degradation or failure with respect to such services, it could result in disruptions in our billing, IT systems and/or long distance and bandwidth services. Service failures could also result in internal controls deficiencies, which could adversely impact our overall control assessment of internal control in accordance with the Sarbanes-Oxley Act of 2002. Furthermore, if these agreements are terminated for any reason, we may be unable to find an alternative service provider in a timely manner or on terms acceptable to us, and may be unable ourselves to perform the services they provide.
With respect to the agreements governing our long distance and bandwidth services, these agreements are based, in part, on our estimate of future supply and demand and may contain minimum volume commitments. If we overestimate demand, we may be forced to pay for services we do not need. If we underestimate demand, we may need to acquire additional capacity on a short-term basis at unfavorable prices, assuming additional capacity is available. If additional capacity is not available, we may not be able to meet this demand. In addition, if we cannot meet any minimum volume commitments, we may be subject to underutilization charges, termination charges or rate increases.
If any of the foregoing events occur with respect to our third-party providers, our business, financial condition, results of operations, liquidity and/or the market price of our outstanding securities could be materially adversely affected.
A network disruption could cause delays or interruptions of service, including for 9-1-1 service, which could cause us to lose customers, engage in litigation, incur fines or otherwise adversely impact our business.
To be successful, we will need to continue to provide our customers with reliable and uninterrupted service over our expanded network. Disruptions in our service could occur as a result of events that are beyond our control. Some of the risks to our network and infrastructure include:
• | physical damage to our transmission network including poles, cable and access lines; |
• | widespread power surges or outages; |
• | software defects in critical systems; |
• | capacity limitations resulting from changes in our customers' usage patterns; |
• | human error; and |
• | damage intentionally inflicted upon the network or our other infrastructure. |
From time to time, in the ordinary course of business, we have experienced and in the future may experience short disruptions in our service due to factors such as cable damage, inclement weather and service failures of our third-party service providers. We could experience more significant disruptions in the future. In addition, certain portions of our network may lack adequate redundancy to allow for expedient recovery of service to affected customers. Disruptions may cause interruptions in service or reduced capacity for customers, either of which could cause us to lose customers, engage in litigation and incur fines and/or expenses or capital expenditures, which could have a material adverse impact on our business, financial condition, results of operations, liquidity and/or the market price of our outstanding securities.
Any failure or inadequacy of our IT infrastructure could harm our business.
A major failure or inadequacy of our IT infrastructure could harm our business. The capacity, reliability and security of our internal IT hardware and software infrastructure are important to the operation of our current and future business, which would suffer in the event of major system failures. Our inability to expand or upgrade our IT hardware and software infrastructure could
24
have adverse consequences, which could include the delayed implementation of new service offerings, increased acquisition integration costs, service or billing interruptions, the issuance of service quality credits, and the diversion of development resources. If any of the foregoing events occur with respect to our IT infrastructure, our business, financial condition, results of operations, liquidity and/or the market price of our outstanding securities could be materially adversely affected.
Increases in broadband usage may cause network capacity limitations, resulting in service disruptions, reduced capacity or slower transmission speeds for customers.
Video streaming services and peer-to-peer file sharing applications use significantly more bandwidth than traditional Internet activity such as web browsing and email. As use of these newer services continues to grow, our high-speed Internet customers will likely use much more bandwidth than in the past. If this occurs, we could be required to make significant capital expenditures to increase network capacity in order to avoid service disruptions, service degradation or slower transmission speeds for our customers. Alternatively, we may choose to implement network management practices to reduce the network capacity available to bandwidth-intensive activities during certain times in areas experiencing congestion, which could negatively affect our ability to retain and attract customers in affected markets. While we believe demand for these services may drive high-speed Internet customers to pay for faster broadband speeds, we may not be able to recover the costs of the necessary network investments. This could result in an adverse impact to our business, financial condition, results of operations, liquidity and/or the market price of our outstanding securities.
A cyber-attack that bypasses our IT and/or network security systems causing an IT and/or network security breach may lead to unauthorized use or disabling of our network, theft of customer data, unauthorized use or publication of our intellectual property and/or confidential business information and could harm our competitive position or otherwise adversely affect our business.
Attempts by others to gain unauthorized access to organizations' IT systems or network elements are becoming more sophisticated and are sometimes successful. These attempts include covertly introducing malware to companies' computers and networks, impersonating authorized users, or "hacking" into systems. We seek to detect and investigate all security incidents and to prevent their recurrence, but, in some cases, we might be unaware of an incident or its magnitude and effect. Significant network security failures could result in the theft, loss, damage, unauthorized use or publication of our intellectual property and/or confidential business information; the theft, loss, damage, unauthorized use or publication of our customers' personally identifiable information, intellectual property and/or confidential business information; the unauthorized use or disabling of our network elements; or damage to our reputation among customers and the public. These consequences could harm our competitive position, subject us to additional regulatory scrutiny, expose us to litigation, reduce the value of our investment in research and development and other strategic initiatives or otherwise adversely affect our business. To the extent that any security breach results in inappropriate disclosure of our customers' or licensees' confidential information, we may incur liability as a result.
Natural catastrophes or terrorism may damage our network or adversely affect the financial markets.
A major earthquake, hurricane, tornado, winter storm, flood, fire, terrorist attack, cyber-attack or other similar disruption could damage our network, network operations centers, call centers, data centers, central offices, corporate headquarters or other facilities. Such an event could interrupt our services, adversely affect service quality, overwhelm customer support and ultimately harm our business and reputation. Although we have implemented measures that are designed to mitigate the effects of such events, we cannot predict all of the potential impacts of such events. We maintain insurance coverage for some of these events; however, the potential liabilities associated with these events could exceed the insurance coverage we maintain. Our inability to operate our networks or operate key systems as a result of such events, even for a limited period of time, may result in significant expenses or loss of customers and associated revenue.
Even if the major event does not directly impact us, these events could more broadly cause consumer confidence and spending to decrease or result in increased volatility in the United States and world financial markets and economy, which would adversely affect our business.
25
Our actual operating results may differ significantly from our guidance.
From time to time, we have released and may continue to release guidance regarding our future performance that represents our management's best estimates as of the date the guidance is provided. This guidance, which consists of forward-looking statements, is prepared by our management and is qualified by, and subject to, the assumptions and the other information contained or referred to in the release. Our guidance is not prepared with a view toward compliance with the published guidelines of the American Institute of Certified Public Accountants, and neither our independent registered public accounting firm nor any other independent expert or outside party compiles or examines the guidance and, accordingly, no such person expresses any opinion or any other form of assurance with respect thereto.
Guidance is based upon a number of assumptions and estimates that, while presented with numerical specificity, are inherently subject to significant business, economic and competitive uncertainties and contingencies, many of which are beyond our control and are based upon specific assumptions with respect to future business decisions, some of which will change. We generally state possible outcomes as high and low ranges which are intended to provide a sensitivity analysis as variables are changed but are not intended to represent our actual results which could fall outside of the suggested ranges. The principal reason that we release this data is to provide a basis for our management to discuss our business outlook with analysts and investors. Notwithstanding this, we do not accept any responsibility for any projections or reports published by any such outside analysts or investors.
Guidance is necessarily speculative in nature, and it can be expected that some or all of the assumptions or the guidance furnished by us will not materialize or will vary significantly from actual results. Accordingly, our guidance is only an estimate of what management believes is realizable as of the date the guidance is provided. Actual results may differ from the guidance and the differences may be material. Investors should also recognize that the reliability of any forecasted financial data diminishes the farther in the future that the data is forecast. In light of the foregoing, users of this guidance are urged to put the guidance in context and not to place undue reliance on any such guidance.
Any inability to successfully implement our operating strategy or the occurrence of any of the events or circumstances discussed therein could result in the actual operating results being different than the guidance, and such differences may be material.
Our success will depend on our ability to attract and retain qualified management and other personnel.
Our success depends upon the talents and efforts of our senior management team. The loss of any member of our senior management team, due to retirement or otherwise, and the inability to attract and retain highly qualified technical and management personnel in the future, could have a material adverse effect on our business, financial condition, results of operations, liquidity and/or the market price of our outstanding securities.
Our ability to successfully manage reductions in our workforce could have a material adverse impact on our results of operations.
Reductions in our workforce could adversely impact our ability to operate effectively and, therefore, could adversely impact our customer service, result in higher regulatory penalties and/or reduce our ability to achieve our operational goals.
A significant portion of our workforce is represented by labor unions and therefore subject to collective bargaining agreements. If disputes arise, or if we are unable to successfully renegotiate these agreements at an appropriate time or on terms acceptable to us, workers subject to these agreements could engage in work stoppages or other concerted activities, which could materially adversely impact our business, financial condition, results of operations, liquidity and/or the market price of our outstanding securities.
As of December 31, 2016, approximately 1,500 of our approximately 2,500 employees were covered by 13 collective bargaining agreements. After ratification of the collective bargaining agreements on February 22, 2015, our agreements with the IBEW and the CWA in northern New England expire in August 2018. Disputes with regard to the terms of any of these agreements or our potential inability to negotiate acceptable contracts with these unions in the future as our current contracts expire could result in, among other things, strikes, work stoppages or other slowdowns by the affected workers. We have experienced work stoppages in the past upon the expiration of collective bargaining agreements. If represented workers were to engage in future work stoppages or other concerted activities, we could experience a significant disruption of our operations, including network disruptions, IT failures, service backlog, internal control failures and/or regulatory compliance issues, and/or higher ongoing labor costs, either of which could have a material adverse effect on our business, financial condition, results of operations, liquidity and/or the market price of our outstanding securities. Additionally, future renegotiation of labor agreements or the provisions of such labor agreements could adversely impact our service reliability and significantly increase our costs for healthcare, wages and other benefits, which could have a material adverse impact on our business, financial condition, results of operations, liquidity and/or the market price of our outstanding securities.
26
The amount we are required to contribute to our qualified pension plans and post-employment benefit plans is impacted by several factors that are beyond our control and changes in those factors may result in a significant increase in future cash contributions.
We sponsor two qualified defined benefit pension plans covering certain employees that will provide them benefit payments, if eligible, after their retirement. These qualified pension plans are subject to funding requirements determined under ERISA and the Code. Required pension contributions may be impacted by several factors, including fluctuations in the discount rate used to calculate the funding target, unfavorable differences in actual experience relative to the assumptions used to determine the liabilities in these plans, the performance of the pension plan asset portfolio and the number of retirees in the qualified pension plan covering non-represented employees who elect to receive lump sum distributions. Unfavorable fluctuations or adverse changes in any of these factors are beyond our control and may diminish the funded status of our pension plans, thereby significantly increasing the contributions we are required to make under ERISA and the Code.
The represented employees pension plan was closed to new participants and benefits under the prior formula were frozen as of October 14, 2014. Future benefit accruals for service on and after February 22, 2015 are at 50% of prior rates and are capped at 30 years of total credited service. Of our projected benefit obligation for our pension plans, approximately 9% reflects the non-represented employees.
Non-represented employees covered by the non-represented employees pension plan have the option to elect to receive their accrued vested benefit in the form of a lump sum payment. Represented employees covered by the represented employees pension plan are no longer able to elect to receive their accrued vested benefit in the form of a lump sum effective with the expiration of the collective bargaining agreements with the IBEW and the CWA on August 2, 2014. As the discount rate used to calculate lump sum payments are currently lower than the discount rate used to calculate the actuarial liabilities in the non-represented employee pension plan, the value of a lump sum payment exceeds the actuarial liability for the participant, which creates an actuarial loss in the pension plan for non-represented employees when paid. As such, a lump sum payment depletes the plan's assets more than the corresponding reduction in the plan's liability, which thereby reduces the funded status of the plan. If a significant number of eligible non-represented employees retire and elect to receive their accrued vested benefit in the form of a lump sum payment, which is beyond our control, the qualified pension plan covering these participants may experience a significant reduction in its funded status, which could materially increase future required contributions. During the year ended December 31, 2016, we recognized $0.6 million in plan settlement expense as the cumulative amount of lump sums paid during 2016 exceeded the expected service and interest cost for 2016.
During the year ended December 31, 2016, we experienced income on qualified pension plan assets totaling approximately 7.5%. However, during the year ended December 31, 2015, we experienced actual losses on qualified pension plan assets totaling approximately 1.9%. The actuarially-determined funded status of our pension plans is dependent on the market value of the assets held by each plan. As such, a significant decline in the market value of the pension plans' assets could result in us having to make additional contributions to these plans.
Legislation enacted in 2014 changed the method for determining the discount rate used for calculating a qualified pension plan's unfunded liability for ERISA and Code purposes, which improved our pension plans' funded status on an ERISA basis. There are no assurances of any future legislation to provide similar relief or to extend the benefits of relief provided by this legislation. See "Item 7. Management's Discussion and Analysis of Financial Condition and Results of Operations—Liquidity and Capital Resources—Pension Contributions and Post-Employment Benefit Plan Expenditures" included elsewhere in this Annual Report.
We also sponsor a post-employment benefit plan that provides medical, dental and life insurance benefits to eligible non-represented employees and former represented employees and, in some instances, to their spouses and families. The level of contributions required from us under these plans is dependent on the number of eligible retirees that elect coverage under the plan and the level and cost of health services used by those eligible retirees, each of which are beyond our control. Inflation in medical and dental costs in the future will increase future contributions. Effective August 28, 2014, active represented employees are no longer eligible for this post-employment benefit plan. Upon ratification of the collective bargaining agreements on February 22, 2015 and for 30 months thereafter, active represented employees who retire and meet the eligibility requirements and their spouses are eligible to receive certain monthly reimbursements of medical insurance premiums for healthcare plans until the retired employee reaches age 65 or dies. As a result of these factors, the payments we are required to make in relation to the above may also increase.
Increasing cash requirements to fund benefits under our qualified pension and post-employment benefit plans and the represented employee limited reimbursement arrangement may impact our liquidity position and limit our operational flexibility. These future cash requirements could have a material adverse impact on our business, financial condition, results of operations, liquidity and/or the market price of our outstanding securities.
27
See note (11) "Employee Benefit Plans" to our consolidated financial statements in "Item 8. Financial Statements and Supplementary Data" included elsewhere in this Annual Report for further information.
Our long-lived assets and non-amortizable intangible assets may become impaired in the future.
At December 31, 2016, in addition to our net property, plant and equipment of $1,024.4 million, we have net amortizable intangible assets of $34.3 million and non-amortizable intangible assets of $41.6 million. Amortizable long-lived assets must be reviewed for impairment whenever indicators of impairment exist. Non-amortizable long-lived assets are required to be reviewed for impairment on an annual basis or more frequently whenever indicators of impairment exist. Indicators of impairment could include, but are not limited to:
• | an inability to perform at levels that were forecasted; |
• | a permanent decline in market capitalization; |
• | implementation of restructuring plans; |
• | changes in industry trends; and/or |
• | unfavorable changes in our capital structure, cost of debt, interest rates or capital expenditures levels. |
Situations such as these could result in an impairment that would require a material non-cash charge to our results of operations and could have a material adverse effect on our consolidated results of operations.
Our operations require substantial capital expenditures.
We require significant capital expenditures to maintain, upgrade and enhance our network facilities and operations. While we have historically been able to fund capital expenditures from cash generated from operations and borrowings under the Revolving Facility, the other risk factors described in this section could materially reduce cash available from operations or significantly increase our capital expenditure requirements, and these outcomes may result in our inability to fund the necessary level of capital expenditures to maintain, upgrade or enhance our network. This could adversely affect our business, financial condition, results of operations, liquidity and/or the market price of our outstanding securities.
We are exposed to risks relating to evaluations of internal control systems required by Section 404 of the Sarbanes-Oxley Act.
As a public reporting company, we are required to comply with the Sarbanes-Oxley Act and the related rules and regulations of the SEC, including accelerated reporting requirements and expanded disclosures regarding evaluations of internal control systems. With respect to internal control over financial reporting, standards established by the Public Company Accounting Oversight Board define a material weakness as a deficiency, or a combination of deficiencies, in internal control over financial reporting, such that there is a reasonable possibility that a material misstatement of our annual or interim financial statements will not be prevented or detected on a timely basis. If our management identifies one or more material weaknesses in internal control over financial reporting in the future in accordance with the annual assessments and quarterly evaluations required by the Sarbanes-Oxley Act, we will be unable to assert that our internal controls are effective which could result in sanctions or investigation by regulatory authorities. In addition, any such material weakness could result in material misstatements in our financial statements, prevent us from providing timely financial statements or meeting our reporting requirements both with the SEC and under our debt obligations and cause investors to lose confidence in our reported financial information.
Risks Relating to Our Regulatory Environment
"Net neutrality" and broadband Internet access service legislation or regulation could limit our ability to operate our broadband business profitably and to manage our broadband facilities efficiently.
In order to continue to provide quality high-speed data service at attractive prices and to offer new services, we believe we need the continued flexibility to respond to changing consumer uses and demands, to manage bandwidth usage efficiently and to continue to invest in our networks. In 2010, the FCC adopted "net neutrality" regulations that curtailed our operational flexibility. A federal appeals court vacated these rules in January 2014, after which the FCC adopted new regulations governing "Broadband Internet Access Services" at its February 26, 2015 Open Meeting (the "Order"). "Broadband Internet access service" will now be classified as a "telecommunications service" under Title II of the Communications Act. The Order prohibits "unjust and unreasonable practices" by broadband Internet access providers. The Order prohibits broadband Internet access providers from blocking access to legal content, applications, services and non-harmful devices. It prohibits broadband Internet access providers from impairing or degrading lawful Internet traffic on the basis of content, applications, services or non-harmful devices. It also prohibits broadband Internet access providers from favoring some lawful Internet traffic over other lawful traffic in exchange for consideration and from prioritizing their own content or services over those of unaffiliated entities. Other than paid prioritization
28
which is prohibited, broadband Internet access providers are allowed to engage in reasonable network management practices, though it is not currently known what such practices will be defined to include. Broadband services that do not flow over the public Internet are exempt from these rules. The Order allows consumer complaints to be brought to the FCC under Title II of the Communications Act.
We cannot predict what impact, if any, these rules may have on our business, financial condition, results of operations, liquidity or the market price of our outstanding securities or whether Congress will modify these rules through pending legislative proposals.
We are subject to significant regulation that could change in a manner adverse to us.
We operate in a heavily regulated industry. Laws and regulations applicable to us and our competitors may be, and have been, challenged in the courts and could be changed by Congress or regulators. In addition, the following factors could have a significant impact on us:
Risk of loss or reduction in revenues associated with regulated filings, rules or tariffs. A portion of our revenues comes from intrastate and interstate network access charges, which are paid to us by interexchange carriers for originating and terminating communications traffic. See "Item 1. Business—Regulatory and Legislative" included elsewhere in this Annual Report.
As described in "Item 1. Business—Regulatory and Legislative," we have accepted most of the CAF Phase II support offered to us during 2015. We risk not being able to fulfill the obligations of the CAF Phase II program, which includes specific location requirements and technical obligations associated with speed, latency, data provision and pricing. These requirements and obligations may prove costly to implement. Failure to timely implement our CAF Phase II obligations by the interim milestones (40%, 60% and 80% of locations built out by December, 2017, 2018 and 2019, respectively) may result in a portion of funds being delayed at each interim milestone. Failure to build out at least 50% of locations required by an interim milestone may result in a loss of all funds and therefore this continuing revenue stream.
The CAF/ICC Order fundamentally reforms the ICC system that governs how communications companies bill one another for terminating traffic, gradually phasing out these charges. Additional reforms have been proposed. The reforms adopted by the FCC in its order will significantly change the access charge system and, if not offset by a revenue replacement mechanism, could potentially result in a significant decrease in or elimination of access charges. Regulatory developments of this type could materially adversely affect our business, financial condition, results of operations, liquidity and/or the market price of our outstanding securities.
Risk of re-regulation of wholesale network services provided to retail and wholesale customers. Pursuant to forbearance from the regulation of high-speed interstate services that was deemed granted to Verizon in 2006 and transferred to us by the FCC in its order approving the Spinco Merger, we offer high-speed interstate services on a deregulated basis. The FCC has initiated a proceeding to investigate potential changes to the regulation of special access services. Several parties filed petitions in 2011 and 2012 asking the FCC to reverse the 2006 forbearance granted to Verizon. The FCC has issued a comprehensive data request to gather granular information from all providers of special access-like high speed services and this data request was completed in February 2015. The purpose of the data request is to provide the FCC with information that can be used to evaluate competition for special access-like services. It is not clear what actions, if any, the FCC will take in these proceedings. Orders resulting from these proceedings could adversely affect pricing and regulation of these services.
The FCC also is considering changes to its rules governing who contributes to the USF support mechanisms, and on what basis. Any changes in the FCC’s rules governing the manner in which entities contribute to the USF could have a material adverse effect on our business, financial condition, results of operations, liquidity and/or the market price of our outstanding securities.
Risk of loss of statutory exemption from burdensome interconnection rules imposed on ILECs. Our rural LECs generally are exempt from the more burdensome requirements of the 1996 Act governing the rights of competitors to interconnect to ILEC networks and to utilize discrete network elements of the incumbent’s network at favorable rates. To the extent state regulators decide that it is in the public interest to extend some or all of these requirements to our rural LECs, we may be required to provide UNEs to competitors in our rural telephone company areas. As a result, more competitors could enter our traditional telephone markets than are currently expected, which could have a material adverse effect on our business, financial condition, results of operations, liquidity and/or the market price of our outstanding securities.
Risks posed by costs of regulatory compliance. Regulations create significant compliance and administrative costs for us. Our subsidiaries that provide intrastate services are generally subject to certification, tariff filing and other ongoing regulatory requirements by state regulators. Our interstate and intrastate access services are currently provided in accordance with tariffs filed with the FCC and state regulatory authorities, respectively. Challenges in the future to our tariffs by regulators or third parties or delays in obtaining certifications and regulatory approvals could cause us to incur substantial legal and administrative expenses,
29
and, if successful, these challenges could adversely affect the rates that we are able to charge our customers, which could have a material adverse effect on our business, financial condition, results of operations, liquidity and/or the market price of our outstanding securities.
Our acceptance of CAF Phase II funding through the FCC's universal service program requires that we satisfy specific broadband service obligations in locations approved by the FCC within deadlines established by the FCC. If we fail to meet these deadlines, or our broadband service fails to satisfy FCC performance standards, we could be subject to penalties, refunds and other enforcement action by the FCC. In the two states where we declined CAF Phase II support, we cannot predict whether competitors will win a competitive bid for support in our service territories.
In addition, our Northern New England operations are subject to regulations not applicable to our rural operations, including but not limited to requirements relating to interconnection, the provision of UNEs, and the other market-opening obligations set forth in the 1996 Act. In approving the transfer of authorizations to us in the Spinco Merger, the FCC determined that our non-rural operations would be subject to the same regulatory requirements that currently apply to Bell Operating Companies. The FCC also stated that we would be entitled to the same regulatory relief that Verizon New England had obtained in the region. Any changes made in connection with these obligations or relief could increase our non-rural operations’ costs or otherwise have a material adverse effect on our business, financial condition, results of operations, liquidity and/or the market price of our outstanding securities. Moreover, we cannot predict the precise manner in which the FCC will apply the Bell Operating Company regulatory framework to us.
Our business also may be affected by legislation and regulation imposing new or greater obligations related to open Internet access, assisting law enforcement, bolstering homeland security, pole attachments, minimizing environmental impacts, protecting customer privacy or addressing other issues that affect our business. We cannot predict whether or to what extent the FCC might modify its rules or what compliance with those new rules might cost. Similarly, we cannot predict whether or to what extent federal or state legislators or regulators might impose new network access, security, environmental or other obligations on our business.
Risk of losses from rate reduction. Our LECs that operate pursuant to intrastate rate-of-return regulation are subject to state regulatory authority over their intrastate telecommunications service rates. State review of these rates could lead to rate reductions, which in turn could have a material adverse effect on our business, financial condition, results of operations, liquidity and/or the market price of our outstanding securities.
For a more thorough discussion of the regulatory issues that may affect our business, see "Item 1. Business—Regulatory and Legislative" included elsewhere in this Annual Report.
30
ITEM 1B. UNRESOLVED STAFF COMMENTS
Not applicable.
ITEM 2. PROPERTIES
We own or lease all of the properties material to our business. Our headquarters is located in Charlotte, North Carolina, in a leased facility. We also have administrative offices, maintenance facilities, rolling stock, central office and remote switching platforms, and transport and distribution network facilities in each of the 17 states in which we operate our LECs. Our facilities are generally located in or near the communities served by our LECs. Auxiliary battery or other non-utility power sources are located at each central office to provide uninterrupted service in the event of an electrical power failure. Transport and distribution network facilities include fiber optic backbone and copper wire distribution facilities, which connect customers to remote switch locations or to the central office and to points of presence or interconnection with the long distance carriers. These facilities are located on land pursuant to permits, easements or other agreements. Our rolling stock includes service vehicles, construction equipment and other required maintenance equipment.
We believe each of our respective properties is suitable and adequate for the business conducted thereon, is being appropriately used consistent with past practice and has sufficient capacity for the present intended purposes.
ITEM 3. LEGAL PROCEEDINGS
See the information under (i) "Legal Proceedings" in note (18) "Commitments and Contingencies" to our consolidated financial statements in "Item 8. Financial Statements and Supplementary Data" and (ii) "Class Action Complaint" in note (20) "Subsequent Events" to our consolidated financial statements in "Item 8. Financial Statements and Supplementary Data" included elsewhere in this Annual Report, which we incorporate herein by reference.
From time to time, we are also subject to other legal and regulatory proceedings in the ordinary course of business. While management presently believes that the ultimate outcome of these proceedings, individually and in the aggregate, will not materially harm our financial position, cash flows, or overall trends in results of operations, legal proceedings are inherently uncertain, and unfavorable rulings could, individually or in aggregate, have a material adverse effect on our business, financial condition, or operating results.
ITEM 4. MINE SAFETY DISCLOSURES
Not applicable.
31
PART II
ITEM 5. MARKET FOR REGISTRANT'S COMMON EQUITY, RELATED STOCKHOLDER MATTERS AND ISSUER PURCHASES OF EQUITY SECURITIES
General Market Information, Holders and Dividends
Our common stock is listed on the Nasdaq Capital Market (the "Nasdaq") under the symbol "FRP" and began trading on January 25, 2011.
The following table sets forth, for the periods indicated, the high and low sales prices per share of our common stock as reported on the Nasdaq. The stock price information is based on published financial sources.
Year Ended December 31, 2016 | High | Low | ||||||
First quarter | $ | 16.29 | $ | 12.69 | ||||
Second quarter | 15.53 | 12.81 | ||||||
Third quarter | 16.40 | 13.04 | ||||||
Fourth quarter | 19.60 | 14.66 | ||||||
Year Ended December 31, 2015 | High | Low | ||||||
First quarter | $ | 18.08 | $ | 13.51 | ||||
Second quarter | 20.98 | 17.24 | ||||||
Third quarter | 19.07 | 14.93 | ||||||
Fourth quarter | 18.87 | 14.56 | ||||||
No dividends were declared on any class of our common stock during the fiscal years 2016 or 2015. We currently do not pay any cash dividends on shares of our common stock and have no plans to pay cash dividends. Any determination to pay dividends in the future will be at the discretion of our board of directors and will depend upon limitations imposed by our results of operations, financial condition, contractual restrictions relating to indebtedness, restrictions imposed by applicable law and other factors our board of directors may deem relevant at the time.
As of February 27, 2017, there were approximately 174 holders of record of our common stock.
32
Performance Graph
Set forth below is a line graph comparing the cumulative total stockholder return on shares of our common stock against (i) the cumulative total return of all companies listed on the S&P 500 and (ii) the cumulative total return of the S&P 500 Telecom sector. The period compared commences on January 1, 2012 and ends on December 31, 2016. This graph assumes that $100 was invested on January 1, 2012 in our common stock and in each of the market index and the sector index at the closing price for FairPoint Communications and the respective indices, and that all cash distributions were reinvested.
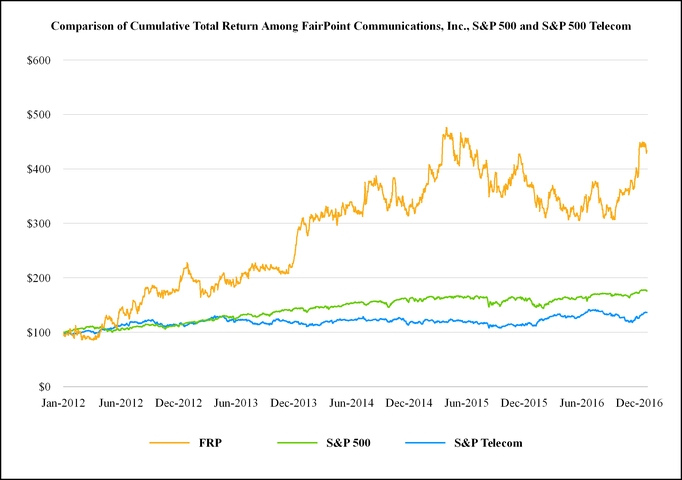
Securities Authorized for Issuance under Equity Compensation Plans
The table below provides information as of December 31, 2016 concerning securities authorized for issuance under our equity compensation plans. As of December 31, 2016, the FairPoint Communications, Inc. Amended and Restated 2010 Long Term Incentive Plan (the "Long Term Incentive Plan") was the only equity compensation plan under which securities of FairPoint Communications were authorized for issuance. The Board of Directors of the Company approved the Long Term Incentive Plan on March 14, 2014 and the stockholders of the Company approved it on May 12, 2014. The Long Term Incentive Plan, prior to its amendment and restatement, was approved by the United States Bankruptcy Court for the Southern District of New York in connection with our emergence from bankruptcy. For a description of the material features of the Long Term Incentive Plan, see note (16) "Stock-Based Compensation" to our consolidated financial statements in "Item 8. Financial Statements and Supplementary Data" included elsewhere in this Annual Report.
33
(a) | (b) | (c) | ||||||||
Plan Category | Number of securities to be issued upon exercise of outstanding options, warrants and rights (1) | Weighted average exercise price of outstanding options, warrants and rights | Number of securities remaining available for future issuance under equity compensation plans (excluding securities reflected in column (a)) (2) | |||||||
Equity compensation plans approved by our stockholders | 2,171,470 | $ | 15.87 | 1,423,409 | ||||||
Total | 2,171,470 | $ | 15.87 | 1,423,409 | ||||||
(1) | Includes 2,171,470 options to purchase shares of common stock under the Long Term Incentive Plan, of which 1,184,859 options were issued prior to the amendment and restatement of the Long Term Incentive Plan on May 12, 2014 with a weighted average exercise price of $16.88. |
(2) | Each stock option granted reduces the availability under the Long Term Incentive Plan by one share. Prior to the amendment and restatement of the Long Term Incentive Plan on May 12, 2014, each restricted stock award granted reduced the availability under the Long Term Incentive Plan by one share. On or after May 12, 2014, each restricted stock award granted reduces the availability by 1.35 shares. Upon the exercise of each stock option or vesting of each restricted share award, one new share of common stock will be issued. |
Repurchase of Equity Securities
Under the Long Term Incentive Plan, employees may elect to have us withhold shares to satisfy minimum statutory federal, state and local tax withholding obligations arising from the vesting of restricted stock. When we withhold these shares, we are required to remit to the appropriate taxing authorities the market price of the shares withheld, which could be deemed a purchase of shares by us on the date of withholding.
ITEM 6. SELECTED FINANCIAL DATA
The summary financial data presented below represents portions of our consolidated financial statements and are not complete. The following financial information should be read in conjunction with "Item 7. Management's Discussion and Analysis of Financial Condition and Results of Operations" and our consolidated financial statements and notes thereto contained in "Item 8. Financial Statements and Supplementary Data" included elsewhere in this Annual Report. Historical results are not necessarily indicative of future performance or results of operations. Amounts are in thousands, except operating metrics, per share data and units.
34
Years Ended December 31, | |||||||||||||||||||
2016 | 2015 | 2014 | 2013 | 2012 | |||||||||||||||
Results of Continuing Operations: | |||||||||||||||||||
Revenues | $ | 824,443 | $ | 859,465 | $ | 901,396 | $ | 939,354 | $ | 973,649 | |||||||||
Operating expenses | 595,098 | 689,873 | 994,670 | 1,052,540 | 1,155,632 | ||||||||||||||
Income/(loss) from operations | 229,345 | 169,592 | (93,274 | ) | (113,186 | ) | (181,983 | ) | |||||||||||
Interest expense | 82,697 | 80,718 | 80,371 | 78,675 | 67,610 | ||||||||||||||
Net income/(loss) | $ | 104,095 | $ | 90,416 | $ | (136,319 | ) | $ | (103,494 | ) | $ | (153,294 | ) | ||||||
Income/(loss) per share from continuing operations: | |||||||||||||||||||
Basic | $ | 3.88 | $ | 3.39 | $ | (5.15 | ) | $ | (3.95 | ) | $ | (5.90 | ) | ||||||
Diluted | 3.84 | 3.35 | (5.15 | ) | (3.95 | ) | (5.90 | ) | |||||||||||
Cash dividends per share | $ | — | $ | — | $ | — | $ | — | $ | — | |||||||||
Weighted average shares outstanding: | |||||||||||||||||||
Basic | 26,854 | 26,652 | 26,449 | 26,190 | 25,987 | ||||||||||||||
Diluted | 27,119 | 26,973 | 26,449 | 26,190 | 25,987 | ||||||||||||||
Financial Position (at period end): | |||||||||||||||||||
Cash, excluding restricted cash (1) | $ | 34,924 | $ | 26,560 | $ | 37,587 | $ | 42,700 | $ | 23,203 | |||||||||
Total assets | 1,230,835 | 1,322,526 | 1,452,371 | 1,574,547 | 1,714,874 | ||||||||||||||
Total long-term debt | 904,770 | 906,545 | 908,641 | 911,021 | 955,889 | ||||||||||||||
Total stockholders' deficit | (54,077 | ) | (1,489 | ) | (600,284 | ) | (309,196 | ) | (317,813 | ) | |||||||||
Operating Data (at period end): | |||||||||||||||||||
Broadband subscribers | 306,624 | 311,130 | 319,915 | 328,183 | 324,850 | ||||||||||||||
Ethernet circuits | 15,691 | 14,507 | 12,614 | 9,501 | 5,945 | ||||||||||||||
Residential voice lines | 366,111 | 409,852 | 466,682 | 527,010 | 585,845 | ||||||||||||||
Summary of Cash Flows: | |||||||||||||||||||
Net cash provided by operating activities | $ | 134,252 | $ | 112,001 | $ | 121,063 | $ | 171,085 | $ | 192,775 | |||||||||
Net cash used in investing activities | (118,460 | ) | (115,871 | ) | (118,363 | ) | (95,951 | ) | (144,307 | ) | |||||||||
Net cash used in financing activities | (7,428 | ) | (7,157 | ) | (7,813 | ) | (55,637 | ) | (42,615 | ) | |||||||||
Capital expenditures | 117,050 | 116,159 | 119,489 | 128,298 | 145,066 | ||||||||||||||
(1) | Cash excludes aggregate restricted cash of $0.7 million, $0.7 million, $0.6 million, $1.2 million and $7.5 million at December 31, 2016, 2015, 2014, 2013 and 2012, respectively. |
35
ITEM 7. MANAGEMENT'S DISCUSSION AND ANALYSIS OF FINANCIAL CONDITION AND RESULTS OF OPERATIONS
The following discussion should be read in conjunction with our consolidated financial statements and the notes thereto in "Item 8. Financial Statements and Supplementary Data" included elsewhere in this Annual Report. The following discussion includes certain forward-looking statements. For a discussion of important factors, including the continuing development of our business, actions of regulatory authorities and competitors and other factors which could cause actual results to differ materially from the results referred to in the forward-looking statements, see "Item 1A. Risk Factors" and "Cautionary Note Regarding Forward-Looking Statements" included elsewhere in this Annual Report. Our discussion and analysis of financial condition and results of operations are presented in the following sections:
•Overview
•Executive Summary
•Proposed Merger with Consolidated Communications Holdings, Inc.
•Labor Matters
•Regulatory and Legislative
•Basis of Presentation
•Results of Operations
•Non-GAAP Financial Measures
•Liquidity and Capital Resources
•Off-Balance Sheet Arrangements
•Summary of Contractual Obligations
•Critical Accounting Policies and Estimates
•New Accounting Standards
•Inflation
Overview
We are a leading provider of advanced communications services to business, wholesale and residential customers within our service territories. We offer our customers a suite of advanced services including Ethernet, SIP-Trunking, hosted PBX, managed services, data center colocation services, high capacity data transport and other IP-based services over our fiber-based network, in addition to Internet access, HSD and local and long distance voice services. Our service territory spans 17 states where we are the incumbent communications provider primarily serving rural communities and small urban markets. Many of our LECs have served their respective communities for more than 80 years. As of December 31, 2016, we operated with approximately 306,600 broadband subscribers, approximately 15,700 Ethernet circuits and approximately 366,100 residential voice lines.
We own and operate an extensive fiber-based Ethernet network with more than 22,000 miles of fiber optic cable, including approximately 18,000 miles of fiber optic cable in Maine, New Hampshire and Vermont, giving us capacity to support more HSD services and extend our fiber reach into more communities across the region. The IP/MPLS network architecture of our fiber-based network allows us to provide Ethernet, transport and other IP-based services with the highest level of reliability at a lower cost of service. This fiber-based Ethernet network also supplies critical infrastructure for wireless carriers serving the region as their bandwidth needs increase, driven by mobile data from smartphones, tablets and other wireless devices. As of December 31, 2016, we provide cellular transport, also known as backhaul, through over 1,900 mobile Ethernet backhaul connections. We have fiber connectivity to approximately 1,300 cellular communications towers in our service footprint.
Executive Summary
Our mission is to empower businesses, consumers and communities with advanced data, IT and voice services by leveraging our network, technology and operational expertise to exceed their expectations. Our vision includes operating and technology platforms that will meet our customers' technology needs by providing them with reliable and secure connections and ready access to what matters most to them.
36
Our executive management team is focused on utilizing our network assets, our outstanding operating platform and our proven ability to develop and deploy market-driven products to build brand awareness, aid in generating new revenue and sustain existing revenue. We will enhance our network to bring new services and more robust technologies to our markets, enable effective and secure technology to ensure our product and service offerings remain competitive, and provide excellent customer service to create a loyal customer base, all while maintaining a sharp focus on managing costs.
Our objective is to transform our revenue by continuing to add advanced data products and services such as Ethernet, high capacity data transport and other IP-based services over our fiber-based network in addition to HSD services, to minimize our dependence on voice access lines. Communications companies, including us, continue to experience a decline in access lines due to increased competition from wireless carriers, cable television operators and CLECs and increased availability of alternative communications services, including wireless and voice over IP ("VoIP"). We will continue our efforts to retain customers to mitigate the loss of voice access lines through bundled packages, including video and other value added services. We believe access lines as a measure of the business are increasingly less meaningful measures of trend and are being replaced by revenue generating broadband subscribers and Ethernet circuits.
Over the past few years, we have made significant capital investments in our fiber-based Ethernet network to expand our business service offerings to meet the growing data needs of our customers and to increase broadband speeds and capacity in our consumer markets. We have also focused our sales and marketing efforts on these advanced data solutions. Specifically, within the last few years, we built and launched high capacity Ethernet services to allow us to meet the capacity needs of our business customers as well as supply high capacity infrastructure to our wholesale customers. In the past year, Ethernet demand has remained strong amid increased price pressure. We continue to see a market trend, largely led by cable companies, of reduced Ethernet prices to business and wholesale customers. We continue to see growth in Ethernet units and speeds amid declining prices in the market. Ethernet high-capacity transport data services are our flagship product and are laying the foundation not only for new business but also for additional IP-based advanced services in the future.
We believe that our extensive fiber network, with more than 22,000 miles of fiber optic cable, including approximately 18,000 miles of fiber optic cable in northern New England and approximately 1,300 cellular communications towers currently served with fiber, puts us in an excellent position to serve the cellular backhaul needs in our markets. We further believe the bandwidth needs of cellular backhaul will grow with the continued adoption of bandwidth-intensive technology. As a result, we expect to see wireless carriers developing new technologies as demand increases on existing fiber-connected towers, including the use of "small cell" architecture. By satisfying additional demand for bandwidth, both traditionally and through new and evolving technology, we expect to partially offset the decline we have seen, and expect to continue to see, in legacy wholesale offerings, including TDM transport services, DS1s, DS3s and wholesale switched access.
Coupled with recent regulatory reform in the states of Maine, New Hampshire and Vermont that will serve to promote fair competition among communications service providers in the region, we believe that there is a significant organic growth opportunity within the business and wholesale markets given our extensive fiber network and IP-based product suite, combined with our relative low market share in these areas.
Proposed Merger with Consolidated Communications Holdings, Inc.
On December 3, 2016, FairPoint Communications entered into the Merger Agreement with Consolidated and Merger Sub, which provides for, among other things, a business combination whereby Merger Sub will merge with and into FairPoint Communications, with FairPoint Communications as the surviving entity. As a result of the Merger, the separate corporate existence of Merger Sub will cease, and FairPoint Communications will survive as a wholly owned subsidiary of Consolidated. Consolidated is a leading business and broadband communications provider throughout its 11-state service area.
If the Merger is completed, under the terms of the Merger Agreement, stockholders of FairPoint Communications will receive 0.7300 shares of common stock of Consolidated for each share of FairPoint Communications common stock that they own immediately before this transaction. The Merger is expected to close around the middle of 2017 and is subject to standard closing conditions, including federal and state regulatory approvals and the approval of both Consolidated’s and FairPoint Communications’ stockholders. The required waiting period under the HSR Act was terminated on January 11, 2017.
For the year ended December 31, 2016, we recognized $4.5 million of merger related expenses, primarily for legal and financial advisory costs.
The award agreements under the Long Term Incentive Plan provide that upon the occurrence of a change in control, unvested benefits will be accelerated and vest in full.
37
Labor Matters
Two of our collective bargaining agreements in northern New England were ratified on February 22, 2015 by their respective unions. Members of these two labor unions initiated a work stoppage on October 17, 2014 and returned to work on February 25, 2015. The respective collective bargaining agreements expire in August 2018. For the year ended December 31, 2015, we recognized $48.9 million of labor negotiation related expenses, primarily for contracted services, contingent workforce expenses (including training) and legal, communications and public relations expenses.
See notes (11) "Employee Benefit Plans" and (12) "Income Taxes" to our consolidated financial statements in "Item 8. Financial Statements and Supplementary Data" included elsewhere in this Annual Report for further information, as well as "Results of Operations" herein.
Regulatory and Legislative
We are generally subject to common carrier regulation primarily by federal and state governmental agencies. At the federal level, the FCC generally exercises jurisdiction over common carriers, such as us, to the extent those carriers provide, originate or terminate interstate or international communications. State regulatory commissions generally exercise jurisdiction over common carriers to the extent those carriers provide, originate or terminate intrastate telecommunications. In addition, pursuant to the Communications Act, state and federal regulators share responsibility for implementing and enforcing the domestic pro-competitive policies introduced by that legislation.
We are required to comply with the Communications Act which requires, among other things, that common carriers offer communications services at just and reasonable rates and on terms and conditions that are not unreasonably discriminatory. The Communications Act also contains requirements intended to promote competition in the provision of local services and lead to deregulation as markets become more competitive.
For a detailed description of the federal and state regulatory environment in which we operate and the FCC's recently promulgated CAF/ICC Order and other recent regulatory changes, as well as the effects and potential effects of such regulation on us, see "Item 1. Business—Regulatory and Legislative" included elsewhere in this Annual Report. The impact of these changes for 2016 is described further below. However, in the long run, we are uncertain of the ultimate impact as federal and state regulations continue to evolve.
Basis of Presentation
We view our business of providing data, voice and communications services to business, wholesale and residential customers as one reportable segment.
Results of Operations
The following table sets forth our consolidated operating results reflected in our consolidated statements of operations for the years ended December 31, 2016, 2015 and 2014, respectively. The comparisons of financial results are not necessarily indicative of future results (in thousands, except for operating metrics):
38
Years Ended December 31, | |||||||||||
2016 | 2015 | 2014 | |||||||||
Revenues: | |||||||||||
Voice services | $ | 297,441 | $ | 323,412 | $ | 362,491 | |||||
Access | 239,761 | 256,617 | 267,938 | ||||||||
Data and Internet services | 187,268 | 178,620 | 175,490 | ||||||||
Regulatory funding | 51,411 | 53,818 | 45,556 | ||||||||
Other | 48,562 | 46,998 | 49,921 | ||||||||
Total revenues | 824,443 | 859,465 | 901,396 | ||||||||
Operating expenses: | |||||||||||
Cost of services and sales, excluding depreciation and amortization | 389,316 | 430,308 | 440,979 | ||||||||
Other post-employment benefit and pension (benefit)/expense | (213,760 | ) | (170,338 | ) | 75,282 | ||||||
Selling, general and administrative expense, excluding depreciation and amortization | 197,239 | 206,046 | 257,627 | ||||||||
Depreciation and amortization | 222,303 | 223,819 | 220,678 | ||||||||
Reorganization related expense | — | 38 | 104 | ||||||||
Total operating expenses | 595,098 | 689,873 | 994,670 | ||||||||
Income/(loss) from operations | 229,345 | 169,592 | (93,274 | ) | |||||||
Other income/(expense): | |||||||||||
Interest expense | (82,697 | ) | (80,718 | ) | (80,371 | ) | |||||
Other, net | 296 | 485 | 7,548 | ||||||||
Total other expense | (82,401 | ) | (80,233 | ) | (72,823 | ) | |||||
Income/(loss) before income taxes | 146,944 | 89,359 | (166,097 | ) | |||||||
Income tax (expense)/benefit | (42,849 | ) | 1,057 | 29,778 | |||||||
Net income/(loss) | $ | 104,095 | $ | 90,416 | $ | (136,319 | ) | ||||
As of December 31, | |||||||||||
Select Operating Metrics: | 2016 | 2015 | 2014 | ||||||||
Broadband subscribers | 306,624 | 311,130 | 319,915 | ||||||||
Ethernet circuits | 15,691 | 14,507 | 12,614 | ||||||||
Residential voice lines | 366,111 | 409,852 | 466,682 | ||||||||
Voice Services Revenues
We receive revenues through the provision of local calling services to business and residential customers, generally for a fixed monthly charge and service charges for special calling features. We also generate revenue through long distance services within our service areas on our network and through resale agreements with national interexchange carriers. For the years ended December 31, 2016, 2015 and 2014, residential voice lines in service decreased 10.7%, 12.2% and 11.4% year-over-year, respectively, which directly impacts local voice services revenues and our opportunity to provide long distance services to our customers, resulting in a decrease of minutes of use. The decline in residential voice lines in 2015 and 2014 may have been partially due to the impact of the strike on service levels. Evolving competition, including reduced voice pricing from cable competitors as well as cellular adoption, has contributed to the decrease in residential voice lines. There are very few areas within our northern New England footprint where cable voice service and cellular are not alternatives for our customers. In addition, business voice services revenue also declined in part because of reduced access lines as businesses shifted from traditional voice products to our Ethernet or other advanced services. We expect the trend of decline in voice lines in service, and thereby a decline in aggregate voice services revenue, to continue as customers continue to turn to the use of alternative communication services as a result of ever-increasing competition.
Effective June 1, 2015, the Performance Assurance Plan ("PAP") that was previously adopted in each of the states of Maine, New Hampshire and Vermont was retired and we began measuring and reporting certain wholesale local service performance results pursuant to the terms of a simplified measurement plan. The new plan, called the Wholesale Performance Plan ("WPP"), was developed collaboratively with CLECs over several years and was approved by the Maine, New Hampshire and Vermont regulatory commissions. Under the WPP, we are subject to significantly fewer performance criteria and our annual service penalty
39
exposure was reduced from a maximum of $87 million to a maximum of $12 million ($4.75 million in each of Maine and New Hampshire and $2.5 million in Vermont). A portion of the service credits resulting from these commitments were recorded to voice services revenues; however, the majority were recorded to access revenues.
The following table reflects the primary drivers of year-over-year changes in voice services revenues (dollars in millions):
Year ended December 31, 2016 vs. December 31, 2015 | Year ended December 31, 2015 vs. December 31, 2014 | |||||||||
Increase (Decrease) | % | Increase (Decrease) | % | |||||||
Local voice services revenues, excluding: | $ | (20.6 | ) | $ | (30.8 | ) | ||||
Long distance services revenues | (5.6 | ) | (8.4 | ) | ||||||
Increase in accrual of PAP/WPP service credits (1) | 0.2 | 0.1 | ||||||||
Total change in voice services revenues | $ | (26.0 | ) | (8 | )% | $ | (39.1 | ) | (11 | )% |
(1) | There was an insignificant amount of PAP/WPP service credits during the year ended December 31, 2016. During the years ended December 31, 2015 and 2014, PAP/WPP service credits resulted in a decrease of $0.2 million and $0.3 million, respectively, to local voice services revenues. |
Access Revenues
We receive revenues for the provision of network access through carrier Ethernet based products and legacy access products to end user customers and long distance and other competing carriers who use our local exchange facilities to provide interexchange services to their customers. Network access can be provided to carriers and end users that buy dedicated local and interexchange capacity to support their private networks (i.e. special access) or it can be derived from fixed and usage-based charges paid by carriers for access to our local network (i.e. switched access).
Carriers are migrating from legacy access products, such as DS1, DS3, frame relay, ATM and private line, to carrier Ethernet based products. During the years ended December 31, 2016, 2015 and 2014, wholesale Ethernet circuits grew by 12.3%, 17.1% and 44.4% year-over-year, respectively. These carrier Ethernet based products are more sustainable, but generally, at the outset, have lower average revenue per user of broadband capacity than the legacy products they are replacing, resulting in a decline in access revenues. We expect the decline in access revenues to continue with customer migration. This decline in legacy access products is expected to be partially offset with the increasing need for bandwidth, including cellular backhaul and demand for carrier Ethernet based products, both of which are expected to increase over time. With the entry of cable competitors into the wholesale market, we continue to experience an increased decline in access lines due to this new competition. However, our extensive fiber-based Ethernet network with more than 22,000 miles of fiber optic cable (of which approximately 18,000 miles are in Maine, New Hampshire and Vermont), including approximately 1,300 cellular communications towers currently served with fiber, puts us in a position to grow our revenue base as demand for cellular backhaul and other Ethernet services expands. We also construct new fiber routes to cellular communications towers when the business case presents itself. Additionally, we continue to evaluate new services to provide to carriers, including the selective use of dark fiber and professional services, to continue to meet carrier access needs.
As described above, we adopted a separate PAP for certain services provided on a wholesale basis to CLECs in each of the states of Maine, New Hampshire and Vermont, pursuant to which we are required to issue service credits in the event we are unable to meet the provisions of the respective PAP. These PAPs were retired effective June 1, 2015 and replaced with the WPP. Our maximum exposure to wholesale service credits has been reduced through the implementation of the WPP. The service credits are allocated to access revenues or voice services revenues based on services provided to the wholesale carrier.
In June 2014, Maine established a new POLR SQI standard, which may subject us to future SQI penalties.
The following table reflects the primary drivers of year-over-year changes in access revenues (dollars in millions):
Year ended December 31, 2016 vs. December 31, 2015 | Year ended December 31, 2015 vs. December 31, 2014 | |||||||||
Increase (Decrease) | % | Increase (Decrease) | % | |||||||
Carrier Ethernet services (1) | $ | 1.6 | $ | 9.3 | ||||||
Legacy access services (2) | (19.3 | ) | (20.8 | ) | ||||||
Decrease in accrual of PAP/WPP service credits (3) | 0.8 | 0.2 | ||||||||
Total change in access revenues | $ | (16.9 | ) | (7 | )% | $ | (11.3 | ) | (4 | )% |
(1) | We offer carrier Ethernet services throughout our market to our business and wholesale customers, which include Ethernet virtual circuit technology for cellular backhaul. As of December 31, 2016, we provide cellular transport on our fiber- |
40
based Ethernet network through over 1,900 fiber-to-the-tower connections compared to over 1,900 and 1,700 as of December 31, 2015 and 2014, respectively.
(2) | Legacy access services include products such as DS1, DS3, frame relay, ATM and private line. |
(3) | During the years ended December 31, 2016, 2015 and 2014, PAP/WPP service credits resulted in a decrease of $0.2 million, $1.0 million and $1.2 million to access revenues, respectively. |
Data and Internet Services Revenues
We receive revenues from monthly recurring charges for the provision of data and Internet services to residential and business customers through DSL technology, fiber-to-the-home technology, retail Ethernet, Internet dial-up, high speed cable modem and wireless broadband.
We have invested in our broadband network to extend the reach and capacity of the network to customers who did not previously have access to data and Internet products and to offer more competitive services to existing customers, including retail Ethernet products. During the years ended December 31, 2016, 2015 and 2014, retail Ethernet circuits grew by 2.8%, 12.4%, and 20.5% respectively. Our broadband subscribers decreased by 1.4%, 2.7% and 2.5% during the years ended December 31, 2016, 2015 and 2014, respectively, which directly impacts data and Internet services revenues. We expect to continue our investment in our broadband network to further grow data and Internet services revenues in the coming years.
The following table reflects the primary drivers of year-over-year changes in data and Internet services revenues (dollars in millions):
Year ended December 31, 2016 vs. December 31, 2015 | Year ended December 31, 2015 vs. December 31, 2014 | |||||||||
Increase (Decrease) | % | Increase (Decrease) | % | |||||||
Retail Ethernet services (1) | $ | 0.6 | $ | 4.9 | ||||||
Other data and Internet technology based services (2) | 8.0 | (1.8 | ) | |||||||
Total change in data and Internet services revenues | $ | 8.6 | 5 | % | $ | 3.1 | 2 | % | ||
(1) | Retail Ethernet services revenue is comprised of data services provided through E-LAN, E-LINE and E-DIA technology on our fiber-based Ethernet network. During the years ended December 31, 2016, 2015 and 2014, we recognized $43.0 million, $42.4 million and $37.5 million, respectively, of retail Ethernet revenues. |
(2) | Includes all other services such as DSL, dial-up, high speed cable modem and wireless broadband. |
Regulatory Funding Revenues
We receive certain federal and state government funding that we classify as regulatory funding, which is further described in “Regulatory and Legislative” herein, including: CAF Phase II support effective January 1, 2015 to build and operate broadband services; CAF Phase II transition funding; CAF Phase I frozen support (for Kansas and Colorado and until a reverse auction is completed); CAF funding under the CAF/ICC Order; and universal service fund support from certain states in which we operate. During the years ended December 31, 2016, 2015 and 2014, we recognized $51.4 million, $53.8 million and $45.6 million, respectively, of regulatory funding revenues. The year-over-year changes are primarily due to the timing of CAF Phase II transitional revenue. CAF Phase II support revenue does not include any funding for Colorado and Kansas. We expect the amount of regulatory funding revenue to decline as the amount of CAF Phase II transition funding decreases in 2016 and is phased out through 2018.
41
Other Services Revenues
We receive revenues from other services, including special purpose projects on behalf of third parties, video services (including cable television and video-over-DSL), billing and collection, directory services, the sale and maintenance of customer premise equipment and certain other miscellaneous revenues. Other services revenues also include revenue we receive from late payment charges to end users and interexchange carriers. Due to the composition of other services revenues, it is difficult to predict future trends.
The following table reflects the primary drivers of year-over-year changes in other services revenues (dollars in millions):
Year ended December 31, 2016 vs. December 31, 2015 | Year ended December 31, 2015 vs. December 31, 2014 | |||||||||
Increase (Decrease) | % | Increase (Decrease) | % | |||||||
Special purpose projects (1) | $ | 0.4 | $ | (3.8 | ) | |||||
Late payment fees (2) | — | 0.4 | ||||||||
Other (3) | 1.2 | 0.5 | ||||||||
Total change in other services revenues | $ | 1.6 | 3 | % | $ | (2.9 | ) | (6 | )% | |
(1) | Special purpose projects are completed on behalf of third party requests. |
(2) | Late payment fees are related to customers who have not paid their bills in a timely manner. |
(3) | Other revenues were primarily attributable to revenue from value added reseller of unified communications, data networking and cabling infrastructure solutions, in addition to fluctuations in directory services, billing and collections and in various other miscellaneous services revenues. |
Supplementary revenue information. In addition to the revenue information discussed above, we are providing the following additional strategic revenue categorization information. Management believes that providing this additional revenue information will afford better visibility into our revenue trends as a result of product and service evolution within our industry. Management believes these metrics will enhance investors' ability to evaluate our business and assist investors in their understanding of the changing composition of our revenue (in millions).
42
Years Ended December 31, | |||||||||||
2016 | 2015 | 2014 | |||||||||
Growth (1) | |||||||||||
Broadband (1a) | $ | 141.8 | $ | 135.6 | $ | 138.7 | |||||
Ethernet (1b) | 98.1 | 95.9 | 81.6 | ||||||||
Hosted and Advanced Services (1c) | 17.9 | 13.4 | 12.5 | ||||||||
Subtotal Growth | 257.8 | 244.9 | 232.8 | ||||||||
Growth as a % of Total Revenue | 31.3 | % | 28.5 | % | 25.8 | % | |||||
Convertible (2) | |||||||||||
Non-Ethernet Special Access (2a) | 66.6 | 79.9 | 94.7 | ||||||||
Business Voice (2b) | 119.0 | 127.7 | 134.1 | ||||||||
Other Convertible (2c) | 20.5 | 23.9 | 28.9 | ||||||||
Subtotal Convertible | 206.1 | 231.5 | 257.7 | ||||||||
Convertible as a % of Total Revenue | 25.0 | % | 26.9 | % | 28.6 | % | |||||
Legacy (3) | |||||||||||
Residential Voice (3a) | 212.1 | 226.0 | 245.6 | ||||||||
Switched Access and Other (3b) | 65.9 | 74.7 | 83.7 | ||||||||
Subtotal Legacy | 278.0 | 300.7 | 329.3 | ||||||||
Legacy as a % of Total Revenue | 33.7 | % | 35.0 | % | 36.5 | % | |||||
Regulatory funding (4) | 51.4 | 53.8 | 45.5 | ||||||||
Regulatory funding as a % of Total Revenue | 6.2 | % | 6.3 | % | 5.0 | % | |||||
Miscellaneous (5) | 31.1 | 28.6 | 36.1 | ||||||||
Miscellaneous as a % of Total Revenue | 3.8 | % | 3.3 | % | 4.1 | % | |||||
Total Revenue | $ | 824.4 | $ | 859.5 | $ | 901.4 | |||||
(1) Growth revenue is comprised of products and services that are generally viewed as in-demand by communications consumers over the medium- to long-term and are expected to increase over time.
a) Broadband revenue is comprised of both residential and business customers delivered through DSL, ADSL, VDSL or other similar services.
b) Ethernet revenue includes Ethernet over copper ("EOC") or Ethernet over fiber ("EOF") services delivered to end-users or to wholesalers, who then sell to their end-users.
c) Hosted and Advanced Services includes VoIP and other digital voice services including unified messaging and other IP features as well as revenue generated from our various advanced services including our value added reseller of unified communications, data networking and cabling infrastructure solutions, the next-generation emergency 9-1-1 contracts in several of our service territories as well as data center and managed services.
(2) Convertible revenues are revenues that could move from TDM-based technologies to Ethernet or other advanced services.
a) Non-Ethernet Special Access includes high-capacity circuits. The revenues are primarily comprised of business revenue from T1's, DS3's and SONET products.
b) Business Voice is traditional voice, long distance, ISDN and Centrex services for a business customer.
c) Other Convertible primarily includes Unbundled Network Element ("UNE"), Asynchronous Transfer Mode ("ATM"), Frame Relay, ISDN, Analog Private Line and Internet services such as dial-up.
(3) Legacy revenues are TDM-based voice related consumer revenue largely related to residential customers.
a) Residential Voice is comprised of TDM voice services to residential customers.
b) Switched Access and Other primarily includes Switched Transport, Local Switching, NECA pooling elements and colocation of miscellaneous equipment.
(4) Refer to the definition of "Regulatory Funding Revenues" above.
(5) Miscellaneous is comprised of special purpose projects, late payment fees from our customers and pole rental revenues among other various service revenues.
43
The primary drivers of the year-over-year changes in the strategic revenue categorization for the year ended December 31, 2016 compared to 2015 were:
• | Growth revenue increased $12.9 million as we experienced growth in broadband revenue as speed upgrades and rate increases helped offset a decline in broadband subscribers as well as increased hosted and advanced services revenue and increased Ethernet revenue due to customer growth. |
• | Convertible revenue decreased $25.4 million as customers continued to migrate from non-Ethernet circuits and businesses shifted from traditional voice products to VoIP and hosted products. |
• | Legacy revenue decreased $22.7 million resulting from a decline in voice access lines due to fewer lines in service and lower legacy switched access revenue versus a year ago. |
• | Regulatory funding revenue decreased $2.4 million primarily due to the timing of CAF Phase II transitional revenue. |
• | Miscellaneous revenue increased $2.5 million due to lower PAP/WPP service credits, revenue assurance activities and higher special purpose projects. |
The primary drivers of the year-over-year changes in the strategic revenue categorization for the year ended December 31, 2015 compared to 2014 were:
• | Growth revenue increased $12.1 million as we experienced growth in Ethernet while price increases for broadband services and speed upgrades helped offset a decline in broadband subscribers. |
• | Convertible revenue decreased $26.2 million as customers migrated from non-Ethernet circuits and businesses shifted from traditional voice products to VoIP and hosted products. |
• | Legacy revenue decreased $28.6 million resulting from the loss of voice access lines versus a year ago combined with lower long distance usage. |
• | Regulatory funding revenue increased $8.3 million due to our acceptance of CAF Phase II and the corresponding transitional revenue of $8.8 million associated with that program. |
• | Miscellaneous revenue decreased $7.5 million due to higher special purpose projects in the first quarter of 2014 and revenue assurance. |
Cost of Services and Sales
Cost of services and sales includes the following costs directly attributable to a service or product: salaries and wages, benefits (including stock based compensation, but excluding the net periodic benefit cost of other post-employment benefit plans and qualified pension plans), materials and supplies, contracted services, network access and transport costs, customer provisioning costs, computer systems support and cost of products sold. Aggregate customer care costs, which include billing and service provisioning, are allocated between cost of services and sales and selling, general and administrative expenses. We expect the cost of services and sales to fluctuate with revenue and decrease due to lower employee expenses from a reduction in headcount, partially offset by expected merger related expenses in 2017, including increased stock-based compensation expense described in "Proposed Merger with Consolidated Communications Holdings, Inc." herein.
The following table reflects the primary drivers of year-over-year changes in cost of services and sales (dollars in millions):
Year ended December 31, 2016 vs. December 31, 2015 | Year ended December 31, 2015 vs. December 31, 2014 | |||||||||
Increase (Decrease) | % | Increase (Decrease) | % | |||||||
Employee expense (1) | $ | 2.8 | $ | (1.7 | ) | |||||
Labor negotiation related expense (2) | (40.3 | ) | 1.9 | |||||||
Severance expense (3) | 1.0 | 1.7 | ||||||||
Network and access expense (4) | 0.9 | (10.9 | ) | |||||||
Other (5) | (5.4 | ) | (1.7 | ) | ||||||
Total change in cost of services and sales | $ | (41.0 | ) | (10 | )% | $ | (10.7 | ) | (2 | )% |
(1) | For the years ended December 31, 2016, 2015 and 2014, we recognized $163.5 million, $160.7 million and $162.4 million, respectively, of employee expense as cost of services and sales. The increase for 2016 compared to 2015 is primarily due to the work stoppage described in "Labor Matters" herein partially offset by a reduction in headcount. The decrease for 2015 compared to 2014 is primarily due to the work stoppage described in "Labor Matters" herein as well as a reduction in headcount, partially offset by a decrease in capitalized labor associated with a reduction in labor intensive capital projects in 2015 versus 2014. |
(2) | Labor negotiation related expense is related primarily to contracted services incurred during the years ended December 31, 2015 and 2014 as a result of the work stoppage described in "Labor Matters" herein. |
44
(3) | For the years ended December 31, 2016, 2015 and 2014, we recognized $3.7 million, $2.7 million and $1.0 million of severance expense, respectively, attributed to the reduction in our workforce. |
(4) | Network and access expense continues to decrease primarily due to lower revenue as well as cost management efforts. |
(5) | Other cost of services and sales has decreased primarily due to lower provisioning and lower back-office expenses. |
Other Post-Employment Benefit and Pension (Benefit)/Expense
We expect other post-employment benefit and pension (benefit)/expense to increase in 2017 compared to 2016 since the prior service credit was fully amortized during 2016.
The following table reflects the primary drivers of year-over-year changes in other post-employment benefit and pension (benefit)/expense (dollars in millions):
Year ended December 31, 2016 vs. December 31, 2015 | Year ended December 31, 2015 vs. December 31, 2014 | |||||||||
Increase (Decrease) | % | Increase (Decrease) | % | |||||||
Other post-employment benefits expense/(benefit) (1) | $ | (43.7 | ) | $ | (236.1 | ) | ||||
Pension expense (2) | 0.3 | (9.5 | ) | |||||||
Total change in other post-employment benefit and pension (benefit)/expense | $ | (43.4 | ) | 25 | % | $ | (245.6 | ) | (326 | )% |
(1) | The decrease in the 2016 net periodic benefit cost compared to 2015 for our other post-employment benefit plans is primarily attributable to the decrease in amortization expense of the net actuarial loss of $31.6 million and additional amortization of the net prior service credits of $4.0 million as well as decreases in service and interest costs resulting from the lower benefit obligation. |
The decrease in the 2015 net periodic benefit cost compared to 2014 for our other post-employment benefit plans is primarily attributable to the benefit recognized from amortization of net prior service credits of $304.6 million partially offset by the amortization expense of the net actuarial loss of $113.4 million in 2015, a decrease in interest cost resulting from the lower obligation and a decrease in service cost due to elimination of benefits for active represented employees.
At December 31, 2015, we recognized actuarial losses of $32.8 million, which resulted in a decrease in the amount of actuarial losses being amortized in 2016 compared to 2015. At December 31, 2014, we recognized actuarial losses of $148.4 million, which resulted in an increase in the amount of actuarial losses being amortized in 2015 compared to 2014. The actuarial gains/losses can be attributed primarily to the change in discount rates.
See note (11) "Employee Benefit Plans" to our consolidated financial statements in "Item 8. Financial Statements and Supplementary Data" included elsewhere in this Annual Report for further information on our other post-employment benefit plans.
(2) | The increase in the 2016 net periodic benefit cost compared to 2015 for our qualified pension plans is primarily attributable to a plan curtailment recognized in the third quarter of 2015 as a result of a workforce reduction partially offset by a decrease in service cost, a decrease in the amortization of actuarial losses and an increase in return on assets. |
The decrease in the 2015 net periodic benefit cost compared to 2014 for our qualified pension plans is primarily attributable to a decrease in service cost, amortization of prior service credit and a plan curtailment recognized in the third quarter of 2015 as a result of a workforce reduction partially offset by an increase in amortization of actuarial losses. The prior service credit is related to pension bands that were frozen under the terms of the collective bargaining agreements.
The decrease in service cost in 2016 compared to 2015 resulted from a reduction in the projected benefit obligation. The reduction in the projected benefit obligation used to measure service cost in 2016 and 2015 is primarily the result of the collective bargaining agreements described in “Labor Matters” herein.
At December 31, 2015, we recognized actuarial gains of $31.7 million, which resulted in a decrease in the amount of actuarial losses being amortized in 2016 compared to 2015. At December 31, 2014, we recognized actuarial losses of $66.7 million, which resulted in an increase in the amount of actuarial losses being amortized in 2015 compared to 2014. The actuarial gains/losses can be attributed primarily to the change in discount rates and the gains/losses incurred on payment of significant lump sums in each of those years.
45
See note (11) "Employee Benefit Plans" to our consolidated financial statements in "Item 8. Financial Statements and Supplementary Data" included elsewhere in this Annual Report for further information on our company-sponsored qualified pension plans.
Selling, General and Administrative Expense
Selling, general and administrative ("SG&A") expense includes salaries and wages and benefits (including stock based compensation, but excluding the net periodic benefit cost of other post-employment benefit plans and qualified pension plans) not directly attributable to a service or product, bad debt charges, taxes other than income, advertising and sales commission costs, customer billing, call center and information technology costs, professional service fees and rent for administrative space. We expect SG&A expense to increase primarily due to expected merger related expenses in 2017, including increased stock-based compensation expense described in "Proposed Merger with Consolidated Communications Holdings, Inc." herein.
The following table reflects the primary drivers of year-over-year changes in SG&A expense (dollars in millions):
Year ended December 31, 2016 vs. December 31, 2015 | Year ended December 31, 2015 vs. December 31, 2014 | |||||||||
Increase (Decrease) | % | Increase (Decrease) | % | |||||||
Employee expense (1) | $ | 0.1 | $ | (9.1 | ) | |||||
Labor negotiation related expense (2) | (7.8 | ) | (26.0 | ) | ||||||
Operating taxes | (0.2 | ) | (5.7 | ) | ||||||
Bad debt expense (3) | (5.2 | ) | (3.4 | ) | ||||||
Severance expense (4) | (0.2 | ) | 0.3 | |||||||
Merger related expense (5) | 4.5 | — | ||||||||
Other (6) | — | (7.7 | ) | |||||||
Total change in SG&A expense | $ | (8.8 | ) | (4 | )% | $ | (51.6 | ) | (20 | )% |
(1) | For the years ended December 31, 2016, 2015 and 2014, we recognized $101.9 million, $101.8 million and $110.9 million, respectively, of employee expense in SG&A expense. The increase in 2016 compared to 2015 is primarily due to the work stoppage described in "Labor Matters" herein partially offset by a reduction in headcount. The decrease in 2015 compared to 2014 is primarily attributable to the work stoppage described in "Labor Matters" herein and reduction in headcount. |
(2) | Labor negotiation related expense is primarily related to contingent workforce expenses as well as communications and public relations, legal and training expenses during the years ended December 31, 2015 and 2014. |
(3) | For the years ended December 31, 2016, 2015 and 2014, we recognized $0.6 million, $5.8 million and $9.2 million of bad debt expense, respectively. |
(4) | For the years ended December 31, 2016, 2015 and 2014, we recognized $1.1 million, $1.3 million and $1.0 million of severance expense, respectively. |
(5) | Merger related expense is primarily related to legal and financial advisory costs during the year ended December 31, 2016 in connection with the Merger described in "Proposed Merger with Consolidated Communications Holdings, Inc." herein. |
(6) | The change in other expenses is primarily due to the timing of spending for contracted services and advertising costs. |
Depreciation and Amortization
Depreciation and amortization includes depreciation of our communications network and equipment and amortization of intangible assets. We require significant capital expenditures to maintain, upgrade and enhance our network facilities and operations. We expect our capital expenditures and depreciation expense to remain consistent in the coming years. We expect amortization expense to remain consistent throughout the remainder of our intangible assets' useful lives.
For the years ended December 31, 2016, 2015 and 2014, we recognized $211.3 million, $212.8 million and $209.7 million of depreciation expense, respectively. The decrease in depreciation expense for the year ended December 31, 2016 compared to December 31, 2015 was primarily due to higher retirements than additions. The increase in depreciation expense for the year ended December 31, 2015 compared to December 31, 2014 was primarily due to higher additions than retirements. We recognized $11.0 million, $11.0 million and $11.0 million of amortization expense in the years ended December 31, 2016, 2015 and 2014, respectively.
46
Interest Expense
The following table reflects a summary of interest expense recorded during the years ended December 31, 2016, 2015 and 2014, respectively (in millions):
Years Ended December 31, | |||||||||
2016 | 2015 | 2014 | |||||||
Credit Agreement Loans (as defined hereinafter) | $ | 48.7 | $ | 49.0 | $ | 49.5 | |||
Notes (as defined hereinafter) | 26.3 | 26.3 | 26.3 | ||||||
Amortization of debt issue costs | 1.2 | 1.2 | 1.1 | ||||||
Amortization of debt discount | 3.3 | 3.1 | 2.9 | ||||||
Interest rate swap agreements | 2.4 | 0.6 | — | ||||||
Other interest expense | 0.8 | 0.5 | 0.6 | ||||||
Total interest expense | $ | 82.7 | $ | 80.7 | $ | 80.4 | |||
Interest expense increased $2.0 million (2.5%) in the year ended December 31, 2016 compared to the year ended December 31, 2015 primarily due to interest rate swap agreements, with an effective date of September 30, 2015. Interest expense increased $0.3 million (0.4%) in the year ended December 31, 2015 compared to the year ended December 31, 2014.
For further information regarding the Credit Agreement Loans and the Notes, see "Liquidity and Capital Resources—Debt" herein and note (8) "Long-term Debt" to our consolidated financial statements in "Item 8. Financial Statements and Supplementary Data" included elsewhere in this Annual Report.
Other Income, Net
Other income generally includes non-operating gains and losses. During the years ended December 31, 2016, 2015 and 2014, net other income was $0.3 million, $0.5 million and $7.5 million, respectively.
As required by the Plan, the FairPoint Litigation Trust (the "Trust") was created and the Company transferred to the Trust the "Litigation Trust Claims", as defined in the FairPoint Litigation Trust Agreement among the Company, its subsidiaries and the trustee. The Trust thereafter settled the "Litigation Trust Claims" against Verizon Communications Inc. During 2014, we received payment from the settlement proceeds and recorded one-time, non-operating income of $6.7 million.
Income Taxes
The Company recorded tax expense on the pre-tax net income for the year ended December 31, 2016 of $42.8 million and a tax benefit on the pre-tax net income/(loss) for the years ended December 31, 2015 and 2014 of $1.1 million and $29.8 million, respectively, which equates to an effective tax rate of 29.2%, (1.2)% and 17.9%, respectively. For 2016, the effective tax rate differs from the 35% federal statutory rate primarily due to a tax benefit associated with a decrease in the valuation allowance offset by tax expense related to state taxes. For 2015, the effective tax rate differs from the statutory rate primarily due to a decrease in the valuation allowance as well as a tax benefit related to state taxes. A tax benefit recorded on pre-tax income for the year ended December 31, 2015 resulted in a negative effective tax rate. For 2014, the effective tax rate differs from the statutory rate primarily due an increase to the valuation allowance offset by a tax benefit related to state taxes.
For further information, see note (12) "Income Taxes" to our consolidated financial statements in "Item 8. Financial Statements and Supplementary Data" included elsewhere in this Annual Report.
47
Non-GAAP Financial Measures
We report our financial results in accordance with accounting principles generally accepted in the United States of America ("GAAP"). The table below includes certain non-GAAP financial measures and the adjustments to the most directly comparable GAAP measure used to determine the non-GAAP measures. Management believes that the non-GAAP measures may be useful to investors in understanding period-to-period operating performance and in identifying historical and prospective trends that may not otherwise be apparent when relying solely on GAAP financial measures. In addition, management believes the non-GAAP measures are useful for investors because they enable them to view performance in a manner similar to the method used by the Company's management. Management believes earnings before interest, taxes, depreciation and amortization ("EBITDA"), as adjusted to exclude the effect of items that are further described below ("Adjusted EBITDA"), provides a useful measure of covenant compliance and Unlevered Free Cash Flow (as defined below) may be useful to investors in assessing the Company's ability to generate cash and meet its debt service requirements. The maintenance covenants contained in the Company's credit facility are based on Consolidated EBITDA, which is consistent with the calculation of Adjusted EBITDA below.
For purposes of calculating Adjusted EBITDA (in accordance with the definition of Consolidated EBITDA in our Credit Agreement), costs, expenses and charges related to the renegotiation of labor contracts including, but not limited to, expenses for third-party vendors and losses related to disruption of operations (including any associated penalties under service level agreements and regulatory performance plans) are permitted to be excluded from the calculation. We believe this includes, among others, the costs paid to third-parties for the contingent workforce and service quality penalties due to the disruption of operations. On October 17, 2014, two of our labor unions in northern New England initiated a work stoppage and returned to work on February 25, 2015. As a result, significant union employee and vehicle and other related expenses related to northern New England were not incurred between October 17, 2014 and February 24, 2015 (the "work stoppage period"). Therefore, to assist in the evaluation of the Company's operating performance without the impact of the work stoppage, we estimated the union employee and vehicle and other related expenses using historical data for the work stoppage period that we believe would have been incurred absent the work stoppage ("Estimated Avoided Costs"). Estimated Avoided Costs is a pro forma estimate only. Actual costs absent the strike may have been different. In 2014 and 2015, had our incumbent workforce been in place, actual labor costs during the work stoppage period may have been higher than the $33 million and $27 million, respectively, recorded as Estimated Avoided Costs due to significant winter storm activity that increased our service demands; however, those incremental storm-related costs would have been an allowed add back to Adjusted EBITDA under the Credit Agreement. Estimated employee expenses avoided during the work stoppage period include salaries and wages, bonus, overtime, capitalized labor, benefits, payroll taxes, travel expenses and other employee related costs based on a trailing 12-month average calculated per striking employee per day during the work stoppage period less any actual expense incurred. Estimated vehicle fuel and maintenance expense savings, which resulted from the contingent workforce utilizing their own vehicles, for the work stoppage period were estimated based on a trailing 12-month average of historical costs less actual expense incurred. Management believes "Adjusted EBITDA minus Estimated Avoided Costs" and "Unlevered Free Cash Flow minus Estimated Avoided Costs" may be useful to investors in understanding our operating performance without the impact of the two unions' work stoppage in northern New England as described elsewhere in this Annual Report.
The non-GAAP financial measures, as used herein, are not necessarily comparable to similarly titled measures of other companies. Furthermore, these non-GAAP measures have limitations as analytical tools and should not be considered in isolation from, or as an alternative to, net income or loss, operating income, cash flow or other combined income or cash flow data prepared in accordance with GAAP. Because of these limitations, Adjusted EBITDA, Adjusted EBITDA minus Estimated Avoided Costs, Unlevered Free Cash Flow and Unlevered Free Cash Flow minus Estimated Avoided Costs should not be considered as measures of discretionary cash available to invest in business growth or reduce indebtedness. The Company compensates for these limitations by relying primarily on its GAAP results and using the non-GAAP measures only supplementally.
A reconciliation of Adjusted EBITDA, Adjusted EBITDA minus Estimated Avoided Costs, Unlevered Free Cash Flow and Unlevered Free Cash Flow minus Estimated Avoided Costs to net income/(loss) is provided in the table below (in thousands):
48
Years Ended December 31, | ||||||||||||
2016 | 2015 | 2014 | ||||||||||
Net income/(loss) | $ | 104,095 | $ | 90,416 | $ | (136,319 | ) | |||||
Income tax expense/(benefit) | 42,849 | (1,057 | ) | (29,778 | ) | |||||||
Interest expense | 82,697 | 80,718 | 80,371 | |||||||||
Depreciation and amortization | 222,303 | 223,819 | 220,678 | |||||||||
Pension expense (1a) | 8,967 | 8,635 | 18,144 | |||||||||
Other post-employment benefits expense/(benefit) (1a) | (222,727 | ) | (178,973 | ) | 57,138 | |||||||
Compensated absences (1b) | (350 | ) | (1,645 | ) | 2,848 | |||||||
Severance | 4,863 | 4,014 | 2,005 | |||||||||
Reorganization costs (1c) | — | 38 | 104 | |||||||||
Storm expenses (1d) | — | — | 145 | |||||||||
Other non-cash items, net (1e) | 6,830 | 8,197 | 2,537 | |||||||||
Labor negotiation related expense (1f) | — | 48,933 | 73,590 | |||||||||
All other allowed adjustments, net (1f) | 4,312 | (170 | ) | (889 | ) | |||||||
Adjusted EBITDA (1) (4) | 253,839 | 282,925 | 290,574 | |||||||||
Estimated Avoided Costs (3) | — | (27,000 | ) | (33,000 | ) | |||||||
Adjusted EBITDA minus Estimated Avoided Costs | $ | 253,839 | $ | 255,925 | $ | 257,574 | ||||||
Adjusted EBITDA (1) (4) | $ | 253,839 | $ | 282,925 | $ | 290,574 | ||||||
Pension contributions | (15,475 | ) | (14,168 | ) | (28,266 | ) | ||||||
Other post-employment benefits payments | (5,715 | ) | (5,597 | ) | (5,808 | ) | ||||||
Capital expenditures | (117,050 | ) | (116,159 | ) | (119,489 | ) | ||||||
Unlevered Free Cash Flow (2) | 115,599 | 147,001 | 137,011 | |||||||||
Estimated Avoided Costs (3) | — | (27,000 | ) | (33,000 | ) | |||||||
Unlevered Free Cash Flow minus Estimated Avoided Costs | $ | 115,599 | $ | 120,001 | $ | 104,011 | ||||||
(1)For purposes of calculating Adjusted EBITDA (in accordance with the definition of Consolidated EBITDA in the Credit Agreement), the Company adjusts net income/(loss) for interest, income taxes, depreciation and amortization, in addition to:
(a)the add-back of aggregate pension and other post-employment benefits expense,
(b)the add-back (or subtraction) of the adjustment to the compensated absences accrual to eliminate the impact of changes in the accrual,
(c)the add-back of costs related to the reorganization, including professional fees for advisors and consultants,
(d)the add-back of costs and expenses, including those imposed by regulatory authorities, with respect to casualty events, acts of God or force majeure to the extent they are not reimbursed from proceeds of insurance,
(e)the add-back of other non-cash items, including stock compensation expense, except to the extent they will require a cash payment in a future period, and
(f)the add-back (or subtraction) of other items, including facility and office closures, expenses related to permitted transactions, labor negotiation related expenses (including losses related to disruption of operations), non-cash gains/losses and non-operating dividend and interest income and other extraordinary gains/losses.
(2)Unlevered Free Cash Flow refers to Adjusted EBITDA (calculated in accordance with the definition of Consolidated EBITDA in the Credit Agreement) minus capital expenditures, cash pension contributions and other post-employment benefits cash payments.
(3)See paragraphs preceding the table above for information regarding the calculation of this non-GAAP measure.
(4)On October 16, 2014, we received payment from the Trust settlement proceeds and recorded one-time, non-operating income of $6.7 million, which is included in the calculation of Adjusted EBITDA. For further information regarding this payment, see "Results of Operations—Other Income" included herein.
49
Liquidity and Capital Resources
Overview
Our current and future liquidity is dependent upon our operating results. We expect that our primary sources of liquidity will be net cash provided by operating activities, cash on hand and funds available under the Revolving Facility. Our short-term and long-term liquidity needs arise primarily from:
(i) | interest and principal payments on our indebtedness; |
(ii) | capital expenditures; |
(iii) | working capital requirements as may be needed to support and grow our business; and |
(iv) | contributions to our qualified pension plans and payments under our other post-employment benefit plans. |
Based on our current and anticipated levels of operations and conditions in our markets, we believe that cash on hand, the Revolving Facility and net cash provided by operating activities will enable us to meet our working capital, capital expenditure, debt service and other funding requirements for at least the next 12 months. We were in compliance with the maintenance covenants contained in the Credit Agreement (as defined hereinafter in "Debt—February 2013 Refinancing") through the end of 2016 and expect to remain in compliance for 2017.
Cash Flows
Cash at December 31, 2016 totaled $34.9 million compared to $26.6 million at December 31, 2015, excluding restricted cash of $0.7 million and $0.7 million, respectively. During 2016, cash flows from operations of $134.3 million, which included outflows due to the scheduled semi-annual interest payments on the Notes and the payment of 2015 annual performance bonuses, were partially offset by cash outflows largely associated with $117.1 million of capital expenditures. During 2015, cash flows from operations of $112.0 million, which included outflows due to the scheduled semi-annual interest payments on the Notes and the payment of 2014 annual performance bonuses, were partially offset by cash outflows largely associated with $116.2 million of capital expenditures.
The following table sets forth our consolidated cash flow results reflected in our consolidated statements of cash flows (in millions):
Years Ended December 31, | |||||||||||
Net cash flows provided by (used in): | 2016 | 2015 | 2014 | ||||||||
Operating activities | $ | 134.3 | $ | 112.0 | $ | 121.1 | |||||
Investing activities | (118.5 | ) | (115.9 | ) | (118.4 | ) | |||||
Financing activities | (7.4 | ) | (7.1 | ) | (7.8 | ) | |||||
Net increase/(decrease) in cash | $ | 8.4 | $ | (11.0 | ) | $ | (5.1 | ) | |||
Operating activities. Net cash provided by operating activities is our primary source of funds. Net cash provided by operating activities for 2016 increased $22.3 million compared to 2015, primarily due to lower labor negotiation related expenses, lower operating expenses, partially offset by a reduction in revenues.
Net cash provided by operating activities for 2015 decreased $9.1 million compared to 2014, primarily due to increased labor negotiation related expenses and a reduction in revenues partially offset by lower operating expenses as well as lower cash pension contributions.
Investing activities. Net cash used in investing activities for 2016 increased $2.6 million compared to 2015. Capital expenditures were $117.1 million, $116.2 million and $119.5 million for the years ended December 31, 2016, 2015 and 2014, respectively. In addition, we completed an immaterial business acquisition during 2016. Net cash used in investing activities for 2015 decreased $2.5 million compared to 2014.
Financing activities. Net cash used in financing activities for 2016 increased $0.3 million compared to 2015, primarily due to increased repayments of capital lease obligations. Net cash used in financing activities for 2015 decreased $0.7 million compared to 2014, primarily due to a reduction in repayments of capital lease obligations.
Pension Contributions and Post-Employment Benefit Plan Expenditures
During the year ended December 31, 2016, we contributed $16.5 million to our Company sponsored qualified defined benefit pension plans and funded benefit payments of $5.7 million under our post-employment benefit plans.
50
On August 8, 2014, the Highway and Transportation Funding Act (the "Act") was signed into law. This Act contained a pension funding stabilization provision which allows pension plan sponsors to use higher discount rate assumptions when determining the funded status and, accordingly, the funding obligations for its pension plans.
The provisions of the Act resulted in our 2016 minimum required pension plan contribution being lower than it would have been in the absence of this stabilization provision. We believe that the intent of the stabilization provision is to alter the timing of pension plan contributions, not to reduce the long-term funding of pension plans. Accordingly, the relief we will receive as a result of the stabilization provision may be temporary in nature in that our near-term minimum required contributions will be less than they otherwise would have been without the passage of this Act and will increase in the medium to long-term.
In 2017, we expect our aggregate cash pension contributions and cash post-employment benefit payments to be approximately $24 million. See "Item 1A. Risk Factors—The amount we are required to contribute to our qualified pension plans and post-employment benefit plans is impacted by several factors that are beyond our control and changes in those factors may result in a significant increase in future cash contributions."
Capital Expenditures
We require significant capital expenditures to maintain, upgrade and enhance our network facilities and operations. In 2016, our net capital expenditures totaled $117.1 million, compared to $116.2 million in 2015. We anticipate that we will fund future capital expenditures through cash flows from operations and cash on hand (including amounts available under the Revolving Facility). In 2017, capital expenditures are expected to be between $110 million to $115 million. Our capital expenditures in the coming years will be impacted by our CAF Phase II elections as further described in "Regulatory and Legislative" herein.
Debt
February 2013 Refinancing. On February 14, 2013 (the "Refinancing Closing Date"), we completed the refinancing of our old credit agreement (the "Refinancing"). In connection with the Refinancing, we (i) issued $300.0 million aggregate principal amount of 8.75% senior secured notes due in 2019 (the "Notes") in a private offering exempt from registration under the Securities Act pursuant to an indenture that we entered into on the Refinancing Closing Date (the "Indenture") and (ii) entered into a new credit agreement (the "Credit Agreement"), dated as of the Refinancing Closing Date. The Credit Agreement provides for a $75.0 million revolving credit facility, including a sub-facility for the issuance of up to $40.0 million in letters of credit (the "Revolving Facility"), and a $640.0 million term loan facility (the "Term Loan" and, together with the Revolving Facility, the " Credit Agreement Loans"). On the Refinancing Closing Date, we used the proceeds of the Notes offering, together with $640.0 million of borrowings under the Term Loan and cash on hand to (i) repay principal of $946.5 million outstanding on the old term loan, plus approximately $7.7 million of accrued interest and (ii) pay approximately $32.6 million of fees, expenses and other costs related to the Refinancing.
The Credit Agreement. In connection with the Refinancing, we entered into the Credit Agreement, which provides for the $75.0 million Revolving Facility, including a sub-facility for the issuance of up to $40.0 million in letters of credit, and the $640.0 million Term Loan. The principal amount of the Term Loan and commitments under the Revolving Facility may be increased by an aggregate amount up to $200.0 million, subject to certain terms and conditions specified in the Credit Agreement. The Term Loan will mature on February 14, 2019 and the Revolving Facility will mature on February 14, 2018, subject in each case to extensions pursuant to the terms of the Credit Agreement. As of December 31, 2016, we had $61.1 million, net of $13.9 million of outstanding letters of credit, available for borrowing under the Revolving Facility.
Interest Rates and Fees. Interest on borrowings under the Credit Agreement Loans accrue at an annual rate equal to either LIBOR or the base rate, in each case plus an applicable margin. LIBOR is the per annum rate for an interest period of one, two, three or six months (at our election), with a minimum LIBOR floor of 1.25% for the Term Loan. The base rate for any date is the per annum rate equal to the greatest of (x) the federal funds effective rate plus 0.50%, (y) the rate of interest publicly quoted from time to time by The Wall Street Journal as the United States ''Prime Rate'' and (z) LIBOR with an interest period of one month plus 1.00%. The applicable margin for the Term Loan is (a) 6.25% per annum with respect to term loans bearing interest based on LIBOR or (b) 5.25% per annum with respect to term loans bearing interest based on the base rate. The applicable rate for the Revolving Facility is, initially, (a) 5.50% with respect to revolving loans bearing interest based on LIBOR or (b) 4.50% per annum with respect to revolving loans bearing interest based on the base rate, in each case subject to adjustment based on our consolidated total leverage ratio, as defined in the Credit Agreement. We are required to pay a quarterly letter of credit fee on the average daily amount available to be drawn under letters of credit issued under the Revolving Facility equal to the applicable rate for revolving loans bearing interest based on LIBOR plus a fronting fee of 0.125% per annum on the average daily amount available to be drawn under such letters of credit. In addition, we are required to pay a quarterly commitment fee on the average daily unused portion of the Revolving Facility, which is 0.50% initially, subject to reduction to 0.375% based on our consolidated total leverage ratio. In the third quarter of 2013, we entered into interest rate swap agreements with a combined notional amount of $170.0 million with three counterparties that are effective for a two year period beginning on September 30, 2015 and maturing on September
51
30, 2017. Each respective swap agreement requires us to pay a fixed rate of 2.665% and provides that we will receive a variable rate based on the three month LIBOR rate, subject to a minimum LIBOR floor of 1.25%. Amounts payable by or due to us will be net settled with the respective counterparties on the last business day of each fiscal quarter, commencing December 31, 2015. For further information regarding these agreements, see note (9) "Interest Rate Swap Agreements" to our consolidated financial statements in “Item 8. Financial Statements and Supplementary Data” included elsewhere in this Annual Report.
Security/Guarantors. All obligations under the Credit Agreement, together with certain designated hedging obligations and cash management obligations, are unconditionally guaranteed on a senior secured basis by certain subsidiaries of FairPoint Communications (the "Subsidiary Guarantors") and secured by a first-priority lien on substantially all personal property of FairPoint Communications and the Subsidiary Guarantors, subject to certain exclusions set forth in the related security documents, pari passu with the lien securing the obligations under the Notes.
Mandatory Repayments. We are required to make quarterly repayments of the Term Loan in a principal amount equal to $1.6 million during the term of the Credit Agreement, with such repayments being reduced based on the application of mandatory and optional prepayments of the Term Loan made from time to time. In addition, mandatory repayments are due under the Credit Agreement with (i) a percentage, initially equal to 50% and subject to reduction to 25% in subsequent fiscal years based on our consolidated total leverage ratio, of our excess cash flow, as defined in the Credit Agreement, (ii) the net cash proceeds of certain asset dispositions, insurance proceeds and condemnation awards and (iii) issuances of debt not permitted to be incurred under the Credit Agreement. No premium is required in connection with prepayments. We did not make any optional or mandatory prepayments under the Credit Agreement, excluding mandatory quarterly repayments discussed above, during the years ended December 31, 2016 and 2015. In addition, we were not required to make an excess cash flow payment for fiscal year 2016.
Covenants. The Credit Agreement contains customary representations and warranties and affirmative and negative covenants for a transaction of this type, including two financial maintenance covenants: (i) a consolidated interest coverage ratio and (ii) a consolidated total leverage ratio. The Credit Agreement also contains a covenant limiting the maximum amount of capital expenditures that we and our subsidiaries may make in any fiscal year.
Events of Default. The Credit Agreement also contains customary events of default.
The Notes. On the Refinancing Closing Date, we issued $300.0 million in aggregate principal amount of the Notes pursuant to the Indenture in a private offering exempt from registration under the Securities Act.
The terms of the Notes are governed by the Indenture. The Notes are senior secured obligations of FairPoint Communications and are guaranteed by the Subsidiary Guarantors. The Notes and the guarantees thereof are secured by a first-priority lien on substantially all personal property of FairPoint Communications and the Subsidiary Guarantors, subject to certain exclusions set forth in the related security documents, pari passu with the lien securing the obligations under the Credit Agreement. The Notes will mature on August 15, 2019 and accrue interest at a rate of 8.75% per annum, which is payable semi-annually in arrears on February 15 and August 15 of each year.
Notes redeemed after February 15, 2016 and prior to February 15, 2017 may be redeemed at 104.375% of the aggregate principal amount; Notes redeemed on or after February 15, 2017 and prior to February 15, 2018 may be redeemed at 102.188% of the aggregate principal amount; and Notes redeemed on or after February 15, 2018 may be redeemed at their par value.
The holders of the Notes have the ability to require us to repurchase all or any part of the Notes if we experience certain kinds of changes in control or engage in certain asset sales, in each case at the repurchase prices and subject to the terms and conditions set forth in the Indenture.
The Indenture contains certain covenants which are customary with respect to non-investment grade debt securities, including limitations on our ability to incur additional indebtedness, pay dividends on or make other distributions or repurchase our capital stock, make certain investments, enter into certain types of transactions with affiliates, create liens and sell certain assets or merge with or into other companies. These covenants are subject to a number of important limitations and exceptions.
The Indenture also provides for customary events of default, including cross defaults to other specified debt of FairPoint Communications and certain of its subsidiaries.
Off-Balance Sheet Arrangements
As of December 31, 2016 and December 31, 2015 we had $13.9 million and $14.2 million, respectively, in outstanding letters of credit under the Revolving Facility and $4.1 million and $4.0 million, respectively, of surety bonds. We do not have any other off-balance sheet arrangements other than our operating lease obligations, which are not reflected on our balance sheet. See “—Summary of Contractual Obligations” for further detail.
52
Summary of Contractual Obligations
The following table discloses aggregate information about our contractual obligations as of December 31, 2016 and the periods in which payments are due (in thousands):
Payments due by period | |||||||||||||||||||
Contractual Obligations | Total | Less than 1 year | 1-3 years | 3-5 years | More than 5 years | ||||||||||||||
Long-term debt obligations, including current maturities (a) | $ | 916,000 | $ | 6,400 | $ | 909,600 | $ | — | $ | — | |||||||||
Interest payments on long-term debt obligations (b) | 170,375 | 75,763 | 94,612 | — | — | ||||||||||||||
Capital lease obligations, including current maturities | 3,034 | 1,279 | 1,475 | 280 | — | ||||||||||||||
Operating lease obligations | 17,759 | 6,644 | 7,519 | 2,857 | 739 | ||||||||||||||
Purchase obligations (c) | 19,524 | 13,471 | 5,822 | 231 | — | ||||||||||||||
Other long-term liabilities (d) | 269,070 | 25,569 | 20,833 | 15,715 | 206,953 | ||||||||||||||
Total contractual obligations | $ | 1,395,762 | $ | 129,126 | $ | 1,039,861 | $ | 19,083 | $ | 207,692 | |||||||||
(a) | Long-term debt obligations exclude outstanding letters of credit totaling $13.9 million under the Revolving Facility at December 31, 2016. For more information, see note (8) "Long-term Debt" to our consolidated financial statements in "Item 8. Financial Statements and Supplementary Data" included elsewhere in this Annual Report. |
(b) | Interest payments represent cash payments on the long-term debt, including payments associated with interest rate swaps, while excluding amortization of capitalized debt issuance costs. |
(c) | Purchase obligations represent commitments for maintenance and support of network equipment and software, which we consider to be material. |
(d) | Other long-term liabilities primarily include our qualified pension and post-employment benefit obligations, and deferred tax liabilities. For more information, see notes (11) "Employee Benefit Plans" and (12) "Income Taxes" to our consolidated financial statements in "Item 8. Financial Statements and Supplementary Data" included elsewhere in this Annual Report. In addition, |
(i) | The balance excludes $3.8 million of reserves for uncertain tax positions, including interest and penalties, that were included in deferred tax liabilities at December 31, 2016 for which we are unable to make a reasonably reliable estimate as to when cash settlements with taxing authorities will occur; |
(ii) | The balance includes the current portion of our post-employment benefit obligations of $7.1 million presented in the current portion of other accrued liabilities at December 31, 2016; and |
(iii) | Our 2017 pension contribution is expected to be approximately $18 million and has been reflected as due in less than one year. Our actual contribution could differ from this estimation. Due to uncertainties in the pension funding calculation, the amount and timing of any other pension contributions are unknown and therefore the remaining accrued pension obligation has been reflected as due in more than 5 years. |
Critical Accounting Policies and Estimates
As disclosed in note (2) "Significant Accounting Policies" to our consolidated financial statements in "Item 8. Financial Statements and Supplementary Data" included elsewhere in this Annual Report, the preparation of our financial statements in conformity with U.S. GAAP requires management to make estimates and assumptions about future events that affect the amounts reported in our consolidated financial statements and accompanying notes. Actual results could differ significantly from those estimates. We believe that the following discussion addresses our most critical accounting policies, which are those that are most important to the portrayal of our financial condition and results of operations and require management's most difficult, subjective and complex judgments. Our critical accounting policies as of December 31, 2016 are as follows:
• | Revenue recognition; |
• | Allowance for doubtful accounts; |
• | Accounting for qualified pension and other post-employment benefits; |
• | Accounting for income taxes; |
• | Depreciation of property, plant and equipment; |
• | Stock-based compensation; and |
• | Valuation of long-lived assets and indefinite-lived intangible assets. |
53
Revenue Recognition. We recognize service revenues based upon usage of our local exchange network and facilities and contract fees. Fixed fees for voice services, Internet services and certain other services are recognized in the month the service is provided. Revenue from other services that are not fixed fee or that exceed contracted amounts is recognized when those services are provided. Non-recurring customer activation fees, along with the related costs up to, but not exceeding, the activation fees, are deferred and amortized over the customer relationship period. SQI penalties and certain PAP/WPP service credits are recorded as a reduction to revenue.
We recognize certain revenues pursuant to various cost recovery programs from state and federal USF, CAF/ICC and from revenue sharing agreements with other LECs administered by the National Exchange Carrier Association ("NECA"). Revenues are calculated based on our investment in our network and other network operations and support costs. We have historically collected revenues recognized through this program; however, adjustments to estimated revenues in future periods are possible. These adjustments could be necessitated by adverse regulatory developments with respect to these subsidies and revenue sharing arrangements, changes in the allowable rates of return, the determination of recoverable costs and/or decreases in the availability of funds in the programs due to increased participation by other carriers.
We make estimated adjustments, as necessary, to revenue and accounts receivable for billing errors, including certain disputed amounts. If circumstances related to these adjustments change or our knowledge evolves, our estimate of the recoverability of our accounts receivable could be further reduced from the levels provided in our consolidated financial statements.
Allowance for Doubtful Accounts. In evaluating the collectability of our accounts receivable, we assess a number of factors, including a specific customer's or carrier's ability to meet its financial obligations to us, the length of time the receivable has been past due and historical collection experience. Based on these assessments, we record both specific and general reserves for uncollectible accounts receivable to reduce the related accounts receivable to the amount we ultimately expect to collect from customers and carriers. If circumstances change or economic conditions worsen such that our past collection experience is no longer relevant, our estimate of the recoverability of our accounts receivable could be further reduced from the levels reflected in our accompanying consolidated balance sheet.
Accounting for Qualified Pension and Other Post-employment Benefits. Certain of our employees participate in our qualified pension plans and other post-employment benefit plans. In the aggregate, the projected benefit obligations of the qualified pension plans exceed the fair value of their respective assets and the post-employment benefit plans do not have plan assets, resulting in expense. Significant qualified pension and other post-employment benefit plan assumptions, including the discount rate used, the long-term rate-of-return on plan assets, and medical cost trend rates are periodically updated and impact the amount of benefit plan income, expense, assets and obligations reflected in our consolidated financial statements. The actuarial assumptions we used in determining our qualified pension and post-employment benefit plans obligations may differ materially from actual results due to changing market and economic conditions, higher or lower withdrawal rates or longer or shorter life spans of participants. While we believe that the assumptions used are appropriate, differences in actual experience or changes in assumptions might materially affect our financial position or results of operations.
Our qualified pension and post-employment benefit liabilities are highly sensitive to changes in the discount rate. We currently estimate that a movement of 1% in the discount rate would change our December 31, 2016 qualified pension plan benefit obligations by approximately 17%. We currently estimate that a 1% fluctuation in the discount rate would change our December 31, 2016 post-employment benefit obligations by approximately 12%.
The post-employment benefit obligations are also highly sensitive to the medical trend rate assumption. A 1% increase in the medical trend rate assumed for post-employment benefits at December 31, 2016 would result in an increase in the post-employment benefit obligations of approximately $10.1 million and a 1% decrease in the medical trend rate assumed at December 31, 2016 would result in a decrease in the post-employment benefit obligations of approximately $8.4 million.
For additional information on our qualified pension and post-employment benefit plans, see note (11) "Employee Benefit Plans" to our consolidated financial statements in "Item 8. Financial Statements and Supplementary Data" included elsewhere in this Annual Report.
Accounting for Income Taxes. Income taxes are accounted for under the asset and liability method. Deferred tax assets and liabilities are recognized for the future tax consequences attributable to differences between the financial statement carrying amounts of existing assets and liabilities and their respective tax bases and operating loss and tax credit carryforwards. Deferred tax assets and liabilities are measured using enacted tax rates expected to apply to taxable income in the years in which those temporary differences are expected to be recovered or settled. The effect on deferred tax assets and liabilities of a change in tax rates is recognized in income in the period that includes the enactment date.
In assessing the realizability of deferred tax assets, management considers whether it is more likely than not that some portion or all of the deferred tax assets will not be realized. The ultimate realization of deferred tax assets is dependent upon the generation of future taxable income during the periods in which those temporary differences become deductible. Management
54
determines its estimates of future taxable income based upon the scheduled reversal of deferred tax liabilities and tax planning strategies. The Company establishes valuation allowances for deferred tax assets when it is estimated to be more likely than not that the tax assets will not be realized.
FairPoint Communications files a consolidated income tax return with its subsidiaries. All intercompany transactions and accounts have been eliminated in consolidation.
Depreciation of Property, Plant and Equipment. We recognize depreciation on property, plant and equipment principally on the composite group remaining life method and straight-line composite rates. This method provides for the recognition of the cost of the remaining net investment in telephone plant, less anticipated net salvage value (if any), over the remaining asset lives. When an asset is retired, the original cost, net of salvage value, is charged against accumulated depreciation and no immediate gain or loss is recognized on the disposition of the asset. Under this method, we review depreciable lives periodically and may revise depreciation rates when appropriate. The Company utilizes straight-line depreciation for its non-telephone property, plant and equipment.
Periodically, the Company reviews the estimated remaining useful lives of its group asset categories to address continuing changes in technology, competition and the Company’s overall reduction in capital spending and increased focus on more efficient utilization of its existing assets.
Stock-based Compensation. Compensation expense for share-based awards made to employees and directors are recognized based on the estimated fair value of each award over the award's vesting period. We estimate the fair value of share-based payment awards on the date of grant using one of the following: an option-pricing model for stock options; the closing market value of our stock for restricted stock and non-market performance share awards; and the Monte Carlo valuation model for market performance share awards. We expense the value of the portion of the award that is ultimately expected to vest over the requisite service period in the statement of operations. We assess the probability of achievement of the performance conditions for the non-market performance share awards at each period-end.
We utilize the Black-Scholes option pricing model to calculate the fair value of our stock option grants and the Monte Carlo valuation method to estimate the fair value of the market portion of the performance share awards. The key assumptions used include the expected life of the stock option, the expected dividend rate, the risk-free interest rate, expected volatility and potential total shareholder return outcomes. The expected life of the stock options granted represents the period of time that the options are expected to be outstanding. The risk-free interest rates are based on United States Treasury yields in effect at the date of grant consistent with the expected life. The expected volatility used in the Black-Scholes option pricing model reflects our historical volatility. Our assumptions of these key inputs, in addition to our assumption made about the portion of the awards that will ultimately vest, requires subjective judgment.
For additional information on share-based awards, including key assumptions used in calculating the grant date fair values, see note (16) "Stock-Based Compensation" to our consolidated financial statements in "Item 8. Financial Statements and Supplementary Data" included elsewhere in this Annual Report.
Valuation of Long-lived Assets and Indefinite-lived Intangible Assets. We review our long-lived assets, which include our amortizable intangible assets, for impairment whenever events or changes in circumstances indicate that the carrying value may not be recoverable. In addition, we review non-amortizable intangible assets for impairment on at least an annual basis as of the first day of the fourth quarter of each year, or more frequently whenever indicators of impairment exist. Indicators of impairment could include, but are not limited to:
• | an inability to perform at levels that were forecasted; |
• | a decline in planned revenues; |
• | a permanent decline in market capitalization; |
• | implementation of restructuring plans; |
• | changes in industry trends; and/or |
• | unfavorable changes in our capital structure, cost of debt, interest rates or capital expenditures levels. |
Our only material non-amortizable intangible asset is the FairPoint trade name. An annual quantitative impairment analysis was performed on October 1, 2016. We assess the fair value of our trade name utilizing the relief from royalty method. If the carrying amount of our trade name exceeds its estimated fair value, the asset is considered impaired. For this annual impairment review, we made certain assumptions including an estimated royalty rate, long-term growth rate, effective tax rate and discount rate and applied these assumptions to projected future cash flows, exclusive of cash flows associated with wholesale and other revenues not generated through brand recognition. As of October 1, 2016, the estimated fair value exceeded the carrying value;
55
therefore, an impairment was not necessary. However, future changes in one or more of our assumptions discussed above may result in the recognition of an impairment loss.
For additional information on our FairPoint trade name, see note (6) "Other Intangible Assets" to our consolidated financial statements in "Item 8. Financial Statements and Supplementary Data" included elsewhere in this Annual Report.
New Accounting Standards
For details of recent Accounting Standards Updates and our evaluation of their adoption on our consolidated financial statements, see note (4) "Recent Accounting Pronouncements" to our consolidated financial statements in "Item 8. Financial Statements and Supplementary Data" included elsewhere in this Annual Report.
Inflation
There are cost of living adjustment clauses in certain of the collective bargaining agreements covering our labor union employees. Considerable fluctuations in cost of living due to inflation could result in an adverse effect on our operations.
ITEM 7A. QUANTITATIVE AND QUALITATIVE DISCLOSURES ABOUT MARKET RISK
We are exposed to market risk in the normal course of our business operations due to ongoing investing and funding activities, including those associated with the variable interest rate in our Credit Agreement and our qualified pension plan assets. Market risk refers to the potential change in fair value of a financial instrument as a result of fluctuations in interest rates, fixed income securities and equity prices. We do not hold or issue derivative instruments, derivative commodity instruments or other financial instruments for trading or speculative purposes. Our primary market risk exposures are interest rate risk and investment risk as follows:
Interest Rate Risk - Long-Term Debt. We are exposed to interest rate risk, primarily as it relates to the variable interest rates we are charged under credit agreements to which we are a party. As of December 31, 2016, our interest rate risk exposure was attributable to the Credit Agreement, which includes the Term Loan and the Revolving Facility, each of which is subject to variable interest rates. We use our variable rate debt, in addition to fixed rate debt, to finance our operations and capital expenditures and believe it is prudent to limit the variability of our interest payments on our variable rate debt. To meet this objective, from time to time, we may enter into interest rate derivative agreements to manage fluctuations in cash flows resulting from interest rate risk.
As of December 31, 2016, we were party to interest rate swap agreements in connection with borrowings under the Credit Agreement covering a combined notional amount of $170.0 million. These agreements were effective on September 30, 2015. Accordingly, on December 31, 2016, only $446.0 million principal balance of the Term Loan was subject to interest rate risk. Interest payments on the Term Loan are subject to a LIBOR floor of 1.25%. As a result, while LIBOR remains below 1.25%, we incur interest at above market rates. To the extent that LIBOR remains below 1.25%, we are buffered from the full financial impact of interest rate risk; however, as LIBOR rises, a change in interest rates could materially affect our consolidated financial statements. For example, with the principal balance of the Term Loan as of December 31, 2016, a 1% increase in the interest rate above the LIBOR floor of 1.25% would unfavorably impact interest expense and pre-tax earnings by approximately $4.5 million on an annual basis.
For further information regarding the Credit Agreement, see "Item 7. Management's Discussion and Analysis of Financial Condition and Results of Operations—Liquidity and Capital Resources," and note (8) "Long-Term Debt" and note (9) "Interest Rate Swap Agreements" to our consolidated financial statements in "Item 8. Financial Statements and Supplementary Data" included elsewhere in this Annual Report.
Interest Rate and Investment Risk - Pension Plans. We are exposed to risks related to the fair value of our pension plan assets and the discount rate used to value our pension plan liabilities and the amount of lump-sum payments made to certain participants. Our pension plan assets consist of a portfolio of fixed income securities, equity securities and cash. Changes in the fair value of this portfolio can occur due to changes in interest rates and the general economy. In addition, interest rates are a primary factor in the determination of our actuarially determined liabilities and, if applicable, the amount of the accrued benefit paid in the form of a lump-sum to a pension plan retiree when requested. Our qualified pension plan assets have historically funded a large portion of the benefits paid under our qualified pension plans. Lower returns on plan assets, decreases in the fair value of plan assets and lower discount rates could negatively impact the funded status of our pension plans and we may be required to make larger contributions to our pension plans than currently anticipated. Due to uncertainties in the pension funding calculation, the amount and timing of pension contributions are unknown other than as disclosed in this Annual Report. For activity in our qualified pension plan assets, see note (11) "Employee Benefit Plans" to our consolidated financial statements in "Item 8. Financial Statements and Supplementary Data" included elsewhere in this Annual Report.
56
ITEM 8. FINANCIAL STATEMENTS AND SUPPLEMENTARY DATA
INDEX TO FINANCIAL STATEMENTS
Page | |
FAIRPOINT COMMUNICATIONS, INC. AND SUBSIDIARIES: | |
Report of Independent Registered Public Accounting Firm | |
CONSOLIDATED FINANCIAL STATEMENTS FOR THE YEARS ENDED DECEMBER 31, 2016, 2015 AND 2014: | |
Consolidated Balance Sheets as of December 31, 2016 and December 31, 2015 | |
Consolidated Statements of Operations for the Years Ended December 31, 2016, 2015 and 2014 | |
Consolidated Statements of Comprehensive Income/(Loss) for the Years Ended December 31, 2016, 2015 and 2014 | |
Consolidated Statements of Stockholders' Deficit for the Years Ended December 31, 2016, 2015 and 2014 | |
Consolidated Statements of Cash Flows for the Years Ended December 31, 2016, 2015 and 2014 | |
57
Report of Management on Internal Control Over Financial Reporting
We, the management of FairPoint Communications, Inc., are responsible for establishing and maintaining adequate internal control over financial reporting of the Company. Management has evaluated internal control over financial reporting of the Company as of December 31, 2016 using the criteria for effective internal control established in Internal Control–Integrated Framework (2013) issued by the Committee of Sponsoring Organizations of the Treadway Commission.
Based on such evaluation, management determined that the Company's internal control over financial reporting was effective as of December 31, 2016.
BDO USA, LLP, our independent registered public accounting firm who audited the financial statements included in this Annual Report, has issued an attestation report on the Company's internal control over financial reporting. This report appears on the following page.
/s/ Paul H. Sunu |
Paul H. Sunu |
Chief Executive Officer |
/s/ Karen D. Turner |
Karen D. Turner |
Executive Vice President and Chief Financial Officer |
58
Report of Independent Registered Public Accounting Firm
The Board of Directors and Stockholders
FairPoint Communications, Inc.
Charlotte, North Carolina
We have audited FairPoint Communications, Inc. and subsidiaries’ internal control over financial reporting as of December 31, 2016, based on criteria established in Internal Control - Integrated Framework (2013) issued by the Committee of Sponsoring Organizations of the Treadway Commission (the COSO criteria). FairPoint Communications, Inc. and subsidiaries’ management is responsible for maintaining effective internal control over financial reporting and for its assessment of the effectiveness of internal control over financial reporting, included in the accompanying Report of Management on Internal Control over Financial Reporting. Our responsibility is to express an opinion on the company’s internal control over financial reporting based on our audit.
We conducted our audit in accordance with the standards of the Public Company Accounting Oversight Board (United States). Those standards require that we plan and perform the audit to obtain reasonable assurance about whether effective internal control over financial reporting was maintained in all material respects. Our audit included obtaining an understanding of internal control over financial reporting, assessing the risk that a material weakness exists, and testing and evaluating the design and operating effectiveness of internal control based on the assessed risk. Our audit also included performing such other procedures as we considered necessary in the circumstances. We believe that our audit provides a reasonable basis for our opinion.
A company’s internal control over financial reporting is a process designed to provide reasonable assurance regarding the reliability of financial reporting and the preparation of financial statements for external purposes in accordance with generally accepted accounting principles. A company’s internal control over financial reporting includes those policies and procedures that (1) pertain to the maintenance of records that, in reasonable detail, accurately and fairly reflect the transactions and dispositions of the assets of the company; (2) provide reasonable assurance that transactions are recorded as necessary to permit preparation of financial statements in accordance with generally accepted accounting principles, and that receipts and expenditures of the company are being made only in accordance with authorizations of management and directors of the company; and (3) provide reasonable assurance regarding prevention or timely detection of unauthorized acquisition, use, or disposition of the company’s assets that could have a material effect on the financial statements.
Because of its inherent limitations, internal control over financial reporting may not prevent or detect misstatements. Also, projections of any evaluation of effectiveness to future periods are subject to the risk that controls may become inadequate because of changes in conditions, or that the degree of compliance with the policies or procedures may deteriorate.
In our opinion, FairPoint Communications, Inc. and subsidiaries maintained, in all material respects, effective internal control over financial reporting as of December 31, 2016, based on the COSO criteria.
We also have audited, in accordance with the standards of the Public Company Accounting Oversight Board (United States), the consolidated balance sheet of FairPoint Communications, Inc. and subsidiaries as of December 31, 2016, and the related consolidated statements of operations, comprehensive income (loss), stockholders’ deficit, and cash flows for the year then ended and our report dated March 6, 2017 expressed an unqualified opinion thereon.
/s/ BDO USA, LLP
Atlanta, Georgia
March 6, 2017
59
Report of Independent Registered Public Accounting Firm
The Board of Directors and Stockholders
FairPoint Communications, Inc.
Charlotte, North Carolina
We have audited the accompanying consolidated balance sheet of FairPoint Communications, Inc. and subsidiaries as of December 31, 2016 and the related consolidated statements of operations, comprehensive income (loss), stockholders’ deficit, and cash flows for the year then ended. These financial statements are the responsibility of the Company’s management. Our responsibility is to express an opinion on these financial statements based on our audit.
We conducted our audit in accordance with the auditing standards of the Public Company Accounting Oversight Board (United States). Those standards require that we plan and perform the audit to obtain reasonable assurance about whether the financial statements are free of material misstatement. An audit includes examining, on a test basis, evidence supporting the amounts and disclosures in the financial statements, assessing the accounting principles used and significant estimates made by management, as well as evaluating the overall financial statement presentation. We believe that our audit provides a reasonable basis for our opinion.
In our opinion, the consolidated financial statements referred to above present fairly, in all material respects, the financial position of FairPoint Communications, Inc. and subsidiaries at December 31, 2016, and the consolidated results of their operations and their cash flows for the year then ended, in conformity with accounting principles generally accepted in the United States of America.
We also have audited, in accordance with the standards of the Public Company Accounting Oversight Board (United States), FairPoint Communications, Inc. and subsidiaries’ internal control over financial reporting as of December 31, 2016, based on criteria established in Internal Control - Integrated Framework (2013) issued by Committee of Sponsoring Organizations of the Treadway Commission (the COSO criteria) and our report dated March 6, 2017 expressed an unqualified opinion thereon.
/s/ BDO USA, LLP
Atlanta, Georgia
March 6, 2017
60
Report of Independent Registered Public Accounting Firm
The Board of Directors and Stockholders of FairPoint Communications, Inc. and subsidiaries
We have audited the accompanying consolidated balance sheet of FairPoint Communications, Inc. and subsidiaries as of December 31, 2015, and the related consolidated statements of operations, comprehensive income (loss), stockholders’ deficit and cash flows for each of the two years in the period ended December 31, 2015. These financial statements are the responsibility of the Company's management. Our responsibility is to express an opinion on these financial statements based on our audits.
We conducted our audits in accordance with the standards of the Public Company Accounting Oversight Board (United States). Those standards require that we plan and perform the audit to obtain reasonable assurance about whether the financial statements are free of material misstatement. An audit includes examining, on a test basis, evidence supporting the amounts and disclosures in the financial statements. An audit also includes assessing the accounting principles used and significant estimates made by management, as well as evaluating the overall financial statement presentation. We believe that our audits provide a reasonable basis for our opinion.
In our opinion, the financial statements referred to above present fairly, in all material respects, the consolidated financial position of FairPoint Communications, Inc. and subsidiaries at December 31, 2015, and the consolidated results of their operations and their cash flows for each of the two years in the period ended December 31, 2015, in conformity with U.S. generally accepted accounting principles.
/s/ Ernst & Young LLP
Charlotte, North Carolina
March 2, 2016
61
FAIRPOINT COMMUNICATIONS, INC. AND SUBSIDIARIES
Consolidated Balance Sheets
December 31, 2016 and 2015
(in thousands, except share data)
December 31, 2016 | December 31, 2015 | ||||||
Assets: | |||||||
Cash | $ | 34,924 | $ | 26,560 | |||
Accounts receivable, net | 62,395 | 60,136 | |||||
Prepaid expenses | 24,498 | 24,410 | |||||
Other current assets | 4,898 | 5,030 | |||||
Total current assets | 126,715 | 116,136 | |||||
Property, plant and equipment, net | 1,024,352 | 1,118,781 | |||||
Intangible assets, net | 75,913 | 83,879 | |||||
Restricted cash | 653 | 651 | |||||
Other assets | 3,202 | 3,079 | |||||
Total assets | $ | 1,230,835 | $ | 1,322,526 | |||
Liabilities and Stockholders' Deficit: | |||||||
Current portion of long-term debt | $ | 6,400 | $ | 6,400 | |||
Current portion of capital lease obligations | 1,227 | 918 | |||||
Accounts payable | 27,598 | 28,157 | |||||
Accrued interest payable | 10,120 | 9,983 | |||||
Accrued payroll and related expenses | 26,187 | 24,753 | |||||
Other accrued liabilities | 47,918 | 50,018 | |||||
Total current liabilities | 119,450 | 120,229 | |||||
Capital lease obligations | 1,311 | 1,223 | |||||
Accrued pension obligations | 133,917 | 150,562 | |||||
Accrued post-employment benefit obligations | 87,629 | 94,042 | |||||
Deferred income taxes, net | 28,016 | 35,075 | |||||
Other long-term liabilities | 16,219 | 22,739 | |||||
Long-term debt, net of current portion | 898,370 | 900,145 | |||||
Total long-term liabilities | 1,165,462 | 1,203,786 | |||||
Total liabilities | 1,284,912 | 1,324,015 | |||||
Commitments and contingencies (See Note 18) | |||||||
Stockholders' deficit: | |||||||
Common stock, $0.01 par value, 37,500,000 shares authorized, 27,074,398 and 26,921,066 shares issued and outstanding at December 31, 2016 and 2015, respectively | 271 | 269 | |||||
Additional paid-in capital | 527,613 | 521,842 | |||||
Accumulated deficit | (603,497 | ) | (707,592 | ) | |||
Accumulated other comprehensive income | 21,536 | 183,992 | |||||
Total stockholders' deficit | (54,077 | ) | (1,489 | ) | |||
Total liabilities and stockholders' deficit | $ | 1,230,835 | $ | 1,322,526 | |||
See accompanying notes to consolidated financial statements.
62
FAIRPOINT COMMUNICATIONS, INC. AND SUBSIDIARIES
Consolidated Statements of Operations
Years Ended December 31, 2016, 2015 and 2014
(in thousands, except per share data)
Years Ended December 31, | |||||||||
2016 | 2015 | 2014 | |||||||
Revenues | $ | 824,443 | $ | 859,465 | $ | 901,396 | |||
Operating expenses: | |||||||||
Cost of services and sales, excluding depreciation and amortization | 389,316 | 430,308 | 440,979 | ||||||
Other post-employment benefit and pension (benefit)/expense | (213,760 | ) | (170,338 | ) | 75,282 | ||||
Selling, general and administrative expense, excluding depreciation and amortization | 197,239 | 206,046 | 257,627 | ||||||
Depreciation and amortization | 222,303 | 223,819 | 220,678 | ||||||
Reorganization related expense | — | 38 | 104 | ||||||
Total operating expenses | 595,098 | 689,873 | 994,670 | ||||||
Income/(loss) from operations | 229,345 | 169,592 | (93,274 | ) | |||||
Other income/(expense): | |||||||||
Interest expense | (82,697 | ) | (80,718 | ) | (80,371 | ) | |||
Other, net | 296 | 485 | 7,548 | ||||||
Total other expense | (82,401 | ) | (80,233 | ) | (72,823 | ) | |||
Income/(loss) before income taxes | 146,944 | 89,359 | (166,097 | ) | |||||
Income tax (expense)/benefit | (42,849 | ) | 1,057 | 29,778 | |||||
Net income/(loss) | $ | 104,095 | $ | 90,416 | $ | (136,319 | ) | ||
Weighted average shares outstanding: | |||||||||
Basic | 26,854 | 26,652 | 26,449 | ||||||
Diluted | 27,119 | 26,973 | 26,449 | ||||||
Income/(loss) per share, basic | $ | 3.88 | $ | 3.39 | $ | (5.15 | ) | ||
Income/(loss) per share, diluted | $ | 3.84 | $ | 3.35 | $ | (5.15 | ) | ||
See accompanying notes to consolidated financial statements.
63
FAIRPOINT COMMUNICATIONS, INC. AND SUBSIDIARIES
Consolidated Statements of Comprehensive Income/(Loss)
Years Ended December 31, 2016, 2015 and 2014
(in thousands)
Years Ended December 31, | ||||||||||
2016 | 2015 | 2014 | ||||||||
Net income/(loss) | $ | 104,095 | $ | 90,416 | $ | (136,319 | ) | |||
Other comprehensive income/(loss), net of taxes: | ||||||||||
Interest rate swaps (net of $0.7 million tax expense and $0.3 million and $0.7 million tax benefit, respectively) | 1,106 | (521 | ) | (1,037 | ) | |||||
Qualified pension and post-employment benefit plans (net of $49.8 million tax benefit, $10.0 million tax expense and $8.6 million tax benefit, respectively) | (163,562 | ) | 503,136 | (157,807 | ) | |||||
Total other comprehensive income/(loss) | (162,456 | ) | 502,615 | (158,844 | ) | |||||
Comprehensive income/(loss) | $ | (58,361 | ) | $ | 593,031 | $ | (295,163 | ) | ||
See accompanying notes to consolidated financial statements.
64
FAIRPOINT COMMUNICATIONS, INC. AND SUBSIDIARIES
Consolidated Statements of Stockholders' Deficit
Years Ended December 31, 2016, 2015, and 2014
(in thousands)
Common stock | Additional paid-in capital | Accumulated deficit | Accumulated other comprehensive income/(loss) | Total stockholders' deficit | ||||||||||||||||||
Shares | Amount | |||||||||||||||||||||
Balance at December 31, 2013 | 26,481 | $ | 264 | $ | 512,008 | $ | (661,689 | ) | $ | (159,779 | ) | $ | (309,196 | ) | ||||||||
Net loss | — | — | — | (136,319 | ) | — | (136,319 | ) | ||||||||||||||
Stock-based compensation issued, net | 230 | 3 | (202 | ) | — | — | (199 | ) | ||||||||||||||
Stock-based compensation expense | — | — | 4,274 | — | — | 4,274 | ||||||||||||||||
Interest rate swaps other comprehensive loss | — | — | — | — | (1,037 | ) | (1,037 | ) | ||||||||||||||
Employee benefits other comprehensive loss before reclassifications | — | — | — | — | (166,673 | ) | (166,673 | ) | ||||||||||||||
Employee benefits reclassified from accumulated other comprehensive loss | — | — | — | — | 8,866 | 8,866 | ||||||||||||||||
Balance at December 31, 2014 | 26,711 | $ | 267 | $ | 516,080 | $ | (798,008 | ) | $ | (318,623 | ) | $ | (600,284 | ) | ||||||||
Net income | — | — | — | 90,416 | — | 90,416 | ||||||||||||||||
Stock-based compensation issued, net | 210 | 2 | (595 | ) | — | — | (593 | ) | ||||||||||||||
Stock-based compensation expense | — | — | 6,357 | — | — | 6,357 | ||||||||||||||||
Interest rate swaps other comprehensive loss | — | — | — | — | (521 | ) | (521 | ) | ||||||||||||||
Employee benefits other comprehensive income before reclassifications | — | — | — | — | 687,643 | 687,643 | ||||||||||||||||
Employee benefits reclassified from accumulated other comprehensive income | — | — | — | — | (184,507 | ) | (184,507 | ) | ||||||||||||||
Balance at December 31, 2015 | 26,921 | $ | 269 | $ | 521,842 | $ | (707,592 | ) | $ | 183,992 | $ | (1,489 | ) | |||||||||
Net income | — | — | — | 104,095 | — | 104,095 | ||||||||||||||||
Stock-based compensation issued, net | 153 | 2 | (520 | ) | — | — | (518 | ) | ||||||||||||||
Stock-based compensation expense | — | — | 6,291 | — | — | 6,291 | ||||||||||||||||
Interest rate swaps other comprehensive loss before reclassifications | — | — | — | — | (361 | ) | (361 | ) | ||||||||||||||
Interest rate swaps reclassified from accumulated other comprehensive loss | — | — | — | — | 1,467 | 1,467 | ||||||||||||||||
Employee benefits other comprehensive income before reclassifications | — | — | — | — | 8,029 | 8,029 | ||||||||||||||||
Employee benefits reclassified from accumulated other comprehensive income | — | — | — | — | (171,591 | ) | (171,591 | ) | ||||||||||||||
Balance at December 31, 2016 | 27,074 | $ | 271 | $ | 527,613 | $ | (603,497 | ) | $ | 21,536 | $ | (54,077 | ) | |||||||||
See accompanying notes to consolidated financial statements.
65
FAIRPOINT COMMUNICATIONS, INC. AND SUBSIDIARIES
Consolidated Statements of Cash Flows
Years Ended December 31, 2016, 2015 and 2014
(in thousands)
Years Ended December 31, | |||||||||||
2016 | 2015 | 2014 | |||||||||
Cash flows from operating activities: | |||||||||||
Net income/(loss) | $ | 104,095 | $ | 90,416 | $ | (136,319 | ) | ||||
Adjustments to reconcile net income/(loss) to net cash provided by operating activities: | |||||||||||
Deferred income taxes | 42,609 | (1,260 | ) | (29,864 | ) | ||||||
Provision for uncollectible revenue | 577 | 5,793 | 9,218 | ||||||||
Depreciation and amortization | 222,303 | 223,819 | 220,678 | ||||||||
Other post-employment benefits | (228,442 | ) | (184,569 | ) | 51,337 | ||||||
Qualified pension | (6,508 | ) | (5,534 | ) | (10,129 | ) | |||||
Stock-based compensation | 6,291 | 6,357 | 4,274 | ||||||||
Other non-cash items | 5,265 | 4,211 | 2,137 | ||||||||
Changes in assets and liabilities arising from operations: | |||||||||||
Accounts receivable | (2,478 | ) | 5,615 | 8,485 | |||||||
Prepaid and other assets | 198 | 1,327 | (338 | ) | |||||||
Restricted cash | — | — | 463 | ||||||||
Accounts payable and accrued liabilities | (4,094 | ) | (36,642 | ) | 5,068 | ||||||
Accrued interest payable | 137 | 5 | 1 | ||||||||
Other assets and liabilities, net | (5,701 | ) | 2,463 | (3,948 | ) | ||||||
Total adjustments | 30,157 | 21,585 | 257,382 | ||||||||
Net cash provided by operating activities | 134,252 | 112,001 | 121,063 | ||||||||
Cash flows from investing activities: | |||||||||||
Net capital additions | (117,050 | ) | (116,159 | ) | (119,489 | ) | |||||
Acquisition of business, net of cash acquired | (2,729 | ) | — | — | |||||||
Distributions from investments and proceeds from the sale of property and equipment | 1,319 | 288 | 1,126 | ||||||||
Net cash used in investing activities | (118,460 | ) | (115,871 | ) | (118,363 | ) | |||||
Cash flows from financing activities: | |||||||||||
Repayments of long-term debt | (6,400 | ) | (6,400 | ) | (6,400 | ) | |||||
Restricted cash | (2 | ) | — | — | |||||||
Proceeds from exercise of stock options | 12 | 13 | 32 | ||||||||
Repayment of capital lease obligations | (1,038 | ) | (770 | ) | (1,445 | ) | |||||
Net cash used in financing activities | (7,428 | ) | (7,157 | ) | (7,813 | ) | |||||
Net change | 8,364 | (11,027 | ) | (5,113 | ) | ||||||
Cash, beginning of period | 26,560 | 37,587 | 42,700 | ||||||||
Cash, end of period | $ | 34,924 | $ | 26,560 | $ | 37,587 | |||||
Supplemental disclosure of cash flow information: | |||||||||||
Interest paid, net of capitalized interest | $ | 77,153 | $ | 75,625 | $ | 75,520 | |||||
Income tax paid, net of refunds | 1,346 | 1,021 | 2,363 | ||||||||
Capital additions included in accounts payable | 8,586 | 10,902 | 13,120 | ||||||||
Acquisition of property and equipment by capital lease | 1,436 | 1,320 | 1,142 | ||||||||
See accompanying notes to consolidated financial statements.
66
FAIRPOINT COMMUNICATIONS, INC. AND SUBSIDIARIES
Notes to Consolidated Financial Statements
Except as otherwise required by the context, references in notes to the consolidated financial statements to:
• | "FairPoint Communications" refers to FairPoint Communications, Inc., excluding its subsidiaries. |
• | "FairPoint" or the "Company" refer to the combined business of FairPoint Communications, Inc. and all of its subsidiaries after giving effect to the merger on March 31, 2008 with Northern New England Spinco Inc., a subsidiary of Verizon Communications Inc. ("Verizon"), which transaction is referred to herein as the "Spinco Merger". |
• | "Northern New England operations" refers to the local exchange business acquired from Verizon and certain of its subsidiaries after giving effect to the Spinco Merger. |
• | "Telecom Group" refers to FairPoint, exclusive of the acquired Northern New England operations. |
(1) Organization and Principles of Consolidation
Organization
FairPoint is a leading provider of advanced communications services to business, wholesale and residential customers within its service territories. FairPoint offers its customers a suite of advanced data services such as Ethernet, high capacity data transport and other IP-based services over an extensive fiber network with more than 22,000 miles of fiber optic cable, including approximately 18,000 miles of fiber optic cable in Maine, New Hampshire and Vermont, in addition to Internet access, high-speed data ("HSD") and local and long distance voice services. As of December 31, 2016, FairPoint's service territory spanned 17 states where it is the incumbent communications provider, primarily serving rural communities and small urban markets. Many of its local exchange carriers ("LECs") have served their respective communities for more than 80 years. As of December 31, 2016, the Company operated with approximately 306,600 broadband subscribers, approximately 15,700 Ethernet circuits and approximately 366,100 residential voice lines.
Principles of Consolidation
The consolidated financial statements include all majority-owned subsidiaries of the Company. Partially owned equity affiliates are accounted for under the cost method or equity method when the Company demonstrates significant influence, but does not have a controlling financial interest. Intercompany accounts and transactions have been eliminated upon consolidation.
(2) Significant Accounting Policies
(a) Presentation and Use of Estimates
The accompanying consolidated financial statements have been prepared in accordance with generally accepted accounting principles in the United States of America ("U.S. GAAP"), which require management to make estimates and assumptions that affect reported amounts and disclosures. Actual results could differ from those estimates. The consolidated financial statements reflect all adjustments that, in the opinion of management, are necessary for a fair presentation of results of operations and financial condition for the interim periods shown, including normal recurring accruals and other items.
The Company reclassified "Claims payable and estimated claims accrual" to "Other accrued liabilities" in the December 31, 2015 consolidated balance sheet to be consistent with current period presentation.
Examples of significant estimates include the allowance for doubtful accounts, revenue reserves, the depreciation of property, plant and equipment, valuation of intangible assets, qualified pension and other post-employment benefit plan assumptions, stock-based compensation and income taxes.
(b) Revenue Recognition
Revenues are recognized as services are rendered and are primarily derived from the usage of the Company's networks and facilities or under revenue-sharing arrangements with other communications carriers. Revenues are primarily derived from: voice services, access (including pooling), certain Connect America Fund ("CAF") receipts, Internet and broadband services and other miscellaneous services. Local access charges are billed to local end users under tariffs approved by each state's Public Utilities Commission ("PUC") or by rates, terms and conditions determined by the Company. Access revenues are derived for the intrastate jurisdiction by billing access charges to interexchange carriers and to other LECs. These charges are billed based on toll or access tariffs approved by the local state's PUC. Access charges for the interstate jurisdiction are billed in accordance with tariffs filed
67
by the National Exchange Carrier Association ("NECA") or by the individual company and approved by the Federal Communications Commission (the "FCC"). On July 14, 2016, the FCC adopted a Declaratory Order that classifies switched access services provided by Incumbent LECs as non-dominant services. This change in classification will not impact rates or revenues as the rates continue to be subject to rules established for all access providers pursuant to the Intercarrier Compensation transition rules adopted in 2011.
Revenues are determined on a bill-and-keep basis or a pooling basis. If on a bill-and-keep basis, the Company bills the charges to the customer and keeps the revenue. If the Company participates in a pooling environment (interstate or intrastate), the revenue from the covered services is contributed to a revenue pool. The revenue is then distributed to individual companies based on their company-specific revenue requirement or similar distribution methods. This distribution is based on individual state PUCs' (intrastate) or the FCC's (interstate) approved settlement mechanisms, separation rules and rates of return. Distribution from these pools can change relative to changes made to expenses, plant investment or rate-of-return. Some companies participate in federal and certain state universal service programs that are pooling in nature but are regulated by rules separate from those described above. These rules vary by state. Revenues earned through the various pooling arrangements are initially recorded based on the Company's estimates.
On November 18, 2011, the FCC released its comprehensive landmark order to modify the nationwide system of universal support and the CAF/intercarrier compensation ("ICC") system (the "CAF/ICC Order"). Rule changes associated with the FCC's CAF/ICC Order impact the NECA interstate pooling, in that a portion of the Company's interstate Universal Service Fund ("USF") revenues, which are administered through the NECA pools and which prior to January 1, 2012 were based on costs, are now based on rules from the FCC's CAF/ICC Order, including CAF Phase II support where FairPoint accepted CAF Phase II support, continued CAF Phase I frozen support where FairPoint did not accept CAF Phase II support and CAF/ICC rules in states where FairPoint is eligible for such support under the ICC Transition Rules for price cap and rate-of-return carriers. FairPoint accepted CAF Phase II support in all states except Kansas and Colorado. The CAF Phase II revenue is being recognized on a straight-line basis, ratably over the six-year period in which the funding will be received. The accepted transition funding is being recognized monthly as received over the three-year transition period ending in July 2018. The Company is required to meet certain interim milestones over the six-year period of CAF Phase II and the Company performs a quarterly assessment of its progress.
Revenue from long distance switched retail and wholesale services can be recurring due to coverage under an unlimited calling plan or can be usage sensitive. In either case, they are billed in arrears and recognized when earned. Internet and data services revenues are substantially all recurring revenues and are billed one month in advance and deferred until earned.
As of December 31, 2016 and 2015, unearned revenue of $18.2 million and $19.9 million, respectively, was included in other accrued liabilities and unearned revenue of $4.8 million and $7.6 million, respectively, was included in other long-term liabilities on the consolidated balance sheets.
The majority of the Company's other miscellaneous services revenue is generated from ancillary special projects at the request of third parties, video services, directory services and late payment charges to end users and wholesale carriers. The Company generally requires customers to pay for ancillary special projects in advance. As of December 31, 2016 and 2015, customer deposits of $3.3 million and $2.1 million, respectively, were included in other accrued liabilities on the consolidated balance sheets. Once the ancillary special project is completed or substantially complete and all project costs have been accumulated for proper accounting recognition, the advance payment is recognized as revenue with any overpayments refunded to the customer, as appropriate. The Company recognizes revenue upon the provision of video services in certain markets by reselling DirecTV and providing cable and IP television video-over-digital subscriber line services. The Company also publishes telephone directories in some of its Telecom Group markets and recognizes revenues associated with these publications evenly over the time period covered by the directory, which is typically twelve months. The Company bills late payment fees to customers who have not paid their bills in a timely manner. In general, late payment fee revenue is recognized based on collection of these charges.
Non-recurring customer activation fees, along with the related costs up to, but not exceeding, the activation fees, are deferred and amortized over the customer relationship period.
Under the Maine Public Utilities Commission ("MPUC") rules (Chapter 201), which went into effect August 1, 2014, the MPUC may open an investigation regarding the failure to meet any of the established SQI benchmarks and has the authority to impose penalties. The MPUC opened an investigation into the Company's failure to meet some third quarter 2014 SQI benchmarks and subsequently opened an investigation into the fourth quarter of 2014 and then with respect to each of the quarterly periods in 2015. On March 29, 2016, the MPUC consolidated the investigations of the six quarters into one investigation. On September 14, 2016, a hearing examiner for the MPUC issued a report recommending that the MPUC find that FairPoint had failed to meet SQI benchmarks for the period under review and impose a $500,000 penalty as allowed by statute, and provided until October 7, 2016 for comments or exceptions to be filed by interested parties. This recommendation did not constitute MPUC action. The Company promptly filed a motion to implement adjudicatory procedures prior to entry of any final order. After the Company’s motion to implement adjudicatory procedures was briefed by the parties, the Hearing Examiner issued an order on November 30, 2016 granting the Company’s motion in part and permanently withdrawing the Examiner’s September 14, 2016 report. A case schedule
68
was established by the Hearing Examiner, and a hearing is currently scheduled to begin May 11, 2017. Subsequent legislation in Maine has superseded the SQI benchmarks applied in the examiner’s report. Effective with the new legislation, the reporting of service quality will be required only in the areas of the state where Provider of Last Resort ("POLR") is still required and will be filed and treated as confidential. The number of SQI reporting metrics has been reduced and the benchmarks are less stringent than under previous Commission rules.
The Company also adopted a separate performance assurance plan ("PAP") for certain services provided on a wholesale basis to competitive local exchange carriers ("CLECs") in each of the states of Maine, New Hampshire and Vermont. Pursuant to the PAPs, FairPoint was required to provide service credits in the event the Company was unable to meet the provisions of the respective PAP. Effective June 1, 2015, the PAP was retired and the Company began measuring and reporting certain wholesale local service performance results pursuant to the terms of a simplified measurement plan. The new plan, called the Wholesale Performance Plan ("WPP"), was developed collaboratively with CLECs over several years and was approved by the Maine, New Hampshire and Vermont regulatory commissions. Under the WPP, the Company is subject to significantly fewer performance criteria and its annual service credit exposure was reduced.
In evaluating the presentation of taxes and surcharges, such as USF charges, sales, use, value added and some excise taxes, the Company determines whether it is the primary obligor or principal taxpayer. In jurisdictions where the Company deems that it is the principal taxpayer, the Company records these taxes and surcharges on a gross basis and include them in its revenues and costs of services and sales. In jurisdictions where the Company determines that it is a pass through agent for the government authority, it records the taxes on a net basis through the consolidated balance sheets.
Customer arrangements that include both equipment and services are evaluated to determine whether the elements are separable. If the elements are deemed separable and separate earnings processes exist, the revenue associated with each element is allocated to each element based on the relative estimated selling price of the separate elements. The Company has estimated the selling prices of each element by reference to vendor-specific objective evidence of selling prices when the elements are sold separately. The revenue associated with each element is then recognized as earned.
Management makes estimated adjustments, as necessary, to revenue and accounts receivable for billing errors, including certain disputed amounts.
(c) Cash and Cash Equivalents
The Company considers all highly liquid investments purchased with an original maturity of three months or less to be cash equivalents.
(d) Accounts Receivable
Accounts receivable are recorded at the invoiced amount and do not bear interest. The allowance for doubtful accounts is recorded as a contra-asset of accounts receivable and represents the Company's best estimate of probable credit losses in the Company's existing accounts receivable. The Company establishes an allowance for doubtful accounts based upon factors surrounding the credit risk of specific customers, historical trends, and other information. Accounts receivable balances are reviewed on an aged basis and account balances are written off against the allowance after all means of collection have been exhausted and the potential for recovery is considered remote.
The following is activity in the Company's allowance for doubtful accounts receivable for the years ended December 31, 2016, 2015 and 2014 (in thousands):
Years Ended December 31, | |||||||||||
2016 | 2015 | 2014 | |||||||||
Balance, beginning of period | $ | 8,333 | $ | 9,894 | $ | 13,142 | |||||
Provision charged to expense | 577 | 5,793 | 9,218 | ||||||||
Provision charged to other accounts (a) | — | (18 | ) | (43 | ) | ||||||
Amounts written off, net of recoveries | (5,273 | ) | (7,336 | ) | (12,423 | ) | |||||
Balance, end of period | $ | 3,637 | $ | 8,333 | $ | 9,894 | |||||
(a) | Provision charged to other accounts includes accruals charged to accounts payable for anticipated uncollectible charges on purchase of accounts receivable from others which were billed by the Company. |
69
(e) Credit Risk
The financial instruments which potentially subject the Company to concentrations of credit risk consist principally of cash and gross accounts receivable existing at December 31, 2016. The Company places its cash with high-quality financial institutions. Concentrations of credit risk with respect to accounts receivable are principally related to trade receivables from other interexchange carriers and are otherwise limited to the Company's large number of customers in several states.
The Company sponsors qualified pension plans for certain employees. Plan assets associated with these qualified pension plans are held by third party trustees and investments are comprised principally of debt and equity securities. The fair value of these plan assets is dependent on the financial condition of those entities issuing the debt and equity securities. A significant decline in the fair value of plan assets could result in additional Company contributions to the qualified pension plans in order to meet funding requirements under the Employee Retirement Income Security Act of 1974, as amended ("ERISA"). For additional information regarding the plan assets of the Company's qualified pension plans, including the December 31, 2016 balance at risk, see note (11) "Employee Benefit Plans" herein.
(f) Property, Plant and Equipment
Given that a majority of the Company's property, plant and equipment is plant used in the Company's wireline and fiber-based Ethernet networks, depreciation is principally based on the composite group remaining life method and straight-line composite rates. This methodology provides for the recognition of the cost of the remaining net investment in telephone plant, property and equipment less anticipated positive net salvage value, over the remaining asset lives. When depreciable telephone plant is replaced or retired, the carrying amount of such plant is deducted from the respective accounts and charged to accumulated depreciation. No gain or loss is generally recognized on disposition of assets. Use of this methodology requires the periodic revision of depreciation rates. In the evaluation of asset lives, multiple factors are considered, including, but not limited to, the ongoing network deployment, technology upgrades and enhancements, planned retirements and the adequacy of reserves. The Company utilizes straight-line depreciation for its non-telephone property, plant and equipment.
Periodically, the Company reviews the estimated remaining useful lives of its group asset categories to address continuing changes in technology, competition and the Company’s overall reduction in capital spending and increased focus on more efficient utilization of its existing assets.
Network software purchased or developed in connection with related plant assets is capitalized. The Company also capitalizes interest associated with the acquisition or construction of network related assets. Capitalized interest is reported as part of the cost of the network related assets and as a reduction in interest expense. See "(i) Computer Software and Interest Costs" herein for additional information.
(g) Long-Lived Assets
Property, plant and equipment and intangible assets subject to amortization are reviewed for impairment whenever events or changes in circumstances indicate that their carrying amounts may not be recoverable. An impairment charge is recognized for the amount, if any, by which the carrying value of the asset exceeds its fair value.
As of December 31, 2016, the Company performed its routine review of impairment triggering events and concluded that it does not believe a triggering event has occurred with respect to property, plant and equipment and intangible assets subject to amortization.
(h) Asset Retirement Obligations
The Company records the estimated fair value of an asset retirement obligation when incurred. The associated asset retirement costs are capitalized as part of the carrying amount of the long-lived asset and depreciated over the asset's estimated useful life. The Company has asset retirement obligations related to battery, fuel tank and chemically-treated pole disposal as well as soil remediation at leased facilities. Considerable management judgment is required in estimating these obligations. Important assumptions include estimates of retirement costs, the timing of the future retirement activities and the likelihood or retirement provisions being enforced. Changes in these assumptions based on future information could result in adjustments to estimated liabilities.
(i) Computer Software and Interest Costs
The Company capitalizes certain costs incurred in connection with developing or obtaining internal use software which has a useful life in excess of one year. Capitalized costs include direct development costs associated with internal use software, including direct labor costs and external costs of materials and services.
70
Subsequent additions, modifications or upgrades to internal-use software are capitalized only to the extent that they allow the software to perform a task it previously did not perform. Software maintenance and training costs are expensed in the period in which they are incurred.
In addition, the Company capitalizes the interest cost associated with the period of time over which the Company's internal use software is developed or obtained.
During the years ended December 31, 2016, 2015 and 2014, the Company recorded the following with regards to software costs (in thousands):
Years Ended December 31, | |||||||||||
2016 | 2015 | 2014 | |||||||||
Capitalized software costs | $ | 10,282 | $ | 22,768 | $ | 17,984 | |||||
Capitalized interest costs | $ | 148 | $ | 99 | $ | 70 | |||||
Amortization expense on capitalized software | $ | 16,610 | $ | 14,669 | $ | 11,415 | |||||
A summary of capitalized software is shown below (in thousands):
December 31, 2016 | December 31, 2015 | ||||||
Gross carrying amount | $ | 167,986 | $ | 176,778 | |||
Less: accumulated amortization | (128,758 | ) | (131,031 | ) | |||
Net capitalized software | $ | 39,228 | $ | 45,747 | |||
Estimated future amortization on capitalized software for each of the five years subsequent to December 31, 2016 are as follows (in thousands):
Year ending December 31, | |||
2017 | $ | 14,856 | |
2018 | $ | 11,670 | |
2019 | $ | 7,731 | |
2020 | $ | 4,528 | |
2021 | $ | 443 | |
(j) Impairment of Other Intangible Assets
Indefinite-lived Intangible Asset. Non-amortizable intangible assets are assessed for impairment at least annually. The Company performs its annual impairment test as of the first day of the fourth fiscal quarter of each year and assesses the fair value of the trade name based on the relief from royalty method. If the carrying amount of the trade name exceeds its estimated fair value, the asset is considered impaired.
For its non-amortizable intangible asset impairment assessments of the FairPoint trade name, the Company makes certain assumptions including an estimated royalty rate, a long-term growth rate, an effective tax rate and a discount rate, and applies these assumptions to projected future cash flows, exclusive of cash flows associated with wholesale revenues and other revenues not generated through brand recognition. As of October 1, 2016, the estimated fair value exceeded the carrying value in the Company's quantitative analysis; therefore, an impairment was not necessary. However, future changes in one or more of the assumptions discussed above may result in the recognition of an impairment loss.
Amortizable Intangible Assets. Amortizable intangible assets must be reviewed for impairment as part of long-lived assets whenever indicators of impairment exist. See "(g) Long-Lived Assets" herein for additional information.
(k) Accounting for Income Taxes
Income taxes are accounted for under the asset and liability method. Deferred tax assets and liabilities are recognized for the future tax consequences attributable to differences between the financial statement carrying amounts of existing assets and liabilities and their respective tax bases and operating loss and tax credit carryforwards. Deferred tax assets and liabilities are measured using enacted tax rates expected to apply to taxable income in the years in which those temporary differences are expected to be recovered or settled. The effect on deferred tax assets and liabilities of a change in tax rates is recognized in income in the period that includes the enactment date.
71
In assessing the realizability of deferred tax assets, management considers whether it is more likely than not that some portion or all of the deferred tax assets will not be realized. The ultimate realization of deferred tax assets is dependent upon the generation of future taxable income during the periods in which those temporary differences become deductible. Management determines its estimates of future taxable income based upon the scheduled reversal of deferred tax liabilities and tax planning strategies. The Company establishes valuation allowances for deferred tax assets when it is estimated to be more likely than not that the tax assets will not be realized.
FairPoint Communications files a consolidated income tax return with its subsidiaries. All intercompany transactions and accounts have been eliminated in consolidation.
(l) Stock-Based Compensation
The Company accounts for employee awards which are expected to vest. Stock-based compensation cost is measured at the grant date, based on the fair value of the award, and is recognized as expense on a straight-line basis over the requisite service period, which generally begins on the date the award is granted through the date the award vests.
(m) Employee Benefit Plans
The Company recognizes the overfunded or underfunded status of its qualified defined benefit plans and post-employment benefit plans as either an asset or liability, respectively, on the consolidated balance sheets. Actuarial gains and losses that arise during the year are recognized as a component of comprehensive income/(loss), net of applicable income taxes, and included in accumulated other comprehensive income. These gains and losses are amortized over future years as a component of the net periodic benefit cost.
(n) Operating Segments
Management views its business of providing data, video and voice communications services to residential, wholesale and business customers as one operating segment. The Company's services consist of retail and wholesale communications and data services, including voice and HSD in 17 states. The Company's chief operating decision maker assesses operating performance and allocates resources based on the consolidated results.
(o) Other Liabilities
Accrued Bonuses. As of December 31, 2016 and 2015, accrued bonuses of $12.7 million and $12.6 million, respectively, were included in accrued payroll and related liabilities on the consolidated balance sheets.
(p) Advertising Costs
Advertising costs are expensed as they are incurred. During the years ended December 31, 2016, 2015 and 2014, advertising costs were $6.5 million, $6.6 million and $9.8 million, respectively.
(q) Interest Rate Swap Agreements
In the third quarter of 2013, the Company entered into interest rate swap agreements. For further information regarding these interest rate swap agreements, see note (9) "Interest Rate Swap Agreements." The interest rate swap agreements, at their inception, qualified for and were designated as cash flow hedging instruments. The Company records its interest rate swaps on the consolidated balance sheets at fair value. The effective portion of changes in fair value are recorded in accumulated other comprehensive income and are subsequently reclassified into earnings in the period that the hedged forecasted transaction affects earnings. Any ineffective portion is recognized in earnings. Both at inception and on a quarterly basis, the Company performs an effectiveness test.
(3) Proposed Merger with Consolidated Communications Holdings, Inc.
On December 3, 2016, FairPoint Communications entered into an Agreement and Plan of Merger (the “Merger Agreement”) with Consolidated Communications Holdings, Inc. ("Consolidated"), a Delaware Corporation, and Falcon Merger Sub, Inc., a newly formed Delaware corporation and wholly-owned subsidiary of Consolidated (“Merger Sub”), which provides for, among other things, a business combination whereby Merger Sub will merge with and into FairPoint Communications, with FairPoint Communications as the surviving entity (the “Merger”). As a result of the Merger, the separate corporate existence of Merger Sub will cease, and FairPoint Communications will survive as a wholly owned subsidiary of Consolidated. Consolidated is a leading business and broadband communications provider throughout its 11-state service area.
72
If the Merger is completed, under the terms of the Merger Agreement, stockholders of FairPoint Communications will receive 0.7300 shares of common stock of Consolidated for each share of FairPoint Communications common stock that they own immediately before this transaction. If the Merger is not completed, FairPoint Communications may be required to pay a termination fee of $18.9 million under certain circumstances set forth in the Merger Agreement. The Merger is expected to close around the middle of 2017 and is subject to standard closing conditions, including federal and state regulatory approvals and the approval of both Consolidated’s and FairPoint Communications’ stockholders.
For the year ended December 31, 2016, the Company recognized $4.5 million of merger related expenses, primarily for legal and financial advisory costs included in selling, general and administrative expense, excluding depreciation and amortization, on the consolidated statement of operations.
The award agreements granted under the FairPoint Communications, Inc. Amended and Restated 2010 Long Term Incentive Plan (the "Long Term Incentive Plan") provide that upon the occurrence of a change in control, unvested benefits will be accelerated and vest in full.
(4) Recent Accounting Pronouncements
In May 2014, the Financial Accounting Standards Board ("FASB") issued Accounting Standards Update ("ASU") 2014-09, Revenue from Contracts with Customers, which is designed to clarify the principles used to recognize revenue for entities. The core principle of ASU 2014-09 is that a company should recognize revenue to depict the transfer of promised goods or services to customers in an amount that reflects the consideration to which the company expects to be entitled in exchange for those goods or services. In addition, ASU 2014-09 requires enhanced disclosures about the nature, amount, timing and uncertainty of revenue and cash flows arising from contracts with customers. While ASU 2014-09 is primarily associated with guidance for revenue from contracts with customers, it also includes new accounting principles related to deferral and amortization of contract acquisition and fulfillment costs. In 2016, the Company performed an assessment of its revenues, acquisition and fulfillment costs from contracts to understand any potential differences to its current accounting policies and business processes. The Company expects to have an impact concerning the deferral of acquisition costs as its current policy is to expense these costs as incurred. At this time, the Company continues to assess and determine data and system requirements necessary to quantify the impacts of this standard as well as to develop and provide the enhanced disclosures required by the new guidance.
In July 2015, the FASB approved a one-year deferral of the effective date of ASU 2014-09. Subsequently, the FASB has issued several additional ASUs to clarify the implementation guidance on principal versus agent considerations, identifying performance obligations, assessing collectability, presentation of sales taxes and other similar taxes collected from customers, non-cash considerations, contract modifications and completed contracts at transition. The new pronouncements will be effective for annual and interim periods beginning on or after December 15, 2017. The Company intends to adopt the new standard effective January 1, 2018.
The standard allows for two methods of adoption: (1) "full retrospective" adoption, meaning the standard is applied to all periods presented, or (2) "modified retrospective" adoption, meaning the cumulative effect of applying ASU 2014-09 is recognized as an adjustment to the fiscal year 2018 opening retained earnings balance. Currently, the Company is evaluating the available adoption methods and plans to select an adoption method in the second half of 2017.
In August 2014, the FASB issued ASU 2014-15, Disclosure of Uncertainties about an Entity's Ability to Continue as a Going Concern, which requires management to evaluate whether there is substantial doubt about an entity’s ability to continue as a going concern and to provide related footnote disclosures in certain circumstances. ASU 2014-15 is effective for annual periods beginning after December 15, 2016. The Company adopted this pronouncement for its year ended December 31, 2016 and it did not have a material impact on its consolidated financial statements.
In February 2016, the FASB issued ASU 2016-02, Leases, whereby, lessees will be required to recognize for all leases at the commencement date a lease liability, which is a lessee‘s obligation to make lease payments arising from a lease, measured on a discounted basis; and a right-of-use asset, which is an asset that represents the lessee’s right to use, or control the use of, a specified asset for the lease term. Under the new guidance, lessor accounting is largely unchanged. A modified retrospective transition approach for leases existing at, or entered into after, the beginning of the earliest comparative period presented in the financial statements must be applied. The modified retrospective approach would not require any transition accounting for leases that expired before the earliest comparative period presented. Companies may not apply a full retrospective transition approach. ASU 2016-02 is effective for annual and interim periods beginning after December 15, 2018. Early application is permitted. The Company is evaluating the potential impact of this pronouncement.
In March 2016, the FASB issued ASU 2016-09, Improvements to Employee Share-Based Payment Accounting, which simplifies several aspects of the accounting for share-based payment award transactions, including, but not limited to: (a) income
73
tax consequences; (b) classification of awards as either equity or liabilities; and (c) classification on the statement of cash flows. ASU 2016-09 is effective for annual and interim periods beginning after December 15, 2016. The Company does not believe the adoption of this pronouncement will have a material impact on its consolidated financial statements.
In November 2016, the FASB issued ASU 2016-18, Statement of Cash Flows: Restricted Cash, which requires a statement of cash flows to explain the change during the period in the total of cash, cash equivalents, and amounts generally described as restricted cash or restricted cash equivalents. Amounts generally described as restricted cash and restricted cash equivalents should be included with cash and cash equivalents when reconciling the beginning-of-period and end-of-period total amounts shown on the statement of cash flows. ASU 2016-18 is effective for fiscal years beginning after December 15, 2017 and interim periods within those fiscal years, and early adoption is permitted, including in an interim period. If early adopted in an interim period, any adjustments should be reflected as of the beginning of the fiscal year that includes that interim period. ASU 2016-18 is to be applied through a retrospective transition method to each period presented. The Company does not believe that the adoption of this pronouncement will have a significant impact on its consolidated statements of cash flows.
(5) Dividends
The Company currently does not pay a dividend on its common stock and has no plans to pay dividends.
(6) Other Intangible Assets
Indefinite-lived Intangible Assets
At December 31, 2016 and 2015, the Company's trade name is recorded at $39.2 million. In addition, the Company completed an immaterial business acquisition during 2016 and recorded goodwill of $2.5 million. On October 1, 2016 and October 1, 2015, the Company performed its annual non-amortizable intangible asset quantitative analysis and concluded that there was no impairment at that time. As of December 31, 2016, the Company performed its routine review of impairment indicators and concluded that it did not believe a triggering event had occurred.
Other Amortizable Intangible Assets
The Company's amortizable intangible assets are as follows (in thousands):
December 31, 2016 | December 31, 2015 | ||||||
Customer lists (weighted average 9.0 years): | |||||||
Gross carrying amount | $ | 99,410 | $ | 99,000 | |||
Less: accumulated amortization | (65,312 | ) | (54,290 | ) | |||
Net customer lists | $ | 34,098 | $ | 44,710 | |||
Other net amortizable intangible assets | $ | 184 | $ | — | |||
Total amortizable intangible assets | $ | 34,282 | $ | 44,710 | |||
Amortization expense of the Company's amortizable intangible assets was $11.0 million, $11.0 million and $11.0 million for the years ended December 31, 2016, 2015 and 2014, respectively, and is expected to be approximately $11.1 million in 2017, 2018, 2019, respectively, $0.8 million in 2020 and $0.1 million in 2021.
74
(7) Property, Plant and Equipment
A summary of property, plant and equipment is shown below (in thousands):
Estimated Life | December 31, 2016 | December 31, 2015 | ||||||||
(in years) | ||||||||||
Land | — | $ | 35,217 | $ | 35,632 | |||||
Buildings | 40 | 215,897 | 211,115 | |||||||
Central office equipment | 7 – 10 | 662,042 | 635,208 | |||||||
Outside communications plant | 15 – 35 | 1,191,142 | 1,161,042 | |||||||
Furniture, vehicles and other work equipment | 5 – 15 | 257,337 | 258,749 | |||||||
Plant under construction | — | 99,568 | 81,096 | |||||||
Other | — | 16,029 | 17,144 | |||||||
Total property, plant and equipment | 2,477,232 | 2,399,986 | ||||||||
Less: Accumulated depreciation | (1,452,880 | ) | (1,281,205 | ) | ||||||
Net property, plant and equipment | $ | 1,024,352 | $ | 1,118,781 | ||||||
Depreciation expense, excluding amortization of intangible assets, for the years ended December 31, 2016, 2015 and 2014 was $211.3 million, $212.8 million and $209.7 million, respectively. Depreciation expense includes amortization of assets recorded under capital leases.
The Company recorded $0.6 million of asset retirement obligations during the year ended December 31, 2015. Net accretion expense, revisions in cash flow estimates and liability settlements were insignificant during the year. The Company's asset retirement obligations are included as a component of other accrued liabilities or other long-term liabilities in the consolidated balance sheets based on the expected timing of the obligation. As of December 31, 2016, the Company's asset retirement liability of $4.8 million consisted of $0.3 million in other accrued liabilities and $4.5 million in other long-term liabilities. As of December 31, 2015, the Company's asset retirement liability of $4.9 million consisted of $0.8 million in other accrued liabilities and $4.1 million in other long-term liabilities.
(8) Long-term Debt
Long-term debt for the Company at December 31, 2016 and 2015 is shown below (in thousands):
December 31, 2016 | December 31, 2015 | ||||||
Term Loan, due 2019 (weighted average rate of 7.50%) | $ | 616,000 | $ | 622,400 | |||
Discount on Term Loan (a) | (7,834 | ) | (11,138 | ) | |||
Debt issuance costs | (3,396 | ) | (4,717 | ) | |||
Notes, 8.75%, due 2019 | 300,000 | 300,000 | |||||
Total long-term debt | 904,770 | 906,545 | |||||
Less: current portion | (6,400 | ) | (6,400 | ) | |||
Total long-term debt, net of current portion | $ | 898,370 | $ | 900,145 | |||
(a) | The $7.8 million and $11.1 million discount on the Term Loan (as defined below) as of December 31, 2016 and 2015, respectively, is being amortized using the effective interest method over the life of the Term Loan. |
As of December 31, 2016, the Company had $61.1 million, net of $13.9 million outstanding letters of credit, available for additional borrowing under the Revolving Facility (as defined below).
The approximate aggregate maturities of long-term debt, excluding the debt discount on the Term Loan, for each of the three years subsequent to December 31, 2016 are as follows (in thousands):
Year ending December 31, | Balance Due | ||
2017 | $ | 6,400 | |
2018 | 6,400 | ||
2019 | 903,200 | ||
Total long-term debt, including current portion | $ | 916,000 | |
75
Refinancing. On February 14, 2013 (the "Refinancing Closing Date"), FairPoint Communications refinanced its old credit agreement (the "Refinancing"). In connection with the Refinancing, FairPoint Communications (i) issued $300.0 million aggregate principal amount of its 8.75% senior secured notes due 2019 (the "Notes") in a private offering exempt from registration under the Securities Act pursuant to an indenture (the "Indenture") that FairPoint Communications entered into on the Refinancing Closing Date with certain of its subsidiaries that guarantee the indebtedness under the Credit Agreement (as defined herein) (the "Subsidiary Guarantors") and U.S. Bank National Association, as trustee and collateral agent, and (ii) entered into a credit agreement (the "Credit Agreement"), dated as of the Refinancing Closing Date, with the lenders party thereto from time to time and Morgan Stanley Senior Funding, Inc., as administrative agent and letter of credit issuer. The Credit Agreement provides for a $75.0 million revolving credit facility (the ''Revolving Facility''), which has a sub-facility providing for the issuance of up to $40.0 million in letters of credit, and a $640.0 million term loan facility (the ''Term Loan'' and, together with the Revolving Facility, the ''Credit Agreement Loans"). On the Refinancing Closing Date, FairPoint Communications used the proceeds of the Notes offering, together with $640.0 million of borrowings under the Term Loan and cash on hand to (i) repay principal of $946.5 million outstanding on the old term loan, plus approximately $7.7 million of accrued interest and (ii) pay approximately $32.6 million of fees, expenses and other costs related to the Refinancing.
The Credit Agreement. The principal amount of the Term Loan and commitments under the Revolving Facility may be increased by an aggregate amount of up to $200.0 million, subject to certain terms and conditions specified in the Credit Agreement. The Term Loan will mature on February 14, 2019 and the Revolving Facility will mature on February 14, 2018, subject in each case to extensions pursuant to the terms of the Credit Agreement.
Interest Rates and Fees. Interest on borrowings under the Credit Agreement Loans accrue at an annual rate equal to either a British Bankers Association London Inter-Bank Offered Rate ("LIBOR") or the base rate, in each case plus an applicable margin. LIBOR is a per annum rate for dollar deposits with an interest period of one, two, three or six months (at FairPoint Communication's election), subject to a minimum LIBOR floor of 1.25% for the Term Loan. The base rate is the per annum rate equal to the greatest of (x) the federal funds effective rate plus 0.50%, (y) the rate of interest publicly quoted from time to time by The Wall Street Journal as the United States ''Prime Rate'' and (z) LIBOR with an interest period of one month plus 1.00%. The applicable margin for the Term Loan is (a) 6.25% per annum with respect to term loans bearing interest based on LIBOR or (b) 5.25% per annum with respect to term loans bearing interest based on the base rate. The applicable interest rate for the Revolving Facility is, initially, (a) 5.50% with respect to revolving loans bearing interest based on LIBOR or (b) 4.50% per annum with respect to revolving loans bearing interest based on the base rate, in each case subject to adjustment based on FairPoint Communication's consolidated total leverage ratio, as defined in the Credit Agreement. FairPoint Communications is required to pay a quarterly letter of credit fee on the average daily amount available to be drawn under letters of credit issued under the Revolving Facility equal to the applicable interest rate for revolving loans bearing interest based on LIBOR, plus a fronting fee of 0.125% per annum on the average daily amount available to be drawn under such letters of credit. In addition, FairPoint Communications is required to pay a quarterly commitment fee on the average daily unused portion of the New Revolving Facility, which is 0.50% initially, subject to reduction to 0.375% based on FairPoint Communication's consolidated total leverage ratio.
Security/Guarantors. All obligations under the Credit Agreement, together with certain designated hedging obligations and cash management obligations, are unconditionally guaranteed on a senior secured basis by certain subsidiaries of FairPoint Communications (the "Subsidiary Guarantors") and secured by a first-priority lien on substantially all personal property of FairPoint Communications and the Subsidiary Guarantors, subject to certain exclusions set forth in the related security documents, pari passu with the lien securing the obligations under the Notes.
Mandatory Repayments. FairPoint Communications is required to make quarterly repayments of the Term Loan in a principal amount of $1.6 million during the term of the Credit Agreement. In addition, mandatory repayments are required under the Credit Agreement with (i) a percentage, initially equal to 50% and subject to reduction to 25% based on FairPoint Communication's consolidated total leverage ratio, of FairPoint Communication's excess cash flow, as defined in the Credit Agreement, (ii) the net cash proceeds of certain asset dispositions, insurance proceeds and condemnation awards and (iii) issuances of debt not permitted to be incurred under the Credit Agreement. No premium is required in connection with prepayments.
Covenants. The Credit Agreement contains customary representations and warranties and affirmative and negative covenants for a transaction of this type, including two financial maintenance covenants: (i) a consolidated interest coverage ratio and (ii) a consolidated total leverage ratio. The Credit Agreement also contains a covenant limiting the amount of capital expenditures that FairPoint Communications and its subsidiaries may make in any fiscal year. As of December 31, 2016, FairPoint Communications was in compliance with all covenants under the Credit Agreement.
Events of Default. The Credit Agreement also contains customary events of default.
The Notes. On the Refinancing Closing Date, FairPoint Communications issued $300.0 million of the Notes pursuant to the Indenture in a private offering exempt from registration under the Securities Act.
76
The terms of the Notes are governed by the Indenture. The Notes are senior secured obligations of FairPoint Communications and are guaranteed by the Subsidiary Guarantors. The Notes and the guarantees thereof are secured by a first-priority lien on substantially all personal property of FairPoint Communications and the Subsidiary Guarantors, subject to certain exclusions set forth in the related security documents, pari passu with the lien securing the obligations under the Credit Agreement. The Notes will mature on August 15, 2019 and accrue interest at a rate of 8.75% per annum, which is payable semi-annually in arrears on February 15 and August 15 of each year.
Notes redeemed after February 15, 2016 and prior to February 15, 2017 may be redeemed at 104.375% of the aggregate principal amount; Notes redeemed on or after February 15, 2017 and prior to February 15, 2018 may be redeemed at 102.188% of the aggregate principal amount; and Notes redeemed on or after February 15, 2018 may be redeemed at their par value.
The holders of the Notes have the ability to require FairPoint Communications to repurchase all or any part of the Notes if FairPoint Communications experiences certain kinds of changes in control or engages in certain asset sales, in each case at the repurchase prices and subject to the terms and conditions set forth in the Indenture.
The Indenture contains certain covenants which are customary with respect to non-investment grade debt securities, including limitations on FairPoint Communication's ability to incur additional indebtedness, pay dividends on or make other distributions or repurchase FairPoint Communication's capital stock, make certain investments, enter into certain types of transactions with affiliates, create liens and sell certain assets or merge with or into other companies. These covenants are subject to a number of important limitations and exceptions. As of December 31, 2016, FairPoint Communications was in compliance with all covenants under the Indenture.
The Indenture also provides for customary events of default, including cross defaults to other specified debt of FairPoint Communications and certain of its subsidiaries.
(9) Interest Rate Swap Agreements
The Company uses interest rate swap agreements to protect the Company against future adverse fluctuations in interest rates by reducing its exposure to variability in cash flows relating to interest payments on a portion of its outstanding debt. The Company's interest rate swaps, which are designated as cash flow hedges, involve the receipt of variable amounts from counterparties in exchange for the Company making fixed-rate payments over the effective term of the agreements without exchange of the underlying notional amount. The Company does not hold or issue any derivative financial instruments for speculative trading purposes.
In the third quarter of 2013, the Company entered into interest rate swap agreements with a combined notional amount of $170.0 million with three counterparties that are effective for a two year period. Such swaps became effective on September 30, 2015 and mature on September 30, 2017. Each respective swap agreement requires the Company to pay a fixed rate of 2.665% and provides that the Company will receive a variable rate based on the three month LIBOR rate subject to a minimum LIBOR floor of 1.25%. Amounts payable by or due to the Company are net settled with the respective counterparties on the last business day of each fiscal quarter.
The effect of the Company’s interest rate swap agreements on the consolidated balance sheets at December 31, 2016 and 2015 is shown below (in thousands):
As of December 31, 2016 | |||||
Derivatives designated as hedging instruments: | Balance Sheet Location | Fair Value | |||
Interest rate swaps, Current | Other accrued liabilities | $ | 1,762 | ||
As of December 31, 2015 | |||||
Derivatives designated as hedging instruments: | Balance Sheet Location | Fair Value | |||
Interest rate swaps, Current | Other accrued liabilities | $ | 2,375 | ||
Interest rate swaps, Long-term | Other long-term liabilities | $ | 1,232 | ||
The gross effect of the Company’s interest rate swap agreements on the consolidated statements of comprehensive income/(loss) for the years ended December 31, 2016, 2015 and 2014 is shown below (in thousands):
77
Amount Recognized in Interest Expense (Pre-Tax) | Amount of Loss/(Gain) Recognized in Other Comprehensive Income on Derivative (Effective Portion) (Pre-Tax) | |||||||||||||||||
Year Ended December 31, 2016 | Year Ended December 31, 2015 | Year Ended December 31, 2014 | Year Ended December 31, 2016 | Year Ended December 31, 2015 | Year Ended December 31, 2014 | |||||||||||||
Interest rate swaps | $ | 2,446 | $ | — | $ | — | $ | (1,845 | ) | $ | 865 | $ | 1,737 | |||||
Amounts reported in accumulated other comprehensive income related to interest rate swaps will be reclassified to interest expense as interest payments are made on the Term Loan. The Company estimates that approximately $1.8 million will be reclassified as an increase to interest expense in the next 12 months.
Each interest rate swap agreement contains a provision whereby if the Company defaults on any of its indebtedness, the Company may also be declared in default under the interest rate swap agreements.
(10) Fair Value
In determining fair value, the Company uses a hierarchy for inputs used in measuring fair value that maximizes the use of observable inputs and minimizes the use of unobservable inputs by requiring that the most observable inputs be used when available. The hierarchy is broken down into three levels based on the reliability of inputs as follows:
Level 1 - | Valuations based on quoted prices in active markets for identical assets or liabilities that the Company has the ability to access. |
Level 2 - | Valuations based on quoted prices for similar instruments in active markets or quoted prices in markets that are not active or for which all significant inputs are observable, either directly or indirectly. |
Level 3 - | Valuations based on inputs that are unobservable and significant to the overall fair value measurement. |
The Company's non-financial assets and liabilities, including its long-lived assets and indefinite-lived intangible assets, are measured and subsequently adjusted, if necessary, to fair value on a non-recurring basis. The Company periodically performs routine reviews of triggering events and/or an impairment test, as applicable. Based on these procedures, the Company did not require an adjustment to fair value to be recorded to these assets in 2016 or 2015.
The Company's financial instruments, other than interest rate swap agreements and long-term debt, consist primarily of cash, restricted cash, accounts receivable and accounts payable. The carrying amounts of these financial instruments are estimated to approximate fair value due to the relatively short period of time to maturity for these instruments. As of December 31, 2016, interest rate swap agreements are carried at their fair value and measured on a recurring basis as follows (in thousands):
Fair Value Measurements Using | |||||||||||
Level 1 | Level 2 | Level 3 | |||||||||
Interest rate swaps, Current (a) | $ | — | $ | 1,762 | $ | — | |||||
As of December 31, 2015, interest rate swap agreements are carried at their fair value and measured on a recurring basis as follows (in thousands):
Fair Value Measurements Using | |||||||||||
Level 1 | Level 2 | Level 3 | |||||||||
Interest rate swaps, Current (a) | $ | — | $ | 2,375 | $ | — | |||||
Interest rate swaps, Long-term (a) | $ | — | $ | 1,232 | $ | — | |||||
(a) | The fair value is determined using valuation models which rely on the expected LIBOR based yield curve and estimates of counterparty and the Company’s non-performance risk. Because each of these inputs are directly observable or can be corroborated by observable market data, the Company has categorized these interest rate swaps as Level 2 within the fair value hierarchy. |
The estimated fair values of the Company's long-term debt as of December 31, 2016 and 2015 are as follows (in thousands):
78
December 31, 2016 | December 31, 2015 | ||||||||||||||
Carrying Amount | Fair Value (a) | Carrying Amount | Fair Value (a) | ||||||||||||
Term Loan, due 2019 (b) | $ | 608,166 | $ | 620,620 | $ | 611,262 | $ | 616,954 | |||||||
Notes, 8.75%, due 2019 | 300,000 | 312,375 | 300,000 | 295,500 | |||||||||||
Total | $ | 908,166 | $ | 932,995 | $ | 911,262 | $ | 912,454 | |||||||
(a) | The Company estimated fair value based on market prices of the Company's debt securities at the balance sheet dates, which falls within Level 2 of the fair value hierarchy. |
(b) | The carrying amount of the Term Loan is net of the unamortized discount of $7.8 million and $11.1 million as of December 31, 2016 and 2015, respectively. |
For a discussion of the fair value measurement of the Company's pension plan assets, see note (11) "Employee Benefit Plans—Plan Assets, Obligations and Funded Status—Qualified Pension Plan Assets".
(11) Employee Benefit Plans
The Company sponsors noncontributory qualified defined benefit pension plans ("qualified pension plans") and post-employment benefit plans which provide certain cash payments and medical, dental and life insurance benefits to eligible retired employees and their beneficiaries and covered dependents. The qualified pension plans and certain post-employment benefit plans were created as part of the acquisition of the Northern New England operations from Verizon and mirrored the prior Verizon plans.
The qualified pension plan available to represented employees was closed to new participants and benefits under the prior formula were frozen as of October 14, 2014. For existing participants, future benefit accruals for service on and after February 22, 2015 are at 50% of prior rates and are capped at 30 years of total credited service. The qualified pension plan available to non-represented employees remains frozen.
The post-employment benefit plan provides medical, dental and life insurance benefits to eligible non-represented employees and former represented employees and, in some instances, to their spouses and families. Effective August 28, 2014, active represented employees are no longer eligible for this post-employment benefit plan. Upon ratification of the collective bargaining agreements on February 22, 2015 and for 30 months thereafter, active represented employees who retire and meet the eligibility requirements and their spouses are eligible to receive certain monthly reimbursements of medical insurance premiums until the retired employee reaches age 65 or dies, at which time the benefit will cease for the spouse as well.
The Company makes contributions to the qualified pension plans to meet minimum funding requirements under the Employee Retirement Income Security Act of 1974, as amended ("ERISA"), and has the ability to elect to make additional discretionary contributions. The other post-employment benefit plans are unfunded and the Company funds the benefits that are paid. Annually, and as necessary, the Company remeasures the net liabilities of its qualified pension and other post-employment benefit plans.
79
Plan Assets, Obligations and Funded Status
A summary of plan assets, projected benefit obligation and funded status of the plans are as follows for the years ended December 31, 2016 and 2015 (in thousands):
Qualified Pension Plans | |||||||
Year Ended December 31, 2016 | Year Ended December 31, 2015 | ||||||
Fair value of plan assets: | |||||||
Beginning fair value of plan assets | $ | 197,062 | $ | 195,410 | |||
Actual return on plan assets | 15,745 | (3,677 | ) | ||||
Plan settlements | (2,510 | ) | (4,472 | ) | |||
Employer contributions | 16,501 | 14,980 | |||||
Benefits paid | (3,898 | ) | (5,179 | ) | |||
Ending fair value of plan assets | 222,900 | 197,062 | |||||
Projected benefit obligation: | |||||||
Beginning projected benefit obligation | $ | 347,624 | $ | 408,216 | |||
Service cost | 6,880 | 8,391 | |||||
Interest cost | 15,079 | 14,879 | |||||
Plan amendment (a) | — | (40,049 | ) | ||||
Plan settlements | (2,510 | ) | (4,472 | ) | |||
Plan curtailment | — | (2,426 | ) | ||||
Benefits paid | (3,898 | ) | (5,179 | ) | |||
Actuarial loss | (6,358 | ) | (31,736 | ) | |||
Ending projected benefit obligation | 356,817 | 347,624 | |||||
Funded status | $ | (133,917 | ) | $ | (150,562 | ) | |
Accumulated benefit obligation | $ | 356,807 | $ | 347,619 | |||
Net amount recognized in long-term liabilities in the consolidated balance sheets | $ | (133,917 | ) | $ | (150,562 | ) | |
Amounts recognized in accumulated other comprehensive income: | |||||||
Prior service credit | $ | 29,867 | $ | 32,909 | |||
Net actuarial loss | (93,953 | ) | (106,704 | ) | |||
Net amount recognized in accumulated other comprehensive income | $ | (64,086 | ) | $ | (73,795 | ) | |
(a) | In the first quarter of 2015, the Company recognized a prior service credit for a negative plan amendment at remeasurement of the represented employees pension plan related to the elimination of prospective future increase in pension bands that were reduced under the terms of the collective bargaining agreements. |
80
Post-employment Benefit Plans | |||||||
Year Ended December 31, 2016 | Year Ended December 31, 2015 | ||||||
Fair value of plan assets: | |||||||
Beginning fair value of plan assets | $ | — | $ | — | |||
Employer contributions | 5,715 | 5,597 | |||||
Benefits paid | (5,715 | ) | (5,597 | ) | |||
Ending fair value of plan assets | — | — | |||||
Projected benefit obligation: | |||||||
Beginning projected benefit obligation | $ | 100,154 | $ | 741,372 | |||
Service cost | 121 | 4,541 | |||||
Interest cost | 3,927 | 7,688 | |||||
Plan amendments (a) | — | (609,619 | ) | ||||
Plan curtailment | — | (5,409 | ) | ||||
Benefits paid | (5,715 | ) | (5,597 | ) | |||
Actuarial loss | (3,720 | ) | (32,822 | ) | |||
Ending projected benefit obligation | 94,767 | 100,154 | |||||
Funded status | $ | (94,767 | ) | $ | (100,154 | ) | |
Amounts recognized in the consolidated balance sheets: | |||||||
Current liabilities | $ | (7,138 | ) | $ | (6,112 | ) | |
Long-term liabilities | (87,629 | ) | (94,042 | ) | |||
Net amount recognized in the consolidated balance sheets | $ | (94,767 | ) | $ | (100,154 | ) | |
Amounts recognized in accumulated other comprehensive income: | |||||||
Net prior service credit | $ | 41,690 | $ | 350,322 | |||
Net actuarial loss | $ | (16,508 | ) | $ | (102,085 | ) | |
Net amount recognized in accumulated other comprehensive income | $ | 25,182 | $ | 248,237 | |||
(a) | In the first quarter of 2015, the Company recognized a net prior service credit for a negative plan amendment at remeasurement of the post-employment benefit plan for represented employees primarily related to the elimination of the post-employment benefits for active represented employees under the terms of the collective bargaining agreements. |
Qualified Pension Plan Assets. The investment objective for the qualified pension plan assets is to achieve a rate of return sufficient to match or exceed the long-term growth rate of the plan liability, using investment vehicles that are consistent with the duration of each plan's liability. The investment objective also targets minimizing the risk of loss of principal. The Company's strategy emphasizes a long-term equity orientation, global diversification and financial and operating risk controls. Both active and passive management investment approaches are employed depending on perceived market efficiencies and various other factors. Diversification targets of 65% equity securities and 35% fixed income securities for the represented employees plan seeks to minimize the concentration of market risk. For the qualified pension plan for the non-represented employees, the diversification target is 45% equity securities and 55% fixed income securities and is invested using primarily a liability driven investment strategy. The asset allocation at December 31, 2016 for the Company's qualified pension plan assets was as follows:
Non-Represented Employees Plan | Represented Employees Plan | Total Qualified Pension Plans | ||||||
Cash and cash equivalents (a) | 3.5 | % | 5.4 | % | 5.2 | % | ||
Equity securities | 42.0 | % | 60.3 | % | 58.3 | % | ||
Fixed income securities | 54.5 | % | 34.3 | % | 36.5 | % | ||
Plan asset portfolio allocation at December 31, 2016 | 100.0 | % | 100.0 | % | 100.0 | % | ||
81
(a) | Cash and cash equivalents at December 31, 2016 include amounts pending settlement from the purchase or sale of equity or fixed income securities. |
The fair values for the qualified pension plan assets by asset category at December 31, 2016 are as follows (in thousands):
Total | Level 1 | Level 2 | Level 3 | ||||||||||||
Cash and cash equivalents | $ | 11,619 | $ | 11,619 | $ | — | $ | — | |||||||
Equity securities | 129,937 | 129,937 | — | — | |||||||||||
Fixed income securities | 81,344 | 53,206 | 28,138 | — | |||||||||||
Fair value of plan assets at December 31, 2016 | $ | 222,900 | $ | 194,762 | $ | 28,138 | $ | — | |||||||
The fair values for the qualified pension plan assets by asset category at December 31, 2015 were as follows (in thousands):
Total | Level 1 | Level 2 | Level 3 | ||||||||||||
Cash and cash equivalents | $ | 1,223 | $ | 1,223 | $ | — | $ | — | |||||||
Equity securities | 138,684 | 79,512 | 59,172 | — | |||||||||||
Fixed income securities | 57,155 | 30,856 | 26,299 | — | |||||||||||
Fair value of plan assets at December 31, 2015 | $ | 197,062 | $ | 111,591 | $ | 85,471 | $ | — | |||||||
Cash and cash equivalents include short-term investment funds, primarily in diversified portfolios of investment grade money market instruments and are valued using quoted market prices, and thus classified within Level 1 of the fair value hierarchy, as outlined in note (10) "Fair Value".
Equity securities include direct holdings of equity securities and units held in mutual funds that invest in equity securities of domestic and international corporations in a variety of industry sectors. The direct holdings and units held in publicly traded mutual funds are valued using quoted market prices and are classified within Level 1 of the fair value hierarchy. Fair values for units held in mutual funds that invest in equity securities that are not publicly traded are based on observable prices and are classified within Level 2 of the fair value hierarchy. The fair values of hedged equity funds are estimated using net asset value per share of the investments. The Company has the ability to redeem these investments at net asset value on a limited basis and thus has classified hedged equity funds within Level 3 of the fair value hierarchy. The Company liquidated its positions in all its hedged equity funds per the terms of its investment agreements with such hedge equity funds in 2015.
Fixed income securities are investments in corporate bonds, treasury securities, other debt instruments and mutual funds that invest in these instruments. These securities are expected to provide significant diversification benefits, in terms of asset volatility and pension funding volatility, in the portfolio and a stable source of income. Units held in corporate bonds, treasury securities and publicly traded mutual funds that invest in fixed income securities are valued using quoted market prices and are classified within Level 1 of the fair value hierarchy. Fair values of mutual funds that invest in fixed income securities that are not publicly traded are based on observable prices and are classified within Level 2 of the fair value hierarchy.
A reconciliation of the beginning and ending balance of plan assets that are measured at fair value using significant unobservable inputs (Level 3) for the year ended December 31, 2015 is as follows (in thousands):
Hedged Equity Funds | |||
Balance at December 31, 2014 | $ | 351 | |
Purchases, sales and settlements, net | (351 | ) | |
Balance at December 31, 2015 | $ | — | |
82
Net Periodic Benefit Cost. The Company capitalizes a portion of net periodic benefit cost in conjunction with its use of internal labor resources utilized on capital projects. During the years ended December 31, 2016, 2015 and 2014, the Company recognized settlement charges in the qualified pension plan that covers non-represented employees. The settlements were incurred when the cumulative amount of lump sums paid to participants in the respective years exceeded the expected service and interest cost for the respective years. Components of the net periodic benefit cost related to the Company's qualified pension plans and other post-employment benefit plans for the years ended December 31, 2016, 2015 and 2014 are as follows (in thousands):
Qualified Pension Plans | ||||||||||||
Year Ended December 31, 2016 | Year Ended December 31, 2015 | Year Ended December 31, 2014 | ||||||||||
Service cost | $ | 6,880 | $ | 8,391 | $ | 14,760 | ||||||
Interest cost | 15,079 | 14,879 | 15,367 | |||||||||
Expected return on plan assets | (15,363 | ) | (14,635 | ) | (13,525 | ) | ||||||
Amortization of prior service credit | (3,042 | ) | (2,933 | ) | — | |||||||
Amortization of actuarial loss | 5,383 | 6,718 | 2,054 | |||||||||
Plan curtailment (a) | — | (4,207 | ) | — | ||||||||
Plan settlement | 629 | 1,022 | 671 | |||||||||
Net periodic benefit cost | 9,566 | 9,235 | 19,327 | |||||||||
Less capitalized portion | (599 | ) | (600 | ) | (1,184 | ) | ||||||
Other post-employment benefit and pension (benefit)/expense | $ | 8,967 | $ | 8,635 | $ | 18,143 | ||||||
(a) | The Company recognized a curtailment gain as the result of a workforce reduction in July 2015. |
Post-employment Benefit Plans | ||||||||||||
Year Ended December 31, 2016 | Year Ended December 31, 2015 | Year Ended December 31, 2014 | ||||||||||
Service cost | $ | 121 | $ | 4,541 | $ | 24,969 | ||||||
Interest cost | 3,927 | 7,688 | 29,908 | |||||||||
Amortization of prior service credit | (308,632 | ) | (304,626 | ) | (948 | ) | ||||||
Amortization of actuarial loss | 81,857 | 113,424 | 6,654 | |||||||||
Net periodic benefit cost | (222,727 | ) | (178,973 | ) | 60,583 | |||||||
Less capitalized portion | — | — | (3,444 | ) | ||||||||
Other post-employment benefit and pension (benefit)/expense | $ | (222,727 | ) | $ | (178,973 | ) | $ | 57,139 | ||||
83
Other Comprehensive Income. Other pre-tax changes in plan assets and benefit obligations recognized in other comprehensive income are as follows for the years ended December 31, 2016, 2015 and 2014, respectively, (in thousands):
Qualified Pension Plans | ||||||||||||
Year Ended December 31, 2016 | Year Ended December 31, 2015 | Year Ended December 31, 2014 | ||||||||||
Amounts recognized in other comprehensive income: | ||||||||||||
Prior service credit | $ | — | $ | (40,049 | ) | $ | — | |||||
Net (gain)/loss arising during the period | (6,739 | ) | (13,424 | ) | 72,670 | |||||||
Amortization of prior service credit | 3,042 | 2,933 | — | |||||||||
Amortization of net actuarial loss | (5,383 | ) | (6,718 | ) | (2,725 | ) | ||||||
Plan curtailment | — | 1,781 | — | |||||||||
Plan settlement | (629 | ) | (1,022 | ) | — | |||||||
Total amount recognized in other comprehensive income | $ | (9,709 | ) | $ | (56,499 | ) | $ | 69,945 | ||||
Estimated amounts that will be amortized from accumulated other comprehensive income in the next fiscal year: | ||||||||||||
Prior service credit | $ | 3,042 | ||||||||||
Net actuarial loss | (4,772 | ) | ||||||||||
Total amount estimated to be amortized from accumulated other comprehensive income in the next fiscal year | $ | (1,730 | ) | |||||||||
Post-employment Benefit Plans | ||||||||||||
Year Ended December 31, 2016 | Year Ended December 31, 2015 | Year Ended December 31, 2014 | ||||||||||
Amounts recognized in other comprehensive income: | ||||||||||||
Prior service credit | $ | — | $ | (619,454 | ) | $ | (46,277 | ) | ||||
Prior service cost | — | 9,835 | — | |||||||||
Plan curtailment | — | (5,409 | ) | — | ||||||||
Net (gain)/loss arising during the period | (3,720 | ) | (32,822 | ) | 148,434 | |||||||
Amortization of prior service credit | 308,632 | 304,626 | 948 | |||||||||
Amortization of net actuarial loss | (81,857 | ) | (113,424 | ) | (6,654 | ) | ||||||
Total amount recognized in other comprehensive income | $ | 223,055 | $ | (456,648 | ) | $ | 96,451 | |||||
Estimated amounts that will be amortized from accumulated other comprehensive income in the next fiscal year: | ||||||||||||
Net prior service credit | $ | 1,819 | ||||||||||
Net actuarial loss | (1,083 | ) | ||||||||||
Total amount estimated to be amortized from accumulated other comprehensive income in the next fiscal year | $ | 736 | ||||||||||
Assumptions
The determination of the net liability and the net periodic benefit cost recognized for the qualified pension plans and post-employment benefit plans by the Company are, in part, based on assumptions made by management. These assumptions include, among others, the discount rate applied to estimated future cash flows of the plans, the expected return on assets held by the qualified pension plans, certain demographic characteristics of the participants, such as expected retirement and mortality rates, and future inflation in healthcare costs. The Company also has an assumption regarding increases in the amount of post-employment benefit plans expenditures to be paid by the Company, based upon the past practice of such increases being provided to participants. These assumptions are reviewed at least annually for changes with the Company's independent actuaries.
84
Projected Benefit Obligation Assumptions. The weighted average assumptions used in determining projected benefit obligations are as follows:
December 31, 2016 | December 31, 2015 | ||||
Qualified Pension Plans: | |||||
Discount rate | 4.49 | % | 4.44 | % | |
Rate of compensation increase (a) | 3.00 | % | 3.00 | % | |
Post-employment Benefit Plans: | |||||
Discount rate | 4.20 | % | 4.15 | % | |
Rate of compensation increase (a) | N/A | N/A | |||
(a) | The rate of future increases in compensation assumption only applies to the plans for represented employees as plans for non-represented employees are frozen. |
Net Periodic Benefit Cost Assumptions. The weighted average assumptions used in determining net periodic cost are as follows:
Years Ended December 31, | ||||||||
2016 | 2015 | 2014 | ||||||
Qualified Pension Plans: | ||||||||
Discount rate | 4.48 | % | 4.39 | % | 4.92 | % | ||
Expected return on plan assets (a) | 7.34 | % | 7.31 | % | 7.66 | % | ||
Rate of compensation increase (b) | 3.00 | % | 3.00 | % | 3.00 | % | ||
Post-employment Benefit Plans: | ||||||||
Discount rate | 4.18 | % | 3.54 | % | 4.98 | % | ||
Rate of compensation increase (b) | N/A | N/A | 4.00 | % | ||||
Healthcare cost trend rate (c) | 7.40 | % | 7.70 | % | 7.90 | % | ||
Rate that the cost trend rates ultimately declines to | 4.50 | % | 4.50 | % | 4.50 | % | ||
Year that the rates reach the terminal rate | 2037 | 2030 | 2030 | |||||
(a) | The expected return on plan assets is the long-term rate-of-return the Company expects to earn on the plan assets. In developing the expected return on plan asset assumption, the Company evaluated historical investment performance, the plans' asset allocation strategies and return forecasts for each asset class and input from its advisors. Projected returns by such advisors were based on broad equity and fixed income indices. The expected return on plan assets is reviewed annually in conjunction with other plan assumptions and, if considered necessary, revised to reflect changes in the financial markets and the investment strategy. The investment strategy and target allocations of the qualified pension plans previously disclosed in "—Plan Assets, Obligations and Funded Status—Qualified Pension Plan Assets" herein were utilized. |
(b) | The rate of future increases in compensation assumption only applies to the plans for represented employees as plans for non-represented employees are frozen. |
(c) | The rate of healthcare cost trend assumption for 2016 and 2015 applies to the other post-employment benefit plan for management and existing represented retirees. |
Post-employment Benefit Plans Sensitivity. A 1% change in the medical trend rate assumed for post-employment benefits at December 31, 2016 would have the following effects (in thousands):
Increase (Decrease) | |||
1% increase in the medical trend rate: | |||
Effect on total service cost and interest cost components | $ | 420 | |
Effect on benefit obligation | $ | 10,122 | |
1% decrease in the medical trend rate: | |||
Effect on total service cost and interest cost components | $ | (349 | ) |
Effect on benefit obligation | $ | (8,423 | ) |
85
Estimated Future Contributions and Benefit Payments
Legislation enacted in 2014 changed the method in determining the discount rate used for calculating a qualified pension plan’s unfunded liability. This act contained a pension funding stabilization provision which allows pension plan sponsors to use higher interest rate assumptions when determining funded status and funding obligations. As a result, the Company's 2016 and 2015 minimum required pension plan contributions are significantly lower than it would have been in the absence of this stabilization provision.
Estimated future employer contributions and benefit payments as of December 31, 2016 are as follows (in thousands):
Qualified Pension Plans | Post-employment Benefit Plans | ||||||
Expected employer contributions for fiscal year 2017 | $ | 18,431 | $ | 7,138 | |||
Expected benefit payments for fiscal years: | |||||||
2017 | $ | 8,558 | $ | 7,138 | |||
2018 | 9,919 | 6,686 | |||||
2019 | 11,473 | 6,637 | |||||
2020 | 11,846 | 6,455 | |||||
2021 | 13,135 | 6,267 | |||||
2022-2026 | 84,859 | 27,230 | |||||
401(k) Savings Plans
As of December 31, 2016, the Company and its subsidiaries sponsor a voluntary 401(k) savings plans that cover all eligible Telecom Group employees and northern New England management employees, and a voluntary 401(k) savings plan that covers all eligible northern New England represented employees (collectively, "the 401(k) Plans"). Each 401(k) Plan year, the Company contributes an amount of matching contributions to the 401(k) Plans determined by the Company at its discretion for management employees and based on collective bargaining agreements for all other employees. For the 401(k) Plan years ended December 31, 2016, 2015 and 2014, the Company generally matched 100% of each employee's contribution up to 5% of compensation. Total Company contributions to all 401(k) Plans were $8.9 million, $8.8 million and $9.5 million for the years ended December 31, 2016, 2015 and 2014, respectively.
(12) Income Taxes
Income Tax (Expense)/Benefit
Income tax (expense)/benefit for the years ended December 31, 2016, 2015, 2014, respectively, consists of the following components (in thousands):
Years Ended December 31, | |||||||||||
2016 | 2015 | 2014 | |||||||||
Current: | |||||||||||
Federal | $ | — | $ | — | $ | — | |||||
State and local | (240 | ) | (203 | ) | (86 | ) | |||||
Total current income tax expense | (240 | ) | (203 | ) | (86 | ) | |||||
Deferred: | |||||||||||
Federal | (35,179 | ) | (1,501 | ) | 25,081 | ||||||
State and local | (7,430 | ) | 2,761 | 4,783 | |||||||
Total deferred income tax (expense)/benefit | (42,609 | ) | 1,260 | 29,864 | |||||||
Total income tax (expense)/benefit | $ | (42,849 | ) | $ | 1,057 | $ | 29,778 | ||||
For the year ended December 31, 2016, the tax expense on $146.9 million of pre-tax net income equates to an effective tax rate of 29.2%. The rate differs from the 35% federal statutory rate primarily due to a tax benefit associated with a decrease in the valuation allowance offset by a tax expense related to state taxes.
86
For the year ended December 31, 2015, the tax benefit on $89.4 million of pre-tax net income equates to an effective tax rate of (1.2)%. The rate differs from the 35% federal statutory rate primarily due to a tax benefit associated with a decrease in the valuation allowance as well as a tax benefit related to state taxes.
For the year ended December 31, 2014, the tax benefit on $166.1 million of pre-tax loss equates to an effective tax rate of 17.9%. The rate differs from the 35% federal statutory rate primarily due to tax expense associated with an increase in the valuation allowance offset by a tax benefit related to state taxes.
A reconciliation of the Company's statutory tax rate to its effective tax rate is presented below (in percentages):
Years Ended December 31, | ||||||||
2016 | 2015 | 2014 | ||||||
Statutory federal income tax/(benefit) rate(1) | 35.0 | % | 35.0 | % | (35.0 | )% | ||
State income tax benefit, net of federal income tax | 3.3 | (1.9 | ) | (2.1 | ) | |||
Other, net | 0.7 | 0.2 | 0.3 | |||||
Valuation allowance (benefit)/expense | (9.8 | ) | (34.5 | ) | 18.9 | |||
Effective income tax rate | 29.2 | % | (1.2 | )% | (17.9 | )% | ||
(1) The statutory federal income tax is an expense in 2016 and 2015 due to pre-tax net income for those years and the statutory federal income tax is a benefit in 2014 due to pre-tax net losses for the year ended December 31, 2014.
The effective tax rate reflected in accumulated other comprehensive income for the year ended December 31, 2016 is 23.2%. This effective tax rate is due to a tax benefit on other net comprehensive loss partially offset by tax expense associated with an increase in the valuation allowance.
Deferred Income Taxes
The tax effects of temporary differences that give rise to significant portions of the deferred tax assets and deferred tax liabilities as of December 31, 2016 and 2015 are presented below (in thousands):
December 31, 2016 | December 31, 2015 | ||||||
Deferred tax assets: | |||||||
Federal and state tax loss carryforwards | $ | 106,928 | $ | 103,981 | |||
Employee benefits | 107,152 | 115,531 | |||||
Allowance for doubtful accounts | 1,454 | 3,342 | |||||
Alternative minimum tax and other state credits | 4,299 | 5,094 | |||||
Capitalized restructuring costs | 2,326 | 2,739 | |||||
Deferred revenue | 3,636 | 4,414 | |||||
Other, net | 4,673 | 8,059 | |||||
Total gross deferred tax assets | 230,468 | 243,160 | |||||
Deferred tax liabilities: | |||||||
Property, plant, and equipment | 183,575 | 212,906 | |||||
Goodwill and other intangible assets | 26,184 | 29,588 | |||||
Other, net | 7,274 | 10,613 | |||||
Total gross deferred tax liabilities | 217,033 | 253,107 | |||||
Net deferred tax assets (liabilities) before valuation allowance | 13,435 | (9,947 | ) | ||||
Valuation allowance | (41,451 | ) | (25,128 | ) | |||
Net deferred tax liabilities | $ | (28,016 | ) | $ | (35,075 | ) | |
At December 31, 2016, the Company had gross federal NOL carryforwards of $285.0 million. The Company's remaining federal NOL carryforwards will expire from 2019 to 2036. At December 31, 2016, the Company had a net, after attribute reduction, state NOL deferred tax asset of $11.6 million. The Company's remaining state NOL carryforwards will expire from 2017 to 2036. The amount that expired in 2016 was negligible. At December 31, 2016, the Company had a negligible alternative minimum tax credit carryover and had $4.3 million in state credit carryovers. Telecom Group completed an initial public offering on February 8, 2005, which resulted in an "ownership change" within the meaning of the United States of America federal income tax laws addressing NOL carryforwards, alternative minimum tax credits and other similar tax attributes. The Spinco Merger and the
87
Company's emergence from Chapter 11 protection also resulted in ownership changes. As a result of these ownership changes, there are specific limitations on the Company's ability to use its NOL carryforwards and other tax attributes. The Company believes it can use the NOLs even with these restrictions in place.
Valuation Allowance. At December 31, 2016 and 2015, the Company established a valuation allowance against its deferred tax assets of $41.5 million and $25.1 million, respectively, which consists of a $29.2 million and $14.7 million federal allowance, respectively, and a $12.3 million and $10.4 million state allowance, respectively. During 2016, an increase in the Company's valuation allowance of $35.5 million was allocated to accumulated other comprehensive income in the consolidated balance sheet. During 2015, a decrease in the Company's valuation allowance of $195.5 million was allocated to accumulated other comprehensive income in the consolidated balance sheet. During 2014, an increase in the Company's valuation allowance of $58.3 million was allocated to accumulated other comprehensive income in the consolidated balance sheet.
The following is activity in the Company's valuation allowance for the years ended December 31, 2016, 2015 and 2014, respectively (in thousands):
Years Ended December 31, | |||||||||||
2016 | 2015 | 2014 | |||||||||
Balance, beginning of period | $ | (25,128 | ) | $ | (259,857 | ) | $ | (166,773 | ) | ||
(Increase) decrease allocated to other comprehensive income | (35,511 | ) | 195,540 | (58,254 | ) | ||||||
(Increase) decrease allocated to continuing operations | 19,188 | 39,189 | (34,830 | ) | |||||||
Balance, end of period | $ | (41,451 | ) | $ | (25,128 | ) | $ | (259,857 | ) | ||
Unrecognized Tax Benefits. As of December 31, 2016, the Company's total unrecognized tax benefits were $4.0 million, which were recorded as a reduction of the Company's federal and state NOL carryforwards. The total unrecognized tax benefits that, if recognized, would affect the effective tax rate were $3.8 million. The Company does not expect a significant increase or decrease in its unrecognized tax benefits during the next twelve months. A reconciliation of the beginning and ending amount of unrecognized tax benefits is as follows (in thousands):
Balance as of December 31, 2014 | $ | 4,035 | |
Additions for tax positions of prior years | 12 | ||
Balance as of December 31, 2015 | $ | 4,047 | |
Additions for tax positions of prior years | — | ||
Balance as of December 31, 2016 | $ | 4,047 | |
The Company recognizes any interest and penalties accrued related to unrecognized tax benefits in income tax expense. During the year ended December 31, 2014, the Company made payments of interest and penalties in the amount of $0.1 million. During the years ended December 31, 2016 and December 31, 2015, the Company did not make any payments of interest and penalties. There was nothing accrued in the consolidated balance sheets for the payment of interest and penalties at December 31, 2016 and 2015, respectively, as the remaining unrecognized tax benefits would only serve to reduce the Company's current federal and state NOL carryforwards, if ultimately recognized.
Income Tax Returns
The Company and its eligible subsidiaries file consolidated income tax returns in the United States of America federal jurisdiction and certain consolidated, combined and separate entity tax returns, as required, with various state and local governments. Based solely on statutes of limitations, the Company would not be subject to United States of America federal, state and local, or non-United States of America income tax examinations by tax authorities for years prior to 2012. However, tax years prior to 2012 may be subject to examination by federal or state taxing authorities if the Company's NOL carryovers from those years are utilized in the future. As of December 31, 2016 and 2015, the Company does not have any significant jurisdictional tax audits.
88
(13) Accumulated Other Comprehensive Income
Components of accumulated other comprehensive income, net of income tax, were as follows (in thousands):
December 31, 2016 | December 31, 2015 | ||||||
Accumulated other comprehensive income, net of taxes: | |||||||
Fair value of interest rate swaps | $ | (1,054 | ) | $ | (2,160 | ) | |
Qualified pension and other post-employment benefit plans | 22,590 | 186,152 | |||||
Total accumulated other comprehensive income, net of taxes | $ | 21,536 | $ | 183,992 | |||
Other comprehensive income for the years ended December 31, 2016 and 2015, respectively, includes changes in the fair value of the Company's cash flow hedges, actuarial losses and prior service credits related to the qualified pension and other post-employment benefit plans arising during the respective periods and amortization of these actuarial losses and prior service credits. For further detail of amounts recognized in other comprehensive income related to the cash flow hedges, see note (9) "Interest Rate Swap Agreements" herein. For further detail of amounts recognized in other comprehensive income related to the qualified pension and other post-employment benefit plans, see note (11) "Employee Benefit Plans—Plan Assets, Obligations and Funded Status—Other Comprehensive Income" herein.
The following table provides a reconciliation of adjustments reclassified from accumulated other comprehensive income to the consolidated statement of operations (in thousands):
Year Ended December 31, 2016 | ||||
Employee benefits: | ||||
Amortization of actuarial loss (.65 years to 11.47 years) (a) | $ | 87,240 | ||
Amortization of net prior service credit (.87 years to 23.91 years) (a) | (311,674 | ) | ||
Plan settlement (a) | 629 | |||
Total employee benefits reclassified from accumulated other comprehensive income | (223,805 | ) | ||
Tax benefit (b) | 52,214 | |||
Total employee benefits reclassified from accumulated other comprehensive income, net | $ | (171,591 | ) | |
Interest rate swaps: | ||||
Interest rate swaps reclassified from accumulated other comprehensive income (c) | $ | 2,446 | ||
Tax expense (b) | $ | (979 | ) | |
Total interest rate swaps reclassified from accumulated other comprehensive income, net | $ | 1,467 | ||
Total amounts reclassified from accumulated other comprehensive income, net | $ | (170,124 | ) | |
(a) These accumulated other comprehensive income components are included in the computation of net periodic benefit cost. See note (11) "Employee Benefit Plans" for details.
(b) See note (12) "Income Taxes" for details.
(c) These accumulated other comprehensive income components are included in interest expense. See note (9) "Interest Rate Swap Agreements" for details.
(14) Earnings Per Share
Basic earnings per share of the Company is computed by dividing net income/(loss) by the weighted average number of shares of common stock outstanding for the period. Except when the effect would be anti-dilutive, the diluted earnings per share calculation using the treasury stock method includes the impact of stock units, shares of non-vested restricted stock and shares that could be issued under outstanding stock options.
Weighted average number of common shares used for basic earnings per share excludes weighted average shares of non-vested restricted stock of 199,222, 232,274 and 235,462 for the years ended December 31, 2016, 2015 and 2014, respectively. Non-vested restricted stock is included in common shares issued and outstanding in the consolidated balance sheets.
89
Potentially dilutive shares exclude warrants and stock options in accordance with the treasury stock method primarily due to exercise prices exceeding the average market value. Since the Company incurred a loss for the year ended December 31, 2014, all potentially dilutive securities are anti-dilutive and, therefore, are excluded from the determination of diluted earnings per share.
The following table provides a reconciliation of the common shares used for basic earnings per share and diluted earnings per share:
Years Ended December 31, | |||||||||
2016 | 2015 | 2014 | |||||||
Weighted average number of common shares used for basic earnings per share | 26,854,396 | 26,652,240 | 26,449,408 | ||||||
Effect of potential dilutive shares | 265,041 | 320,639 | — | ||||||
Weighted average number of common shares and potential dilutive shares used for diluted earnings per share | 27,119,437 | 26,972,879 | 26,449,408 | ||||||
Weighted average number of anti-dilutive shares outstanding at period-end that are excluded from the above reconciliation | 3,916,342 | 4,141,096 | 4,463,364 | ||||||
(15) Stockholders' Deficit
At December 31, 2016, 37,500,000 shares of common stock were authorized and 27,074,398 shares of common stock (including shares of non-vested restricted stock) and 3,582,402 warrants, each eligible to purchase one share of common stock, were outstanding.
The initial exercise price applicable to the warrants is $48.81 per share of common stock. The exercise price applicable to the warrants is subject to adjustment upon the occurrence of certain events described in the warrant agreement. The warrants may be exercised at any time on or before January 24, 2018.
(16) Stock-Based Compensation
Stock-based compensation expense recognized in the financial statements is as follows (in thousands):
Years Ended December 31, | |||||||||||
2016 | 2015 | 2014 | |||||||||
Amounts charged against income, before income tax benefit | $ | 6,291 | $ | 6,357 | $ | 4,274 | |||||
Amount of related income tax benefit recognized in income | (2,516 | ) | (2,529 | ) | (1,714 | ) | |||||
Total net income/loss impact | $ | 3,775 | $ | 3,828 | $ | 2,560 | |||||
At December 31, 2016, the Company had $5.6 million of stock-based compensation cost related to non-vested awards that will be recognized over a weighted average period of 1.75 years, all of which is related to awards granted under the Long Term Incentive Plan.
Long Term Incentive Plan
The Long Term Incentive Plan provides for grants of up to 5,674,277 shares of common stock awards, of which stock options, restricted stock awards and performance share awards and other types of equity awards can be granted. As of December 31, 2016, there are 1,423,409 shares available for grant under the Long Term Incentive Plan. Each stock option granted reduces the availability under the Long Term Incentive Plan by one share. Prior to the approval of the amendment and restatement of the Long Term Incentive Plan by the Company's stockholders on May 12, 2014, each restricted stock award granted reduced the availability under the Long Term Incentive Plan by one share and on or after May 12, 2014 each restricted stock award granted reduces the availability by 1.35 shares. Upon the exercise of each stock option or vesting of each restricted share award, one new share of common stock will be issued.
For the years ended December 31, 2016, 2015 and 2014, the Company granted shares of restricted stock and stock options with one of the following vesting terms: (i) vest immediately; (ii) vest 100% on the first anniversary; (iii) vest over three equal annual installments, with one-third vesting on the first anniversary of the grant date and one-third on the second and third anniversaries thereafter or (iv) vest 25% immediately and 25% on the first, second and third anniversaries thereafter. In addition,
90
for the year ended December 31, 2016, the Company granted performance share awards that vest at the end of a three-year performance period based upon achievement of certain market (total shareholder return) and non-market (growth revenue) performance measures.
Stock Options. Stock options have a term of 10 years from the date of grant; however, vested stock options will generally expire 90 days after an employee's termination with the Company, unless the Company is in a blackout period. Stock option activity under the Long Term Incentive Plan is summarized as follows:
Options Outstanding | Weighted Average Exercise Price Per Share | Weighted Average Remaining Contractual Life (in years) | ||||||
Outstanding at December 31, 2013 | 1,399,123 | $ | 16.74 | |||||
Granted (a) | 462,374 | 13.31 | ||||||
Exercised | (51,050 | ) | 6.28 | |||||
Forfeited | (2,005 | ) | 4.31 | |||||
Expired | (33,597 | ) | 23.65 | |||||
Outstanding at December 31, 2014 | 1,774,845 | $ | 16.03 | |||||
Granted (a) | 620,843 | 14.74 | ||||||
Exercised (b) | (210,638 | ) | 10.07 | |||||
Forfeited | (83,495 | ) | 13.41 | |||||
Expired | (70,943 | ) | 24.07 | |||||
Outstanding at December 31, 2015 | 2,030,612 | $ | 16.08 | |||||
Granted (a) | 531,975 | 14.57 | ||||||
Exercised (b) | (178,650 | ) | 10.27 | |||||
Forfeited | (96,592 | ) | 14.35 | |||||
Expired | (115,875 | ) | 23.58 | |||||
Outstanding at December 31, 2016 | 2,171,470 | $ | 15.87 | 6.5 | ||||
Exercisable at December 31, 2016 (c) | 1,492,405 | $ | 16.49 | 5.6 | ||||
Vested and Expected to Vest at December 31, 2016 (d) | 2,148,754 | $ | 15.88 | 6.5 | ||||
(a) | During the years ended December 31, 2016, 2015 and 2014, the weighted average grant date fair value of stock options granted was $4.3 million, $5.4 million and $3.2 million, respectively. For purposes of determining compensation expense, the grant date fair value per share of the stock options was estimated using the Black-Scholes option pricing model which requires the use of various assumptions including the expected life of the option, expected dividend rate, expected volatility and risk-free interest rate. Key assumptions used for determining the fair value of stock options granted were as follows: |
Years Ended December 31, | ||||||||
2016 | 2015 | 2014 | ||||||
Expected life (1) | 5.5 - 6.5 years | 5.5 - 6.5 years | 5.5 - 6.5 years | |||||
Expected dividend (2) | — | — | — | |||||
Expected volatility (3) | 55.1 | % | 59.6 | % | 51.0 | % | ||
Risk-free interest rate (4) | 1.40% - 1.76% | 1.35% - 2.02% | 1.63% - 2.19% | |||||
(1) | The 5.5-year and 6.5-year expected lives (estimated period of time outstanding) of stock options granted were estimated using the ‘Simplified Method' which utilizes the midpoint between the vesting date and the end of the contractual term. This method was utilized for the stock options due to the lack of historical exercise behavior of the Company's employees. |
(2) | For all stock options granted during 2016, 2015 and 2014, no dividends are planned to be paid over the contractual term of the stock options resulting in the use of a zero expected dividend rate. |
(3) | The expected volatility rate is based on the observed historical volatilities of the Company's common stock and observed historical and implied volatilities of comparable companies, which were adjusted to account for the various differences between the comparable companies and the Company. |
91
(4) | The risk-free interest rate is specific to the date of grant and is based on the United States Treasury constant maturity market yield in effect at the time of the grant. |
(b) | During the years ended December 31, 2016 and 2015, the total intrinsic value of stock options that were exercised was $0.9 million and $1.7 million, respectively. |
(c) | Based upon a fair market value of the common stock as of December 30, 2016 of $18.70 per share, the stock options that are exercisable have an aggregate intrinsic value (equal to the value of in-the-money stock options above their respective exercise price) of $6.5 million. |
(d) | Based upon a fair market value of the common stock as of December 30, 2016 of $18.70 per share, the stock options that have vested and are expected to vest have an aggregate intrinsic value (equal to the value of in-the-money stock options above their respective exercise price) of $9.2 million. |
Based upon the respective grant fair value, the aggregate fair value of stock options that vested during the years ended December 31, 2016, 2015, and 2014 was $3.2 million, $2.7 million, and $2.9 million, respectively.
Time-Based Restricted Stock Awards. Restricted stock award activity under the Long Term Incentive Plan is summarized as follows:
Awards Outstanding | Weighted Average Grant Date Fair Value Per Share | |||||
Non-vested at December 31, 2013 | 264,655 | $ | 12.64 | |||
Granted (a) | 216,586 | 13.21 | ||||
Vested (b) | (249,205 | ) | 13.58 | |||
Non-vested at December 31, 2014 | 232,036 | $ | 12.15 | |||
Granted (a) | 161,011 | 15.06 | ||||
Vested (b) | (156,445 | ) | 12.52 | |||
Forfeited | (10,550 | ) | $ | 12.21 | ||
Non-vested at December 31, 2015 | 226,052 | $ | 13.97 | |||
Granted (a) | 175,735 | 14.68 | ||||
Vested (b) | (158,469 | ) | 13.89 | |||
Forfeited | (47,350 | ) | 14.42 | |||
Non-vested at December 31, 2016 | 195,968 | $ | 14.56 | |||
(a) | The grant date fair value per share of the restricted stock awards under the Long Term Incentive Plan was calculated as the fair market value per share of the common stock on the date of grant. During the years ended December 31, 2016, 2015 and 2014, the weighted average grant date fair value of restricted stock awards granted was $2.6 million, $2.4 million, and $2.9 million, respectively. |
(b) | Based upon the respective grant date fair value, the aggregate fair value of restricted stock which vested during the years ended December 31, 2016, 2015 and 2014 was $2.2 million, $2.0 million and $3.4 million, respectively. |
Performance Share Awards. Performance share awards activity under the Long Term Incentive Plan is summarized as follows:
Awards Outstanding | Weighted Average Grant Date Fair Value Per Share | |||||
Non-vested at December 31, 2014 | — | $ | — | |||
Granted (a) | 149,500 | 12.87 | ||||
Forfeited | (18,443 | ) | 12.82 | |||
Non-vested at December 31, 2015 | 131,057 | $ | 12.87 | |||
Granted (a) | 126,000 | 11.88 | ||||
Forfeited | (38,278 | ) | 12.38 | |||
Non-vested at December 31, 2016 | 218,779 | $ | 12.39 | |||
(a) | During the years ended December 31, 2016 and 2015, the weighted average grant date fair value of performance share awards granted was $1.5 million and $1.9 million, respectively. The grant date fair value of the non-market portion of the performance share awards was calculated as the fair market value of the common stock on the date of grant. For |
92
purposes of determining compensation expense for the market portion of the performance share awards, the grant date fair value was estimated using the Monte Carlo valuation model.
(17) Business Concentrations
Geographic
As of December 31, 2016, 83% of the Company's residential voice lines were located in Maine, New Hampshire and Vermont. As a result of this geographic concentration, the Company's financial results will depend significantly upon economic conditions in these markets. A deterioration or recession in any of these markets could result in a decrease in demand for the Company's services and a resulting loss of access line equivalents which could have a material adverse effect on the Company's business, financial condition, results of operations, liquidity and/or the market price of the Company's outstanding securities.
In addition, if state regulators in Maine, New Hampshire or Vermont were to take an action that is adverse to the Company's operations in those states, the Company could suffer greater harm from that action by state regulators than it would from action in other states because of the concentration of operations in those states.
Labor
As of December 31, 2016, the Company employed approximately 2,500 employees, approximately 1,500, or 60%, of whom were covered by 13 collective bargaining agreements.
(18) Commitments and Contingencies
(a) Leases
The Company currently leases real estate and network equipment under capital and operating leases expiring through the year ending 2039. The Company accounts for leases using the straight-line method, which amortizes contracted total payments evenly over the lease term.
Future minimum lease payments under capital leases and non-cancelable operating leases as of December 31, 2016 are as follows (in thousands):
Capital Leases | Operating Leases | ||||||
Year ending December 31: | |||||||
2017 | $ | 1,279 | $ | 6,644 | |||
2018 | 921 | 4,607 | |||||
2019 | 554 | 2,912 | |||||
2020 | 224 | 1,895 | |||||
2021 | 56 | 962 | |||||
Thereafter | — | 739 | |||||
Total minimum lease payments | $ | 3,034 | $ | 17,759 | |||
Less: interest and executory cost | (496 | ) | |||||
Present value of minimum lease payments | 2,538 | ||||||
Less: current installments | (1,227 | ) | |||||
Long-term obligations at December 31, 2016 | $ | 1,311 | |||||
Total rent expense primarily for real estate, vehicles and office equipment was $9.4 million, $9.4 million and $9.8 million for the years ended December 31, 2016, 2015 and 2014, respectively.
The Company does not have any leases with contingent rental payments or any leases with contingency renewal, purchase options, or escalation clauses.
(b) Legal Proceedings
From time to time, the Company is party to various other legal and regulatory proceedings in the ordinary course of business. The Company is a defendant in approximately 16 lawsuits filed by two long distance communications companies, who as plaintiffs have collectively filed over 60 lawsuits arising from switched access charges for calls originating and terminating within the same wireless major trading area. These cases have all been consolidated and transferred to federal district court (the "Court") in Dallas,
93
Texas. The defendants filed joint motions to dismiss these actions. On November 17, 2015, the Court granted the defendants' motions dismissing the plaintiffs' federal law based claims with prejudice. The state law based claims were allowed to be amended and refiled. The Court denied the plaintiffs' request for an immediate appeal of the dismissal of the federal law based claims. Counterclaims against the plaintiffs for the failure to pay these access charges have been filed by the Company. The Company and some of the co-defendants have filed lawsuits against a third long distance communications company for the failure to pay this same type of access charge. These additional lawsuits have also been consolidated and transferred to the Court. Additional motions have been filed by the plaintiffs and defendants, which are still pending. At this time, an estimate of the impact, if any, of these claims cannot be made.
See also "Class Action Complaint" under note (20) "Subsequent Events" herein.
While management presently believes that the ultimate outcome of these proceedings, individually and in the aggregate, will not materially harm the Company’s financial position, cash flows, or overall trends in results of operations, legal proceedings are inherently uncertain, and unfavorable rulings could, individually or in aggregate, have a material adverse effect on the Company’s business, financial condition, or operating results.
(c) Restricted Cash
As of December 31, 2016 and 2015, the Company had $0.7 million and $0.7 million, respectively, of restricted cash, which is restricted for regulatory purposes and is included in long-term restricted cash on the consolidated balance sheets.
(19) Quarterly Financial Information (Unaudited)
The quarterly information presented below represents selected quarterly financial results for the quarters ended March 31, June 30, September 30, and December 31, 2016 and 2015 (in thousands, except per share data).
2016 | First Quarter | Second Quarter | Third Quarter | Fourth Quarter | |||||||||||
Revenue | $ | 206,816 | $ | 206,557 | $ | 207,141 | $ | 203,929 | |||||||
Other post-employment benefit and pension (benefit)/expense (1) | (53,228 | ) | (53,486 | ) | (67,428 | ) | (39,618 | ) | |||||||
Net income (2) | 18,568 | 29,315 | 40,207 | 16,005 | |||||||||||
Income/(loss) per share: | |||||||||||||||
Basic | $ | 0.69 | $ | 1.09 | $ | 1.50 | $ | 0.60 | |||||||
Diluted | $ | 0.68 | $ | 1.08 | $ | 1.48 | $ | 0.59 | |||||||
2015 | First Quarter | Second Quarter | Third Quarter | Fourth Quarter | |||||||||||
Revenue | $ | 213,974 | $ | 214,098 | $ | 221,569 | $ | 209,824 | |||||||
Other post-employment benefit and pension (benefit)/expense (1) | (6,898 | ) | (52,460 | ) | (57,568 | ) | (53,412 | ) | |||||||
Net income/(loss) (2) | (45,213 | ) | 40,265 | 53,054 | 42,310 | ||||||||||
Loss per share: | |||||||||||||||
Basic | $ | (1.70 | ) | $ | 1.51 | $ | 1.99 | $ | 1.59 | ||||||
Diluted | $ | (1.70 | ) | $ | 1.49 | $ | 1.96 | $ | 1.56 | ||||||
(1) Presented for comparative purposes.
(2) The Company generated net income beginning in the second quarter of 2015 largely due to the remeasurement of the employee benefit plans in the first quarter of 2015 as described further in note (11) "Employee Benefit Plans."
94
(20) Subsequent Events
Class Action Complaint
On February 7, 2017, an alleged class action complaint was filed by a purported stockholder of FairPoint Communications in the United States District Court for the Western District of North Carolina (Case No. 3:17-cv-51) against FairPoint Communications, its directors, Consolidated and Merger Sub. Among other things, the complaint alleges that the disclosures in the Form S-4 Registration Statement filed by Consolidated with the Securities and Exchange Commission on January 26, 2017 in connection with the Merger are materially incomplete and misleading in violation of Sections 14(a) and 20(a) of the Exchange Act. The plaintiff seeks to enjoin the defendants from consummating the Merger on the agreed-upon terms or alternatively, to rescind the Merger in the event the defendants consummate the Merger, in addition to damages and attorney fees and costs. FairPoint Communications and the other defendants have not yet filed an answer or other responsive pleading to the complaint.
ITEM 9. CHANGES IN AND DISAGREEMENTS WITH ACCOUNTANTS ON ACCOUNTING AND FINANCIAL DISCLOSURE
None.
ITEM 9A. CONTROLS AND PROCEDURES
(a) Evaluation of Disclosure Controls and Procedures
As of the end of the period covered by this Annual Report, we carried out an evaluation under the supervision and with the participation of our management, including our principal executive officer and principal financial officer, of the effectiveness of our "disclosure controls and procedures" (as defined in Rule 13a-15(e) of the Exchange Act). Disclosure controls and procedures are controls and other procedures of an issuer that are designed to ensure that information required to be disclosed by the issuer in the reports that it files or submits under the Exchange Act is recorded, processed, summarized and reported within the time periods specified in the rules and forms of the SEC.
Based upon this evaluation, our principal executive officer and principal financial officer have concluded that our disclosure controls and procedures were effective as of December 31, 2016.
(b) Changes in Internal Control Over Financial Reporting
There have been no changes in our internal control over financial reporting during the quarter ended December 31, 2016 that have materially affected or are reasonably likely to materially affect our internal control over financial reporting.
See "Item 8. Financial Statements and Supplementary Data" included elsewhere in this Annual Report for the Report of Management on Internal Control over Financial Reporting and the Report of Independent Registered Public Accounting Firm on Internal Control over Financial Reporting, each of which is incorporated herein by reference.
ITEM 9B. OTHER INFORMATION
Not applicable.
95
PART III
ITEM 10. DIRECTORS, EXECUTIVE OFFICERS AND CORPORATE GOVERNANCE
Directors
The following table sets forth the names and ages of our directors, with the exception of Mr. Sunu, as of December 31, 2016.
Name | Age | |
Peter D. Aquino | 55 | |
Dennis J. Austin | 72 | |
Peter C. Gingold | 43 | |
Edward D. Horowitz | 69 | |
Michael J. Mahoney | 66 | |
Michael K. Robinson | 59 | |
David L. Treadwell | 62 | |
Wayne Wilson | 67 | |
Peter D. Aquino—Mr. Aquino has served as President and CEO of Internap Corporation ("Internap") (NASDAQ: INAP) since September 2016. Mr. Aquino held leadership positions in both public and private companies, specializing in turnarounds, start-ups and emerging markets. He is the founder of Broad Valley Capital, LLC, focused on companies needing both telecommunications expertise and capital. Mr. Aquino previously served as the Executive Chairman of Primus Telecom Group, Inc. ("PTGI") (NYSE: PTGI) until April 30, 2013, transitioning from chairman and CEO after nearly a three-year assignment with the international telecommunications company. Prior to PTGI, Mr. Aquino was the President and CEO of RCN Corporation (formerly NASDAQ: RCNI) from December 2004 until its go-private sale in August 2010. Mr. Aquino formerly served as chairman of the United Way Worldwide - U.S. Board of Trustees through 2015 and as a board member of TiVo, Inc. (NASDAQ: TIVO) through 2016. Mr. Aquino currently serves as a board member of Internap and Lumos Networks Corp. (NASDAQ: LMOS). Mr. Aquino is a graduate of Montclair State College in New Jersey and has a Masters of Business Administration from George Washington University in Washington, DC.
We believe Mr. Aquino's qualifications to serve on our board include his leadership background in the communications industry, including his experience from both an operational and financial perspective and his service as a member of the board of directors of two other publicly-traded companies.
Dennis J. Austin—Mr. Austin has served as an independent telecommunications consultant since 2002. Mr. Austin previously served as a consultant at BearingPoint, formerly KPMG Consulting and formerly KPMG LLP, from 1995 to 2002 and as vice president at San Francisco Consulting Group ("SFCG") from 1985 to 1995. Prior to joining SFCG, Mr. Austin was vice president of engineering with Dataspeed Inc. from 1983 to 1985 and director of switch engineering, network planning and design at GTE Sprint from 1977 to 1983. Prior to joining GTE Sprint, Mr. Austin served as a member of the technical staff with Bell Telephone Laboratories from 1966 to 1977. Mr. Austin holds a Ph.D. in electrical engineering from Stanford University.
We believe Mr. Austin's qualifications to serve on our board include his significant consulting and leadership experience in the telecommunications industry, as well as his strong technical and product background.
Peter C. Gingold—Mr. Gingold joined Angelo, Gordon & Co. ("Angelo Gordon") in May of 2007 as a vice president and became a director of Angelo Gordon in February 2011, in each case focusing in distressed and leverage credit. Mr. Gingold became a managing director of Angelo Gordon in February 2014. Mr. Gingold's background includes significant management experience across several operational roles, positions as an investment banker and functions related to corporate development and strategy. Mr. Gingold currently serves as a board member of C&D Technologies, Inc. He holds a Bachelor of Science degree from Cornell University and a Master of Business Administration degree from the Columbia Business School.
We believe Mr. Gingold's qualifications to serve on our board include his extensive understanding of equity and debt capital markets, as well as his current and past positions on the boards or as a board observer of other companies.
Edward D. Horowitz—Mr. Horowitz currently serves as our chair of the board of directors. Mr. Horowitz is chairman of EdsLink LLC, a New York City based venture capital firm, which he founded in 2000 and is also a director of Globecomm Systems Inc. and the First Responder Network Authority. He served as co-CEO of Encompass Digital Media, a global operator of satellite teleports and digital content management from January 2013 through March 2014 and on its board from 2010 through 2014. Mr. Horowitz served as president and CEO of SES-Americom, a communications satellite operator and as a member of the executive
96
committee of its parent company, SES (SESG, Lux.) from 2005 to 2008. Before founding EdsLink LLC, Mr. Horowitz was executive vice president of Advanced Development at Citigroup from 1997 through 2000 and was the founder and chairman of e-Citi. Prior to joining Citigroup, from 1989 to 1997, Mr. Horowitz was a senior vice president of Viacom Inc. and a member of its operating committee. Mr. Horowitz is a trustee of the New York Hall of Science and the American Management Association. He received a Bachelor of Science degree in physics from the City College of New York and a Master of Business Administration degree from the Columbia Business School.
We believe Mr. Horowitz's qualifications to serve on our board include his breadth of leadership experience in the communications industry, as well as his current and past service on the boards of other companies.
Michael J. Mahoney—Mr. Mahoney previously served as president and CEO of Commonwealth Telephone Enterprises, Inc. ("Commonwealth Telephone") from 2000 to 2007. Prior to joining Commonwealth Telephone, Mr. Mahoney served as president and chief operating officer of RCN Corporation from 1997 to 2000 and as president and chief operating officer of C-TEC Corporation from 1993 to 1997. Mr. Mahoney currently serves as a director of Level 3 Communications, Inc. (NYSE: LVLT). He received a Bachelor of Science degree in accounting from Villanova University.
We believe Mr. Mahoney's qualifications to serve on our board include his extensive management, operational and financial experience in telecommunications and specifically in businesses similar to ours, his significant regulatory experience and expertise and his service as a director of another publicly-traded company.
Michael K. Robinson—Mr. Robinson has served as president and CEO since 2005, and as a director since 2009, of Broadview Networks, Inc. ("Broadview"). Broadview executed a pre-packaged Chapter 11 restructuring in the third quarter of 2012 and exited bankruptcy in November 2012. Mr. Robinson previously served as executive vice president and chief financial officer ("CFO") of US LEC (which is now part of Windstream Corporation) from 1998 to 2005. Prior to 1998, Mr. Robinson spent 10 years as an executive at Alcatel (now Alcatel-Lucent). Mr. Robinson also serves as a director of Lumos Networks Corp. (NASDAQ: LMOS). Mr. Robinson received a bachelor's degree in Business and Economics from Emory & Henry College and a Master of Business Administration degree from Wake Forest University.
We believe Mr. Robinson's prior experience in telecommunications, from an operational, strategic and financial perspective, adds significant perspective to the changing market for communication services.
David L. Treadwell—Mr. Treadwell has been a director of FairPoint since 2011 and serves on a number of other boards in various industries. Mr. Treadwell currently serves on the board of directors of two other publicly traded companies: Flagstar Bancorp. Inc. (NYSE: FBC) and Visteon Corporation (NYSE: VC). He also serves as chairman of the following privately held firms: Revere Industries, LLC, AGY, LLC, WinCorp LLC, U.S. Well Services LLC and Grow Michigan, LLC. Mr. Treadwell also serves on the board of directors of C&D Technologies, Inc. He previously served as president and CEO of EP Management Corporation, formerly known as EaglePicher Corporation, from 2006 through 2011. Mr. Treadwell was EaglePicher Corporation's chief operating officer from 2005 to 2006. Prior to that, he served as CEO of Oxford Automotive, Inc. in 2004 to 2005 through its restructuring. Mr. Treadwell received a Bachelor of Business Administration degree from the University of Michigan, Ann Arbor.
We believe Mr. Treadwell's qualifications to serve on our board include his strong operational and leadership skills and his previous experience outside of the telecommunications industry, as well as his previous experience as a turn-around agent for businesses seeking strategic alternatives.
Wayne Wilson—Mr. Wilson, a New Hampshire resident, has been an independent business advisor since 2002. From 1995 to 2002, Mr. Wilson served in various roles as president, chief operating officer and CFO of PC Connection, Inc., a Fortune 1000 direct marketer of information technology products and services. From 1986 to 1995, Mr. Wilson was a partner in the assurance and advisory services practice of Deloitte & Touche LLP. He previously served as a director of ARIAD Pharmaceuticals, Inc. (NASDAQ: ARIA), Edgewater Technology, Inc. (NASDAQ: EDGW), Hologic, Inc. (NASDAQ: HOLX) and Cytyc Corporation. Mr. Wilson received a Bachelor of Arts degree in political science from Duke University and a Master of Business Administration degree from the University of North Carolina at Chapel Hill. He is a certified public accountant in New Hampshire and North Carolina.
We believe Mr. Wilson's qualifications to serve on our board include his strong accounting and finance understanding gained from years as a certified public accountant in industry and with a major public accounting firm. This allows him to provide leadership to our audit committee. Mr. Wilson's qualifications also include his experience as a director on the boards of multiple publicly-traded companies. Mr. Wilson also fulfills the regulatory requirement that at least one member of our board reside in northern New England, as Mr. Wilson is a resident of New Hampshire.
97
Executive Officers
The following table sets forth the names and positions of our current executive officers and their ages as of December 31, 2016.
Name | Age | Position | ||
Paul H. Sunu | 60 | Director and Chief Executive Officer | ||
Karen D. Turner | 48 | Executive Vice President and Chief Financial Officer | ||
Bruce F. Metge | 60 | Executive Vice President and Chief Legal Officer | ||
Peter G. Nixon | 64 | Executive Vice President, Revenue and External Affairs | ||
John J. Lunny | 53 | Executive Vice President and Chief Technology Officer | ||
Steven G. Rush | 59 | Executive Vice President, Northern New England Operations | ||
John T. Hogshire | 55 | Senior Vice President and Controller | ||
The following sets forth selected biographical information for our executive officers.
Paul H. Sunu—Mr. Sunu has served as our CEO since August 2010, prior to which he was CFO of Hargray Communications Group, Inc., a position he had held since 2008. Mr. Sunu was CFO of Hawaiian Telcom Communications, Inc. from 2007 to 2008 and a managing director and CFO of Madison River Communications Corp. from 1996 to 2007. He currently serves as the vice-chairman of the board of directors of Electric Lightwave Communications, Inc. and is a former board member of Madison River Communications Corp., Hawaiian Telcom Communications, Inc. and Centennial Communications Corp. He received a Bachelor of Arts degree in public administration from the University of Illinois and a J.D. from the University of Illinois College of Law.
We believe Mr. Sunu's role as our CEO makes him uniquely qualified to serve on our board, as he brings the day to day knowledge of our business to the board and shares his strategic vision with the board as it provides oversight and policy direction for the Company.
Karen D. Turner. In August 2016, Ms. Turner was appointed as our Executive Vice President and Chief Financial Officer. In this role, Ms. Turner oversees our financial, human resources and risk management functions. Ms. Turner was recently Executive Vice President, Operational Support from January 2016 until August 2016 and prior to that, was Senior Vice President, Strategy and Business Support from December 2014 until January 2016. Ms. Turner joined us in May 2014 as Vice President, Strategy and Business Support and served in that role until December 2014. Prior to joining FairPoint, Ms. Turner previously served as Vice President of Global Business Finance from 2011 to 2014 and Corporate Controller from 2008 to 2011 at INC Research, LLC. Ms. Turner has more than 20 years of experience in finance, accounting, operational support and administration.
Bruce F. Metge. In September 2016, Mr. Metge was appointed as our Executive Vice President and Chief Legal Officer. Mr. Metge brings to FairPoint more than 35 years of legal experience having served as General Counsel for several public and private companies and in private practice. He most recently served as General Counsel for Hillcrest Laboratories, Inc., a firm specializing in complex motion sensing software used throughout the world in television monitors, virtual reality and telecommunication devices. Prior to Hillcrest, Metge worked as General Counsel and Chief Compliance Officer for Catalyst Health Solutions, Inc., a publicly traded administrator of the prescription drug component of overall health benefit programs, and previous to that, he was a Partner at Mintz, Levin, Cohn, Ferris, Glovsky and Popeo, P.C. He has a bachelor’s degree in Public Policy from Duke University and a J.D. from Northwestern University School of Law. He has bar memberships in the District of Columbia, Illinois and Massachusetts.
Peter G. Nixon. In January 2016, Mr. Nixon was appointed as our Executive Vice President, Revenue and External Affairs. Mr. Nixon is responsible for revenue, regulatory and governmental affairs activities. Previously, since July 2011, Mr. Nixon served as Executive Vice President, External Affairs and Operational Support. From July 2007 to July 2011 Mr. Nixon served as our President. Prior to July 2007, Mr. Nixon had served as our Chief Operating Officer since November 2002. Previously, Mr. Nixon was our Senior Vice President of Corporate Development from February 2002 to November 2002 and President of our Telecom Group from April 2001 to February 2002. Prior to this, Mr. Nixon served as President of our Eastern Region, Telecom Group from June 1999 to April 2001 and President of Chautauqua and Erie Telephone Corporation, which we refer to as C&E, from July 1997, when we acquired C&E, to June 1999. From April 1989 to June 1997, Mr. Nixon served as Executive Vice President of C&E. From April 1978 to March 1989, Mr. Nixon served as Vice President of Operations for C&E. Mr. Nixon served as the past chairman of the New York State Telecommunications Association from June 1996 to June 1998.
John J. Lunny. In August 2015, Mr. Lunny was appointed as our Executive Vice President and Chief Technology Officer. Mr. Lunny is responsible for voice and data network architecture, data center operations, IT, engineering and provisioning, as well as project management and product development. Mr. Lunny has 27 years of network operations, engineering and service delivery experience in the communications industry. He joined us in 2008 as director of sales engineering and was promoted to vice president
98
of network planning in 2009, Senior Vice President of Planning and Engineering in 2010 and Senior Vice President and Chief Technology Officer before moving into his current position in 2015. Prior to joining us, Mr. Lunny was senior director of service delivery at Comcast Business Services and before that he spent 13 years at Level 3 Communications, Inc. in operations, where he took on roles of increasing responsibility and became vice president of operations for the northeast region. Mr. Lunny also worked in sales engineering and operations at Reliance CommTec / Lorain Power. He began his career in Network Operations for AT&T.
Steven G. Rush. In August 2015, Mr. Rush was appointed as our Executive Vice President, Northern New England Operations. Mr. Rush is responsible for operational leadership of our northern New England properties. Mr. Rush was most recently Senior Vice President, Northern New England Operations and prior to December 2014 he was Senior Vice President, Customer Care and Network Assurance for us. Prior to joining us in 2007, Mr. Rush was Vice President of the Technical Network for INFONXX. Mr. Rush spent 26 years with AT&T in roles of increasing responsibility and tackled many challenges including mobilizing and coordinating restoral of the telecommunications network serving the New York Stock Exchange following the events of September 11, 2001. In his last role with AT&T, he was Vice President of Network Operations. He began his career as a Fire Control Technician in the U.S. Navy specializing in the Advanced Electronics and Electricity division.
John T. Hogshire. In April 2014, Mr. Hogshire was appointed as our Senior Vice President and Controller. Previously, Mr. Hogshire served as our Vice President and Controller from September 2010 to April 2014. Mr. Hogshire previously served as the Director of Accounting for Aviat Networks from July 2008 to September 2010, as a Consultant with Aviat Networks from January 2008 to July 2008 and as Vice President—Controller of Madison River Communications Corp. from December 1998 to July 2007.
Section 16(a) Beneficial Ownership Reporting Compliance
Section 16(a) of the Securities Exchange Act of 1934 requires our officers and directors, and persons who own, or are part of a group that owns, more than 10% of a registered class of our equity securities, to file reports of ownership and changes in ownership with the SEC and NASDAQ. Officers, directors and beneficial owners of more than 10% of our common stock are required by regulation of the SEC to furnish us with copies of all Section 16(a) forms they file.
Based solely on our review of Forms 3, 4 and 5 and amendments thereto available to us and other information obtained from our directors, officers and beneficial owners of more than 10% of our common stock or otherwise available to us, we believe that no director, officer or beneficial owner of more than 10% of our common stock failed to file on a timely basis reports required pursuant to Section 16(a) of the Exchange Act for fiscal year 2016.
Codes of Ethics
Code of Business Conduct and Ethics
We have adopted a code of business conduct and ethics that applies to all of our employees, including our principal executive officer, principal financial officer and principal accounting officer. This code of business conduct and ethics is designed to comply with the SEC regulations and the NASDAQ listing standards related to codes of conduct and ethics and is posted on our corporate website at www.fairpoint.com on the "Investor Relations" page, under the "Corporate Governance" caption. A copy of our code of business conduct and ethics, which was updated in November 2015, is available free of charge upon request directed to our secretary at: Secretary, FairPoint Communications, Inc., 521 East Morehead Street, Suite 500, Charlotte, North Carolina 28202.
Code of Ethics for Financial Professionals
We have also adopted a code of ethics for financial professionals as required by the SEC under Section 406 of the Sarbanes—Oxley Act of 2002. This code sets forth written standards that are designed to deter wrongdoing and to promote honest and ethical conduct by our senior financial officers, including our CEO, and is a supplement to our code of business conduct and ethics. In addition to applying to our CEO, CFO, Chief Accounting Officer and Treasurer, this code applies to all of the other persons employed by us who have significant responsibility for preparing or overseeing the preparation of our financial statements and the other financial data included in our periodic reports filed with the SEC and in other public communications made by us that are designated from time to time by our CFO as senior financial professionals. Our code of ethics for financial professionals is posted on our corporate website at www.fairpoint.com on the "Investor Relations" page, under the "Corporate Governance" caption. A copy of our code of ethics for financial professionals is available free of charge upon request directed to our secretary at: Secretary, FairPoint Communications, Inc., 521 East Morehead Street, Suite 500, Charlotte, North Carolina 28202.
99
Corporate Governance
Nomination of Directors
There have been no material changes to the procedures by which shareholders may recommend nominees to our board of directors.
Audit Committee
Our board of directors has a separately designated standing audit committee. Our audit committee members are: Wayne Wilson (chair), Peter D. Aquino, Dennis J. Austin and Michael K. Robinson. Messrs. Wilson and Robinson are qualified as audit committee financial experts within the meaning of item 407(d)(5)(ii) of Regulation S-K under the Securities Exchange Act of 1934 (the "Exchange Act") and our board of directors has determined that they have the requisite accounting and related financial management expertise within the meaning of the listing standards of the NASDAQ. Messrs. Wilson and Robinson satisfy the independence criteria and each have the qualifications set forth in the listing standards of the NASDAQ and the applicable provisions of the Exchange Act. The SEC has determined that the audit committee financial expert designation does not impose on any person with that designation any duties, obligations or liability that are greater than the duties, obligations or liability imposed on such person as a member of the audit committee of the board of directors in the absence of such designation.
ITEM 11. EXECUTIVE COMPENSATION
Our executive compensation is presented in the following sections:
•Compensation Discussion and Analysis
•2016 Summary Compensation Table
•Grants of Plan-Based Awards for 2016
•Outstanding Equity Awards at December 31, 2016
•Option Exercises and Stock Vested for 2016
•Potential Payments Upon Termination or Change in Control
•Director Compensation
•Compensation Committee Interlocks and Insider Participation
•Compensation Committee Report
Compensation Discussion and Analysis
General Principles and Procedures
Executive Summary
Our executive compensation program is designed to attract, motivate and retain top executives and managerial talent and to reward our executives and managers for delivering results that will build sustainable growth and value for our shareholders over the long-term. We believe our compensation program aligns the interests of our executives with those of our shareholders by tying short- and long-term incentive compensation directly to the Company's achievement of short- and long-term performance goals. In determining certain aspects of executive compensation for fiscal year 2016, the compensation committee considered the sustained, overwhelming shareholder support our "say-on-pay" advisory votes have received since 2012 and the continued alignment of executive compensation with shareholder interests.
The Company's named executive officers ("NEOs") included in the tables that follow this Compensation Discussion and Analysis for 2016 are:
◦Paul H. Sunu, Director and Chief Executive Officer
◦ | Karen D. Turner, Executive Vice President and Chief Financial Officer (Ms. Turner was appointed to this position effective August 3, 2016) |
◦ | Ajay Sabherwal, former Executive Vice President and Chief Financial Officer (Mr. Sabherwal resigned effective August 3, 2016) |
◦Peter G. Nixon, Executive Vice President, Revenue and External Affairs
◦John J. Lunny, Executive Vice President and Chief Technology Officer
100
◦Steven G. Rush, Executive Vice President, Northern New England Operations
◦ | Anthony A. Tomae, former Executive Vice President and Chief Revenue Officer (Mr. Tomae's employment was terminated without cause effective January 29, 2016) |
2016 Executive Compensation Highlights
The key compensation decisions and factors affecting the compensation of our NEOs for 2016 were as follows:
• | Base salary increases, which are further described on page 106. |
• | Performance-based annual bonuses earned during 2016 and will be paid in 2017 based on achievement of corporate and individual performance goals as described on pages 107-108. |
• | Equity awards with grant date values between 88% and 179% of base salary as described on pages 108-109. |
2016 Performance Highlights
The direct alignment of our compensation program with Company performance helped produce the following 2016 business highlights:
(1) | Enhanced Operational Performance. We continue to focus on delivering exceptional customer service while at the same time, cultivating, improving and enhancing our people and processes. Our trouble loads have continued to decline and mean time to repair has improved as we continue to implement improvements in our operations. |
(2) | Delivered Solid Financial Performance. For 2016, we achieved our financial guidance and ended the year with what we believe is a strong cash position through diligent and effective cost management. |
(3) | Enhanced Network. We have strategically invested in our network to extend service availability and improve offered broadband speeds. We are on track to meet the requirements under the CAF Phase II Program. Additionally, we continue to expand our network through "edge out" strategies including purchase and construction of unique fiber extensions during 2016. |
(4) | Continued Transformation of Revenue Mix. We lowered our revenue losses during 2016 and increased growth revenues to 31% of total revenue. We continued our focus on advanced services, while developing new products and capabilities to serve more effectively small and medium sized businesses which are an important element of many of our markets. We accelerated our product development pipeline through the acquisition of a Maine based value added reseller of unified communications, data networking and cabling infrastructure solutions. Additionally, with more than 22,000 miles of fiber, we experienced an 8% increase in Ethernet circuits in 2016 compared to 2015. |
(5) | Exploration of Strategic Alternatives. On December 3, 2016, FairPoint Communications entered into the Merger Agreement with Consolidated. The combined company will have enhanced scale, including presence in 24 states and ownership of over 35,000 miles of fiber. The Merger is expected to close around the middle of 2017. Additional details, including reasons for the Merger and conditions to close, as well as compensation that may be payable to our executive officers in connection with the Merger, are disclosed in our definitive proxy statement filed with the SEC on February 27, 2017. |
Compensation Philosophy and Objectives
Our overriding objective is to achieve and sustain significant increases in shareholder value. Our executive compensation program has been designed to support this objective with a clear link between pay and corporate and individual performance while discouraging executives from taking excessive risks. We structure our compensation plans to provide target compensation levels and opportunities that are competitive with the median target opportunities for comparable positions among the companies in our peer group. This approach is also aimed at ensuring our ability to attract, retain and motivate the executives, managers and professionals who are critical to our short- and long-term success. A significant portion of our executives' compensation is "performance-based" in the form of both short- and long-term incentives that are intended to motivate balanced decision making by our executives while also aligning their interests with those of our shareholders.
Shareholder Engagement
Our board encourages shareholder feedback and believes that fostering relationships with shareholders is an important objective. Our engagement team, which is comprised of senior leaders and members of the board, interacts with shareholders on a regular basis through face-to-face meetings, participation in industry conferences, phone calls and email.
101
Since our last annual meeting, our engagement team has conducted face-to-face meetings with shareholders that, combined, represented in excess of 50% of our outstanding common stock. These forums allow for an open dialogue on our financial performance, community involvement, governance practices, compensation programs and industry trends. Feedback received from shareholders is routinely shared with the chair of the board.
At our 2016 annual meeting, we received strong support of our executive compensation programs, with the "say-on-pay" proposal receiving votes in favor of approximately 99% of those cast. We will continue to engage with shareholders on executive compensation and other pertinent matters.
Governance and Oversight of our Executive Compensation Program
Our executive compensation program is governed and administered by the compensation committee of the board of directors. The compensation committee is comprised of independent, non-employee members of the board.
The compensation committee's overall responsibilities include approving our compensation philosophy, policies and plans; reviewing and approving corporate goals and objectives relevant to the compensation for our CEO and other executive officers; evaluating the CEO's performance in light of these goals; setting the compensation of our CEO; and after considering the recommendation of our CEO, approving the compensation of our other executives, including the other NEOs. Our CEO does not participate in discussions or decision-making regarding his own compensation but does make recommendations to the compensation committee regarding the compensation of the other NEOs as well as other senior executives. However, the ultimate decisions are made by the compensation committee. The compensation committee also has oversight responsibility for our management development and succession planning efforts.
The compensation committee retains an independent executive compensation consulting firm, Lyons, Benenson & Company Inc. ("LB&Co."), to assist and advise the compensation committee on all aspects of our executive compensation program. LB&Co. provides no other services to us. The services of LB&Co. include:
• | Advising on the compensation philosophy and the compensation committee charter; |
• | Assessing risk in connection with compensation programs; |
• | Developing and analyzing the appropriateness of our peer group; |
• | Providing and analyzing competitive market compensation data; |
• | Analyzing the effectiveness of our executive compensation plans and making recommendations, as appropriate; |
• | Assisting in the design of employment and severance agreements, as applicable; |
• | Evaluating how well our compensation program adheres to our stated objectives and philosophy; and |
• | Providing data, advice and counsel on director compensation. |
Harvey Benenson, the Managing Director of LB&Co., generally attends all meetings of the compensation committee. Certain of our directors, including Mr. Sunu, serve or have served on the boards of other companies, including their compensation committees, for which LB&Co. has provided or provides compensation consulting services. The compensation committee assessed the independence of LB&Co. pursuant to SEC rules and concluded that no conflict of interest exists that prevents LB&Co. from providing independent consulting services to the compensation committee.
Peer Group
The compensation committee uses executive compensation data from a peer group of companies to assist the compensation committee with analyzing the effectiveness and competitiveness of our executive compensation program. The peer group is designed to reflect the current competitive environment for our products, services and executive talent, as well as the competitive environment we expect to face in the future. In structuring the peer group, we focused on companies of comparable scope with notable performance accomplishments. Using data from the public filings of a large number of companies, we narrowed the peer group to 12 companies by applying the following selection criteria:
• | Relevant industry classification (based on our global industry classification standard), business description and services provided; |
• | With some exceptions based on industry relevance, comparable size, with revenues between $400 million and $5.77 billion; and |
• | Levels of achievement in certain performance metrics, such as three-year revenue growth, three-year earnings before interest, taxes, depreciation and amortization ("EBITDA") growth and three-year free cash flow growth. |
102
The companies included in the peer group in 2015 were: Akamai Technologies, Inc.; AOL Inc.; Cablevision Systems Corporation; Charter Communications, Inc.; Cincinnati Bell Inc.; Consolidated Communications Holdings, Inc.; EarthLink Holdings Corp.; Frontier Communications Corporation; Hawaiian Telcom Holdco, Inc.; j2 Global, Inc.; Level 3 Communications, Inc.; Premiere Global Services, Inc.; SBA Communications Corporation; Vonage Holdings Corp. and Windstream Corporation.
The following companies were removed from our peer group in 2016:
Company Name | Reason for Removal |
AOL Inc. | No longer publicly traded |
Cablevision Systems Corporation | Above revenue range |
Charter Communications, Inc. | Above revenue range |
Level 3 Communications, Inc. | Above revenue range |
Premiere Global Services, Inc. | No longer publicly traded |
General Communication, Inc. and Cogent Communications Holdings, Inc. were added to our peer group in 2016 using the selection criteria described above.
As a result of these changes, the companies included in the peer group in 2016 were: Akamai Technologies, Inc.; Cincinnati Bell Inc.; Cogent Communications Holdings, Inc.; Consolidated Communications Holdings, Inc.; EarthLink Holdings Corp.; Frontier Communications Corporation; General Communication, Inc.; Hawaiian Telcom Holdco, Inc.; j2 Global, Inc.; SBA Communications Corporation; Vonage Holdings Corp. and Windstream Corporation.
The compensation committee believes this peer group is both reflective of where we are positioned currently as well as where we aspire to be in the future. The compensation committee recognizes that certain of the companies included in the peer group are considerably larger than us. These companies have been included because of their relevance to the industry and their offerings and because we draw from the same talent pool for employees. The compensation committee is mindful of differences in size and scope when using peer group data.
Specific Principles for Determining Executive Compensation
Assessing the Competitiveness of Our Compensation Program
The compensation committee benchmarks executive compensation levels annually. We strive to ensure that the target total compensation opportunity for each of our executives is competitive relative to comparable positions with the peer group companies. Specifically, base salaries, annual incentives and equity based incentives are all targeted at the peer group median. Both our annual and long-term incentives are structured, however, to deliver actual total compensation that may exceed the market median when the underlying performance upon which those incentives are based exceeds median performance.
Total Compensation Mix
As reflected in the following charts, a significant portion, 71% and 63%, respectively, of our CEO's and the average of other NEOs' target total compensation opportunity was performance-based using 2016 annual base salary, 2016 target annual incentive plan and 2016 LTIP Plan (as defined hereinafter) grants as illustrated below.

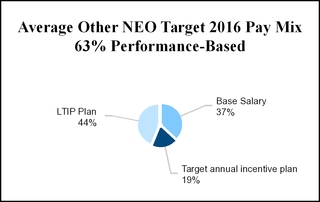
103
Paying for Performance
We are committed to the principle of paying for performance. Our compensation program is designed such that a significant portion of the total compensation opportunity of our executives is based on achievement of financial measures as illustrated below. For the 2016 annual incentive payout, actual achievement of $265.1 million for Pre-Bonus Adjusted EBITDA (as defined hereinafter), or 116.9% of target, resulted in payout at 38.0% for that measure compared to a target payout of 32.5%. The actual achievement of $42.1 million for Pre-Bonus Free Cash Flow (as defined hereinafter), or 125.0% of target, resulted in payout at 40.6% for that measure compared to a target payout of 32.5%.
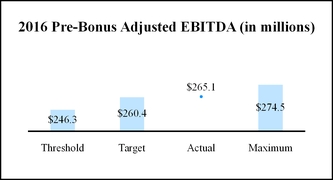
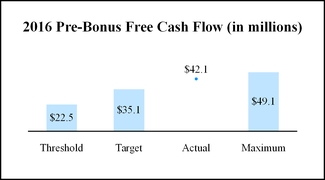
The table below identifies and explains the reason for each component and the method for determining amounts earned under our executive compensation program.
Element | Reason and Method for Element |
Base Salary | Base salary represents "fair" pay for the performance of duties and responsibilities. The compensation committee determines the level of base salary based on compensation benchmarking, the different levels of responsibility that exist within the Company, each executive's level of experience within the communications industry and individual performance at the Company. |
Annual Incentives | Under the annual incentive plan, executives may earn annual cash incentives based on short-term corporate and individual performance. The incentive opportunity motivates executives to achieve the performance objectives and goals that are consistent with our plans and budgets and that strengthen our ability to compete effectively. |
Long Term Incentives/Equity Awards | The FairPoint Communications, Inc. Amended and Restated 2010 Long Term Incentive Plan (the "LTIP Plan") effective May 12, 2014 allows executives to receive stock-based awards that link the executives' interests with those of our shareholders. The value of the awards is based on the Company's performance over multi-year periods to retain and motivate key executives and encourage them to operate the Company's business with a view towards creating long-term shareholder value. |
Retirement and Welfare Benefits | We maintain a 401(k) retirement savings plan. In 2016, this plan included an employer matching contribution up to an amount equal to 5% of each participant's compensation. Additionally, we provide, on equal terms for all employees, group term life insurance, group health insurance and short- and long-term disability insurance. |
Post-employment, Severance and Change-in-Control Benefits | We provide severance benefits to certain NEOs at levels that we consider conservative yet competitive when compared to those offered by our peers. We believe that such benefits are necessary and appropriate in order to attract and retain qualified NEOs. The severance benefits for these executives are generally paid if the executives are terminated without cause or they resign with good reason. In addition to cash severance payments that would be due upon a qualifying termination, each terminated executive is entitled to continued welfare benefits for a limited period after termination. |
104
Share Ownership Guidelines
Our executive officers are subject to share ownership guidelines to better align their interests with those of our shareholders by requiring the executives to acquire and maintain meaningful equity positions in the Company. Under the guidelines, each executive officer is required to own shares of our common stock with a value equal to a multiple of the executive officer’s base salary as indicated in the table below. Executive officers are required to meet these guidelines within the later of five years of the date of adoption of these guidelines (by June 4, 2018) or of such individual becoming subject to them.
Position | Base Salary Multiple | |
Chief Executive Officer | 4.00X | |
Executive Vice Presidents | 2.25X | |
For executive officers, the failure to timely meet or, in certain circumstances, to show sustained progress toward timely meeting the goals set forth in the share ownership guidelines could result in a reduction of future equity grants and/or payment of future annual and/or cash incentive payouts in the form of equity, at the discretion of the compensation committee.
No Hedging/No Pledging Provisions
Our insider trading policy prohibits the executive officers from using any strategies or products (such as derivative securities or short-selling techniques) to hedge against potential changes in the value of our common stock, prohibits the holding of our securities in a margin account and prohibits any executive officer from pledging our securities as collateral for a loan.
Incentive Recoupment Policy
The compensation committee has adopted a clawback policy that requires an executive officer to repay us a compensation payment or award previously made to the officer if the following conditions are met:
(1) | the payment was predicated upon achieving certain financial results that were required to be reported under the securities laws that were subsequently the subject of a restatement of our financial statements filed with the SEC due to our material noncompliance with any financial reporting requirement under the securities laws; |
(2) | the compensation committee determines the officer engaged in fraud and/or intentional misconduct that caused or substantially caused the need for the restatement; and |
(3) | a lower payment would have been made to the officer based upon the restated financial results. |
Executive Compensation Decisions for 2016
Base Salary
The table below shows the annual base salary rate increases from 2015 to 2016 for each NEO:
Executive (1) | Annual Base Salary Rate (2) | % of Base Salary Increase | ||
2016 | 2015 | |||
Mr. Sunu | $830,000 | $830,000 | —% | |
Ms. Turner | $375,000 | $263,000 | 43% | |
Mr. Nixon | $353,000 | $342,000 | 3% | |
Mr. Lunny | $300,000 | $288,300 | 4% | |
Mr. Rush | $285,000 | $273,000 | 4% | |
(1) | Mr. Tomae's employment was terminated without cause effective January 29, 2016 and Mr. Sabherwal resigned his employment effective August 3, 2016. |
(2) | The annual base salary rate for 2016 was effective on July 1, 2016 with the exception of Ms. Turner, which was effective August 3, 2016 upon her appointment to Chief Financial Officer. Base salary reflected in the Realized Compensation table and the Summary Compensation table is based on the respective NEO's compensation reported on IRS Form W-2. |
105
Annual Incentive Compensation Awards
NEOs earn annual incentive compensation based on the achievement of financial and non-financial goals established by the compensation committee each year. For 2016, the financial goals were measured by the Company's Pre-Bonus Consolidated EBITDA and Pre-Bonus Free Cash Flow and the non-financial goals included seven service quality measures. In setting the 2016 financial goals, the compensation committee considered the industry-wide trends that are negatively impacting revenue (primarily for voice-related products). The target goals for 2016 were set based on the expected business plan with stretch goals added to achieve maximum payout.
The compensation committee believes achievement of these goals is critically important to the Company's business and strategy and will increase the value of the Company.
The compensation committee adopted the following challenging financial targets for the 2016 annual incentive compensation awards ($ in millions):
Weight | Performance Measures | Threshold (25% payout) | Target (100% payout) | Maximum (150% payout) | 2016 Actual Results | 2016 Results Relative to Target | |||||||||||||
Financial Measures | 32.5% | Pre-Bonus Consolidated EBITDA (1) | $ | 246.3 | $ | 260.4 | $ | 274.5 | $ | 265.1 | 116.9% of target | ||||||||
32.5% | Pre-Bonus Free Cash Flow (1) | $ | 22.5 | $ | 35.1 | $ | 49.1 | $ | 42.1 | 125.0% of target | |||||||||
(1) | Pre-Bonus Consolidated EBITDA and Pre-Bonus Free Cash Flow are non-GAAP financial measures used by management to measure operational and financial performance. For purposes of calculating Pre-Bonus Consolidated EBITDA, the Company adjusts net income/(loss) for interest, income taxes, depreciation and amortization, in addition to: a) the add-back of aggregate pension and other post-employment benefits ("OPEB") expense, b) the add-back (or subtraction) of the adjustment to the compensated absences accrual to eliminate the impact of changes in the accrual, c) the add-back of costs related to the reorganization, including professional fees for advisors and consultants, d) other adjustments, such as the add-back of costs and expenses, including those imposed by regulatory authorities, with respect to casualty events, acts of God or force majeure to the extent they are not reimbursed from proceeds of insurance; other non-cash items, except to the extent they will require a cash payment in a future period, including impairment charges; and other items, including facility and office closures, expenses related to permitted transactions, labor negotiation related expenses (including losses related to disruption of operations), non-cash gains/losses, non-operating dividend and interest income and other extraordinary gains/losses and e) the add-back of any bonus expense to the extent any bonuses were earned. Pre-Bonus Free Cash Flow adjusts Pre-Bonus Consolidated EBITDA for pension contributions, OPEB payments and capital expenditures. |
In addition, 5% and 30% of each officer's 2016 annual incentive award was based on the officer's achieving specified service quality targets and individual or departmental goals or milestones related to the officer's areas of responsibility, respectively. The specified service quality targets included: call center abandonment rate, installation appointments not met for Company reasons, mean time to repair service affecting abnormal events, whole performance credits and productivity and quality metrics. The goals or milestones include certain financial and human resources milestones, revenue and sales force development milestones, technology milestones and operational improvement milestones. In order for any bonuses to be paid for 2016, the Company had to achieve threshold performance under both of the financial objectives (Pre-Bonus Consolidated EBITDA and Pre-Bonus Free Cash Flow) set by the compensation committee.
106
The table below shows the 2016 target bonus opportunity percentages, performance goals and weightings for our NEOs:
Executive | Bonus Target (% of 2016 Annual Base Salary) | Performance Criteria | ||
Mr. Sunu | 100% | (i) 32.5%—Pre-Bonus Consolidated EBITDA; (ii) 32.5%—Pre-Bonus Free Cash Flow; (iii) 5%—the Company achieving specified service quality measures and (iv) 30%—the Company meeting certain objectives set by the board of directors. | ||
Messrs. Nixon, Lunny and Rush and Ms. Turner | 50% | (i) 32.5%—Pre-Bonus Consolidated EBITDA; (ii) 32.5%—Pre-Bonus Free Cash Flow; (iii) 5%—the Company achieving specified service quality measures and (iv) 30%—the executive officer achieving certain individual or departmental goals or milestones. | ||
Messrs. Sabherwal and Tomae* | N/A | N/A | ||
*Mr. Tomae's employment was terminated without cause effective January 29, 2016 and Mr. Sabherwal resigned his employment effective August 3, 2016.
The following table shows the 2016 annual incentive earned by the NEOs based on the financial and service quality results achieved, the relative weighting of each corporate performance objective (as shown above) and each NEO's individual performance rating:
Performance Achievement | Annual Incentive Payout | |||||||||
Executive | Financial Measures | Service Quality Measures | Individual Goals | $ | As a % of Target | |||||
Mr. Sunu | 78.62% | 4.95% | 30.00% | 960,800 | 113.57% | |||||
Ms. Turner | 78.62% | 4.95% | 30.00% | 179,100 | 113.57% | |||||
Mr. Nixon | 78.62% | 4.95% | 30.00% | 201,100 | 113.57% | |||||
Mr. Lunny | 78.62% | 4.95% | 30.00% | 167,100 | 113.57% | |||||
Mr. Rush | 78.62% | 4.95% | 30.00% | 161,400 | 113.57% | |||||
Messrs. Sabherwal and Tomae* | N/A | N/A | N/A | N/A | N/A | |||||
*Mr. Tomae's employment was terminated without cause effective January 29, 2016 and Mr. Sabherwal resigned his employment effective August 3, 2016.
2016 Equity Compensation Awards
The compensation committee awards long-term, equity based awards to executives to reward the NEOs for their performance and to retain and motivate them and encourage them to create long-term shareholder value. The compensation committee approved the following equity compensation awards to our NEOs:
Executive (1) | Number of Shares of Restricted Stock | Number of Stock Options | Number of Performance Shares | Grant Date Value ($) | Grant Date Value (% of Base Salary) | |||||
Mr. Sunu | 31,000 | 54,000 | 27,000 | $1,216,221 | 147% | |||||
Ms. Turner | 22,000 | 37,000 | 6,000 | $671,251 | 179% | |||||
Mr. Sabherwal | 11,000 | 19,000 | 9,000 | $423,356 | 101% | |||||
Mr. Nixon | 9,000 | 16,000 | 8,000 | $357,625 | 101% | |||||
Mr. Lunny | 6,000 | 13,000 | 6,000 | $265,229 | 88% | |||||
Mr. Rush | 6,000 | 13,000 | 6,000 | $265,229 | 93% | |||||
Mr. Tomae | N/A | N/A | N/A | N/A | N/A | |||||
(1) The grant date for these awards was January 22, 2016, except the following grants awarded on August 15, 2016 to Ms. Turner upon her appointment to Chief Financial Officer: 15,000 shares of restricted stock and 25,000 stock options. Mr. Tomae's employment was terminated without cause effective January 29, 2016.
The amount of equity awards for 2016 were determined by the compensation committee in its discretion, taking into account the CEO's recommendations other than with respect to the amounts awarded to the CEO. The equity grant included a mix of stock options, restricted stock and performance shares. The options and restricted stock granted on January 22, 2016 are time-vested,
107
with 25% vesting on the grant date and the remainder vesting in three equal annual installments, commencing on the first anniversary date of the grant. The options and restricted stock granted on August 15, 2016 to Ms. Turner are time-vested, vesting in three equal annual installments, commencing on the first anniversary date of the grant. The performance shares will be earned, at the end of a three-year performance period, based upon (i) the Company's achievement of a growth revenue performance goal and (ii) the total shareholder return to our shareholders compared to the total shareholder return achieved by the companies in a telecommunications industry group. One share of our common stock will be distributed to the participant for each whole performance share earned by the participant.
Employment Agreements
Paul H. Sunu
On April 9, 2013, the Company entered into an amended and restated employment agreement with Mr. Sunu, as amended on August 14, 2015 (the “Sunu Employment Agreement”). Mr. Sunu's term of employment is through August 31, 2017, unless terminated sooner or renewed as provided in the Sunu Employment Agreement. In addition, under the Sunu Employment Agreement, Mr. Sunu is nominated annually to the board of directors of the Company (and has served and will so serve, if elected).
Mr. Sunu is eligible to participate in the benefits programs generally available to the Company's other senior executives, including the LTIP Plan, as determined at the discretion of the compensation committee of the board of directors and subject to the terms of such plan. In any year that the compensation committee determines to make a grant or grants under the LTIP Plan, the grant date value of any award to Mr. Sunu is anticipated to be no less than 1.5 times the annual base salary payable to him in effect at such time. Under the Sunu Employment Agreement, Mr. Sunu is eligible to participate in the Company's annual incentive plan and earn a performance-based bonus thereunder for annual performance periods. Mr. Sunu's target level bonus under the annual incentive plan is 100% of the base salary payable to him during the applicable performance period and Mr. Sunu is eligible for a maximum bonus under such plan of up to 150% of his base salary.
Under the Sunu Employment Agreement, either party may terminate Mr. Sunu's employment at any time. Information about his potential severance pay and benefits appears under "—Potential Payments Upon Termination or Change in Control."
Karen D. Turner, Ajay Sabherwal, Peter G. Nixon, John J. Lunny and Steven G. Rush
The Company entered into employment agreements with Ms. Turner (on November 20, 2014, as amended on August 14, 2015 and November 21, 2016); Mr. Sabherwal (on January 22, 2013, as amended on August 14, 2015 and May 16, 2016); Mr. Nixon (on January 22, 2013, as amended on August 14, 2015 and May 16, 2016); Mr. Lunny (on July 1, 2014, as amended on August 14, 2015 and November 21, 2016) and Mr. Rush (on August 10, 2015, as amended on June 1, 2016).
Pursuant to the respective employment agreements, each current executive will serve in their respective positions (with such title subject to change from time to time as determined by the board of directors) with the Company through December 31, 2019, subject to earlier termination or extension as set forth in the employment agreements with the exception of Mr. Rush, whose employment with the Company is through August 10, 2018. Following such period of employment (or the applicable extension term, if any), the current executive will continue on an at will basis until such time as the Company provides a written notice of termination in accordance with the terms of his or her employment agreement.
The current executives are eligible to participate in the annual incentive plan and are eligible to earn a performance-based bonus thereunder. The current executives are also eligible to participate in the benefits programs and other plans made available generally to the Company's other senior executives, including but not limited to the LTIP Plan.
Information about the potential severance pay and benefits associated with these employment agreements appears under
"—Potential Payments Upon Termination or Change in Control" herein with the exception of Mr. Sabherwal. Mr. Sabherwal resigned his employment effective August 3, 2016.
Anthony A. Tomae
The Company entered into an employment agreement with Mr. Tomae on November 15, 2012. Mr. Tomae's employment agreement set forth the terms and conditions of his employment as Executive Vice President and Chief Revenue Officer of the Company for a three-year term ending on November 15, 2015, subject to extension as set forth in his employment agreement. On August 14, 2015, the Company amended Mr. Tomae’s employment agreement, which extended the term of the agreement through December 31, 2016. Following the term of employment (or the applicable extension term, if any), Mr. Tomae was to have remained employed on an at-will basis until such time as the Company provided a written notice of termination in accordance with the terms of his employment agreement.
Mr. Tomae's employment with the Company terminated without cause effective January 29, 2016. Further information about his severance pay and benefits appear "—Potential Payments Upon Termination or Change in Control" herein.
108
Tax Considerations
Section 162(m) of the Code generally disallows a tax deduction to public corporations for taxable compensation, other than performance-based compensation, over $1.0 million paid for any fiscal year to any of the Company's NEOs (excluding the Chief Financial Officer) as of the end of any fiscal year. The Company's policy is to qualify its executive program and plans for deductibility under Section 162(m) to the extent the compensation committee determines such action to be appropriate.
While the compensation committee's general policy is to preserve the deductibility of compensation paid to the NEOs, the compensation committee nevertheless authorizes payments that might not be deductible if it believes that they are in the best interests of the Company and its shareholders.
Realized Compensation
The SEC's calculation of total compensation, as shown in the Summary Compensation table, includes several items that are driven by accounting assumptions. In some cases, the actual compensation realized by the NEOs may be very different than what is reported in the Summary Compensation table and compensation reported may not be realized for many years, if at all. Furthermore, realized compensation for a NEO for any given year may be greater or less than the compensation reported in the Summary Compensation table for that year depending on fluctuations in stock prices on the grant and vesting dates, differences in equity grant values from year to year and SEC reporting requirements, as described below.
The primary difference between the table below (the "Realized Compensation table") and the Summary Compensation table is the method used to value restricted stock awards, stock options and performance shares. SEC rules require that the entire grant date fair value of all restricted stock awards (calculated as the fair market value of the common stock on the date of grant), stock options (estimated using the Black-Scholes option pricing model, as outlined in footnote (1) of the Summary Compensation table) and performance shares (calculated as the fair market value of the common stock on the date of grant based upon the probable outcome of performance conditions) be reported in the Summary Compensation table during the year in which they were granted. As a result, a significant portion of the total compensation amounts reported in the Summary Compensation table relates to restricted stock awards and performance shares that have not vested and stock options that have not been exercised during the year. In contrast, the Realized Compensation table below includes only the value of restricted stock awards that vested (calculated as the fair market value of the common stock on the date of vesting) and stock options that were exercised (calculated as the difference between the exercise price and the market value of the common stock on the date of exercise) during the applicable fiscal year. In addition, the Realized Compensation table below does not include any items from the "All Other Compensation" column of the Summary Compensation table, which include (1) matching contributions made by the Company to its 401(k) retirement savings plan, (2) contributions made by the Company to the term life insurance plan it sponsors and (3) relocation expense reimbursement, since in each case for subsections (1), (2) and (3) there is no cash compensation received by the NEO for these benefits, as well as (4) severance expenses, because this is not compensation received during the course of employment with the Company.
109
The Realized Compensation table below supplements the Summary Compensation table and shows compensation actually realized by each NEO in 2016, 2015 and 2014, as described above.
Executive | Year | Salary (1) $ | Bonus (1) $ | Non-Equity Incentive Plan Compensation (2) $ | Stock Awards (3) $ | Option Awards (4) $ | Total $ | |||||||||||||
Mr. Sunu | 2016 | 845,962 | — | 960,800 | 609,675 | — | 2,416,437 | |||||||||||||
2015 | 830,000 | 500,000 | 893,100 | 504,510 | — | 2,727,610 | ||||||||||||||
2014 | 815,000 | — | 407,500 | 706,320 | — | 1,928,820 | ||||||||||||||
Ms. Turner (5) | 2016 | 315,442 | — | 179,100 | 74,394 | — | 568,936 | |||||||||||||
2015 | 263,000 | — | 141,500 | 54,732 | — | 459,232 | ||||||||||||||
2014 | 146,154 | — | 36,600 | — | — | 182,754 | ||||||||||||||
Mr. Sabherwal (6) | 2016 | 267,312 | — | — | 208,768 | 392,014 | 868,094 | |||||||||||||
2015 | 408,000 | — | 219,500 | 171,308 | — | 798,808 | ||||||||||||||
2014 | 401,600 | — | 100,400 | 215,940 | — | 717,940 | ||||||||||||||
Mr. Nixon | 2016 | 354,119 | — | 201,100 | 181,425 | — | 736,644 | |||||||||||||
2015 | 342,000 | — | 184,000 | 150,977 | — | 676,977 | ||||||||||||||
2014 | 336,400 | — | 84,100 | 178,692 | — | 599,192 | ||||||||||||||
Mr. Lunny | 2016 | 294,202 | — | 167,100 | 103,460 | — | 564,762 | |||||||||||||
2015 | 283,060 | — | 146,600 | 82,830 | 170,938 | 683,428 | ||||||||||||||
2014 | 261,580 | — | 65,400 | 55,835 | — | 382,815 | ||||||||||||||
Mr. Rush | 2016 | 284,296 | — | 161,400 | 51,730 | — | 497,426 | |||||||||||||
2015 | 266,846 | — | 143,600 | 30,120 | — | 440,566 | ||||||||||||||
2014 | 243,797 | 8,000 | 61,000 | 12,350 | — | 325,147 | ||||||||||||||
Mr. Tomae (7) | 2016 | 46,579 | — | — | 150,387 | 464,640 | 661,606 | |||||||||||||
2015 | 343,000 | — | 184,500 | 334,856 | — | 862,356 | ||||||||||||||
2014 | 337,200 | — | 84,300 | 222,455 | — | 643,955 | ||||||||||||||
(1) | Base salary and bonus as reported on the respective NEO's W-2 and as presented in the Summary Compensation table. |
(2) | For 2016, represents the performance-based compensation under the annual incentive plan earned during 2016 and will be paid in 2017, as presented in the Summary Compensation table. |
(3) | The value of restricted stock that vested during the year, as reported on the respective NEO's W-2 and as presented in the table "—Option Exercises and Stock Vested for 2016" herein (the "Option Exercises and Stock Vested for 2016 table"). |
(4) | The value of stock options exercised during the year, as reported on the respective NEO's W-2 and as presented in the Option Exercises and Stock Vested for 2016 table. |
(5) | Ms. Turner began employment with the Company on April 7, 2014 and she was appointed as Chief Financial Officer effective August 3, 2016. |
(6) | Mr. Sabherwal resigned his employment effective August 3, 2016. |
(7) | Mr. Tomae's employment was terminated without cause effective January 29, 2016. |
110
2016 Summary Compensation Table
The table below summarizes the total compensation paid or earned by each of the NEOs for the fiscal years ended December 31, 2016, 2015 and 2014.
Name and Principal Position | Year | Salary $ | Bonus $ | Stock Awards(1) $ | Option Awards(1) $ | Non-Equity Incentive Plan Compensation(2) $ | All Other Compensation(3) $ | Total $ | ||||||||||||||
Paul H. Sunu (4) Director and Chief Executive Officer | 2016 | 845,962 | — | 779,048 | 437,173 | 960,800 | 15,722 | 3,038,705 | ||||||||||||||
2015 | 830,000 | 500,000 | 905,704 | 569,160 | 893,100 | 15,722 | 3,713,686 | |||||||||||||||
2014 | 815,000 | — | 738,080 | 583,075 | 407,500 | 15,664 | 2,559,319 | |||||||||||||||
Karen D. Turner (5) Executive Vice President and Chief Financial Officer | 2016 | 315,442 | — | 385,364 | 285,887 | 179,100 | 14,227 | 1,180,020 | ||||||||||||||
2015 | 263,000 | — | 197,424 | 128,718 | 141,500 | 13,868 | 744,510 | |||||||||||||||
2014 | 146,154 | — | 55,320 | 42,810 | 36,600 | 6,256 | 287,140 | |||||||||||||||
Ajay Sabherwal (6) Former Executive Vice President and Chief Financial Officer | 2016 | 267,312 | — | 269,536 | 153,820 | — | 14,181 | 704,849 | ||||||||||||||
2015 | 408,000 | — | 318,726 | 199,644 | 219,500 | 14,763 | 1,160,633 | |||||||||||||||
2014 | 401,600 | — | 263,600 | 198,931 | 100,400 | 14,578 | 979,109 | |||||||||||||||
Peter G. Nixon Executive Vice President, Revenue and External Affairs | 2016 | 354,119 | — | 228,092 | 129,533 | 201,100 | 14,518 | 927,362 | ||||||||||||||
2015 | 342,000 | — | 290,842 | 166,370 | 184,000 | 14,518 | 997,730 | |||||||||||||||
2014 | 336,400 | — | 218,788 | 167,239 | 84,100 | 14,323 | 820,850 | |||||||||||||||
John J. Lunny Executive Vice President and Chief Technology Officer | 2016 | 294,202 | — | 159,984 | 105,245 | 167,100 | 13,050 | 739,581 | ||||||||||||||
2015 | 283,060 | — | 218,896 | 135,723 | 146,600 | 14,215 | 798,494 | |||||||||||||||
2014 | 261,580 | — | 171,340 | 131,706 | 65,400 | 11,935 | 641,961 | |||||||||||||||
Steven G. Rush (7) Executive Vice President, Northern New England Operations | 2016 | 284,296 | — | 159,984 | 105,245 | 161,400 | 34,122 | 745,047 | ||||||||||||||
2015 | 266,846 | — | 197,424 | 128,718 | 143,600 | 60,175 | 796,763 | |||||||||||||||
2014 | 243,797 | 8,000 | — | 150,913 | 61,000 | 46,384 | 510,094 | |||||||||||||||
Anthony A. Tomae(8) Former Executive Vice President and Chief Revenue Officer | 2016 | 46,579 | — | — | — | — | 1,005,394 | 1,051,973 | ||||||||||||||
2015 | 343,000 | — | 272,382 | 166,370 | 184,500 | 14,522 | 980,774 | |||||||||||||||
2014 | 337,200 | — | 263,600 | 198,931 | 84,300 | 14,323 | 898,354 | |||||||||||||||
(1) The amounts shown are the grant date fair value of the stock and option awards, adjusted to eliminate the effect of any forfeiture assumption in calculating stock compensation, computed in accordance with the Compensation—Stock Compensation Topic of the Accounting Standards Codification ("ASC"). In the case of performance shares, the grant date fair value is based upon the probable outcome of the performance conditions.
The grant date fair value per share of the restricted stock awards was calculated as the fair market value per share of the common stock on the date of grant.
The performance shares are based upon (i) the Company's achievement of a growth revenue performance goal (non-market portion) and (ii) the total shareholder return to our shareholders compared to the total shareholder return achieved by the companies in a telecommunications industry group (market portion). The grant date fair value of the non-market portion of the performance shares was calculated as the fair market value per share of the common stock on the date of grant. For purposes of determining compensation expense for the market portion of the performance shares, the grant date fair value was estimated using the Monte Carlo valuation model.
The grant date fair value per share of the stock options was estimated using the Black-Scholes option pricing model which requires the use of various assumptions including the expected life of the option, expected dividend rate, expected volatility and risk-free interest rate. Key assumptions used for determining the fair value of the stock options granted during 2016, 2015 and 2014 were as follows:
Year Ended December 31, 2016 | Year Ended December 31, 2015 | Year Ended December 31, 2014 | ||||||
Expected life (a) | 5.5 - 6.5 years | 5.5 - 6.5 years | 5.5 - 6.5 years | |||||
Expected dividend (b) | — | — | — | |||||
Expected volatility (c) | 55.1 | % | 59.6 | % | 51 | % | ||
Risk-free interest rate (d) | 1.40% - 1.76% | 1.35% - 1.66% | 1.63% - 2.29% | |||||
111
(a) | The expected lives (estimated period of time outstanding) of stock options granted were estimated using the 'Simplified Method' which utilizes the midpoint between the vesting date and the end of the contractual term. This method was utilized for the stock options due to the lack of historical exercise behavior of the Company's employees. |
(b) | For all stock options granted during 2016, 2015 and 2014, no dividends are planned to be paid over the contractual term of the stock options resulting in the use of a zero expected dividend rate. |
(c) | The expected volatility rate is based on the observed historical volatilities of our common stock and observed historical and implied volatilities of comparable companies, which were adjusted to account for the various differences between the comparable companies and us. |
(d) | The risk-free interest rate is specific to the date of grant and is based on the United States Treasury constant maturity market yields in effect at the time of the grant. |
(2) These awards were granted pursuant to the annual incentive plan. The 2016 amounts will be paid in March 2017.
See "—Annual Incentive Compensation Awards" for additional information.
(3) The amount shown for 2016 reflects the following for each NEO:
Name | 401(k)(a) | Term life (b) | Relocation Expense Reimbursement (c) | Severance (d) | Total All Other Compensation | |||||||||||||||
Mr. Sunu | $ | 13,250 | $ | 2,472 | $ | — | $ | — | $ | 15,722 | ||||||||||
Ms. Turner | 13,250 | 977 | — | — | 14,227 | |||||||||||||||
Mr. Sabherwal | 13,250 | 931 | — | — | 14,181 | |||||||||||||||
Mr. Nixon | 13,250 | 1,268 | — | — | 14,518 | |||||||||||||||
Mr. Lunny | 11,981 | 1,069 | — | — | 13,050 | |||||||||||||||
Mr. Rush | 12,640 | 1,012 | 20,470 | — | 34,122 | |||||||||||||||
Mr. Tomae | 11,554 | 147 | — | 993,693 | 1,005,394 | |||||||||||||||
(a) | Reflects matching contributions made by the Company to its 401(k) retirement savings plan for each NEO. |
(b) | Contributions made by the Company to the term life insurance plans it sponsors for all eligible employees (including our NEOs). |
(c) | Relocation expenses reimbursed by the Company. |
(d) | As described further in "—Employment Agreements", Mr. Tomae received a separation payment in 2016. |
(4) Mr. Sunu received a $500,000 signing bonus during 2015 in connection with the extension of his employment agreement. Mr. Sunu does not receive any compensation for serving on our board of directors.
(5) Ms. Turner began employment with the Company on April 7, 2014 and she was appointed as Chief Financial Officer effective August 3, 2016.
(6) Mr. Sabherwal resigned his employment effective August 3, 2016.
(7) Mr. Rush received an $8,000 bonus during 2014.
(8) Mr. Tomae's employment was terminated without cause effective January 29, 2016.
112
Grants of Plan-Based Awards for 2016
Estimated Future Payouts Under Non-Equity Incentive Plan Awards | Estimated Future Payouts Under Equity Incentive Plan Awards | All Other Stock Awards: Number of Shares of Stock or Units (#) | All Other Option Awards: Number of Securities Underlying Options (#) | Exercise or Base Price of Option Awards(6) ($/Sh) | Closing Market Price on Date of Option Award Grant(6) ($/Sh) | Grant Date Fair Value of Stock and Option Awards(7) ($) | |||||||||||||||||||||||||
Executive(1) | Grant Date | Threshold ($) | Target ($) | Maximum ($) | Threshold (#) | Target (#) | Maximum (#) | ||||||||||||||||||||||||
Mr. Sunu | 2/9/2016(2) | 211,491 | 845,962 | 1,268,943 | — | — | — | — | — | — | — | — | |||||||||||||||||||
1/22/2016(3) | — | — | — | — | 27,000 | 27,000 | — | — | — | N/A | 320,868 | ||||||||||||||||||||
1/22/2016(4) | — | — | — | — | — | — | — | 54,000 | 14.61 | 14.78 | 437,173 | ||||||||||||||||||||
1/22/2016(4) | — | — | — | — | — | — | 31,000 | — | — | N/A | 458,180 | ||||||||||||||||||||
Ms. Turner | 2/9/2016(2) | 39,430 | 157,721 | 236,582 | — | — | — | — | — | — | — | — | |||||||||||||||||||
1/22/2016(3) | — | — | — | — | 6,000 | 6,000 | — | — | — | N/A | 71,304 | ||||||||||||||||||||
1/22/2016(4) | — | — | — | — | — | — | — | 12,000 | 14.61 | 14.78 | 97,150 | ||||||||||||||||||||
1/22/2016(4) | — | — | — | — | — | — | 7,000 | — | — | N/A | 103,460 | ||||||||||||||||||||
8/15/2016(5) | — | — | — | — | — | — | — | 25,000 | 14.14 | 14.04 | 188,737 | ||||||||||||||||||||
8/15/2016(5) | — | — | — | — | — | — | 15,000 | — | — | N/A | 210,600 | ||||||||||||||||||||
Mr. Sabherwal | 2/9/2016(2) | 52,500 | 210,000 | 315,000 | — | — | — | — | — | — | — | — | |||||||||||||||||||
1/22/2016(3) | — | — | — | — | 9,000 | 9,000 | — | — | — | N/A | 106,956 | ||||||||||||||||||||
1/22/2016(4) | — | — | — | — | — | — | — | 19,000 | 14.61 | 14.78 | 153,820 | ||||||||||||||||||||
1/22/2016(4) | — | — | — | — | — | — | 11,000 | — | — | N/A | 162,580 | ||||||||||||||||||||
Mr. Nixon | 2/9/2016(2) | 44,265 | 177,060 | 265,590 | — | — | — | — | — | — | — | — | |||||||||||||||||||
1/22/2016(3) | — | — | — | — | 8,000 | 8,000 | — | — | — | N/A | 157,148 | ||||||||||||||||||||
1/22/2016(4) | — | — | — | — | — | — | — | 16,000 | 14.61 | 14.78 | 129,533 | ||||||||||||||||||||
1/22/2016(4) | — | — | — | — | — | — | 9,000 | — | — | N/A | 70,944 | ||||||||||||||||||||
Mr. Lunny | 2/9/2016(2) | 36,775 | 147,101 | 220,652 | — | — | — | — | — | — | — | — | |||||||||||||||||||
1/22/2016(3) | — | — | — | — | 6,000 | 6,000 | — | — | — | N/A | 71,304 | ||||||||||||||||||||
1/22/2016(4) | — | — | — | — | — | — | — | 13,000 | 14.61 | 14.78 | 105,245 | ||||||||||||||||||||
1/22/2016(4) | — | — | — | — | — | — | 6,000 | — | — | N/A | 88,680 | ||||||||||||||||||||
Mr. Rush | 2/9/2016(2) | 35,537 | 142,148 | 213,222 | — | — | — | — | — | — | — | — | |||||||||||||||||||
1/22/2016(3) | — | — | — | — | 6,000 | 6,000 | — | — | — | N/A | 71,304 | ||||||||||||||||||||
1/22/2016(4) | — | — | — | — | — | — | — | 13,000 | 14.61 | 14.78 | 105,245 | ||||||||||||||||||||
1/22/2016(4) | — | — | — | — | — | — | 6,000 | — | — | N/A | 88,680 | ||||||||||||||||||||
(1) | Mr. Tomae's employment was terminated without cause effective January 29, 2016. |
(2) | See "—Annual Incentive Compensation Awards" and the Summary Compensation table for additional information. Amounts represent potential payouts under the annual incentive plan based on a percentage of 2016 annual base salary assuming achievement of the financial and service quality targets as follows: 25% for threshold, 100% for target and 150% for maximum. The actual amounts earned under the annual incentive plan for 2016 for Messrs. Sunu, Nixon, Lunny and Rush and Ms. Turner will be paid in March 2017 and are indicated in the Summary Compensation table. Mr. Sabherwal resigned his employment effective August 3, 2016. |
(3) | These performance shares were granted under the LTIP Plan and will be earned, at the end of a three-year performance period, based upon (i) the Company's achievement of a growth revenue performance goal and (ii) the total shareholder return to our shareholders compared to the total shareholder return achieved by the companies in a telecommunications industry group. |
(4) | These restricted stock awards and stock options were granted under the LTIP Plan and are time-vested. 25% vested on the grant date with the remainder vesting in equal installments on January 23, 2017, January 22, 2018 and January 22, 2019. |
113
(5) | These restricted stock awards and stock options were granted under the LTIP Plan and are time-vested in equal installments on August 15, 2017, August 15, 2018 and August 15, 2019. |
(6) | Exercise price of stock options is calculated as the average of the low and high market value of our common stock on the date of grant. |
(7) | Reflects the grant date fair value of stock and option awards based on the number of awards included in the grant and the fair value of the awards at the date of grant, as determined in accordance with the Compensation—Stock Compensation Topic of the ASC. In the case of restricted stock this amount is equal to the number of restricted shares issued multiplied by the market value of our common stock on the date of grant. In the case of performance shares, the grant date fair value is based upon the probable outcome of the performance conditions. See note (1) to the Summary Compensation table for more information on the assumptions used. |
Outstanding Equity Awards at December 31, 2016
Option Awards | Stock Awards | |||||||||||||||||||
Executive(1) | Grant Date | Number of Securities Underlying Unexercised Options (2) (#) Exercisable | Equity Incentive Plan Awards: Number of Securities Underlying Unexercised Unearned Options (2) (#) | Option Exercise Price (3) ($) | Option Expiration Date | Number of Shares or Units of Stock That Have Not Vested(4) (#) | Market Value of Shares or Units of Stock That Have Not Vested(5) ($) | Equity Incentive Plan Awards: Number of Unearned Shares, Units or Other Rights That Have Not Vested (6) (#) | Equity Incentive Plan Awards: Market or Payout Value of Unearned Shares, Units or Other Rights That Have Not Vested (7) ($) | |||||||||||
Mr. Sunu | 1/22/2016 | — | — | — | — | 23,250 | 434,775 | — | — | |||||||||||
1/22/2016 | — | — | — | — | — | — | 27,000 | 504,900 | ||||||||||||
1/22/2016 | 13,500 | 40,500 | 14.61 | 1/22/2026 | — | — | — | — | ||||||||||||
1/22/2015 | — | — | — | — | 19,000 | 355,300 | — | — | ||||||||||||
1/22/2015 | 32,500 | 32,500 | 14.73 | 1/22/2025 | — | — | — | — | ||||||||||||
1/22/2015 | — | — | — | — | — | — | 26,000 | 486,200 | ||||||||||||
1/22/2014 | — | — | — | — | 14,000 | 261,800 | — | — | ||||||||||||
1/22/2014 | 63,750 | 21,250 | 13.29 | 1/22/2024 | — | — | — | — | ||||||||||||
1/22/2013 | 94,000 | — | 9.36 | 1/22/2023 | — | — | — | — | ||||||||||||
1/24/2012 | 48,000 | — | 4.56 | 1/24/2022 | — | — | — | — | ||||||||||||
1/24/2011 | 125,000 | — | 24.29 | 1/24/2021 | — | — | — | — | ||||||||||||
Ms. Turner | 8/15/2016 | — | — | — | — | 15,000 | 280,500 | — | — | |||||||||||
8/15/2016 | — | 25,000 | 14.14 | 8/15/2026 | — | — | — | — | ||||||||||||
1/22/2016 | — | — | — | — | 5,250 | 98,175 | — | — | ||||||||||||
1/22/2016 | — | — | — | — | — | — | 6,000 | 112,200 | ||||||||||||
1/22/2016 | 3,000 | 9,000 | 14.61 | 1/22/2026 | — | — | — | — | ||||||||||||
1/22/2015 | — | — | — | — | 4,000 | 74,800 | — | — | ||||||||||||
1/22/2015 | 7,350 | 7,350 | 14.73 | 1/22/2025 | — | — | — | — | ||||||||||||
1/22/2015 | — | — | — | — | — | — | 6,000 | 112,200 | ||||||||||||
5/12/2014 | — | — | — | — | 1,333 | 24,927 | — | — | ||||||||||||
5/12/2014 | 4,000 | 2,000 | 13.60 | 5/12/2024 | — | — | — | — | ||||||||||||
114
Option Awards | Stock Awards | |||||||||||||||||||
Executive(1) | Grant Date | Number of Securities Underlying Unexercised Options (2) (#) Exercisable | Equity Incentive Plan Awards: Number of Securities Underlying Unexercised Unearned Options (2) (#) | Option Exercise Price (3) ($) | Option Expiration Date | Number of Shares or Units of Stock That Have Not Vested(4) (#) | Market Value of Shares or Units of Stock That Have Not Vested(5) ($) | Equity Incentive Plan Awards: Number of Unearned Shares, Units or Other Rights That Have Not Vested (6) (#) | Equity Incentive Plan Awards: Market or Payout Value of Unearned Shares, Units or Other Rights That Have Not Vested (7) ($) | |||||||||||
Mr. Nixon | 1/22/2016 | — | — | — | — | 6,750 | 126,225 | — | — | |||||||||||
1/22/2016 | — | — | — | — | — | — | 8,000 | 149,600 | ||||||||||||
1/22/2016 | 4,000 | 12,000 | 14.61 | 1/22/2026 | — | — | — | — | ||||||||||||
1/22/2015 | — | — | — | — | 6,250 | 116,875 | — | — | ||||||||||||
1/22/2015 | 9,500 | 9,500 | 14.73 | 1/22/2025 | — | — | — | — | ||||||||||||
1/22/2015 | — | — | — | — | — | — | 8,000 | 149,600 | ||||||||||||
1/22/2014 | — | — | — | — | 4,150 | 77,605 | — | — | ||||||||||||
1/22/2014 | 18,285 | 6,095 | 13.29 | 1/22/2024 | — | — | — | — | ||||||||||||
1/22/2013 | 27,500 | — | 9.36 | 1/22/2023 | — | — | — | — | ||||||||||||
1/24/2012 | 13,000 | — | 4.56 | 1/24/2022 | — | — | — | — | ||||||||||||
1/24/2011 | 33,000 | — | 24.29 | 1/24/2021 | — | — | — | — | ||||||||||||
Mr. Lunny | 1/22/2016 | — | — | — | — | 4,500 | 84,150 | — | — | |||||||||||
1/22/2016 | — | — | — | — | — | — | 6,000 | 112,200 | ||||||||||||
1/22/2016 | 3,250 | 9,750 | 14.61 | 1/22/2026 | — | — | — | — | ||||||||||||
1/22/2015 | — | — | — | — | 4,500 | 84,150 | — | — | ||||||||||||
1/22/2015 | 3,875 | 7,750 | 14.73 | 1/22/2025 | — | — | — | — | ||||||||||||
1/22/2015 | — | — | — | — | — | — | 6,500 | 121,550 | ||||||||||||
1/22/2014 | — | — | — | — | 3,250 | 60,775 | — | — | ||||||||||||
1/22/2014 | 4,800 | 4,800 | 13.29 | 1/22/2024 | — | — | — | — | ||||||||||||
1/22/2013 | 1,000 | — | 9.36 | 1/22/2023 | — | — | — | — | ||||||||||||
1/24/2011 | 18,500 | — | 24.29 | 1/24/2021 | — | — | — | — | ||||||||||||
Mr. Rush | 1/22/2016 | — | — | — | — | 4,500 | 84,150 | — | — | |||||||||||
1/22/2016 | — | — | — | — | — | — | 6,000 | 112,200 | ||||||||||||
1/22/2016 | 3,250 | 9,750 | 14.61 | 1/22/2026 | — | — | — | — | ||||||||||||
1/22/2015 | — | — | — | — | 4,000 | 74,800 | — | — | ||||||||||||
1/22/2015 | 7,350 | 7,350 | 14.73 | 1/22/2025 | — | — | — | — | ||||||||||||
1/22/2015 | — | — | — | — | — | — | 6,000 | 112,200 | ||||||||||||
1/22/2014 | 16,500 | 5,500 | 13.29 | 1/22/2024 | — | — | — | — | ||||||||||||
1/22/2013 | 2,000 | — | 9.36 | 1/22/2023 | — | — | — | — | ||||||||||||
1/24/2012 | 6,050 | — | 4.56 | 1/24/2022 | — | — | — | — | ||||||||||||
1/24/2011 | 15,500 | — | 24.29 | 1/24/2021 | — | — | — | — | ||||||||||||
Mr. Tomae(8) | 1/22/2015 | — | — | — | — | — | — | 2,500 | 46,750 | |||||||||||
(1) | No unvested stock options or stock awards were outstanding at December 31, 2016 for Mr. Sabherwal. |
(2) | These stock options were granted under the LTIP Plan. See "—Grants of Plan-Based Awards for 2016" for vesting details of the January 22, 2016 and August 15, 2016 grants. The stock options shown for the January 22, 2015, January 22, 2014, January 22, 2013, January 24, 2012 and January 24, 2011 grants are time-vested. 25% vested on the grant date with the remainder vesting in three annual installments of 25%, commencing on or about the first anniversary date of the grant, except 3,000 stock options for Mr. Nixon granted on January 22, 2013 that vested 100% on the grant date. The stock options shown for the May 12, 2014 grant are time-vested, vesting in three equal annual installments, commencing on the first anniversary date of the grant. |
(3) | The exercise price is calculated as the average of the low and high market value of our common stock on the date of grant. |
(4) | These stock awards were granted under the LTIP Plan. See "—Grants of Plan-Based Awards for 2016" for vesting details of the January 22, 2016 and August 15, 2016 grants. The stock awards shown for the January 22, 2015 and January 22, |
115
2014 grants are time-vested. 25% vested on the grant date with the remainder vesting in three annual installments of 25%, commencing on or about the first anniversary date of the grant. The stock awards shown for the May 12, 2014 grant are time-vested, vesting in three equal annual installments, commencing on the first anniversary date of the grant.
(5) | Computed by multiplying the number of unvested shares by $18.70, the market closing price of our common stock on December 30, 2016. |
(6) | These performance share awards were granted under the LTIP Plan. See "—Grants of Plan-Based Awards for 2016" for vesting details of the January 22, 2016 grant. The performance share awards shown for the January 22, 2015 grant will be earned, at the end of a three-year performance period, based upon (i) the Company's achievement of a growth revenue performance goal and (ii) the total shareholder return to our shareholders compared to the total shareholder return achieved by the companies in a telecommunications industry group. |
(7) | Computed by multiplying the number of unvested shares by $18.70, the market closing price of our common stock on December 30, 2016. |
(8) | In accordance with the performance share awards pursuant to the LTIP Plan, Mr. Tomae's outstanding performance awards on his termination date were prorated to reflect the number of performance shares earned during the performance period while the remaining performance shares were forfeited on his termination date. |
Option Exercises and Stock Vested for 2016
Option Awards | Stock Awards | |||||||||||
Executive | Number of Shares Acquired on Exercise (#) | Value Realized on Exercise(1) ($) | Number of Shares Acquired on Vesting (#) | Value Realized on Vesting (2) ($) | ||||||||
Mr. Sunu | — | — | 41,250 | 609,675 | ||||||||
Ms. Turner | — | — | 5,083 | 74,394 | ||||||||
Mr. Sabherwal | 86,900 | 392,014 | 14,125 | 208,768 | ||||||||
Mr. Nixon | — | — | 12,275 | 181,425 | ||||||||
Mr. Lunny | — | — | 7,000 | 103,460 | ||||||||
Mr. Rush | — | — | 3,500 | 51,730 | ||||||||
Mr. Tomae | 79,250 | 464,640 | 10,175 | 150,387 | ||||||||
(1) | Value realized by Mr. Sabherwal is computed by multiplying the number of shares acquired upon exercise by the difference between the market price of the underlying securities on the exercise date ($14.99) and the strike price of the stock options (15,500 at $4.56; 33,500 at $9.36; 21,750 at $13.29; 11,400 at $14.73 and 4,750 at $14.61). Value realized by Mr. Tomae is computed by multiplying the number of shares acquired upon exercise by the difference between the market price of the underlying securities on the exercise date ($15.61) and the strike price of the stock options (26,000 at $5.29; 22,000 at $9.36; 21,750 at $13.29 and 9,500 at $14.73). |
(2) | Value realized is computed by multiplying the number of shares acquired upon vesting by the market price of the underlying securities on the vesting date of January 22, 2016 at $14.78 for all shares except 1,333 shares for Ms. Turner which vested on May 12, 2016 at $14.23. |
Potential Payments Upon Termination or Change in Control
As of December 31, 2016, we had employment agreements with Messrs. Sunu, Nixon, Lunny and Rush and Ms. Turner. The employment agreements provide benefits to our NEOs in the event their employment is terminated under certain circumstances as summarized below. In addition, as described below, we had an employment agreement with Mr. Tomae, whose employment terminated without cause effective January 29, 2016, pursuant to which Mr. Tomae received certain benefits upon such termination.
On December 3, 2016, FairPoint Communications entered into the Merger Agreement with Consolidated. Additional details, including reasons for the Merger and conditions to close as well as compensation that may be payable to our executive officers in connection with the Merger, are disclosed in our definitive proxy statement filed with the SEC on February 27, 2017.
116
Employment Agreements
Paul H. Sunu
Under the Sunu Employment Agreement, in the event (a) the Company terminates Mr. Sunu's employment without cause (as defined in the Sunu Employment Agreement), (b) the term of employment under the Employment Agreement expires following the Company's delivery of a non-extension notice or (c) Mr. Sunu resigns his employment for good reason (as defined in the Sunu Employment Agreement), Mr. Sunu is entitled to receive (i) any accrued but unpaid base salary through the date of the termination, any unpaid annual incentive plan bonus (in respect of any completed fiscal year that has ended prior to the date of the termination of Mr. Sunu's employment), any unpaid or unreimbursed expenses and any benefits to be provided under the Company's employee benefits plans upon a termination of employment; and (ii) an amount equal to the sum of (A) two times the amount of Mr. Sunu's then-current base salary, (B) two times the amount of his average annual incentive plan bonus; and (C) the cost of continued health and disability insurance coverage for Mr. Sunu and his covered dependents for a period of 24 months. Mr. Sunu will also be entitled to any (x) amounts payable under the LTIP Plan (in accordance with its terms) and (y) a pro rata portion of the annual incentive plan bonus for the year in which the termination occurred. The amount of Mr. Sunu's average annual incentive plan bonus will be determined based on Mr. Sunu's actual annual incentive plan bonus in the two years immediately preceding the year in which termination occurs.
In addition, upon termination of his employment under the circumstances described in (a), (b) and (c) of the preceding paragraph, Mr. Sunu is entitled to immediate accelerated vesting of (i) the next tranche of any time-based equity award that would have otherwise vested except for the termination or receipt of a non-extension notice and (ii) any performance-based equity award, if, in the discretion of the compensation committee, the performance vesting criteria have been met as of the date of termination, prorated for the time employed during the performance period prior to the date of termination or receipt of a non-extension notice. The benefits and payments described in this and the preceding paragraph are subject to adjustment in the event that Mr. Sunu's employment is terminated by the Company without cause (other than due to his death or disability) within 12 months before or 12 months after a change in control (as defined in the Sunu Employment Agreement). The amount of Mr. Sunu's bonus upon termination related to a change in control will be the greater of (B) of the preceding paragraph or two times his target annual incentive plan bonus for the year in which the termination occurred. Also upon the occurrence of a change in control, Mr. Sunu's unvested benefits under the LTIP Plan are accelerated and vest in full.
Pursuant to the Sunu Employment Agreement, in the event that Mr. Sunu's employment is terminated (a) by the Company with cause, (b) by Mr. Sunu without good reason or (c) upon the expiration of the term of employment following delivery by Mr. Sunu to the Company of a non-extension notice, Mr. Sunu is entitled to (x) any accrued but unpaid base salary through the date of the termination of Mr. Sunu's employment, (y) any unpaid or unreimbursed expenses and (z) any benefits to be provided under the Company's employee benefits plans (in accordance with the terms of such plans). Mr. Sunu will also be entitled to amounts payable under the LTIP Plan (in accordance with its terms). However, Mr. Sunu will be entitled to receive the payments and benefits as provided by the Sunu Employment Agreement for termination by Mr. Sunu for good reason, subject to the same conditions as those under such circumstances, in the event that Mr. Sunu provides the Company with notice of his termination of employment without good reason during the 13th month following the consummation of a change in control.
In the event that Mr. Sunu's employment is terminated due to death or disability, Mr. Sunu or his estate or his beneficiaries, as the case may be, are entitled to (i) any accrued but unpaid base salary through the date of the termination of Mr. Sunu's employment, (ii) any unpaid annual incentive plan bonus (in respect of any completed fiscal year that has ended prior to the date of the termination of Mr. Sunu's employment), (iii) any unpaid or unreimbursed expenses, (iv) any benefits to be provided under the Company's employee benefits plans (in accordance with such plans), (v) amounts payable under the LTIP Plan (in accordance with its terms) and (vi) an amount equal to the sum of (x) Mr. Sunu's then-current base salary, (y) Mr. Sunu's annual incentive plan bonus for the immediately preceding fiscal year and (z) the cost of continued health and disability insurance coverage for Mr. Sunu and his covered dependents during the 12-month period following the date of such termination.
The payment of any amount or provision of any benefit, subject to certain exceptions set forth in the Sunu Employment Agreement, is conditioned upon Mr. Sunu's execution and delivery to the Company of a release of all claims against, among other parties, the Company and its subsidiaries, in connection with those termination circumstances under the Sunu Employment Agreement requiring a release. In addition, Mr. Sunu's entitlement to payments and benefits upon termination under the Sunu Employment Agreement is subject to his compliance with a non-interference agreement with the Company, pursuant to which Mr. Sunu agrees to, among other things, certain non-competition and non-solicitation provisions for 24 months following the termination of his employment with the Company.
Karen D. Turner, Peter G. Nixon, John J. Lunny and Steven G. Rush
Under the respective employment agreements with each of the above named executives, either party may terminate the executive's employment at any time. In the event (i) the Company terminates the executive's employment without cause (as defined in the employment agreements) prior to the expiration of the term of employment, (ii) the Company delivers a termination notice
117
to the executive in accordance with the provisions of his or her employment agreement or (iii) the executive resigns his or her employment for good reason (as defined in the employment agreements), the executive will receive: (x) any accrued but unpaid base salary through the date of the termination, any unpaid annual incentive plan bonus (in respect of any completed fiscal year that has ended prior to the date of the termination of the executive's employment), any unpaid or unreimbursed expenses, any benefits to be provided under the Company's employee benefits plans upon a termination of employment and any amounts payable under the LTIP Plan; and (y) an amount equal to the sum of (A) two times the amount of the executive's then-current base salary, (B) two times the amount of his or her average annual incentive plan bonus for the immediately preceding two fiscal years where such average is determined by reference to the actual annual bonus paid to the executive for the immediately two preceding fiscal years; and (C) the cost of continued health and disability insurance coverage for the executive and his or her covered dependents for a period of 24 months following such termination or resignation, as applicable. In the case of (iii) above, the executive is also entitled to accelerated vesting of the next tranche of awards payable under the LTIP Plan. The employment agreements do not require the Company to provide any tax gross-up on the benefits paid under the employment agreements.
In the event the Company terminates the executive's employment without cause (as defined in the employment agreements) or the Company delivers a termination notice to the executive, in either case after the expiration of the term of employment, the executive will receive: (i) any accrued but unpaid base salary through the date of the termination, (ii) any unpaid or unreimbursed expenses, (iii) any benefits to be provided under the Company's employee benefits plans and (iv) any amounts payable under the LTIP Plan. However, if such termination occurs within six months of a change in control, the executive is also entitled to any unpaid annual incentive plan bonus (in respect of any completed fiscal year that has ended prior to the date of the termination of the executive's employment) and each of the payments and benefits described in (A) and (C) in the immediately preceding paragraph. The amount of the executive's bonus upon termination related to a change in control will be the greater of (B) in the preceding paragraph or two times his or her target annual incentive plan bonus for the year in which the termination occurred.
In the event that the executive's employment is terminated due to death or disability, the executive or his or her estate or his or her beneficiaries, as the case may be, is entitled to (i) any accrued but unpaid base salary through the date of the termination of the executive's employment, (ii) any unpaid annual incentive plan bonus (in respect of any completed fiscal year that has ended prior to the date of the termination of the executive's employment), (iii) any unpaid or unreimbursed expenses, (iv) any benefits to be provided under the Company's employee benefits plans (in accordance with such plans) and (v) any amounts payable under the LTIP Plan.
In the event that the executive's employment is terminated (i) by the Company with cause, (ii) by the executive without good reason or (iii) upon the delivery by the executive to the Company of a termination notice pursuant to the terms of his or her employment agreement, the executive is entitled to any accrued but unpaid base salary through the date of the termination of the executive's employment, any unpaid or unreimbursed expenses, any benefits to be provided under the Company's employee benefits plans upon a termination of employment (in accordance with the terms of such plans) and any amounts payable under the LTIP Plan.
Upon the occurrence of a change in control, all of the executives' unvested benefits under the LTIP Plan are accelerated and vest in full.
The executive's entitlement to payments and benefits under his or her employment agreement is subject to his or her compliance with a non-interference agreement with the Company, pursuant to which the executive agrees to, among other things, certain non-competition and non-solicitation provisions for 12 months following his or her employment with the Company.
In addition, in the event that (i) the executive's employment is terminated due to death or disability, (ii) the Company terminates the executive's employment without cause, (iii) the Company delivers a termination notice prior to the expiration of the executive's term of employment pursuant to the provisions of the employment agreement, or (iv) the executive terminates his or her employment with good reason in accordance with his or her employment agreement, the payment of any amount or provision of any benefit in connection therewith is conditioned upon the executive's execution and delivery to the Company of a release of all claims, subject to certain exceptions set forth in the employment agreements.
Anthony A. Tomae
Mr. Tomae's employment with the Company terminated without cause effective January 29, 2016. The benefits and payments provided to him in connection with such termination were provided pursuant to his employment agreement with the Company dated as of November 15, 2012, as amended on August 14, 2015.
In accordance with his employment agreement, Mr. Tomae received a separation payment which consisted of: (x) his accrued, but unpaid, base salary through the date of termination, unpaid or unreimbursed expenses and accrued and unpaid vacation pay as provided under the Company's employee benefits plans upon a termination of employment; and (y) an amount equal to the sum of (A) two times the amount of Mr. Tomae's then-current base salary, (B) two times the amount of his average annual incentive plan bonus for 2014 and 2015 where the average was determined by reference to the actual annual bonus paid to Mr. Tomae and (C) the cost of continued health and disability insurance coverage for Mr. Tomae for a period of 24 months following his termination.
118
In accordance with his employment agreement, the Company did not provide any tax gross-up on the benefits paid under the agreement.
Upon the occurrence of a change in control, Mr. Tomae's unvested benefits under the LTIP Plan are accelerated and vest in full.
Mr. Tomae's entitlement to payments and benefits under his employment agreement were subject to his compliance with a non-interference agreement with the Company, pursuant to which Mr. Tomae agreed to, among other things, certain non-competition and non-solicitation provisions for twelve months following his employment with the Company and a general release of claims.
Potential Post-Employment Payments Table
The following table shows cash compensation and other benefits that would have been provided under the employment agreements with the CEO if his employment had terminated on December 31, 2016 under conditions that would trigger payments.
Reason for Payment | Base Salary(1) ($) | Non-Equity Incentive Plan(2) ($) | Acceleration and Continuation of Equity Awards(3) ($) | Continuation of Medical/Welfare Benefits(4) ($) | Total Termination Benefits ($) | ||||||||||
Mr. Sunu | |||||||||||||||
Involuntary termination with cause or voluntary termination without good reason | — | — | — | — | — | ||||||||||
Death or disability | 830,000 | 893,100 | 1,778,998 | 17,585 | 3,519,683 | ||||||||||
Expiration following non-extension notice | 1,660,000 | 1,300,600 | 492,433 | 35,171 | 3,488,204 | ||||||||||
Termination without cause or voluntary termination with good reason | 1,660,000 | 1,300,600 | 1,311,498 | 35,171 | 4,307,269 | ||||||||||
Termination after change in control | 1,660,000 | 1,660,000 | 2,452,608 | 35,171 | 5,807,779 | ||||||||||
(1) | Other than for Mr. Sunu's death or disability, the base salary paid upon termination under the applicable scenario is calculated as two times the 2016 base salary. In the event of Mr. Sunu's death or disability, the base salary paid upon termination is equal to his 2016 base salary. |
(2) | Other than for Mr. Sunu's death or disability, the incentive paid upon termination under the applicable scenario is calculated as two times the average of the annual incentive paid for the immediately two preceding fiscal years (fiscal years 2015 and 2014), except in the case of termination due to a change in control, which is the greater of the average annual incentive paid for the immediately two preceding fiscal years or two times the annual incentive target. In the event of Mr. Sunu's death or disability, the incentive is equal to his annual incentive paid for the immediately preceding fiscal year (fiscal year 2015). |
(3) | The amounts are calculated based on the closing price of $18.70 on December 30, 2016 under the applicable scenario. In the event of Mr. Sunu's death or disability, the amount is calculated for full vesting of stock awards, the next tranche for option awards and a prorated amount for performance share awards pursuant to the LTIP Plan. In the event of Mr. Sunu's receipt of a non-extension notice, the amount is calculated for a prorated amount for performance awards. In the event of Mr. Sunu's termination without cause or voluntary termination with good reason, the amount is calculated for the next tranche of stock and option awards and a prorated amount for performance awards. In the case of termination related to a change in control, the amount is calculated for full vesting of all unvested awards. |
(4) | Other than for Mr. Sunu's death or disability, the cost of continued health and disability insurance coverage paid upon termination under the applicable scenario is calculated at the present value of 24 months of benefits. In the event of Mr. Sunu's death or disability, the amount is calculated at the present value of 12 months of benefits. |
The following table shows cash compensation and other benefits that would have been provided under the employment agreements with the other NEOs, other than Mr. Tomae, if their employment had terminated on December 31, 2016 under conditions that would trigger payments. The information set forth in the table below with respect to Mr. Tomae shows the cash compensation and other benefits provided to him in connection with the termination of his employment with the Company without cause effective January 29, 2016.
119
Reason for Payment | Base Salary(1) ($) | Non-Equity Incentive Plan(2) ($) | Acceleration and Continuation of Equity Awards(3) ($) | Continuation of Medical/Welfare Benefits(4) ($) | Total Termination Benefits ($) | ||||||||||
Ms. Turner | |||||||||||||||
Involuntary termination with cause or voluntary termination without good reason | — | — | — | — | — | ||||||||||
Death or disability | — | — | 665,668 | — | 665,668 | ||||||||||
Termination without cause | 750,000 | 178,100 | 420,195 | 30,659 | 1,378,954 | ||||||||||
Voluntary termination with good reason | 750,000 | 178,100 | 263,618 | 30,659 | 1,222,377 | ||||||||||
Termination after change in control | 750,000 | 375,000 | 892,998 | 30,659 | 2,048,657 | ||||||||||
Mr. Nixon | |||||||||||||||
Involuntary termination with cause or voluntary termination without good reason | — | — | — | — | — | ||||||||||
Death or disability | — | — | 538,496 | — | 538,496 | ||||||||||
Termination without cause | 706,000 | 268,100 | 208,035 | 35,171 | 1,217,306 | ||||||||||
Voluntary termination with good reason | 706,000 | 268,100 | 246,309 | 35,171 | 1,255,580 | ||||||||||
Termination after change in control | 706,000 | 353,000 | 739,674 | 35,171 | 1,833,845 | ||||||||||
Mr. Lunny | |||||||||||||||
Involuntary termination with cause or voluntary termination without good reason | — | — | — | — | — | ||||||||||
Death or disability | — | — | 402,153 | — | 402,153 | ||||||||||
Termination without cause | 600,000 | 212,000 | 159,776 | 45,250 | 1,017,026 | ||||||||||
Voluntary termination with good reason | 600,000 | 212,000 | 185,544 | 45,250 | 1,042,794 | ||||||||||
Termination after change in control | 600,000 | 300,000 | 559,438 | 45,250 | 1,504,688 | ||||||||||
Mr. Rush | |||||||||||||||
Involuntary termination with cause or voluntary termination without good reason | — | — | — | — | — | ||||||||||
Death or disability | — | — | 328,787 | — | 328,787 | ||||||||||
Termination without cause | 570,000 | 204,600 | 153,543 | 50,058 | 978,201 | ||||||||||
Voluntary termination with good reason | 570,000 | 204,600 | 123,087 | 50,058 | 947,745 | ||||||||||
Termination after change in control | 570,000 | 285,000 | 482,162 | 50,058 | 1,387,220 | ||||||||||
Mr. Tomae(5) | |||||||||||||||
Termination without cause | 686,000 | 268,800 | 46,750 | 38,893 | 1,040,443 | ||||||||||
(1) | The base salary paid upon termination under the applicable scenario is calculated as two times the 2016 base salary. |
(2) | The incentive paid upon termination under the applicable scenario is calculated as two times the average of the annual incentive paid for the immediately two preceding fiscal years (fiscal years 2015 and 2014), except in the case of termination due to a change in control, which is the greater of the average annual incentive paid for the immediately two preceding fiscal years or two times the annual incentive target. |
(3) | The amounts are calculated based on the closing price of $18.70 on December 30, 2016 under the applicable scenario. In the event of death or disability, the amount is calculated for full vesting of stock awards, the next tranche for option awards and a prorated amount for performance share awards pursuant to the LTIP Plan. In the event of voluntary termination with good reason, the amount is calculated for the next tranche of stock and option awards. The amount is calculated for the next tranche for January 22, 2016 stock and option awards and the next two tranches for August 15, 2016 stock and option awards in order to obtain at least 50% vesting as well as a prorated amount for performance share awards in the event of termination without cause pursuant to the LTIP Plan. In the case of termination related to a change in control, the amount is calculated for full vesting of all unvested awards. |
120
(4) | The cost of continued health and disability insurance coverage paid upon termination under the applicable scenario is calculated at the present value of 24 months of benefits. |
(5) | Mr. Tomae's employment with the Company terminated without cause effective January 29, 2016. The base salary, non-equity incentive plan and the continuation of health and disability insurance coverage reflects the actual payment and benefits received by Mr. Tomae upon his termination. The acceleration and continuation of equity awards amount is calculated based on the closing price of $18.70 on December 30, 2016. In accordance with the performance share awards pursuant to the LTIP Plan, Mr. Tomae's outstanding performance awards on his termination date were prorated to reflect the number of performance shares earned during the performance period while the remaining performance shares were forfeited on his termination date. |
Director Compensation
We use a combination of cash and stock-based incentive compensation to attract and retain qualified candidates to serve on our board of directors. In setting director compensation, we consider the significant amount of time that directors spend in fulfilling their duties to us as well as the skill level required by the members of our board of directors. Our employee director, Mr. Sunu, does not receive any compensation for serving on our board of directors.
2016 Compensation
Cash Compensation. With the exception of Mr. Gingold, who elected to forgo all compensation, our non-employee directors were paid the following cash fees in 2016: (i) an annual fee of $75,000 for serving as a non-employee director; (ii) a $40,000 annual cash retainer for serving as the chair of the board of directors; (iii) a $30,000 annual cash retainer for serving as the chair of the audit committee; (iv) a $20,000 annual cash retainer for serving as the chair of the compensation committee (prorated for a partial year's service in the case of Messrs. Horowitz and Treadwell), the corporate governance and nominating committee (prorated for a partial year's service in the case of Messrs. Treadwell and Horowitz) and the regulatory committee; and (v) annual committee member fees of $15,000 for serving on the audit committee (prorated for a partial year's service in the case of Mr. Mahoney) and $7,500 for serving on the compensation committee (prorated for a partial year's service in the case of Messrs. Horowitz, Mahoney and Treadwell). All annual fees were paid in quarterly installments.
Equity Compensation. Again, with the exception of Mr. Gingold, who elected to forgo all compensation, on January 22, 2016, each of our non-employee directors received an award of approximately $150,000 in the form of restricted stock and stock options under the LTIP Plan. These awards vested 100% on the first anniversary of the grant date, January 23, 2017.
Share Ownership Guidelines
Our directors are subject to share ownership guidelines to better align their interests with those of our shareholders by requiring directors to acquire and maintain meaningful equity positions in the Company. Under the guidelines, each director is required to own shares of our common stock with a value equal to at least three times their annual base cash retainer. Directors are required to meet these guidelines within the later of five years of the date of adoption of these guidelines (by June 3, 2018) or of such individual becoming subject to them. If a director does not meet the required ownership guidelines within the specified period, he may receive all of his future board compensation in equity until the goal is met.
No Hedging/No Pledging Provisions
Our insider trading policy prohibits the directors from using any strategies or products (such as derivative securities or short-selling techniques) to hedge against the potential changes in the value of our common stock, prohibits the holding of our securities in a margin account and prohibits any director from pledging our securities as collateral for a loan.
121
2016 Director Summary Compensation Table
Name | Fees Earned or Paid in Cash (1) ($) | Stock Awards (2) ($) | Option Awards (3) ($) | Total ($) | ||||||||
Peter D. Aquino | 90,000 | 105,012 | 44,992 | 240,004 | ||||||||
Dennis J. Austin | 90,000 | 105,012 | 44,992 | 240,004 | ||||||||
Peter C. Gingold (4) | — | — | — | — | ||||||||
Edward D. Horowitz | 138,750 | 105,012 | 44,992 | 288,754 | ||||||||
Michael J. Mahoney | 106,250 | 105,012 | 44,992 | 256,254 | ||||||||
Michael K. Robinson | 90,000 | 105,012 | 44,992 | 240,004 | ||||||||
David L. Treadwell | 98,750 | 105,012 | 44,992 | 248,754 | ||||||||
Wayne Wilson | 105,000 | 105,012 | 44,992 | 255,004 | ||||||||
(1) | See the discussion preceding this table for the general method used to determine each non-employee director's cash compensation. For fiscal 2016, the particular components paid as cash compensation in excess of each non-employee director's $75,000 annual retainer were as follows: Mr. Aquino ($15,000 as member of the audit committee); Mr. Austin ($15,000 as member of the audit committee); Mr. Horowitz ($40,000 as chair of the board of directors, $10,000 as chair of the corporate governance and nominating committee effective June 1, 2016, $10,000 as chair of the compensation committee through May 31, 2016 and $3,750 as member of the compensation committee effective June 1, 2016); Mr. Mahoney ($20,000 as chair of the regulatory committee, $7,500 as member of the audit committee through May 31, 2016 and $3,750 as member of the compensation committee effective June 1, 2016); Mr. Robinson ($15,000 as member of the audit committee); Mr. Treadwell ($10,000 as chair of the compensation committee effective June 1, 2016, $10,000 as chair of the corporate governance and nominating committee through May 31, 2016, and $3,750 as member of the compensation committee through May 31, 2016) and Mr. Wilson ($30,000 as chair of the audit committee). |
(2) | Reflects the grant date fair value based on the number of awards included in the grant and the fair value of the awards at the date of grant, as determined in accordance with the Compensation—Stock Compensation Topic of the ASC. This amount is equal to the number of shares of restricted stock issued multiplied by the market value of our common stock on the date of grant. On January 22, 2016, each director, with the exception of Mr. Gingold, was granted 7,105 shares of restricted stock with a market value of $14.78 per share that vested on January 23, 2017. |
(3) | Reflects the grant date fair value based on the number of awards included in the grant and the fair value of the awards at the date of grant, as determined in accordance with the Compensation—Stock Compensation Topic of the ASC. See note (1) to the Summary Compensation table for more information on the assumptions used. On January 22, 2016, each director, with the exception of Mr. Gingold, was granted 6,025 options with a grant date fair value of $7.47 per share that vested on January 23, 2017. |
(4) | Mr. Gingold waived the receipt of all compensation. |
Compensation Committee Interlocks and Insider Participation
The compensation committee of the board of directors for 2016 was comprised of Mr. Treadwell, Mr. Gingold, Mr. Horowitz and Mr. Mahoney (effective June 1, 2016). None of the members of the board of directors who sat on the compensation committee in 2016 was employed by us as an officer or employee during or prior to 2016 or had any interlocking relationships requiring disclosure under applicable rules and regulations. No executive officer of the Company served as a member of the compensation committee of another entity, one of whose executive officers served on our board of directors in 2016.
Compensation Committee Report*
The compensation committee of the board of directors oversees the executive compensation program for the Company's CEO and other executive officers, including those named in "Compensation Discussion and Analysis—2016 Summary Compensation Table" in this Annual Report. The executive officers named in that table are referred to collectively as the named executive officers (the "NEOs").
The compensation committee is generally responsible for strategic decisions relating to the overall compensation structure and program applicable to the Company's executives and senior management. The program currently includes: base salaries, cash-based annual incentive compensation and equity-based long-term incentives. The compensation committee, jointly with the corporate governance and nominating committee, is responsible for the compensation program of our non-employee directors, which program is currently comprised of cash fees and equity.
122
On behalf of the shareholders, the compensation committee has carefully monitored the Company's executive compensation program. We believe that the Compensation Discussion and Analysis contained in this Annual Report and the related tables that follow will show an executive compensation program that is designed to maximize long-term shareholder value and provide the NEOs with incentives for superior corporate and individual performance and encourage them to remain with the Company.
The compensation committee has reviewed and discussed the Compensation Discussion and Analysis with management, and, based on such review and discussions, recommended to the board of directors that it be included in this Annual Report.
Shareholders are invited to express their views to the board of directors regarding executive compensation as well as other matters as described in this Annual Report. See "Board of Directors and Committees of the Board of Directors—Policies Relating to our Board of Directors—Communications with Board of Directors" in this Annual Report.
Submitted by the compensation committee of the board of directors:
David L. Treadwell (Chair)
Edward D. Horowitz
Peter C. Gingold
Michael J. Mahoney
______________
* The material in this report shall not be deemed to be "soliciting material", or to be "filed" with the SEC or subject to the liabilities of Section 18 of the Exchange Act, and is not incorporated by reference in any filing of the Company under the Securities Act of 1933 or the Exchange Act, whether made before or after the date hereof and regardless of any general incorporation language in any such filing.
ITEM 12. SECURITY OWNERSHIP OF CERTAIN BENEFICIAL OWNERS AND MANAGEMENT AND RELATED STOCKHOLDER MATTERS
The information required by Item 201(d) of Regulation S-K is incorporated herein by reference to "Item 5. Market for Registrant's Common Equity, Related Stockholder Matters and Issuer Purchases of Equity Securities—Securities Authorized for Issuance under Equity Compensation Plans" included elsewhere in this Annual Report.
Security Ownership of Certain Beneficial Owners and Management
The following table sets forth information regarding beneficial ownership of our common stock as of February 27, 2017. The information (other than with respect to our current directors and executives) is based on a review of statements filed prior to February 27, 2017 with the SEC pursuant to Sections 13(d), 13(f), 13(g) and 16 of the Exchange Act with respect to our common stock. The following table includes beneficial ownership for:
• | each NEO; |
• | all other executive officers as a group; |
• | each director; |
• | all executive officers and directors as a group; and |
• | each person known to us to be the beneficial owner of 5% or more of the outstanding shares of our common stock based on such person's most recently filed Schedule 13D or Schedule 13G. |
The address of each director and executive officer listed is c/o FairPoint Communications, Inc., 521 East Morehead Street, Suite 500, Charlotte, NC 28202.
The amounts and percentages of common stock beneficially owned are reported on the basis of regulations of the SEC governing the determination of beneficial ownership of securities. Under the rules of the SEC, a person is deemed to be a "beneficial owner" of a security if that person has or shares "voting power", which includes the power to vote or to direct the voting of such security, or "investment power", which includes the power to dispose of or direct the disposition of such security. A person is also deemed to be a beneficial owner of any securities of which that person has a right to acquire beneficial ownership within 60 days. All persons listed have sole voting and investment power with respect to their shares unless otherwise indicated.
123
Common Stock Beneficially Owned (1) | ||||||
Name | Number | Percent of Class | ||||
Executive Officers and Directors: | ||||||
Paul H. Sunu (2) | 743,236 | 2.7 | % | |||
Karen D. Turner (3) | 61,730 | 0.2 | % | |||
Peter G. Nixon (4) | 199,642 | 0.7 | % | |||
John J. Lunny (5) | 81,605 | 0.3 | % | |||
Steven G. Rush (6) | 82,919 | 0.3 | % | |||
Ajay Sabherwal (7) | 69,355 | 0.3 | % | |||
Anthony A. Tomae (8) | 49,608 | 0.2 | % | |||
Other executive officers as a group (2 persons) (9) | 60,259 | 0.2 | % | |||
Peter D. Aquino (10) | 42,952 | 0.2 | % | |||
Dennis J. Austin (11) | 106,798 | 0.4 | % | |||
Peter C. Gingold (12) | — | — | ||||
Edward D. Horowitz (13) | 117,298 | 0.4 | % | |||
Michael J. Mahoney (14) | 104,798 | 0.4 | % | |||
Michael K. Robinson (15) | 104,798 | 0.4 | % | |||
David L. Treadwell (16) | 123,798 | 0.5 | % | |||
Wayne Wilson (17) | 104,798 | 0.4 | % | |||
All current executive officers and directors as a group (15 persons) (18) | 1,934,631 | 7.1 | % | |||
5% Shareholders: | ||||||
Angelo, Gordon & Co., L.P. (19) | 5,128,325 | 18.8 | % | |||
The Vanguard Group (20) | 2,312,969 | 8.5 | % | |||
Maglan Capital LP (21) | 2,062,812 | 7.6 | % | |||
BlackRock, Inc. (22) | 1,594,606 | 5.8 | % | |||
Renaissance Technologies LLC (23) | 1,477,800 | 5.4 | % | |||
Vanguard World Funds (24) | 1,426,565 | 5.2 | % | |||
(1) | Unless otherwise indicated below, the persons and entities named in the table have sole voting and sole investment power with respect to all shares beneficially owned by them, subject to community property laws where applicable. The percentage of beneficial ownership is based on 27,266,570 shares of our common stock outstanding as of February 27, 2017. |
(2) | With respect to shares Mr. Sunu beneficially owned: (i) includes 427,750 shares of our common stock issuable upon exercise of stock options that are either currently exercisable or become exercisable during the next 60 days, (ii) includes 43,000 shares of restricted stock awarded under the LTIP Plan and (iii) includes 272,486 shares of common stock. |
(3) | With respect to shares Ms. Turner beneficially owned: (i) includes 21,025 shares of our common stock issuable upon exercise of stock options that are either currently exercisable or become exercisable during the next 60 days, (ii) includes 28,583 shares of restricted stock awarded under the LTIP Plan and (iii) includes 12,122 shares of common stock. |
(4) | With respect to shares Mr. Nixon beneficially owned: (i) includes 120,130 shares of our common stock issuable upon exercise of stock options that are either currently exercisable or become exercisable during the next 60 days, (ii) includes 13,625 shares of restricted stock awarded under the LTIP Plan and (iii) includes 65,887 shares of common stock. |
(5) | With respect to shares Mr. Lunny beneficially owned: (i) includes 43,350 shares of our common stock issuable upon exercise of stock options that are either currently exercisable or become exercisable during the next 60 days, (ii) includes 11,250 shares of restricted stock awarded under the LTIP Plan and (iii) includes 27,005 shares of common stock. |
(6) | With respect to shares Mr. Rush beneficially owned: (i) includes 63,075 shares of our common stock issuable upon exercise of stock options that are either currently exercisable or become exercisable during the next 60 days, (ii) includes 11,000 shares of restricted stock awarded under the LTIP Plan and (iii) includes 8,844 shares of common stock. |
(7) | Mr. Sabherwal resigned his employment with the Company effective August 3, 2016. With respect to shares beneficially owned, includes 69,355 shares of common stock as of his termination date, the latest date for which information is available to the Company. |
124
(8) | Mr. Tomae’s employment with the Company terminated without cause effective January 29, 2016. With respect to shares beneficially owned, includes 49,608 shares of common stock as of his termination date, the latest date for which information is available to the Company. |
(9) | With respect to shares beneficially owned: (i) includes 37,850 shares of our common stock issuable upon exercise of stock options that are either currently exercisable or become exercisable during the next 60 days, (ii) includes 21,000 shares of restricted stock awarded under the LTIP Plan and (iii) includes 1,409 shares of common stock. |
(10) | With respect to shares Mr. Aquino beneficially owned: (i) includes 15,842 shares of our common stock issuable upon exercise of stock options that are either currently exercisable or become exercisable during the next 60 days, (ii) includes 7,500 shares of restricted stock awarded under the LTIP Plan and (iii) includes 19,610 shares of common stock. |
(11) | With respect to shares Mr. Austin beneficially owned: (i) includes 47,643 shares of our common stock issuable upon exercise of stock options that are either currently exercisable or become exercisable during the next 60 days, (ii) includes 7,500 shares of restricted stock awarded under the LTIP Plan and (iii) includes 51,655 shares of common stock. |
(12) | Mr. Gingold has elected to waive all compensation and otherwise owns no shares of common stock. |
(13) | With respect to shares Mr. Horowitz beneficially owned: (i) includes 47,643 shares of our common stock issuable upon exercise of stock options that are either currently exercisable or become exercisable during the next 60 days, (ii) includes 7,500 shares of restricted stock awarded under the LTIP Plan and (iii) includes 62,155 shares of common stock. |
(14) | With respect to shares Mr. Mahoney beneficially owned: (i) includes 47,643 shares of our common stock issuable upon exercise of stock options that are either currently exercisable or become exercisable during the next 60 days, (ii) includes 7,500 shares of restricted stock awarded under the LTIP Plan and (iii) includes 49,655 shares of common stock. |
(15) | With respect to shares Mr. Robinson beneficially owned: (i) includes 47,643 shares of our common stock issuable upon exercise of stock options that are either currently exercisable or become exercisable during the next 60 days, (ii) includes 7,500 shares of restricted stock awarded under the LTIP Plan and (iii) includes 49,655 shares of common stock. |
(16) | With respect to shares Mr. Treadwell beneficially owned: (i) includes 47,643 shares of our common stock issuable upon exercise of stock options that are either currently exercisable or become exercisable during the next 60 days, (ii) includes 7,500 shares of restricted stock awarded under the LTIP Plan and (iii) includes 68,655 shares of common stock. |
(17) | With respect to shares Mr. Wilson beneficially owned: (i) includes 47,643 shares of our common stock issuable upon exercise of stock options that are either currently exercisable or become exercisable during the next 60 days, (ii) includes 7,500 shares of restricted stock awarded under the LTIP Plan and (iii) includes 49,655 shares of common stock. |
(18) | With respect to shares beneficially owned: (i) includes 1,014,880 shares of our common stock issuable upon exercise of stock options that are either currently exercisable or become exercisable during the next 60 days, (ii) includes 180,958 shares of restricted stock awarded under the LTIP Plan and (iii) includes 738,793 shares of common stock. Does not include shares beneficially owned by Mr. Sabherwal or Mr. Tomae because they are no longer current executive officers. |
(19) | Based solely on information contained in the Schedule 13D filed with the SEC on May 20, 2011 by Angelo, Gordon & Co., L.P. (address: 245 Park Avenue, 26th Floor, New York, New York 10167) and the number of outstanding shares of our common stock on February 27, 2017. The Angelo, Gordon & Co., L.P. Schedule 13D reported sole voting power and sole dispositive power of 5,128,325 shares. |
(20) | Based solely on information contained in the Schedule 13G filed on February 10, 2017 with the SEC as of December 31, 2016 by The Vanguard Group (address: 100 Vanguard Boulevard, Malvern, Pennsylvania 19355) and the number of outstanding shares of our common stock on February 27, 2017. The Vanguard Group Schedule 13G reported an aggregate amount beneficially owned by each reporting person of 2,312,969 shares. |
(21) | Based solely on information contained in the Schedule 13G filed on December 5, 2016 with the SEC as of December 5, 2016 by Maglan Capital LP (address: 25 West 39th Street, 2nd Floor, New York, New York 10018) and the number of outstanding shares of our common stock on February 27, 2017. The Maglan Capital LP Schedule 13G reported shared voting power and shared dispositive power of 2,062,812 shares. |
(22) | Based solely on information contained in the Schedule 13G filed on January 30, 2017 with the SEC as of December 31, 2016 by BlackRock, Inc. (address: 55 East 52nd Street, New York, New York 10055) and the number of outstanding shares of our common stock on February 27, 2017. The BlackRock, Inc. Schedule 13G reported an aggregate amount beneficially owned by each reporting person of 1,594,606 shares. |
(23) | Based solely on information contained in the Schedule 13G filed on February 14, 2017 with the SEC as of December 15, 2016 by Renaissance Technologies LLC (address: 800 Third Avenue, New York, New York 10022) and the number |
125
of outstanding shares of our common stock on February 27, 2017. The Renaissance Technologies LLC Schedule 13G reported an aggregate amount beneficially owned by each reporting person of 1,477,800 shares.
(24) | Based solely on information contained in the Schedule 13G filed on February 13, 2017 with the SEC as of December 31, 2016 by Vanguard World Funds (address: 100 Vanguard Boulevard, Malvern, Pennsylvania 19355) and the number of outstanding shares of our common stock on February 27, 2017. The Vanguard World Funds Schedule 13G reported sole voting power of 1,426,565 shares. |
ITEM 13. CERTAIN RELATIONSHIPS AND RELATED TRANSACTIONS, AND DIRECTOR INDEPENDENCE
Certain Relationships and Related Transactions
Our code of business conduct and ethics, which is posted on our website at www.fairpoint.com, prohibits directors and executive officers from engaging in transactions on behalf of us with a family member or with a company with which they are or their family member is a significant owner or associated or employed in a significant role. Our audit committee must review and approve in advance all material related party transactions or business or professional relationships. All instances involving potential related party transactions or business or professional relationships must be reported to our legal department which will assess the materiality of the transaction or relationship and elevate the matter to the audit committee as appropriate. Any dealings with a related party must be conducted in such a way as to avoid preferential treatment and assure that the terms obtained by us are no less favorable than could be obtained from unrelated parties on an arm's-length basis. Directors and officers are not permitted to enter into, develop or continue any such material transaction or relationship without obtaining prior approval from the audit committee.
Michael K. Robinson, a member of our board of directors, serves as the CEO of Broadview. From time to time, Broadview purchases services from us in the ordinary course of business. In 2016, we provided wholesale services, specifically the resale of access on our network and unbundled network elements, as well as full end-to-end circuit platforms, to Broadview, totaling approximately $1.0 million in the aggregate. This amount is less than 1% of Broadview's gross revenue for 2016. Such services were provided on an arm's-length basis.
Director Independence
The board of directors considered transactions and relationships between each director or any member of his or her immediate family and the Company and its subsidiaries and affiliates. Our board of directors has determined that, other than Paul H. Sunu, all of our directors are independent under the criteria for independence set forth in the listing standards of the Nasdaq and accordingly are independent directors with no material relationship to us other than being a director or shareholder of FairPoint. Therefore, we satisfy the Nasdaq requirement that a majority of our board of directors be comprised of independent directors.
ITEM 14. PRINCIPAL ACCOUNTING FEES AND SERVICES
The following table sets forth the aggregate fees paid or payable relating to services rendered for our fiscal years ended December 31, 2016 and 2015:
Year Ended December 31, 2016 | Year Ended December 31, 2015 | |||||||
Audit Fees (1) | $ | 1,070,000 | $ | 1,985,000 | ||||
Audit-related Fees (2) | — | 135,000 | ||||||
All Other Fees (3) | — | 2,000 | ||||||
Total | $ | 1,070,000 | $ | 2,122,000 | ||||
(1) | Audit fees include amounts related to annual financial statement audit work and quarterly financial statement reviews. These amounts also include the review of documents filed with the SEC, accounting consultations related to the annual audit and preparation of letters for underwriters and other requesting parties as well as fees associated with the joint proxy statement/prospectus in connection with the Merger. |
(2) | Audit-related fees consist of amounts related to the Statement on Standards for Attestation Engagements No. 16 examination of our data center colocation services. |
(3) | All Other Fees consist of amounts billed to us related to an online research tool for 2015. |
126
Audit Committee Pre-Approval Policy
In accordance with our audit committee pre-approval policy, all audit and non-audit services performed for us by our independent accountants were pre-approved by our audit committee.
Our audit committee's pre-approval policy provides that our independent registered public accounting firm shall not provide services that have the potential to impair or appear to impair the independence of the audit role. The pre-approval policy requires our independent registered public accounting firm to provide an annual engagement letter to our audit committee outlining the scope of the audit services proposed to be performed during the fiscal year. Upon the audit committee's acceptance of and agreement with such engagement letter, the services within the scope of the proposed audit services shall be deemed pre-approved pursuant to the policy.
The pre-approval policy provides for categorical pre-approval of specified audit and permissible non-audit services and requires the specific pre-approval by the audit committee, prior to engagement, of such services, other than audit services covered by the annual engagement letter. In addition, services to be provided by our independent registered public accounting firm that are not within the category of pre-approved services must be approved by the audit committee prior to engagement, regardless of the service being requested or the dollar amount involved.
Requests or applications for services that require specific separate approval by the audit committee are required to be submitted to the audit committee by both management and the independent registered public accounting firm and must include a detailed description of the services to be provided and a joint statement confirming that the provision of the proposed services does not impair the independence of the independent registered public accounting firm.
The audit committee may delegate pre-approval authority to one or more of its members. The member or members to whom such authority is delegated shall report any pre-approval decisions to the audit committee at its next scheduled meeting. The audit committee is prohibited from delegating to management its responsibilities to pre-approve services to be performed by our independent registered public accounting firm.
127
PART IV
ITEM 15. EXHIBITS, FINANCIAL STATEMENT SCHEDULES
(a) Financial Statements
The financial statements filed as part of this Annual Report are listed in the index to the financial statements under "Item 8. Financial Statements and Supplementary Data" included elsewhere in this Annual Report, which index to the financial statements is incorporated herein by reference.
(b) Exhibits
The exhibits filed as part of this Annual Report are listed in the index to exhibits found hereafter, which index to exhibits is incorporated herein by reference.
ITEM 16. FORM 10-K SUMMARY
None.
128
SIGNATURES
Pursuant to the requirements of Section 13 or 15(d) of the Securities Exchange Act of 1934, the registrant has duly caused this report to be signed on its behalf by the undersigned, thereunto duly authorized.
FAIRPOINT COMMUNICATIONS, INC. | |||
By: | /s/ Paul H. Sunu | Date: | March 6, 2017 |
Paul H. Sunu, Chief Executive Officer and Director | |||
Pursuant to the requirements of the Securities Exchange Act of 1934, this report has been signed below by the following persons on behalf of the registrant and in the capacities and on the dates indicated.
By: | /s/ Paul H. Sunu | Date: | March 6, 2017 |
Paul H. Sunu, Chief Executive Officer and Director | |||
(Principal Executive Officer) | |||
By: | /s/ Karen D. Turner | Date: | March 6, 2017 |
Karen D. Turner, Executive Vice President and Chief Financial Officer | |||
(Principal Financial Officer) | |||
By: | /s/ John T. Hogshire | Date: | March 6, 2017 |
John T. Hogshire, Senior Vice President and Controller | |||
(Principal Accounting Officer) | |||
By: | /s/ Peter D. Aquino | Date: | March 6, 2017 |
Peter D. Aquino, Director | |||
By: | /s/ Dennis J. Austin | Date: | March 6, 2017 |
Dennis J. Austin, Director | |||
By: | /s/ Peter C. Gingold | Date: | March 6, 2017 |
Peter C. Gingold, Director | |||
By: | /s/ Edward D. Horowitz | Date: | March 6, 2017 |
Edward D. Horowitz, Chairman of the Board of Directors | |||
By: | /s/ Michael J. Mahoney | Date: | March 6, 2017 |
Michael J. Mahoney, Director | |||
By: | /s/ Michael K. Robinson | Date: | March 6, 2017 |
Michael K. Robinson, Director | |||
By: | /s/ David L. Treadwell | Date: | March 6, 2017 |
David L. Treadwell, Director | |||
By: | /s/ Wayne Wilson | Date: | March 6, 2017 |
Wayne Wilson, Director | |||
129
Exhibit Index
Exhibit No. | Description | |
2.1 | Third Amended Joint Plan of Reorganization Under chapter 11 of title 11 of the United States Code.(1) | |
2.2 | Agreement and Plan of Merger, dated as of December 3, 2016, by and among Consolidated Communications Holdings, Inc., FairPoint Communications, Inc. and Falcon Merger Sub, Inc. (19) ** | |
2.3 | First Amendment to Agreement and Plan of Merger, dated as of January 20, 2017, by and among Consolidated Communications Holdings, Inc., FairPoint Communications, Inc. and Falcon Merger Sub, Inc. * | |
3.1 | Ninth Amended and Restated Certificate of Incorporation of FairPoint.(2) | |
3.2 | Second Amended and Restated By-Laws of FairPoint.(2) | |
4.1 | Warrant Agreement, dated as of January 24, 2011, by and between FairPoint and The Bank of New York Mellon.(3) | |
4.2 | Specimen Stock Certificate.(2) | |
4.3 | Specimen Warrant Certificate.(3) | |
4.4 | Indenture, dated as of February 14, 2013, among FairPoint, the subsidiary guarantors party thereto, U.S. Bank National Association, as trustee, and U.S. Bank National Association, as collateral agent.(7) | |
4.5 | First Supplemental Indenture, dated as of September 16, 2013, among FairPoint, the subsidiary guarantors party thereto and U.S. Bank National Association, as trustee.(10) | |
10.1 | Security Agreement, dated as of February 14, 2013, among FairPoint, the subsidiary guarantors party thereto and U.S. Bank National Association, as collateral agent.(7) | |
10.2 | Pledge Agreement, dated as of February 14, 2013, among FairPoint, the subsidiary guarantors party thereto and U.S. Bank National Association, as collateral agent.(7) | |
10.3 | Credit Agreement, dated as of February 14, 2013, among FairPoint, the lenders party thereto from time to time and Morgan Stanley Senior Funding, Inc., as administrative agent and letter of credit issuer.(7) | |
10.4 | Pledge Agreement, dated as of February 14, 2013, made by FairPoint and the subsidiary guarantors party thereto in favor of Morgan Stanley Senior Funding, Inc., as administrative agent.(7) | |
10.5 | Security Agreement, dated as of February 14, 2013, among FairPoint, the subsidiary guarantors party thereto and Morgan Stanley Senior Funding, Inc., as administrative agent.(7) | |
10.6 | Continuing Guaranty, dated as of February 14, 2013, made by the subsidiary guarantors party thereto in favor of Morgan Stanley Senior Funding, Inc., as administrative agent.(7) | |
10.7 | Registration Rights Agreement, dated as of January 24, 2011, by and between FairPoint Communications, Inc. and Angelo, Gordon & Co., L.P.(3) | |
10.8 | FairPoint Litigation Trust Agreement, dated as of January 24, 2011.(3) | |
10.9 | Form of Director Indemnity Agreement.(4) | |
10.10 | Amended and Restated Employment Agreement, dated as of April 9, 2013, by and between FairPoint and Paul H. Sunu.†(9) | |
10.11 | First Amendment to April 9, 2013 Amended and Restated Employment Agreement, effective as of August 14, 2015, by and between FairPoint and Paul H. Sunu.†(15) | |
10.12 | Employment Agreement, made and entered into as of January 22, 2013, by and between FairPoint and Ajay Sabherwal.†(8) | |
10.13 | First Amendment to January 22, 2013 Employment Agreement, effective as of August 14, 2015, by and between FairPoint and Ajay Sabherwal.†(15) | |
10.14 | Second Amendment to January 22, 2013 Employment Agreement, effective as of May 16, 2016, by and between FairPoint and Ajay Sabherwal.†(17) | |
130
Exhibit No. | Description | |
10.15 | Employment Agreement, made and entered into as of January 22, 2013, by and between FairPoint and Shirley J. Linn.†(8) | |
10.16 | First Amendment to January 22, 2013 Employment Agreement, effective as of August 14, 2015, by and between FairPoint and Shirley J. Linn.†(15) | |
10.17 | Employment Agreement, made and entered into as of January 22, 2013, by and between FairPoint and Peter G. Nixon.†(8) | |
10.18 | First Amendment to January 22, 2013 Employment Agreement, effective as of August 14, 2015, by and between FairPoint and Peter G. Nixon.†(15) | |
10.19 | Second Amendment to January 22, 2013 Employment Agreement, effective as of May 16, 2016, by and between FairPoint and Peter G. Nixon.†(17) | |
10.20 | Employment Agreement, made and entered into as of November 15, 2012, by and between FairPoint and Anthony A. Tomae.†(8) | |
10.21 | First Amendment to November 15, 2012 Employment Agreement, effective as of August 14, 2015, by and between FairPoint and Anthony A. Tomae.†(15) | |
10.22 | Employment Agreement, made and entered into as of July 1, 2014, by and between FairPoint and John J. Lunny.†(12) | |
10.23 | First Amendment to July 1, 2014 Employment Agreement, effective as of August 14, 2015, by and between FairPoint and John J. Lunny.†(15) | |
10.24 | Second Amendment to July 1, 2014 Employment Agreement, effective as of November 21, 2016, by and between FairPoint and John J. Lunny.†* | |
10.25 | Employment Agreement, made and entered into as of November 20, 2014, by and between FairPoint and Karen D. Turner.†(13) | |
10.26 | First Amendment to November 20, 2014 Employment Agreement, effective as of August 14, 2015, by and between FairPoint and Karen D. Turner.†(15) | |
10.27 | Second Amendment to November 20, 2014 Employment Agreement, effective as of November 21, 2016, by and between FairPoint and Karen D. Turner.†* | |
10.28 | Employment Agreement, made and entered into as of August 10, 2015, by and between FairPoint and Steven G. Rush.†(15) | |
10.29 | First Amendment to August 10, 2015 Employment Agreement, effective as of June 1, 2016, by and between FairPoint and Steven G. Rush.†(17) | |
10.30 | Employment Agreement, made and entered into as of September 6, 2016, by and between FairPoint and Bruce F. Metge.†(18) | |
10.31 | FairPoint Communications, Inc. Amended and Restated 2010 Long Term Incentive Plan.†(11) | |
10.32 | Form of Non-Incentive Stock Option Award Agreement for directors relating to the FairPoint Communications, Inc. Amended and Restated 2010 Long Term Incentive Plan.†(11) | |
10.33 | Form of Restricted Share Award Agreement for directors relating to the FairPoint Communications, Inc. Amended and Restated 2010 Long Term Incentive Plan.†(11) | |
10.34 | Form of Stock Option Award Agreement for employees relating to the FairPoint Communications, Inc. Amended and Restated 2010 Long Term Incentive Plan.†(11) | |
10.35 | Form of Restricted Share Award Agreement for employees relating to the FairPoint Communications, Inc. Amended and Restated 2010 Long Term Incentive Plan.†(11) | |
10.36 | Form of FairPoint Communications, Inc. Performance Share Award Agreement for Performance Period Beginning January 1, 2015 for employees relating to the FairPoint Communications, Inc. Amended and Restated 2010 Long Term Incentive Plan.†(14) | |
10.37 | Form of FairPoint Communications, Inc. Performance Share Award Agreement for Performance Period Beginning January 1, 2016 for employees relating to the FairPoint Communications, Inc. Amended and Restated 2010 Long Term Incentive Plan.†(16) | |
131
Exhibit No. | Description | |
10.38 | FairPoint Communications, Inc. Incentive Recoupment Policy.†(6) | |
10.39 | Form of FairPoint Communications, Inc. Severance in Connection With a Change in Control Agreement for certain employees, effective as of November 5, 2015.†(16) | |
10.40 | Form of First Amendment to November 5, 2015 Severance in Connection With a Change in Control Agreement for certain employees, effective as of January 11, 2017.†* | |
11 | Statement Regarding Computation of Per Share Earnings (included in the financial statements contained in this Annual Report). | |
14.1 | FairPoint Code of Business Conduct and Ethics, as revised November 6, 2015.(16) | |
14.2 | FairPoint Code of Ethics for Financial Professionals.(5) | |
21 | Subsidiaries of FairPoint.* | |
23.1 | Consent of BDO USA, LLP.* | |
23.2 | Consent of Ernst & Young LLP.* | |
31.1 | Certification as adopted pursuant to Section 302 of the Sarbanes-Oxley Act of 2002.* | |
31.2 | Certification as adopted pursuant to Section 302 of the Sarbanes-Oxley Act of 2002.* | |
32.1 | Certification required by 18 United States Code Section 1350, as adopted pursuant to Section 906 of the Sarbanes-Oxley Act of 2002.‡ | |
32.2 | Certification required by 18 United States Code Section 1350, as adopted pursuant to Section 906 of the Sarbanes-Oxley Act of 2002.‡ | |
99.1 | Order, dated January 13, 2011, Confirming Debtors' Third Amended Joint Plan of Reorganization Under chapter 11 of title 11 of the United States Code, dated as of December 29, 2010.(1) | |
99.2 | FairPoint Insider Trading Policy, as revised October 30, 2014.(13) | |
101.INS | XBRL Instance Document.* | |
101.SCH | XBRL Taxonomy Extension Schema Document.* | |
101.CAL | XBRL Taxonomy Extension Calculation Linkbase Document.* | |
101.DEF | XBRL Taxonomy Extension Definition Linkbase Document.* | |
101.LAB | XBRL Taxonomy Extension Label Linkbase Document.* | |
101.PRE | XBRL Taxonomy Extension Presentation Linkbase Document.* | |
* | Filed herewith. |
** | Pursuant to Item 601(b)(2) of Regulation S-K, the schedules to the Merger Agreement (identified therein) have been omitted from this Report and will be furnished supplementally to the SEC upon request. |
† | Indicates a management contract or compensatory plan or arrangement. |
‡ | Pursuant to SEC Release No. 33-8238, this certification will be treated as "accompanying" this Annual Report on Form 10-K and not "filed" as part of such report for purposes of Section 18 of the Exchange Act, or otherwise subject to the liability of Section 18 of the Exchange Act and this certification will not be deemed to be incorporated by reference into any filing under the Securities Act or the Exchange Act, except to the extent that the registrant specifically incorporates it by reference. |
(1) | Incorporated by reference to the Current Report on Form 8-K of FairPoint filed on January 14, 2011. |
(2) | Incorporated by reference to the Registration Statement on Form 8-A of FairPoint filed on January 24, 2011. |
(3) | Incorporated by reference to the Current Report on Form 8-K of FairPoint filed on January 25, 2011, Film Number 11544980. |
(4) | Incorporated by reference to the Current Report on Form 8-K of FairPoint filed on January 25, 2011, Film Number 11544991. |
(5) | Incorporated by reference to the Annual Report on Form 10-K of FairPoint for the year ended December 31, 2004. |
(6) | Incorporated by reference to the Quarterly Report on Form 10-Q of FairPoint for the period ended March 31, |
132
2012.
(7) | Incorporated by reference to the Current Report on Form 8-K of FairPoint filed on February 14, 2013. |
(8) | Incorporated by reference to the Annual Report on Form 10-K of FairPoint for the year ended December 31, 2012. |
(9) | Incorporated by reference to the Quarterly Report on Form 10-Q of FairPoint for the period ended March 31, 2013. |
(10) | Incorporated by reference to the Quarterly Report on Form 10-Q of FairPoint for the period ended September 30, 2013. |
(11) | Incorporated by reference to the Current Report on Form 8-K of FairPoint filed on May 12, 2014. |
(12) | Incorporated by reference to the Quarterly Report on Form 10-Q of FairPoint for the period ended June 30, 2014. |
(13) | Incorporated by reference to the Annual Report on Form 10-K of FairPoint for the year ended December 31, 2014. |
(14) | Incorporated by reference to the Quarterly Report on Form 10-Q of FairPoint for the period ended March 31, 2015. |
(15) | Incorporated by reference to the Quarterly Report on Form 10-Q of FairPoint for the period ended September 30, 2015. |
(16) | Incorporated by reference to the Annual Report on Form 10-K of FairPoint for the year ended December 31, 2015. |
(17) | Incorporated by reference to the Quarterly Report on Form 10-Q of FairPoint for the period ended June 30, 2016. |
(18) | Incorporated by reference to the Quarterly Report on Form 10-Q of FairPoint for the period ended September 30, 2016. |
(19) | Incorporated by reference to the Current Report on Form 8-K of FairPoint filed on December 5, 2016. |
133