Attached files
| file | filename |
|---|---|
| 8-K - FORM 8-K - SLM Corp | w81493e8vk.htm |
Exhibit
99.1
| SLM Corporation ASF Investor Discussions February 2011 |
| Forward-Looking Statements The following information is current as of February 7, 2011 and should be read in connection with SLM Corporation's press release for fourth quarter 2010 earnings, dated January 19, 2011, and more detailed information contained in the Company's 2009 Annual Report on Form 10-K (the "2009 Form 10-K"). Our actual results may differ materially from those included in these forward-looking statements due to a variety of factors including, but not limited to, those described in our 2009 Form 10-K in "Part I -Item 1A. Risk Factors" and in our quarterly reports on Form 10-Q in "Part II - Item 1A. Risk Factors."This Presentation contains forward-looking statements and information based on management's current expectations as of the date of this presentation. Statements that are not historical facts, including statements about our beliefs or expectations and statements that assume or are dependent upon future events, are forward-looking statements. Forward- looking statements are subject to risks, uncertainties, assumptions and other factors that may cause actual results to be materially different from those reflected in such forward-looking statements. These factors include, among others, increases in financing costs; limits on liquidity; any adverse outcomes in any significant litigation to which we are a party; our derivative counterparties terminating their positions with the Company if permitted by their contracts and the Company substantially incurring additional costs to replace any terminated positions; and changes in the terms of student loans and the educational credit marketplace (including changes resulting from new laws and the implementation of existing laws). The Company could be affected by: changes in or the termination of various liquidity programs implemented by the federal government; changes in the demand for educational financing or in financing preferences of lenders, educational institutions, students and their families; changes in the composition of our Managed FFELP and Private Education Loan portfolios; changes in the general interest rate environment, including the rate relationships among relevant money-market instruments, and in the securitization markets, which may increase the costs or limit the availability of financings necessary to initiate, purchase or carry education loans; changes in projections of losses from loan defaults; changes in general economic conditions; changes in prepayment rates and credit spreads; and changes in the demand for debt management services. The preparation of our consolidated financial statements also requires management to make certain estimates and assumptions including estimates and assumptions about future events. These estimates or assumptions may prove to be incorrect. All forward-looking statements contained in this Presentation are qualified by these cautionary statements and are made only as of the date of this Presentation. The Company does not undertake any obligation to update or revise these forward-looking statements to conform the statement to actual results or changes in the Company's expectations. 2 |
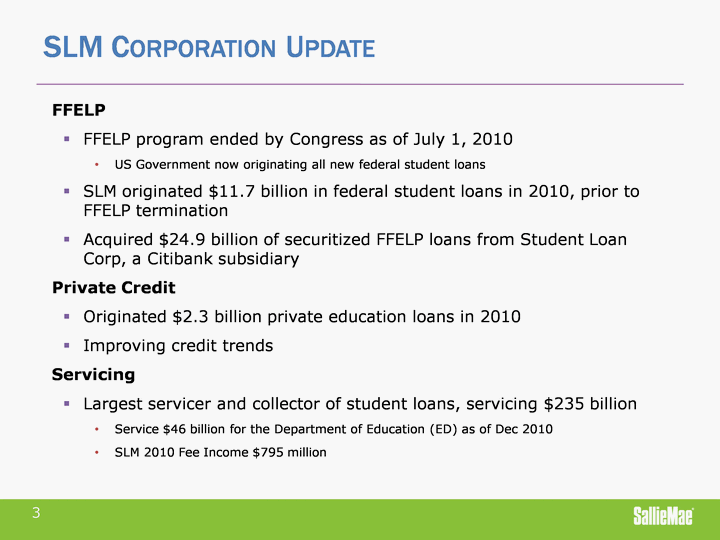
| SLM Corporation Update FFELP FFELP program ended by Congress as of July 1, 2010 US Government now originating all new federal student loans SLM originated $11.7 billion in federal student loans in 2010, prior to FFELP termination Acquired $24.9 billion of securitized FFELP loans from Student Loan Corp, a Citibank subsidiary Private Credit Originated $2.3 billion private education loans in 2010 Improving credit trends Servicing Largest servicer and collector of student loans, servicing $235 billion Service $46 billion for the Department of Education (ED) as of Dec 2010 SLM 2010 Fee Income $795 million 3 |
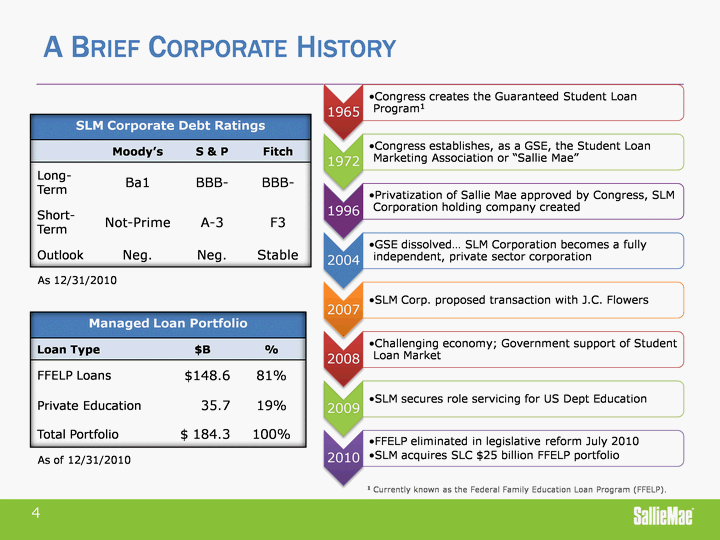
| A Brief Corporate History 1 Currently known as the Federal Family Education Loan Program (FFELP). SLM Corporate Debt Ratings SLM Corporate Debt Ratings SLM Corporate Debt Ratings SLM Corporate Debt Ratings Moody's S & P Fitch Long-Term Ba1 BBB- BBB- Short-Term Not-Prime A-3 F3 Outlook Neg. Neg. Stable Managed Loan Portfolio Managed Loan Portfolio Managed Loan Portfolio Loan Type $B % FFELP Loans $148.6 81% Private Education 35.7 19% Total Portfolio $ 184.3 100% As 12/31/2010 As of 12/31/2010 4 |
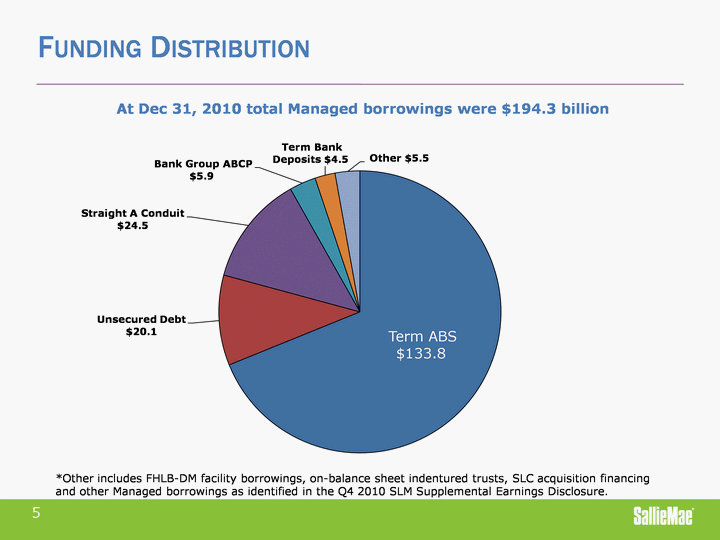
| Funding Distribution At Dec 31, 2010 total Managed borrowings were $194.3 billion 5 (CHART) *Other includes FHLB-DM facility borrowings, on-balance sheet indentured trusts, SLC acquisition financing and other Managed borrowings as identified in the Q4 2010 SLM Supplemental Earnings Disclosure. |
| 6 2010 SLM Capital Markets Summary Issued $2 billion of FFELP ABS Issued $4.1 billion of Private Credit ABS Issued $1.5 billion of unsecured notes On January 11, 2011 we issued a $2 billion unsecured corporate bond On January 14, 2011 we expanded and extended our ABCP facility Bank Group ABCP borrowings reduced to $5.9 billion |
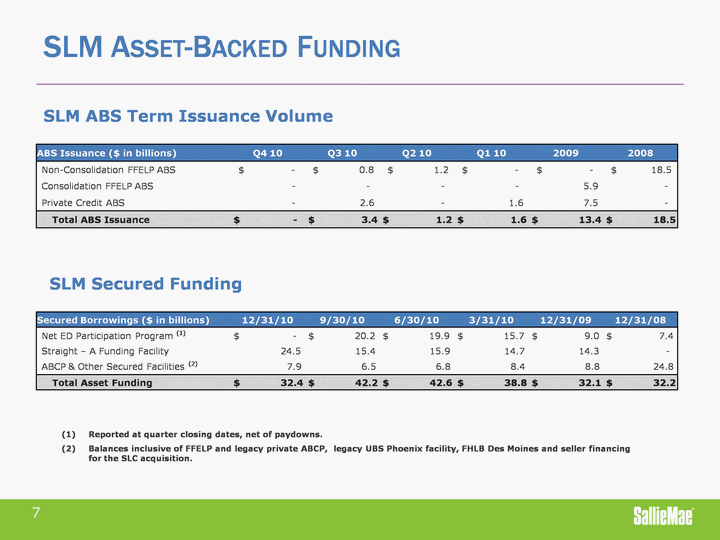
| SLM Asset-Backed Funding SLM ABS Term Issuance Volume Reported at quarter closing dates, net of paydowns. Balances inclusive of FFELP and legacy private ABCP, legacy UBS Phoenix facility, FHLB Des Moines and seller financing for the SLC acquisition. 7 SLM Secured Funding ABS Issuance ($ in billions) Q4 10 Q3 10 Q2 10 Q1 10 2009 2008 Non-Consolidation FFELP ABS $ - $ 0.8 $ 1.2 $ - $ - $ 18.5 Consolidation FFELP ABS - - - - 5.9 - Private Credit ABS - 2.6 - 1.6 7.5 - Total ABS Issuance $ - $ 3.4 $ 1.2 $ 1.6 $ 13.4 $ 18.5 Secured Borrowings ($ in billions) 12/31/10 9/30/10 6/30/10 3/31/10 12/31/09 12/31/08 Net ED Participation Program (1) $ - $ 20.2 $ 19.9 $ 15.7 $ 9.0 $ 7.4 Straight - A Funding Facility 24.5 15.4 15.9 14.7 14.3 - ABCP & Other Secured Facilities (2) 7.9 6.5 6.8 8.4 8.8 24.8 Total Asset Funding $ 32.4 $ 42.2 $ 42.6 $ 38.8 $ 32.1 $ 32.2 |
| SLM FFELP Student loan ABS |
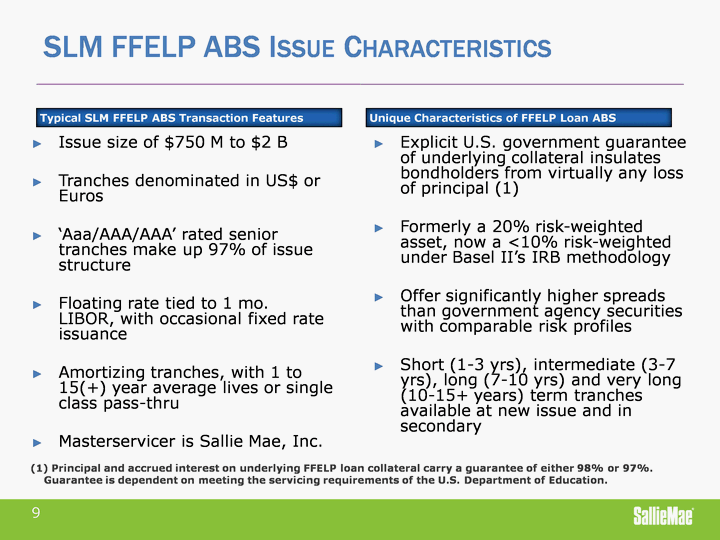
| SLM FFELP ABS Issue Characteristics Issue size of $750 M to $2 B Tranches denominated in US$ or Euros 'Aaa/AAA/AAA' rated senior tranches make up 97% of issue structure Floating rate tied to 1 mo. LIBOR, with occasional fixed rate issuance Amortizing tranches, with 1 to 15(+) year average lives or single class pass-thru Masterservicer is Sallie Mae, Inc. Explicit U.S. government guarantee of underlying collateral insulates bondholders from virtually any loss of principal (1) Formerly a 20% risk-weighted asset, now a <10% risk-weighted under Basel II's IRB methodology Offer significantly higher spreads than government agency securities with comparable risk profiles Short (1-3 yrs), intermediate (3-7 yrs), long (7-10 yrs) and very long (10-15+ years) term tranches available at new issue and in secondary (1) Principal and accrued interest on underlying FFELP loan collateral carry a guarantee of either 98% or 97%. Guarantee is dependent on meeting the servicing requirements of the U.S. Department of Education. Typical SLM FFELP ABS Transaction Features Unique Characteristics of FFELP Loan ABS 9 |
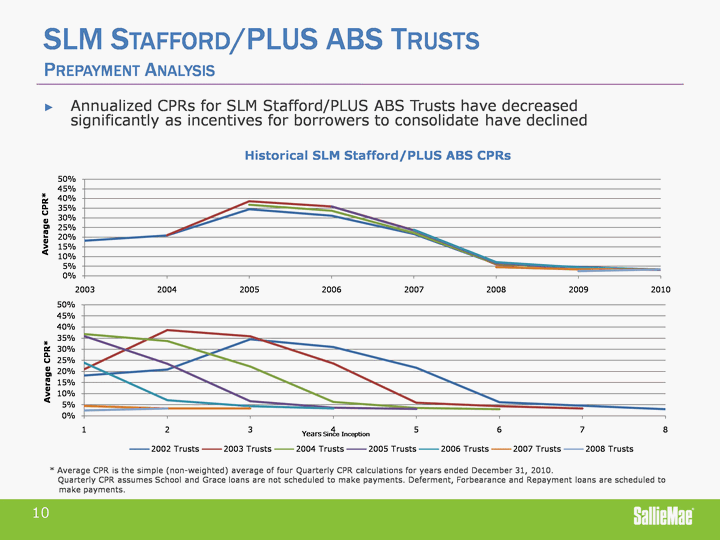
| SLM Stafford/PLUS ABS Trusts Prepayment Analysis Annualized CPRs for SLM Stafford/PLUS ABS Trusts have decreased significantly as incentives for borrowers to consolidate have declined Historical SLM Stafford/PLUS ABS CPRs * Average CPR is the simple (non-weighted) average of four Quarterly CPR calculations for years ended December 31, 2010. Quarterly CPR assumes School and Grace loans are not scheduled to make payments. Deferment, Forbearance and Repayment loans are scheduled to make payments. 10 10 (CHART) |
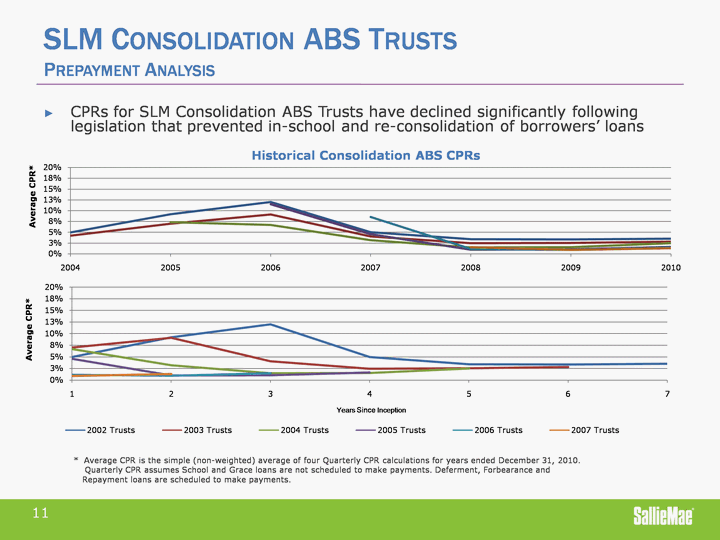
| SLM Consolidation ABS Trusts Prepayment Analysis Historical Consolidation ABS CPRs * Average CPR is the simple (non-weighted) average of four Quarterly CPR calculations for years ended Dec ember 31, 2010. Quarterly CPR assumes School and Grace loans are not scheduled to make payments. Deferment, Forbearance and Repayment loans are scheduled to make payments. CPRs for SLM Consolidation ABS Trusts have declined significantly following legislation that prevented in-school and re-consolidation of borrowers' loans 11 (CHART) (CHART) |
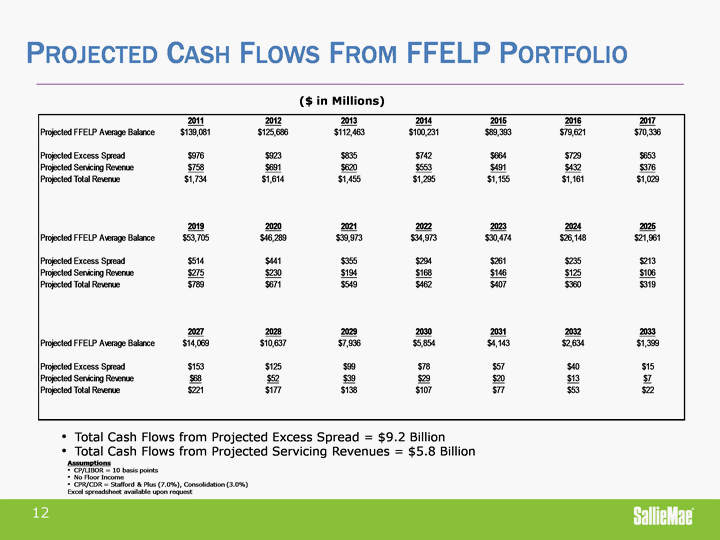
| Projected Cash Flows From FFELP Portfolio Assumptions CP/LIBOR = 10 basis points No Floor Income CPR/CDR = Stafford & Plus (7.0%), Consolidation (3.0%) Excel spreadsheet available upon request 12 ($ in Millions) Total Cash Flows from Projected Excess Spread = $9.2 Billion Total Cash Flows from Projected Servicing Revenues = $5.8 Billion |

| SLM Private Education loan ABS |
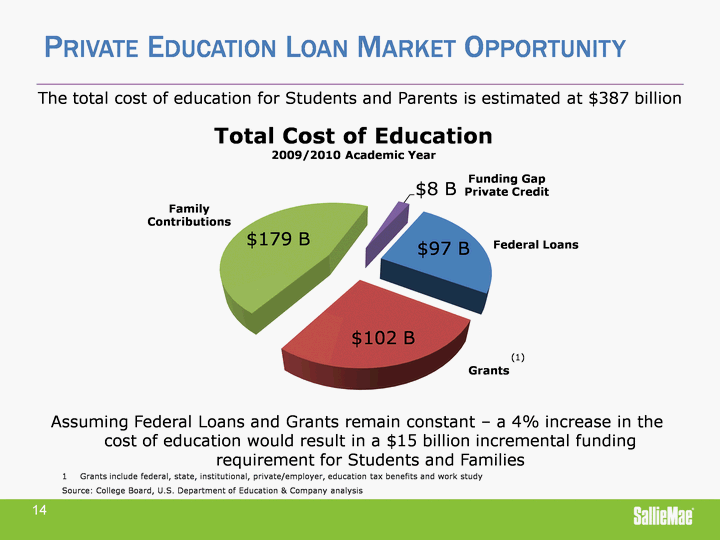
| Private Education Loan Market Opportunity The total cost of education for Students and Parents is estimated at $387 billion Grants include federal, state, institutional, private/employer, education tax benefits and work study Source: College Board, U.S. Department of Education & Company analysis 14 (CHART) (1) Assuming Federal Loans and Grants remain constant - a 4% increase in the cost of education would result in a $15 billion incremental funding requirement for Students and Families |
| Private Education Loans Managed Portfolio Loan Characteristics 19% of SLM's managed student loan portfolio, $35.7 billion at 12/31/10 High-quality long-duration assets 59% of portfolio has a cosigner, typically a parent Higher education loans typically non-dischargeable in bankruptcy Average life ~ 7.75 years Attractive margins and risk adjusted returns Dominant franchise and distribution capabilities among students, colleges and universities Strong customer service capabilities Fully integrated process Sales, underwriting, originations, servicing and collections Note: All figures as of Dec 31, 2010. 15 |
| Credit Performance Forbearance continues to be down 60% from 2008 levels Non-traditional forbearance is 6.1% as of 12/31/2010 Traditional forbearance is 4.4% as of 12/31/10 Non-Traditional charge-offs are down 20% year over year Charge-offs Q4 2010 14.9% vs. Q3 2009 at 18.6% Traditional Charge-offs are down 8% from prior quarter Charge-offs Q4 2010 3.6% vs. Q3 at 3.9% FICO scores continue to improve on loans moving into repayment Average FICO's of 724 on 2010 loans moving into repayment versus 709 in 2006 Portfolio cosigner percentage continues to increase 59% of portfolio has a cosigner, up from 50% historically 69% of loans entering repayment in Q4 2010 have a cosigner up from 51% in 2006 89% of Q4 2010 loan originations had cosigners Private Education Loans - Credit Performance is Improving 16 |
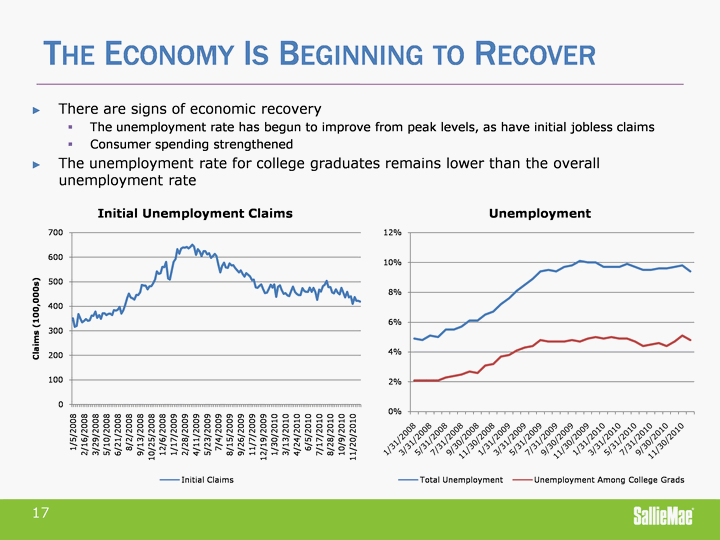
| The Economy Is Beginning to Recover There are signs of economic recovery The unemployment rate has begun to improve from peak levels, as have initial jobless claims Consumer spending strengthened The unemployment rate for college graduates remains lower than the overall unemployment rate 17 (CHART) (CHART) |
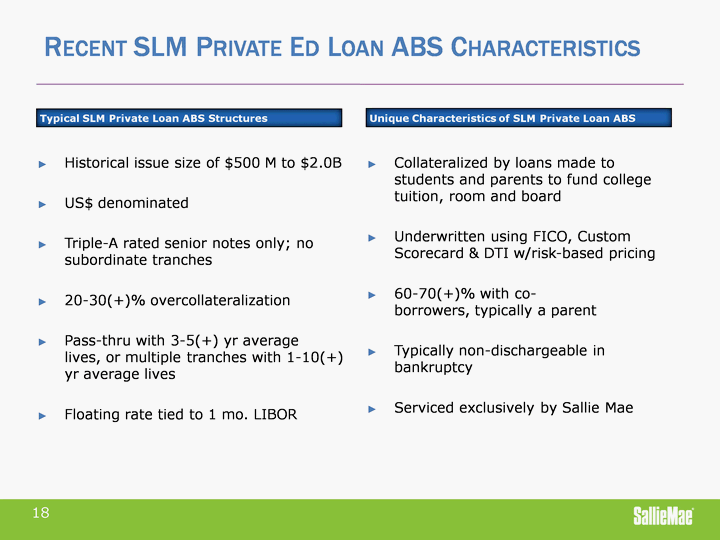
| Recent SLM Private Ed Loan ABS Characteristics Historical issue size of $500 M to $2.0B US$ denominated Triple-A rated senior notes only; no subordinate tranches 20-30(+)% overcollateralization Pass-thru with 3-5(+) yr average lives, or multiple tranches with 1-10(+) yr average lives Floating rate tied to 1 mo. LIBOR Collateralized by loans made to students and parents to fund college tuition, room and board Underwritten using FICO, Custom Scorecard & DTI w/risk-based pricing 60-70(+)% with co- borrowers, typically a parent Typically non-dischargeable in bankruptcy Serviced exclusively by Sallie Mae Typical SLM Private Loan ABS Structures Unique Characteristics of SLM Private Loan ABS 18 |
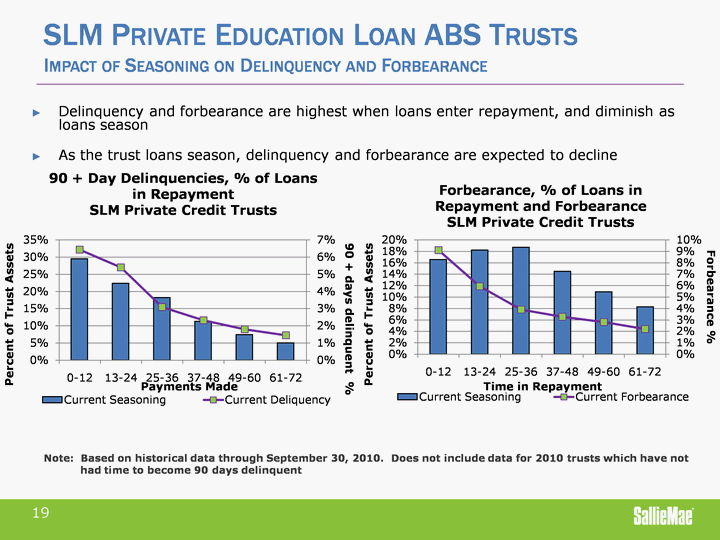
| Note: Based on historical data through September 30, 2010. Does not include data for 2010 trusts which have not had time to become 90 days delinquent SLM Private Education Loan ABS Trusts Impact of Seasoning on Delinquency and Forbearance Delinquency and forbearance are highest when loans enter repayment, and diminish as loans season As the trust loans season, delinquency and forbearance are expected to decline 19 (CHART) (CHART) |
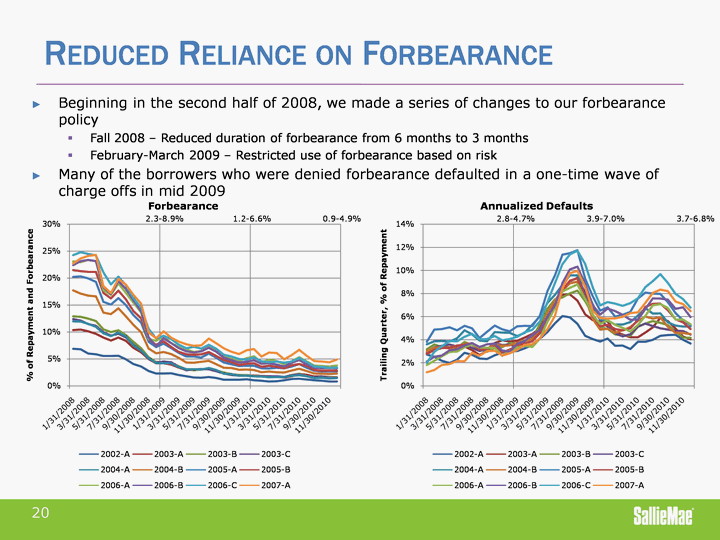
| Reduced Reliance on Forbearance Beginning in the second half of 2008, we made a series of changes to our forbearance policy Fall 2008 - Reduced duration of forbearance from 6 months to 3 months February-March 2009 - Restricted use of forbearance based on risk Many of the borrowers who were denied forbearance defaulted in a one-time wave of charge offs in mid 2009 20 (CHART) (CHART) 2.3-8.9% 1.2-6.6% 0.9-4.9% 2.8-4.7% 3.9-7.0% 3.7-6.8% |
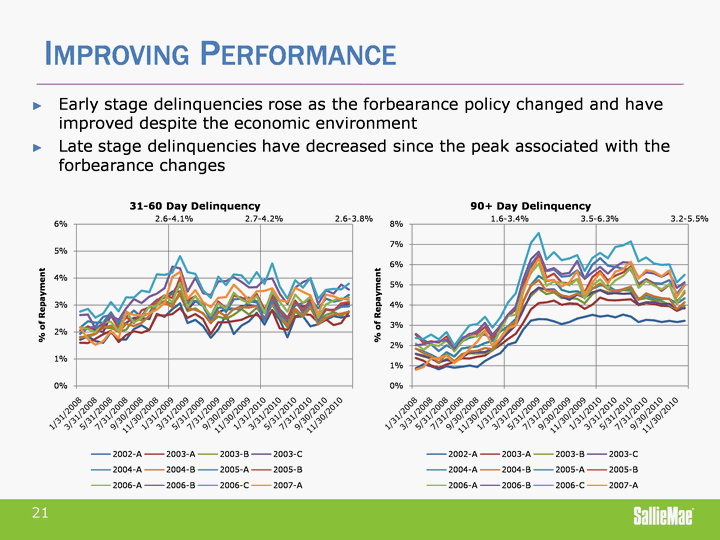
| Improving Performance Early stage delinquencies rose as the forbearance policy changed and have improved despite the economic environment Late stage delinquencies have decreased since the peak associated with the forbearance changes 21 (CHART) (CHART) 2.6-4.1% 2.7-4.2% 2.6-3.8% 1.6-3.4% 3.5-6.3% 3.2-5.5% |

| 2007-A AND PRIOR SLM PRIVATE LOAN ABS Prepayment Analysis Historical SLM Private Credit ABS CPRs Constant prepayment rates increased in 2007 due to the introduction of Private Credit Consolidation loans, but then declined accordingly following SLM's decision to suspend its consolidation loan program 11/30/2002 2/28/2003 5/31/2003 8/31/2003 11/30/2003 2/29/2004 5/31/2004 8/31/2004 11/30/2004 2/28/2005 5/31/2005 8/31/2005 11/30/2005 2/28/2006 5/31/2006 8/31/2006 11/30/2006 2/28/2007 5/31/2007 8/31/2007 11/30/2007 2/29/2008 5/31/2008 8/31/2008 11/30/2008 2/28/2009 5/31/2009 8/31/2009 11/30/2009 2/28/2010 5/31/2010 2002-A 0.02 0.01 0.01 0.01 0.01 0.02 0.02 0.03 0.04 0.05 0.07 0.05 0.06 0.07 0.09 0.08 0.11 0.11 0.09 0.07 0.08 0.0945 0.0636 0.0413 0.0473 0.0546 0.0647 0.0501 0.047 0.0607 2003-A 0.0236172 0.0209585 0.0213033 0.0220455 0.0266651 0.0260547 0.0330885 0.0388733 0.0594678 0.0468802 0.0474262 0.0590022 0.0766511 0.0620133 0.0898985 0.0930055 0.0822731 0.0571616 0.0651318 0.0938 0.0586 0.0482 0.0447 0.0572 0.0653 0.056 0.0531 0.0564 2003-B 0.0196991 0.0190606 0.0206465 0.0202833 0.0200219 0.0245259 0.0315476 0.0482446 0.0326783 0.039373 0.044897 0.0707957 0.0685625 0.1060034 0.0909016 0.083898 0.0585169 0.0683136 0.0937 0.054 0.0434 0.042 0.062 0.0668 0.0561 0.0474 0.0617 2003-C 0.0152843 0.0160452 0.014292 0.0180218 0.0179457 0.0283099 0.0361233 0.0304271 0.0367122 0.0447702 0.0722085 0.067429 0.1017183 0.0967132 0.0777458 0.057986 0.0766992 0.092 0.058 0.0429 0.0408 0.0553 0.0721 0.0586 0.0486 0.0613 2004-A 0.0187456 0.0166026 0.0164751 0.029934 0.0322261 0.0245132 0.0307617 0.0418472 0.0692516 0.0711425 0.1100171 0.0959807 0.0898134 0.0642664 0.0778312 0.0992 0.0653 0.0523 0.0468 0.0606 0.0753 0.0646 0.0546 0.0686 2004-B 0.0195699 0.0186244 0.0241702 0.0302471 0.0221029 0.0304168 0.03491 0.062598 0.068949 0.1246455 0.0951131 0.090922 0.0774936 0.106146 0.1023 0.0579 0.0397 0.0449 0.0542 0.0707 0.0531 0.0473 0.0609 2005-A 0.0319776 0.022261 0.0243768 0.0328796 0.0597171 0.0610083 0.0990818 0.0793967 0.0819435 0.064987 0.1045868 0.1033 0.0572 0.0438 0.0457 0.0592 0.0782 0.0608 0.0541 0.0704 2005-B 0.0242175 0.0279132 0.0573982 0.0555737 0.094908 0.0719371 0.073013 0.0529046 0.0893389 0.0782 0.0405 0.0297 0.0426 0.0531 0.0704 0.0549 0.0467 0.0584 2006-A 0.0476348 0.0500356 0.0857629 0.0634152 0.0664913 0.0531197 0.084535 0.0687 0.036 0.0232 0.0356 0.0434 0.0572 0.0462 0.0453 0.0508 2006-B 0.0447179 0.082504 0.0619091 0.0673478 0.0496674 0.0736355 0.0719 0.0388 0.0273 0.0331 0.0503 0.071 0.0529 0.0528 0.0554 2006-C 0.0677068 0.0683649 0.0645688 0.0526468 0.0767421 0.0719 0.038 0.0262 0.0396 0.0516 0.0725 0.0575 0.0533 0.0627 2007-A 0.0552171 0.0457742 0.0630612 0.0559 0.0274 0.0185 0.0277 0.033 0.0517 0.0387 0.0396 0.0485 22 |
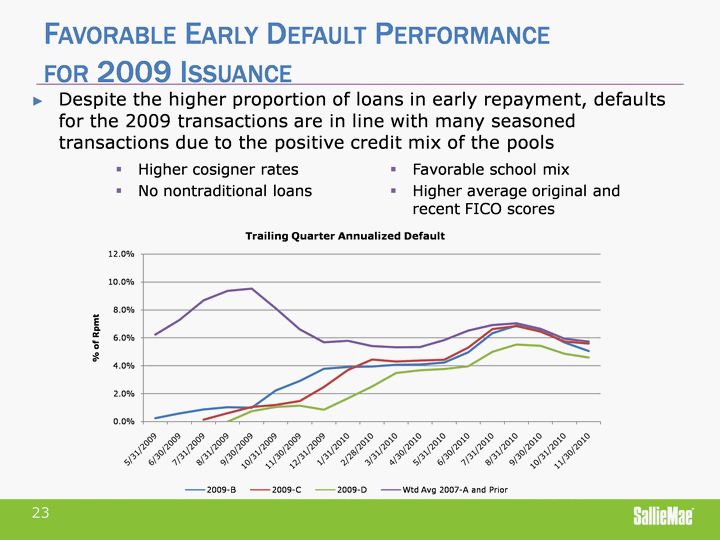
| Favorable Early Default Performance for 2009 Issuance Despite the higher proportion of loans in early repayment, defaults for the 2009 transactions are in line with many seasoned transactions due to the positive credit mix of the pools 23 (CHART) Higher cosigner rates No nontraditional loans Favorable school mix Higher average original and recent FICO scores |
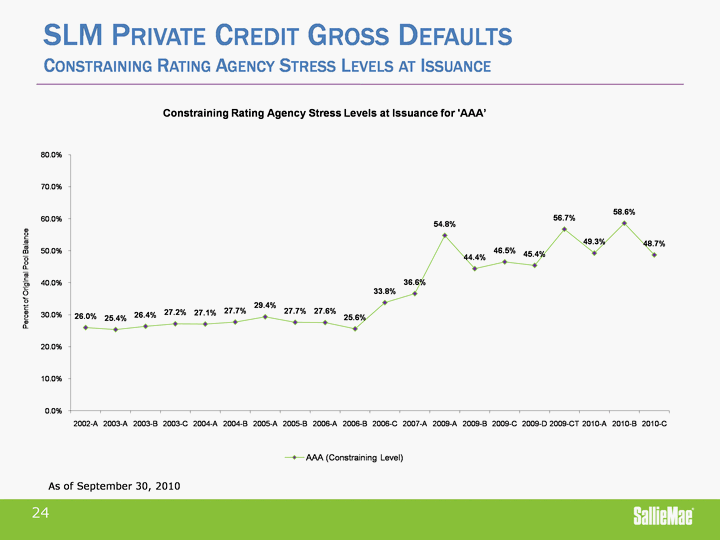
| SLM Private Credit Gross Defaults Constraining Rating Agency Stress Levels at Issuance As of September 30, 2010 (CHART) 24 |
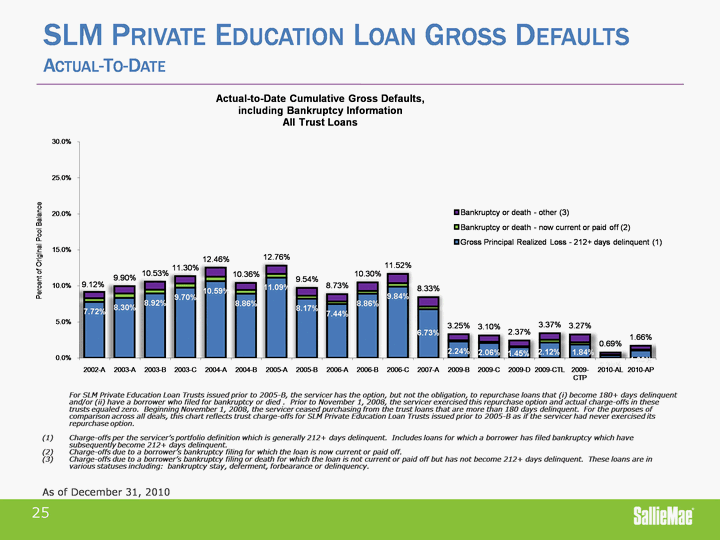
| SLM Private Education Loan Gross Defaults Actual-To-Date Actual-To-Date Actual-To-Date For SLM Private Education Loan Trusts issued prior to 2005-B, the servicer has the option, but not the obligation, to repurchase loans that (i) become 180+ days delinquent and/or (ii) have a borrower who filed for bankruptcy or died . Prior to November 1, 2008, the servicer exercised this repurchase option and actual charge-offs in these trusts equaled zero. Beginning November 1, 2008, the servicer ceased purchasing from the trust loans that are more than 180 days delinquent. For the purposes of comparison across all deals, this chart reflects trust charge-offs for SLM Private Education Loan Trusts issued prior to 2005-B as if the servicer had never exercised its repurchase option. Charge-offs per the servicer's portfolio definition which is generally 212+ days delinquent. Includes loans for which a borrower has filed bankruptcy which have subsequently become 212+ days delinquent. Charge-offs due to a borrower's bankruptcy filing for which the loan is now current or paid off. Charge-offs due to a borrower's bankruptcy filing or death for which the loan is not current or paid off but has not become 212+ days delinquent. These loans are in various statuses including: bankruptcy stay, deferment, forbearance or delinquency. As of December 31, 2010 25 |
| Additional Information Available at www.salliemae.com 26 |