Attached files
| file | filename |
|---|---|
| 8-K - 8-K - FIRST MARBLEHEAD CORP | a11-4711_28k.htm |
Exhibit 99.1
|
|
ASF 2011 Presentation February 6-9, 2011 |

|
|
Forward-Looking Statements Statements in this presentation regarding First Marblehead’s strategy, future operational results, competitive position, future opportunities and growth prospects, outlook, the demand for private education loans, the characteristics of future loan pools based on our Monogram® platform, and the future performance of securitization trusts that First Marblehead has facilitated (the “Trusts”), including projected forbearance, prepayment, delinquency and default rates, as well as any other statements that are not purely historical, constitute forward-looking statements for purposes of the safe harbor provisions of The Private Securities Litigation Reform Act of 1995. These forward-looking statements are based on our historical performance, the historical performance of the Trusts, and on our plans, estimates and expectations as of February 4, 2011. The inclusion of this forward-looking information should not be regarded as a representation by us or any other person that the future results, plans, projections, estimates or expectations expressed or implied will actually be achieved. You are cautioned that matters subject to forward-looking statements involve known and unknown risks and uncertainties, including economic, legislative, regulatory, competitive and other factors, which may cause actual financial or operational results, including the performance of the Trusts and facilitated loan volumes, or the timing of events, including loan defaults, to be materially different than those expressed or implied by our forward-looking statements. Important factors that could cause or contribute to such differences include: market acceptance of and demand for our Monogram platform and fee-based service offerings; the volume, timing and performance of facilitated loan volumes; the size and structure of any credit enhancement provided by us in connection with our Monogram platform; degradation of credit quality, credit enhancement or performance of the Trusts’ loan portfolios; economic, legislative, regulatory, competitive and other factors affecting default, recovery and prepayment rates on private student loan portfolios, including general economic conditions, the consumer credit environment, interest rates and unemployment rates; borrower defaults and the Trusts’ ability to recover principal and interest from such borrowers, including the effectiveness of various risk mitigation strategies, such as alternative payment plans; capital market receptivity to private student loan asset-backed securities; changes to bankruptcy laws that could affect the non-dischargeable status of education-related loans; management’s determination of which qualitative and quantitative factors, including macroeconomic indicators and historical experience, should be weighted in our projections, and the weight to be given to each such factor; and the other factors set forth under the caption "risk factors" in our quarterly report on Form 10-Q filed with the Securities and Exchange Commission on November 9, 2010. We specifically disclaim any obligation to update any forward-looking statements as a result of developments occurring after February 4, 2011. Disclaimer The information in this presentation is intended to provide a broad overview of a portfolio of private education loans facilitated by First Marblehead. Neither First Marblehead nor any other party is offering any securities by making this presentation or soliciting any action based upon the information provided. Nothing in this presentation should be relied upon as a representation by First Marblehead, or any other person, as to the future performance of any securitization trust described in this presentation or as to any securities that may be issued in the future. The information contained herein is intended to be illustrative only, and historical collateral pools may not be representative of any future collateral pool. |
|
|
Section I FMD Corporate Update & Overview Section II Legacy Portfolio Experience Section III Revised Approach to Risk and Portfolio Management Section IV The Monogram® Platform – Targeting the Best Credits TABLE OF CONTENTS Appendix NCSLT Performance Summary |
|
|
Section I FMD Corporate Update & Overview |
|
|
Corporate Update – Tuition Management Systems (TMS) Acquisition Closed December 31, 2010. Largest volume tuition payment plan provider in the country. Processed nearly $3.9 billion in tuition payments in 2010. Provider of outsourced tuition planning, billing, and payment technology services for universities, colleges, elementary and secondary schools. Serving over 1,100 schools and approximately 400,000 families. Impressive client list including educational institutions such as Duke University, Boston College, University of Chicago, MIT and Carnegie Mellon University. Provides a source of stable, fee-based revenues. Size and quality of its customer base provides an opportunity to expand our school relationships and offer complementary products and services in the future. Experienced and talented management team that is like minded with us in our entrepreneurial focus and fully capable of growing top and bottom line results. Expected to be cash flow positive from operations by the end of this fiscal year. |
|
|
Corporate Update – TERI and Q2 FY11 Financial Highlights TERI Update: During Q2 FY11, reached a settlement with TERI and its creditors committee. Per the terms of the settlement, FMD allowed unsecured claims against TERI’s bankruptcy estate of ~$28 million in aggregate TERI plan of reorganization was confirmed in October and became effective in November. NCSLT trusts received ~$284 million in cash in November FMD and NCSLT trusts received cash distributions of $3 million and $21 million in December. Q2 FY11 financial highlights: Net loss available to FMD stockholders was $(1.5) million compared to $(10.6) million in Q1 FY11. Includes one-time gains of $8.1 million related to the reorganization proceeding of TERI Loss per share decreased to $(0.01) from $(0.11) in Q1 FY11. $293.8 in cash, cash equivalents, short-term investments and federal funds sold as of December 31, 2010. Includes receipt of $45 million federal income tax refund Includes net payment of $46 million for TMS acquisition |
|
|
Focus. Flexibility. Innovation. Work with lender and school clients to create responsible, affordable choices for students and their families as they prepare to meet the cost of higher education Approach credit with data-driven quantitative analysis based on 20 years of industry experience Operate a highly specialized business model that derives revenue from fee-for-service operations, partnered lending platforms and capital markets execution strategies What We Do Financial services intermediary specializing in the design, origination, management and financing of private student loan programs Industry leader with expertise stemming from over 6 million loan applications processed, over $16.5 billion in loan volume and 38 asset-backed bond securitizations totaling over $16 billion in issuance volume Outsourced tuition planning, billing and payment technology services through its subsidiary Tuition Management Systems LLC Who We Are |
|
|
Focus. Flexibility. Innovation. Families struggle more than ever to fill the funding “gap” created by ever-increasing college costs, federal loan limits and shrinking state and institutional aid Legislative changes and the credit crisis have tempered lending activities Number of competitors has diminished Ensure the right students at the right schools receive the right student loans Why We Do It Leverage extensive private student loan performance experience applying sophisticated risk analysis capabilities and high-touch portfolio management strategies designed to optimize performance Utilize a seasoned national sales force and transparent loan application process to deliver customized loan products uniquely designed to meet borrowers’ needs Coordinate with investment banks, rating agencies and investors to strategically deploy capital to create viable and flexible disposition strategies for clients How We Do It |
|
|
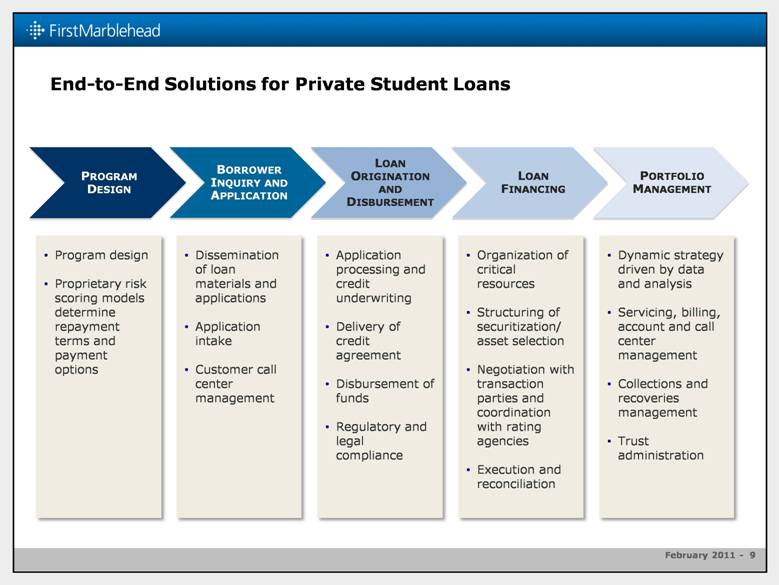
End-to-End Solutions for Private Student Loans Application processing and credit underwriting Delivery of credit agreement Disbursement of funds Regulatory and legal compliance Organization of critical resources Structuring of securitization/ asset selection Negotiation with transaction parties and coordination with rating agencies Execution and reconciliation Dynamic strategy driven by data and analysis Servicing, billing, account and call center management Collections and recoveries management Trust administration Program design Proprietary risk scoring models determine repayment terms and payment options Dissemination of loan materials and applications Application intake Customer call center management BORROWER INQUIRY AND APPLICATION LOAN ORIGINATION AND DISBURSEMENT LOAN FINANCING PORTFOLIO MANAGEMENT PROGRAM DESIGN |
|
|
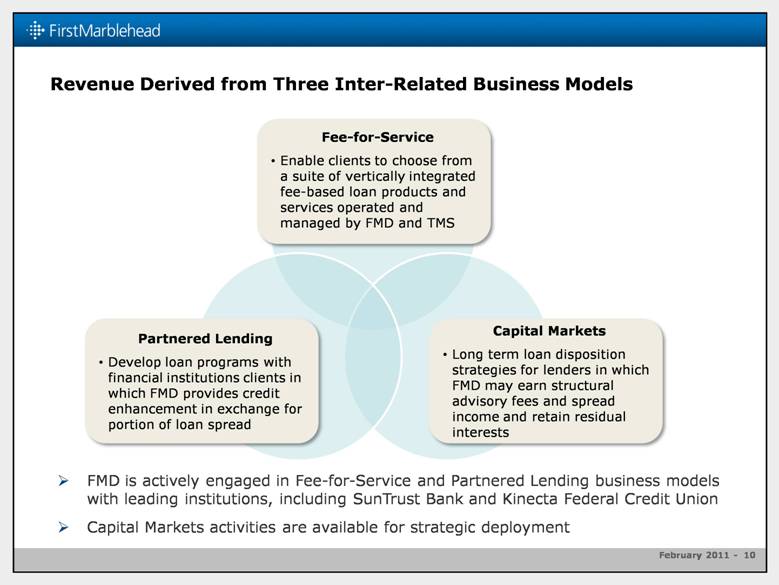
Revenue Derived from Three Inter-Related Business Models Partnered Lending Develop loan programs with financial institutions clients in which FMD provides credit enhancement in exchange for portion of loan spread Capital Markets Long term loan disposition strategies for lenders in which FMD may earn structural advisory fees and spread income and retain residual interests Fee-for-Service Enable clients to choose from a suite of vertically integrated fee-based loan products and services operated and managed by FMD and TMS FMD is actively engaged in Fee-for-Service and Partnered Lending business models with leading institutions, including SunTrust Bank and Kinecta Federal Credit Union Capital Markets activities are available for strategic deployment |
|
|
Market Opportunities Exist From The New York Times (January 24, 2011) – “The University of South Carolina has lost almost half of its state appropriations in the last three years, gets only about a quarter of its education budget from the state and is expecting another round of deep cuts next year.” “More states may soon find themselves in a similar position. In California, where tuition has been raised by 30 percent in the last two years — and where out-of-state tuition now tops $50,000, about the same as an elite private university — the governor has proposed cutting state support for the University of California by $500 million for the next fiscal year.” |
|
|
Section II Legacy Portfolio Experience |
|
|
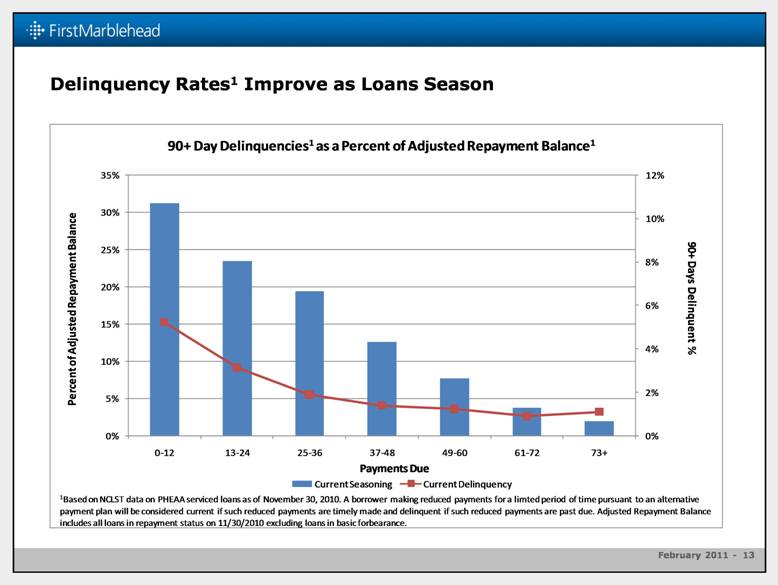
Delinquency Rates1 Improve as Loans Season 0% 2% 4% 6% 8% 10% 12% 0% 5% 10% 15% 20% 25% 30% 35% 0 - 12 13 - 24 25 - 36 37 - 48 49 - 60 61 - 72 73+ Current Seasoning Current Delinquency Payments Due Percent of Adjusted Repaymen t Balance 90+ Days Delinquent % 90+ Day Delinquencies 1 as a Percent of Adjusted Repayment Balance 1 1 Based on NCLST data on PHEAA serviced loans as of November 30, 2010. A borrower making reduced payments for a limted period of time pursuant to an alternative payment plan will be considered current if such reduced payments are timely made and delinquent if such reduced payments are pas t due. Adjusted Repayment Balance includes all loans in repayment status on 11/30/2010 excluding loans in basic forbearance. |
|
|
Basic Forbearance 1 Most Prevalent in Year 1 of Repayment 0% 2% 4% 6% 8% 10% 12% 0% 5% 10% 15% 20% 25% 30% 35% 0 - 12 13 - 24 25 - 36 37 - 48 49 - 60 61 - 72 73+ Current Seasoning Current Forbearance Payments Due at Time of Entering Basic Forbearance Percent of Repayment Balance Basic Forbearance % Basic Forbearance as a Percent of Repayment Balance 1 1 Based on NCLST data on PHEAA serviced loans as of November 30, 2010. Basic Forbearance does not include loans in alternative payment plans, and alternative payment plans may reduce utilization of basic forbearance. Repayment Balance includes all loans in repayment status as of 11/30/2010, including loans in basic forbearance, alternative payment plans, and loans that have entered repayment status and subsequently deferred payment. |

|
|
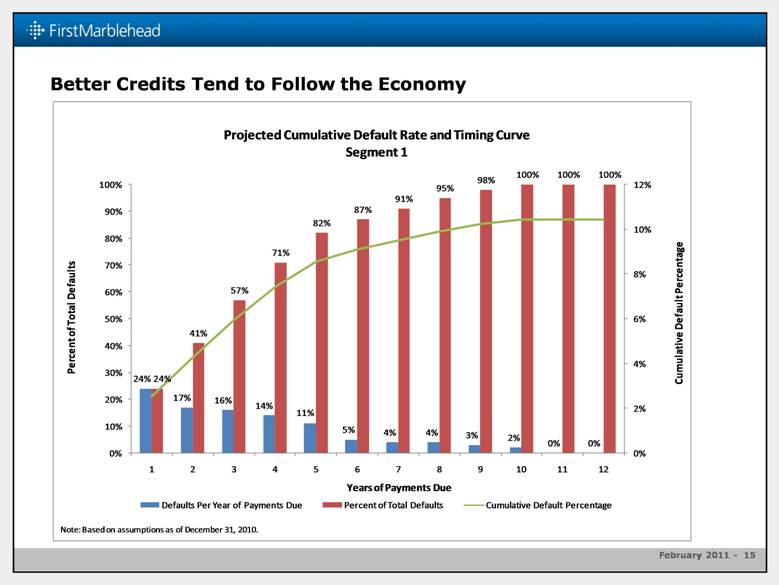
Better Credits Tend to Follow the Economy 24% 17% 16% 14% 11% 5% 4% 4% 3% 2% 0% 0% 24% 41% 57% 71% 82% 87% 91% 95% 98% 100% 100% 100% 0% 2% 4% 6% 8% 10% 12% 0% 10% 20% 30% 40% 50% 60% 70% 80% 90% 100% 1 2 3 4 5 6 7 8 9 10 11 12 Defaults Per Year of Payments Due Percent of Total Defaults Cumulative Default Percentage Projected Cumulative Default Rate and Timing Curve Segment 1 Years of Payments Due Percent of Total Defaults Cumulative Default Percentage Note: Based on assumptions as of December 31, 2010. |
|
|
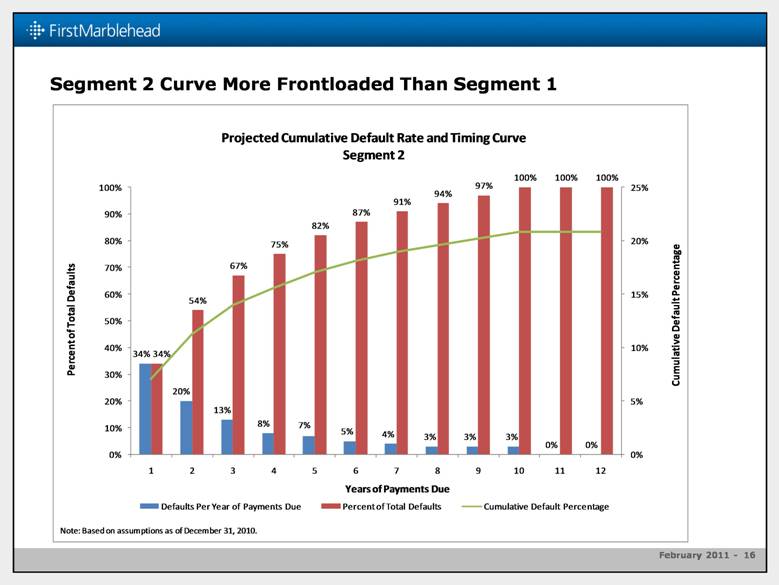
Segment 2 Curve More Frontloaded Than Segment 1 34% 20% 13% 8% 7% 5% 4% 3% 3% 3% 0% 0% 34% 54% 67% 75% 82% 87% 91% 94% 97% 100% 100% 100% 0% 5% 10% 15% 20% 25% 0% 10% 20% 30% 40% 50% 60% 70% 80% 90% 100% 1 2 3 4 5 6 7 8 9 10 11 12 Defaults Per Year of Payments Due Percent of Total Defaults Cumulative Default Percentage Projected Cumulative Default Rate and Timing Curve Segment 2 Years of Payments Due Percent of Total Defaults Cumulative Default Percentage Note: Based on assumptions as of December 31, 2010. |
|
|
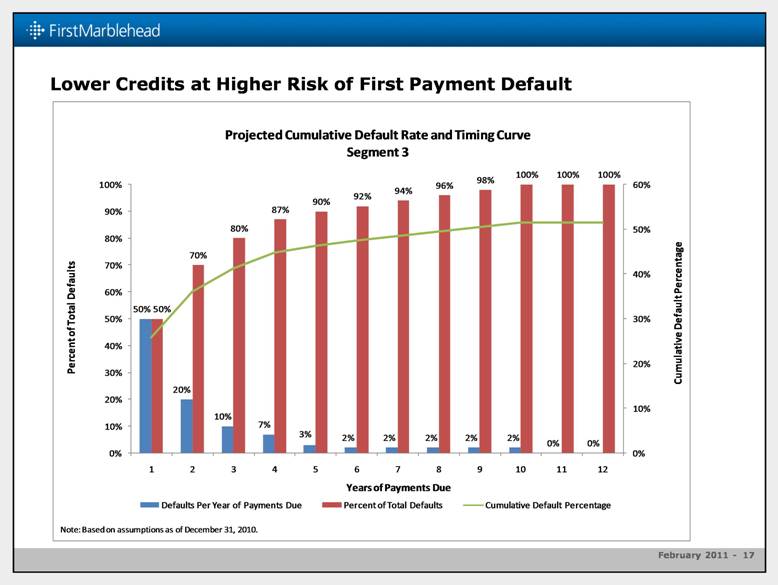
Lower Credits at Higher Risk of First Payment Default 50% 20% 10% 7% 3% 2% 2% 2% 2% 2% 0% 0% 50% 70% 80% 87% 90% 92% 94% 96% 98% 100% 100% 100% 0% 10% 20% 30% 40% 50% 60% 0% 10% 20% 30% 40% 50% 60% 70% 80% 90% 100% 1 2 3 4 5 6 7 8 9 10 11 12 Defaults Per Year of Payments Due Percent of Total Defaults Cumulative Default Percentage Projected Cumulative Default Rate and Timing Curve Segment 3 Years of Payments Due Percent of Total Defaults Cumulative Default Percentage Note: Based on assumptions as of December 31, 2010. |
|
|
Section III Revised Approach to Risk and Portfolio Management |
|
|
Key Considerations - Credit Risk for Private Student Loans |
|
|
Default Methodology – Scorecard Development Results: Target variable: probability of default within first 2 years of time in repayment (exposure time) Outperforms the use of traditional credit scores Effectively ranks applications from high to low risk of default Variables analyzed by internal legal and compliance functions and external legal counsel Methodology, data and performance validated by national credit bureau Predictive Attributes: Product attributes: repayment option, loan amount, expected time in deferment, applicants income and homeowner status, student’s grade level and undergraduate/graduate status, etc. Channel: source, certification, etc. Cosigner presence and credit Credit bureau data across multiple asset classes: FICO, charge-offs, inquiries, indebtedness, performance on all assets The score attributes can be grouped into the following: Application information Wealth of credit experience Delinquencies and derogatory information Level of recent credit activity Utilization of credit and level of indebtedness |
|
|
More Effective Rank Ordering of Risk FMD Proprietary Risk Score versus traditional credit score To Reduce Defaults by 75% Eliminate worst 55% using traditional credit score Eliminate worst 26% using FMC Worst 15% assigned by FMC score captures ~58% of defaults Worst 15% assigned by traditional credit score captures ~35% of defaults 10% 20% 30% 40% 50% 60% 70% 80% 90% 100% 5% 10% 15% 20% 25% 30% 35% 40% 45% 50% 55% 60% 65% 70% 75% 80% 85% 90% 95% 100% % of Defaults Captured Percent of Applications |
|
|
Robust Analytics Throughout Life Cycle Credit Scoring Fraud Mitigation Prepayment Drop-Out Probability Early Awareness Collectability Recoverability Monthly Default Risk Score Our suite of risk models are used throughout the life cycle of a loan to optimize profitability and manage risk |
|
|
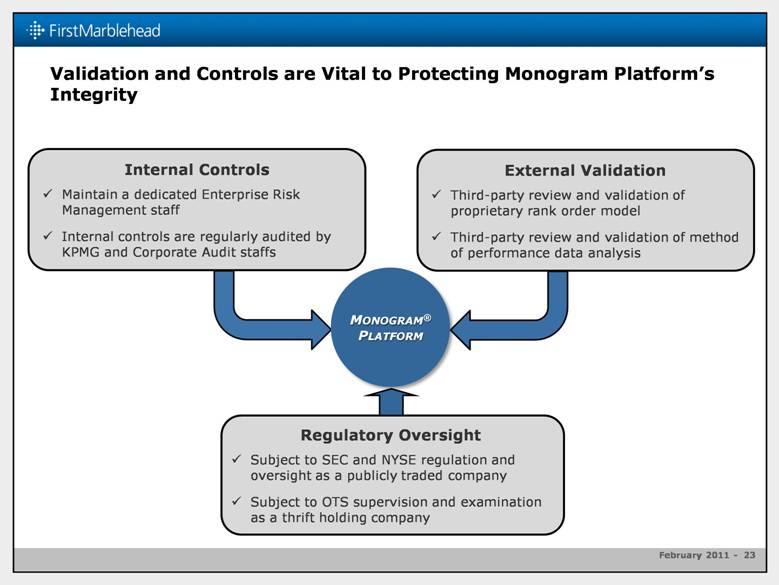
Validation and Controls are Vital to Protecting Monogram Platform’s Integrity Internal Controls Maintain a dedicated Enterprise Risk Management staff Internal controls are regularly audited by KPMG and Corporate Audit staffs External Validation Third-party review and validation of proprietary rank order model Third-party review and validation of method of performance data analysis Regulatory Oversight Subject to SEC and NYSE regulation and oversight as a publicly traded company Subject to OTS supervision and examination as a thrift holding company MONOGRAM® PLATFORM |
|
|
Performance-Driven Portfolio Management Strategy |
|
|
Section IV The Monogram Platform – Targeting the Best Credits |

|
|
Market Demanding Better Credits at Traditional Schools Targeting and approving only higher credit quality applicants More granular risk segmentation allows for better risk-based pricing Traditional Title IV school with lower FFELP cohort default rates All applications certified by and funds disbursed to the school Repay type and term controlled for Monitor actual distribution, evolve program as necessary Current product offering: Focuses on the best legacy loans – Segment 1 Excludes loans for students attending non-traditional and non-Title IV schools Excludes non-school certified loan programs |
|
|
Monogram® Platform Incorporates all of FMD’s Core Competencies 1st Generation Product 2nd Generation Product 3rd Generation Product |

|
|
Lending Process Includes 12-month Selling Season |
|
|
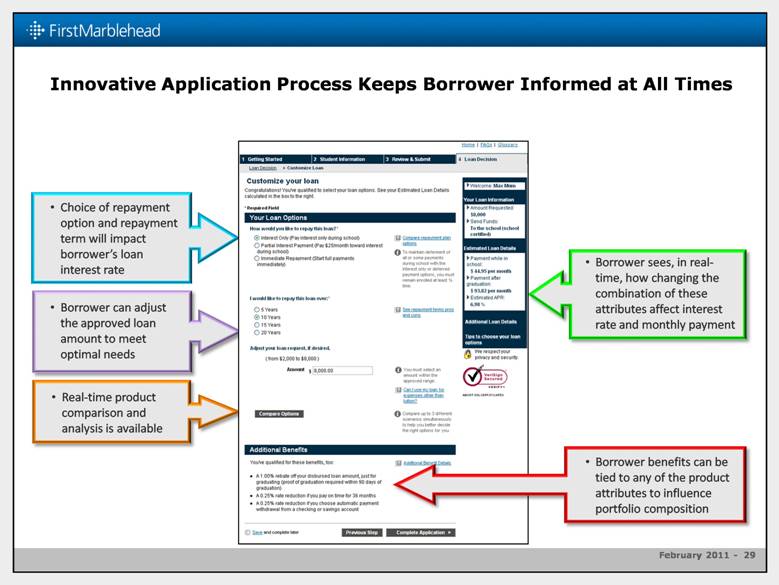
Innovative Application Process Keeps Borrower Informed at All Times Real-time product comparison and analysis is available Choice of repayment option and repayment term will impact borrower’s loan interest rate Borrower can adjust the approved loan amount to meet optimal needs Borrower sees, in real-time, how changing the combination of these attributes affect interest rate and monthly payment Borrower benefits can be tied to any of the product attributes to influence portfolio composition |
|
|
Launch of Monogram Platform - Origination Statistics to Date Over 4,000 loan applications processed ~ $4 million in volume ~ 85% cosigned Weighted average FICO of 762 Projected weighted average life of 4.9 years ~ 14% are variable rate loans with an average interest rate of 9.04% ~ 86% are fixed rate loans with an average interest rate of 10% ~ 88% are in some form of immediate repayment (full P&I, full interest-only or partial interest-only) Conclusion: Through the Monogram Platform, FMD is achieving its objective of originating high quality assets – assets that should be very attractive to lenders and bond investors. |
|
|
Appendix NCSLT Performance Summary |
|
|
Portfolio Risk Segmentation December 31, 2010 NCSLT Portfolio Segment 1 Segment 2 Segment 3 Distribution by original loan amount 25.5% 27.0% 47.5% Distribution by total outstanding loan amount(1): Not in repayment(2) 3.3 5.3 13.9 In repayment(2) 19.7 22.2 35.6 Gross default rate(3) 10.4 20.8 51.5 Recovery rate(4) 40.0 40.0 40.0 Net default rate(5) 6.3 12.5 30.9 Prepayment rate(6) 6.6 4.7 2.8 Outstanding aggregate principal and capitalized interest balance as of December 31, 2010. Loans “not in repayment” include loans in deferment or basic forbearance status as of December 31, 2010. We classify loans subject to alternative payment plans, a form of forbearance, as “in repayment.” Historical and projected defaults over the lives of the trusts as a percentage of original outstanding aggregate principal. Historical and projected recoveries, net of historical and projected collection costs, as a percentage of historical and projected cumulative gross defaults. Historical and projected defaults over the lives of the trusts less historical and projected recoveries, net of collection costs, as a percentage of original outstanding aggregate principal. Amount presented is the weighted average conditional prepayment rate (CPR) over the lives of the trusts. The CPR is an estimate of the likelihood that a loan will be prepaid during a period given that it has not previously defaulted or been repaid in full. Source: FMD 10-Q for the quarterly period ending December 31, 2010 |
|
|
Charge-off Rates1 Down From Peak in CY 2009 0% 5% 10% 15% 20% 25% 1 2 3 Charge - off Rate as a Percent of Repayment Balance 1 Risk Segment 1 Based on NCSLT data on PHEAA serviced loans through November 30, 2010. Charge - off Rate is the cumulative balance of loans in default during the period (greater than 180 days past due) divided by all loans in repayment status at the beginning of the period (Repayment Balance) annualized. Repayment Balance includes loans in basic forbearance, alternative payment plans, and loans that have entered repayment status and subsequently deferred payment. Charge-off Rate |

|
|
Capital Markets Contacts |