Attached files
| file | filename |
|---|---|
| 8-K - FORM 8-K - Brooks Automation, Inc. | b84739e8vk.htm |
Exhibit 99.1
| (c) Copyright 2011 by Brooks Automation, Inc. - Proprietary Information 1 1st Quarter Fiscal 2011 Financial Results Conference Call |
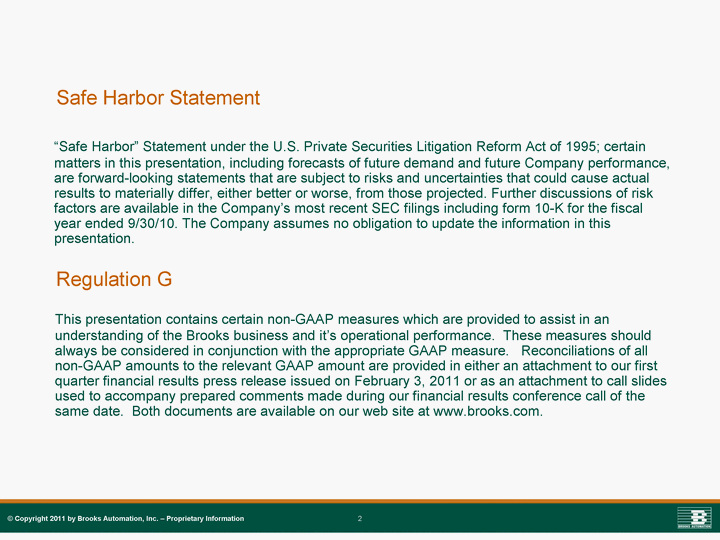
| (c) Copyright 2011 by Brooks Automation, Inc. - Proprietary Information 2 Safe Harbor Statement "Safe Harbor" Statement under the U.S. Private Securities Litigation Reform Act of 1995; certain matters in this presentation, including forecasts of future demand and future Company performance, are forward-looking statements that are subject to risks and uncertainties that could cause actual results to materially differ, either better or worse, from those projected. Further discussions of risk factors are available in the Company's most recent SEC filings including form 10-K for the fiscal year ended 9/30/10. The Company assumes no obligation to update the information in this presentation. Regulation G This presentation contains certain non-GAAP measures which are provided to assist in an understanding of the Brooks business and it's operational performance. These measures should always be considered in conjunction with the appropriate GAAP measure. Reconciliations of all non-GAAP amounts to the relevant GAAP amount are provided in either an attachment to our first quarter financial results press release issued on February 3, 2011 or as an attachment to call slides used to accompany prepared comments made during our financial results conference call of the same date. Both documents are available on our web site at www.brooks.com. |
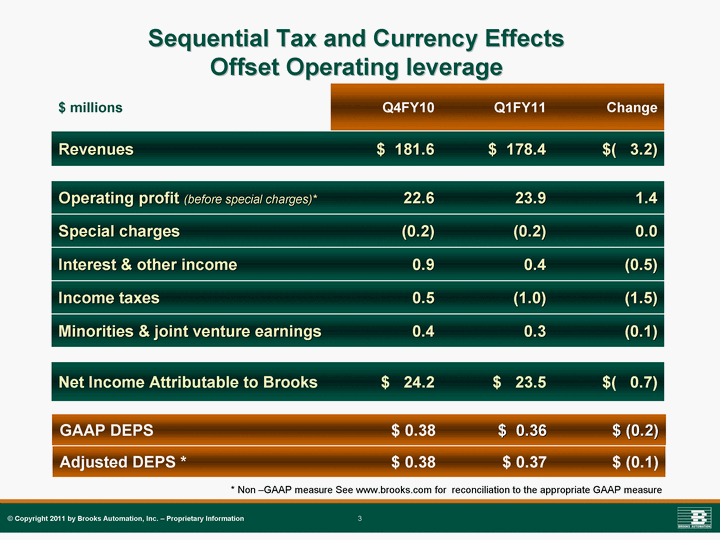
| (c) Copyright 2011 by Brooks Automation, Inc. - Proprietary Information 3 Sequential Tax and Currency Effects Offset Operating leverage $ millions Q4FY10 Q1FY11 Change Revenues $ 181.6 $ 178.4 $( 3.2) Operating profit (before special charges)* 22.6 23.9 1.4 Special charges (0.2) (0.2) 0.0 Interest & other income 0.9 0.4 (0.5) Income taxes 0.5 (1.0) (1.5) Minorities & joint venture earnings 0.4 0.3 (0.1) Net Income Attributable to Brooks $ 24.2 $ 23.5 $( 0.7) GAAP DEPS $ 0.38 $ 0.36 $ (0.2) Adjusted DEPS * $ 0.38 $ 0.37 $ (0.1) * Non -GAAP measure See www.brooks.com for reconciliation to the appropriate GAAP measure |
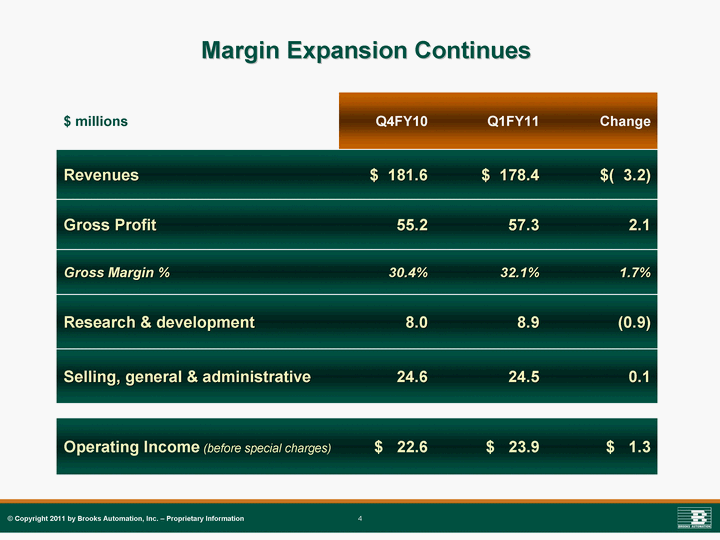
| (c) Copyright 2011 by Brooks Automation, Inc. - Proprietary Information 4 Margin Expansion Continues $ millions Q4FY10 Q1FY11 Change Revenues $ 181.6 $ 178.4 $( 3.2) Gross Profit 55.2 57.3 2.1 Gross Margin % 30.4% 32.1% 1.7% Research & development 8.0 8.9 (0.9) Selling, general & administrative 24.6 24.5 0.1 Operating Income (before special charges) $ 22.6 $ 23.9 $ 1.3 |
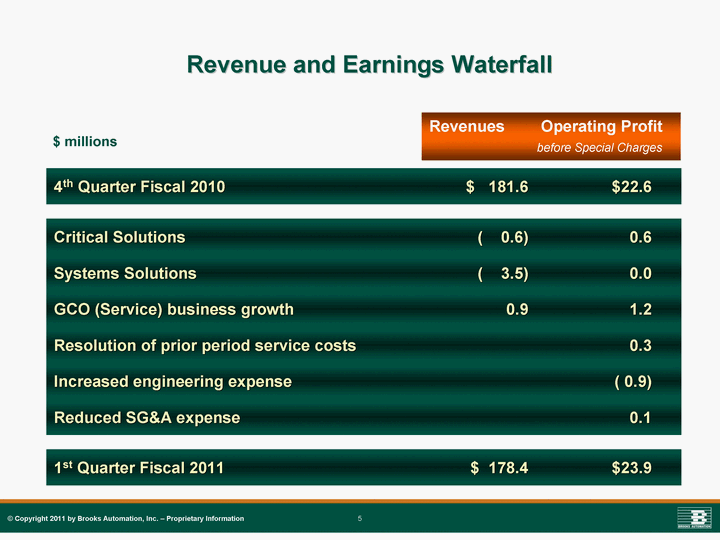
| (c) Copyright 2011 by Brooks Automation, Inc. - Proprietary Information 5 Revenue and Earnings Waterfall 4th Quarter Fiscal 2010 $ 181.6 $22.6 Critical Solutions ( 0.6) 0.6 Systems Solutions ( 3.5) 0.0 GCO (Service) business growth 0.9 1.2 Resolution of prior period service costs 0.3 Increased engineering expense ( 0.9) Reduced SG&A expense 0.1 1st Quarter Fiscal 2011 $ 178.4 $23.9 Revenues Operating Profit before Special Charges $ millions |
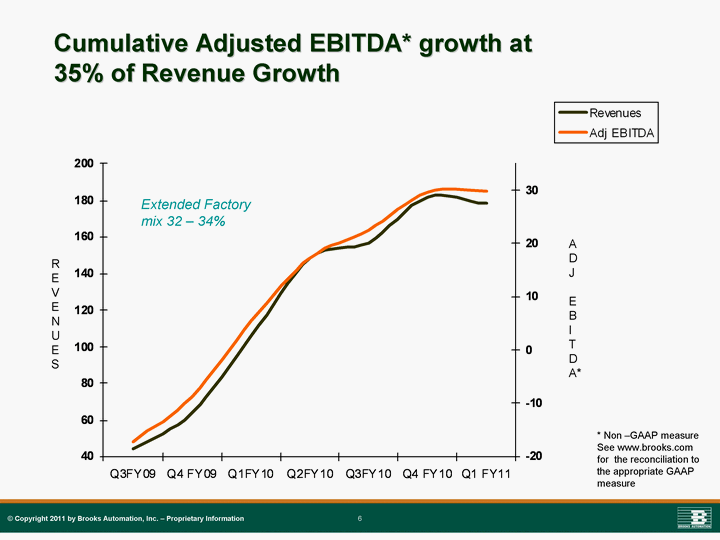
| (c) Copyright 2011 by Brooks Automation, Inc. - Proprietary Information 6 Cumulative Adjusted EBITDA* growth at 35% of Revenue Growth R E V E N U E S A D J E B I T D A* Extended Factory mix 32 - 34% * Non -GAAP measure See www.brooks.com for the reconciliation to the appropriate GAAP measure measure measure measure measure measure |
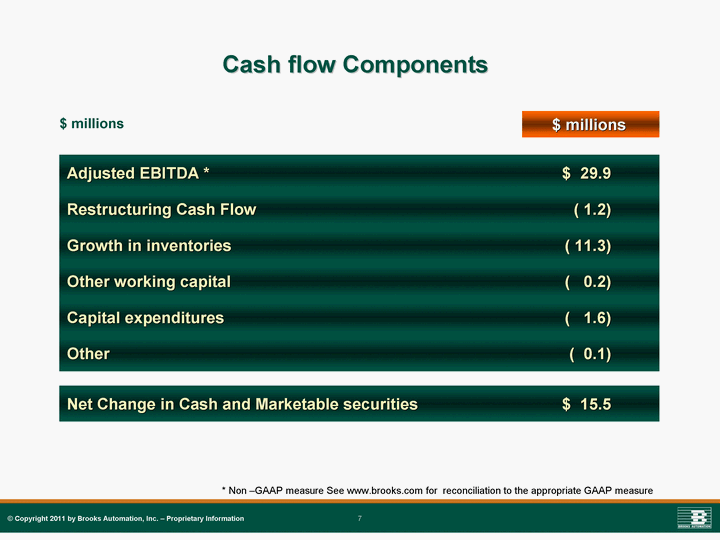
| (c) Copyright 2011 by Brooks Automation, Inc. - Proprietary Information 7 Cash flow Components Adjusted EBITDA * $ 29.9 Restructuring Cash Flow ( 1.2) Growth in inventories ( 11.3) Other working capital ( 0.2) Capital expenditures ( 1.6) Other ( 0.1) Net Change in Cash and Marketable securities $ 15.5 $ millions $ millions * Non -GAAP measure See www.brooks.com for reconciliation to the appropriate GAAP measure |
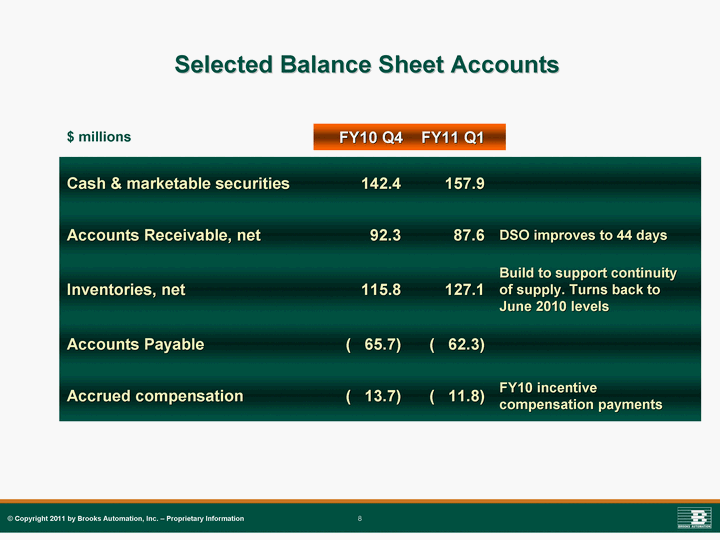
| (c) Copyright 2011 by Brooks Automation, Inc. - Proprietary Information 8 Selected Balance Sheet Accounts Cash & marketable securities 142.4 157.9 Accounts Receivable, net 92.3 87.6 DSO improves to 44 days Inventories, net 115.8 127.1 Build to support continuity of supply. Turns back to June 2010 levels Accounts Payable ( 65.7) ( 62.3) Accrued compensation ( 13.7) ( 11.8) FY10 incentive compensation payments FY10 Q4 FY11 Q1 $ millions |
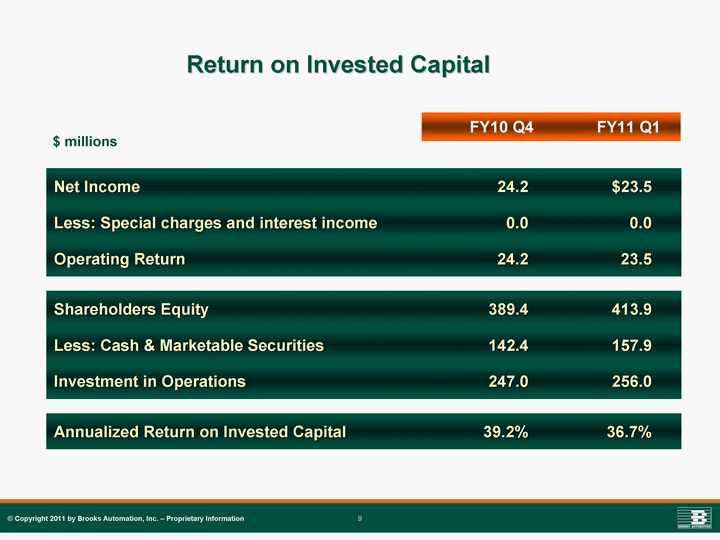
| (c) Copyright 2011 by Brooks Automation, Inc. - Proprietary Information 9 Return on Invested Capital Net Income 24.2 $23.5 Less: Special charges and interest income 0.0 0.0 Operating Return 24.2 23.5 Shareholders Equity 389.4 413.9 Less: Cash & Marketable Securities 142.4 157.9 Investment in Operations 247.0 256.0 Annualized Return on Invested Capital 39.2% 36.7% FY10 Q4 FY11 Q1 $ millions |
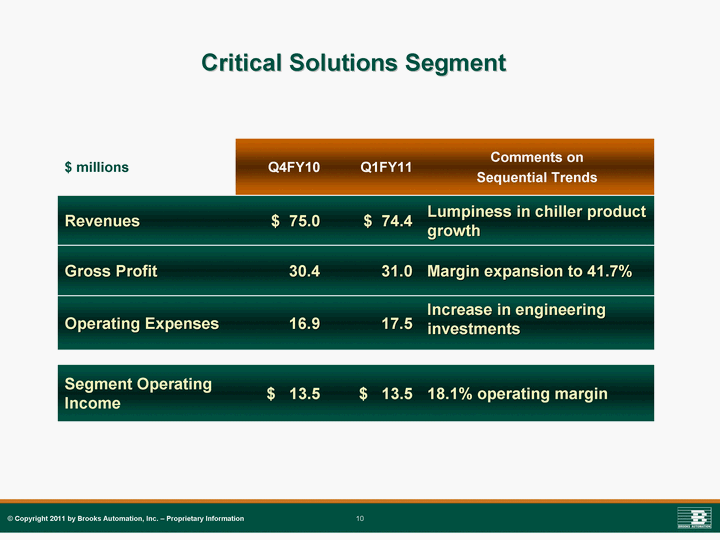
| (c) Copyright 2011 by Brooks Automation, Inc. - Proprietary Information 10 Critical Solutions Segment $ millions Q4FY10 Q1FY11 Comments on Sequential Trends Revenues $ 75.0 $ 74.4 Lumpiness in chiller product growth Gross Profit 30.4 31.0 Margin expansion to 41.7% Operating Expenses 16.9 17.5 Increase in engineering investments Segment Operating Income $ 13.5 $ 13.5 18.1% operating margin |
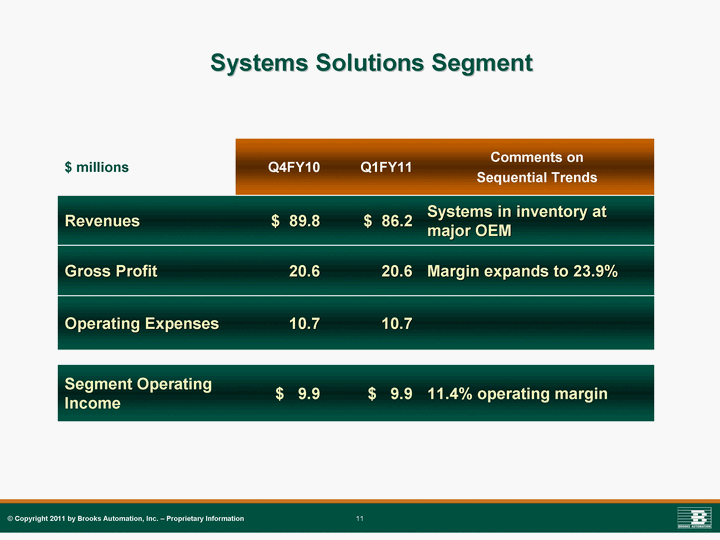
| (c) Copyright 2011 by Brooks Automation, Inc. - Proprietary Information 11 Systems Solutions Segment $ millions Q4FY10 Q1FY11 Comments on Sequential Trends Revenues $ 89.8 $ 86.2 Systems in inventory at major OEM Gross Profit 20.6 20.6 Margin expands to 23.9% Operating Expenses 10.7 10.7 Segment Operating Income $ 9.9 $ 9.9 11.4% operating margin |
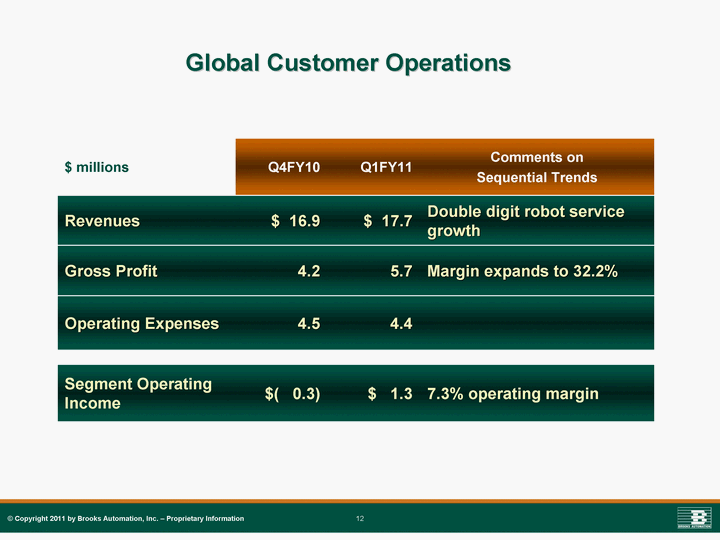
| (c) Copyright 2011 by Brooks Automation, Inc. - Proprietary Information 12 Global Customer Operations $ millions Q4FY10 Q1FY11 Comments on Sequential Trends Revenues $ 16.9 $ 17.7 Double digit robot service growth Gross Profit 4.2 5.7 Margin expands to 32.2% Operating Expenses 4.5 4.4 Segment Operating Income $( 0.3) $ 1.3 7.3% operating margin |
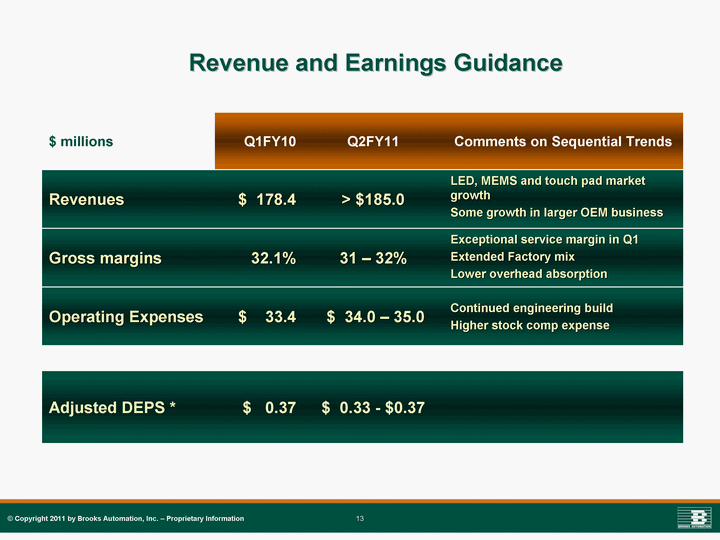
| (c) Copyright 2011 by Brooks Automation, Inc. - Proprietary Information 13 Revenue and Earnings Guidance $ millions Q1FY10 Q2FY11 Comments on Sequential Trends Revenues $ 178.4 > $185.0 LED, MEMS and touch pad market growth Some growth in larger OEM business Gross margins 32.1% 31 - 32% Exceptional service margin in Q1 Extended Factory mix Lower overhead absorption Operating Expenses $ 33.4 $ 34.0 - 35.0 Continued engineering build Higher stock comp expense Adjusted DEPS * $ 0.37 $ 0.33 - $0.37 |
| (c) Copyright 2011 by Brooks Automation, Inc. - Proprietary Information 14 1st Quarter Fiscal 2011 Financial Results Conference Call |
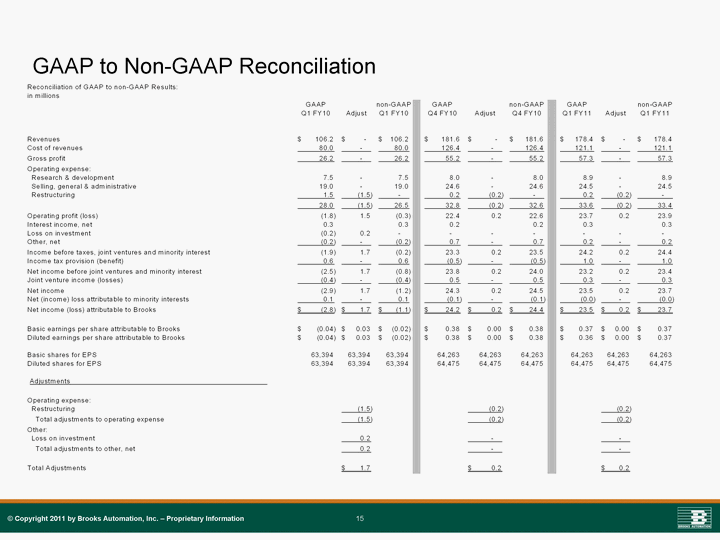
| (c) Copyright 2011 by Brooks Automation, Inc. - Proprietary Information 15 GAAP to Non-GAAP Reconciliation |
