Attached files
| file | filename |
|---|---|
| 8-K - FORM 8-K - WESCO INTERNATIONAL INC | l41714e8vk.htm |
| EX-99.1 - EX-99.1 - WESCO INTERNATIONAL INC | l41714exv99w1.htm |
Exhibit
99.2
| Supplemental Financial Data WESCO Fourth Quarter and Full Year 2010 January 27, 2011 |
| Safe Harbor Statement Note: All statements made herein that are not historical facts should be considered as "forward- looking statements" within the meaning of the Private Securities Litigation Act of 1995. Such statements involve known and unknown risks, uncertainties and other factors that may cause actual results to differ materially. Such risks, uncertainties and other factors include, but are not limited to, debt level, changes in general economic conditions, fluctuations in interest rates, increases in raw materials and labor costs, levels of competition and other factors described in detail in Form 10-K for WESCO International, Inc. for the year ended December 31, 2009 and any subsequent filings with the Securities & Exchange Commission. Any numerical or other representations in this presentation do not represent guidance by management and should not be construed as such. |
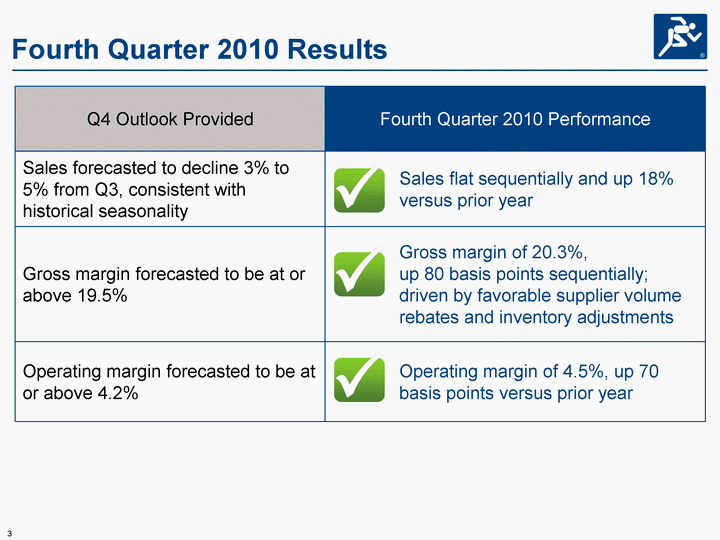
| Fourth Quarter 2010 Results Q4 Outlook Provided Fourth Quarter 2010 Performance Fourth Quarter 2010 Performance Sales forecasted to decline 3% to 5% from Q3, consistent with historical seasonality Sales flat sequentially and up 18% versus prior year Gross margin forecasted to be at or above 19.5% Gross margin of 20.3%, up 80 basis points sequentially; driven by favorable supplier volume rebates and inventory adjustments Operating margin forecasted to be at or above 4.2% Operating margin of 4.5%, up 70 basis points versus prior year |
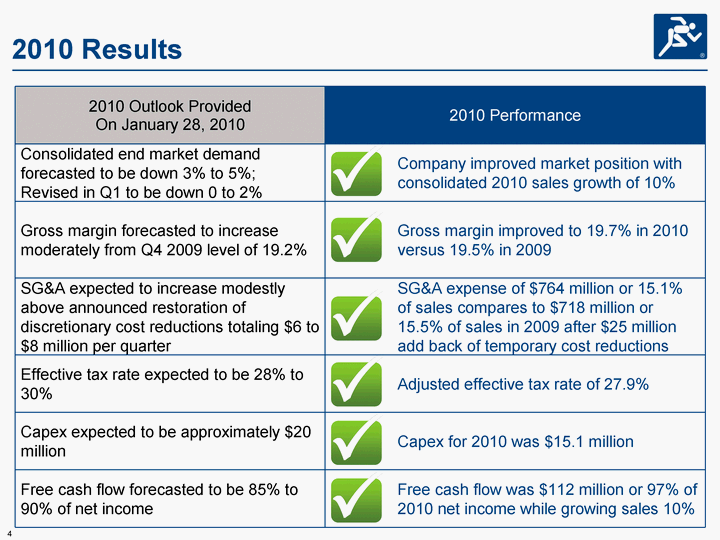
| 2010 Results 2010 Outlook Provided On January 28, 2010 2010 Performance 2010 Performance Consolidated end market demand forecasted to be down 3% to 5%; Revised in Q1 to be down 0 to 2% Company improved market position with consolidated 2010 sales growth of 10% Gross margin forecasted to increase moderately from Q4 2009 level of 19.2% Gross margin improved to 19.7% in 2010 versus 19.5% in 2009 SG&A expected to increase modestly above announced restoration of discretionary cost reductions totaling $6 to $8 million per quarter SG&A expense of $764 million or 15.1% of sales compares to $718 million or 15.5% of sales in 2009 after $25 million add back of temporary cost reductions Effective tax rate expected to be 28% to 30% Adjusted effective tax rate of 27.9% Capex expected to be approximately $20 million Capex for 2010 was $15.1 million Free cash flow forecasted to be 85% to 90% of net income Free cash flow was $112 million or 97% of 2010 net income while growing sales 10% |
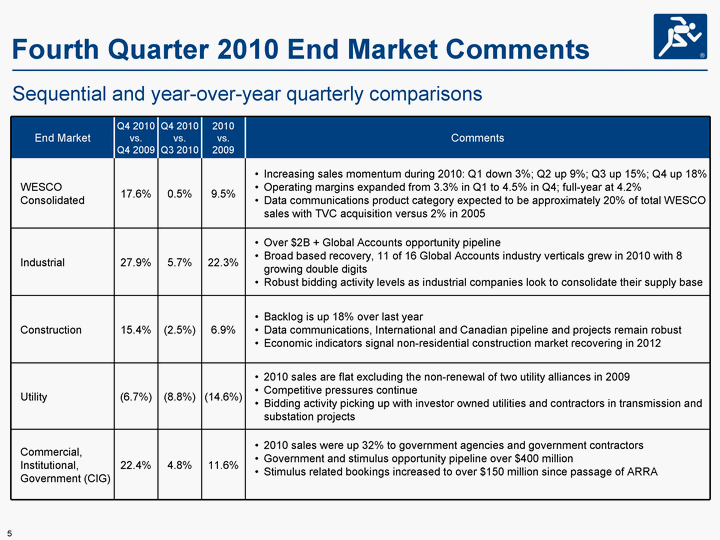
| End Market Q4 2010 vs. Q4 2009 Q4 2010 vs. Q3 2010 2010 vs. 2009 Comments WESCO Consolidated 17.6% 0.5% 9.5% Increasing sales momentum during 2010: Q1 down 3%; Q2 up 9%; Q3 up 15%; Q4 up 18% Operating margins expanded from 3.3% in Q1 to 4.5% in Q4; full-year at 4.2% Data communications product category expected to be approximately 20% of total WESCO sales with TVC acquisition versus 2% in 2005 Industrial 27.9% 5.7% 22.3% Over $2B + Global Accounts opportunity pipeline Broad based recovery, 11 of 16 Global Accounts industry verticals grew in 2010 with 8 growing double digits Robust bidding activity levels as industrial companies look to consolidate their supply base Construction 15.4% (2.5%) 6.9% Backlog is up 18% over last year Data communications, International and Canadian pipeline and projects remain robust Economic indicators signal non-residential construction market recovering in 2012 Utility (6.7%) (8.8%) (14.6%) 2010 sales are flat excluding the non-renewal of two utility alliances in 2009 Competitive pressures continue Bidding activity picking up with investor owned utilities and contractors in transmission and substation projects Commercial, Institutional, Government (CIG) 22.4% 4.8% 11.6% 2010 sales were up 32% to government agencies and government contractors Government and stimulus opportunity pipeline over $400 million Stimulus related bookings increased to over $150 million since passage of ARRA Fourth Quarter 2010 End Market Comments Sequential and year-over-year quarterly comparisons |
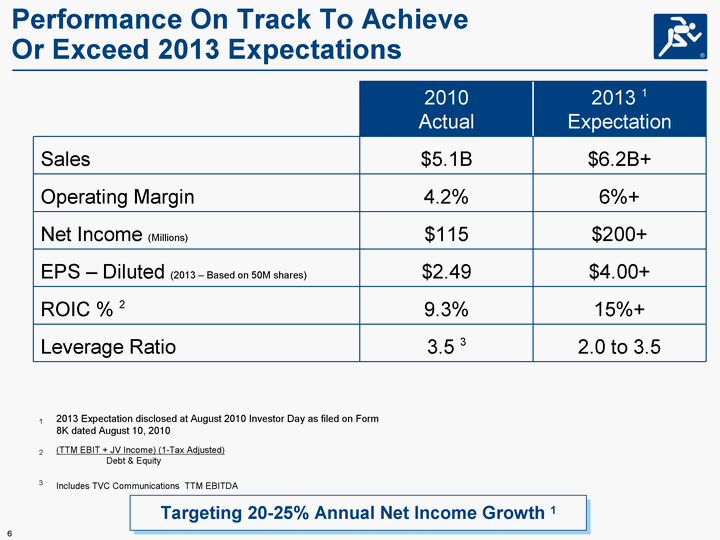
| Performance On Track To Achieve Or Exceed 2013 Expectations 2010 Actual 2013 1 Expectation Sales $5.1B $6.2B+ Operating Margin 4.2% 6%+ Net Income (Millions) $115 $200+ EPS - Diluted (2013 - Based on 50M shares) $2.49 $4.00+ ROIC % 2 9.3% 15%+ Leverage Ratio 3.5 3 2.0 to 3.5 Targeting 20-25% Annual Net Income Growth 1 1 2013 Expectation disclosed at August 2010 Investor Day as filed on Form 8K dated August 10, 2010 2 (TTM EBIT + JV Income) (1-Tax Adjusted) Debt & Equity 3 Includes TVC Communications TTM EBITDA |
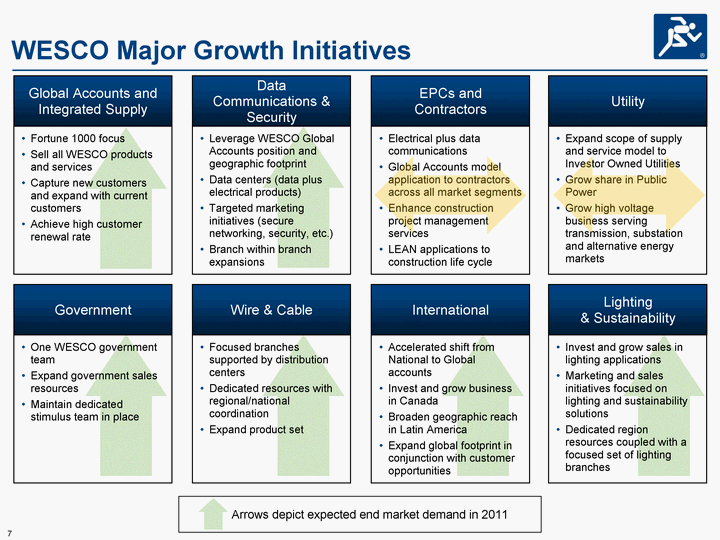
| WESCO Major Growth Initiatives Arrows depict expected end market demand in 2011 Fortune 1000 focus Sell all WESCO products and services Capture new customers and expand with current customers Achieve high customer renewal rate Global Accounts and Integrated Supply Electrical plus data communications Global Accounts model application to contractors across all market segments Enhance construction project management services LEAN applications to construction life cycle EPCs and Contractors Accelerated shift from National to Global accounts Invest and grow business in Canada Broaden geographic reach in Latin America Expand global footprint in conjunction with customer opportunities International One WESCO government team Expand government sales resources Maintain dedicated stimulus team in place Government Expand scope of supply and service model to Investor Owned Utilities Grow share in Public Power Grow high voltage business serving transmission, substation and alternative energy markets Utility Leverage WESCO Global Accounts position and geographic footprint Data centers (data plus electrical products) Targeted marketing initiatives (secure networking, security, etc.) Branch within branch expansions Data Communications & Security Invest and grow sales in lighting applications Marketing and sales initiatives focused on lighting and sustainability solutions Dedicated region resources coupled with a focused set of lighting branches Lighting & Sustainability Focused branches supported by distribution centers Dedicated resources with regional/national coordination Expand product set Wire & Cable |
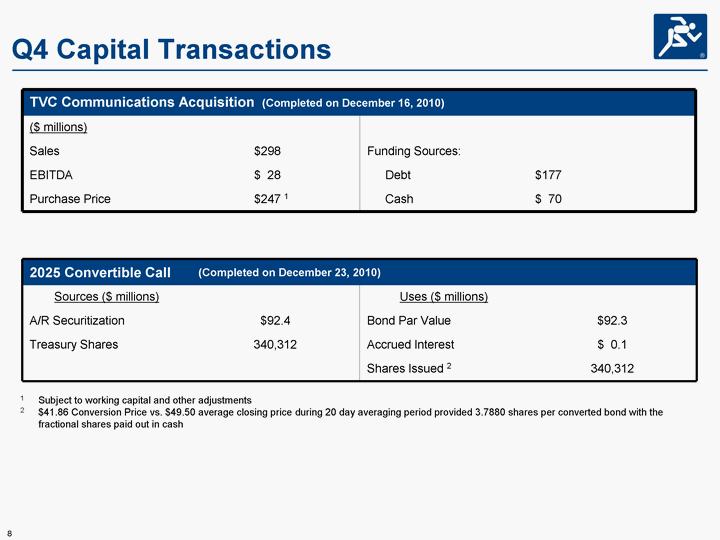
| Q4 Capital Transactions TVC Communications Acquisition (Completed on December 16, 2010) TVC Communications Acquisition (Completed on December 16, 2010) TVC Communications Acquisition (Completed on December 16, 2010) TVC Communications Acquisition (Completed on December 16, 2010) ($ millions) Sales $298 Funding Sources: EBITDA $ 28 Debt $177 Purchase Price $247 1 Cash $ 70 2025 Convertible Call (Completed on December 23, 2010) (Completed on December 23, 2010) Sources ($ millions) Uses ($ millions) A/R Securitization $92.4 Bond Par Value $92.3 Treasury Shares 340,312 Accrued Interest $ 0.1 Shares Issued 2 340,312 1 Subject to working capital and other adjustments 2 $41.86 Conversion Price vs. $49.50 average closing price during 20 day averaging period provided 3.7880 shares per converted bond with the fractional shares paid out in cash |
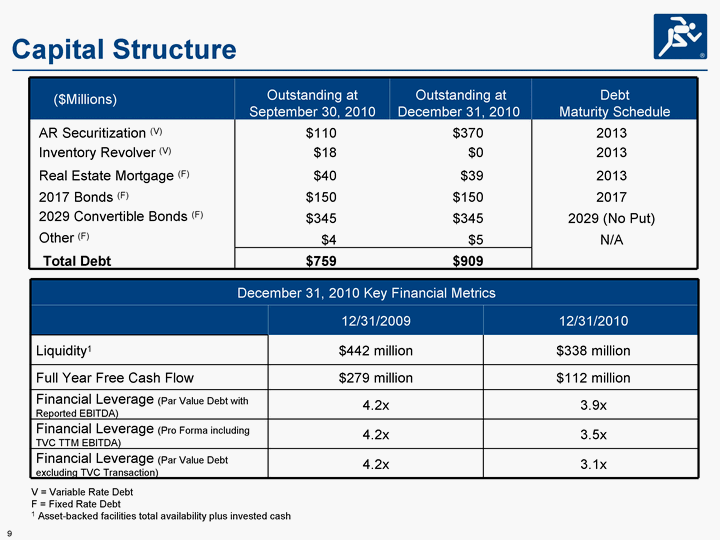
| December 31, 2010 Key Financial Metrics December 31, 2010 Key Financial Metrics December 31, 2010 Key Financial Metrics 12/31/2009 12/31/2010 Liquidity1 $442 million $338 million Full Year Free Cash Flow $279 million $112 million Financial Leverage (Par Value Debt with Reported EBITDA) 4.2x 3.9x Financial Leverage (Pro Forma including TVC TTM EBITDA) 4.2x 3.5x Financial Leverage (Par Value Debt excluding TVC Transaction) 4.2x 3.1x ($Millions) Outstanding at September 30, 2010 Outstanding at September 30, 2010 Outstanding at December 31, 2010 Outstanding at December 31, 2010 Debt Maturity Schedule Debt Maturity Schedule AR Securitization (V) $110 $370 $370 2013 Inventory Revolver (V) $18 $0 $0 2013 Real Estate Mortgage (F) $40 $39 $39 2013 2017 Bonds (F) $150 $150 $150 2017 2029 Convertible Bonds (F) $345 $345 $345 2029 (No Put) Other (F) $4 $5 $5 N/A Total Debt $759 $909 $909 Capital Structure V = Variable Rate Debt F = Fixed Rate Debt 1 Asset-backed facilities total availability plus invested cash |
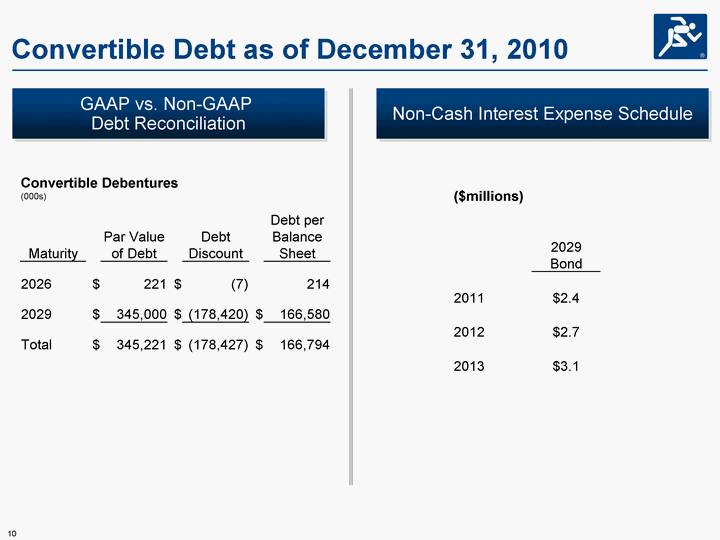
| Convertible Debt as of December 31, 2010 GAAP vs. Non-GAAP Debt Reconciliation Non-Cash Interest Expense Schedule ($millions) ($millions) ($millions) ($millions) ($millions) 2029 Bond 2011 $2.4 2012 $2.7 2013 $3.1 Convertible Debentures (000s) Convertible Debentures (000s) Convertible Debentures (000s) Convertible Debentures (000s) Convertible Debentures (000s) Convertible Debentures (000s) Convertible Debentures (000s) Convertible Debentures (000s) Maturity Par Value of Debt Debt Discount Debt per Balance Sheet 2026 $ 221 $ (7) 214 2029 $ 345,000 $ (178,420) $ 166,580 Total $ 345,221 $ (178,427) $ 166,794 |
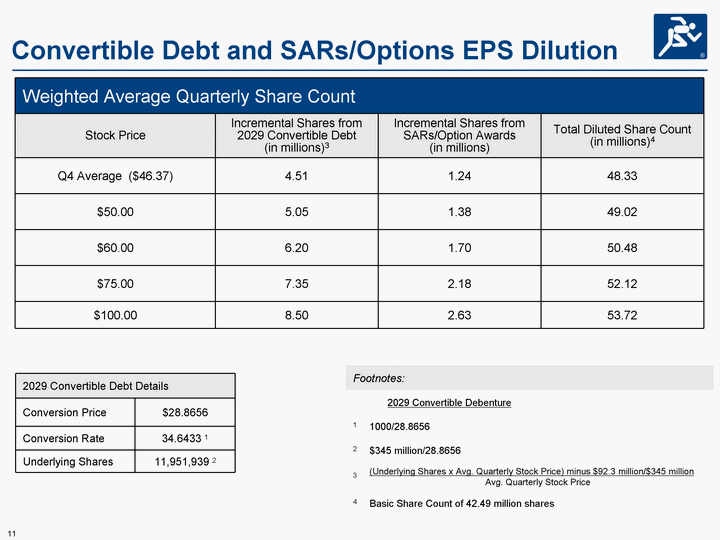
| Convertible Debt and SARs/Options EPS Dilution Weighted Average Quarterly Share Count Weighted Average Quarterly Share Count Weighted Average Quarterly Share Count Weighted Average Quarterly Share Count Stock Price Incremental Shares from 2029 Convertible Debt (in millions)3 Incremental Shares from SARs/Option Awards (in millions) Total Diluted Share Count (in millions)4 Q4 Average ($46.37) 4.51 1.24 48.33 $50.00 5.05 1.38 49.02 $60.00 6.20 1.70 50.48 $75.00 7.35 2.18 52.12 $100.00 8.50 2.63 53.72 2029 Convertible Debt Details 2029 Convertible Debt Details Conversion Price $28.8656 Conversion Rate 34.6433 1 Underlying Shares 11,951,939 2 Footnotes: Footnotes: Footnotes: 2029 Convertible Debenture 1 1000/28.8656 2 $345 million/28.8656 3 (Underlying Shares x Avg. Quarterly Stock Price) minus $92.3 million/$345 million Avg. Quarterly Stock Price (Underlying Shares x Avg. Quarterly Stock Price) minus $92.3 million/$345 million Avg. Quarterly Stock Price 4 Basic Share Count of 42.49 million shares Basic Share Count of 42.49 million shares |
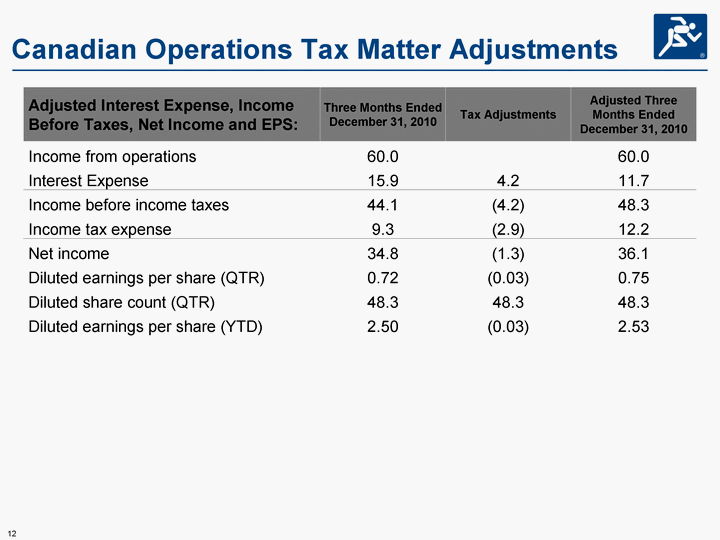
| Canadian Operations Tax Matter Adjustments Adjusted Interest Expense, Income Before Taxes, Net Income and EPS: Three Months Ended December 31, 2010 Tax Adjustments Adjusted Three Months Ended December 31, 2010 Income from operations 60.0 60.0 Interest Expense 15.9 4.2 11.7 Income before income taxes 44.1 (4.2) 48.3 Income tax expense 9.3 (2.9) 12.2 Net income 34.8 (1.3) 36.1 Diluted earnings per share (QTR) 0.72 (0.03) 0.75 Diluted share count (QTR) 48.3 48.3 48.3 Diluted earnings per share (YTD) 2.50 (0.03) 2.53 |
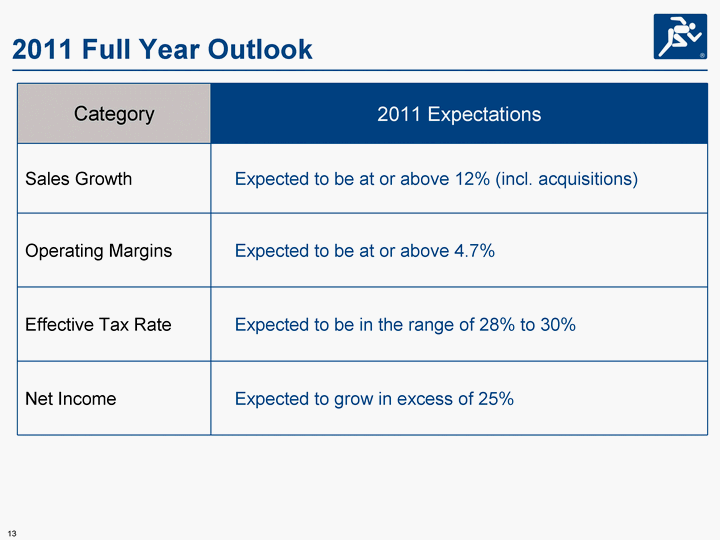
| 2011 Full Year Outlook Category 2011 Expectations 2011 Expectations Sales Growth Expected to be at or above 12% (incl. acquisitions) Operating Margins Expected to be at or above 4.7% Effective Tax Rate Expected to be in the range of 28% to 30% Net Income Expected to grow in excess of 25% |
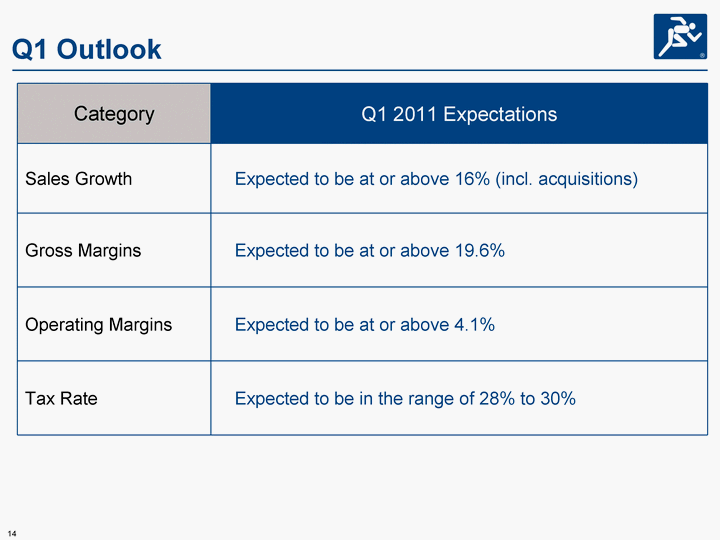
| Q1 Outlook Category Q1 2011 Expectations Q1 2011 Expectations Sales Growth Expected to be at or above 16% (incl. acquisitions) Gross Margins Expected to be at or above 19.6% Operating Margins Expected to be at or above 4.1% Tax Rate Expected to be in the range of 28% to 30% |
