Attached files
| file | filename |
|---|---|
| 8-K - FORM 8-K - FLAGSTAR BANCORP INC | k49991e8vk.htm |
| EX-99.1 - EX-99.1 - FLAGSTAR BANCORP INC | k49991exv99w1.htm |
Exhibit 99.2

| 1 Troy, Michigan Presenters: Joseph P. Campanelli Chief Executive Officer Paul D. Borja Chief Financial Officer Q4 2010 Results |

| 2 The information contained in this presentation is not intended as a solicitation to buy Flagstar Bancorp, Inc. stock and is provided for general information. This presentation may include forward-looking statements and include comments with respect to our objectives and strategies, and the results of our operations and our business. Forward-looking statements can be identified by the fact that they do not relate strictly to historical or current facts. They often include words such as "expects," "assumes," "anticipates," "intends," "plans," "believes," "seeks," "estimates" or words of similar meaning, or future or conditional words such as "assuming," "will," "would," "possible," "proposed," "projected," "positioned," "vision," "opportunity," "should," "could," "indicative," "target" or "may." Forward-looking statements provide our expectations or predictions of future conditions, events or results. They are not guarantees of future performance. By their nature, these forward-looking statements involve numerous assumptions, uncertainties and opportunities, both general and specific. These statements speak only as of the date they are made. We do not undertake to update forward-looking statements to reflect the impact of circumstances or events that arise after the date the forward-looking statements were made. There a number of factors, many of which are beyond our control that could cause actual conditions, events or results to differ significantly from those described in the forward looking statements. Some of these are: Volatile interest rates that impact, amongst other things, (i) the mortgage banking business, (ii) our ability to originate loans and sell assets at a profit, (iii) prepayment speeds and (iv) our cost of funds, could adversely affect earnings, growth opportunities and our ability to pay dividends to shareholders. Our ability to maintain capital levels. Competitive factors for loans could negatively impact gain on loan sale margins. Competition from banking and non-banking companies for deposits and loans can affect our growth opportunities, earnings, gain on sale margins, market share and ability to transform business model. Changes in the regulation of financial services companies and government-sponsored housing enterprises, and in particular, declines in the liquidity of the mortgage loan secondary market, could adversely affect business. Changes in regulatory capital requirements or an inability to achieve desired capital ratios could adversely affect our growth and earnings opportunities and our ability to originate certain types of loans, as well as our ability to sell certain types of assets for fair market value or to transform business model. - General business and economic conditions, including unemployment rates, further movements in interest rates, the slope of the yield curve, any increase in fraud and other criminal activity and the further decline of asset values in certain geographic markets, may significantly affect the company's business activities, loan losses, reserves, earnings and business prospects. - Factors concerning the implementation of proposed enhancements and transformation of business model could result in slower implementation times than we anticipate and negate any competitive advantage that we may enjoy. When relying on forward-looking statements to make decisions, investors should carefully consider the aforementioned factors as well as other uncertainties and events. Legal Disclaimer |

| Financials |
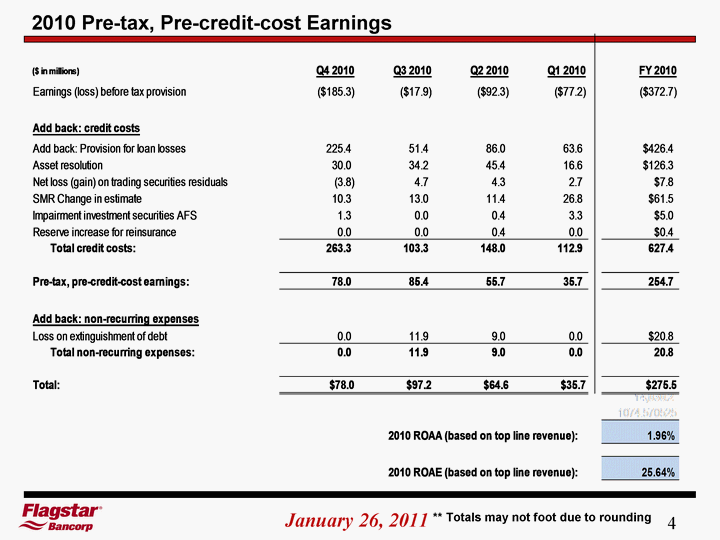
| 4 2010 Pre-tax, Pre-credit-cost Earnings ** Totals may not foot due to rounding |

| 5 Net Income ** Totals may not foot due to rounding |

| 6 Net Interest Income ** Totals may not foot due to rounding |

| 7 Non Interest Income ** Totals may not foot due to rounding |

| 8 Non Interest Expense ** Totals may not foot due to rounding |

| 9 Selected Balance Sheet Items ** Totals may not foot due to rounding |

| 10 Decline in Credit Related Expenses ** Totals may not foot due to rounding * Provision for Q4 2010 excludes $176.5 million related to a loss on the sale of $474 million of non-performing loans and the transfer of $104.2 million to the available for sale category |

| Mortgage Banking |

| 12 Gain on Loan Sales ($ in millions) |

| 13 Loan Production - Historical Trend Flagstar's Mission ($ in millions) |

| 14 Loan Production ** Totals may not foot due to rounding |
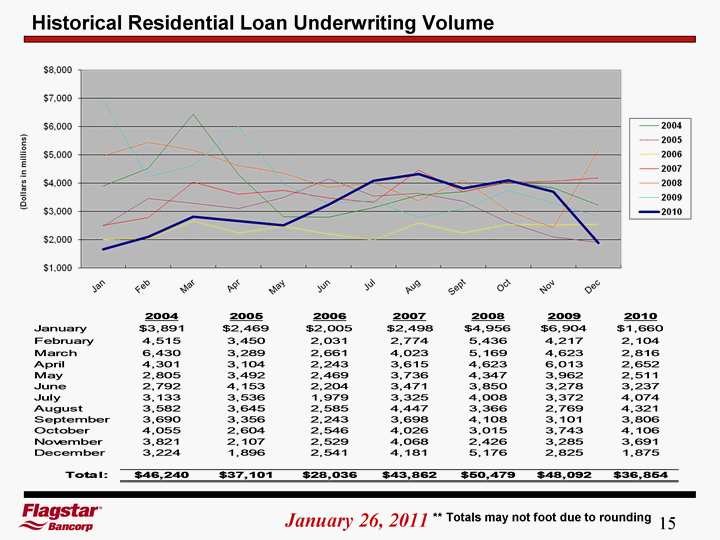
| 15 Historical Residential Loan Underwriting Volume ** Totals may not foot due to rounding |

| 16 Historical Residential Loan Lock Volume ** Totals may not foot due to rounding |

| 17 Historical Residential Loan Closing Volume ** Totals may not foot due to rounding |

| Funding |

| 19 Total Funding Breakout ** Totals may not foot due to rounding Dec 31, 2010 |

| 20 Deposits - Ending Balances ** Totals may not foot due to rounding (1) Ending balance and rate for the period noted |

| 21 Growth in Core Deposits ** Totals may not foot due to rounding * Includes checking accounts, savings accounts, and money market accounts (excludes custodial accounts) Note: Deposits represent month end balances |
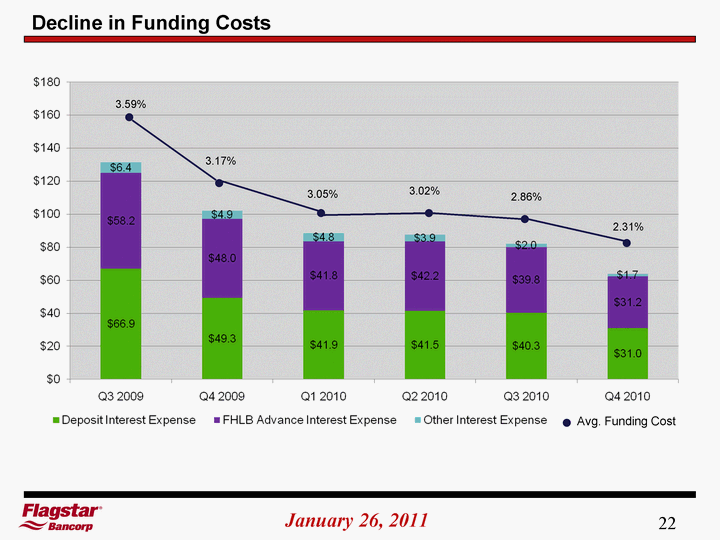
| 22 Decline in Funding Costs 2.86% 3.02% 3.59% 3.05% 3.17% Avg. Funding Cost 2.31% |

| Portfolio |

| 24 Residential First Mortgages * As of Dec 31, 2010 ($ in thousands) Residential First Mortgage Portfolio - by State ** Totals may not foot due to rounding * Reflects unpaid principal balance of underlying loans before accounting adjustments for discounts and other items. Also excludes loans eligible for repurchase from Ginnie Mae pools |

| 25 Residential First Mortgages * As of Dec 31, 2010 ($ in thousands) Residential First Mortgage Portfolio - by LTV ** Totals may not foot due to rounding Reflects unpaid principal balance of underlying loans before accounting adjustments for discounts and other items. Also excludes loans eligible for repurchase from Ginnie Mae pools ** LTV equals current principal balance divided by appraised value at origination |

| 26 Residential First Mortgages * As of Dec 31, 2010 ($ in thousands) Residential First Mortgage Portfolio - by Original FICO ** Totals may not foot due to rounding Reflects unpaid principal balance of underlying loans before accounting adjustments for discounts and other items. Also excludes loans eligible for repurchase from Ginnie Mae pools |
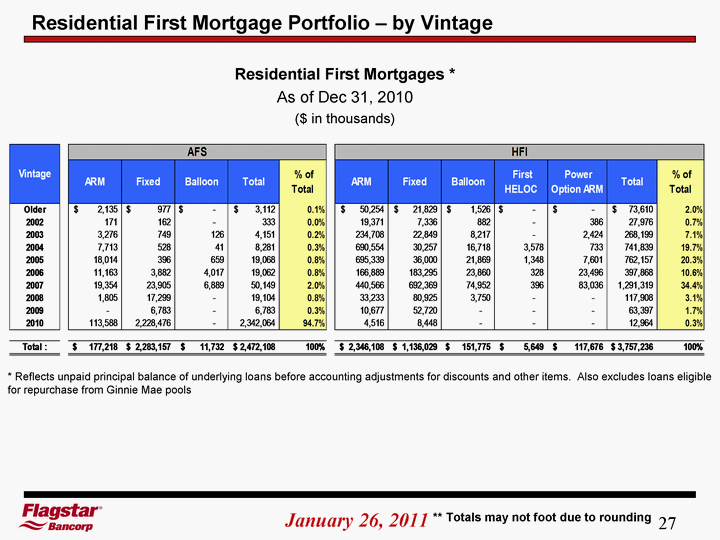
| 27 Residential First Mortgages * As of Dec 31, 2010 ($ in thousands) Residential First Mortgage Portfolio - by Vintage ** Totals may not foot due to rounding * Reflects unpaid principal balance of underlying loans before accounting adjustments for discounts and other items. Also excludes loans eligible for repurchase from Ginnie Mae pools |

| 28 As of Dec 31, 2010 ($ in 000's) Commercial Real Estate (CRE) Portfolio ** Totals may not foot due to rounding |

| 29 As of Dec 31, 2010 ($ in 000's) Non Agency Investment Securities Available for Sale Portfolio ** Totals may not foot due to rounding |

| 30 As of Dec 31, 2010 ($ in 000's) Real Estate Owned Portfolio ** Totals may not foot due to rounding |

| Asset Quality |

| 32 Asset Quality ** Totals may not foot due to rounding |

| 33 NPL Sale / Equity Offering Provides Strengthened Asset Quality Ratios Flagstar's Mission NPAs 1 / Total Assets NPLs Held for Investment / LHFI ALLL / NPLs Held for Investment NPAs 1 / Tier One + General Reserves (Texas Ratio) 65% increase 59% decrease 47% decrease 44% decrease Includes non-performing loans available for sale |

| 34 Flagstar Asset Quality Performance versus OCC and OTS Peers Flagstar's Mission % of Performing First Mortgage Loans Held for Investment % of Seriously Delinquent First Mortgage Loans Held for Investment 1 1) 60+ day delinquent first mortgage loans * Source: OCC and OTS Mortgage Metrics Report, data as of third quarter 2010. Performance data based on first-lien residential first mortgages serviced by national banks and federally chartered thrifts, which represent 64% of all US mortgages. 13% increase 72% decrease |

| 35 1) Over 90 day delinquent plus matured plus performing non accrual, calculated using OTS method 2) Includes $327.3 million of charge offs related to the sale of $474 million of non-performing loans Asset Quality By Loan Type - HFI ** Totals may not foot due to rounding |

| 36 * Calculated using OTS method Historical Monthly Delinquency Trends - HFI First Mortgage |

| 37 * Calculated using OTS method Historical Monthly Delinquency Trends - HFI Second Mortgage |

| 38 * Calculated using OTS method Historical Monthly Delinquency Trends - HFI HELOC |

| 39 * Includes performing non accrual commercial RE loans Historical Monthly Delinquency Trends - HFI Commercial RE |

| 40 Historical Loan Sales - Agency vs. Non Agency (in millions) |
| Capital |
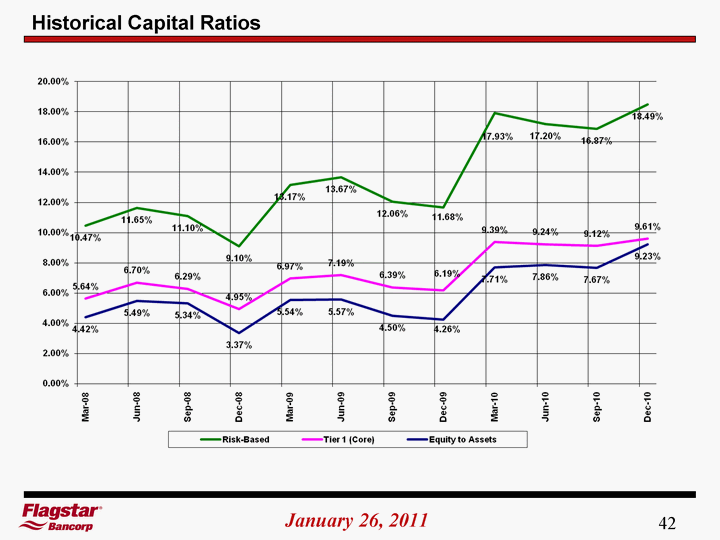
| 42 Historical Capital Ratios |
| 2011 Outlook |

| 44 2011 Outlook |

| Appendix |

| 46 1) Calculated using OTS method Delinquent Loans by Loan Type - HFI ** Totals may not foot due to rounding |

| 47 HFI Residential First Mortgage Portfolio As of Dec 31, 2010 ($ in 000's) * 90 day + matured and non performing accruals, calculated using OTS method HFI Residential 1st Mortgage Portfolio - by FICO and LTV ** Totals may not foot due to rounding ** LTV equals current principal balance divided by appraised value at origination |
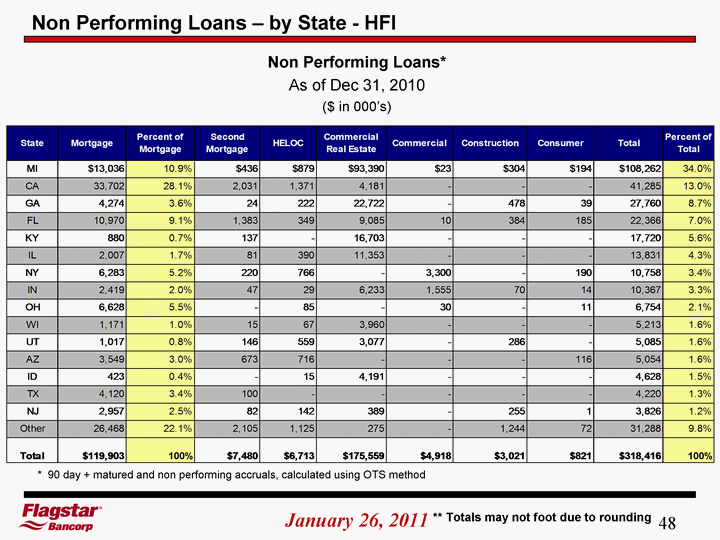
| 48 Non Performing Loans* As of Dec 31, 2010 ($ in 000's) * 90 day + matured and non performing accruals, calculated using OTS method Non Performing Loans - by State - HFI ** Totals may not foot due to rounding |

| 49 Non Performing Loans* As of Dec 31, 2010 ($ in 000's) * 90 day + matured and non performing accruals, calculated using OTS method Non Performing Loans - by Vintage - HFI ** Totals may not foot due to rounding |

| 50 Commercial Real Estate Portfolio* As of Dec 31, 2010 ($ in 000's) Commercial Real Estate (CRE) Portfolio - by Vintage ** Totals may not foot due to rounding Reflects unpaid principal balance of underlying loans before accounting adjustments for discounts and other items. Also excludes commercial letters of credit |
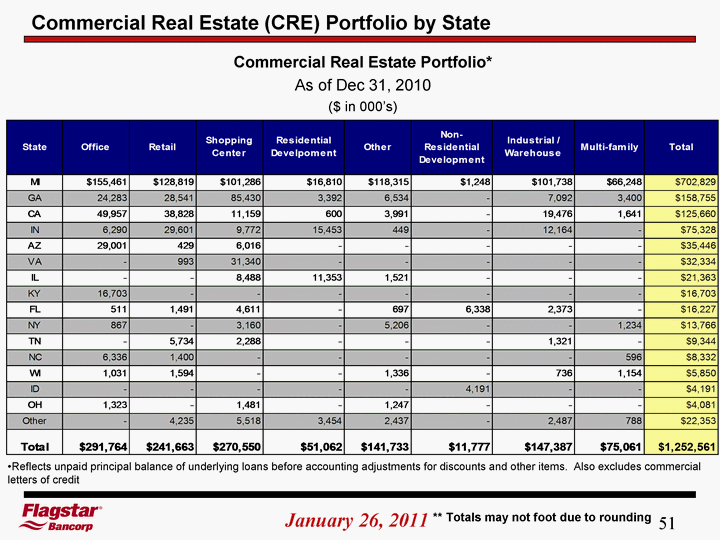
| 51 Commercial Real Estate Portfolio* As of Dec 31, 2010 ($ in 000's) Commercial Real Estate (CRE) Portfolio by State ** Totals may not foot due to rounding Reflects unpaid principal balance of underlying loans before accounting adjustments for discounts and other items. Also excludes commercial letters of credit |

| 52 |
