Attached files
| file | filename |
|---|---|
| 8-K - WESTERN ALLIANCE BANCORPORATION 8-K - WESTERN ALLIANCE BANCORPORATION | a6583825.htm |
| EX-99.1 - EXHIBIT 99.1 - WESTERN ALLIANCE BANCORPORATION | a6583825ex99-1.htm |
Exhibit 99.2
Robert Sarver Chairman & CEO Ken Vecchione President & COO Dale Gibbons Executive Vice President & CFO 4th Quarter 2010 Earnings Call Western Alliance Bancorporation (NYSE: WAL) January 27, 2011
Forward-Looking Information This presentation contains forward-looking statements that relate to expectations, beliefs, projections, future plans and strategies, anticipated events or trends and similar expressions concerning matters that are not historical facts. The forward-looking statements contained herein reflect our current views about future events and financial performance and are subject to risks, uncertainties, assumptions and changes in circumstances that may cause our actual results to differ significantly from historical results and those expressed in any forward-looking statement. Some factors that could cause actual results to differ materially from historical or expected results include: factors listed in the Company’s annual report on Form 10-K as filed with the Securities and Exchange Commission; changes in general economic conditions, either nationally or locally in the areas in which we conduct or will conduct our business; inflation, interest rate, market and monetary fluctuations; increases in competitive pressures among financial institutions and businesses offering similar products and services; higher defaults on our loan portfolio than we expect; changes in management’s estimate of the adequacy of the allowance for loan losses; legislative or regulatory changes or changes in accounting principles, policies or guidelines; supervisory actions by regulatory agencies which may limit our ability to pursue certain growth opportunities; management’s estimates and projections of interest rates and interest rate policy; the execution of our business plan; and other factors affecting the financial services industry generally or the banking industry in particular. We do not intend and disclaim any duty or obligation to update or revise any industry information or forward-looking statements set forth in this presentation to reflect new information, future events or otherwise.

4th Quarter 2010 Highlights Pre-tax, pre-credit income $25 million (1)Up $0.4 million or 1.6% from Q3-2010 Up $7.7 million or 44.5% from Q4-2009 Net interest income $60.9 million Up $1.4 million or 2.4% from Q3-2010 Net Interest Margin of 4.26% compared to 4.32% in Q3-2010 and 3.84% in Q4-2009 Operating expense $41.9 million (2) Up 1.5% from Q3-2010, flat from Q4-2009 Operating efficiency ratio 62.2% compared to 62.4% in Q3-2010 and 70.6% in Q4-2009 Provision expense of $18.4 million Down 20.0% from Q3-2010 and down 54.9% from Q4-2009 Net charge offs down 35.9% from Q3-2010 and 56.3% from Q4-2009
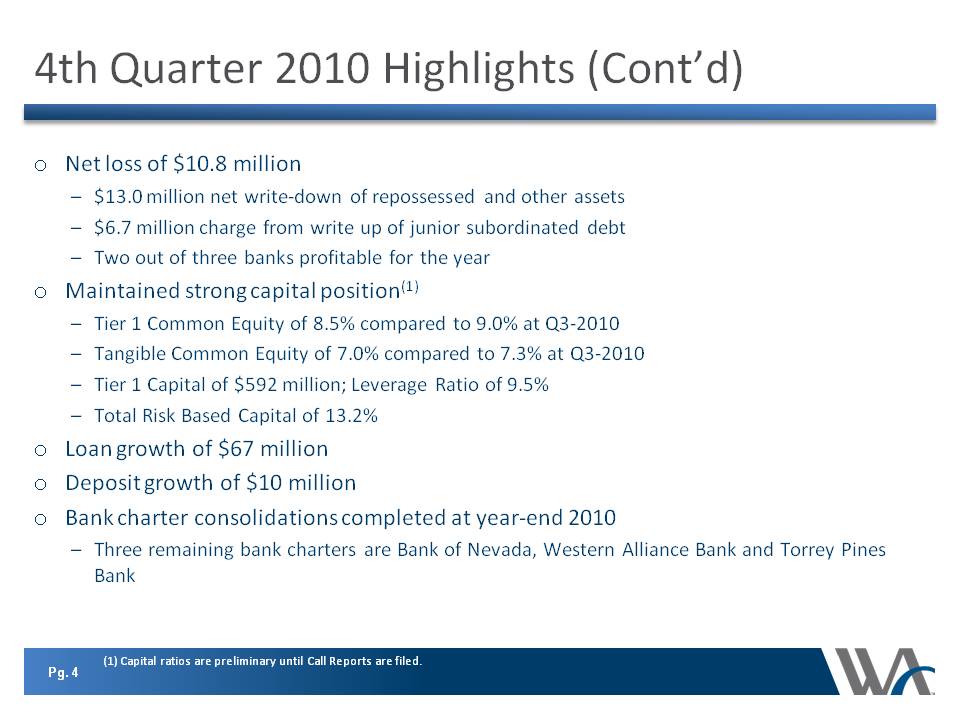
4th Quarter 2010 Highlights (Cont’d) Net loss of $10.8 million $13.0 million net write-down of repossessed and other assets $6.7 million charge from write up of junior subordinated debt Two out of three banks profitable for the year Maintained strong capital position(1) Tier 1 Common Equity of 8.5% compared to 9.0% at Q3-2010 Tangible Common Equity of 7.0% compared to 7.3% at Q3-2010 Tier 1 Capital of $592 million; Leverage Ratio of 9.5% Total Risk Based Capital of 13.2% Loan growth of $67 million Deposit growth of $10 million Bank charter consolidations completed at year-end 2010 Three remaining bank charters are Bank of Nevada, Western Alliance Bank and Torrey Pines Bank
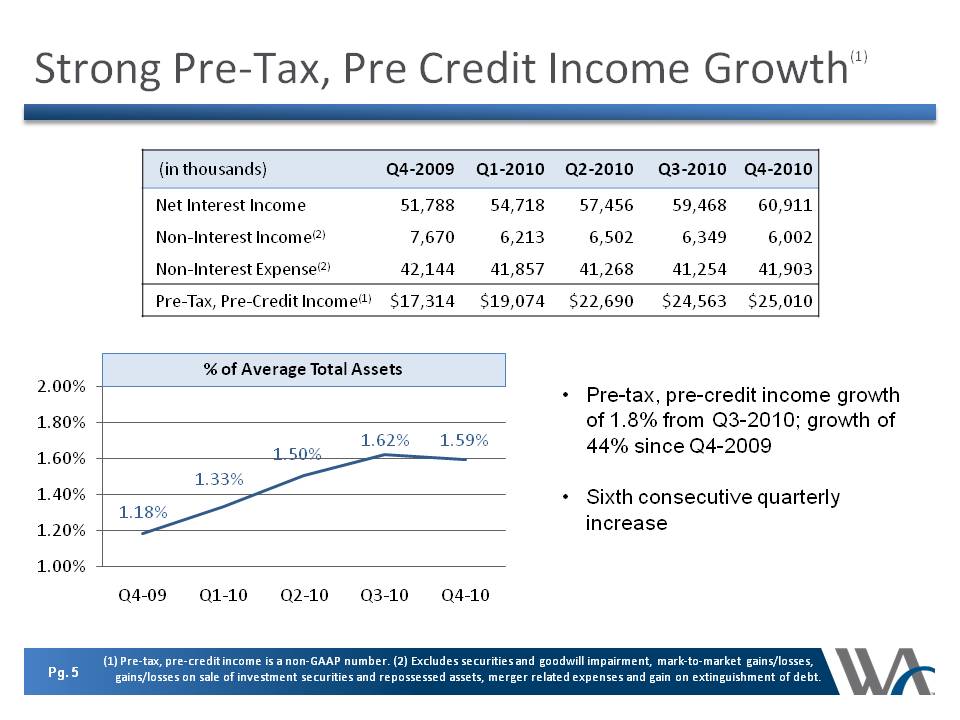
Strong Pre-Tax, Pre Credit Income Growth(1) Pre-tax, pre-credit income growth of 1.8% from Q3-2010; growth of 44% since Q4-2009 Sixth consecutive quarterly increase % of Average Total Assets (in thousands) Q4-2009 Q1-2010 Q2-2010 Q3-2010 Q4-2010 Net Interest Income 51,788 54,718 57,456 59,468 60,911 Non-Interest Income(2) 7,670 6,213 6,502 6,349 6,002 Non-Interest Expense(2) 42,144 41,857 41,268 41,254 41,903 Pre-Tax, Pre-Credit Income(1) $17,314 $19,074 $22,690 $24,563 $25,010 Q4-09 Q1-10 Q2-10 Q3-10 Q4-10 1.18% 1.33% 1.50% 1.62% 1.59%
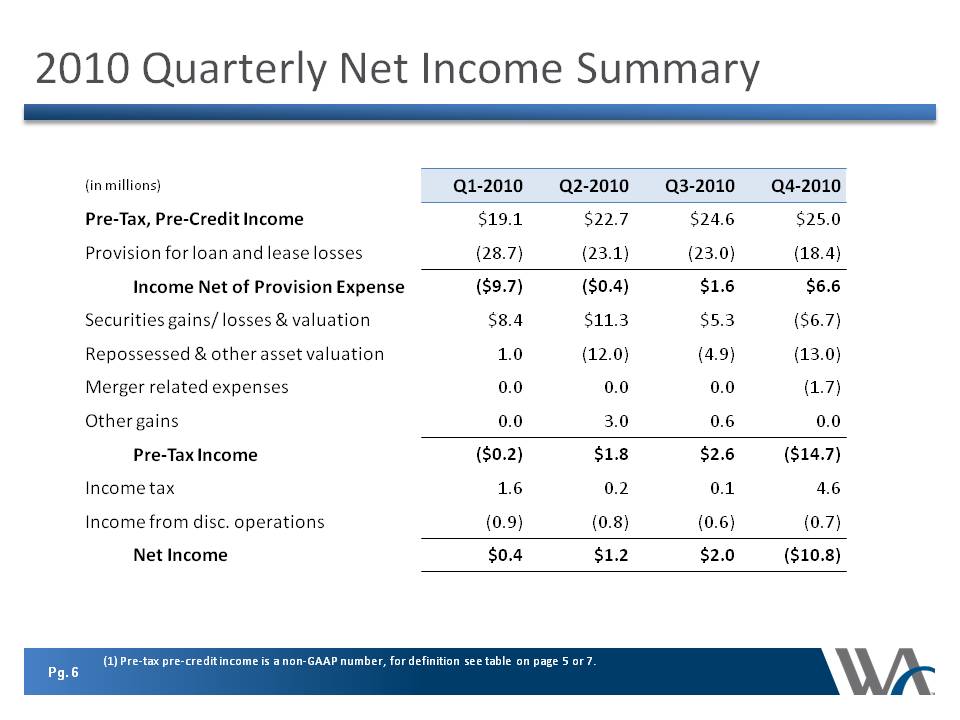
2010 Quarterly Net Income Summary (in millions) Q1-2010 Q2-2010 Q3-2010 Q4-2010 Pre-Tax, Pre-Credit Income $19.1 $22.7 $24.6 $25.0 Provision for loan and lease losses (28.7) (23.1) (23.0) (18.4) Income Net of Provision Expense ($9.7) ($0.4) $1.6 $6.6 Securities gains/ losses & valuation $8.4 $11.3 $5.3 ($6.7) Repossessed & other asset valuation 1.0 (12.0) (4.9) (13.0) Merger related expenses 0.0 0.0 0.0 (1.7) Other gains 0.0 3.0 0.6 0.0 Pre-Tax Income ($0.2) $1.8 $2.6 ($14.7) Income tax 1.6 0.2 0.1 4.6 Income from disc. operations (0.9) (0.8) (0.6) (0.7) Net Income $0.4 $1.2 $2.0 ($10.8)
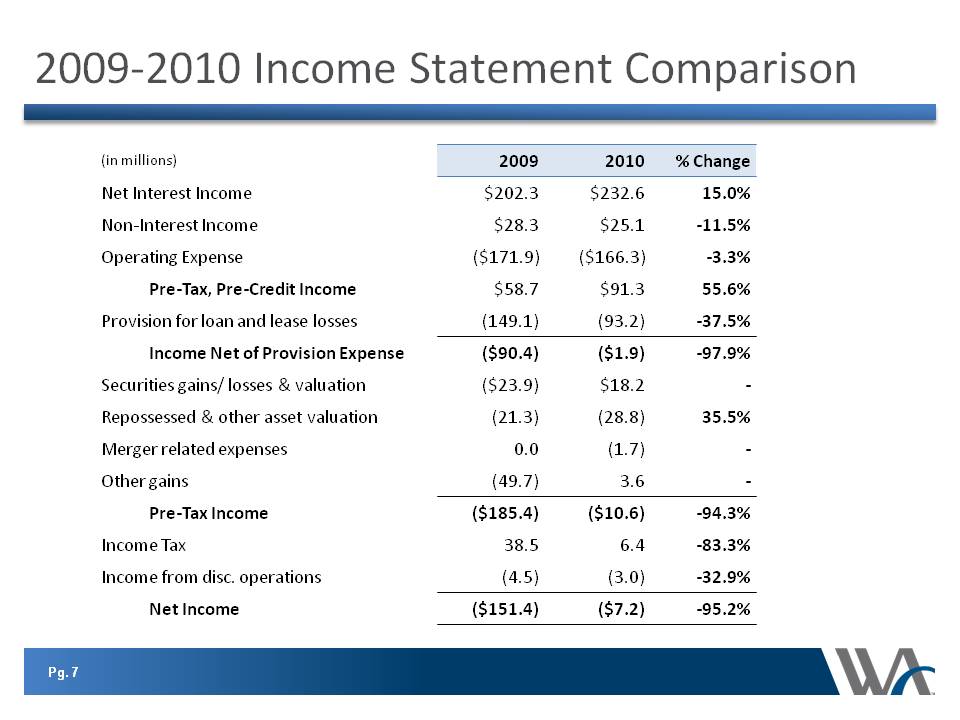
2009-2010 Income Statement Comparison (in millions) 2009 2010 % Change Net Interest Income $202.3 $232.6 15.0% Non-Interest Income $28.3 $25.1 -11.5% Operating Expense ($171.9) ($166.3) -3.3% Pre-Tax, Pre-Credit Income $58.7 $91.3 55.6% Provision for loan and lease losses (149.1) (93.2) -37.5% Income Net of Provision Expense ($90.4) ($1.9) -97.9% Securities gains/ losses & valuation ($23.9) $18.2 - Repossessed & other asset valuation (21.3) (28.8) 35.5% Merger related expenses 0.0 (1.7) - Other gains (49.7) 3.6 - Pre-Tax Income ($185.4) ($10.6) -94.3% Income Tax 38.5 6.4 -83.3% Income from disc. operations (4.5) (3.0) -32.9% Net Income ($151.4) ($7.2) -95.2%
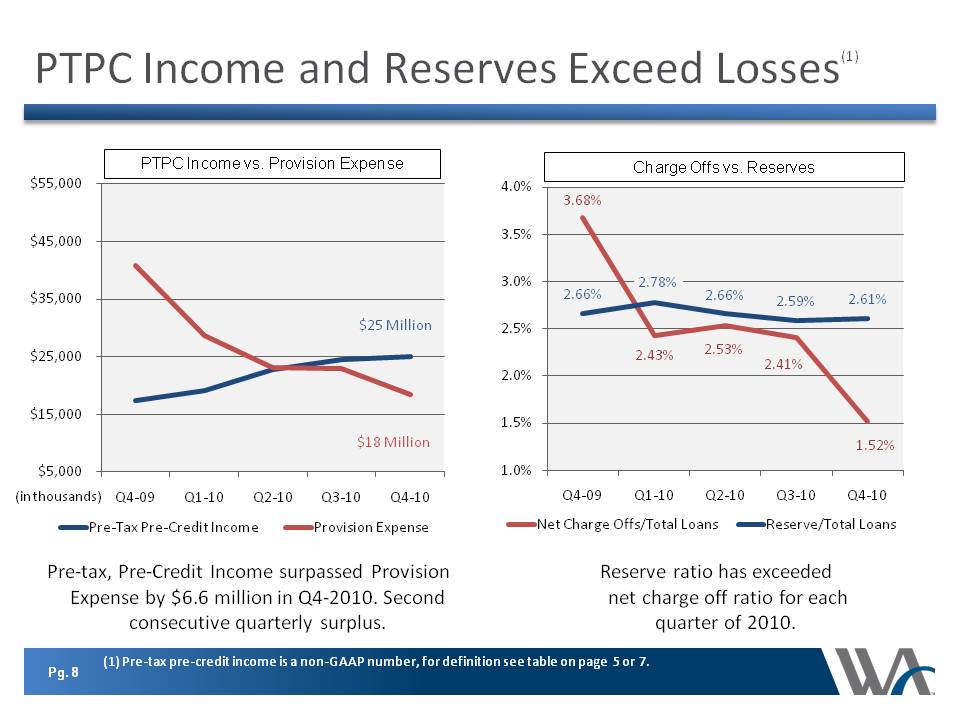
PTPC Income and Reserves Exceed Losses(1) Pre-tax, Pre-Credit Income surpassed Provision Expense by $6.6 million in Q4-2010. Second consecutive quarterly surplus. (in thousands) Reserve ratio has exceeded net charge off ratio for each quarter of 2010. Charge Offs vs. Reserves PTPC Income vs. Provision Expense Q1-10 Q1-10 net c/o 24,647 112,724 reserve average loans 4,053,520.32 4,059,117 total loans % 2.47% 2.78% % Q2-10 Q2-10 net c/o 25,826 110,013 reserve average loans 4,080,005 4,129,950 total loans % 2.54% 2.66% % Q3-10 Q3-10 net c/o 24,807 109,720 reserve average loans 4,115,894 4,173,403 total loans % 2.42% 2.63% % Q4-10 Q4-10 net c/o 15,855 110,700 reserve average loans 4,196,248 4,240,542 total loans % 1.52% 2.61% %
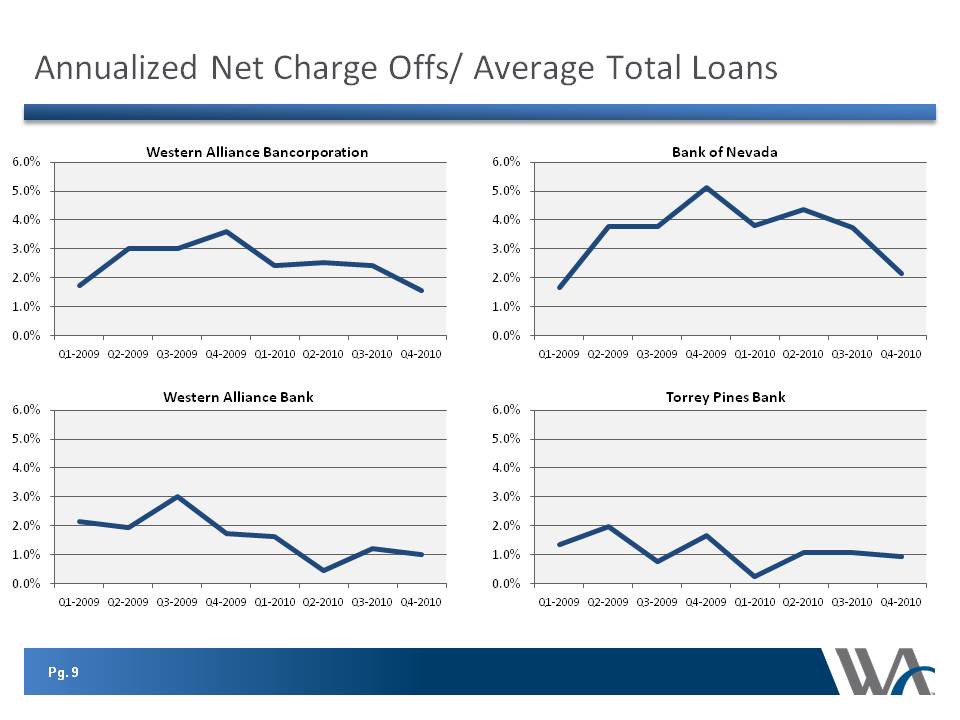
Annualized Net Charge Offs/ Average Total Loans Column1 Q1-2009 Q2-2009 Q3-2009 Q4-2009 Q1-2010 Q2-2010 Q3-2010 Q4-2010 Annualized Net Charge Offs to Total Loans 1.72% 3.00% 3.02% 3.60% 2.43% 2.54% 2.43% 1.54%
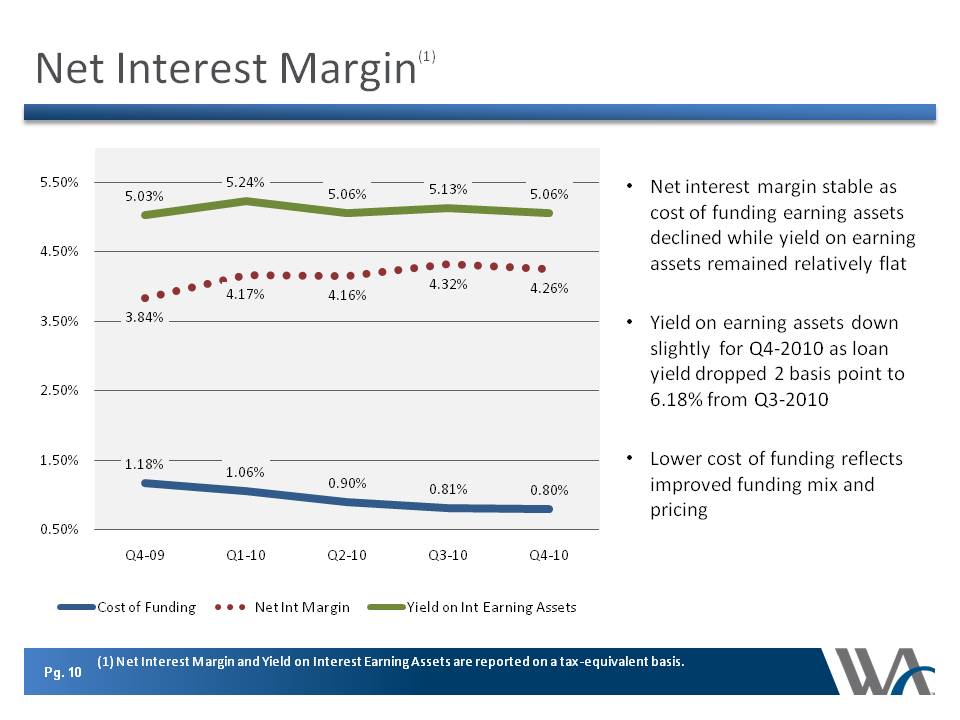
Net Interest Margin(1) Net interest margin stable as cost of funding earning assets declined while yield on earning assets remained relatively flat Yield on earning assets down slightly for Q4-2010 as loan yield dropped 2 basis point to 6.18% from Q3-2010 Lower cost of funding reflects improved funding mix and pricing Quarter Cost of Funding Net Int Margin Yield on Int Earning Assets Q4-09 1.18% 3.84% 5.03% Q1-10 1.06% 4.17% 5.24% Q2-10 0.90% 4.16% 5.06% Q3-10 0.81% 4.32% 5.13% Q4-10 0.80% 4.26% 5.06%
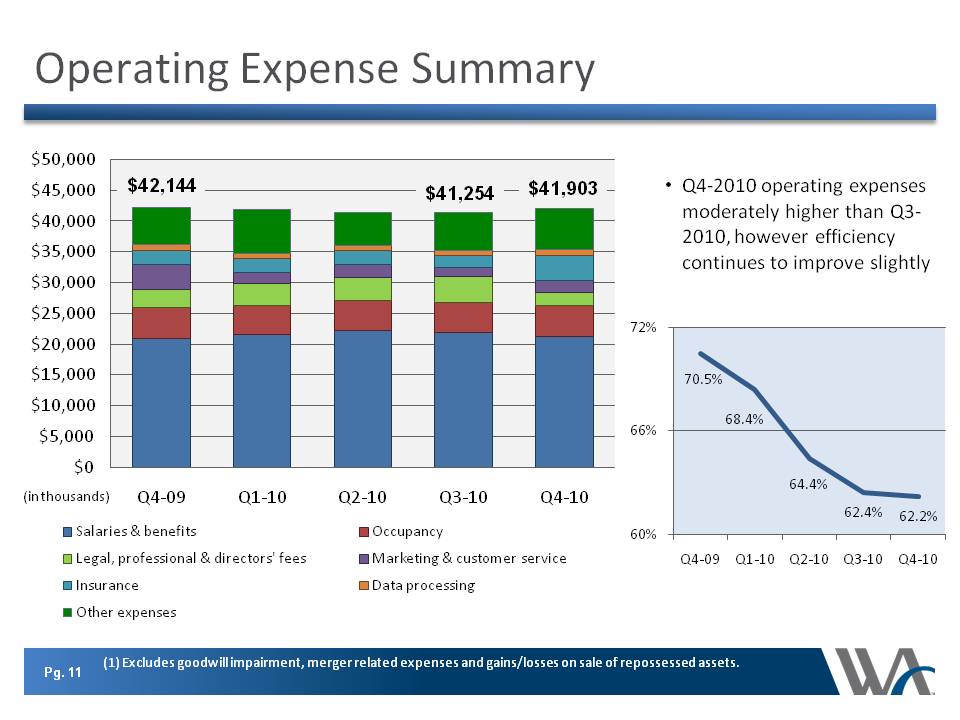
Operating Expense Summary $42,144 (in thousands) $41,903 $41,254 Q4-2010 operating expenses moderately higher than Q3-2010, however efficiency continues to improve slightly Q4-09 70.5% Q1-10 68.4% Q2-10 64.4% Q3-10 62.4% Q4-10 62.2%
Trust Preferred Valuation Western Alliance currently has outstanding $64.5 million of aggregate principal trust preferred securities with an average contractual rate of three month LIBOR +248 basis points and average maturity in 2035 The company re-values this debt to current market values based on the median spread to treasurys of a pool of publicly traded non-rated issuances similar to its own This valuation reached a low point at 6/30/10 of $36.3 million (an adjusted spread of 698 basis points over LIBOR) At 12/31/10 the market spread to treasury for the same comparable pool of issuances tightened back to 557 basis points. This resulted in write up of our trust preferred securities to $43.0 million and a charge to income of $6.7 million In aggregate for 2010, the company’s fair value adjustments net to a $0.4 million charge for the year
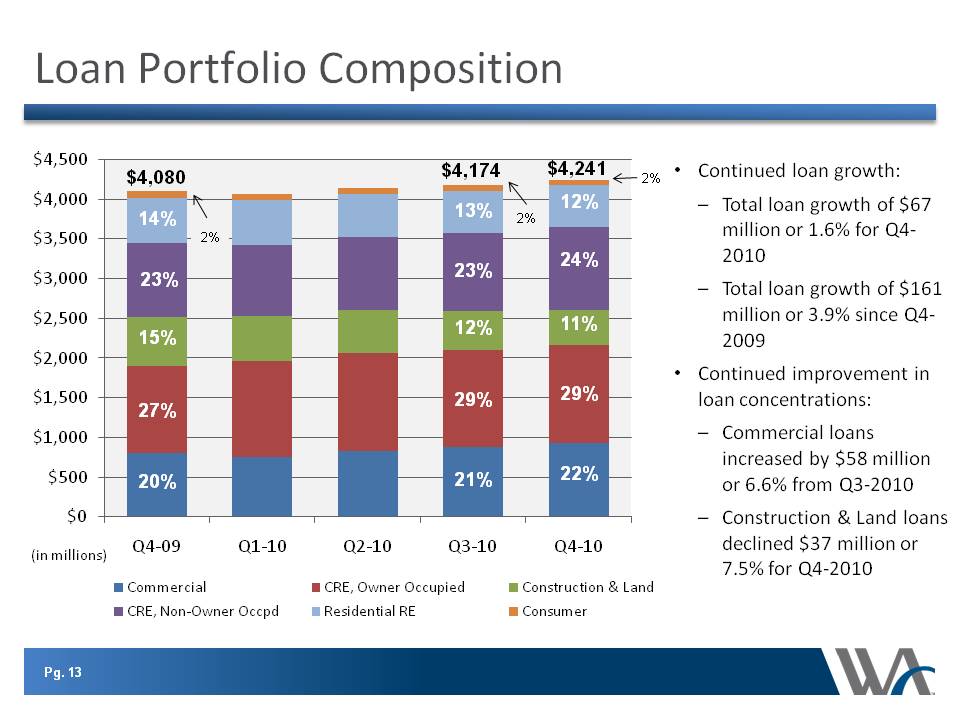
Loan Portfolio Composition (in millions) $4,080 27% 23% 15% 20% 14% 2% 2% $4,174 29% 23% 21% 12% 13% $4,241 29% 24% 22% 11% 12% Continued loan growth: Total loan growth of $67 million or 1.6% for Q4-2010 Total loan growth of $161 million or 3.9% since Q4-2009 Continued improvement in loan concentrations: Commercial loans increased by $58 million or 6.6% from Q3-2010 Construction & Land loans declined $37 million or 7.5% for Q4-2010 2%
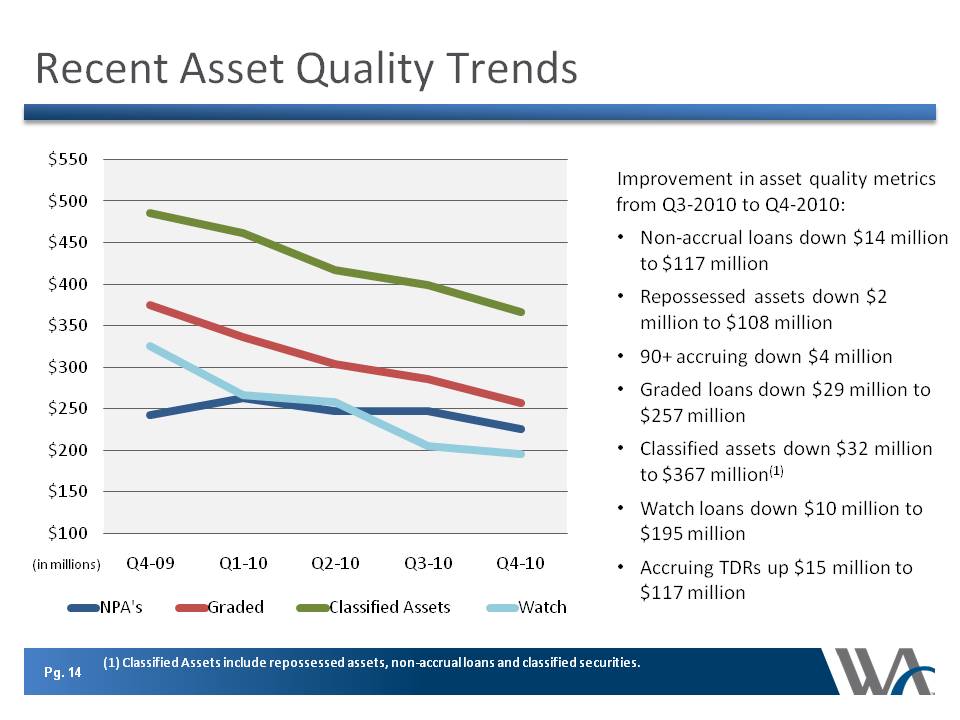
Recent Asset Quality Trends (in millions) Improvement in asset quality metrics from Q3-2010 to Q4-2010:Non-accrual loans down $14 million to $117 millionRepossessed assets down $2 million to $108 million90+ accruing down $4 million Graded loans down $29 million to $257 million Classified assets down $32 million to $367 million (1) Watch loans down $10 million to $195 million Accruing TDRs up $15 million to $117 million Column1 Q4-09 Q1-10 Q2-10 Q3-10 Q4-10 NPA's 242,585,917 262,834,018 246,862,016 246,667,755 226,111,738 Graded 374,846,592 336,624,047 304,270,468 285,971,509 256,657,038 Classified Assets 485,911,347 461,822,847 417,417,757 398,896,859 366,915,402 Watch 325,721,082 266,733,839 257,714,740 205,113,556 194,904,768
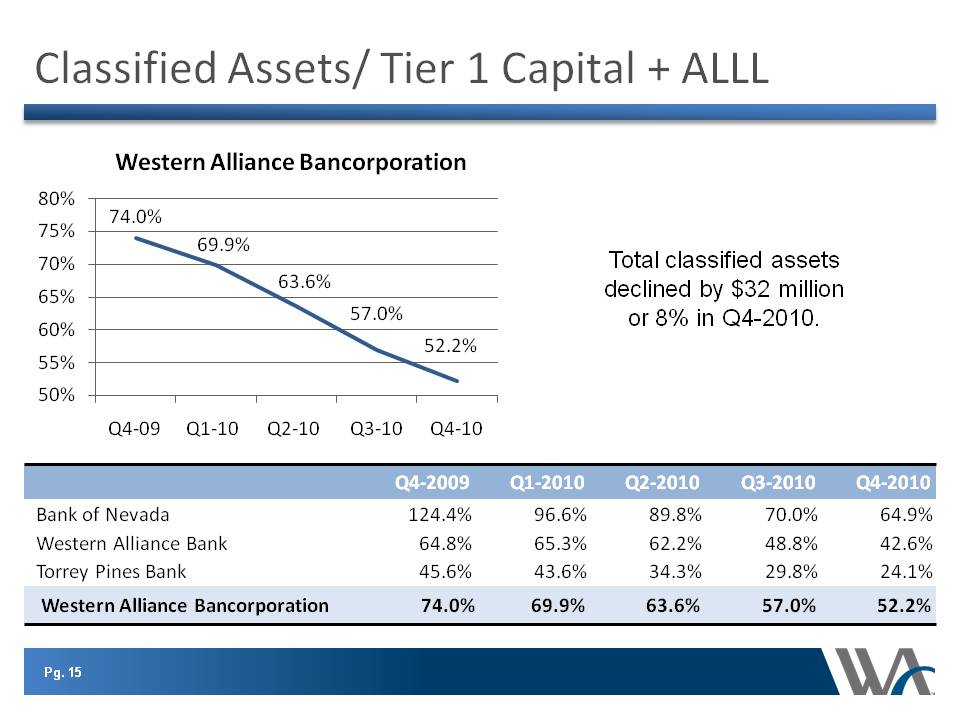
Classified Assets/ Tier 1 Capital + ALLL Total classified assets declined by $32 million or 8% in Q4-2010. Q4-2009 Q1-2010 Q2-2010 Q3-2010 Q4-2010 Bank of Nevada 124.4% 96.6% 89.8% 70.0% 64.9% Western Alliance Bank 64.8% 65.3% 62.2% 48.8% 42.6% Torrey Pines Bank 45.6% 43.6% 34.3% 29.8% 24.1% Western Alliance Bancorporation 74.0% 69.9% 63.6% 57.0% 52.2% Q4-09 Q1-10 Q2-10 Q3-10 Q4-10 Ratio 74.00% 69.90% 63.60% 57.00% 52.20%
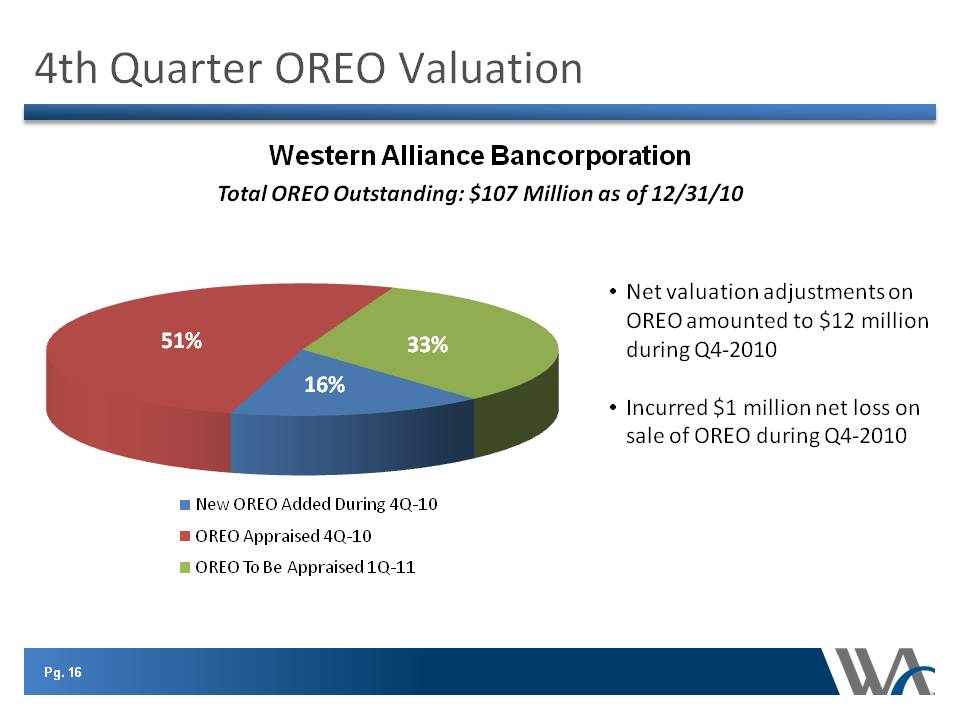
4th Quarter OREO Valuation Net valuation adjustments on OREO amounted to $12 million during Q4-2010 Incurred $1 million net loss on sale of OREO during Q4-2010 Total OREO Outstanding: $107 Million as of 12/31/10 Western Alliance Bancorporation OREO Appraisals New OREO Added During 4Q-10 17.24 OREO Appraised 4Q-10 54.59 OREO To Be Appraised 1Q-11 34.73
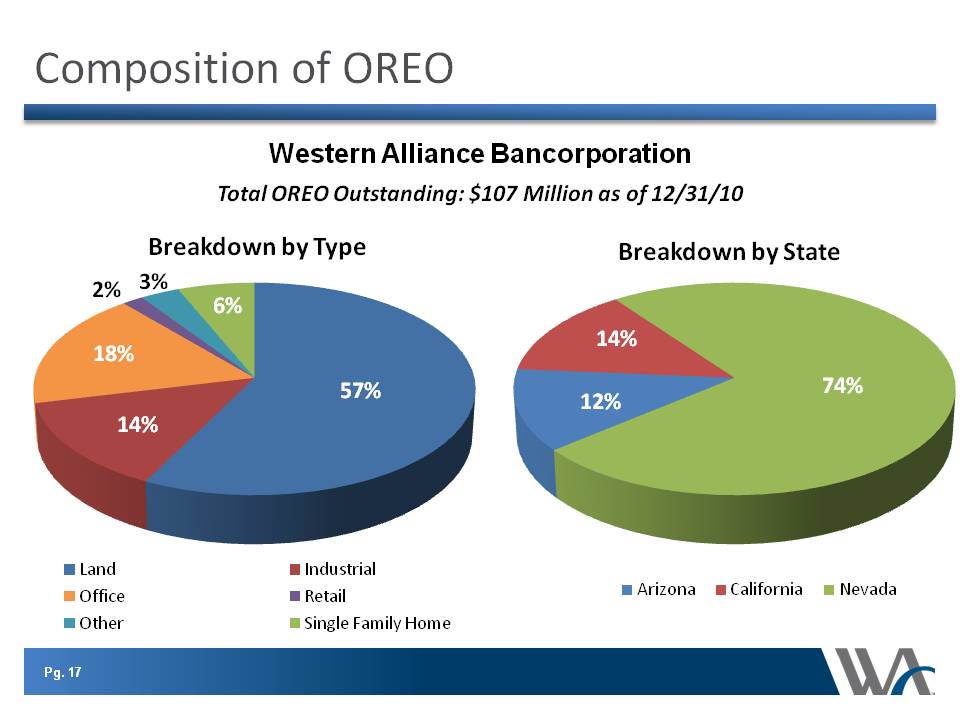
Composition of OREO $1.3 Billion Western Alliance Bancorporation Total OREO Outstanding: $107 Million as of 12/31/10 12/31/10 Balance Land 61,170 Industrial 14,721 Office 18,815 Retail 1,830 Other 3,390 Single Family Home 6,633 Property Type Arizona 13,194 California 14,485 Nevada 78,372
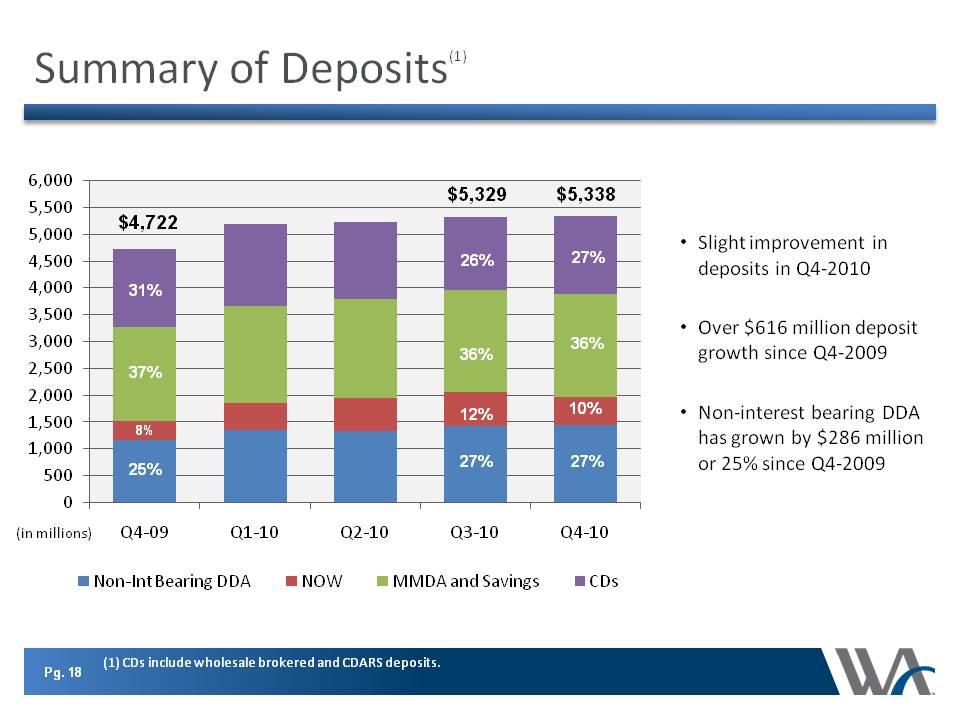
Summary of Deposits(1) 36% 27% 10% Slight improvement in deposits in Q4-2010 Over $616 million deposit growth since Q4-2009 Non-interest bearing DDA has grown by $286 million or 25% since Q4-2009 27% $4,722 $5,329 $5,338 (in millions) Q4-09 Q1-10 Q2-10 Q3-10 Q4-10 Non-Int Bearing DDA 1,157.0 1,348.8 1,330.3 1,421.7 1,443.3 NOW 362.7 510.2 611.4 645.4 523.8 MMDA and Savings 1,752.5 1,798.5 1,845.8 1,892.2 1,926.1 CDs 1,449.9 1,532.7 1,442.5 1,369.2 1,445.3 (1) CDs include wholesale brokered and CDARS deposits.
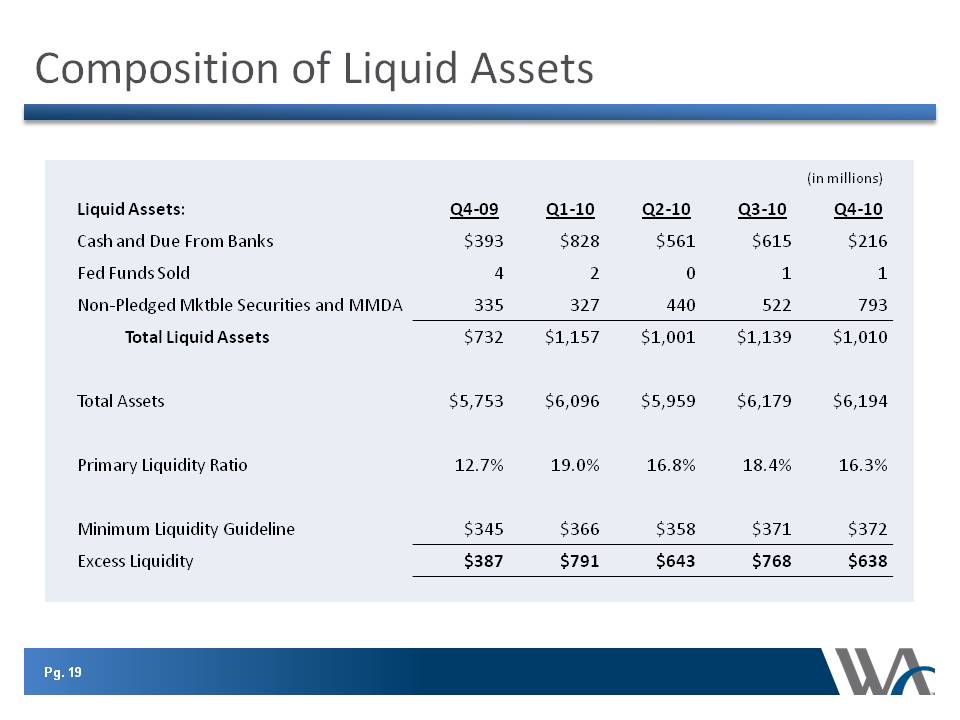
Composition of Liquid Assets (in millions) Liquid Assets: Q4-09 Q1-10 Q2-10 Q3-10 Q4-10 Cash and Due From Banks $393 $828 $561 $615 $216 Fed Funds Sold 4 2 0 1 1 Non-Pledged Mktble Securities and MMDA 335 327 440 522 793 Total Liquid Assets $732 $1,157 $1,001 $1,139 $1,010 Total Assets $5,753 $6,096 $5,959 $6,179 $6,194 Primary Liquidity Ratio 12.7% 19.0% 16.8% 18.4% 16.3% Minimum Liquidity Guideline $345 $366 $358 $371 $372 Excess Liquidity $387 $791 $643 $768 $638
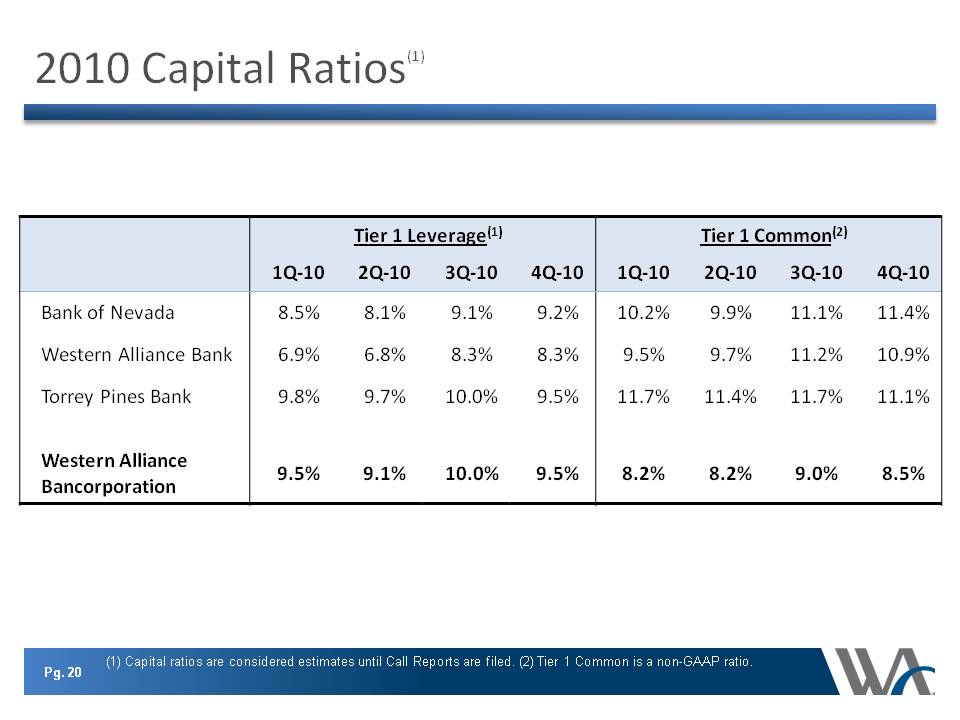
2010 Capital Ratios(1) (1) Capital ratios are considered estimates until Call Reports are filed. (2) Tier 1 Common is a non-GAAP ratio. Tier 1 Leverage(1) Tier 1 Common(2) 1Q-10 2Q-10 3Q-10 4Q-10 1Q-10 2Q-10 3Q-10 4Q-10 Bank of Nevada 8.5% 8.1% 9.1% 9.2% 10.2% 9.9% 11.1% 11.4% Western Alliance Bank 6.9% 6.8% 8.3% 8.3% 9.5% 9.7% 11.2% 10.9% Torrey Pines Bank 9.8% 9.7% 10.0% 9.5% 11.7% 11.4% 11.7% 11.1% Western Alliance Bancorporation 9.5% 9.1% 10.0% 9.5% 8.2% 8.2% 9.0% 8.5%
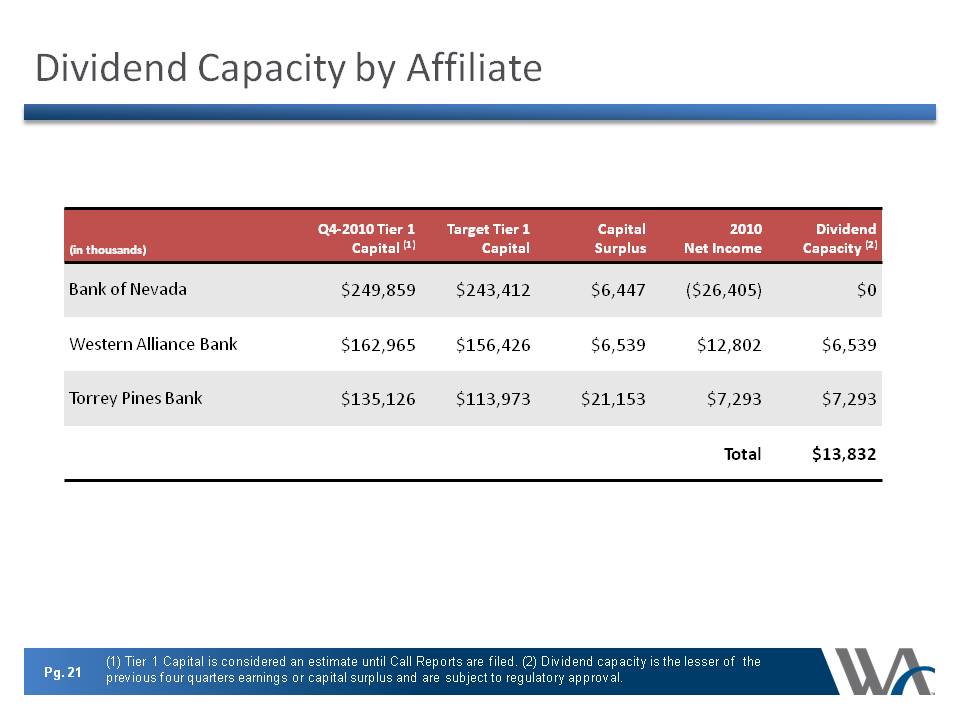
Dividend Capacity by Affiliate (1) Tier 1 Capital is considered an estimate until Call Reports are filed. (2) Dividend capacity is the lesser of the previous four quarters earnings or capital surplus and are subject to regulatory approval. (in thousands) Q4-2010 Tier 1 Capital (1) Target Tier 1 Capital Capital Surplus 2010 Net Income Dividend Capacity (2) Bank of Nevada $249,859 $243,412 $6,447 ($26,405) $0 Western Alliance Bank $162,965 $156,426 $6,539 $12,802 $6,539 Torrey Pines Bank $135,126 $113,973 $21,153 $7,293 $7,293 Total $13,832
Strategic Outlook Focus on core banking operations Reduce non-performing assets Increase market share Strengthen risk management