Attached files
| file | filename |
|---|---|
| 8-K - FORM 8-K - OCCIDENTAL PETROLEUM CORP /DE/ | form8k-20110126.htm |
| EX-99.1 - EXHIBIT 99.1 - OCCIDENTAL PETROLEUM CORP /DE/ | ex99_1-20110126.htm |
| EX-99.2 - EXHIBIT 99.2 - OCCIDENTAL PETROLEUM CORP /DE/ | ex99_2-20110126.htm |
| EX-99.5 - EXHIBIT 99.5 - OCCIDENTAL PETROLEUM CORP /DE/ | ex99_5-20110126.htm |
| EX-99.3 - EXHIBIT 99.3 - OCCIDENTAL PETROLEUM CORP /DE/ | ex99_3-20110126.htm |
EXHIBIT 99.4
Occidental Petroleum Corporation
Fourth Quarter 2010 Earnings Conference Call
January 26, 2011
Fourth Quarter 2010 Earnings Conference Call
January 26, 2011
1

2
Fourth Quarter 2010 Earnings - Highlights
Fourth Quarter 2010 Earnings - Highlights
• Core Results - $1.3 Billion vs. $1.1 Billion in 4Q09
– Core EPS $1.58 (diluted) vs. $1.35 in 4Q09.
• Net Income - $1.2 Billion vs. $938 Million in 4Q09
– EPS $1.49 (diluted) vs. $1.15 in 4Q09.
2

3
Fourth Quarter 2010 Earnings - Highlights
Fourth Quarter 2010 Earnings - Highlights
• Argentina has been classified as a discontinued
operation; therefore, its results have been excluded from
continuing operations, net of tax, for all periods.
operation; therefore, its results have been excluded from
continuing operations, net of tax, for all periods.
• Argentina has not been profitable for the last four years.
• 4Q10 also included after-tax non-core charges of $175
mm for impairments predominately of gas properties in
the Rockies and an $80 mm benefit related to foreign tax
credit carry-forwards.
mm for impairments predominately of gas properties in
the Rockies and an $80 mm benefit related to foreign tax
credit carry-forwards.
• 4Q10 core income included $110 mm higher pre-tax
expense compared to 3Q10 ($70 mm after-tax or $0.09
per diluted share) from equity and related compensation
programs mostly due to the effect of the steep increase
in the company's stock price during this period.
expense compared to 3Q10 ($70 mm after-tax or $0.09
per diluted share) from equity and related compensation
programs mostly due to the effect of the steep increase
in the company's stock price during this period.
3
4
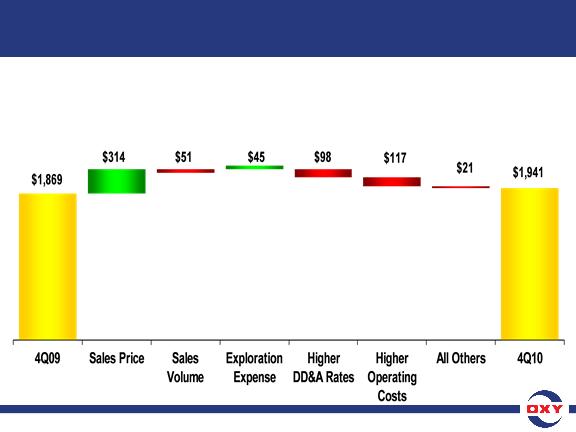
($ in millions)
• Core Results for 4Q10 of $1.941 B vs. $1.869 B in 4Q09
– Realized crude oil prices increased 11½ percent in 2010 but domestic natural gas prices
declined 5½ percent from the fourth quarter of 2009.
declined 5½ percent from the fourth quarter of 2009.
Fourth Quarter 2010 Earnings - Oil & Gas
Segment Variance Analysis - 4Q10 vs. 4Q09
Segment Variance Analysis - 4Q10 vs. 4Q09
4

5
Fourth Quarter 2010 Earnings - Oil & Gas Segment
4Q10 4Q09
Oil and Gas Production Volumes (mboe/d) 753 717
– Year-over-year increase of 5%.
• 4Q10 production of 753 mboe/d was slightly higher than 3Q10 of 751 mboe/d.
• 4Q10 volumes, compared to 3Q10, were negatively impacted by 10 mboe/d
from the effects of our PSCs, 6 mboe/d due to strikes in Argentina, and
inclement weather in December which impacted our California production.
from the effects of our PSCs, 6 mboe/d due to strikes in Argentina, and
inclement weather in December which impacted our California production.
• In California, oil production was higher by 2 mb/d in 4Q10 compared to 3Q10,
but was offset by 1 mb/d resulting from higher oil prices affecting production
sharing and similar contracts at our THUMS operation and by 3 mb/d of lower
NGL volumes resulting from lower gas production.
but was offset by 1 mb/d resulting from higher oil prices affecting production
sharing and similar contracts at our THUMS operation and by 3 mb/d of lower
NGL volumes resulting from lower gas production.
• Excluding Argentina, worldwide oil and gas production for 4Q10 was 714
mboe/d.
mboe/d.
• 3Q10 production would have been 706 mboe/d if Argentina were excluded.
5

6
Fourth Quarter 2010 Earnings - Oil & Gas Segment
4Q10 4Q09
Oil and Gas Sales Volumes (mboe/d) 751 722
• Sales volumes differ from production volumes above due mainly to a
4Q10 lifting in Argentina, which slipped from 3Q10, partially offset by
Iraq production, which will be sold in 2011 and a lifting in Colombia,
which was sold in 1Q11.
4Q10 lifting in Argentina, which slipped from 3Q10, partially offset by
Iraq production, which will be sold in 2011 and a lifting in Colombia,
which was sold in 1Q11.
• Exploration expense was $54 million in 4Q10.
6

7
4Q10 4Q09
Reported Segment Earnings ($ mm) $1,666 $1,869
WTI Oil Price ($/bbl) $85.17 $76.19
NYMEX Gas Price ($/mcf) $3.85 $4.29
Oxy’s Realized Prices
Worldwide Oil ($/bbl) $79.96 $71.74
US Natural Gas ($/mcf) $4.13 $4.37
Fourth Quarter 2010 Earnings - Oil & Gas Segment
7
8
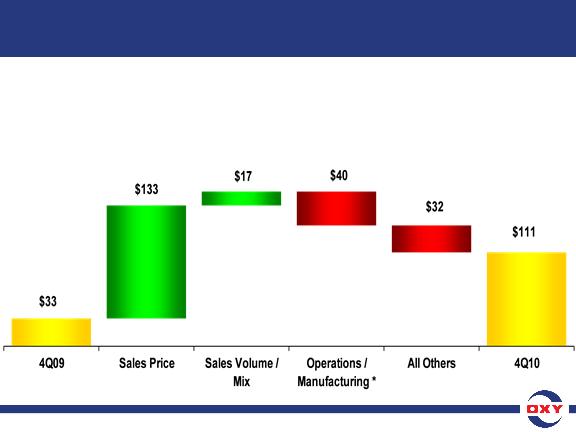
($ in millions)
*Higher feedstock costs
• Core Results for 4Q10 of $111 mm vs. $33 mm in 4Q09
– Chemical segment earnings for 4Q10 were $111 million and in line with our earlier guidance.
Fourth Quarter 2010 Earnings - Chemical
Segment Variance Analysis - 4Q10 vs. 4Q09
Segment Variance Analysis - 4Q10 vs. 4Q09
8
9
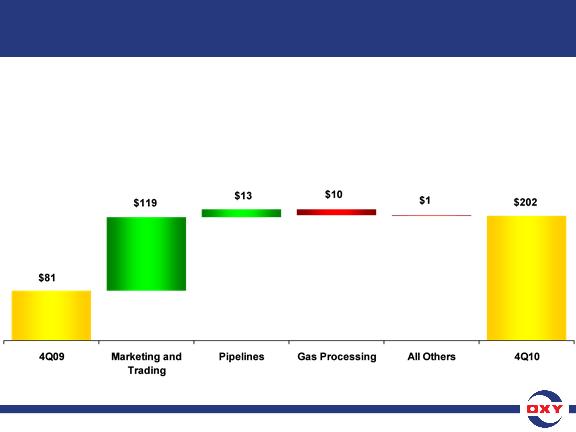
($ in millions)
• Core Results for 4Q10 of $202 mm vs. $81 mm in 4Q09
– Midstream segment earnings for 4Q10 increased compared to $163 mm in 3Q10 and $81 mm
in 4Q09. The increase in earnings was mainly due to higher trading and marketing income.
in 4Q09. The increase in earnings was mainly due to higher trading and marketing income.
Fourth Quarter 2010 Earnings - Midstream
Segment Variance Analysis - 4Q10 vs. 4Q09
Segment Variance Analysis - 4Q10 vs. 4Q09
9

10
Fourth Quarter 2010 Earnings -
Full Year 2010 Results & Capital Spending
Full Year 2010 Results & Capital Spending
Fourth Quarter 2010 Earnings -
Full Year 2010 Results & Capital Spending
Full Year 2010 Results & Capital Spending
FY2010 FY2009
• Net Income ($mm) $4,530 $2,915
• EPS (diluted) $5.56 $3.58
• Core Income ($mm) $4,664 $3,192
• EPS (diluted) $5.72 $3.92
• Income for the twelve months of 2010 included $134 million of
charges, net of tax and 2009 included $277 million of charges, net of
tax, for the items noted on the schedule reconciling net income to
core results.
charges, net of tax and 2009 included $277 million of charges, net of
tax, for the items noted on the schedule reconciling net income to
core results.
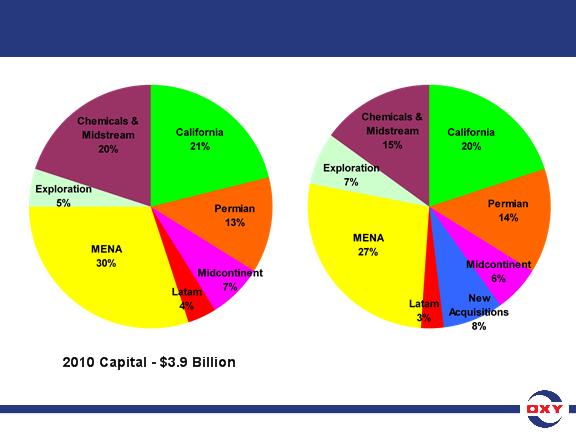
• Capital spending for 4Q10 was about $1.4 billion and $3.9 billion for
full year 2010, excluding Argentina.
full year 2010, excluding Argentina.
– Capital expenditures by segment were 80% in Oil and Gas, 13% in Midstream with
the remainder in Chemicals.
the remainder in Chemicals.
10

11
Fourth Quarter 2010 Earnings - Oil & Gas
Segment - Cash Production Costs and Taxes
Segment - Cash Production Costs and Taxes
Fourth Quarter 2010 Earnings - Oil & Gas
Segment - Cash Production Costs and Taxes
Segment - Cash Production Costs and Taxes
• Oil and gas cash production costs, which exclude
production and property taxes, were $10.19 per boe for
2010, excluding Argentina.
production and property taxes, were $10.19 per boe for
2010, excluding Argentina.
– Full-year 2009 costs were $8.95 a boe, on the same basis.
– The year-over-year increase reflects $0.32 a barrel in higher CO2
costs, due to our decision to expense 100% of injected CO2
beginning in 2010, and higher field support operations,
workovers and maintenance costs.
costs, due to our decision to expense 100% of injected CO2
beginning in 2010, and higher field support operations,
workovers and maintenance costs.
• Taxes - other than on income were $1.83 per boe for 2010
compared to $1.67 per boe for all of 2009. These costs,
which are sensitive to product prices, reflect the effect of
higher crude oil and gas prices in 2010.
compared to $1.67 per boe for all of 2009. These costs,
which are sensitive to product prices, reflect the effect of
higher crude oil and gas prices in 2010.
11
12
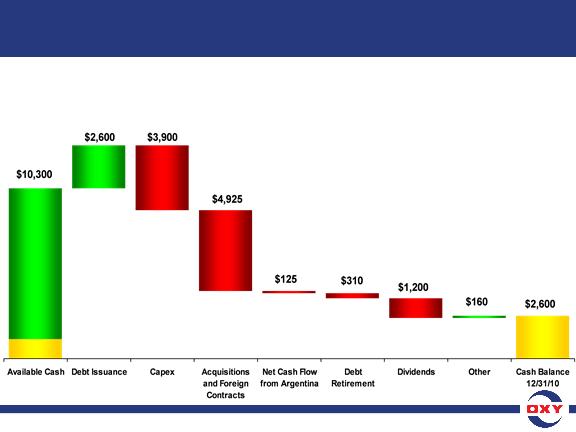
Operating
Cash Flow
from
Continuing
Operations
$9,100
Cash Flow
from
Continuing
Operations
$9,100
(excluding
Argentina)
Argentina)
Beginning
Cash $1,200
12/31/09
Cash $1,200
12/31/09
($ in millions)
– Free cash flow from continuing operations after capex and dividends
but before acquisition activity and debt retirements was about $4.3
billion.
but before acquisition activity and debt retirements was about $4.3
billion.
Fourth Quarter 2010 Earnings -
Full Year 2010 Cash Flow
Full Year 2010 Cash Flow
12

13
Fourth Quarter 2010 Earnings -
Shares Outstanding, Debt and Returns
Shares Outstanding, Debt and Returns
Shares Outstanding (mm) 2010 12/31/10
Weighted Average Basic 812.5
Weighted Average Diluted 813.8
Basic Shares Outstanding 812.5
Diluted Shares Outstanding 813.9
2010
Debt/Capital 14%
ROE 14.7%
ROCE 13.2%
13

14
Fourth Quarter 2010 Earnings -
Acquisitions & Reserve Replacement
Acquisitions & Reserve Replacement
Fourth Quarter 2010 Earnings -
Acquisitions & Reserve Replacement
Acquisitions & Reserve Replacement
• Our acquisition costs in 4Q10 were $3.1 billion, which
included the previously announced purchases and oil and gas
bolt-on properties, mainly in the Permian.
included the previously announced purchases and oil and gas
bolt-on properties, mainly in the Permian.
– We expect to close the purchase of several additional properties and the
sale of Argentina in 1Q11.
sale of Argentina in 1Q11.
– During the year we spent $4.1 billion on Oil & Gas acquisitions, of which
about 50% was on unproved properties.
about 50% was on unproved properties.
• On a preliminary basis, our 2010 reserve replacement ratio
was about 150%.
was about 150%.
– Approximately one-third of the current year reserve adds came from
acquisitions.
acquisitions.
– We will provide additional details regarding reserves as soon as the
information is available.
information is available.
14

15
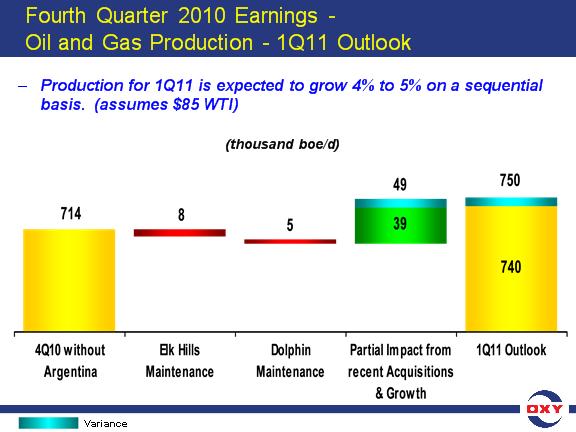
Fourth Quarter 2010 Earnings -
Oil and Gas Production - 1Q11 Outlook
Oil and Gas Production - 1Q11 Outlook
• Our 1Q11 production will be impacted by the following
factors:
factors:
– We will no longer report Argentina production;
– The timing of the completion of the new acquisitions;
• While the acquisition of the oil and gas properties in North Dakota
closed at year end, the acquisition of the South Texas properties is
yet to close.
closed at year end, the acquisition of the South Texas properties is
yet to close.
– Planned one month maintenance and production shut-downs at
Elk Hills and Dolphin;
Elk Hills and Dolphin;
• The impact of the Elk Hills shutdown, which will only impact natural
gas and liquids production, will be about 8 mboe/d for 1Q11.
gas and liquids production, will be about 8 mboe/d for 1Q11.
• The impact of the Dolphin shutdown will be about 5 mboe/d for
1Q11.
1Q11.
15
16
16

17
Fourth Quarter 2010 Earnings -
Oil and Gas Production - 1Q11 Outlook
Oil and Gas Production - 1Q11 Outlook
• We expect 1Q11 oil and gas production volumes to be
between 740 and 750 mboe/d at 4Q10 average oil prices
of $85 WTI.
between 740 and 750 mboe/d at 4Q10 average oil prices
of $85 WTI.
• We expect sales volumes to be around 725 mboe/d.
– A $5 increase in WTI would reduce our daily volumes by about
5,500 boe/d.
5,500 boe/d.
• Once we know 1Q11 results and the timing and the
initial production rates on transfer from the pending
acquisitions, we can provide an accurate full year 2011
production guidance.
initial production rates on transfer from the pending
acquisitions, we can provide an accurate full year 2011
production guidance.
– Production growth will resume in 2Q11.
– We reasonably expect that by at least the second half of the
year, production would be similar to the run rate shown in last
May's investor presentation, adjusted for oil price changes.
year, production would be similar to the run rate shown in last
May's investor presentation, adjusted for oil price changes.
17

18
Fourth Quarter 2010 Earnings - 1Q11 Outlook
• Commodity Price Sensitivity - Earnings
– At current market prices, a $1.00 per barrel change in oil prices
impacts oil and gas quarterly earnings before income taxes by
about $41 mm;
impacts oil and gas quarterly earnings before income taxes by
about $41 mm;
– The average 4Q10 WTI oil price was $85.17 per barrel;
– A swing of $0.50 per mm BTU in domestic gas prices has a $36 mm
impact on quarterly pretax income;
impact on quarterly pretax income;
– This is a significant increase in gas price sensitivities from what
we have provided in the past;
we have provided in the past;
– The current NYMEX gas price is around $4.50 p/mcf.
• We expect 1Q11 exploration expense to be about $85 mm
for seismic and drilling for our exploration programs.
for seismic and drilling for our exploration programs.
18

19
Fourth Quarter 2010 Earnings - 1Q11 Outlook
Fourth Quarter 2010 Earnings - 1Q11 Outlook
• The Chemical segment is expected to provide earnings
for 1Q11 of about $125 million.
for 1Q11 of about $125 million.
– We expect margins and volumes to continue to improve as the
economy strengthens.
economy strengthens.
• We expect our combined worldwide tax rate in 1Q11 to
be about 40 percent.
be about 40 percent.
19

20
Fourth Quarter 2010 Earnings -
Capital Spending and DD&A - Full Year 2011 Outlook
Capital Spending and DD&A - Full Year 2011 Outlook
• We expect capital spending for the total year 2011 to be
about $6.1 billion compared to the total 2010 capital of
$3.9 billion.
about $6.1 billion compared to the total 2010 capital of
$3.9 billion.
– Both amounts exclude Argentina and the Shah Field
Development Project.
Development Project.
– Occidental's share of the Shah Field development capital will
total about $4 billion over the next several years.
total about $4 billion over the next several years.
– Our 2011 capital is close to our 4Q10 annualized run rate of $5.5
billion and in line with the five-year capital plan we showed in the
May investor presentation plus the capital that was deferred from
2010.
billion and in line with the five-year capital plan we showed in the
May investor presentation plus the capital that was deferred from
2010.
• Our Oil and Gas DD&A expense for 2011 should be
approximately $11.75 per boe.
approximately $11.75 per boe.
– Depreciation for the other two segments should be
approximately $500 million.
approximately $500 million.
20
21
(excluding Argentina)
2011E Capital - $6.1 Billion
Fourth Quarter 2010 Earnings -
Capital Spending - 2010 Actual & 2011 Outlook
Capital Spending - 2010 Actual & 2011 Outlook
21

22
Fourth Quarter 2010 Earnings - California Update
Fourth Quarter 2010 Earnings - California Update
• We have about 520 geologically viable (so-called de-risked)
shale drilling locations in California excluding traditional Elk
Hills.
shale drilling locations in California excluding traditional Elk
Hills.
– Of these locations, about 250 are both outside of Elk Hills proper
and the Kern County Discovery Area.
and the Kern County Discovery Area.
• During 2011, based on a conservative view of the permitting
process, we expect to drill a total of 107 shale wells outside
Elk Hills proper.
process, we expect to drill a total of 107 shale wells outside
Elk Hills proper.
– As additional permits become available, the level of drilling
activity would pick-up during the year.
activity would pick-up during the year.
• We will also drill about 28 exploration wells in California in
2011.
2011.
– Approximately 50% of these wells will be for conventional
exploration.
exploration.
– We expect that the exploration activity will, at a minimum, create
more unconventional drilling locations.
more unconventional drilling locations.
22
23
23