Attached files
| file | filename |
|---|---|
| 8-K - FORM 8-K - OCCIDENTAL PETROLEUM CORP /DE/ | form8k-20110126.htm |
| EX-99.1 - EXHIBIT 99.1 - OCCIDENTAL PETROLEUM CORP /DE/ | ex99_1-20110126.htm |
| EX-99.2 - EXHIBIT 99.2 - OCCIDENTAL PETROLEUM CORP /DE/ | ex99_2-20110126.htm |
| EX-99.4 - EXHIBIT 99.4 - OCCIDENTAL PETROLEUM CORP /DE/ | ex99_4-20110126.htm |
| EX-99.5 - EXHIBIT 99.5 - OCCIDENTAL PETROLEUM CORP /DE/ | ex99_5-20110126.htm |
EXHIBIT 99.3
Investor Relations Supplemental Schedules

|
Investor Relations Supplemental Schedules
|
|||||||
|
Summary
|
|||||||
|
($ Millions)
|
|||||||
|
4Q 2010
|
4Q 2009
|
||||||
|
Reported Net Income
|
$1,212
|
$938
|
|||||
|
EPS - Diluted
|
$1.49
|
$1.15
|
|||||
|
Core Results
|
$1,287
|
$1,102
|
|||||
|
EPS - Diluted
|
$1.58
|
$1.35
|
|||||
|
Total Worldwide Sales Volumes (mboe/day)
|
751
|
722
|
|||||
|
Total Worldwide Crude Oil Realizations ($/BBL)
|
$79.96
|
$71.74
|
|||||
|
Domestic Natural Gas Realizations ($/MCF)
|
$4.13
|
$4.37
|
|||||
|
Wtd. Average Basic Shares O/S (mm)
|
812.6
|
811.8
|
|||||
|
Wtd. Average Diluted Shares O/S (mm)
|
813.7
|
813.5
|
|||||
|
YTD 2010
|
YTD 2009
|
||||||
|
Reported Net Income
|
$4,530
|
$2,915
|
|||||
|
EPS - Diluted
|
$5.56
|
$3.58
|
|||||
|
Core Results
|
$4,664
|
$3,192
|
|||||
|
EPS - Diluted
|
$5.72
|
$3.92
|
|||||
|
Total Worldwide Sales Volumes (mboe/day)
|
744
|
714
|
|||||
|
Total Worldwide Crude Oil Realizations ($/BBL)
|
$75.16
|
$57.31
|
|||||
|
Domestic Natural Gas Realizations ($/MCF)
|
$4.53
|
$3.46
|
|||||
|
Wtd. Average Basic Shares O/S (mm)
|
812.5
|
811.3
|
|||||
|
Wtd. Average Diluted Shares O/S (mm)
|
813.8
|
813.8
|
|||||
|
Shares Outstanding (mm)
|
812.8
|
811.9
|
|||||
|
Cash Flow from Operations
|
$
|
9,300
|
$
|
5,800
|
|||
1
Investor Relations Supplemental Schedules
|
OCCIDENTAL PETROLEUM
|
||||||||||||||
|
2010 Fourth Quarter
|
||||||||||||||
|
Net Income (Loss)
|
||||||||||||||
|
($ millions)
|
||||||||||||||
|
Reported
|
Core
|
|||||||||||||
|
Income
|
Significant Items Affecting Income
|
Results
|
||||||||||||
|
Oil & Gas
|
$
|
1,666
|
$
|
275
|
Asset Impairments
|
$
|
1,941
|
|||||||
|
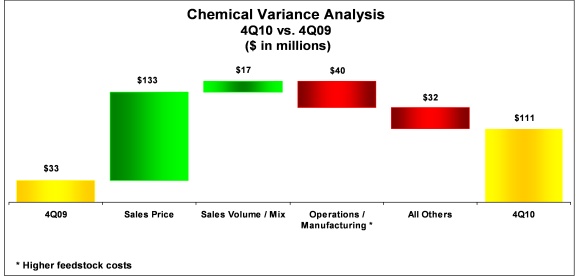
Chemical
|
111
|
111
|
||||||||||||
|
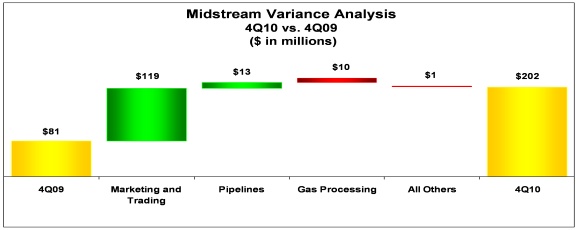
Midstream, marketing and other
|
202
|
202
|
||||||||||||
|
Corporate
|
||||||||||||||
|
Interest expense, net
|
(20
|
)
|
(20
|
)
|
||||||||||
|
Other
|
(149
|
)
|
(149
|
)
|
||||||||||
|
Taxes
|
(618
|
)
|
(100
|
)
|
Tax effect of adjustments
|
(798
|
)
|
|||||||
|
(80
|
)
|
Benefit from foreign tax
|
||||||||||||
|
credit carry-forwards
|
||||||||||||||
|
Income from continuing operations
|
1,192
|
95
|
1,287
|
|||||||||||
|
Discontinued operations, net of tax
|
20
|
(20
|
)
|
Discontinued operations, net
|
-
|
|||||||||
|
Net Income
|
$
|
1,212
|
$
|
75
|
$
|
1,287
|
||||||||
|
Basic Earnings Per Common Share
|
||||||||||||||
|
Income from continuing operations
|
$
|
1.47
|
||||||||||||
|
Discontinued operations, net
|
0.02
|
|||||||||||||
|
Net Income
|
$
|
1.49
|
$
|
1.58
|
||||||||||
|
Diluted Earnings Per Common Share
|
||||||||||||||
|
Income from continuing operations
|
$
|
1.47
|
||||||||||||
|
Discontinued operations, net
|
0.02
|
|||||||||||||
|
Net Income
|
$
|
1.49
|
$
|
1.58
|
||||||||||
2
Investor Relations Supplemental Schedules
|
OCCIDENTAL PETROLEUM
|
||||||||||||||
|
2009 Fourth Quarter
|
||||||||||||||
|
Net Income (Loss)
|
||||||||||||||
|
($ millions)
|
||||||||||||||
|
Reported
|
Core
|
|||||||||||||
|
Income
|
Significant Items Affecting Income
|
Results
|
||||||||||||
|
Oil & Gas
|
$
|
1,869
|
$
|
1,869
|
||||||||||
|
Chemical
|
33
|
33
|
||||||||||||
|
Midstream, marketing and other
|
81
|
81
|
||||||||||||
|
Corporate
|
||||||||||||||
|
Interest expense, net
|
(31
|
)
|
(31
|
)
|
||||||||||
|
Other
|
(107
|
)
|
(107
|
)
|
||||||||||
|
Taxes
|
(743
|
)
|
(743
|
)
|
||||||||||
|
Income from continuing operations
|
1,102
|
-
|
1,102
|
|||||||||||
|
Discontinued operations, net of tax
|
(164
|
)
|
164
|
Discontinued operations, net
|
-
|
|||||||||
|
Net Income
|
$
|
938
|
$
|
164
|
$
|
1,102
|
||||||||
|
Basic Earnings Per Common Share
|
||||||||||||||
|
Income from continuing operations
|
$
|
1.35
|
||||||||||||
|
Discontinued operations, net
|
(0.20
|
)
|
||||||||||||
|
Net Income
|
$
|
1.15
|
$
|
1.36
|
||||||||||
|
Diluted Earnings Per Common Share
|
||||||||||||||
|
Income from continuing operations
|
$
|
1.35
|
||||||||||||
|
Discontinued operations, net
|
(0.20
|
)
|
||||||||||||
|
Net Income
|
$
|
1.15
|
$
|
1.35
|
||||||||||
3
Investor Relations Supplemental Schedules
|
OCCIDENTAL PETROLEUM
|
||||||||||||||
|
2010 Twelve Months
|
||||||||||||||
|
Net Income (Loss)
|
||||||||||||||
|
($ millions)
|
||||||||||||||
|
Reported
|
Core
|
|||||||||||||
|
Income
|
Significant Items Affecting Income
|
Results
|
||||||||||||
|
Oil & Gas
|
$
|
7,151
|
$
|
275
|
Asset Impairments
|
$
|
7,426
|
|||||||
|
Chemical
|
438
|
438
|
||||||||||||
|
Midstream, marketing and other
|
472
|
472
|
||||||||||||
|
Corporate
|
||||||||||||||
|
Interest expense, net
|
(93
|
)
|
(93
|
)
|
||||||||||
|
Other
|
(404
|
)
|
(404
|
)
|
||||||||||
|
Taxes
|
(2,995
|
)
|
(100
|
)
|
Tax effect of adjustments
|
(3,175
|
)
|
|||||||
|
(80
|
)
|
Benefit from foreign tax
|
||||||||||||
|
credit carry-forwards
|
||||||||||||||
|
Income from continuing operations
|
4,569
|
95
|
4,664
|
|||||||||||
|
Discontinued operations, net of tax
|
(39
|
)
|
39
|
Discontinued operations, net
|
-
|
|||||||||
|
Net Income
|
$
|
4,530
|
$
|
134
|
$
|
4,664
|
||||||||
|
Basic Earnings Per Common Share
|
||||||||||||||
|
Income from continuing operations
|
$
|
5.62
|
||||||||||||
|
Discontinued operations, net
|
(0.05
|
)
|
||||||||||||
|
Net Income
|
$
|
5.57
|
$
|
5.73
|
||||||||||
|
Diluted Earnings Per Common Share
|
||||||||||||||
|
Income from continuing operations
|
$
|
5.61
|
||||||||||||
|
Discontinued operations, net
|
(0.05
|
)
|
||||||||||||
|
Net Income
|
$
|
5.56
|
$
|
5.72
|
||||||||||
4
Investor Relations Supplemental Schedules
|
OCCIDENTAL PETROLEUM
|
||||||||||||||
|
2009 Twelve Months
|
||||||||||||||
|
Net Income (Loss)
|
||||||||||||||
|
($ millions)
|
||||||||||||||
|
Reported
|
Core
|
|||||||||||||
|
Income
|
Significant Items Affecting Income
|
Results
|
||||||||||||
|
Oil & Gas
|
$
|
5,097
|
$
|
8
|
Rig contract terminations
|
$
|
5,105
|
|||||||
|
Chemical
|
389
|
389
|
||||||||||||
|
Midstream, marketing and other
|
235
|
235
|
||||||||||||
|
Corporate
|
||||||||||||||
|
Interest expense, net
|
(102
|
)
|
(102
|
)
|
||||||||||
|
Other
|
(405
|
)
|
40
|
Severance
|
(350
|
)
|
||||||||
|
15
|
Railcar leases
|
|||||||||||||
|
Taxes
|
(2,063
|
)
|
(22
|
)
|
Tax effect of adjustments
|
(2,085
|
)
|
|||||||
|
Income from continuing operations
|
3,151
|
41
|
3,192
|
|||||||||||
|
Discontinued operations, net of tax
|
(236
|
)
|
236
|
Discontinued operations, net
|
-
|
|||||||||
|
Net Income
|
$
|
2,915
|
$
|
277
|
$
|
3,192
|
||||||||
|
Basic Earnings Per Common Share
|
||||||||||||||
|
Income from continuing operations
|
$
|
3.88
|
||||||||||||
|
Discontinued operations, net
|
(0.29
|
)
|
||||||||||||
|
Net Income
|
$
|
3.59
|
$
|
3.93
|
||||||||||
|
Diluted Earnings Per Common Share
|
||||||||||||||
|
Income from continuing operations
|
$
|
3.87
|
||||||||||||
|
Discontinued operations, net
|
(0.29
|
)
|
||||||||||||
|
Net Income
|
$
|
3.58
|
$
|
3.92
|
||||||||||
5
Investor Relations Supplemental Schedules
|
OCCIDENTAL PETROLEUM
|
||||||||||||||
|
Worldwide Effective Tax Rate
|
||||||||||||||
|
QUARTERLY
|
YEAR-TO-DATE
|
|||||||||||||
|
2010
|
2010
|
2009
|
2010
|
2009
|
||||||||||
|
REPORTED INCOME
|
QTR 4
|
QTR 3
|
QTR 4
|
12 Months
|
12 Months
|
|||||||||
|
Oil & Gas
|
1,666
|
1,757
|
1,869
|
7,151
|
5,097
|
|||||||||
|
Chemicals
|
111
|
189
|
33
|
438
|
389
|
|||||||||
|
Midstream, marketing and other
|
202
|
163
|
81
|
472
|
235
|
|||||||||
|
Corporate & other
|
(169
|
)
|
(84
|
)
|
(138
|
)
|
(497
|
)
|
(507
|
)
|
||||
|
Pre-tax income
|
1,810
|
2,025
|
1,845
|
7,564
|
5,214
|
|||||||||
|
Income tax expense
|
||||||||||||||
|
Federal and state
|
129
|
322
|
338
|
1,087
|
684
|
|||||||||
|
Foreign
|
489
|
500
|
405
|
1,908
|
1,379
|
|||||||||
|
Total
|
618
|
822
|
743
|
2,995
|
2,063
|
|||||||||
|
Income from continuing operations
|
1,192
|
1,203
|
1,102
|
4,569
|
3,151
|
|||||||||
|
Worldwide effective tax rate
|
34%
|
41%
|
40%
|
40%
|
40%
|
|||||||||
|
2010
|
2010
|
2009
|
2010
|
2009
|
||||||||||
|
CORE RESULTS
|
QTR 4
|
QTR 3
|
QTR 4
|
12 Months
|
12 Months
|
|||||||||
|
Oil & Gas
|
1,941
|
1,757
|
1,869
|
7,426
|
5,105
|
|||||||||
|
Chemicals
|
111
|
189
|
33
|
438
|
389
|
|||||||||
|
Midstream, marketing and other
|
202
|
163
|
81
|
472
|
235
|
|||||||||
|
Corporate & other
|
(169
|
)
|
(84
|
)
|
(138
|
)
|
(497
|
)
|
(452
|
)
|
||||
|
Pre-tax income
|
2,085
|
2,025
|
1,845
|
7,839
|
5,277
|
|||||||||
|
Income tax expense
|
||||||||||||||
|
Federal and state
|
309
|
322
|
338
|
1,267
|
706
|
|||||||||
|
Foreign
|
489
|
500
|
405
|
1,908
|
1,379
|
|||||||||
|
Total
|
798
|
822
|
743
|
3,175
|
2,085
|
|||||||||
|
Core results
|
1,287
|
1,203
|
1,102
|
4,664
|
3,192
|
|||||||||
|
Worldwide effective tax rate
|
38%
|
41%
|
40%
|
41%
|
40%
|
|||||||||
6
Investor Relations Supplemental Schedules
|
OCCIDENTAL PETROLEUM
|
||||||||||||
|
2010 Fourth Quarter Net Income (Loss)
|
||||||||||||
|
Reported Income Comparison
|
||||||||||||
|
Fourth
|
Third
|
|||||||||||
|
Quarter
|
Quarter
|
|||||||||||
|
2010
|
2010
|
B / (W)
|
||||||||||
|
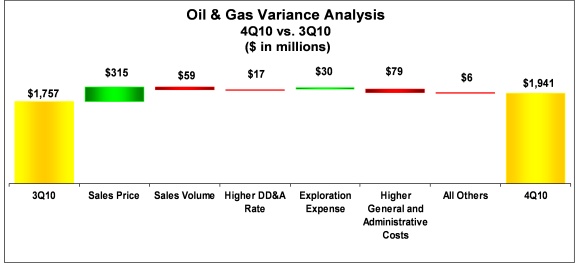
Oil & Gas
|
$
|
1,666
|
$
|
1,757
|
$
|
(91
|
)
|
|||||
|
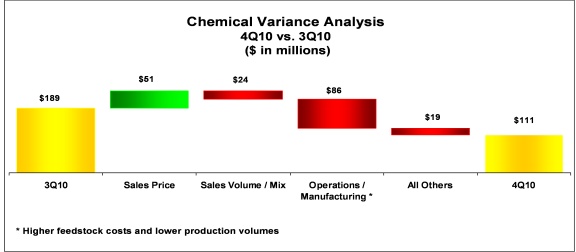
Chemical
|
111
|
189
|
(78
|
)
|
||||||||
|
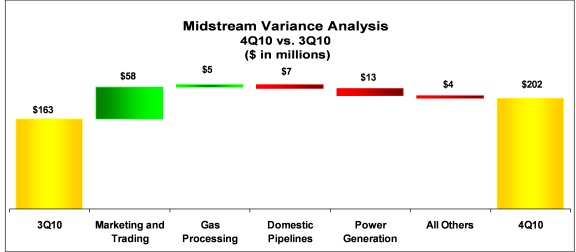
Midstream, marketing and other
|
202
|
163
|
39
|
|||||||||
|
Corporate
|
||||||||||||
|
Interest expense, net
|
(20
|
)
|
(18
|
)
|
(2
|
)
|
||||||
|
Other
|
(149
|
)
|
(66
|
)
|
(83
|
)
|
||||||
|
Taxes
|
(618
|
)
|
(822
|
)
|
204
|
|||||||
|
Income from continuing operations
|
1,192
|
1,203
|
(11
|
)
|
||||||||
|
Discontinued operations, net
|
20
|
(12
|
)
|
32
|
||||||||
|
Net Income
|
$
|
1,212
|
$
|
1,191
|
$
|
21
|
||||||
|
Earnings Per Common Share
|
||||||||||||
|
Basic
|
$
|
1.49
|
$
|
1.46
|
$
|
0.03
|
||||||
|
Diluted
|
$
|
1.49
|
$
|
1.46
|
$
|
0.03
|
||||||
|
Worldwide Effective Tax Rate
|
34%
|
41%
|
7%
|
|||||||||
|
OCCIDENTAL PETROLEUM
|
||||||||||||
|
2010 Fourth Quarter Net Income (Loss)
|
||||||||||||
|
Core Results Comparison
|
||||||||||||
|
Fourth
|
Third
|
|||||||||||
|
Quarter
|
Quarter
|
|||||||||||
|
2010
|
2010
|
B / (W)
|
||||||||||
|
Oil & Gas
|
$
|
1,941
|
$
|
1,757
|
$
|
184
|
||||||
|
Chemical
|
111
|
189
|
(78
|
)
|
||||||||
|
Midstream, marketing and other
|
202
|
163
|
39
|
|||||||||
|
Corporate
|
||||||||||||
|
Interest expense, net
|
(20
|
)
|
(18
|
)
|
(2
|
)
|
||||||
|
Other
|
(149
|
)
|
(66
|
)
|
(83
|
)
|
||||||
|
Taxes
|
(798
|
)
|
(822
|
)
|
24
|
|||||||
|
Core Results
|
$
|
1,287
|
$
|
1,203
|
$
|
84
|
||||||
|
Core Results Per Common Share
|
||||||||||||
|
Basic
|
$
|
1.58
|
$
|
1.48
|
$
|
0.10
|
||||||
|
Diluted
|
$
|
1.58
|
$
|
1.48
|
$
|
0.10
|
||||||
|
Worldwide Effective Tax Rate
|
38%
|
41%
|
3%
|
|||||||||
7
Investor Relations Supplemental Schedules
8
Investor Relations Supplemental Schedules
|
OCCIDENTAL PETROLEUM
|
||||||||||||
|
2010 Fourth Quarter Net Income (Loss)
|
||||||||||||
|
Reported Income Comparison
|
||||||||||||
|
Fourth
|
Fourth
|
|||||||||||
|
Quarter
|
Quarter
|
|||||||||||
|
2010
|
2009
|
B / (W)
|
||||||||||
|
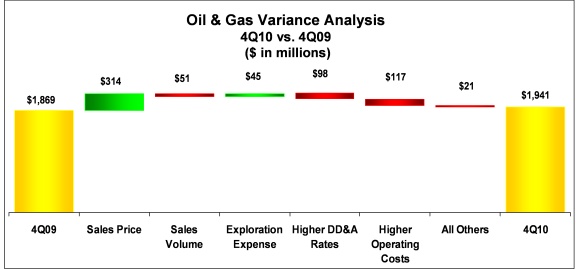
Oil & Gas
|
$
|
1,666
|
$
|
1,869
|
$
|
(203
|
)
|
|||||
|
Chemical
|
111
|
33
|
78
|
|||||||||
|
Midstream, marketing and other
|
202
|
81
|
121
|
|||||||||
|
Corporate
|
||||||||||||
|
Interest expense, net
|
(20
|
)
|
(31
|
)
|
11
|
|||||||
|
Other
|
(149
|
)
|
(107
|
)
|
(42
|
)
|
||||||
|
Taxes
|
(618
|
)
|
(743
|
)
|
125
|
|||||||
|
Income from continuing operations
|
1,192
|
1,102
|
90
|
|||||||||
|
Discontinued operations, net
|
20
|
(164
|
)
|
184
|
||||||||
|
Net Income
|
$
|
1,212
|
$
|
938
|
$
|
274
|
||||||
|
Earnings Per Common Share
|
||||||||||||
|
Basic
|
$
|
1.49
|
$
|
1.15
|
$
|
0.34
|
||||||
|
Diluted
|
$
|
1.49
|
$
|
1.15
|
$
|
0.34
|
||||||
|
Worldwide Effective Tax Rate
|
34%
|
40%
|
6%
|
|||||||||
|
OCCIDENTAL PETROLEUM
|
||||||||||||
|
2010 Fourth Quarter Net Income (Loss)
|
||||||||||||
|
Core Results Comparison
|
||||||||||||
|
Fourth
|
Fourth
|
|||||||||||
|
Quarter
|
Quarter
|
|||||||||||
|
2010
|
2009
|
B / (W)
|
||||||||||
|
Oil & Gas
|
$
|
1,941
|
$
|
1,869
|
$
|
72
|
||||||
|
Chemical
|
111
|
33
|
78
|
|||||||||
|
Midstream, marketing and other
|
202
|
81
|
121
|
|||||||||
|
Corporate
|
||||||||||||
|
Interest expense, net
|
(20
|
)
|
(31
|
)
|
11
|
|||||||
|
Other
|
(149
|
)
|
(107
|
)
|
(42
|
)
|
||||||
|
Taxes
|
(798
|
)
|
(743
|
)
|
(55
|
)
|
||||||
|
Core Results
|
$
|
1,287
|
$
|
1,102
|
$
|
185
|
||||||
|
Core Results Per Common Share
|
||||||||||||
|
Basic
|
$
|
1.58
|
$
|
1.36
|
$
|
0.22
|
||||||
|
Diluted
|
$
|
1.58
|
$
|
1.35
|
$
|
0.23
|
||||||
|
Worldwide Effective Tax Rate
|
38%
|
40%
|
2%
|
|||||||||
9
Investor Relations Supplemental Schedules
10
Investor Relations Supplemental Schedules
|
SUMMARY OF OPERATING STATISTICS
|
||||||||||||||
|
Fourth Quarter
|
Twelve Months
|
|||||||||||||
|
2010
|
2009
|
2010
|
2009
|
|||||||||||
|
NET SALES VOLUMES PER DAY:
|
||||||||||||||
|
United States
|
||||||||||||||
|
Crude Oil and Liquids (MBBL)
|
||||||||||||||
|
California
|
90
|
92
|
92
|
93
|
||||||||||
|
Permian
|
163
|
164
|
161
|
164
|
||||||||||
|
Midcontinent Gas
|
19
|
15
|
18
|
14
|
||||||||||
|
Total
|
272
|
271
|
271
|
271
|
||||||||||
|
Natural Gas (MMCF)
|
||||||||||||||
|
California
|
259
|
282
|
280
|
250
|
||||||||||
|
Permian
|
154
|
122
|
133
|
125
|
||||||||||
|
Midcontinent Gas
|
286
|
241
|
264
|
260
|
||||||||||
|
Total
|
699
|
645
|
677
|
635
|
||||||||||
|
Latin America
|
||||||||||||||
|
Crude Oil (MBBL)
|
Colombia
|
31
|
36
|
32
|
39
|
|||||||||
|
Natural Gas (MMCF)
|
Bolivia
|
18
|
12
|
16
|
16
|
|||||||||
|
Middle East / North Africa
|
||||||||||||||
|
Crude Oil and Liquids (MBBL)
|
||||||||||||||
|
Bahrain
|
3
|
1
|
3
|
-
|
||||||||||
|
Dolphin
|
23
|
26
|
24
|
25
|
||||||||||
|
Libya
|
12
|
15
|
13
|
12
|
||||||||||
|
Oman
|
63
|
54
|
61
|
50
|
||||||||||
|
Qatar
|
74
|
80
|
76
|
79
|
||||||||||
|
Yemen
|
27
|
32
|
30
|
35
|
||||||||||
|
Total
|
202
|
208
|
207
|
201
|
||||||||||
|
Natural Gas (MMCF)
|
||||||||||||||
|
Bahrain
|
170
|
40
|
169
|
10
|
||||||||||
|
Dolphin
|
232
|
256
|
236
|
257
|
||||||||||
|
Oman
|
47
|
42
|
48
|
49
|
||||||||||
|
Total
|
449
|
338
|
453
|
316
|
||||||||||
|
Continuing operations
|
||||||||||||||
|
Barrels of Oil Equivalent (MBOE)
|
699
|
680
|
701
|
672
|
||||||||||
|
Discontinued operations
|
||||||||||||||
|
Crude Oil (MBBL)
|
46
|
37
|
37
|
37
|
||||||||||
|
Natural Gas (MMCF)
|
36
|
30
|
34
|
30
|
||||||||||
|
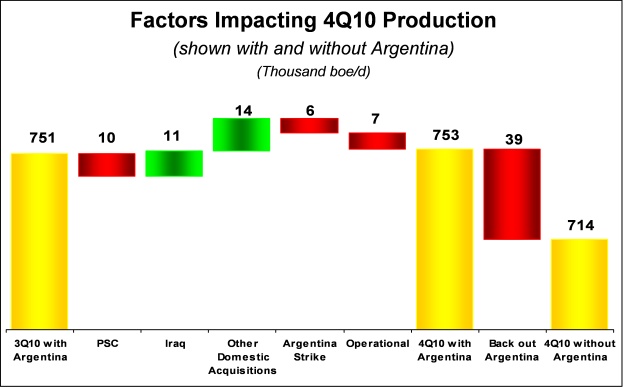
Total Sales - MBOE
|
751
|
722
|
744
|
714
|
||||||||||
11
Investor Relations Supplemental Schedules
|
OCCIDENTAL PETROLEUM
|
||||||||||||||
|
SUMMARY OF OPERATING STATISTICS
|
||||||||||||||
|
Fourth Quarter
|
Twelve Months
|
|||||||||||||
|
2010
|
2009
|
2010
|
2009
|
|||||||||||
|
NET PRODUCTION PER DAY:
|
||||||||||||||
|
United States
|
||||||||||||||
|
Crude Oil and Liquids (MBBL)
|
272
|
271
|
271
|
271
|
||||||||||
|
Natural Gas (MMCF)
|
699
|
645
|
677
|
635
|
||||||||||
|
Latin America
|
||||||||||||||
|
Crude Oil (MBBL)
|
Colombia
|
30
|
36
|
32
|
39
|
|||||||||
|
Natural Gas (MMCF)
|
18
|
12
|
16
|
16
|
||||||||||
|
Middle East / North Africa
|
||||||||||||||
|
Crude Oil and Liquids (MBBL)
|
||||||||||||||
|
Bahrain
|
3
|
1
|
3
|
-
|
||||||||||
|
Dolphin
|
23
|
26
|
24
|
26
|
||||||||||
|
Iraq
|
11
|
-
|
3
|
-
|
||||||||||
|
Libya
|
12
|
11
|
13
|
11
|
||||||||||
|
Oman
|
67
|
56
|
62
|
50
|
||||||||||
|
Qatar
|
75
|
78
|
76
|
79
|
||||||||||
|
Yemen
|
27
|
31
|
31
|
34
|
||||||||||
|
Total
|
218
|
203
|
212
|
200
|
||||||||||
|
Natural Gas (MMCF)
|
449
|
338
|
453
|
316
|
||||||||||
|
Continuing operations
|
||||||||||||||
|
Barrels of Oil Equivalent (MBOE)
|
714
|
676
|
706
|
671
|
||||||||||
|
Discontinued operations
|
||||||||||||||
|
Crude Oil (MBBL)
|
33
|
36
|
36
|
36
|
||||||||||
|
Natural Gas (MMCF)
|
36
|
30
|
34
|
30
|
||||||||||
|
Total Worldwide Production - MBOE
|
753
|
717
|
748
|
712
|
||||||||||
12
Investor Relations Supplemental Schedules
|
OCCIDENTAL PETROLEUM
|
|||||||||||||||||
|
SUMMARY OF OPERATING STATISTICS
|
|||||||||||||||||
|
Fourth Quarter
|
Twelve Months
|
||||||||||||||||
|
2010
|
2009
|
2010
|
2009
|
||||||||||||||
|
OIL & GAS:
|
|||||||||||||||||
|
PRICES
|
|||||||||||||||||
|
United States
|
|||||||||||||||||
|
Crude Oil ($/BBL)
|
79.20
|
70.90
|
73.79
|
56.74
|
|||||||||||||
|
Natural gas ($/MCF)
|
4.13
|
4.37
|
4.53
|
3.46
|
|||||||||||||
|
Latin America
|
|||||||||||||||||
|
Crude Oil ($/BBL)
|
81.05
|
71.69
|
75.29
|
55.89
|
|||||||||||||
|
Natural Gas ($/MCF)
|
7.76
|
5.73
|
7.73
|
5.70
|
|||||||||||||
|
Middle East / North Africa
|
|||||||||||||||||
|
Crude Oil ($/BBL)
|
80.65
|
73.11
|
76.67
|
58.75
|
|||||||||||||
|
Total Worldwide
|
|||||||||||||||||
|
Crude Oil ($/BBL)
|
79.96
|
71.74
|
75.16
|
57.31
|
|||||||||||||
|
Natural Gas ($/MCF)
|
2.91
|
3.42
|
3.11
|
2.83
|
|||||||||||||
|
Fourth Quarter
|
Twelve Months
|
||||||||||||||||
|
2010
|
2009
|
2010
|
2009
|
||||||||||||||
|
Exploration Expense
|
|||||||||||||||||
|
United States
|
$
|
27
|
$
|
53
|
$
|
162
|
$
|
160
|
|||||||||
|
Latin America
|
6
|
12
|
7
|
14
|
|||||||||||||
|
Middle East / North Africa
|
21
|
33
|
93
|
80
|
|||||||||||||
|
TOTAL REPORTED
|
$
|
54
|
$
|
98
|
$
|
262
|
$
|
254
|
|||||||||
13
Investor Relations Supplemental Schedules
|
OCCIDENTAL PETROLEUM
|
||||||||||||||||
|
SUMMARY OF OPERATING STATISTICS
|
||||||||||||||||
|
Fourth Quarter
|
Twelve Months
|
|||||||||||||||
|
Capital Expenditures ($MM)
|
2010
|
2009
|
2010
|
2009
|
||||||||||||
|
Oil & Gas
|
||||||||||||||||
|
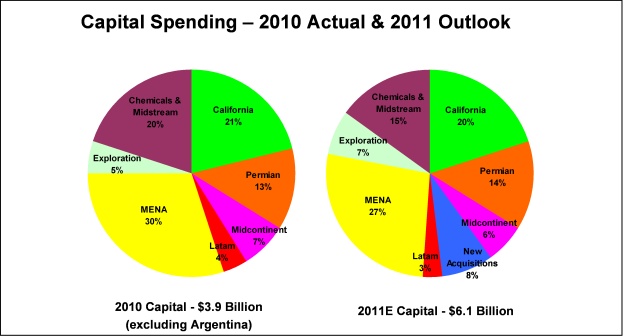
California
|
$
|
297
|
$
|
152
|
$
|
841
|
$
|
554
|
||||||||
|
Permian
|
212
|
85
|
502
|
413
|
||||||||||||
|
Midcontinent Gas
|
131
|
41
|
269
|
118
|
||||||||||||
|
Latin America
|
56
|
40
|
163
|
210
|
||||||||||||
|
Middle East / North Africa
|
344
|
253
|
1,199
|
1,021
|
||||||||||||
|
Exploration
|
62
|
50
|
192
|
132
|
||||||||||||
|
Chemicals
|
108
|
91
|
237
|
205
|
||||||||||||
|
Midstream, marketing and other
|
144
|
124
|
501
|
554
|
||||||||||||
|
Corporate
|
6
|
4
|
36
|
38
|
||||||||||||
|
TOTAL
|
$
|
1,360
|
$
|
840
|
$
|
3,940
|
$
|
3,245
|
||||||||
|
Depreciation, Depletion &
|
Fourth Quarter
|
Twelve Months
|
||||||||||||||
|
Amortization of Assets ($MM)
|
2010
|
2009
|
2010
|
2009
|
||||||||||||
|
Oil & Gas
|
||||||||||||||||
|
Domestic
|
$
|
365
|
$
|
305
|
$
|
1,412
|
$
|
1,237
|
||||||||
|
Latin America
|
31
|
48
|
122
|
198
|
||||||||||||
|
Middle East / North Africa
|
282
|
237
|
1,134
|
823
|
||||||||||||
|
Chemicals
|
78
|
76
|
321
|
298
|
||||||||||||
|
Midstream, marketing and other
|
38
|
31
|
142
|
110
|
||||||||||||
|
Corporate
|
5
|
6
|
22
|
21
|
||||||||||||
|
TOTAL
|
$
|
799
|
$
|
703
|
$
|
3,153
|
$
|
2,687
|
||||||||
14
Investor Relations Supplemental Schedules
|
OCCIDENTAL PETROLEUM
|
||||||||||||
|
CORPORATE
|
||||||||||||
|
($ millions)
|
||||||||||||
|
31-Dec-10
|
31-Dec-09
|
|||||||||||
|
CAPITALIZATION
|
||||||||||||
|
Long-Term Debt (including current maturities)
|
$
|
5,111
|
$
|
2,796
|
||||||||
|
Others
|
-
|
25
|
||||||||||
|
Total Debt
|
$
|
5,111
|
$
|
2,821
|
||||||||
|
EQUITY
|
$
|
32,484
|
$
|
29,159
|
||||||||
|
Total Debt To Total Capitalization
|
14%
|
9%
|
||||||||||
15
Investor Relations Supplemental Schedules
|
Investor Relations Supplemental Schedules
|
|||||||||
|
Argentina Summary
|
|||||||||
|
($ Millions)
|
|||||||||
|
2008
|
2009
|
2010
|
|||||||
|
Net Production (MBOE/Day)
|
38
|
41
|
42
|
||||||
|
Results pre-tax
|
(591
|
)
|
(369
|
)
|
(33
|
)
|
|||
|
Results after-tax
|
(344
|
)
|
(224
|
)
|
(18
|
)
|
|||
|
Depreciation, Depletion &
Amortization of Assets
|
314
|
430
|
350
|
||||||
|
Capital Expenditures
|
538
|
336
|
415
|
*
|
|||||
|
*Includes $105 million contract extension bonus.
|
|||||||||
16
Investor Relations Supplemental Schedules
|
Investor Relations Supplemental Schedules
|
||||||||||||||
|
Argentina Summary
|
||||||||||||||
|
($ Millions)
|
||||||||||||||
|
2010
|
||||||||||||||
|
1st Q
|
2nd Q
|
3rd Q
|
4th Q
|
TY
|
||||||||||
|
Net Production (MBOE/Day)
|
42
|
42
|
45
|
39
|
42
|
|||||||||
|
Results pre-tax
|
(43
|
)
|
(17
|
)
|
(13
|
)
|
40
|
(33
|
)
|
|||||
|
Results after-tax
|
(26
|
)
|
(8
|
)
|
(7
|
)
|
23
|
(18
|
)
|
|||||
17
Investor Relations Supplemental Schedules
18