Attached files
| file | filename |
|---|---|
| 8-K - CURRENT REPORT - SILVERADO GOLD MINES LTD | form8k.htm |
| EX-99.1 - PRESS RELEASE - SILVERADO GOLD MINES LTD | exhibit99-1.htm |
| EX-99.4 - PRESS RELEASE - SILVERADO GOLD MINES LTD | exhibit99-4.htm |
| EX-99.3 - PRESS RELEASE - SILVERADO GOLD MINES LTD | exhibit99-3.htm |
Report on
Nolan Gold and Antimony Mine
January 2011
Table of Contents
Table of Photos
![]()
Copyright © 2011 Silverado Gold Mines Ltd. All rights reserved.
No part of this document may be reproduced, distributed,
transmitted, cached or otherwise used,
except with the prior written
permission of the copyright holder.
110001SGM Nolan Mine Report Jan 2011.docx
Location Map
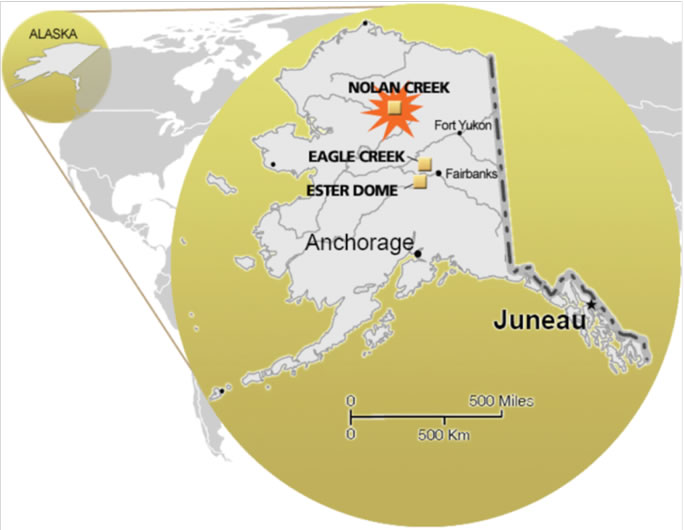
| Nolan Gold and Antimony Mine |
| Koyukuk Mining District |
| Arctic Alaska |
| Calculations for Three Mining Models |
Introduction
An independent NI 43-101 positive Pre-Feasibility Report written January 2009, as amended June 2009, on the Nolan Creek Project contains all necessary information to fulfill NI 43-101 compliancy in all relevant categories discussed in this report. To view the report go to http://www.silverado.com/d/09Jan01_NI43-101_amended.pdf. The NI 43-101 report disclosed gold and antimony grades averaging 0.365 troy ounces (Tr Oz) per ton OPT gold (Au) and 28% antimony (Sb) using a BTW core. The BTW core, being the least expensive of core sizes, was successfully used to explore for the source of the placer or nugget gold for which this property is famous. However, the BTW core resulted in major core loss in the ore zones due to the expected breaking and grinding of the soft massive stibnite (antimony sulfide). Subsequently, with the ore zone being discovered and delineation begun, NQ core was used in follow-up drilling and accomplished much better recovery. Therefore higher grades in Au and Sb which were commensurate with higher results from underground bulk sampling (UBS) (hand-sampling) were achieved by the NQ drilling. The UBS returned assays for five combined samples averaging 0.72 OPT Au and 64.4% Sb. The five individual assay samples may be viewed in the tunnel map insert on page 19. Now that we are drilling in ore, subsequent drilling will be carried out with the largest practical core size for the job, being HQ core.
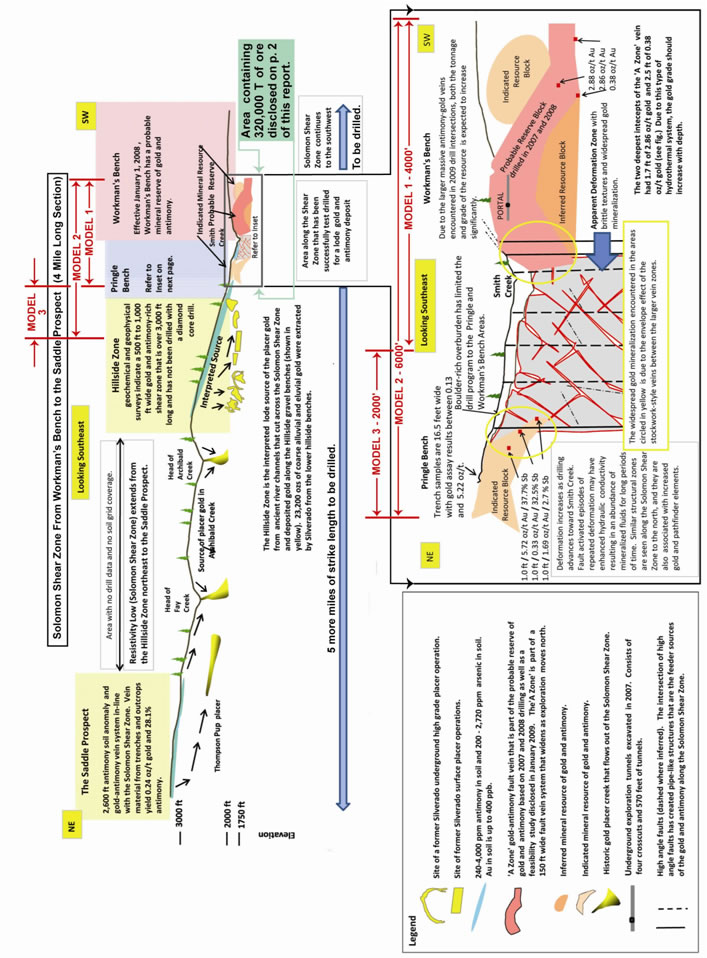
The drilling results in the NI 43-101 Report delineated a zone 3000 feet (') long (L) x 350' deep (D) x 0.9' wide (W). Subsequent drilling in late 2009 extended the zone to 3500' L x 500' D x 1.2' W, and the NQ core achieved high rates of recovery with gold and antimony grades increasing substantially. The drill also completed considerable in-fill work between existing holes.
As all 71 diamond core drill holes in both drill programs hit their targets, and as data from technical surveys is overlying the ore bodies and confirming their extension, management had the confidence to expand the zone to 4000' L x 600' D x 1.2' W. In addition, based on the increased recoveries and better grades of NQ core drilling, as well as high UBS grades, management has taken the liberty to increase grades from .365 to 0.5 OPT Au and from 28% to 40% Sb, which is still considerably less than the UBS grades averaging 0.72 OPT Au and 64.4% Sb.
- 1 -
Mining Model 1
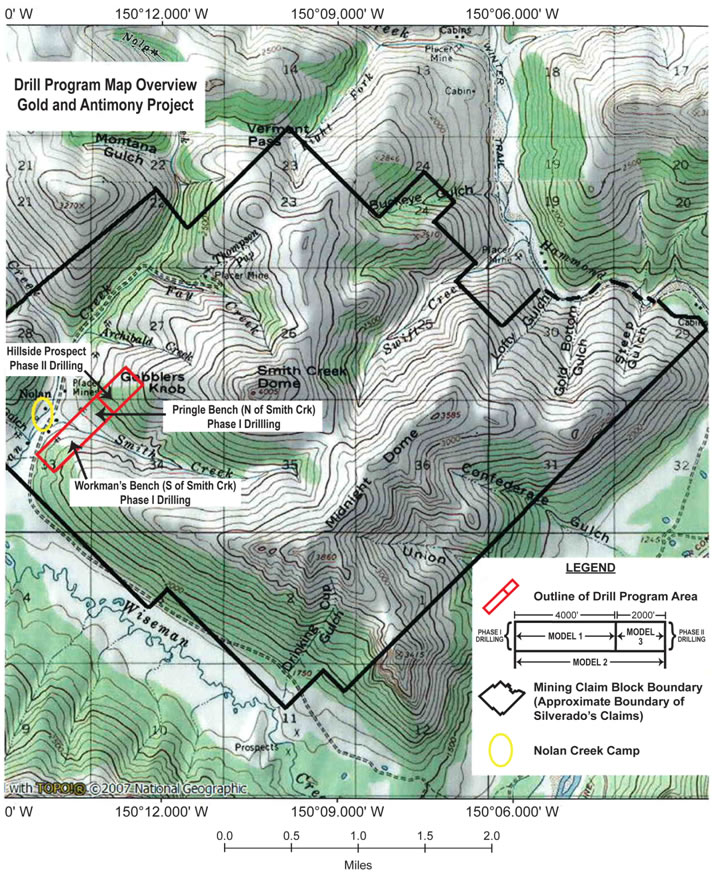
Model 1 encompasses the Workman’s Bench and Pringle Bench areas. These areas are shown on pages 12, 13, 14, 20, 21, 22, 23, and 24, and are tight to the drilling from Workman’s Bench to Pringle Bench or 4000' L x 600' D.
Gross Value Calculations
4000’ L × 600’ D × 1.2’ W ÷ 9 ft3/ton (T) = 320,000 T
Value of Contained Au = 320,000 T @ 0.5 OPT @ 90% Recovery @ $1300/Tr Oz of gold =
| $187,200,000 |
320,000 T @ 40% Sb @ 85% recovery @ 2000 lb/T @ $4/lb (currently $12,000/T or $6/lb)
Value of Contained Sb = 320,000 T × 40% Sb × 85% recovery × 2000 lb × $4 =
| $870,400,000 |
TOTAL GROSS VALUE of Contained Au & Sb in 320,000T =
| $1,057,600,000 or $3,305/T of ore |
Note: The usual deleterious penalty elements are present, but substantially below penalty grades or allowable limits. This will result in the mine Sb product receiving top dollar.
Gross Cost
The NI 43-101 report cost/T of $376 (p. 137 – 18.8.3, e.g.: $77/T mining cost = 20.5% of total/T cost) is in line with our estimated cost of approximately $300/T. (If 20.5% total cost = $77/T, then 100% cost = $376/T.) The NI 43-101 report provided for an operation producing 70 ton per day (TPD). A 200-500 TPD operation (this report) would significantly reduce per unit costs with our increased daily throughput (200-500 TPD). Therefore, we believe $300/T to contain adequate safety margins for any start-up costs with ample coverage for any unforeseen costs. Gross Cost is therefore 320,000 T × $300/T =
| $96,000,000 |
- 2 -
Net Value Before Taxes
Profit before taxes (we have approximately $40,000,000 in tax losses carried forward) would therefore be: Total Gross Value of $1,057,600,000 – Gross Cost of $96,000,000 =
| $961,600,000 or $3,005/T of ore |
Mine Life
Life of 320,000 T @ 200T/D @ 300 D/Year (Yr) or 60,000 T/Yr =
| 5.33 Yr |
NET VALUE PER YEAR BEFORE TAXES = $961,600,000 ÷ 5.33 Yr =
| $180,400,000/Yr |
|
Mining Model 2
Model 2 encompasses Workman’s Bench through Pringle Bench @ 4000', and continuing an additional 2000' to the Hillside area for at total of 6000'. Area shown on pages 12, 13, 14, 20, 21, 22, 23, and 24 is 6000' L and given rule of thumb for depth calculation (depth = 1/2 length), then Tonnage = 6000' x 3000' x 1.2' ÷ 9ft3/T = 2,400,000 T. (Note: Page 14 shows about four miles of explored strike with Model 1 and 2 areas in side view as well.)
Note: Use same gross and net value/T numbers as in Model 1: $3305/T (Gross) and $3005/T (Net).
Value of Contained Au & Sb
GROSS VALUE = 2,400,000 T @ $3,305/T =
| $7,932,000,000 |
NET VALUE = 2,400,000 T @ $3,005 =
| $7,212,000,000 |
- 3 -
Mine Life
LIFE of 2,400,000 T @ 500 TPD @ 300 DPY =
| 16 Years |
NET VALUE PER YEAR BEFORE TAXES = $7,212,000,000 ÷ 16 Yrs =
| $450,750,000/Yr |
Mining Model 3
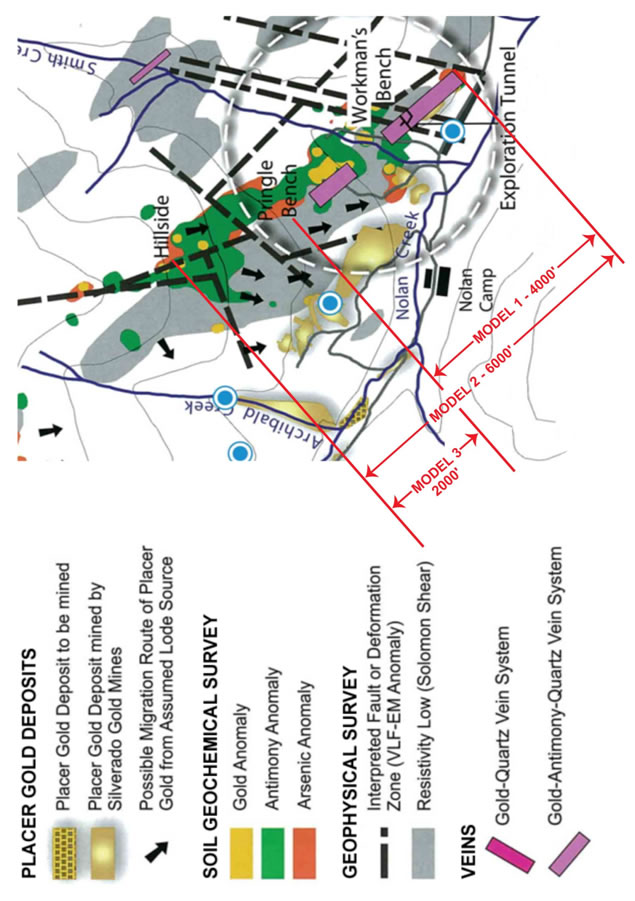
Model 3 contemplates the discovery of a “bonanza” or extremely rich gold ore zone encountered in the 2000' part of the mineralized structural zone between the Pringle Bench and Hillside areas shown on pages 12, 13, 14, 20, 21, 22, 23, and 24.
It is significant to note that the placer mining areas immediately below the mineralized zone of the Hillside area yielded quartz-carbonate gold nuggets as well as the largest portion of the 23,000 ounces of placer gold taken by Silverado during the exploration phase. Gold bearing solutions flowing in and through these zones rapidly precipitate out their gold within a carbonate environment.
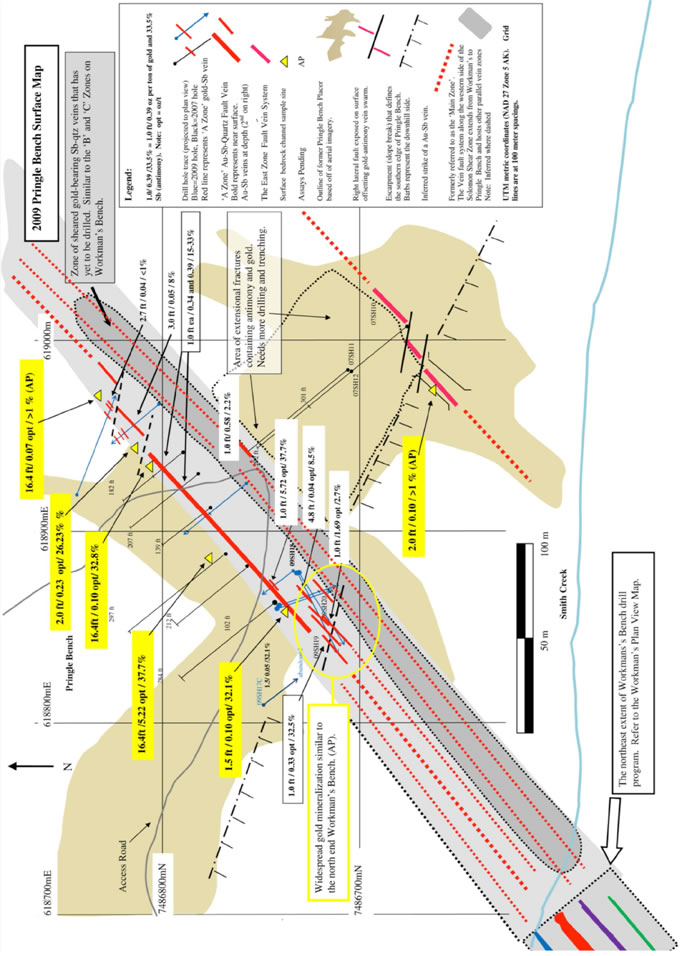
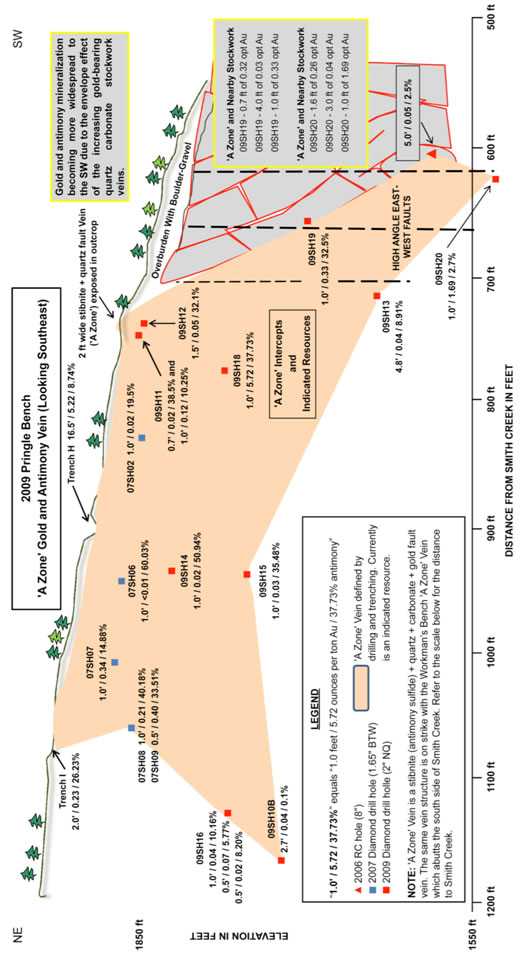
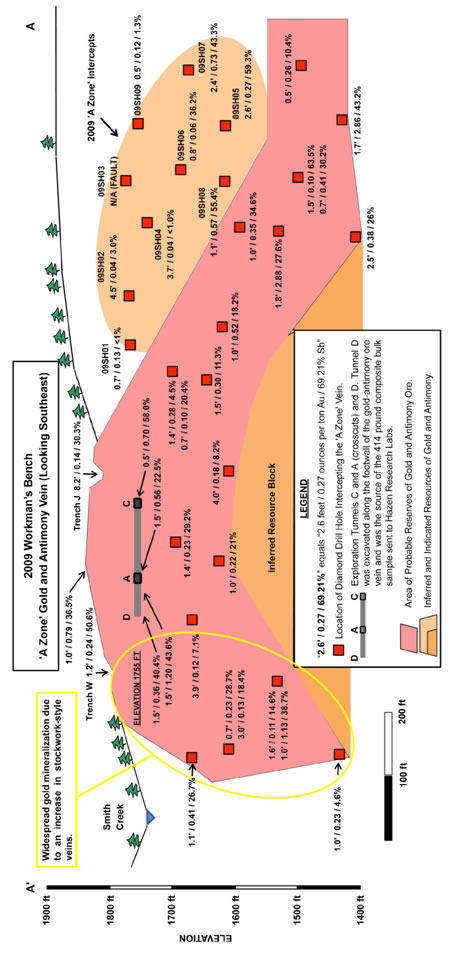
Another indicator of the presence of one or more “bonanza” ore bodies is the fact that gold grades are increasing to the NE from the Pringle Bench area, as does the presence of quartz-carbonate. Our last drilling and trenching was 2000' SW of Hillside area at the northeast extent of Pringle Bench and encountered assays as high as 5.72 OPT Au over 1' and 5.22 OPT Au over 16.4'; as well as mineralized widths of up to 60' containing visible gold (VG) and Sb in a quartz-carbonate stockwork. Given this data, one is able to make a case for a bonanza-type system from place to place along strike in this area. We are also encountering native gold immediately below, and attached to a flat lying horizon of quartz crystals and black vitreous crystalline hard quartz. High grade gold has been encountered immediately below this horizon.
- 4 -
Example of a “Bonanza” Deposit
Say an area of 20' L x 10' D x 2" W lies in the 2000' L x 1000' D area between Pringle Bench and Hillside area. Gold draining this area has been recovered in pieces up to 41.4 Tr Oz (see back cover) @ 6" L x 2.5" W x 1.5" thick. (See pages 25-29 for some pictures of gold nuggets draining Hillside Area.) For every total of 20' L x 10' D x 2" W, we would have 20' x 10' x 1/6' = 33.3 ft3 @ 3 ft3/ton = 11.1 tons of 95% pure gold (Nolan gold ranges from 93 to 97% fine or pure) = 10.5 tons of pure gold @ 2000 lbs. / ton = 21,000 lbs @ 2.2 lbs / kilogram (Kg) or 9,546 Kg at 1000 grams (g)/Kg = 9,546,000 g @ 31.1 g / Tr Oz of Au = 306,945 Tr Oz @ $1300 / Tr Oz = $399 million (say 400 million). This could be mined and processed in one week. We would likely double the price if the gold ore is as spectacular as that which was taken by Silverado below this area. In this case we could cut the ore out of the ground and sell as specimen. Our gold is most often associated with optical grade hexagonal quartz crystals in a matrix of pure white quartz-carbonate on this area of the property and as such make an excellent case for exceptionally beautiful specimens. Gold specimens of this calibre often sell for 5 to 10 times the value of their gold content (i.e.: museums and collectors).
Therefore, every 20' x 10' x 1/6' or 33.3 ft3 section of ground represents a possible + $400 million in value. In an area of 2000' x 1000' x 1/6' (Model 3 area @ 333,333 ft3), we have 10,010 opportunities of locating a + $400 million ore zone. We suspect such + $400 million ore zones exist in the area indicated and possibility elsewhere on the property. The largest single nugget of the 200,000 Tr Oz taken by the old-time miners (back to 1897) was from the Hammond River area of the property and weighed 136 Tr Oz.
- 5 -
Distribution of $50 Million of Investment
Capital*
Model 500 Tons Per Day (TPD) Mill & 200 TPD Mine
– 300 Days Per Year for First 2-3 Years
| CATEGORY | EXPENDITURES (US$ in thousands) | |||||||||
| TRANCH 1 | TRANCH 2 | TRANCH 3 | ||||||||
| ON SIGNING | AUG 1/11 | NOV 1/11 | ||||||||
| • |
Administration & Permitting | 1500 | 1500 | 500 | ||||||
| • |
Head & Field Office Payables | 2000 | ||||||||
| • |
Drilling 72,000′ HQ Core | 3600 | 3600 | |||||||
| • |
Construction | 1000 | 2000 | |||||||
| Disposal Areas: | ||||||||||
| Acid Mine Rock | ||||||||||
| Mill Tailings | ||||||||||
| Mill Water | ||||||||||
| • |
2011/12 Core Logging & Assaying | 600 | 600 | 100 | ||||||
| • |
Drill Pads Roads & Culverts | 400 | 200 | |||||||
| • |
Equipment Purchase | 3000 | 2000 | |||||||
| • |
Fuel & Supplies | 400 | 300 | 600 | ||||||
| • |
Contingencies | 950 | 1120 | 320 | ||||||
| • |
Mine Development | 2000 | 6000 | |||||||
| Begins Nov 1/2011: | ||||||||||
| • |
Mill Construction | 3000 | 6000 | |||||||
| • |
Mining & Milling (until sales returns) | 6700 | ||||||||
| TOTALS | 10,450 | 17,320 | 22,220 | |||||||
| TOTAL | 49,990 | say 50,000 | ||||||||
* Distribution dependant on the Company’s raise of the required capital.
- 6 -
Notes
-
Camp and all infrastructure paid.
-
Claims in good standing (12 square miles).
-
5-year permit issued and in hand for exploration drilling and 3000 T UBS.
-
One-year ground water drainage study complete. pH 6.9-7.0 (ideal).
-
Sb – No blinding of screens. Tabular grains (ideal antimony ore shape – not bladed).
-
Recovery Mill – Gravity and water only. See pictures of table concentrate on page 11.
-
Lithology – Flat lying metasediment (turbidite) on page 9. See stratigraphy on back (roof) and floor, and Sb quartz-carbonate gangue on right rib of tunnel. Good ground for mining.
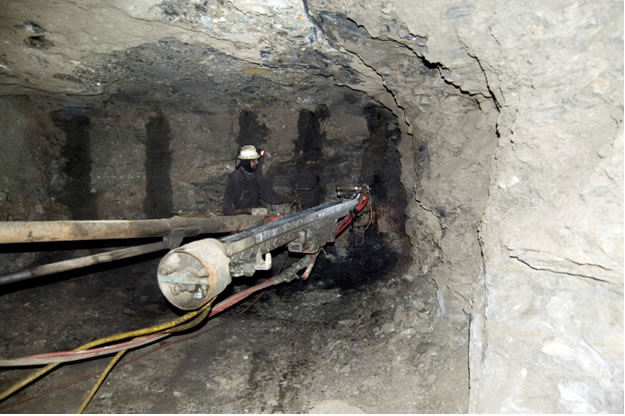
Photo 1: Drilling blast holes underground.
- 7 -
Support Information for Data in Pages 1-7
Cost Factors
Projected costs of operations have been assembled from an NI 43-101 Report and from actual costs of the placer mining operations conducted by Silverado in prior years. Cost information and data may be found in the NI 43-101 compliant pre-feasibility report completed in 2009, and referenced on page 2 of this report under heading: “Gross Cost.”
Underground mining of frozen placer channels or old river bottoms is nearly the same in nature as is hard rock mining (drill, blast, muck) and all other associated costs are near identical or identical between our prior operations and contemplated operations. The remaining work to be completed is the construction of the mill, drilling and underground development.
Other Considerations
Dry Mine
Test holes conducted by a well drilling rig have yielded dry holes so far, indicating dry mining conditions which are favorable to mining.
Metallurgy
Test work yielded 85% antimony sulfide (stibnite) and 90% native gold recoveries using only gravity and water. Rod mills will be used to minimize sliming of the stibnite; Holman-Wilfley Tables will separate constituents; slime tables can separate stibnite slimes from coarse sand product and Falcon Concentrators will create a high grade stibnite slime product. Gold bars will be poured from the gold split off of the primary and secondary tables. The waste water appears to be near neutral (background water tests were completed over a one year period and ranged in Ph from 6.9 to 7.0 or neutral). A simple water neutralization plant will be used prior to the three existing settling ponds. Water is lost to evaporation. Thus, high recoveries of clean products may be realized without the use of hazardous chemicals while controlling Ph to a desirable range with relative ease. The environment will be well protected.
- 8 -
Tailings & 30% Mine Waste Rock
It is anticipated these materials will be disposed of in lined pits interspersed with limestone to maintain a neutral Ph in the near neutral material which originates in a high quartz-carbonate environment. We will be able to produce high grade products in a low cost, environmentally safe and friendly manner.
Quartz-Carbonate
We are fortunate to be mining in an environment where the rock bears a high percentage of quartz-carbonate. This rock naturally assists in neutralizing any acids which may occur from the decay of sulfides present. The addition of the limestone will help maintain the neutral environment and once a waste pit is fully utilized it will be covered with the prior removed and stock piled natural flora which has proven in the past to create acceptably reclaimed areas.
As we enter the higher quartz-carbonate enriched rocks, gold grades are rising. The carbonates precipitate gold from solution as can be seen by the wire gold growing from the white quartz-carbonate shown in the right portion of the top picture on page 29, with stibnite encountered in the same drill core of the A vein shown on the left side of the same picture.
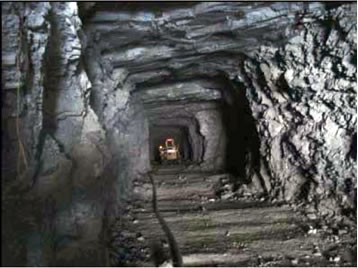
Photo 2: 'A' Crosscut looking southwest. Note near horizontal phyllitic schist band in base and roof.
- 9 -
Hydrological Considerations
The Workman’s Bench deposit occupies a near-horizontal terrace level at an elevation of 1,800 feet near the confluence of Smith Creek, a third order tributary, with Nolan Creek, a second order trunk stream. The Workman’s Bench mineralized system trends in a northeast direction toward Smith Creek Valley. The underground workings driven into the Workman’s Bench lode are dry. One hole, 08BT17, which is part of the Workman’s bench evaluation, intersected “live water”. The drill hole is situated at the northeastern edge of the drill pattern completed in Workman’s bench and does not affect the reserves assessed in the NI 43-101 Technical Report. The drill hole likely intersected water from Smith Creek—drilling did not advance further because it was assumed that Smith Creek constituted a northeasterly limit of Workman’s bench due to this condition. The hole was plugged off. The QP assumed from inspection of data that no other holes on Workman’s Bench contained water and all drilled dry. Management deems the single wet drill hole on the northeastern margin of the defined resource not to be a problem and the drill hole 08SH17 could be grouted off if necessary. Based on observations of the drill hole data and underground mine conditions, the QP also agrees with this assessment. The other hole that drilled wet was on Pringle Bench to the northeast (07SH04). The inferred mineral resources on Pringle Bench are not part of the pre-feasibility analysis presented in the NI 43-101 Technical Report. There is other evidence to corroborate the general dry nature of the bedrock subsurface. A number of large diameter well holes were drilled in the camp vicinity in order to find a good source of water. Three drill holes explored the Workman’s Bench area to depths of up to 400 feet, but failed to encounter water. Left limit benches on Nolan Creek; i.e., Swede Channel and Mary’s Bench, were found to be dry during underground drift mining of frozen placer gold deposits.
- 10 -
Examples of Stibnite-Gold Concentrate From Table Product
A split portion of the concentrate from the shaking table was panned to concentrate the gold even further. Several gold particles were observed ranging in size between 500 µm to about 2 mm. Figures 1 and 2 illustrate the gold in the shaking table concentrate; note the coarse nature of the gold particles in the sample. In the QP’s judgment, the Hazen work on the bulk sample, coupled with his own mineralogical work derived from his underground sampling, provides enough information to initiate design and operations for recovery of gold and stibnite. The Company subsequently commissioned such a report and is now in possession of a complete and acceptable design flow report for a gravity and water gold/antimony recovery circuit.
Figure 1: Stibnite-gold concentrate from table product - example 1
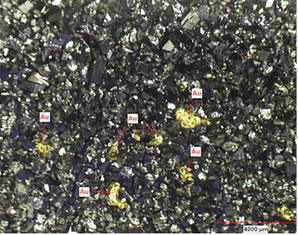
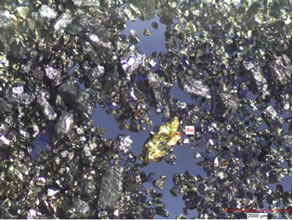
Figure 2: Stibnite-gold concentrate from table product - example 2
- 11 -
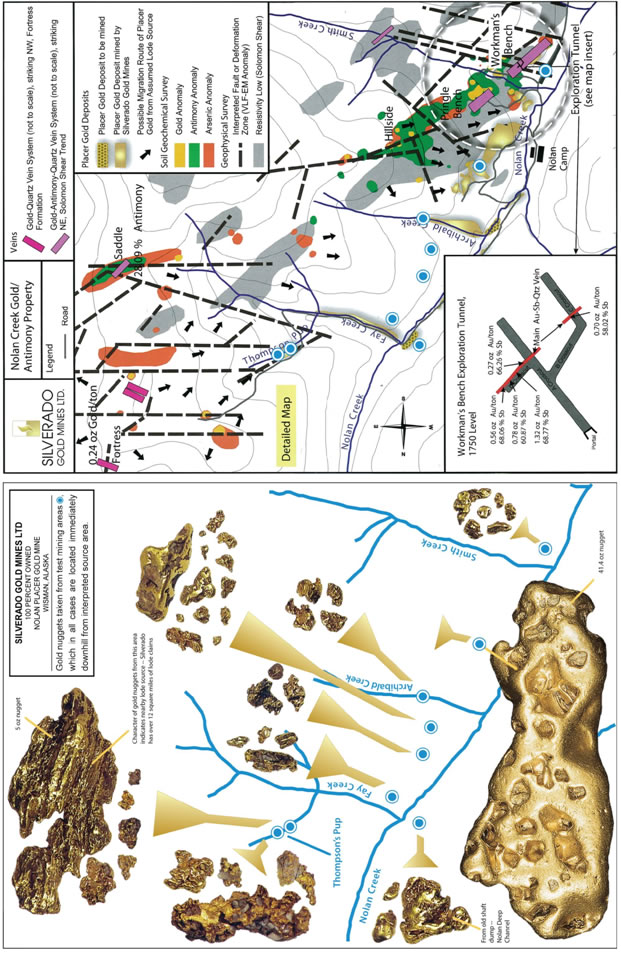
Nolan Creek Property
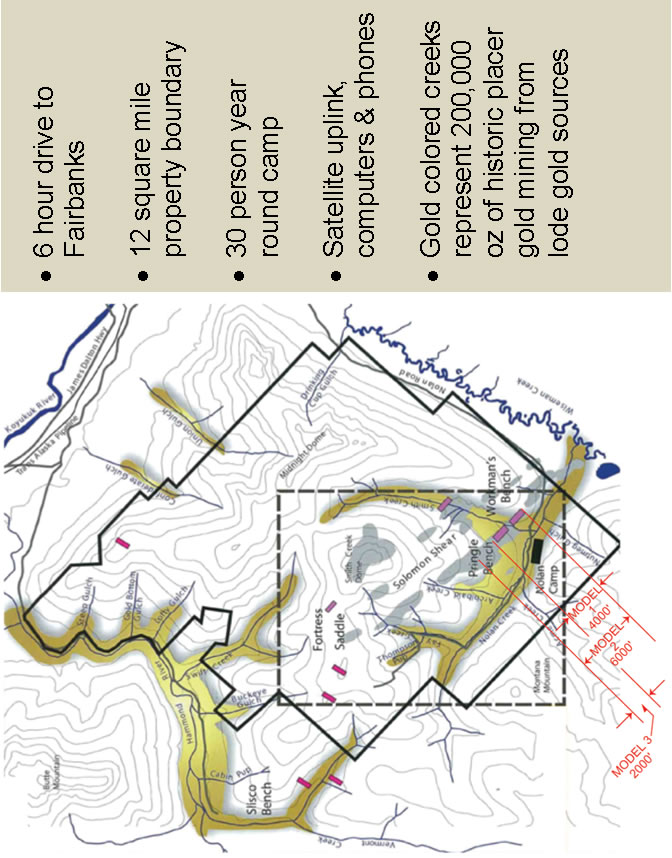
-12 -
Nolan Creek Property - Detailed
- 13 -
- 14 -
- 15 -
- 16 -
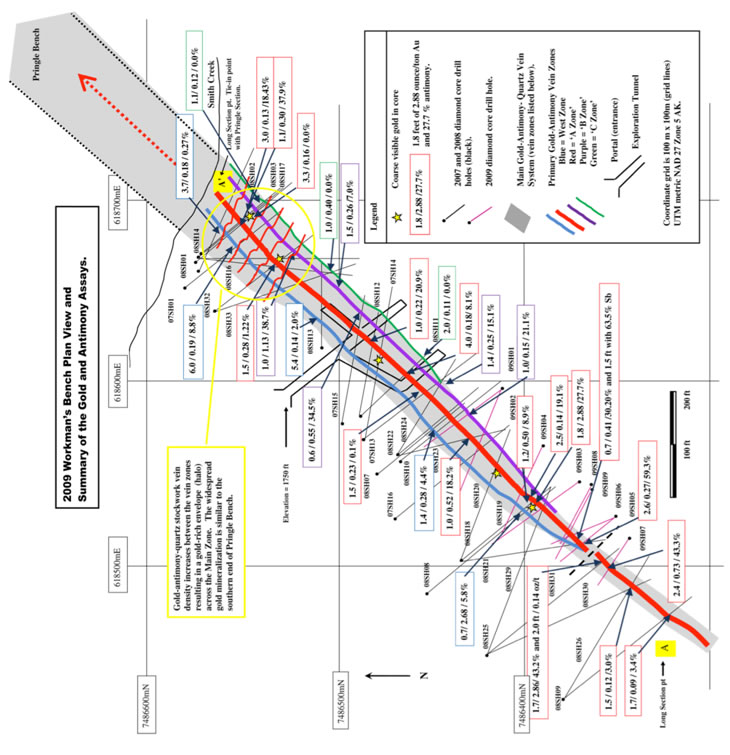
Workman’s Bench – Plan View
- 17 -
- 18 -
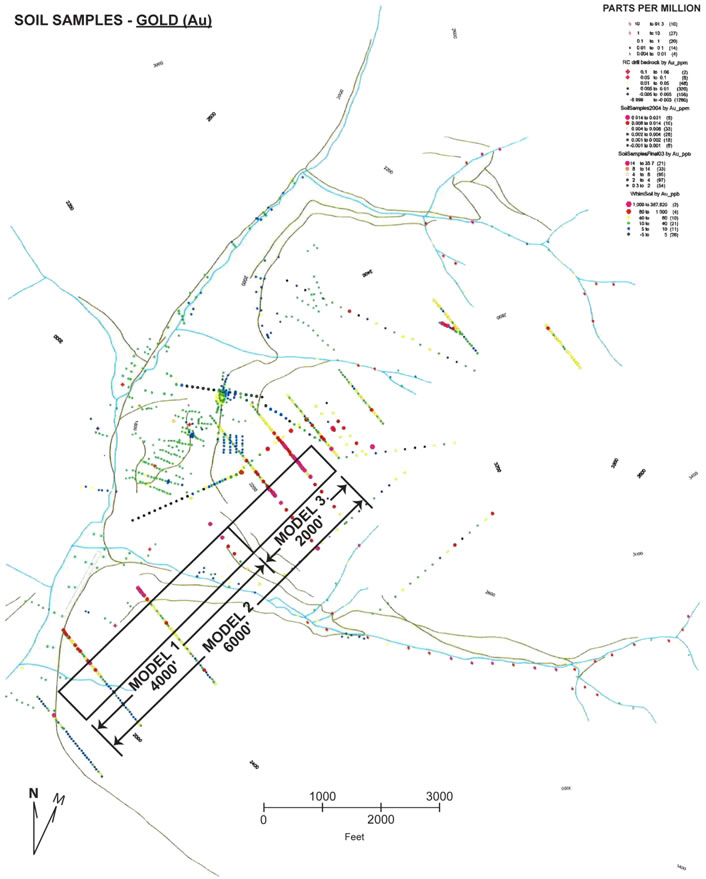
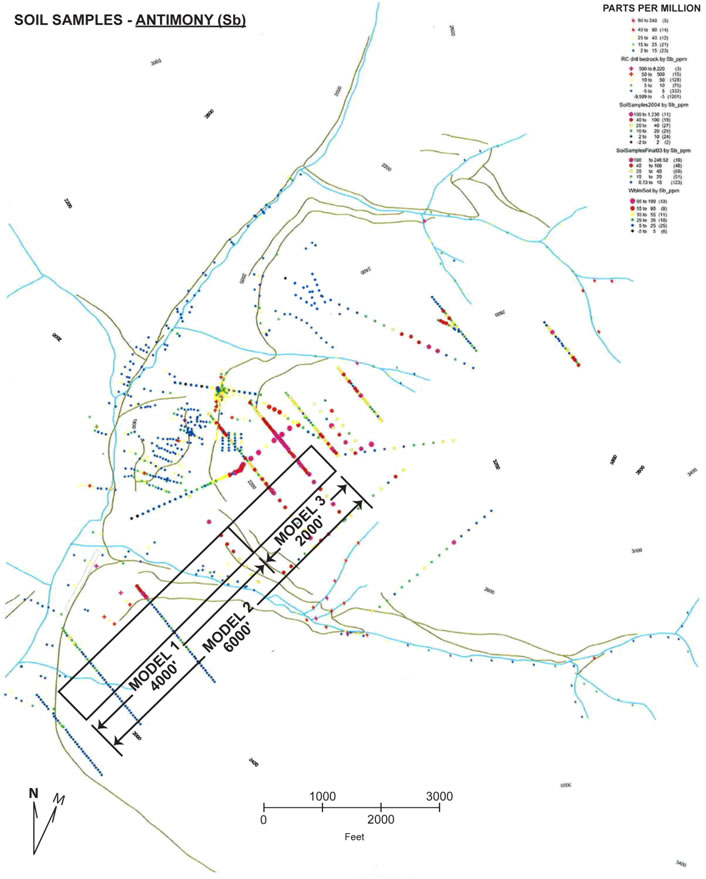
Soil Geochemical Survey
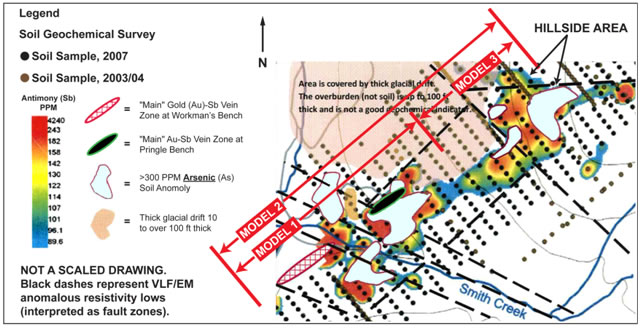
Gold is spotty on these trends and is relatively immobile in this “non-soil” environment. The ground cover is called “detrital” or glacial debris. It consists of boulders, cobbles, sand, silt and ice lenses; all of which have been mixed together after the passage of glaciers and all of which are frozen solid and near impassable to gold ion migration from source to surface. Arsenic, which is in our geological area, as it is in many locations worldwide in its form of arsenopyrite (an arsenic-iron-sulfur mineral) is often directly associated with gold mineralization. We call this a “pathfinder” mineral as it leads to gold when gold does not show on its own. The antimony here acts the same and both the arsenic (arsenopyrite) and antimony (stibnite or antimony sulfide) are extremely rich in this area as well as is the actual gold ore we have discovered and are continuing to discover in these areas of high arsenic and antimony concentrations.
- 20 -
Drilling Program Overview Map
- 21 -
Soil Sample Map – Gold (Au)
- 22 -
Soil Sample Map – Antimony (Sb)
- 23 -
Soil Sample Map – Arsenic (As)
- 24 -
Pictures on Pages 25-29 Comprise Supporting Data for
Model 3
See Explanations on Pages
4 and 9.
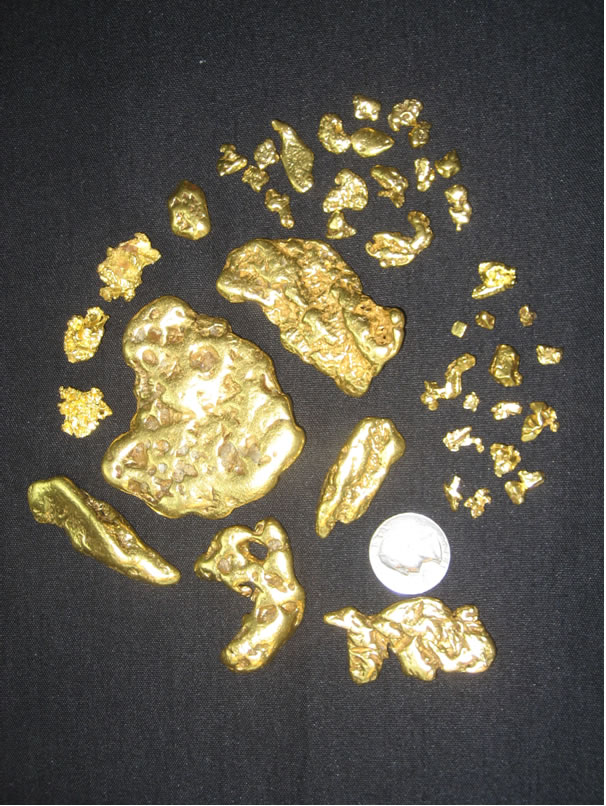
Photo 3: Nuggets from below Hillside area.
This same type of gold and larger—up to 41.4 Tr Oz pieces—have been recovered in Silverado’s mining along and just below a four mile stretch of ground as shown on the maps on pages 14 and 19 of this report.
- 25 -
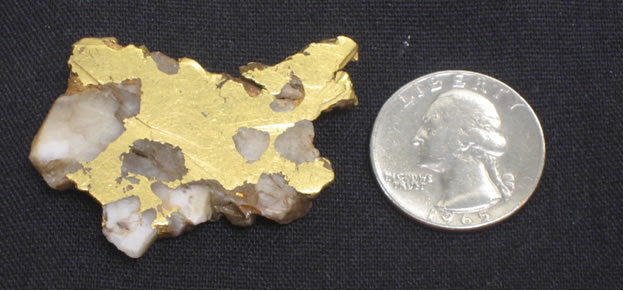
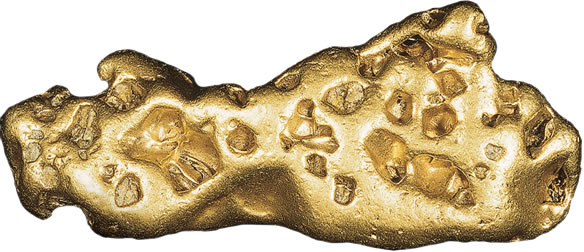
Photo 4: Gold in quartz.
Gold in water flows through shattered bull quartz and re-cements the quartz fragments as the gold precipitates out of solution.
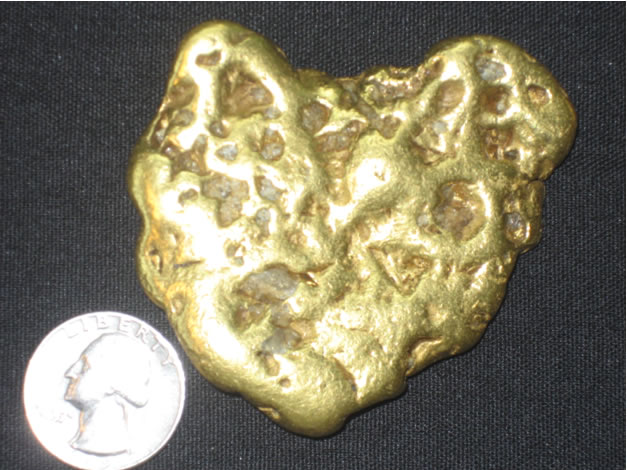
Photo 5: 9 Tr Oz gold nugget.
Empty quartz-filled holes reveal the six sided tips of quartz crystals. As these are encountered on both sides of the nugget, it confirms that the precipitation process has caused gold to fill all openings available in the fissure when gold was being deposited. This process can form very high grade gold enriched zones.
- 26 -
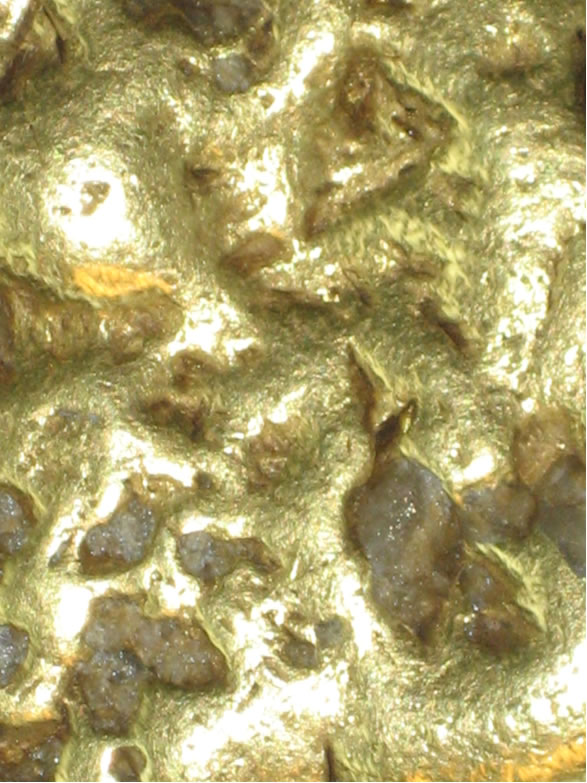
Photo 6: Gold nugget showing tips of quartz crystals broken off in gold.
Most native gold in nature is 70% gold (18 carat (K)) with silver usually making up the majority of the balance. Nolan gold is 93-97% pure or 22.3 to 23.3 K of a possible 24 K. (24 K = 99.99% pure or fine gold.) The nuggets are prized as some of the world’s most pure gold colored natural occurring gold and sell for a premium over gold spot price.
- 27 -
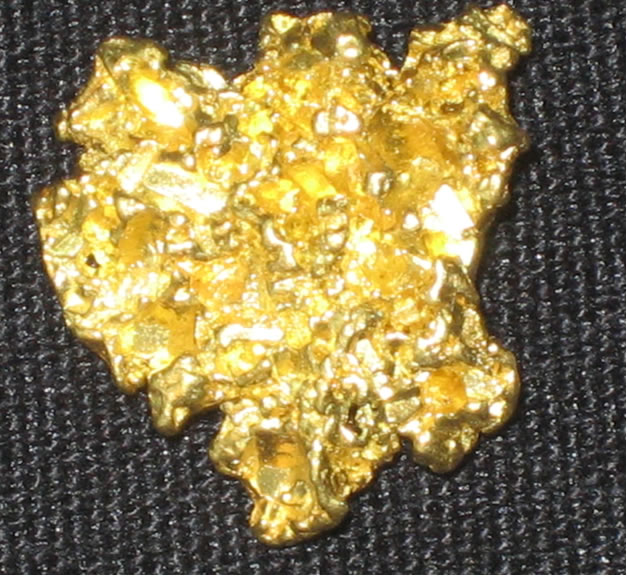
Photo 7: Quartz/Gold nugget after hydrofluoric acid treatment.
In this picture, gold appears to be crystalline after hydrofluoric acid was applied to a sample of quartz covered gold. The acid dissolved the quartz in 24 hours leaving gold patterned after the dissolved quartz crystals. These nuggets sold for 100% premium to gold price.
- 28 -
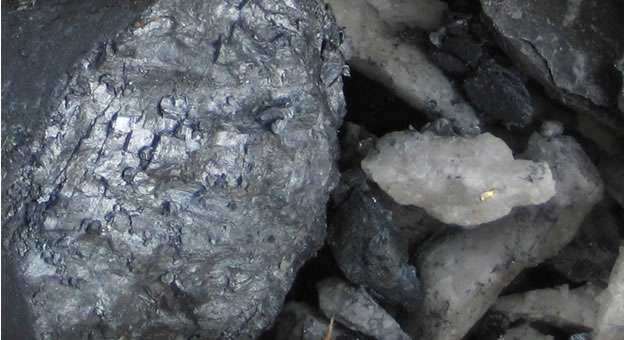
Photo 8: Wire gold in quartz-carbonate (right); stibnite or antimony sulfide (left).
See “quartz-carbonate” page 4, paragraph 2 and page 9 under heading “Quartz-Carbonate.”
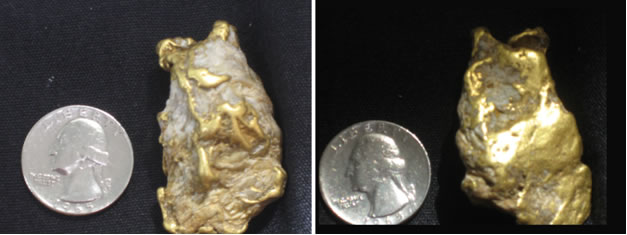
Photo 9: Nuggets with quartz-carbonate.
Nuggets from drainages of the Hillside area display massive native gold (930-970 fine) in quartz-carbonate. This area is NE of Pringle Bench and is the interpreted source area of most of the 23,000 oz of gold recovered by Silverado during its work while exploring for the source of the large placer gold nuggets.
- 29 -
Forward Looking Statements
This report may contain, in addition to historical information, forward-looking statements within the meaning of Section 27A of the Securities Act of 1933, as amended, and Section 21E of the Securities Exchange Act of 1934, as amended. Statements in this report that are forward-looking statements are based on the current expectations, beliefs, assumptions, estimates and forecasts about the Company’s business and the industry and markets in which it operates.
Such forward-looking statements involve risks and uncertainties regarding the market price of gold, availability of funds, government regulations, common share prices, operating costs, capital costs, outcomes of test mining activities and other factors. Forward-looking statements are made, without limitation, in relation to operating plans, property exploration activities, including test mining activities, availability of funds, environmental reclamation, operating costs and permit acquisition. Any statements contained herein that are not statements of historical facts may be deemed to be forward-looking statements. In some cases, you can identify forward-looking statements by terminology such as “may”, “will”, “should”, “expect”, “plan”, “intend”, “anticipate”, “believe”, “estimate”, “predict”, “potential”, or “continue”, and the negative of such terms or other comparable terminology. Actual events or results may differ materially. In evaluating these statements, you should consider various factors, including the risks detailed in the Company’s filings with the Canadian Securities Authorities and the US SEC. These factors may cause the Company’s actual results to differ materially from any forward-looking statement. Except as required by applicable securities laws, the Company disclaims any obligation to publicly update these statements, or disclose any difference between its actual results and those reflected in these statements. Given these uncertainties, readers are cautioned not to place undue reliance on such forward-looking statements.
___________________
- 30 -
For additional information contact:
| Garry Anselmo |
| President, CEO, & COO |
| 1.604.689.1535 |
| ganselmo@silverado.com |
| Trading Symbols: |
| OTC BB: SLGLF |
| FRANKFURT: SLGL |
Silverado Gold Mines Ltd | 1820-1111 W. Georgia St., Vancouver,
BC V6E 4M3
604.689.1535 | 800.665.4646 | www.silverado.com
- 31 -
Actual Size
41.4 Tr Oz Gold Nugget
Taken by Silverado From Below Hillside Area
See Page 19
![]()